 Leonard Günzel
 Theresa Beer
95% of researchers rate our articles as excellent or good
Learn more about the work of our research integrity team to safeguard the quality of each article we publish.
Find out more
TECHNOLOGY AND CODE article
Front. Mar. Sci. , 10 August 2022
Sec. Ocean Solutions
Volume 9 - 2022 | https://doi.org/10.3389/fmars.2022.948163
This article is part of the Research Topic ICYMARE - Early Career Researchers in Marine Science View all 32 articles
The global energy consumption has been on the rise since the last industrial revolution and continues to be. So far the demand could be satisfied by a mixture of conventional and renewable energies. With the global effort to eliminate conventional energies to stop the anthropological climate change, the demand for reliable and predictable renewable energies is growing. Under these circumstances, more attention is drawn towards the development of non-intermittent ocean energy systems. Apart from waves, thermal and salinity gradients, currents are an abundant and reliable ocean energy source. Inspired by state-of-the-art technology, a unique system for current energy, the Current Kite, is presented in the following paper. This tethered undersea kite (TUSK) consist of a wing to which a turbine is attached. The wing drags the turbine through the water in a certain trajectory, sweeping a large area at a relative speed that is several times the actual speed of the underwater current. In the following paper we present the general setup and design of our first and second prototype. The first prototype was build as a prove of concept. It was equipped with active steering and several on board sensors. With the second prototype the aim was to build a more sophisticated system, which would make the active steering redundant and use more efficient, circular flight paths. A wing which would adjust itself in the current and follow the predefined circular path, was designed using numerical simulations. To achieve this circular flight movement without twisting the electrical cable, a swivel and a stress reducer were designed and built to connect the TUSK as well as transfer electrical power to land. In addition the tracking-system was redesigned, communicating by modulation over the power line. This provides a fully autonomous ocean current power plant, which communicates in real time data and has a promising outlook in efficiency, regarding to the state of art. Due to Covid-19 regulations it was not possible to test the prototype. Therefore the paper mainly focuses on the design and construction process, up to the production of the TUSK.
The development and growth of modern societies has emerged a rise in the demand for energy within the last decades. Globally the consumption of energy has nearly doubled since 1990. The demand of modern societies and the ongoing fight against climate change forces us to search for new renewable and environmentally friendly energy generation methods (Enerdata, 2021). Especially the marine energy sector has seen huge growth in the last years due to the oceans enormous amount of untapped energy potential. Besides the already successfully introduced usage of offshore wind energy and tidal energy within the ocean, other resources remain unused.
One of those resources with extremely high potential and good predictability are ocean currents. One of the many benefits of current power is that it is more predictable than the conditions for wind and solar energy systems. Current-power systems are an emerging technology which can extract energy from ocean currents like the North Atlantic Current. The system discussed in the scope of this paper is a Tethered Undersea Kite (TUSK). The advantage of this setup is the increased speed of relative water motion through the rotor area, which is higher than the actual water current velocity. For a wing speed that is twice as fast as the ocean current, the power output is up to eight times higher than that of a fixed marine turbine (Bahaj, 2011; Olinger and Wang, 2015).
Inspired by the Deep Green-Technology by Minesto™ (Minesto, 2021), an unique system for tidal energy, the Current Kite, was designed at the University of Applied Sciences Bremerhaven. After manufacturing a first prototype consisting of a wing, active steering and a tracking system, conclusions for the main wing could be drawn. For the second prototype, a new TUSK, without active steering was designed. This led to the redesign of the tether. Also, the tracking system was improved. For the applicability of this new system several components had to be designed, build and implicated into the new system.
The theory behind the project and the prototype are presented in Section 2 and 3. The new wing design was evaluated using numerical simulations described in Section 4.1. The computed wing design was then built, as described in Section 4.3. To measure the wing speed a small rotor must be installed at the outside of the wing, as well as a power-transmitting swivel, which is described in Section 4.4. The communication with the wing will be set up using modulation over the power line. This will be done using a generic home adapter for internet communication, described in Section 4.5.4. To evaluate the wing’s position under water and to compare the predicted movement with the actual one, an orientation measurement system was set up using an inertial measurement unit, described in Section 4.6.2.
The global ocean currents are a form of kinetic energy similar to global wind systems (e.g. jet stream). Both are generally diffuse but can be economically harvested in certain areas. From a physical perspective the challenge to harvest energy from ocean currents is very similar to the challenge to harvest wind. A defining parameter of both, the power density PW of a moving medium, is given by the velocity vo and the density ρ , in the form of:
Thus if water is used as a flowing medium [density 1020kg/m3 (Dhanak and Xiros, 2016)] with an approximately 1000 times higher density than air (approx. 1.225kg/m3 at sea level), the power production increases 800 fold. More importantly, as given in Equation 1, the velocity of the medium is cubed. This means that a doubling of the medium velocity leads to an eight-fold increase of power density. While economically profitable wind speeds are generally abundant around the world, this is not the case for ocean currents. High velocity ocean currents are uncommon and mostly concentrated around constraining topographies (Bahaj, 2011). Therefore, an important parameter which needs to be addressed is the velocity vo . While one can hardly influence the velocity of an ocean current, there are technical solutions to increase the water speed which the turbine experiences. The aim for these prototypes was to increase the current velocity of 2m/s to a trajectory speed of 4m/s.
It is helpful to look towards the research field of wind energy in this context. Different approaches can be found in the literature. The most important one for this article is the theoretical research of Miles L. Loyd on Crosswind Kite Power (Loyd, 1980). This paper describes a concept for large-scale wind power production by means of aerodynamically efficient kites. Loyd explains different motion types of kites in crosswind and the resulting force which can be extracted and transformed into energy. Two of these methods have seen a steady increase in research and deployment until today. The first method describes a kite which is hooked to a generator on the ground. The generator is anchored on the ground and is equipped with a spool on which the rope is wound onto. As the kite rises it unwinds the spool and the generator is actuated. The second method was used as a blueprint for the first and second prototype described in this article and is illustrated in Figure 1A. Here the kite is anchored to the ground as well, but the generator is mounted on the kite itself. The kite first needs to rise to a certain height to enable a circular flight path. There the crosswind motion can be used. As the kite starts to traverse orthogonal to the wind the kite speed should increase to a multiple of the wind speed. This higher speed powers the rotor that is connected to the generator.
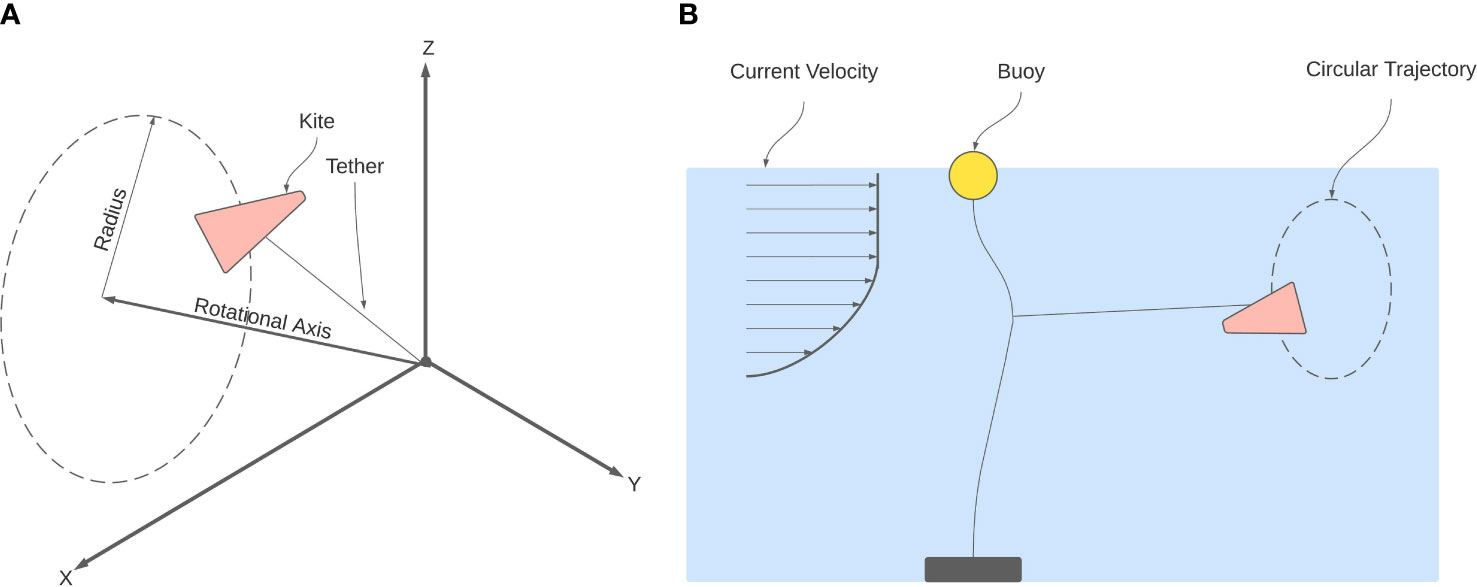
Figure 1 (A) Schematic drawing of the TUSK in crosscurrent motion, it is moving in a circular path indicated here by the dotted line. (B) The TUSK is shown as it would be deployed in the field, anchored in between the ground and the buoy using the rope.
This concept can be adopted to marine energy (Siddiqui et al., 2020; Reed et al., 2020). The TUSK can be either mounted on the ground or on a buoy as show in Figure 1B. Generally speaking the velocity of ocean current is faster towards the surface (Olinger and Wang, 2015). For further elaboration a buoy mounted system will be discussed, even though the developed system is theoretically capable of operating in both modes.
Most of the research and commercial effort is focused on TUSKs which move in a figure of eight shaped trajectory (Olinger and Wang, 2015). This trajectory allows the TUSKs to sweep a larger area close to the surface and thus harvest higher velocity currents. It also prevents the the twirling of the tether which needs to be decoupled from the anchoring or buoy. Because of the abrupt change of motion in this trajectory the load on the generator and thus the energy output is not steady. To support this rather complex flight behavior a complex steering mechanism is needed. The prototypes described in this article were designed to overcome these problems and allow to move in a circular trajectory. This would allow for a less complex steering architecture and more importantly a steady load on the generator, due to the continuous motion.
Most of the early assumptions of the prototype design were based on the work of (Loyd, 1980). The wing of the Current Kite is a continuous wing profile which provides for lift and is steered using flaps at the wing tips. The TUSK is connected to the tether using four anchoring hooks on the wing. The length of the tether was chosen to accomplish a 5m radius for the circular motion. The electronics used to steer the TUSK and gather data, are stored in a vacuum-acrylic chamber positioned in the center of the wing. The general setup is shown in Figure 2.
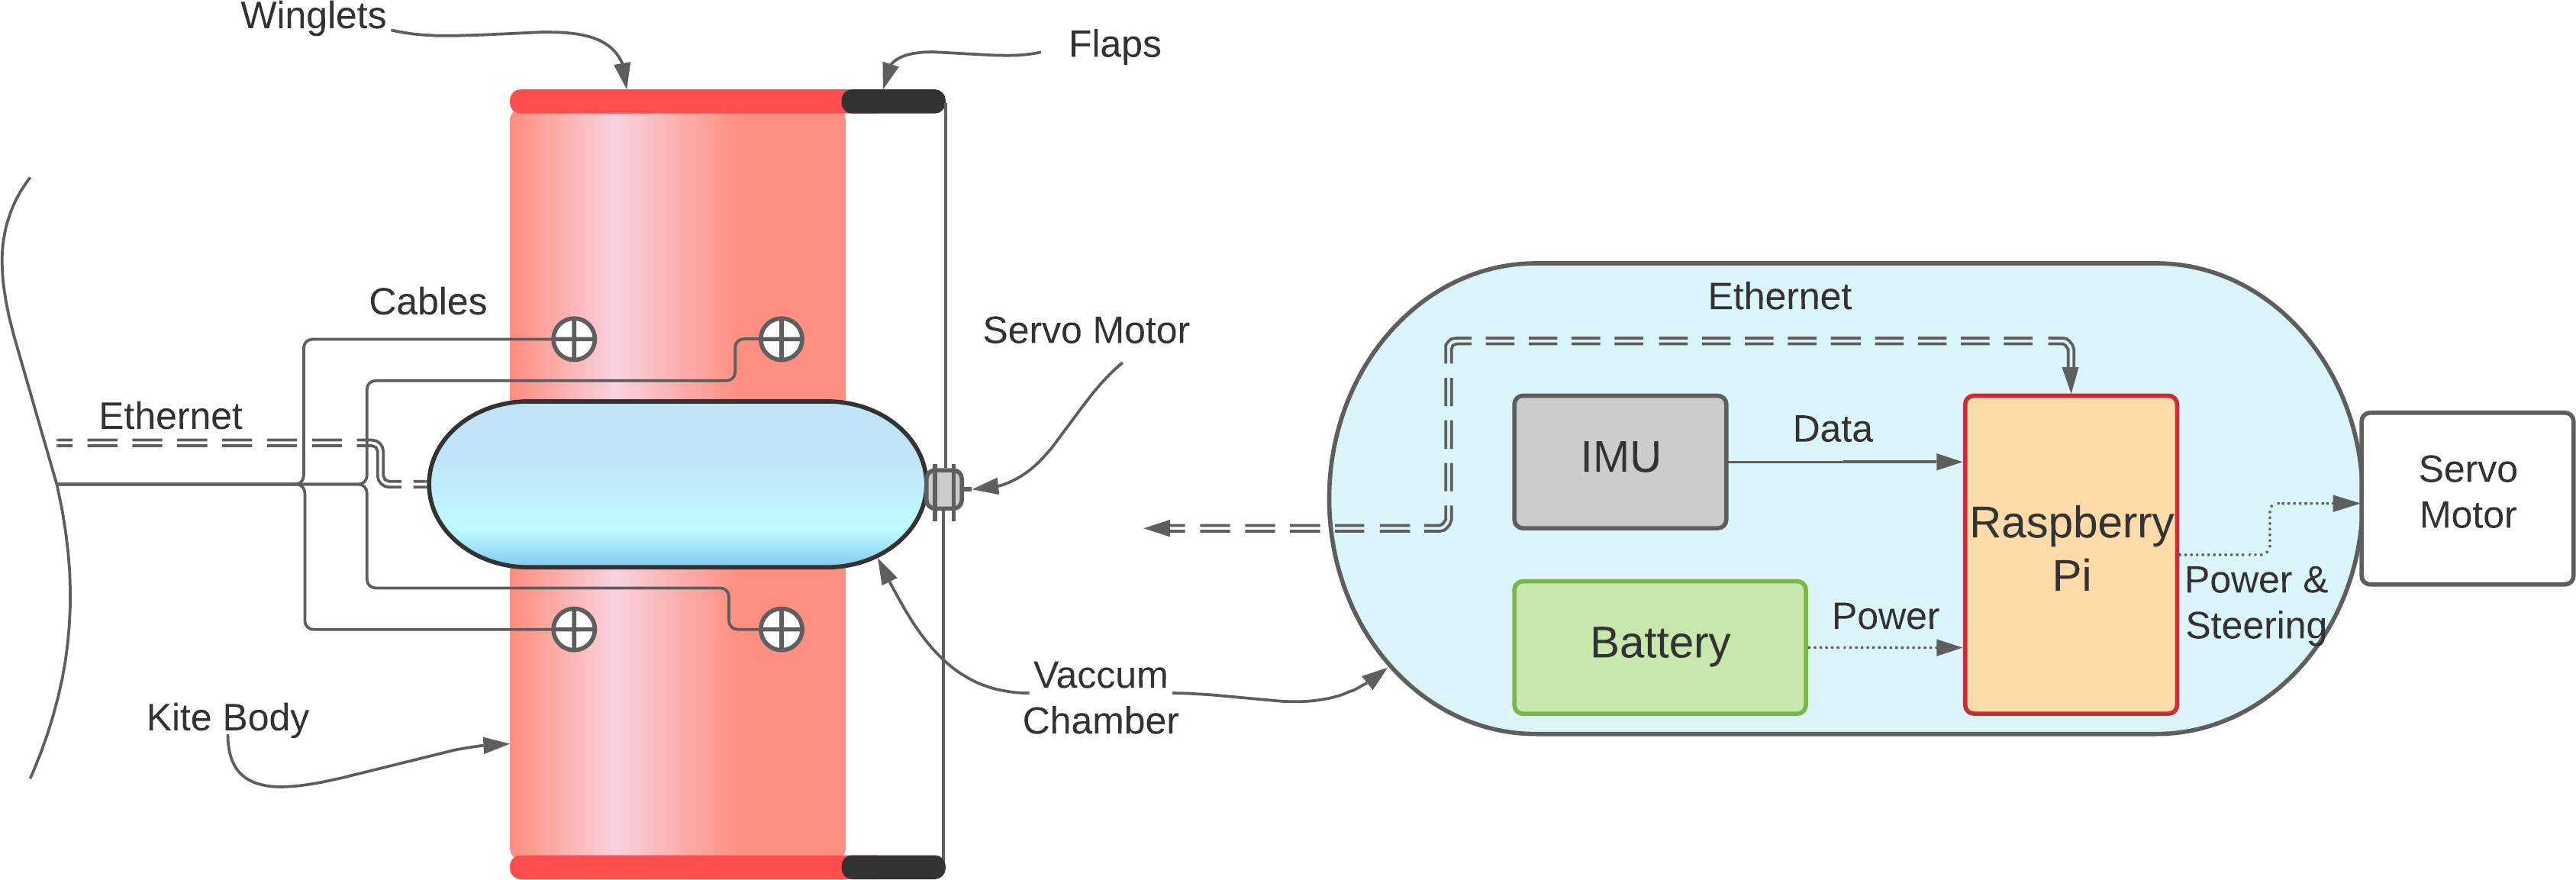
Figure 2 Schematic setup of first prototype with the overall design on the left and a more detailed look inside the acrylic vacuum chamber on the right.
The design is lacking a power generator and any kind of power transmission. As this was a first prototype the general target was to have a device in the water to gain experience and generate first data. Therefore, different problems were deliberately not addressed. The twisting of the cable was neglected and the data were transmitted using an Ethernet cable mounted. As mentioned earlier it was decided to choose a circular flight path unlike Minesto, which move in a figure of eight. Minesto’s approach prevents the twisting of the cable and uses a larger horizontal area of the water column but also implies more complex steering and varying generator speeds. All these problems were addressed in the second TUSK design and will be explained in the following Sections.
The wing was constructed around a wood-structure which is coated with fiberglass reinforced epoxy. This method was discarded with the new wing to achieve a smoother surface. On the wingtips winglets are mounted to reduce wingtip vortices and achieve better maneuverability. Flaps are integrated into the winglets to steer the TUSK. They are controlled using an DC servo motor.
The computational hardware, which was mentioned before, consists of three different devices. The steering is managed by a small computer, which operates the servo motor. The computer receives the commands through an Ethernet cable from outside the chamber and is steered manually. The same data line is also used to transmit the data which the IMU acquires. This device gathers data regarding the angular velocity, acceleration and further sensor values and will be explained further in Section 8. The user operating the vehicle on the water surface can access the IMU data and therefore estimate in which position and location the TUSK currently is and can then steer the TUSK accordingly. The chamber is further equipped with a battery to supply the computer with energy. The IMU comes already equipped with a battery. Due to the discard of the active steering in the second TUSK, the computer was made obsolete since its only task was to operate the servo motor. The IMU on the other hand was reused in the second design to gather data on flight behavior.
The main goal of the first prototype was to get it up running fast and gather data in the water. This was achieved within the first year and a first field test was conducted in water. To simulate a steady current the TUSK was connected to a boat which served as an anchor point. This boat then sailed at a given speed and the TUSK was put into the water and pulled behind the boat to test its flight behavior. Impressions from the test can be seen in Figure 3.
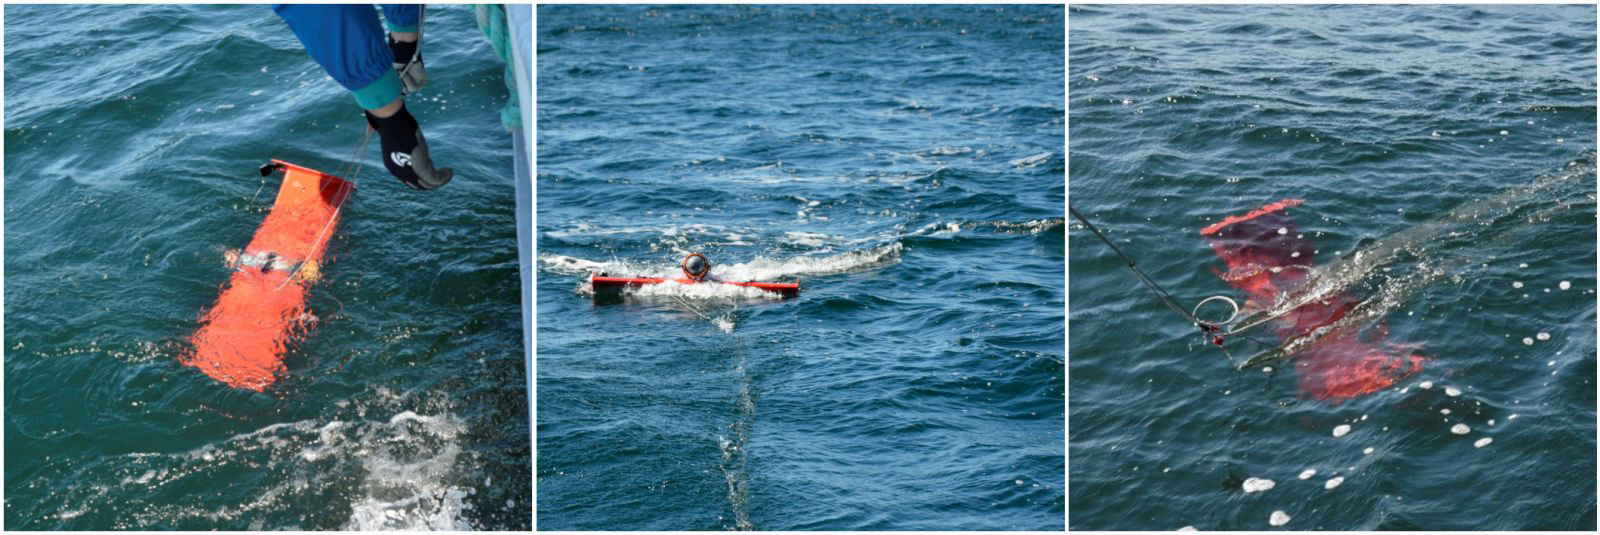
Figure 3 Test of first prototype at the Sven Loven Centre in Sweden 2019.
Due to a leakage in the Ethernet cable, the vacuum chamber was flooded quickly and the electrical systems were destroyed. Even though some data could be saved it was not sufficient to draw any conclusions from it.
While the first prototype was designed in a purely symmetrical fashion the second design had a more sophisticated approach. Similar to modern wind turbine blades, the second prototype featured a twisted airfoil which would self center the TUSK on a circular path. Therefore the steering unit used in the first prototype was made obsolete. The remaining technical devices are stored inside the wing which is flooded unlike the first prototype. Further a generator was added and a swivel to transmit the power generated by it. The data generated by the IMU were transmitted over the powerline as well using a power adapter. This general setup is illustrated in the Figure 4. To generate a feasible wing shape a motion analysis was conducted.
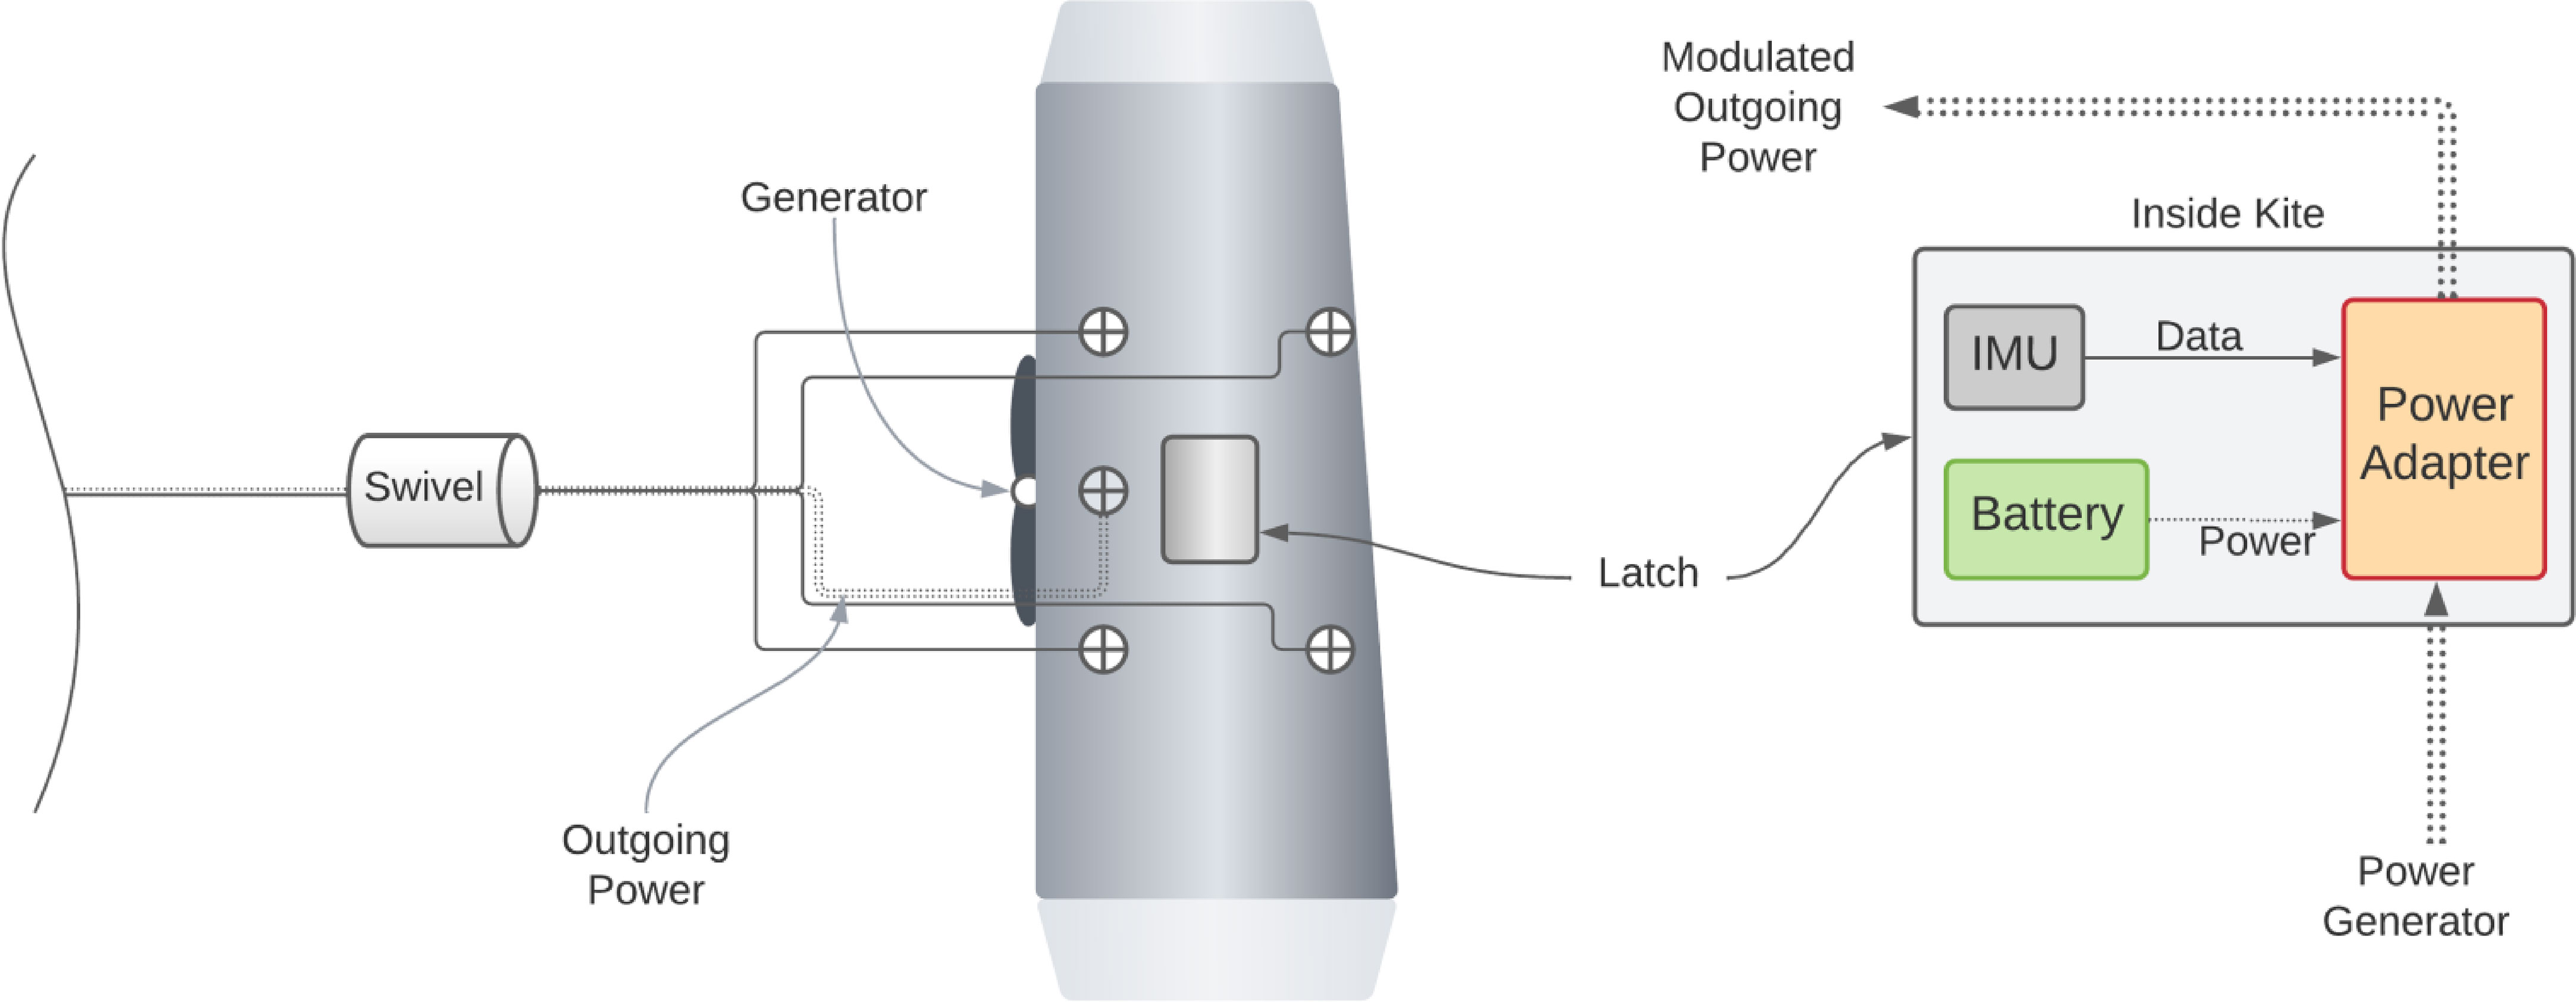
Figure 4 Schematic drawing of the second prototype TUSK. From left to right: To decouple the twisting a power transmitting swivel is placed in between the TUSK and the anchoring point. The wing is designed in a asymmetrical shape and is equipped with a generator on the backside. The computational equipment is stored inside the wing and further illustrated in the cut out.
Using the simulation software Autodesk CFD (Computational Fluid Dynamics) Motion (Autodesk, 2021), different design approaches and cross sections were used. As explained before, the efficiency of the design was a priority but even more important the design needed to keep the TUSK on a predetermined path. To achieve this, the wing was subjected to motion analysis. For this purpose, the path which the TUSK needs to stay on is configured and fed into the program, as shown in Figure 5.
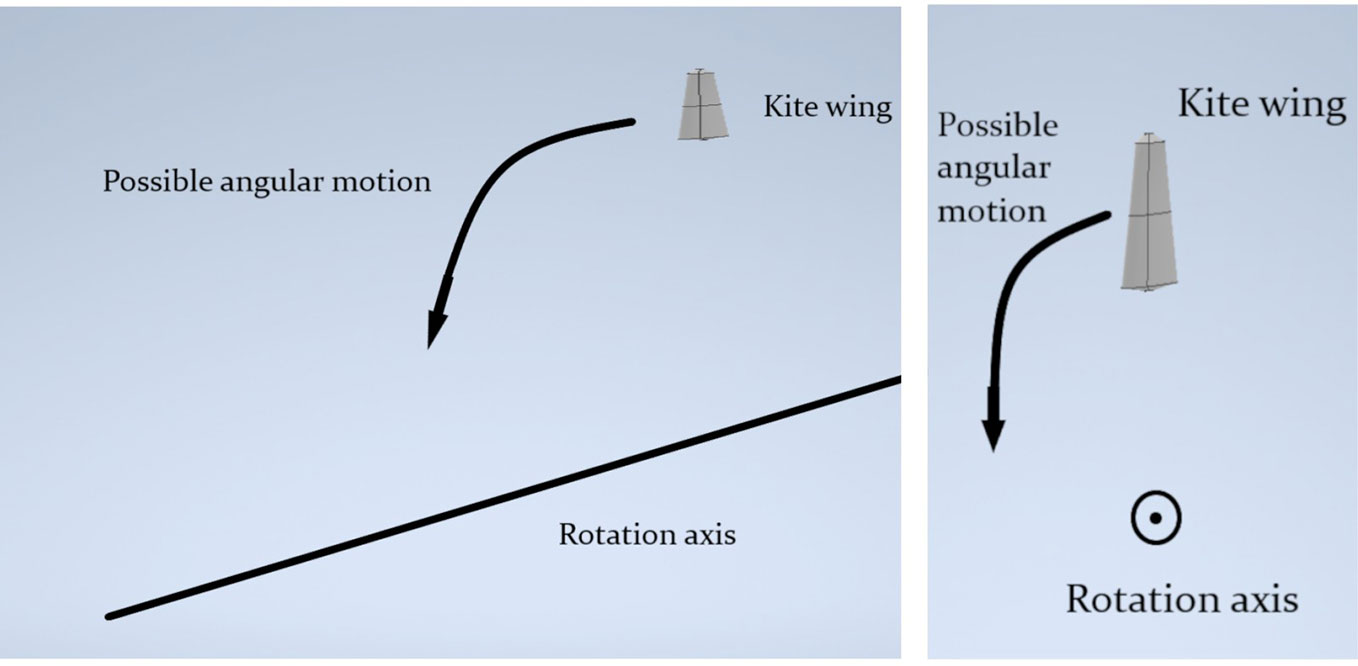
Figure 5 The setup for the motion simulation of the TUSK. The TUSK flies around a rotation axis at a given distance.
From here on different design approaches were chosen and parameters varied to determine the best design for this use case. Due to limited computational capacities only a limited set of parameters could be chosen for variation. To restrict the simulation time and iterations, the following were chosen as most important:
* Profile (according to NACA standard).
* Tapering over the length of the wing.
* Torsion over the length of the wing.
* Winglet design at the wingtips.
Inspired by wind turbine blades, the idea is to achieve higher efficiency by twisting and tapering the wing as it is common with turbine blades. Further the profile is altered over the length of the blade, accommodating the difference of speed depending on the distance to the hub. This concept could not be implemented due to insufficient means of production. Therefore a profile with an appropriate lift-to-drag ratio was chosen. For the remaining two aspects different characteristic values were defined and tested. An extensive explanation of the simulation process is omitted.
The most promising result is shown in Figure 6. The wing tapers by half continuously over the whole length. The torsion is not continuous and is limited to the smaller half of the wing where the difference in angle of attack between the center and the tip is 10. The profile as explained before does not change over length of the wing. In the picture the winglets are not yet attached but can be found in the later design.

Figure 6 Final design depicted in a 3D simulation tool.
In Table 1 the different wing velocities vwing are noted for different inlet velocities. According to the simulation an inlet velocity of 2m/s would lead to a wing velocity of up to 3.9m/s. Because the power P is proportional to the cube of the velocity, the 1.95-times greater velocity of the wing means a 7.4 - times greater power output.
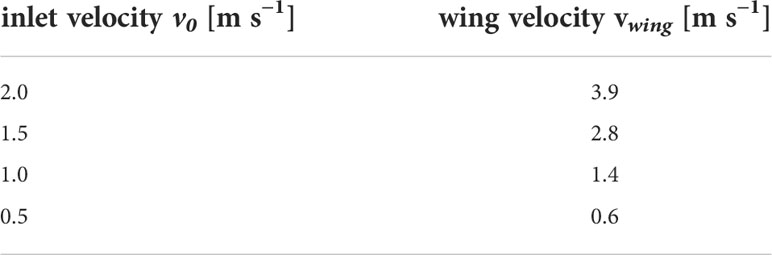
Table 1 Resulting wing velocities vwing of the final design from inlet velocities v0.
Similar to the first prototype the second wing was built using fiberglass reinforced epoxy. To enhance the hydrodynamics of the structure and allow for an even smoother surface it was decided to use a mould construction. To build the mould a foam base was found to be most suitable. The manufacturing of the foam positive can be executed in a short time and the materials can be sourced easily. The method finds a widespread use in model radio-controlled vehicles and other small to middle scale, low volume production.
This positive was used to make the fiberglass negative, which in turn functions as the mould for the fiberglass wing. Using a negative mould has the advantage of providing a defined surface and shape. Another benefit was that more wings can be produced and the moulds are reusable.
To build the positive of the wing, extruded polystyrene (XPS) foam was used due to its closed cell structure. The foam was cut using a hot wire cutter, this method works well with XPS foams, due to the wire melting its way through the foam and thus creating a thin layer of hardened polystyrene, which forms a flat and closed surface (Ahn et al., 2003). Due to imperfections the surface had to be processed by alternating between sanding and coating, until the shape and surface was satisfactory. The result can be seen in Figure 7.
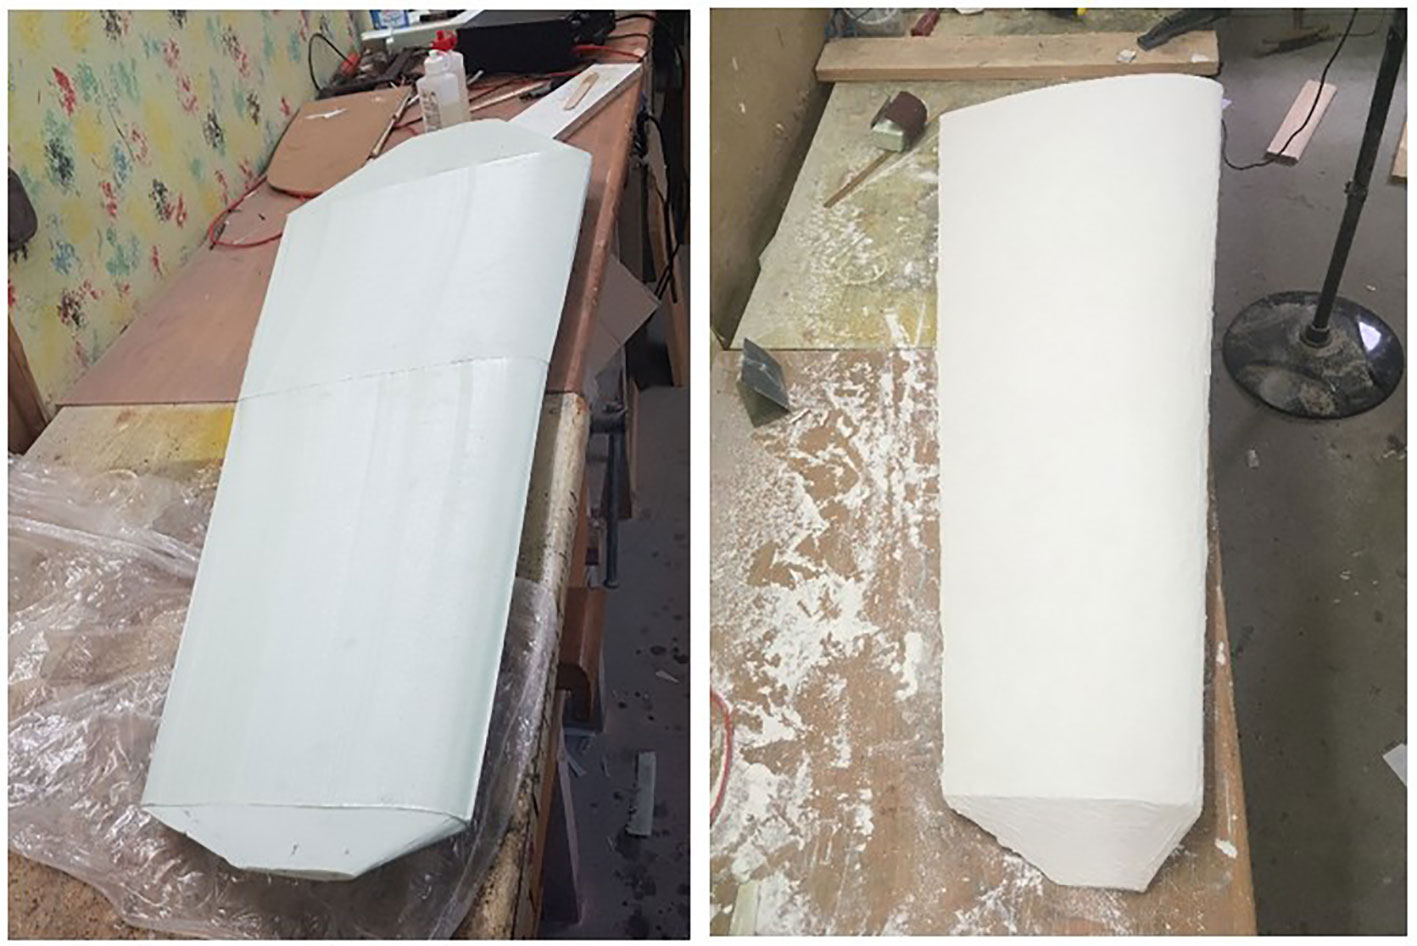
Figure 7 Foam wing glued together after manufacturing the single parts. In the right picture the application of the filler coat is depicted.
The foam positive was coated in two layers of epoxy resin and, after it was fully cured, rubbed down with three layers of a resin mould release agent. The release agent prevented the fiberglass mould from adhering to the foam and wing. More precisely the foam mould was laid out with fiberglass, which was then soaked in epoxy. Two to three layers were applied. After the first half of the mould has solidified, the foam encasing was torn off. The plain of the other mould half functions as the bottom. This ensures the mould halves were exactly complimentary, evening out imperfections in straightness of the separation line. The rest of the process done in the first mould was repeated, leaving two negative mould halves. In the top mould a piece of wood, wrapped tightly in cling film, was positioned. This was where the hatch will sit. The moulds were cleaned and wiped down several times with the release agent. A thick paste was made from epoxy resin, thixotropic agent (thickener) and multi-colored glitter. The paste, which is a kind of gel coat, was spread thickly in the moulds creating a bubble free and workable surface layer. The advantages of this paste over polyester gel coat were its finish hardness, impact resistance and bonding capabilities.
Each wing half consists of six fiberglass layers total. Three biaxial layers making the wing torsion-resistant and, through the arc that each half forms, diverting pressure stress. One UD layer oriented from leading to trailing edge diverting pressure stress. Two UD layers oriented along the span making the wing bend resistant. All these layers can be seen in Figure 8. The cloths were laid in a predetermined order to minimize warping. On the laminate in the bottom mould (high pressure side) a strip of foam was positioned lengthwise, and fiber glassed over. The purpose of this will be explained in Section 4.3.
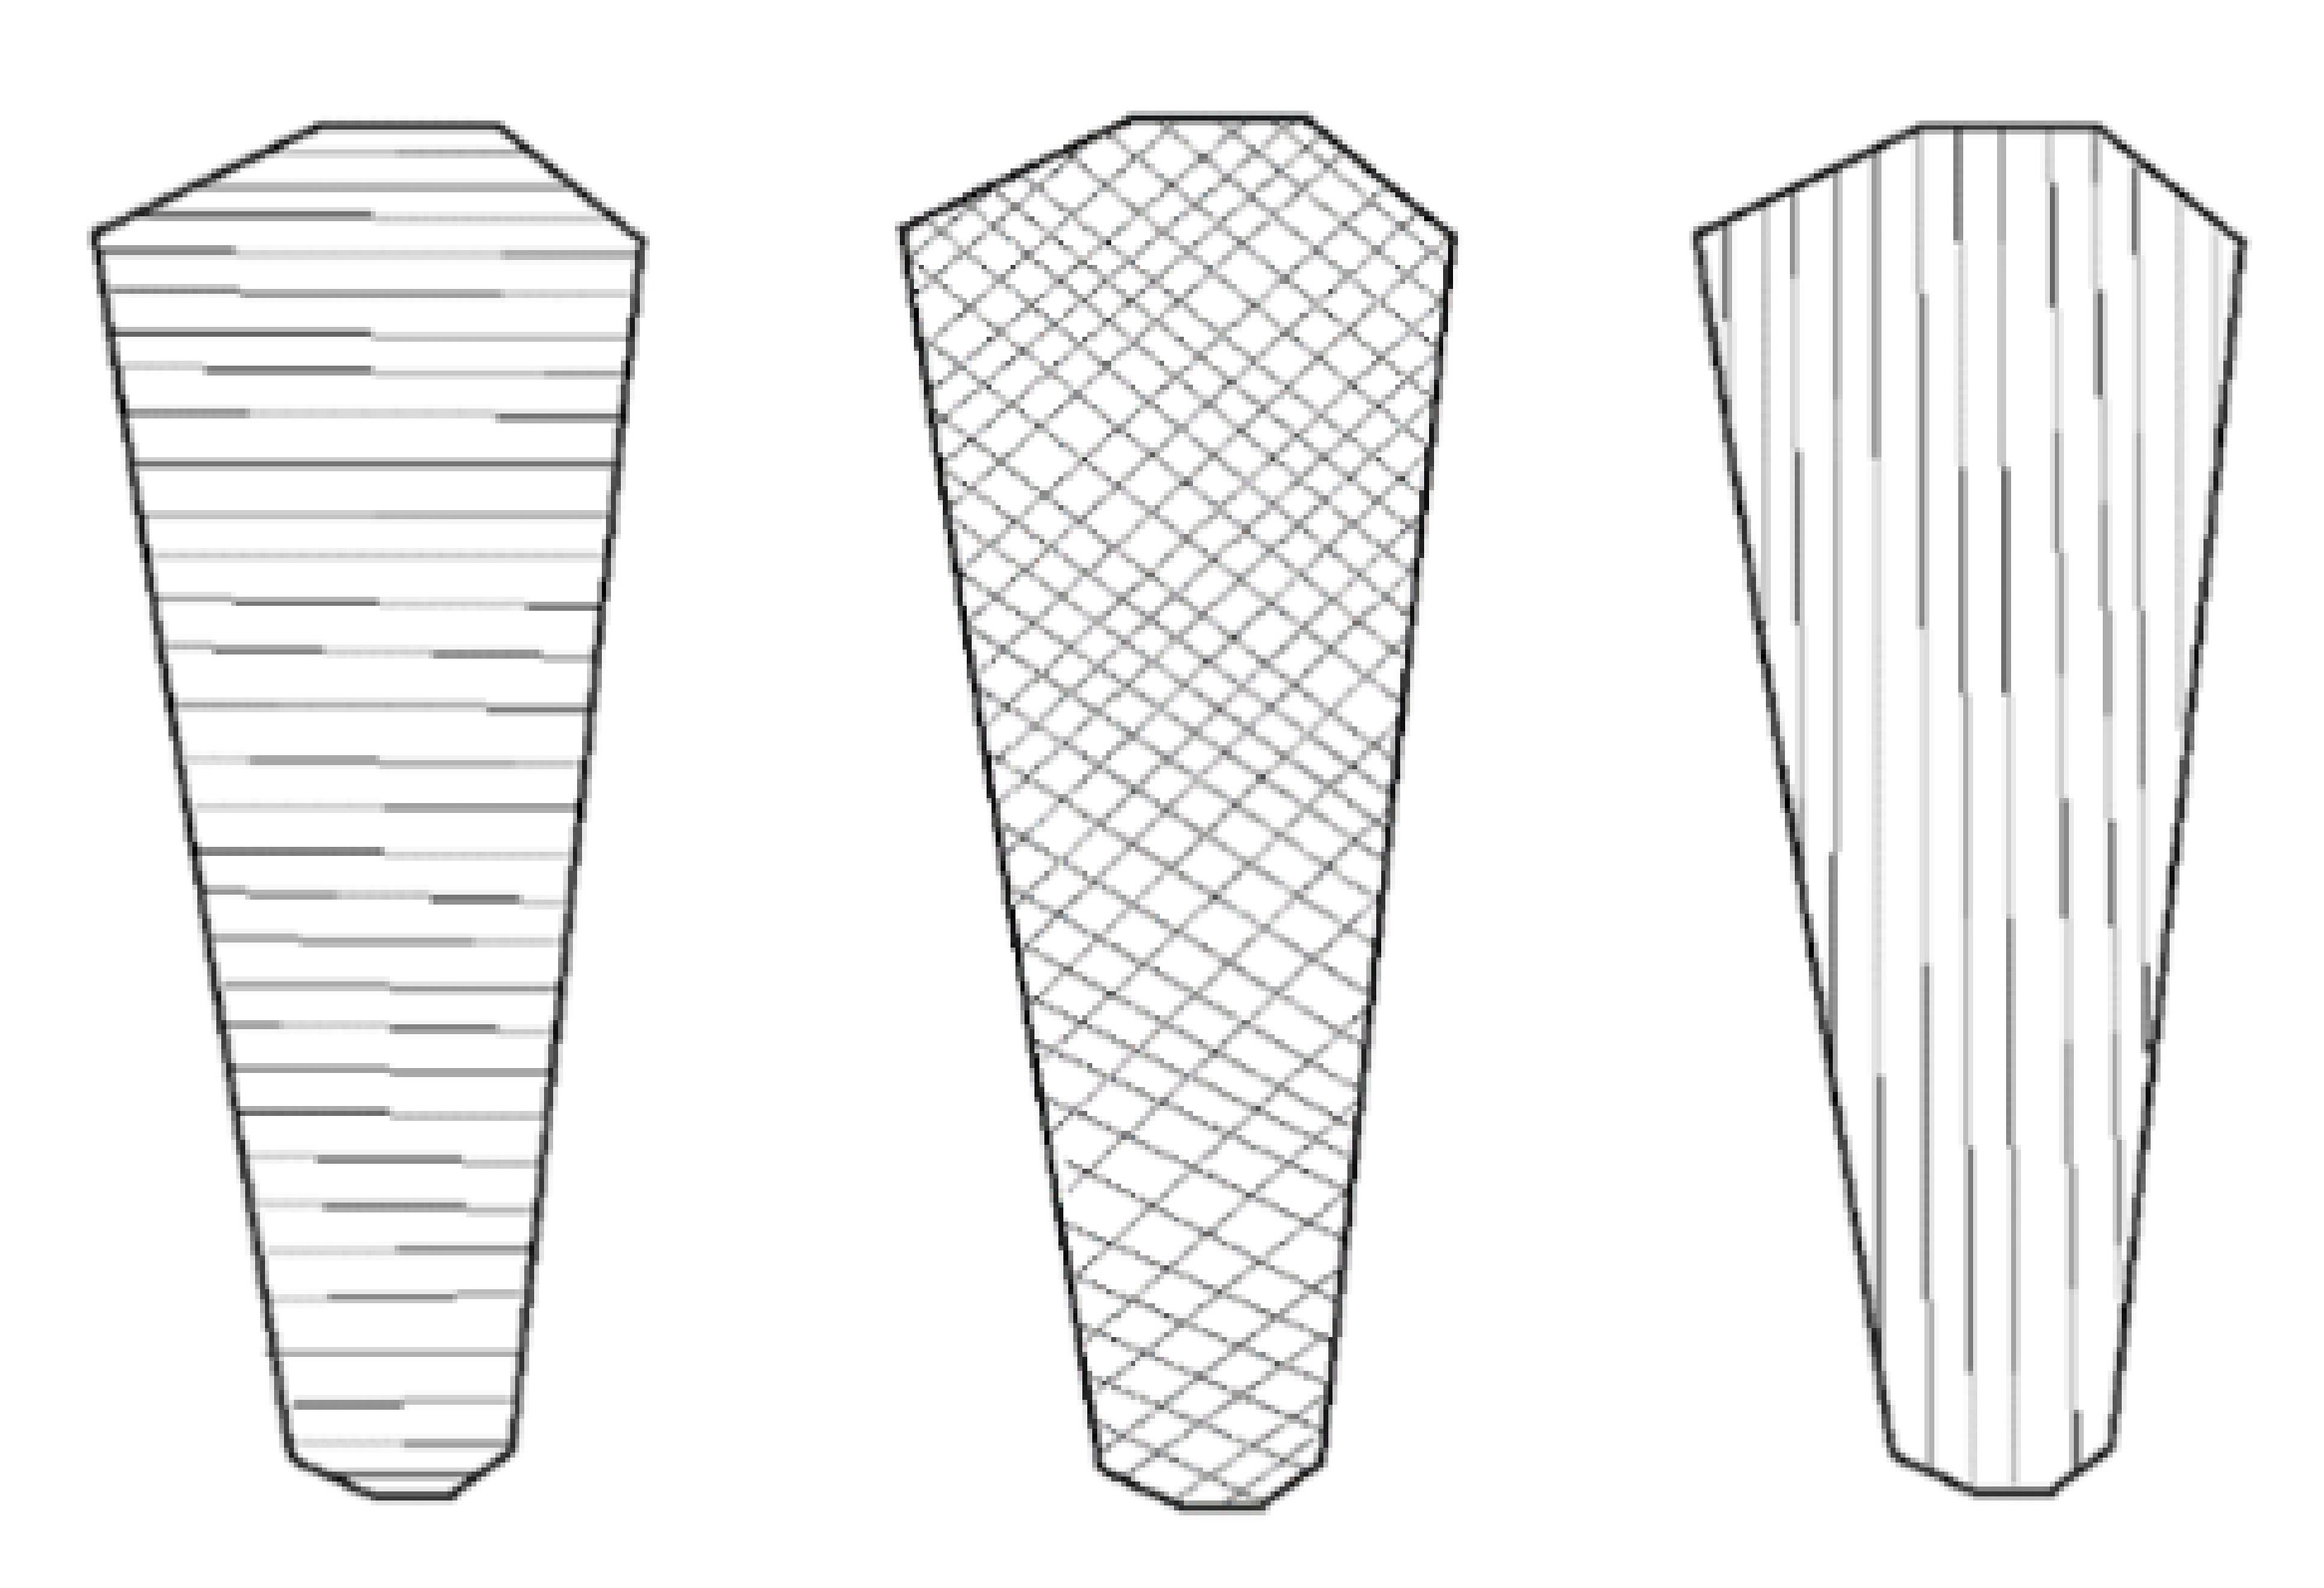
Figure 8 Applied fiberglass orientations. Left to right: UD leading to trailing edge, biaxial layers and UD tip to tip.
The recessed hatch was cut out with a dremel tool, leaving 5 mm to each side. A previously fabricated fiberglass hatch door was fit up to precisely fit the recess, as shown in Figure 9 1-3. On the other half, a thin rectangle was cut in the outer shell to open up the foam strip. Four holes were drilled for the inserts at strategic positions. The inserts, consisting of three washers decreasing in size and a nut, were glued into place with epoxy. To prevent the screw from adhering to the epoxy, the thread was coated in grease. After the epoxy has cured, the edges were sanded down to sit flush and the defects were repaired. Finally, the wing was taken through the grids, starting with 120 grid and finishing with a polishing and waxing compound used for boats.
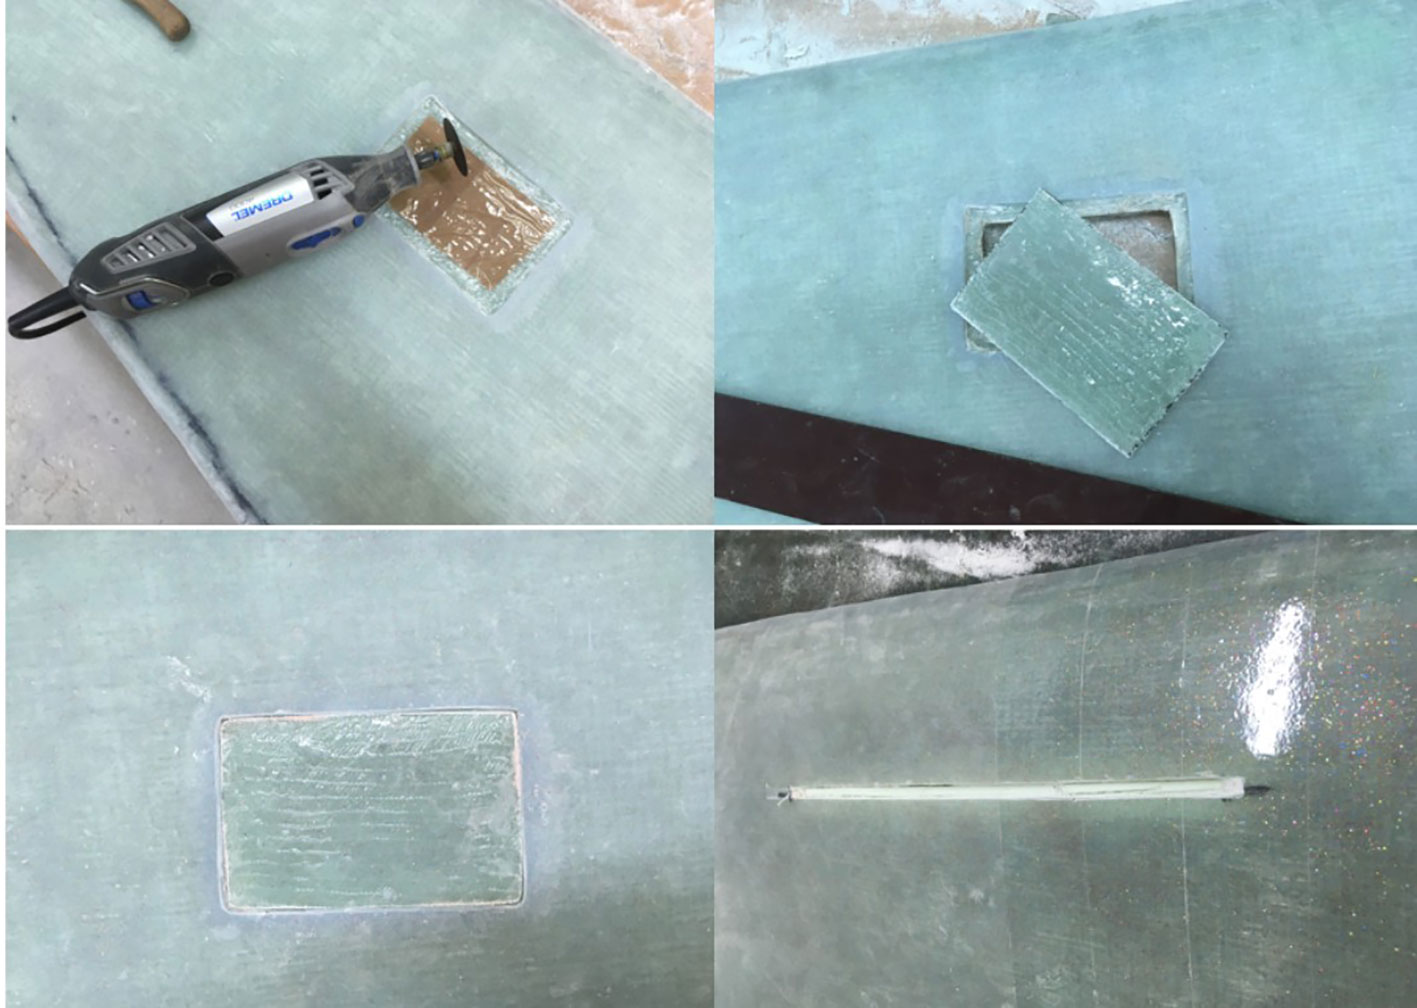
Figure 9 Manufacturing of the hatch for the electric components and a rail for the generator mount.
The generator mount consists of an aluminum L-profile and a small aluminum plate, depicted in Figure 10. The plate has a threaded M5 hole and was used to clamp the L-profile to the rail. The vertical side of the L-profile functions as a base plate for the generator, shown in in Figure 10. There were four holes for the screws and one for the generator shaft.
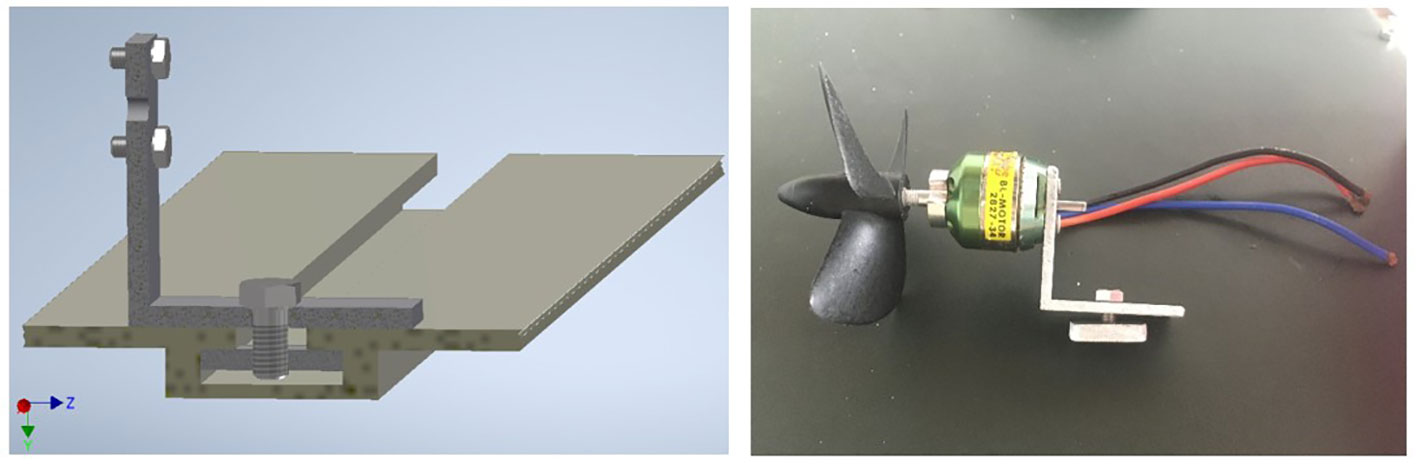
Figure 10 Designed generator mount and rail with computer aided design. On the right the generator shown with the mount.
Because the generator induces drag and can be shifted along the wing, it acts as a passive form of steering that will help fine-tuning the radius of the TUSK’s circular trajectory. The generator is a ROXXY BL-Motor 2827-34. It was chosen because it was already waterproofed and was tested to work well with the speeds that the TUSK was predicted to reach.
The swivel is a core element of the overall design as it allows for the circular flight path. Without this device the tether would twist and eventually break. Further, the swivel does not only allow for the force of the TUSk pulling to be transmitted over the tether to the anchor, but also transmits the gathered IMU data as well as the generated electricity by the generator.
The main design point of the swivel is that all parts are conforming to standards (Hoischen, 2003) (DIN, 2002) (ISO, 1991). As shown in Figure 11 the swivel consists of a clear Plexiglas tube, allowing to check if water has seeped in without disassembly. It also is not load bearing which is beneficial for the O-rings. The bearings are on separate surfaces; this eases the assembly process greatly as they do not have to be moved far in their respective fit. All components are fixed to the two covers. This improves ease of fabrication and assembly.
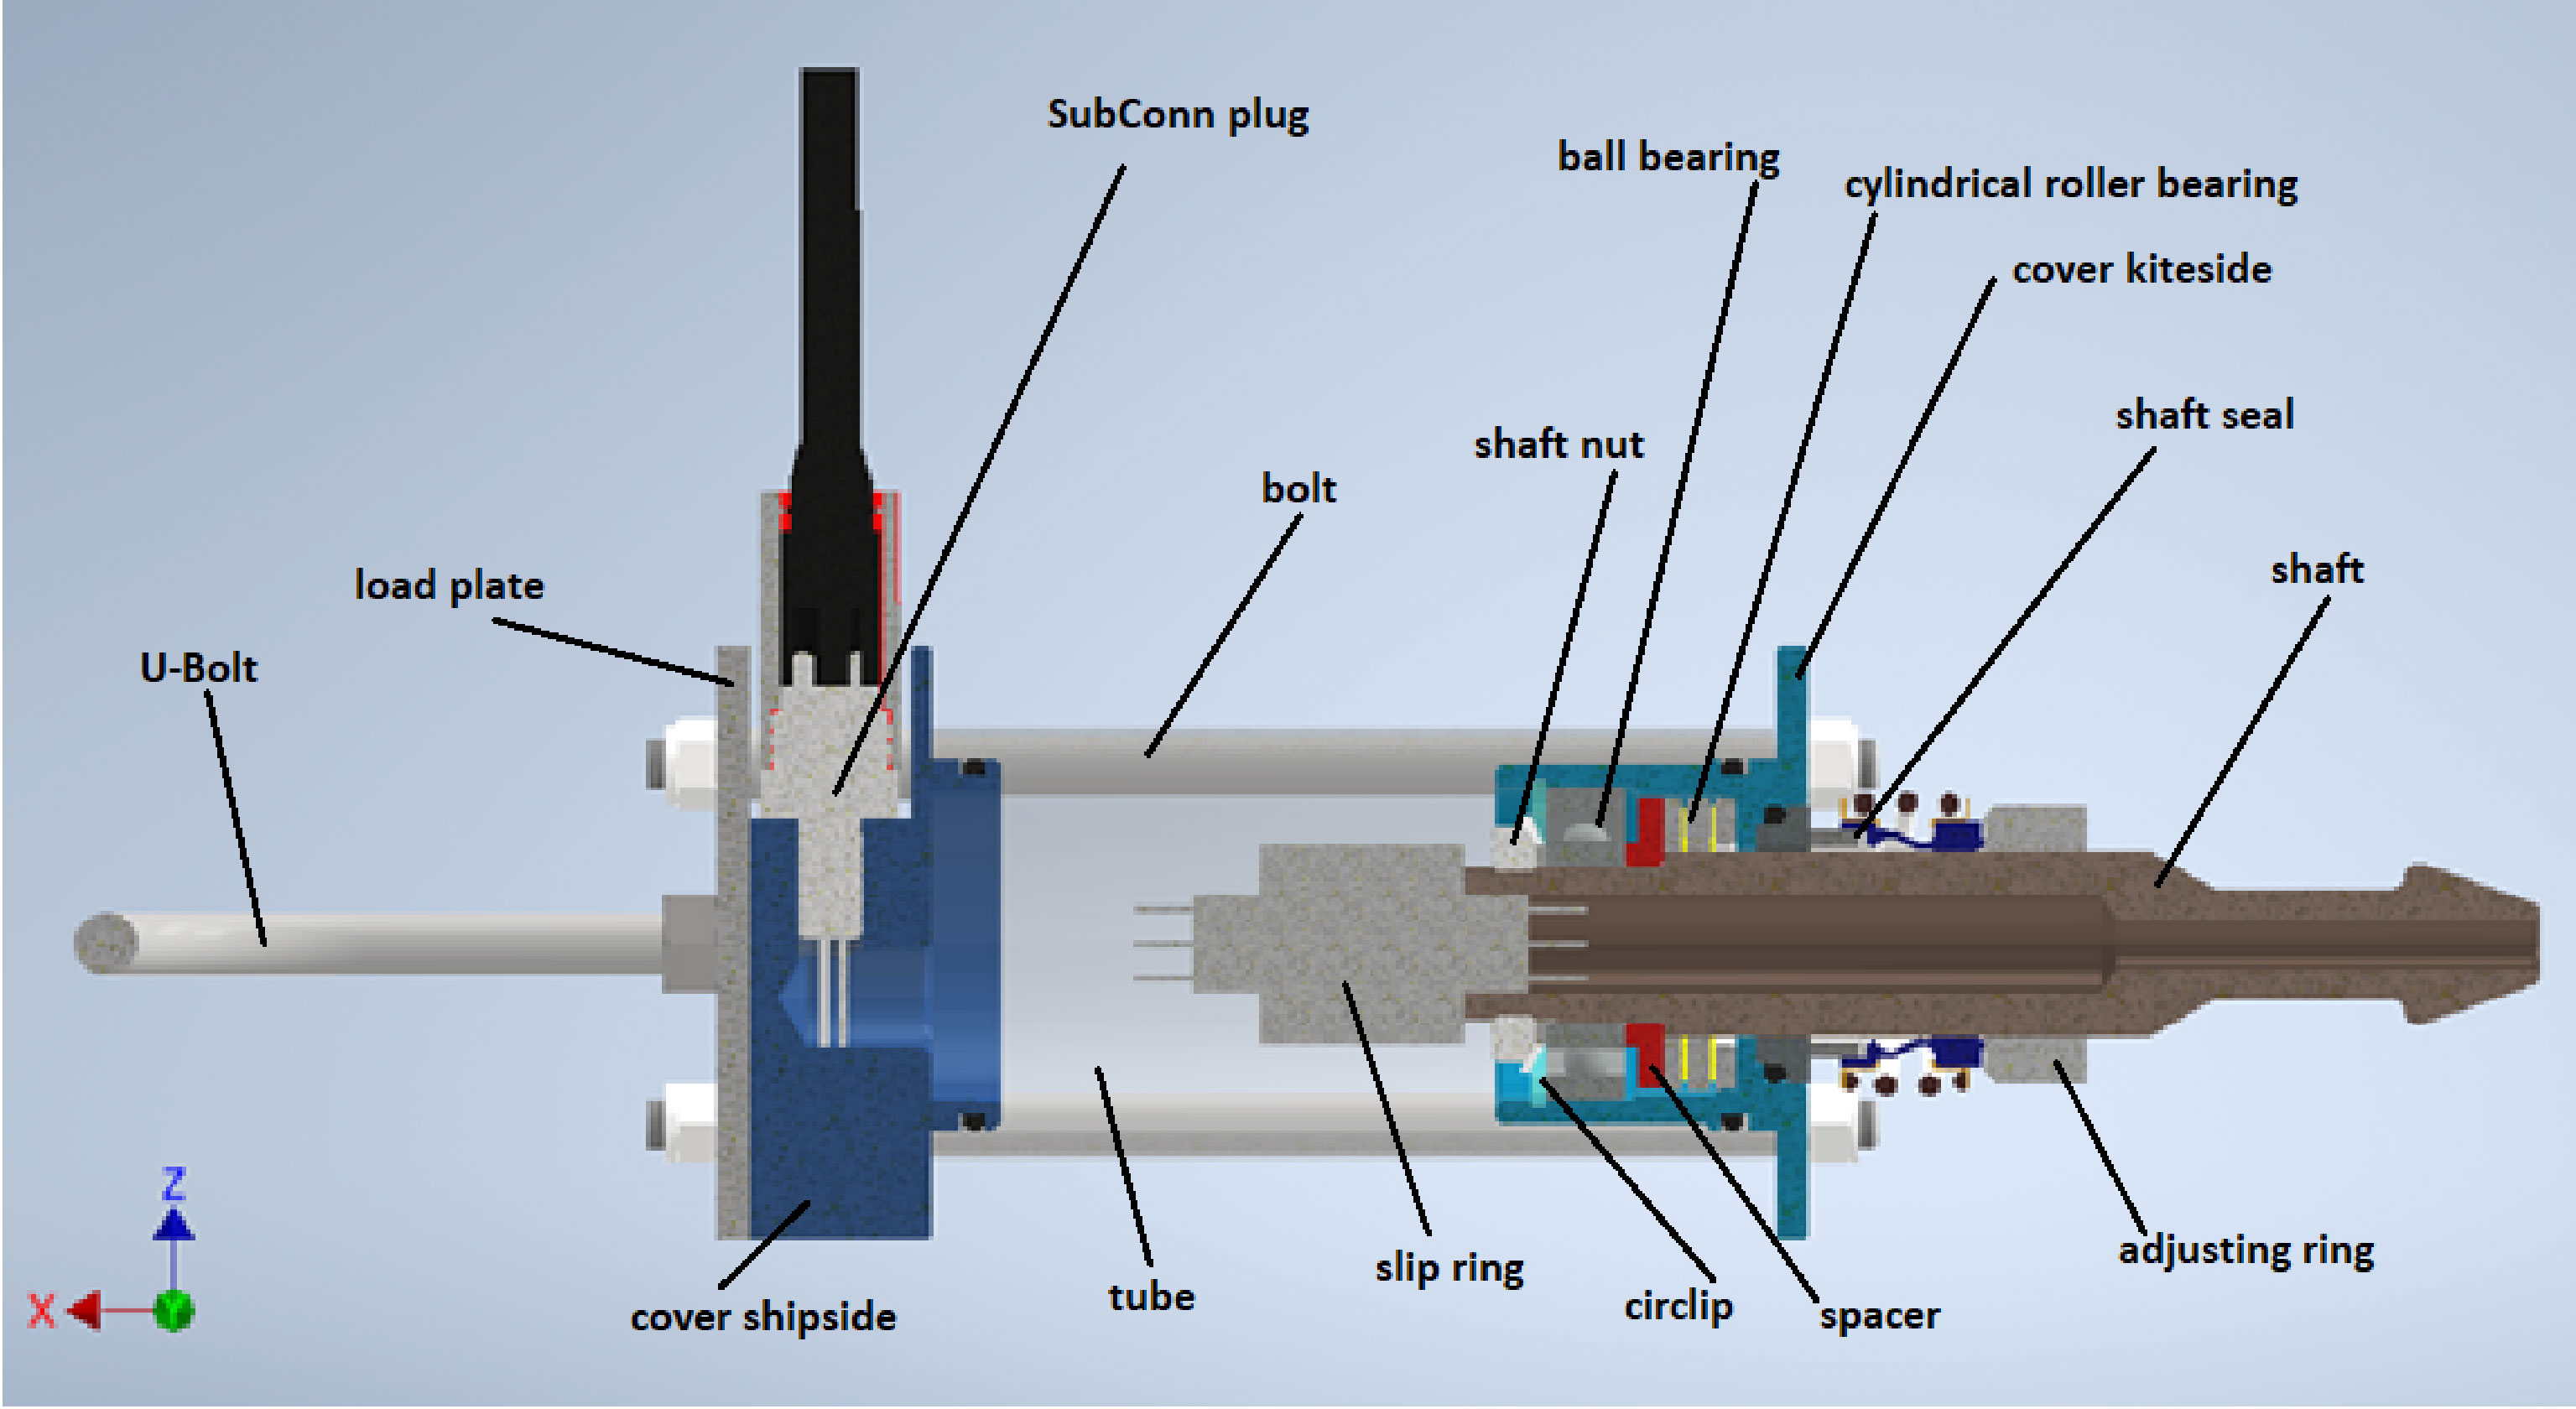
Figure 11 Main components of the swivel.
The swivel is designed to hold more than two tons (20 kN). This value is based on calculations and part indications.
In Figure 12A the load path in the swivel is portrayed. Starting from the left, the boat pulls on the U-bolt, which in turn transmits the force to the load plate. The load plate diverts the force to the four bolts leading to the cover kite side. Here, the force is directed inward to the cylindrical roller bearing. It then passes through the spacer and the inner ring of the roller bearing to be transmitted by the shaft nut to the shaft. From the shaft the force enters the fiberglass sleeve and UD strings.
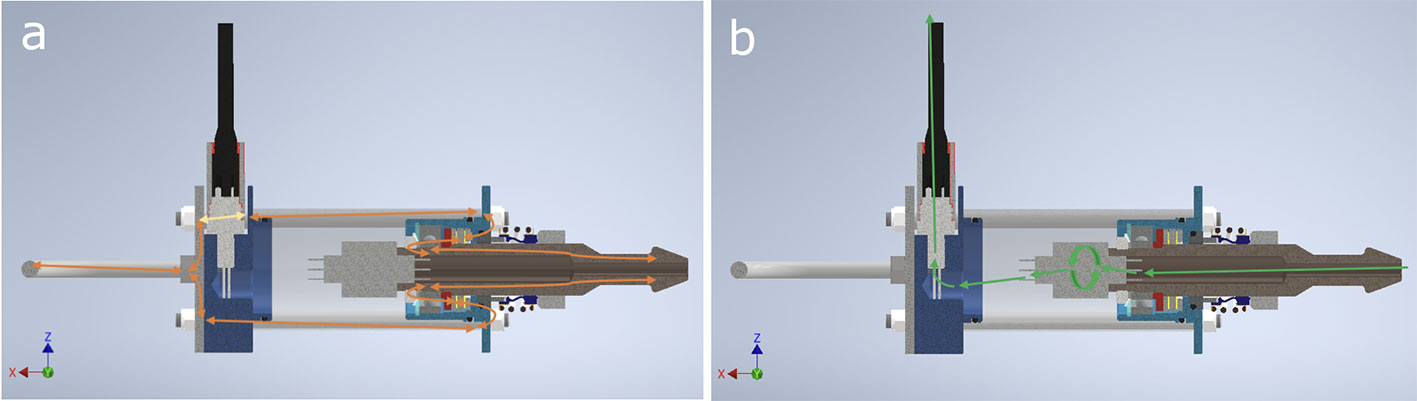
Figure 12 (A) Path of the load force through the swivel is presented. The load path within the swivel is indicated through the orange arrows. (B) Path of the current within the power line though the swivel. The current is indicated through the green arrows.
In Figure 12B the electricity and data path is portrayed. The cable comes in from the kite side. It is glued into the shaft with a soft sealant, such as Sikaflex. The current enters the slip ring from the right side. Here it is transmitted to the corresponding wires leading out of the slip ring and into the SubConn connector, which is screwed into the cover ship side. From here it leads straight to the boat.
To transfer the data of the IMU to the computer for further analysis a data connection was needed. But the narrow design of the swivel only allowed for the current-carrying cable to be fed through, thus made a direct data cable connection impractical. The most suitable approach for the data transfer was, to use a modified powerline adapter and transfer the data via the current-carrying cable.
The power line data communication is used to transfer data from one device to another using electrical power lines, with the advantage that no external data cable is needed. The application of power line adapters in common households is to provide Wireless-Fidelity (WLAN) or Local Area Network (LAN) access over the the power lines. There are various power line adapters which differ in their data transmitting type, caused by regional differences. In Europe, the dominating power line adapter is an IEEE-1901-FFT standard, which uses a orthogonal frequency division multiplexing with a Fast Fourier-Transformation (FFT) as a base (IEEE, 2010). The FFT is used to divide a time discrete signal in its frequency parts. This provides an easy way to analyze the signal.
In the modulation process a carrier wave is the base for transmitting the data. It has a constant frequency and can be changed by a wave input signal to implement data information. This changes the shape of the wave either in the amplitude, the frequency or the phase (Li, 2020). The changed carriers will then be combined to one signal by using the multiplexing technique. The outgoing and incoming signals will be combined to one signal and transferred. At the receiver, the signal is divided so the outcome will be the same carriers. This technique is called demultiplexing.
Orthogonal frequency modulation makes it possible to submit several different carriers over the same medium, by frequency differentiation between the carriers. The systematic behind this is, that each carrier peaks at the point of its neighbor signals zero crossing, preventing to interrupt the other carriers. This only works with carriers orthogonal to each other. Each of the orthogonal carriers is modulated with a small amount of the data that needs to be transmitted, preventing disturbances and echoes of the signal. This process of ensuring the right transmitting of the signal is important for the power line adapter, which can deal with great influences by the electricity transmitted simultaneously by the power cable.
The problem of introducing the power line communication to the TUSK system is that a power line adapter uses the voltage of a power plug which, installed in Europe, provides around 230 V. The maximum voltage provided in the TUSK is based on an internal battery pack, which can only provide a small voltage. To solve the problem the power line adapter was removed from its case, so the circuit board is accessible shown in Figure 13. The circuit board was analyzed, to identify components and possible sub circuits and figure out their functions, which lead to the realization that there are two main circuits, one which converts the introduced voltage and the other one, which works with the converted voltage, that transfers the data signal. The realization that the voltage is converted supported the suggestion, that the voltage needed for the data transferring process is significantly lower than the voltage of power plugs. Measurements of the circuit board revealed that the actual required voltage is around 12, also the measurements showed that the data transfer circuit works independent from the converting circuit. Proving the measurement, the AC/DC voltage converter was removed, and an external power source was connected to the capacitor that connects to the data transfer circuit. Additionally, the power line adapters were connected with a power cable, representing the cable between the TUSK and the computer. One power line adapter was connected to an IMU, and one was connected to a WLAN adapter, which connects to a computer receiving the data.

Figure 13 Front side of the power line adapter which was adapted and implicated into the system.
For measurements a voltage around 12V was set as the start testing voltage. The goal was to find the lowest operation voltage, so the voltage is lowered over the time until the computer does not receive any data. The measurements showed that operation voltage can be lowered to 5V and the IMU data is still successfully transferred to the computer. Further the test ensured, that there are no disturbances in the data transfer ratio. This validation of the modification of the power line adapters leads to the further implication of the adapters in the system. In the system one adapter was placed in the wing. It is connected to a battery pack of four AA batteries with 1.5V each, introducing a total voltage of 6V and connected to the IMU via WLAN. The cable connecting the wing through the swivel is used for the data transfer and the second power line adapter is connected to the power cable and the computer.
The TUSK is designed in a way maintain a circular flight path only due to its wing design. Therefore, there is no need for an active steering system and the required navigation system to accommodate the steering. Still, to monitor and improve flight behavior, measurements need to be taken on the speed, angle and pitch of the system. Thus, a navigation system is necessary to support the design and development process of the TUSK.
To monitor the flight behavior of the TUSK several systems were considered. Due to the GPS-wavelength absorbing property of water, a GPS based navigation was not an option. Further, due to the overall light absorbance of water it is also not possible to use a visual tracking system for navigation. A common means of navigation in unmanned vehicles is an IMU.
An IMU is an electronic device that consist of several inertial sensors like accelerometers and rotation rate sensors (gyroscopes). These devices allow for the IMU to measure the acceleration force acting on the device and the rotational angular rate in three spatial dimensions. The device used for this project is further equipped with a magnetometer to measure the surrounding magnetic force, which is also resolved in three spatial dimensions. Merging these inputs, IMUs can be used to estimate a vehicle’s position in absence of other position data. Only using an IMU as a means of navigation imposes the risk of the data drifting due to imperfections in the system and therefore a loss of accuracy in the dataset. This loss of accuracy was accepted due to the early development stage of the prototype.
The IMU used for this project is the NGIMU produced by the company x-io (x io, 2021). The device uses a sample rate of 400Hz for the accelerometer and gyroscope and monitors the magnetometer with 20Hz. The NGIMU is further equipped with a pressure and a humidity sensor. The data gathered by the later two sensors is not relevant for the prototype as the NGIMU will be placed inside the Current Kite. Therefore these sensors are not considered in the data analysis. The NGIMU uses Micro USB (Universal Serial Bus), Serial (RS-232) and WLAN (Wireless Local Area Network) as communication interfaces.
To access the data gathered by the IMU the options are to save them locally and access after the measurement or to stream the data in real time. The first option requires no additional data transmission cable, but it requires for the operation to stop and to dismantle the device on land to extract the memory card and copy the dataset. This is not beneficial for a device that should work autonomous in the long-term. Therefore this option was discarded. Instead, it was decided to establish a live-data-transmission using the WLAN interface. As explained in the previous Section instead of an independent communication cable the system uses the modulation of the powerline current to transmit the data gathered by the IMU. This data then is received by the computer connected to the TUSK to be analyzed and displayed to the operator.
The two powerline adapters (each functioning as a router) are set up as a local network which the IMU and the computer access as clients with a static-IP. The data sent by the IMU is transmitted using a WLAN connection to the powerline adapter on the TUSK. The packages are addressed to the computer’s IP-address and therefore are send to the second powerline adapter. Using wave modulation, the data is transmitted over the powerline to the second powerline adapter. The computer is registered with this powerline adapter and has a static-IP connection. Therefore, the powerline adapter forwards the data sent by the IMU over a WLAN interface to the computer. The connection is based on the UDP (User Datagram Protocol) and sends data at 30Hz. The data received by the computer is then analyzed in real time using software developed for this project.
The IMU sends the recorded data at a frequency of 30 Hz (datasets are saved at a higher frequency locally) encoded in a OSC (Open Sound Control) format. The data therefore first needs to be decoded. As a result, one obtains an array with different values and data types. The array is specified using a milliseconds time stamp and consists of the gyroscope acceleration values in x, y and z direction, accelerometer-forces in x, y and z direction, magnetometer-forces in x, y and z direction, barometer-pressure and the humidity. For further analysis only the gyroscope and accelerometer values are used with their according timestamp. The values are then filtered for errors and plotted in according diagrams. To test the setup the IMU was connected to a rotating lever. The result can be seen in Figure 14. The three lines plotted in the top diagram are the gyroscope-acceleration in x, y and z direction. As the rotation is only a two-dimensional movement the only value with a significant change in behavior is the z-value (green). As the device speeds up the wavelength gets shorter and the angular velocity increases until a steady frequency is reached towards the end. The two other values x and y barely experience any increase in angular velocity, still one can see a marginal part of a sinus-function in the graphs induced by the vibration of the device.
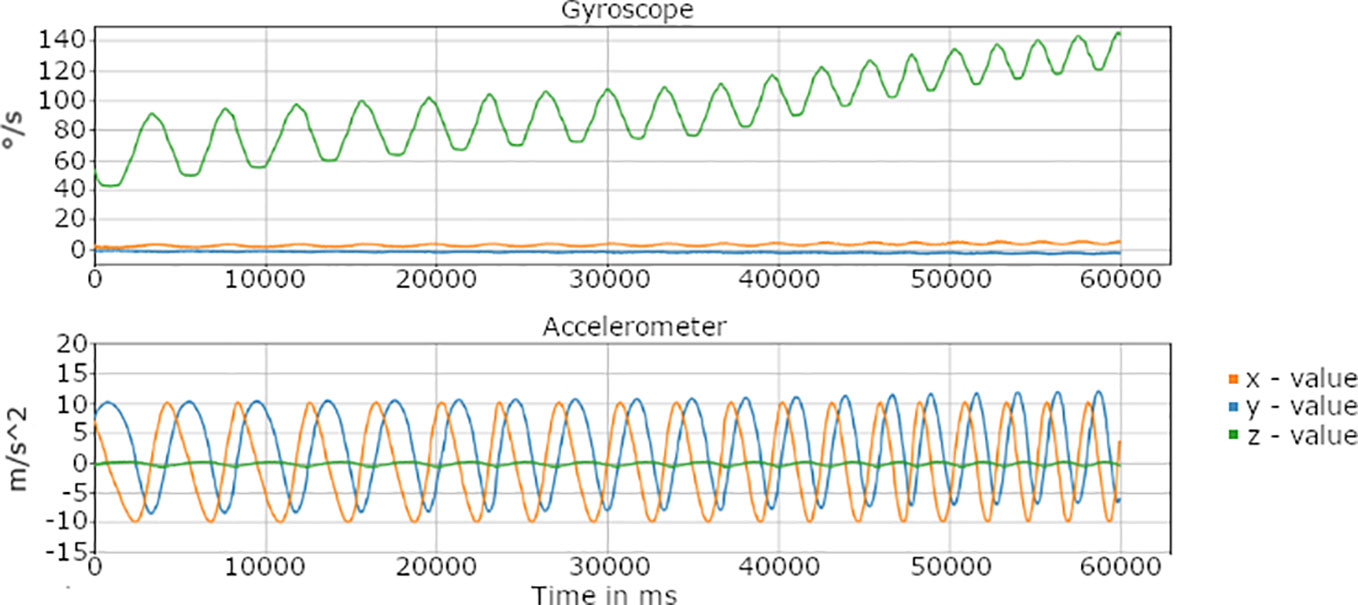
Figure 14 Visualized data for the starting process of the IMU mounted to a rotating lever. In the top diagram the gyroscope data are visualized. In the bottom diagram the accelerometer values are depicted.
In the bottom diagram of Figure 14 the accelerometer values are depicted. Here the behavior of the curves is the opposite of the gyroscope curves. The z-value barely changes and the x and y values are affected by the rotational movement. As the z-axis is parallel to the rotational axis, the forces implied by the rotation on the sensor are only marginal in comparison to the resulting forces in the direction of x and y. Here, the wavelength of the x and y curves decrease and the amplitude increases slightly as the lever increases it’s rotational speed.
Further a data logging process which saves the complete dataset for later analysis was added. The software shown here is in a prototype phase. The existing program is sufficient for a general analysis of the system’s behavior. One can analyze trends and reoccurring movements and approximate the TUSK’s orientation. Still this is not satisfactorily for a full analysis of the flight behavior. Especially with less steady movements and more degrees of freedom the operator is not able to understand the TUSK’s flight behavior and orientation. Further the data-drift is not sufficiently researched. The future goal is to estimate the TUSK’s position in space based on the data gathered by the IMU. To achieve this algorithms need to be implemented that weight the importance of the different inputs and fuse them (Kok et al., 2017). Further most system in place today rely on a reference point for this analysis. With its fixed anchoring, there is a potential for a reference point. This has to be further investigated and can be implemented later.
To supply the rising energy demand of the future with sustainable technology, societies are looking for a diverse and independent mix of energy sources. Predictability will be a key component in replacing current base load capable conventional power plants. A sustainable source of power, which only gets a little consideration are the steady and strong currents circling our oceans. An initial successful approach to harvest tidal current energy was done by the company Minesto. We were inspired by their work and tried to adapt their basic concept to suit our design. The underlying idea of this project was to change the flight path of the TUSK from a figure of eight to a circle. What might sound insignificant posed many technical challenges and possible advantages in efficiency and complexity. The process from the first idea to a final prototype can be followed along on the development of the two prototypes we build.
The first prototype was a continuous wing profile constructed around an aluminum and wood core. It featured flaps at the wingtips which were integrated into the design and controlled by the operator with the help of a servo motor. All electronic devices besides the servo motor where positioned in a separate chamber. A battery powered small computer was used to simultaneously operate the servo motor and stream the data gathered by the IMU via an Ethernet cable to a Laptop above the water surface. The main idea behind the first prototype was to gain information and data. Through the production and programming of this system a lot of knowledge could be gained. The first field test did not generate a lot of valuable data as the system got damaged and could not further be used.
The second prototype was designed with a specific focus set on the circular flight-path. The wing body did not feature a core but was sole build out of fiberglass using a negative mould. This was done to get as close as possible to the simulations. In these simulations the wing designs where tested and determined the final parameters. This TUSK was not a continuous wing profile as the wing tapered by half over its full length. Further the wing was twisted on the outer half to accommodate the higher speed. To not interfere with the calculated hydrodynamics the technical devices where placed inside the wing. A circular flight path introduces a constant drilling to the tether leading to a constant counter momentum slowing down the TUSK or ultimately to the failure of the tether. To solve this problem a novel swivel was designed which not only prevents the drilling of the tether, but also allows for the electric current to be transmitted. To omit the implementation of a data cable, two powerline adapters where configured to be used for the data transmission over the cable. Over this connection it was possible to stream the data gathered by the IMU on the laptop above the water surface. Here the operator can make use of the software developed for this project to supervise the flight behavior of the TUSK in general terms.
Some of the described functionalities could be tested already and the system was being prepared for its first field test. Due to Covid-19 the originally planned testing campaign had to be canceled. Up to the publication of this paper it was not possible to get the device into the water and document its functionality. Therefore, the assessment of the functionality of the different parts of the developed system and the system itself is based on either laboratory tests or theoretical estimations. They can not be backed by empirical in-field data.
Still, the approaches taken and the solutions found to accommodate the general idea of a circular flight path show potential. By sharing the process of the development we aim to inspire and support the advancement of this novel technology. The energy supply of the future will be based on a diverse energy portfolio, and the technology presented in this paper is a promising, baseload-capable asset to it.
The original contributions presented in the study are included in the article/Supplementary Material. Further inquiries can be directed to the corresponding author.
LG, TB and SW conceived of the presented idea. All authors discussed the results and contributed to the final manuscript.
We would like to express our gratitude to our primary supervisor, Prof. Dr. Axel Bochert, who guided us throughout this project. We want to further thank Dr. Johannes Lemburg from the Alfred-Wegener-Institute (AWI) for his assistance in the swivel development process.
The authors declare that the research was conducted in the absence of any commercial or financial relationships that could be construed as a potential conflict of interest.
All claims expressed in this article are solely those of the authors and do not necessarily represent those of their affiliated organizations, or those of the publisher, the editors and the reviewers. Any product that may be evaluated in this article, or claim that may be made by its manufacturer, is not guaranteed or endorsed by the publisher.
The Supplementary Material for this article can be found online at: http://www.frontiersin.org/article/10.3389/fmars.2022.948163/full#supplementary-material
Ahn D., Lee S., Yang D.-Y. (2003). A study on the influence of the sloped cutting angle on kerfwidth and part quality in the hotwire cutting of eps foam for the vlm-s rapid prototyping process. Int. J. Mach. Tools Manufacture 43, 1447–1464. doi: 10.1016/S0890-6955(03)00170-6
IEEE (2010). “Ieee standard for broadband over power line networks,” in Medium access control and physical layer specifications (IEEE Std 1901-2010), 1–1586. doi: 10.1109/IEEESTD.2010.5678772
Autodesk (2021). Autodesk cfd - computational fluid dynamics simulation software (Autodesk.com) Mill Valley, California, USA.
Bahaj A. S. (2011). Generating electricity from the oceans. Renewable Sustain. Energy Rev. 15, 3399–3416. doi: 10.1016/j.rser.2011.04.032
Dhanak M. R., Xiros N. I. (2016). Springer handbook of ocean engineering (Springer International Publishing).
DIN, E (2002). 1302: Geometrische produktspezifikationen (GPS)-angabe der oberflächenbeschaffenheit in der technischen produktdokumentation (Juni). Berlin, Germany.
ISO D. (1991). 2768-1 DIN ISO 2768-1: Allgemeintoleranzen; toleranzen für längen-und winkelmaße ohne einzelne toleranzeintragung (Berlin: Beuth Verlag).
Kok M., Hol J. D., Schön T. B. (2017). Using inertial sensors for position and orientation estimation. Found. Trends®. Signal Process. 11, 1–153. doi: 10.1561/2000000094
Li H. (2020). Principle of OFDM and multi-carrier modulations (Cham: Springer International Publishing), 1093–1097. doi: 10.1007/978-3-319-78262-1_164
Loyd M. L. (1980). Crosswind kite power (for large-scale wind power production). J. Energy 4, 106–111. doi: 10.2514/3.48021
Olinger D. J., Wang Y. (2015). Hydrokinetic energy harvesting using tethered undersea kites. J. Renewable Sustain. Energy 7. doi: 10.1063/1.4926769
Reed J., Daniels J., Siddiqui A., Cobb M., Vermillion C. (2020). Optimal exploration and charging for an autonomous underwater vehicle with energy-harvesting kite. 2020. Am. Control. Conf. (ACC), 4134–4139. doi: 10.23919/ACC45564.2020.9147746
Siddiqui A., Naik K., Cobb M., Granlund K., Vermillion C. (2020). Lab-Scale, closed-loop experimental characterization, model refinement, and validation of a hydrokinetic energy-harvesting ocean kite. J. Dyn. Syst. Meas. Control. 142. doi: 10.1115/1.4047825
Keywords: ocean technology, current energy, ocean energy, tidal energy, tidal power, renewable energy, energy, TUSK
Citation: Günzel L, Beer T, Wucherpfennig S and Boelmann J (2022) Prototyping of a tethered undersea kite to harvest energy from low velocity currents. Front. Mar. Sci. 9:948163. doi: 10.3389/fmars.2022.948163
Received: 19 May 2022; Accepted: 14 July 2022;
Published: 10 August 2022.
Edited by:
Viola Liebich, Bremen Society for Natural Sciences, GermanyReviewed by:
Ahmad Hably, Grenoble Institute of Technology, FranceCopyright © 2022 Günzel, Beer, Wucherpfennig and Boelmann. This is an open-access article distributed under the terms of the Creative Commons Attribution License (CC BY). The use, distribution or reproduction in other forums is permitted, provided the original author(s) and the copyright owner(s) are credited and that the original publication in this journal is cited, in accordance with accepted academic practice. No use, distribution or reproduction is permitted which does not comply with these terms.
*Correspondence: Jan Boelmann, amJvZWxtYW5uQGhzLWJyZW1lcmhhdmVuLmRl
Disclaimer: All claims expressed in this article are solely those of the authors and do not necessarily represent those of their affiliated organizations, or those of the publisher, the editors and the reviewers. Any product that may be evaluated in this article or claim that may be made by its manufacturer is not guaranteed or endorsed by the publisher.
Research integrity at Frontiers
Learn more about the work of our research integrity team to safeguard the quality of each article we publish.