 Yongquan Wang
 Huizeng Liu
 Guofeng Wu
- 1Ministry of Natural Resources Key Laboratory for Geo-Environmental Monitoring of Great Bay Area and Guangdong Key Laboratory of Urban Informatics and Shenzhen Key Laboratory of Spatial Smart Sensing and Services, Shenzhen University, Shenzhen, China
- 2Institute for Advanced Study, Shenzhen University, Shenzhen, China
- 3School of Architecture and Urban Planning, Shenzhen University, Shenzhen, China
Over the past several decades, satellite ocean color remote sensing has greatly improved our understanding of the biogeochemical properties of the global ocean. Particulate organic nitrogen (PON) refers to the nitrogen contained in biological or other debris particles, and it plays important roles in the ecosystem functions and biogeochemical processes of the marine biology. However, few studies have focused on the satellite retrieval of oceanic PON concentrations. With an attempt to fill the gap, this study aimed to explore the feasibility of retrieving oceanic PON concentrations from remote sensing data, determine the bio-optical proxies for satellite PON retrievals, and develop satellite oceanic PON retrieval models for the global ocean. In situ PON data collected over the global ocean and Moderate-resolution Imaging Spectroradiometer (MODIS) Level-3 products were used. Three different types of models were tested: (1) apparent optical property (AOP)-based models, 2) inherent optical property (IOP)-based models, and 3) biological property-based models. Results showed that ocean color remote sensing could be used for oceanic PON concentration retrieval in the global ocean, and AOP-based models calibrated produced better fitting performance than the other two types; models based on blue-to-green band ratio (BG) and normalized difference nitrogen index (NDNI) produced comparable and better fitting and validation performance; and IOP-based and biological property-based models produced lower but also acceptable performance. With the PON models developed, the monthly variations of PON concentrations in the global ocean were also explored. In further studies, PON models will be used to explore oceanic PON spatiotemporal variations and the underlying driving forces.
Introduction
Nitrogen, as one of the main nutrients in the ocean, is an essential element for the growth of phytoplankton and plays an important role in the biological productivity, ecosystem functions, and biogeochemical processes of the marine environment (Tyrrell, 1999; Moore et al., 2013). Marine nitrogen can regulate the intensity of the biological pump and thus indirectly influence the global carbon cycle and climate (Falkowski, 1997; Gruber and Galloway, 2008; Zehr and Kudela, 2011; Voss et al., 2013). In the marine nitrogen cycle, there are transitions between dissolved and particulate as well as between inorganic and organic through the biological and chemical processes (Loh and Bauer, 2000; Yu et al., 2012; Lipizer et al., 2012). Studies suggest that the ocean is the largest nitrogen reservoir on the Earth, containing about five times more nitrogen than the terrestrial biosphere (Capone et al., 2008). In addition, the transformation of PON and dissolved nitrogen accounts for a large proportion of marine acidification, eutrophication, and sediment denitrification (Fennel et al., 2006; Seitzinger et al., 2006; Enriquez et al., 2010). Therefore, understanding the spatiotemporal variations of oceanic nitrogen is of great significance for understanding the marine nitrogen cycle and marine ecosystems.
Particulate organic nitrogen (PON) refers to the nitrogen contained in biological or other debris particles (Smith et al., 1986). In addition, the PON concentration has distinct spatiotemporal variations over the global ocean because of biological production, PON transformations, physical mixing, and horizontal transport by ocean currents (Wada and Hattori, 1990; Wang et al., 2008; Pajares and Ramos, 2019). Traditionally, oceanic PON concentrations were obtained through in situ sampling and laboratory determination (Holm-Hansen, 1968), and the spatiotemporal PON variations in the large area were simulated with physico-biogeochemical models (Deutsch et al., 2007; Wang W. L. et al., 2019). However, the model performance depends on its consistence with the real world, which might be undermined because of lacking enough input in situ PON data.
Ocean color remote sensing relies on the water-leaving radiance/reflectance derived from remote sensing data to retrieval aquatic properties (Mcclain, 2009; Liu et al., 2021a; Liu et al., 2022a). Over the past several decades, ocean color remote sensing has been widely used for retrieving water constituents (Hu et al., 2018), such as particulate organic carbon (POC) and chlorophyll (CHL) over the global ocean (blondeau-Patissier et al., 2014; O'reilly and Werdell, 2019; Liu et al., 2021b; Tehrani et al., 2021). Hitherto, there are limited studies in literature focused on satellite retrievals of oceanic nitrogen, including the total nitrogen (Mathew et al., 2017), dissolved organic nitrogen (Zhang et al., 2020), dissolved inorganic nitrogen (Xu et al., 2010), and nitrogen-fixing organisms (Mckinna, 2015). Recently, Fumenia et al. (2020), based on Biogeochemical-Argo observations, found a significant correlation between the backscattering coefficient at 700 nm and PON, indicating the feasibility of estimating PON concentrations from optical properties.
However, few studies could be found on the satellite retrieval of oceanic PON concentrations. With an attempt to fill the gap, this study aims to explore the feasibility of retrieving oceanic PON concentrations from remote sensing data, determine the bio-optical proxy for satellite PON retrieval, and construct satellite oceanic PON retrieval models for the global ocean. To achieve those goals, a large diverse matchup dataset of global in situ PON measurements and satellite ocean color products were used, and three types of satellite retrieval models were tested, including inherent optical property (IOP)-based, apparent optical property (AOP)-based, and biological property-based models. The results from this study could contribute to better monitoring the spatiotemporal of PON concentrations and understanding the nitrogen cycle in the global ocean.
Materials and methods
In situ PON data
In this study, in situ PON data were obtained from two databases: oceanic PON data retrieved from SeaBASS (https://seabass.gsfc.nasa.gov/, downloaded on 21 July 2021) and the dataset collected by Martiny et al. (2014) shared on the Dryad Digital Repository (https://datadryad.org/). The dataset of Martiny et al. (2014) contains 46,633 PON measurements from 70 cruises or time-series stations over the global ocean, while the SeaBASS dataset includes 4,038 PON measurements shared by researchers worldwide. The PON measurements include both water samples collected from open ocean and coastal productive waters spanning a long period from 1972 to 2019. PON is defined as the organic nitrogen retained on pre-combusted Whatman GF/F filters with a pore size of 0.7 μm, and its concentration is generally quantified following the chemical oxidation technique (Pujopay and Raimbault, 1994) or the carbon hydrogen nitrogen method (Sharp, 1974). Since this study only focused on estimating PON concentrations in the surface ocean, PON measurements were averaged over the top 10 m to provide the “surface” value. PON measurements with no valid sampling date or geographic location were first eliminated, and those with a PON concentration lower than 1 mg/m3 were further removed from further analyses, because they may possess substantial bias due to adsorption of dissolved nitrogen onto the filters (Cetinic et al., 2012).
Satellite and in situ matchup data
As for the ocean color remote sensing data, MODIS data from both Aqua and Terra satellites were used to obtain as many matchups for PON modeling. The MODIS Daily Level-3 SMI products with a spatial resolution of 4 km were obtained from NASA’s Ocean Biology Processing Group (http://oceancolor.gsfc.nasa.gov/) in September 2021. The MODIS Level-3 data are generated by merging high-quality Level-2 data sensed within 1 day through a predefined spatial grid. The products mainly include Rrs at five bands (443, 469, 488, 547, and 678 nm), inherent optical properties (IOPs), POC, and CHL. The MODIS data were searched to retrieve satellite products collocated with in situ data collected on the same day. The Aqua/MODIS products were first matched to the in situ samples, and samples included in matchups were eliminated; the Terra/MODIS data were then matched to the remaining samples. The final matchup datasets were obtained by merging matchups of the two satellites. Figure 1 shows the true color composites of MODIS images from Terra and Aqua satellites and their corresponding Daily Level-3 products, and the matchups of in situ PON and MODIS data obtains on those 2 days were also illustrated.
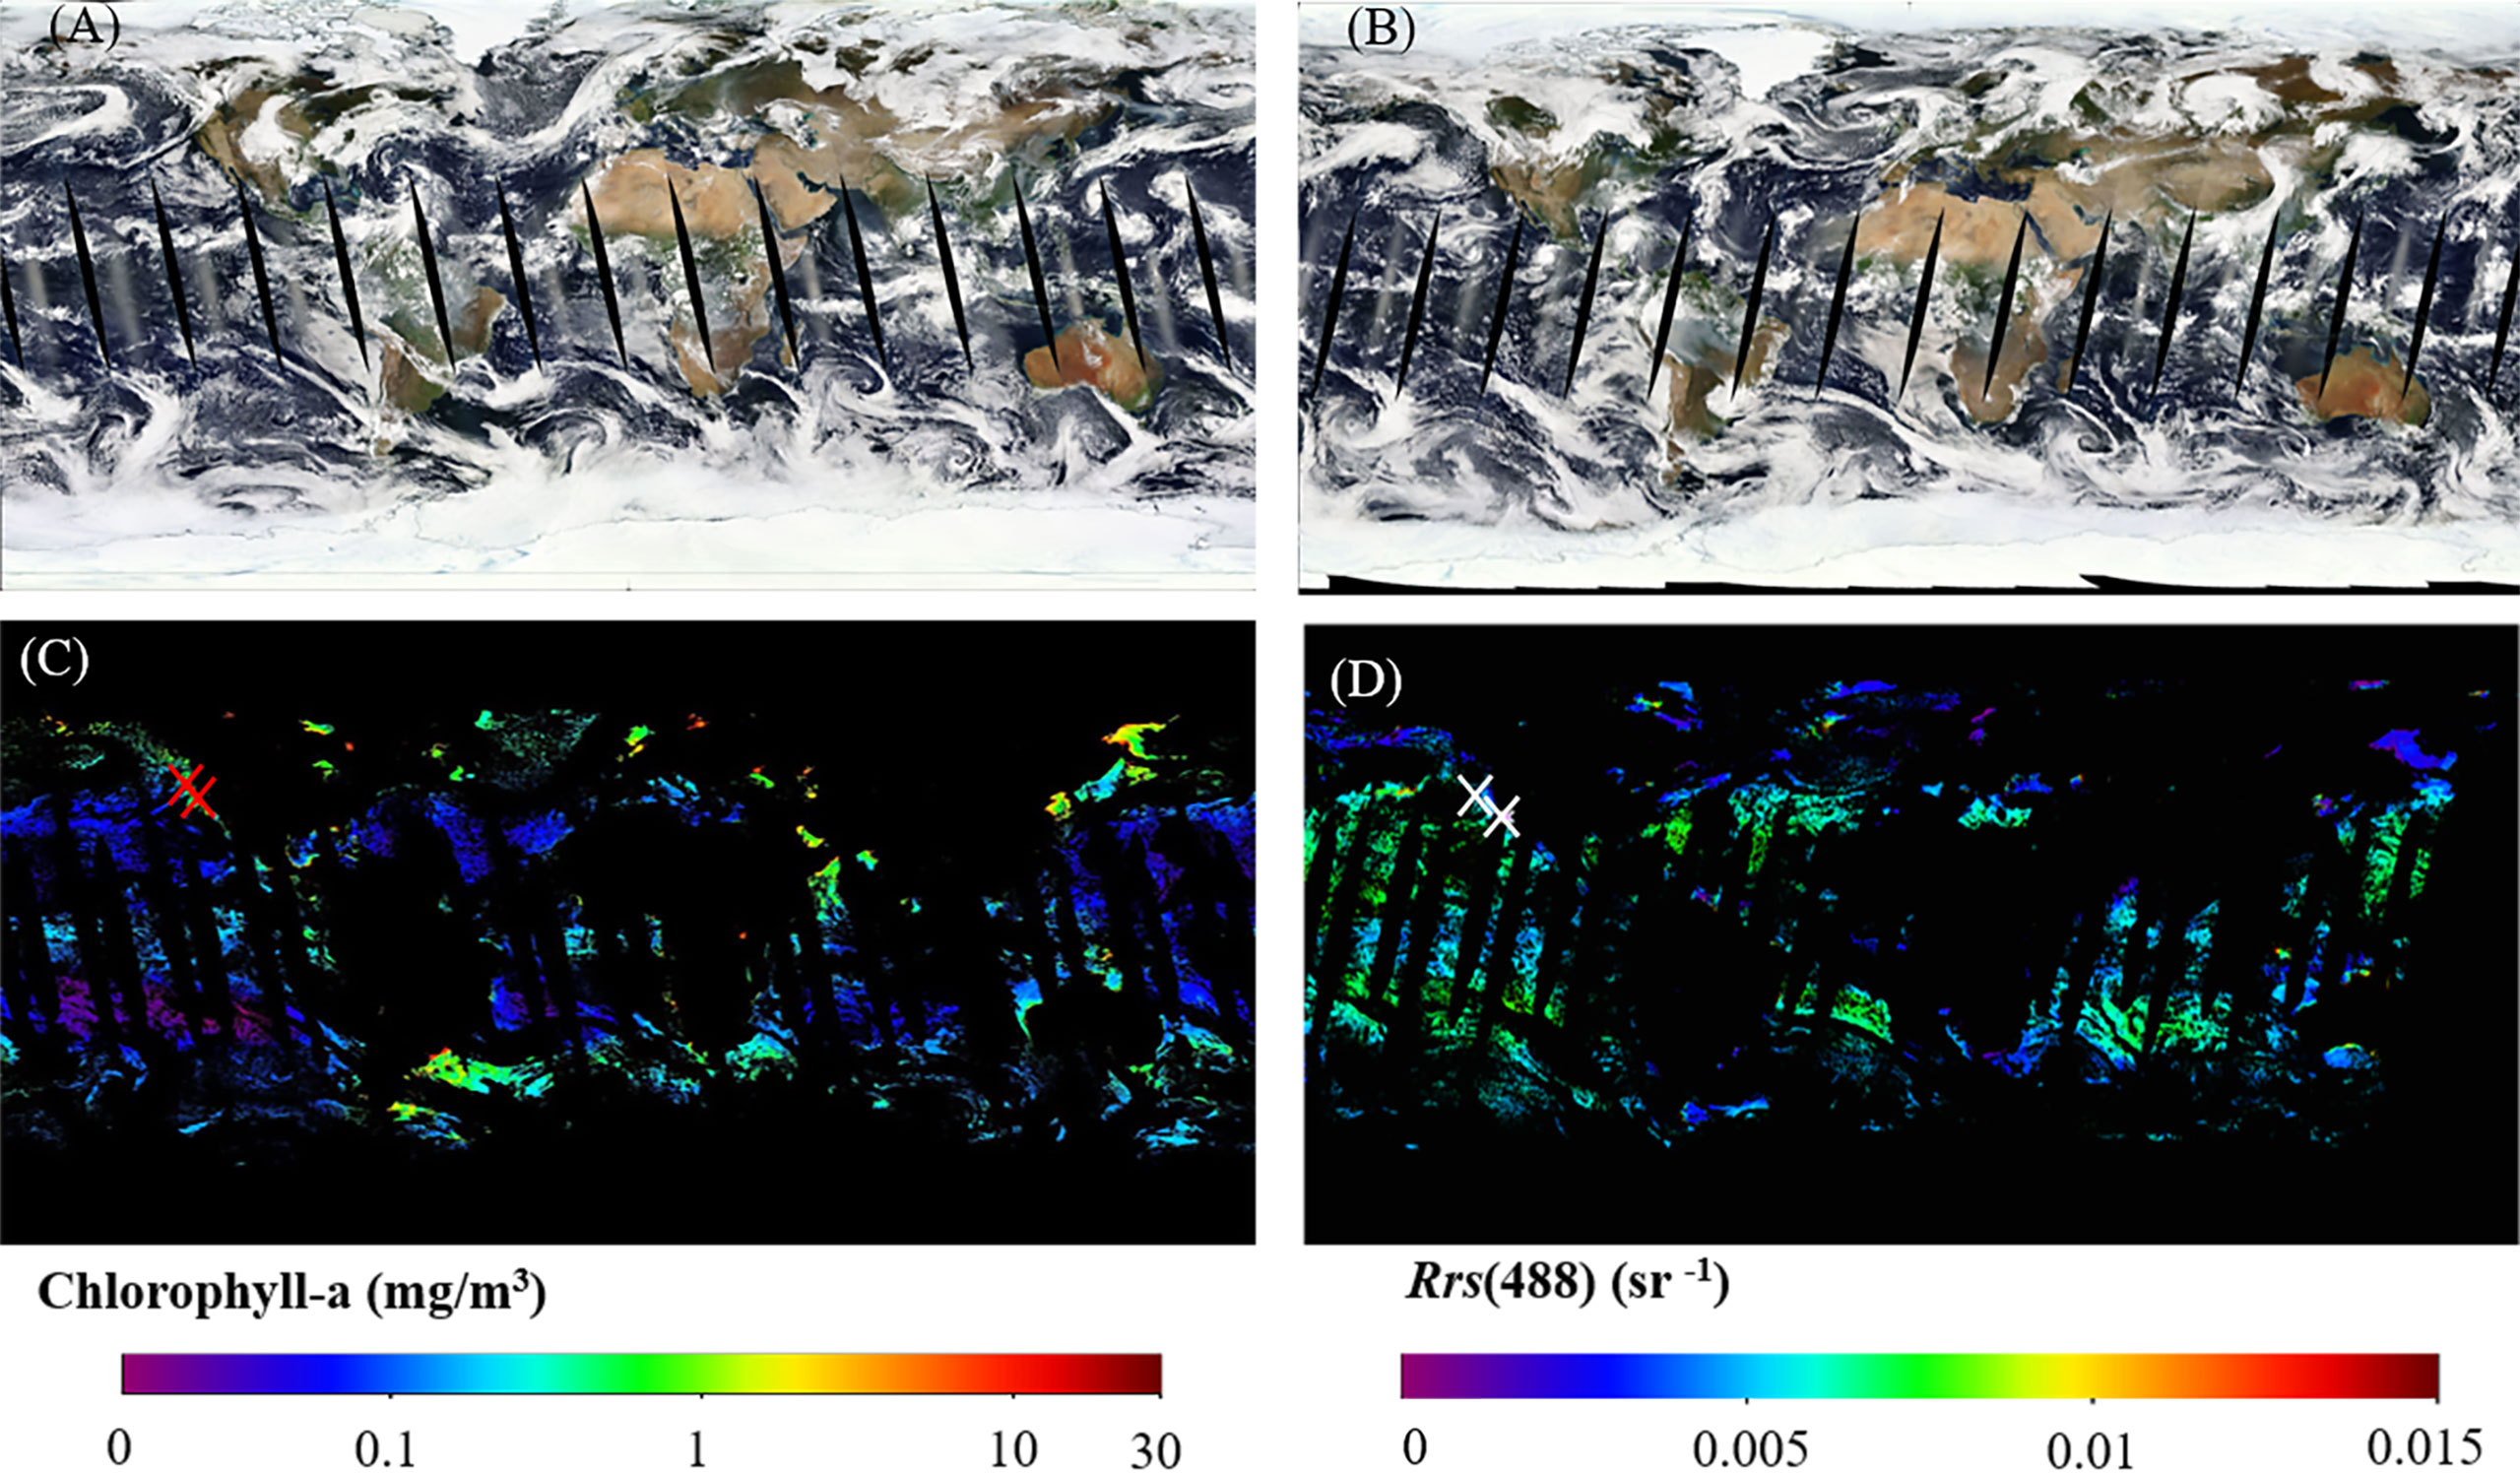
Figure 1 The Aqua/MODIS true color composites (A) and Chlorophyll-a product (C) on 10 October 2005. The Terra/MODIS true color reflectance (B) and Rrs at the 488-nm product (D) on 13 September 2004. The satellite and in situ matchups are represented by red and white crosses.
Following the matchup procedure of Liu et al. (2021b), a 3 × 3 window surrounding the in situ sampling location was used to extract satellite data, and matchups with less than 50% valid pixels were eliminated. A total of 2,148 satellite and in situ matchups were obtained. Four-fifths of matchups were randomly selected as the training dataset, and the remaining were used as the validation dataset. The geographical distribution of valid satellite data matchups and the histogram of in situ PON values are shown in Figures 2A, D). The main matchups were in the Atlantic Ocean and a considerable number of matchups in some coastal regions (such as the east and west American coastal oceans). Statistical descriptions of in situ PON of all matchups as well as the training and validation datasets are given in Table 1, showing large variations with a minimum of 1.21 mg/m3 and a maximum of 254.00 mg/m3. The in situ measurements varied with depth, and a total of 745 field sampling points had more than two measurements at different depths (0–10 m), which were used to analyze the variance of PON in the top 10 m. The standard deviation value showed a lognormal distribution (Figure 3) with a mean value of 3.89 mg/m3.
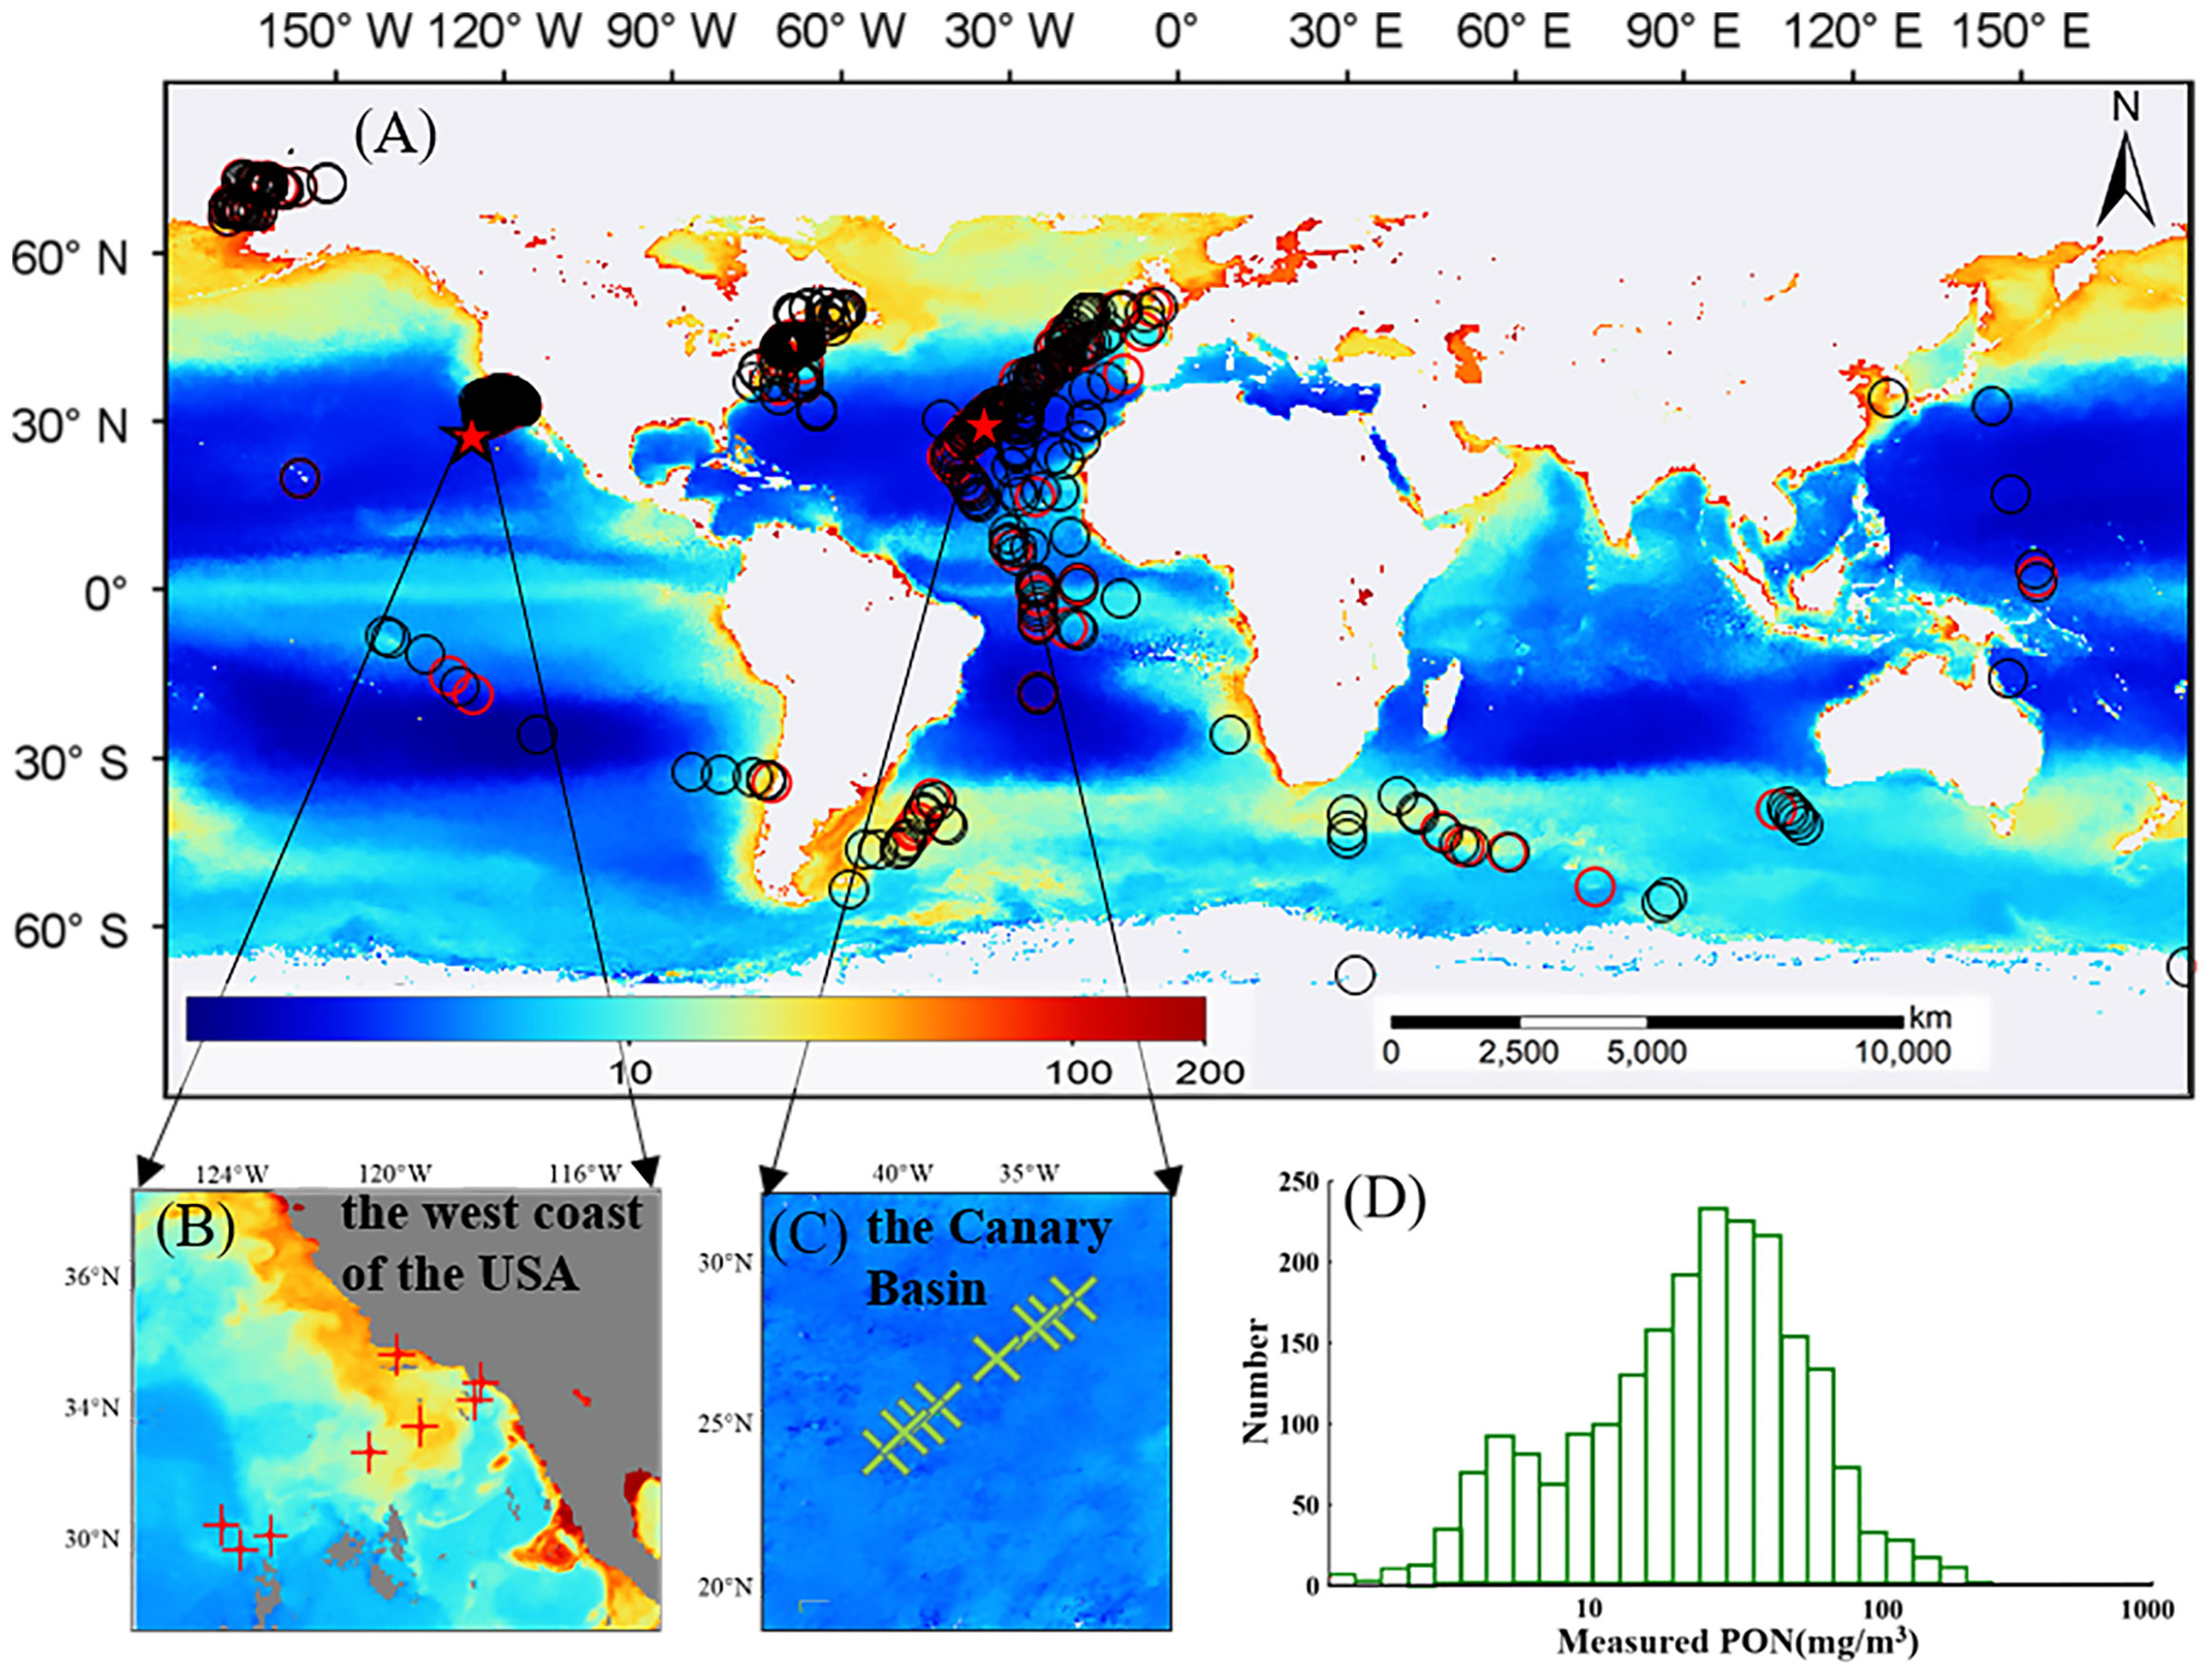
Figure 2 Geographical locations of matchups of in situ and satellite data (A), and the histogram of PON concentrations of all matchups (D). Modeling data and validation data are represented by black circles and red circles, respectively. Subplots (B, C) show matchups in these two regions used for further model evaluations. The background map in (A) shows the monthly climatology PON products generated from data from March 2009 to May 2016 by the NDNI model.
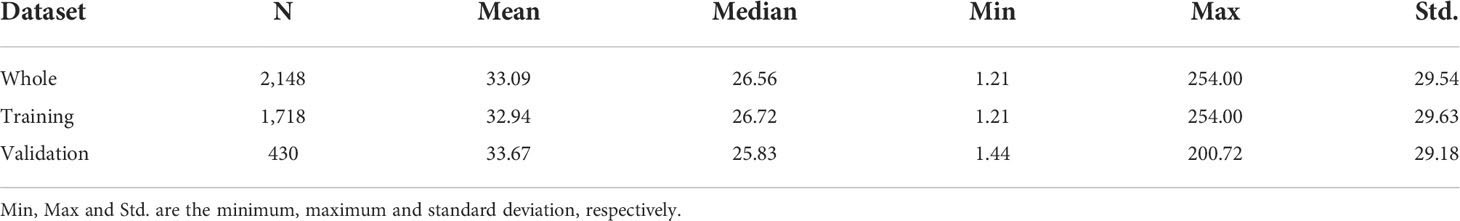
Table 1 Statistical descriptions of PON concentrations for all matchups (whole), model training (four-fifth of matchups), and validation (one-fifth of matchups) datasets, respectively.
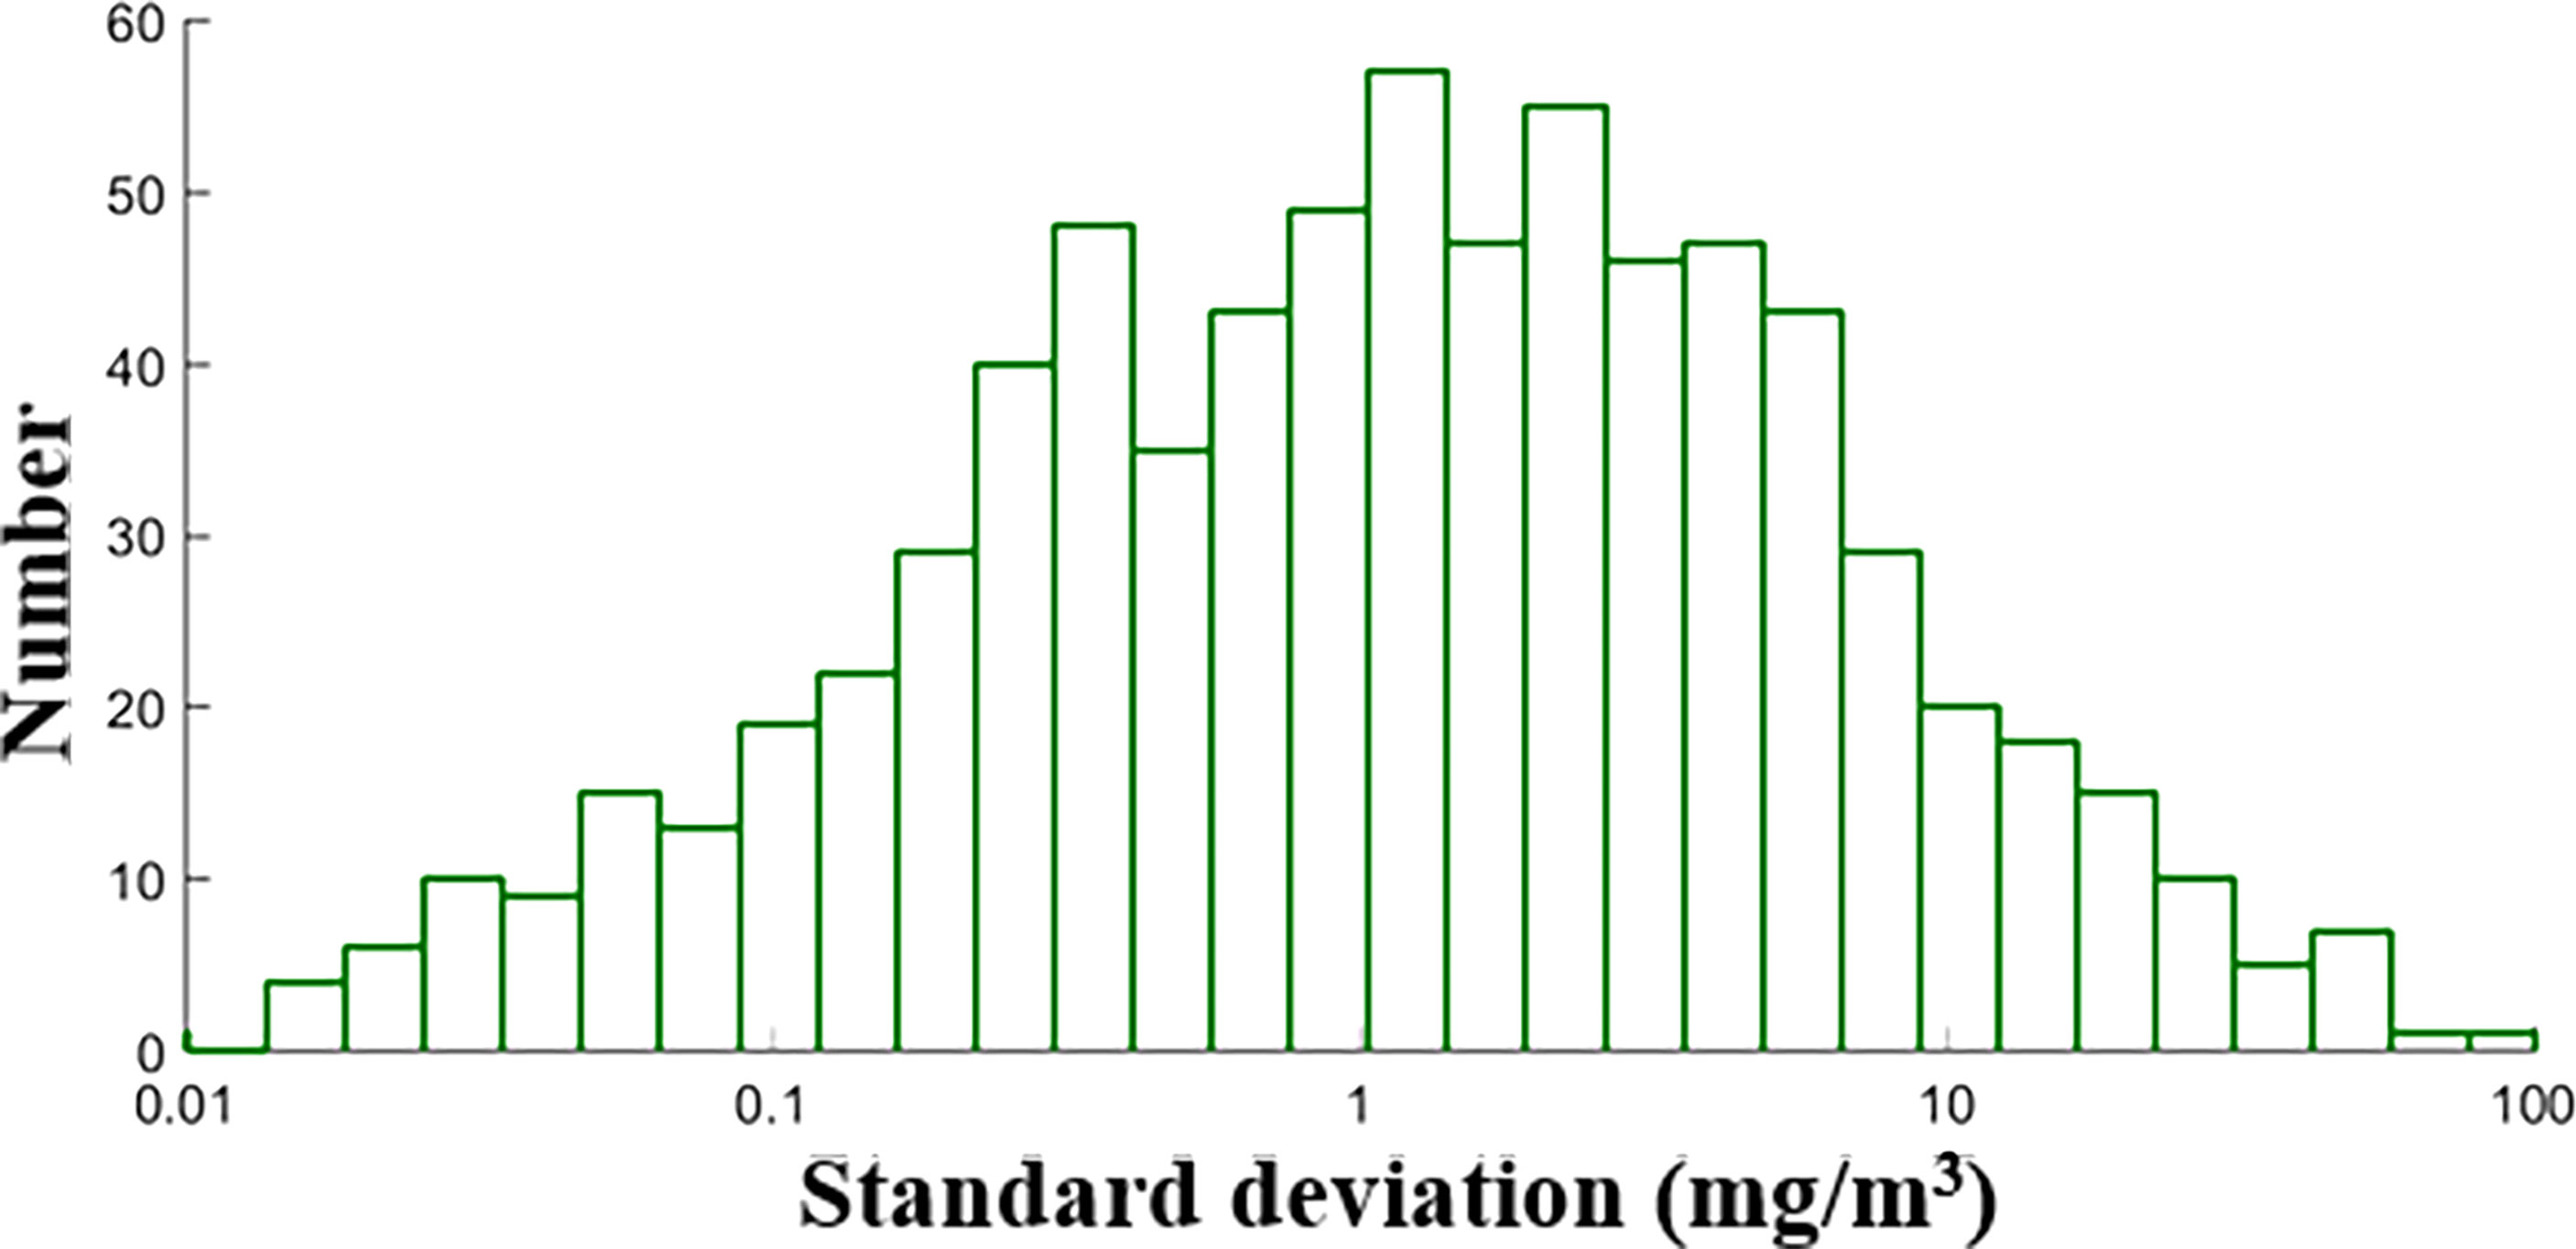
Figure 3 The histogram of standard deviation of in situ PON concentrations within the top 10 meters, and the scale of x-axis is in log10 transformation.
Algorithm development and application
Three types of PON retrieval models were considered in this study, and they were based on three different types of ocean color remote sensing data, respectively: (i) IOPs, including a and bbp_s, (ii) AOPs, i.e., Rrs band index, and (iii) biological properties, i.e., CHL and POC concentrations. The first type is IOP-based models, which relates PON concentration to oceanic IOPs. Satellite retrieval of the oceanic PON concentration using IOP-based models actually involves two steps: i) deriving IOPs from Rrs and ii) retrieving PON from IOPs. In this study, the total absorption coefficient (a) and the backscattering spectral parameter (bbp_s), were considered for the IOP-based models. a and bbp_s were derived from Rrs with the Generalized Inherent Optical Property (GIOP) model (Werdell et al., 2013).
Different from the IOP-based models, the second type is to directly retrieve PON from AOPs. As for the AOP-based models, four commonly used band indexes were considered, including the blue -to-green band ratio (BG) (Morel and Prieur 1977), color index (CI) (Hu et al., 2012), maximum band ratio (MBR) (O'reilly et al., 1998), and normalized difference nitrogen index (NDNI) (Serrano et al., 2002). The last type is based on biological properties to retrieve PON. The CHL concentration was derived with the ocean color index (OCI) algorithm, a combination of CI and OCx band ratio algorithm (Hu et al., 2012). As for the POC-based PON retrieval model, the pairs of surface POC and PON concentrations were extracted from the in situ dataset (Martiny et al., 2014), and the model was calibrated with the data pairs. The ocean color parameters and band index involved in PON modeling are given in Table 2. Actually, there are also numerous other IOPs and band indexes initially considered for PON modeling (Martiny et al., 2014). The nine indices (Table 2) were selected as candidate proxies for PON modeling with preliminary screening, since they produced acceptable performance.
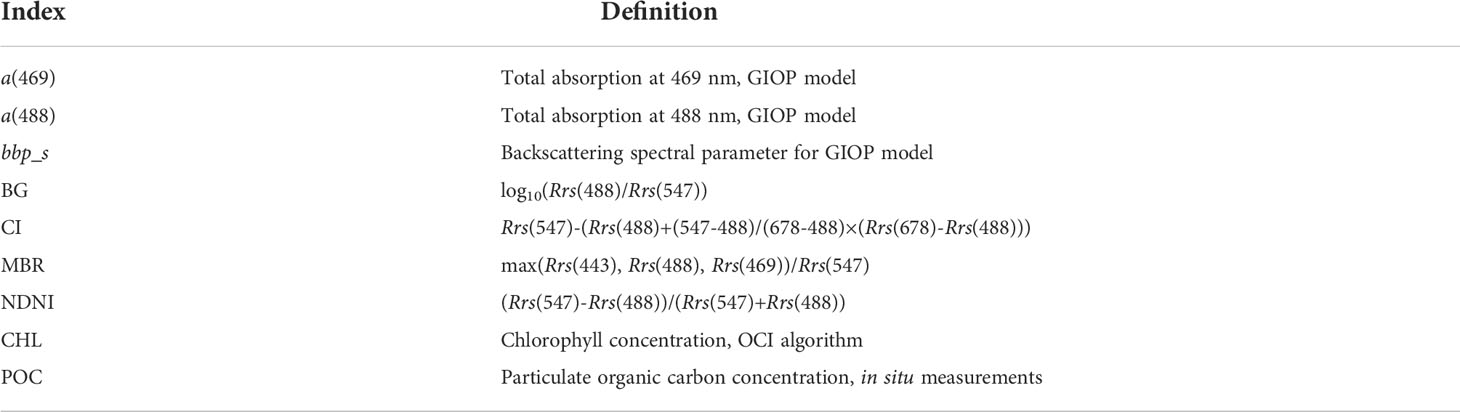
Table 2 The definitions of indices used for PON retrieval models.
The widely used linear, polynomial, exponential, and power methods were used to calibrate PON models against the selected ocean color parameters using the least square technique, respectively. The model with the best-fitting accuracy for the training dataset was selected for each index, and the model performance was further evaluated with the validation dataset. The root mean square deviation (RMSD), mean absolute percent difference (MAPD), and coefficient of determination (R2) were used to evaluate the model fitting and validation performance. To test model applicability, the developed PON retrieval models were further applied in two ways. The first approach was to apply PON models in two regions with different variations of PON concentrations. The west coast of the United States and the Canary Basin were selected (shown in Figures 2B, C), and in situ PON data collected in 2005 and 2014 were used to assess PON retrieval performance. The second way was to compare PON retrieval results in the global ocean using the monthly mean MODIS level-3 data in June 2021. To compare PON retrieval results, taking the best model as the baseline, the absolute and unbiased relative differences of PON concentrations derived from the other two models were calculated, and the unbiased relative difference in percentage was computed as (y-x)/(y+x)×200%. Moreover, three PON models with better statistical performance applied Aqua/MODIS monthly products to analyze the PON temporal variations over the past 20 years, and relationships between PON and POC as well as CHL variations were also explored. POC and chlorophyll data were from Level-3 Aqua/MODIS monthly mean products. The global mean value ()or each month was calculated from a monthly map with the following equation:
Results
Model calibration
The PON retrieval models based on the nine selected proxies calibrated with the training dataset are shown in Figure 4 and summarized in Table 3. The linear POC-based model calibrated with in situ POC–PON pairs had far better-fitting performance than others with an R2 of 0.93 and an RMSD of 0.11, while R2 and RMSD of models calibrated with in situ PON and satellite-derived ocean color parameters were within the range 0.60–0.65 and 0.24–0.25, respectively. Out of models based on ocean color parameters, PON retrieval models based on the three Rrs band indices, i.e., BG and NDNI, respectively, produced comparable and relatively better performance than others with R2 = 0.65 and RMSD = 0.24, followed by models based on MBR (R2 = 0.63 and RMSD = 0.25) and a(488) (R2 = 0.62 and RMSD = 0.25). Models based on a(469), CI, and CHL had an R2 of 0.61 and an RMSD of 0.25. bbp_s was the worst proxy for PON retrieval with an R2 of 0.60 and an RMSD of 0.26.
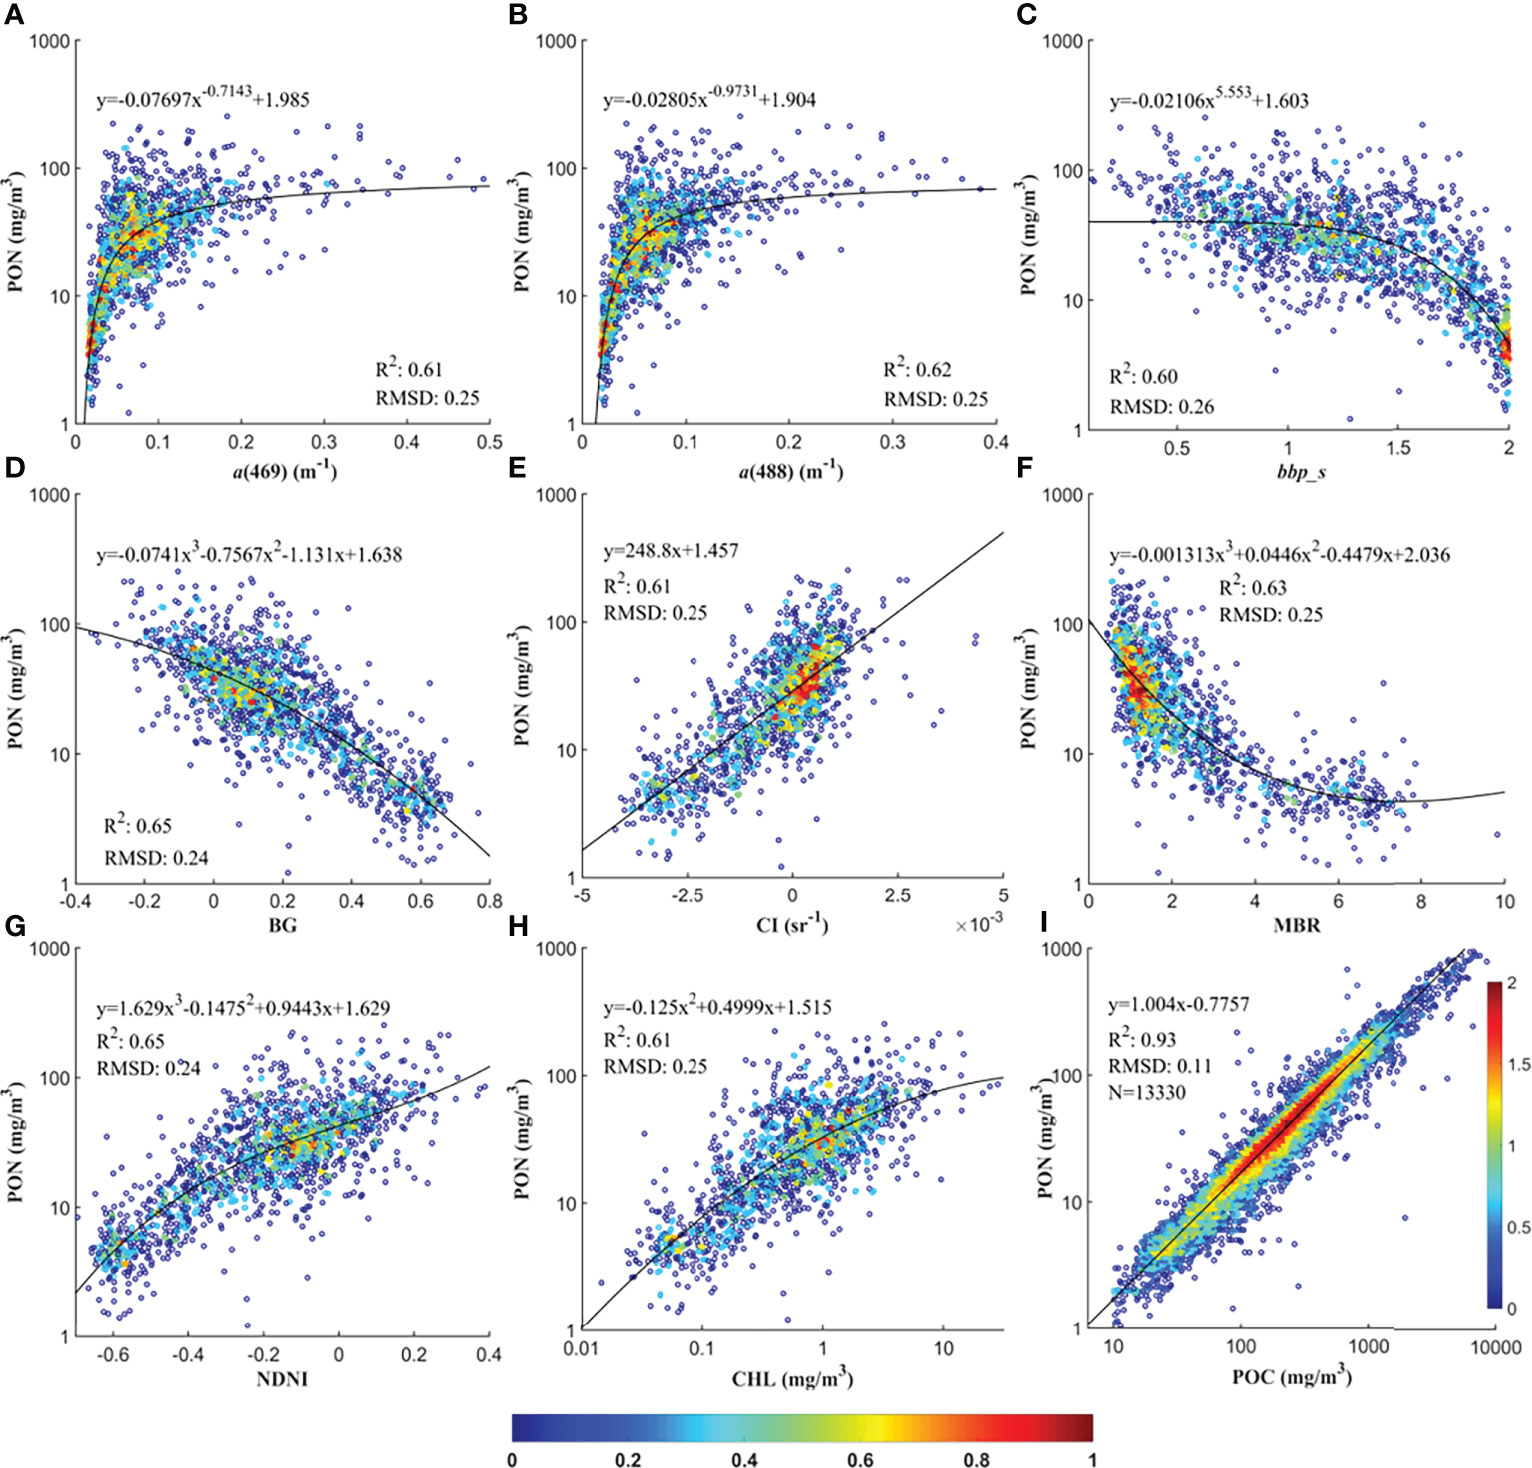
Figure 4 Oceanic PON concentrations retrieval models based on a(469) (A), a(488) (B), bbp_s (C), BG (D), CI (E), MBR (F), NDNI (G), CHL (H), and POC (I), respectively. PON, CHL and POC are in log10 transformation. The numbers along the ramp indicate the pixel density after log10 transformation.
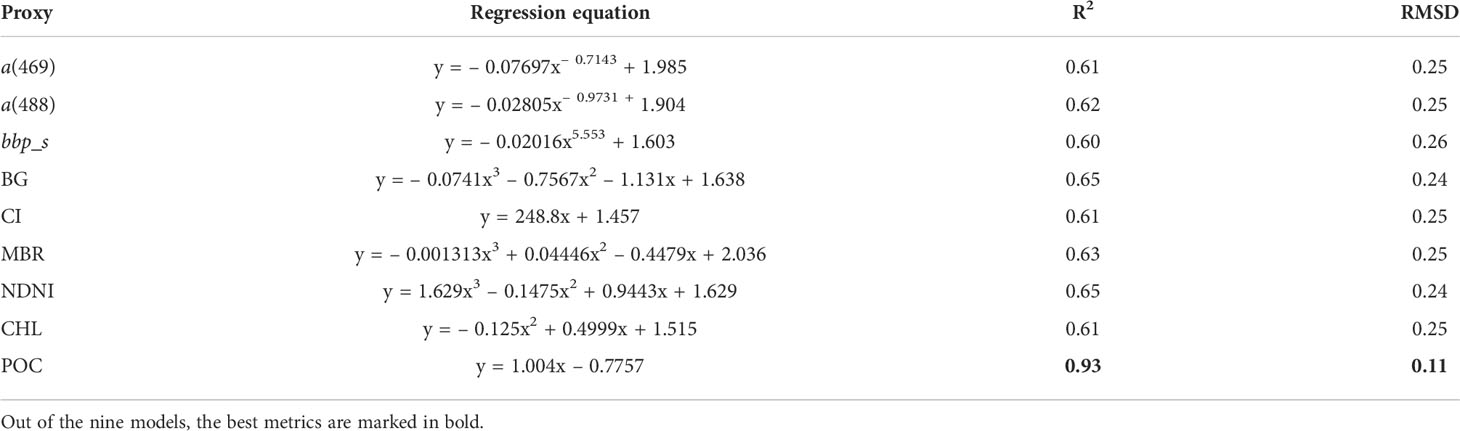
Table 3 The best-fit regression models for the nine PON retrieval models and their statistical performance.
Model validation
The validation results for the nine PON retrieval models are shown by the scatterplots of estimated vs. measured PON concentrations in Figure 5 and summarized in Table 4. All of the nine models tended to underestimate high PON values with the slope for the regression lower than 0.70, which could also be observed from the data points below the 1:1 line with PON >60 mg/m3. Similar to the model-fitting results, the NDNI base produced the best validation performance with the highest R2 (0.67) and slope for the regression line (0.69), and the lowest RMSD (0.23), MAPD (15.26), and the intercept for the regression line (0.41), followed by the BG-based model (R2 = 0.66, RMSD = 0.24, MAPD = 15.31% and slope = 0.69 and intercept = 0.42). MBR- and a(488)-based models also produced acceptable and comparable validation performance with an R2 of 0.64 and an RMSD of 0.24, while a(469)-, CI-, CHL- and bbp_s-based models produced lower performance with R2 varying between 0.60 and 0.63, and RMSD between 0.25 and 0.26. The POC-based PON retrieval model had the worst performance with a R2 of 0.58 and a RMSD of 0.27.
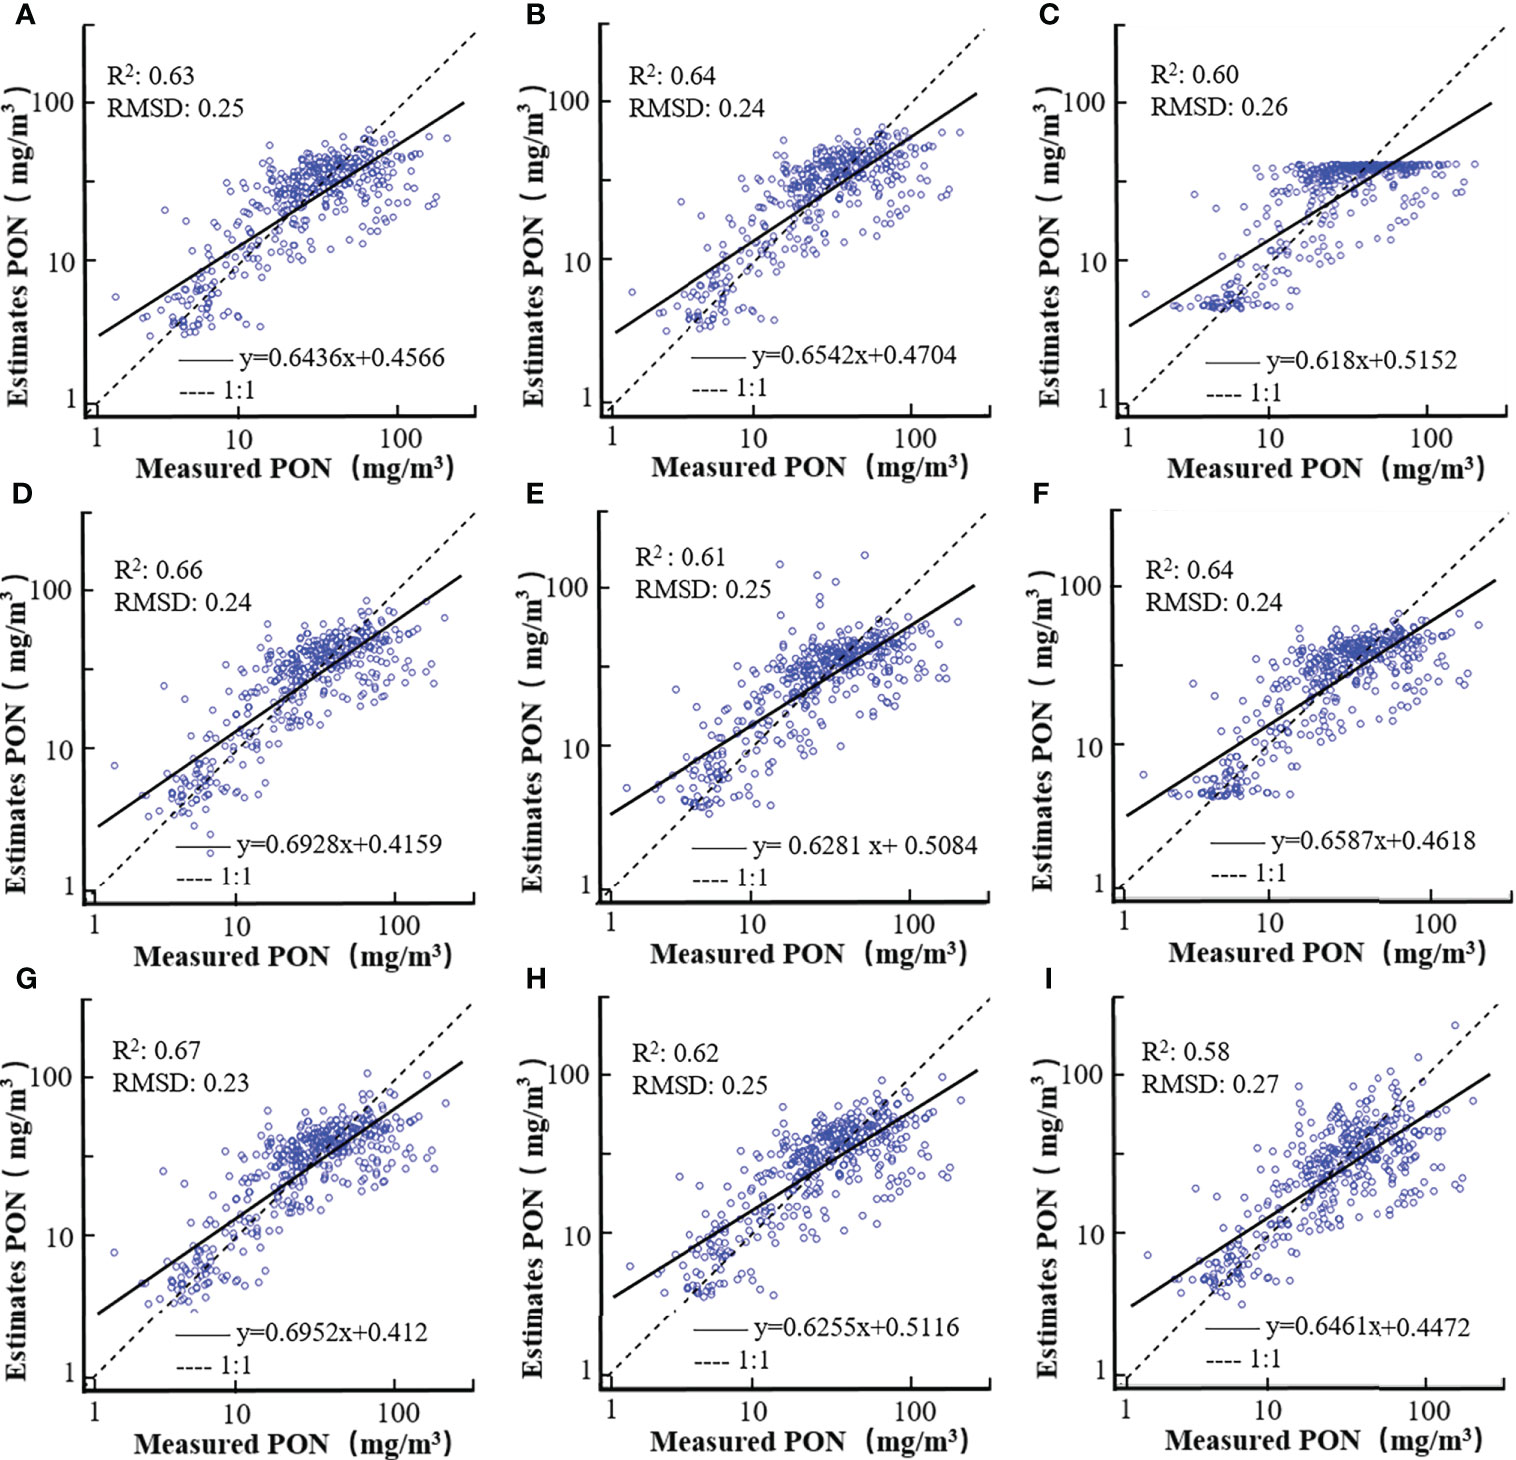
Figure 5 Scatterplots of estimated vs. measured PON concentrations for models based on a(469) (A), a(488) (B), bbp_s (C), BG (D), CI (E), MBR (F), NDNI (G), CHL (H), and POC (I). Both axes are in log10 transformation.
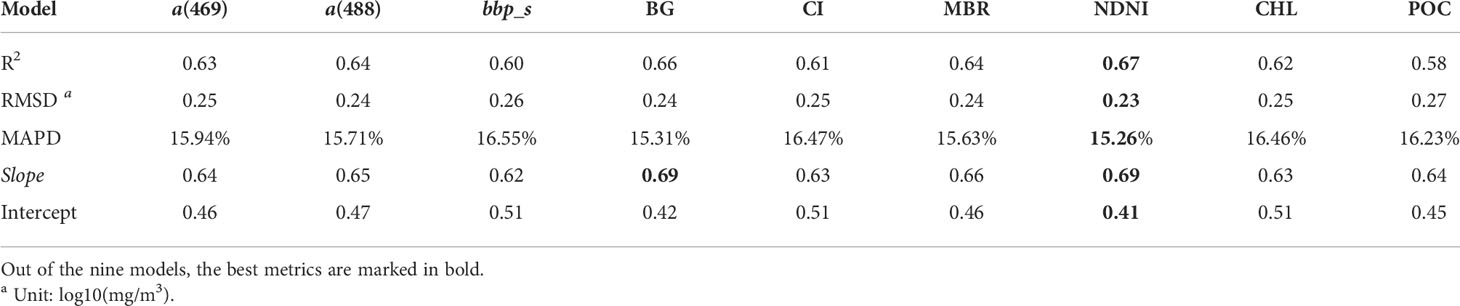
Table 4 Statistical descriptions of model validation performance calculated in log10 transformation.
Model applications
The model application results for the two selected regions, i.e., the west coast of the United States and the Canary Basin, are illustrated in Figure 6 and summarized in Table 5, and the eight in situ sampling locations used for performance evaluation are shown in Figures 2B, C, respectively. Overall, the nine models produced consistent patterns of the PON gradient from coastal to open ocean waters. In the west coast of the United States, the nine models exhibit similar performance for eight field sampling locations, with the NDNI-based model performing the best (RMSD = 6.00 mg/m3 and MAPD = 27.22%). The Canary Basin located in the middle of the Atlantic Ocean had lower PON concentrations than the west coast of the United States. Comparatively, all of the nine PON retrieval models had better performance for the Canary Basin than that for the west coast of the United States with lower RMSD and MAPD values. Specifically, models based on POC, BG, bbp_s, and MBR overestimated PON concentrations, while models based on CHL, a(469), and a(488) slightly underestimated PON concentrations for most stations. The NDNI-based model also worked better for the Canary Basin with RMSD = 0.39 mg/m3 and MAPD = 9.19%.
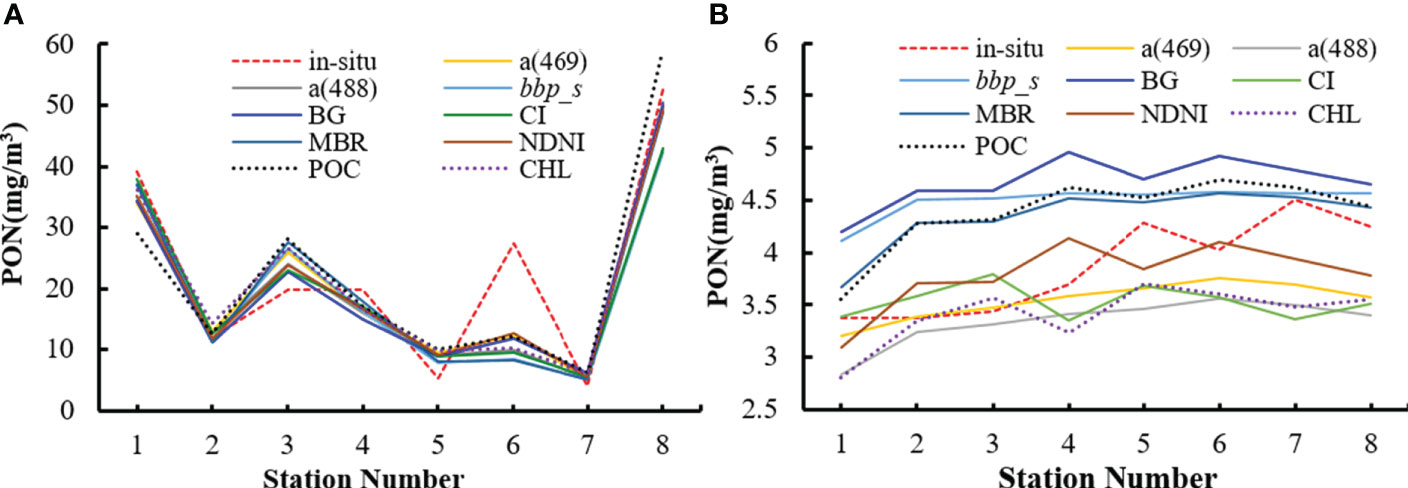
Figure 6 The estimated PON concentrations for matchups associated with the in situ data for the west coast of the United States (A) and the Canary Basin (B), respectively.
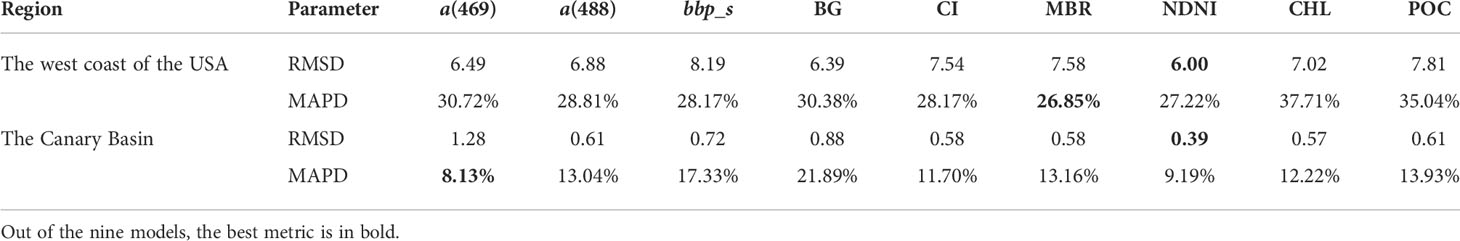
Table 5 Statistics of model performance for the west coast of the United States and the Canary Basin.
The global oceanic PON maps retrieved by the nine models from the monthly mean MODIS Level-3 data in June 2021 are shown in Figure 7. The spatial variation patterns of PON concentrations of the nine oceanic PON maps were generally consistent. The open oceans have lower PON concentrations and higher values in turbid continental shelves and coastal regions. However, there are also some obvious differences between them. Models based on a(469) and a(488) perform similarly (Figures 7A, B). Models based on bbp_s (Figure 7C) and MBR (Figure 7F) produced generally lower than other models, and the maximum of derived PON concentrations is less than 80 mg/m3. Comparatively, BG- and NDNI-based models (Figures 7D, G) produced higher PON concentrations than other models. Particularly, the CI-based model (Figure 7E) produced relatively higher estimations in productive offshore areas than other models, such as in Gulf of Mexico and Guiana Basin.
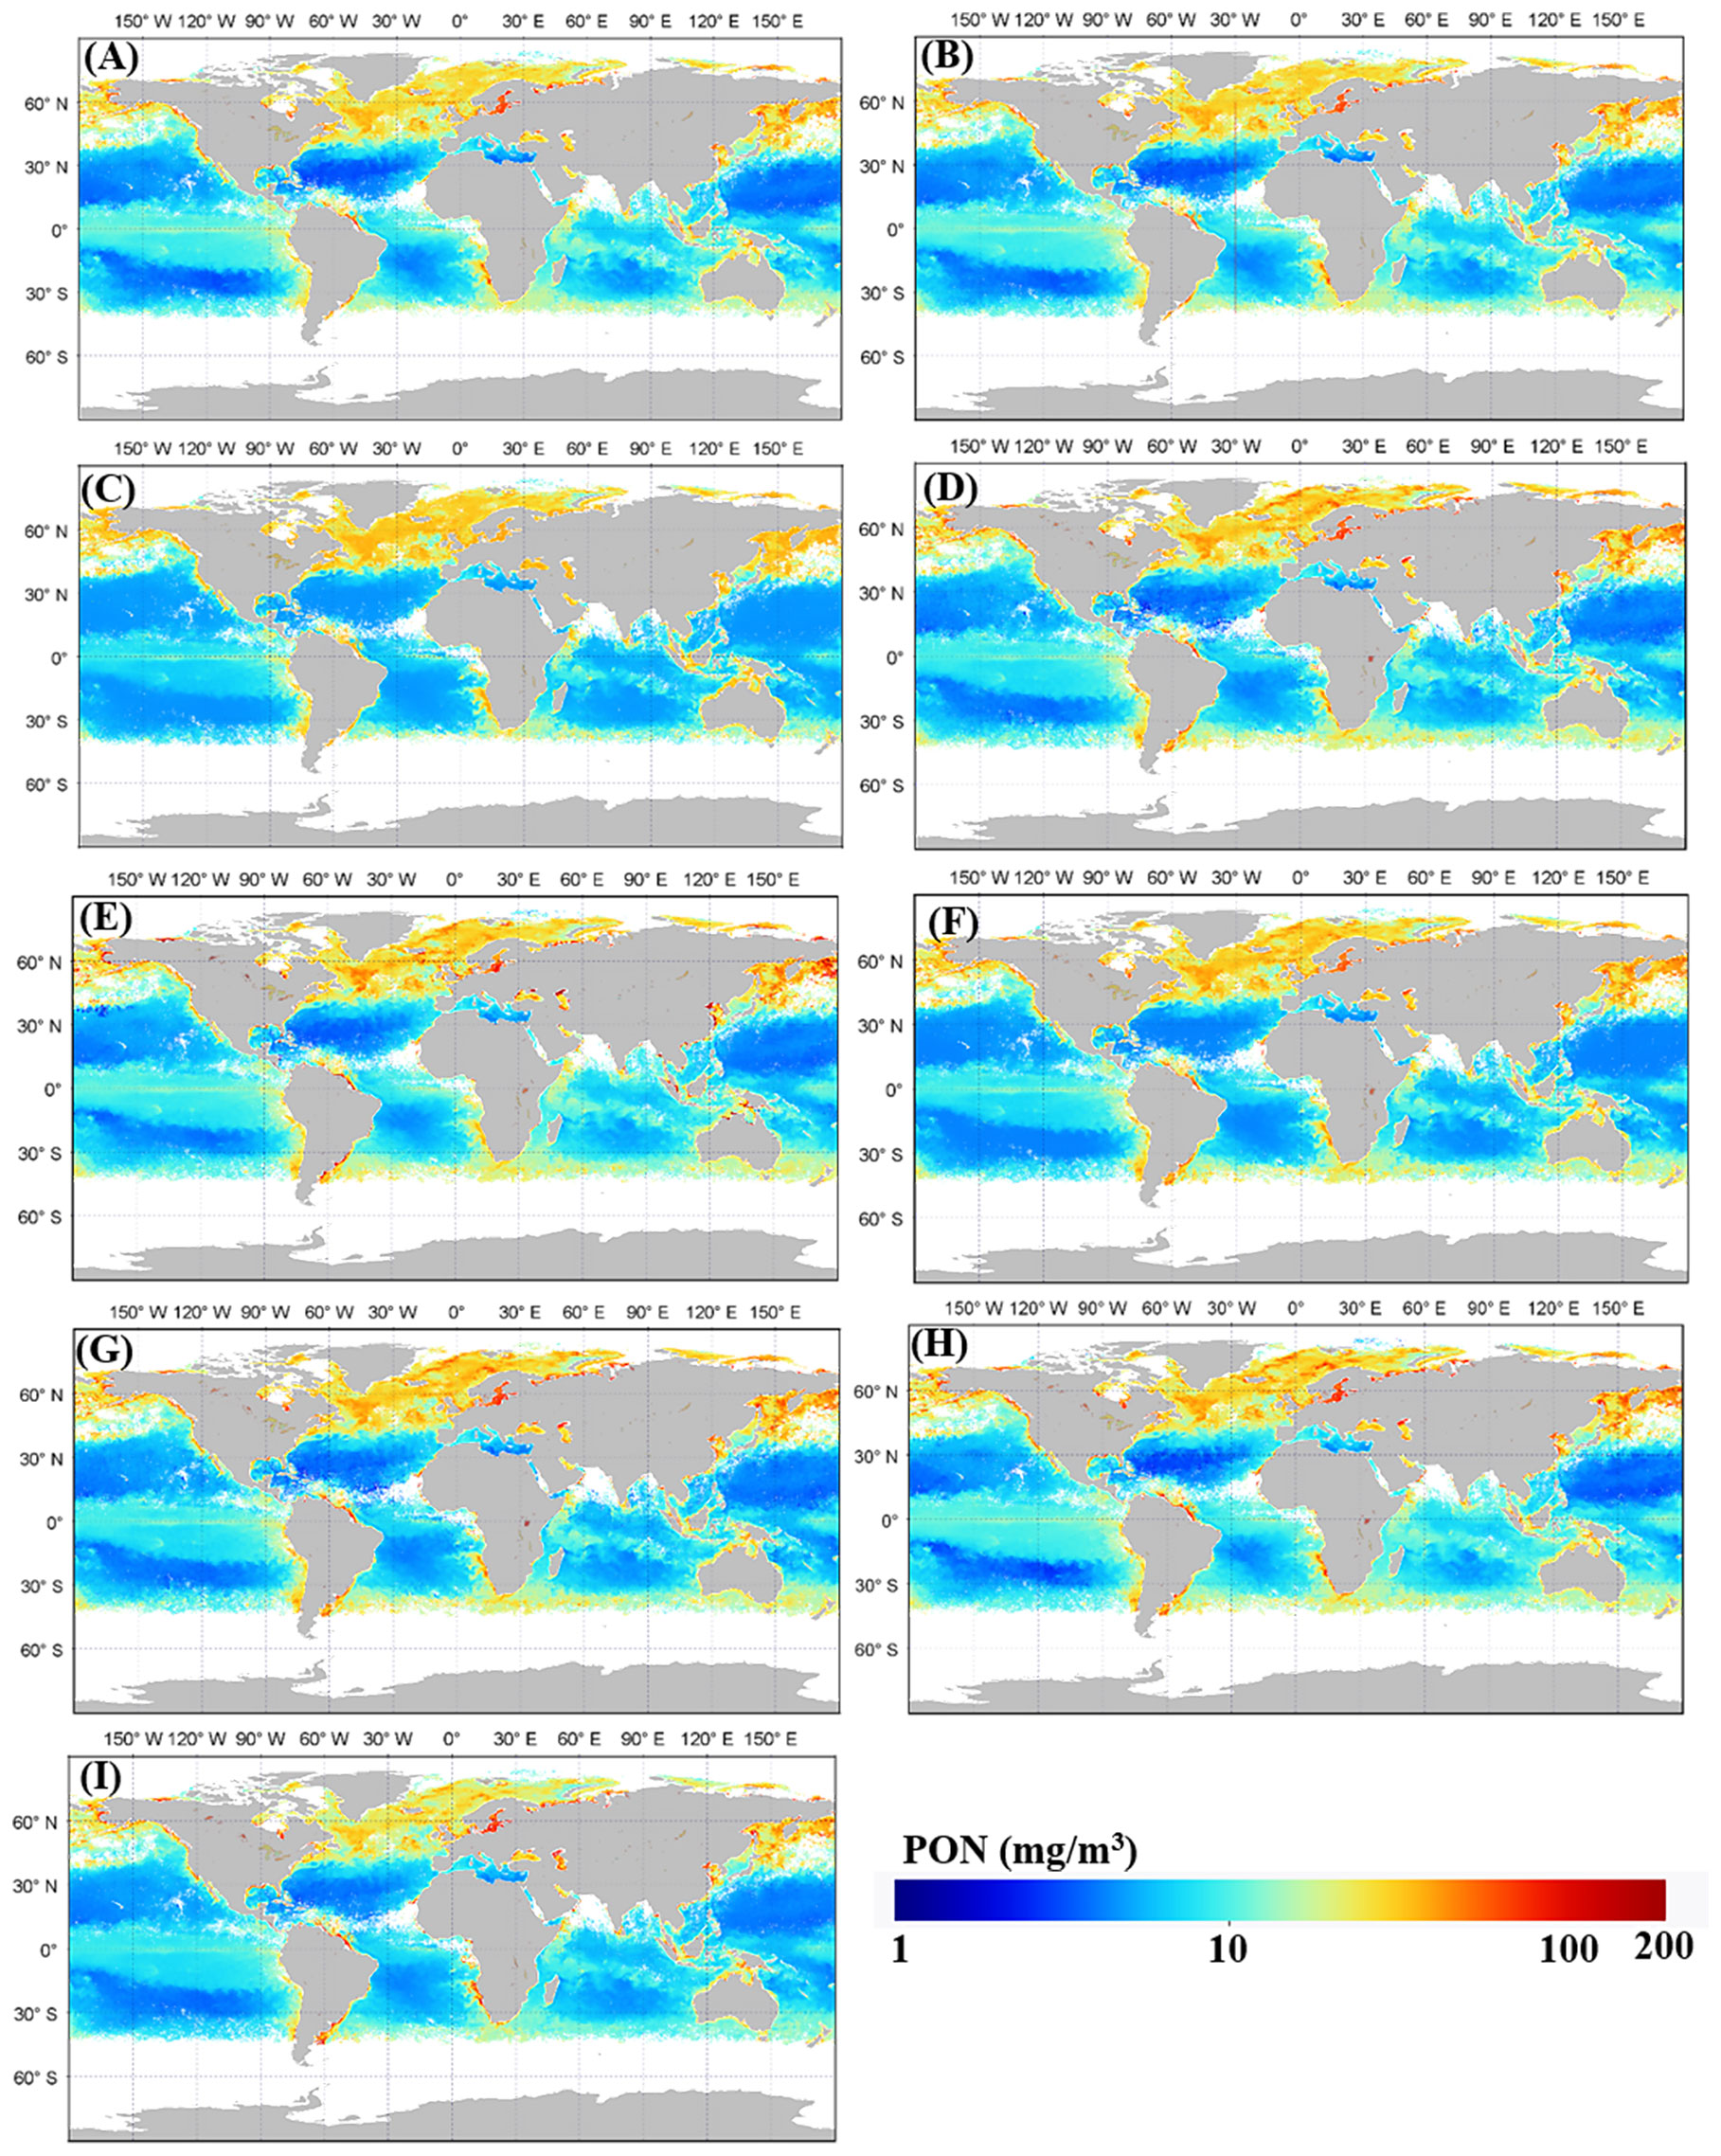
Figure 7 PON concentrations (mg/m3) retrieved with models based on a(469) (A), a(488) (B), bbp_s (C), BG (D), CI (E), MBR (F), NDNI (G), CHL (H), and POC (I), respectively.
The absolute and relative differences of the a(488)- and CHL-based models against the NDNI-based model are shown in Figure 8, in which absolute differences were calculated in untransformed scale and the relative differences were calculated in log10 transformation. Large relative differences were mainly observed in oligotrophic open oceans and turbid coastal seas. For examples, large positive relative differences were clearly observed in the central Indian Ocean and Coral Sea, while some negative differences were also observed, such as in the Arctic Ocean and Canary Sea (Figure 8). A transect through the Atlantic Ocean at 30°W shows the regional differences in nine model estimates for PON (Figure 9). The relative differences in oligotrophic open oceans were generally small, while larger differences of nine models in the North Atlantic Ocean can be clearly found at about between 40°N and 50°N.
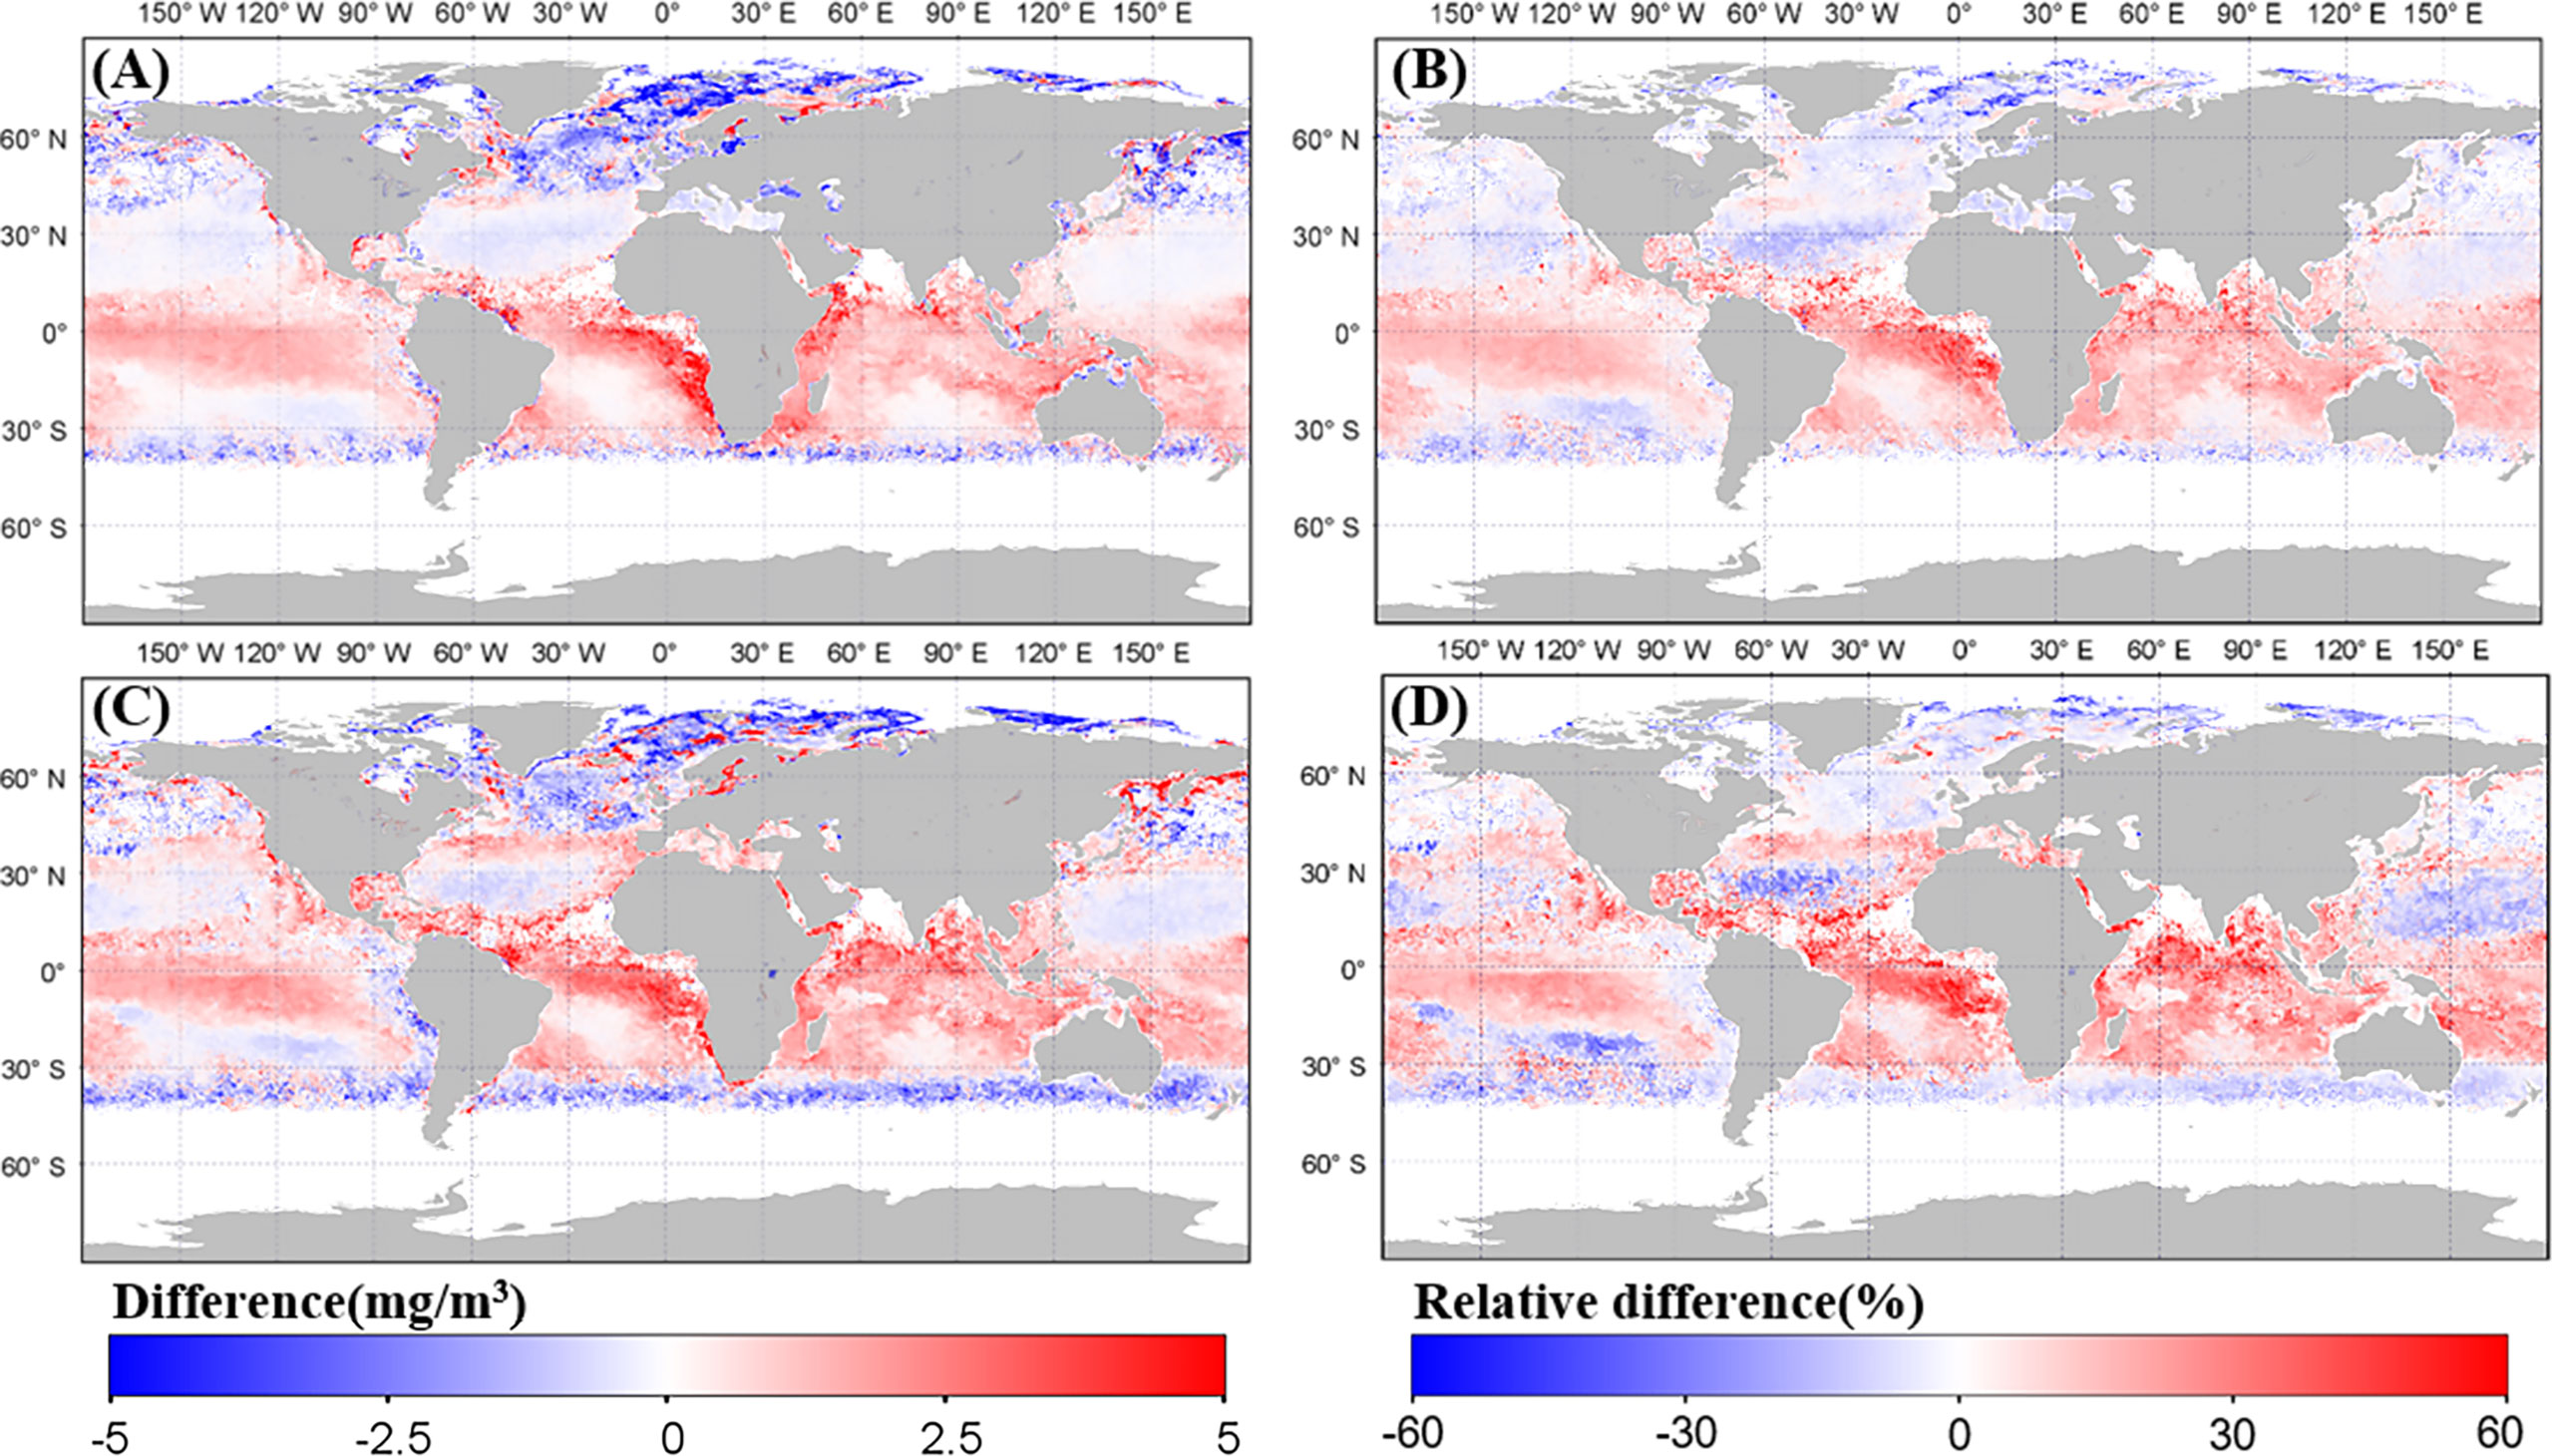
Figure 8 Absolute and relative PON concentration differences between models based on a(488) and the NDNI (A, B), as well as that based on CHL and NDNI (C, D). The left and right columns were for absolute and relative differences, respectively.
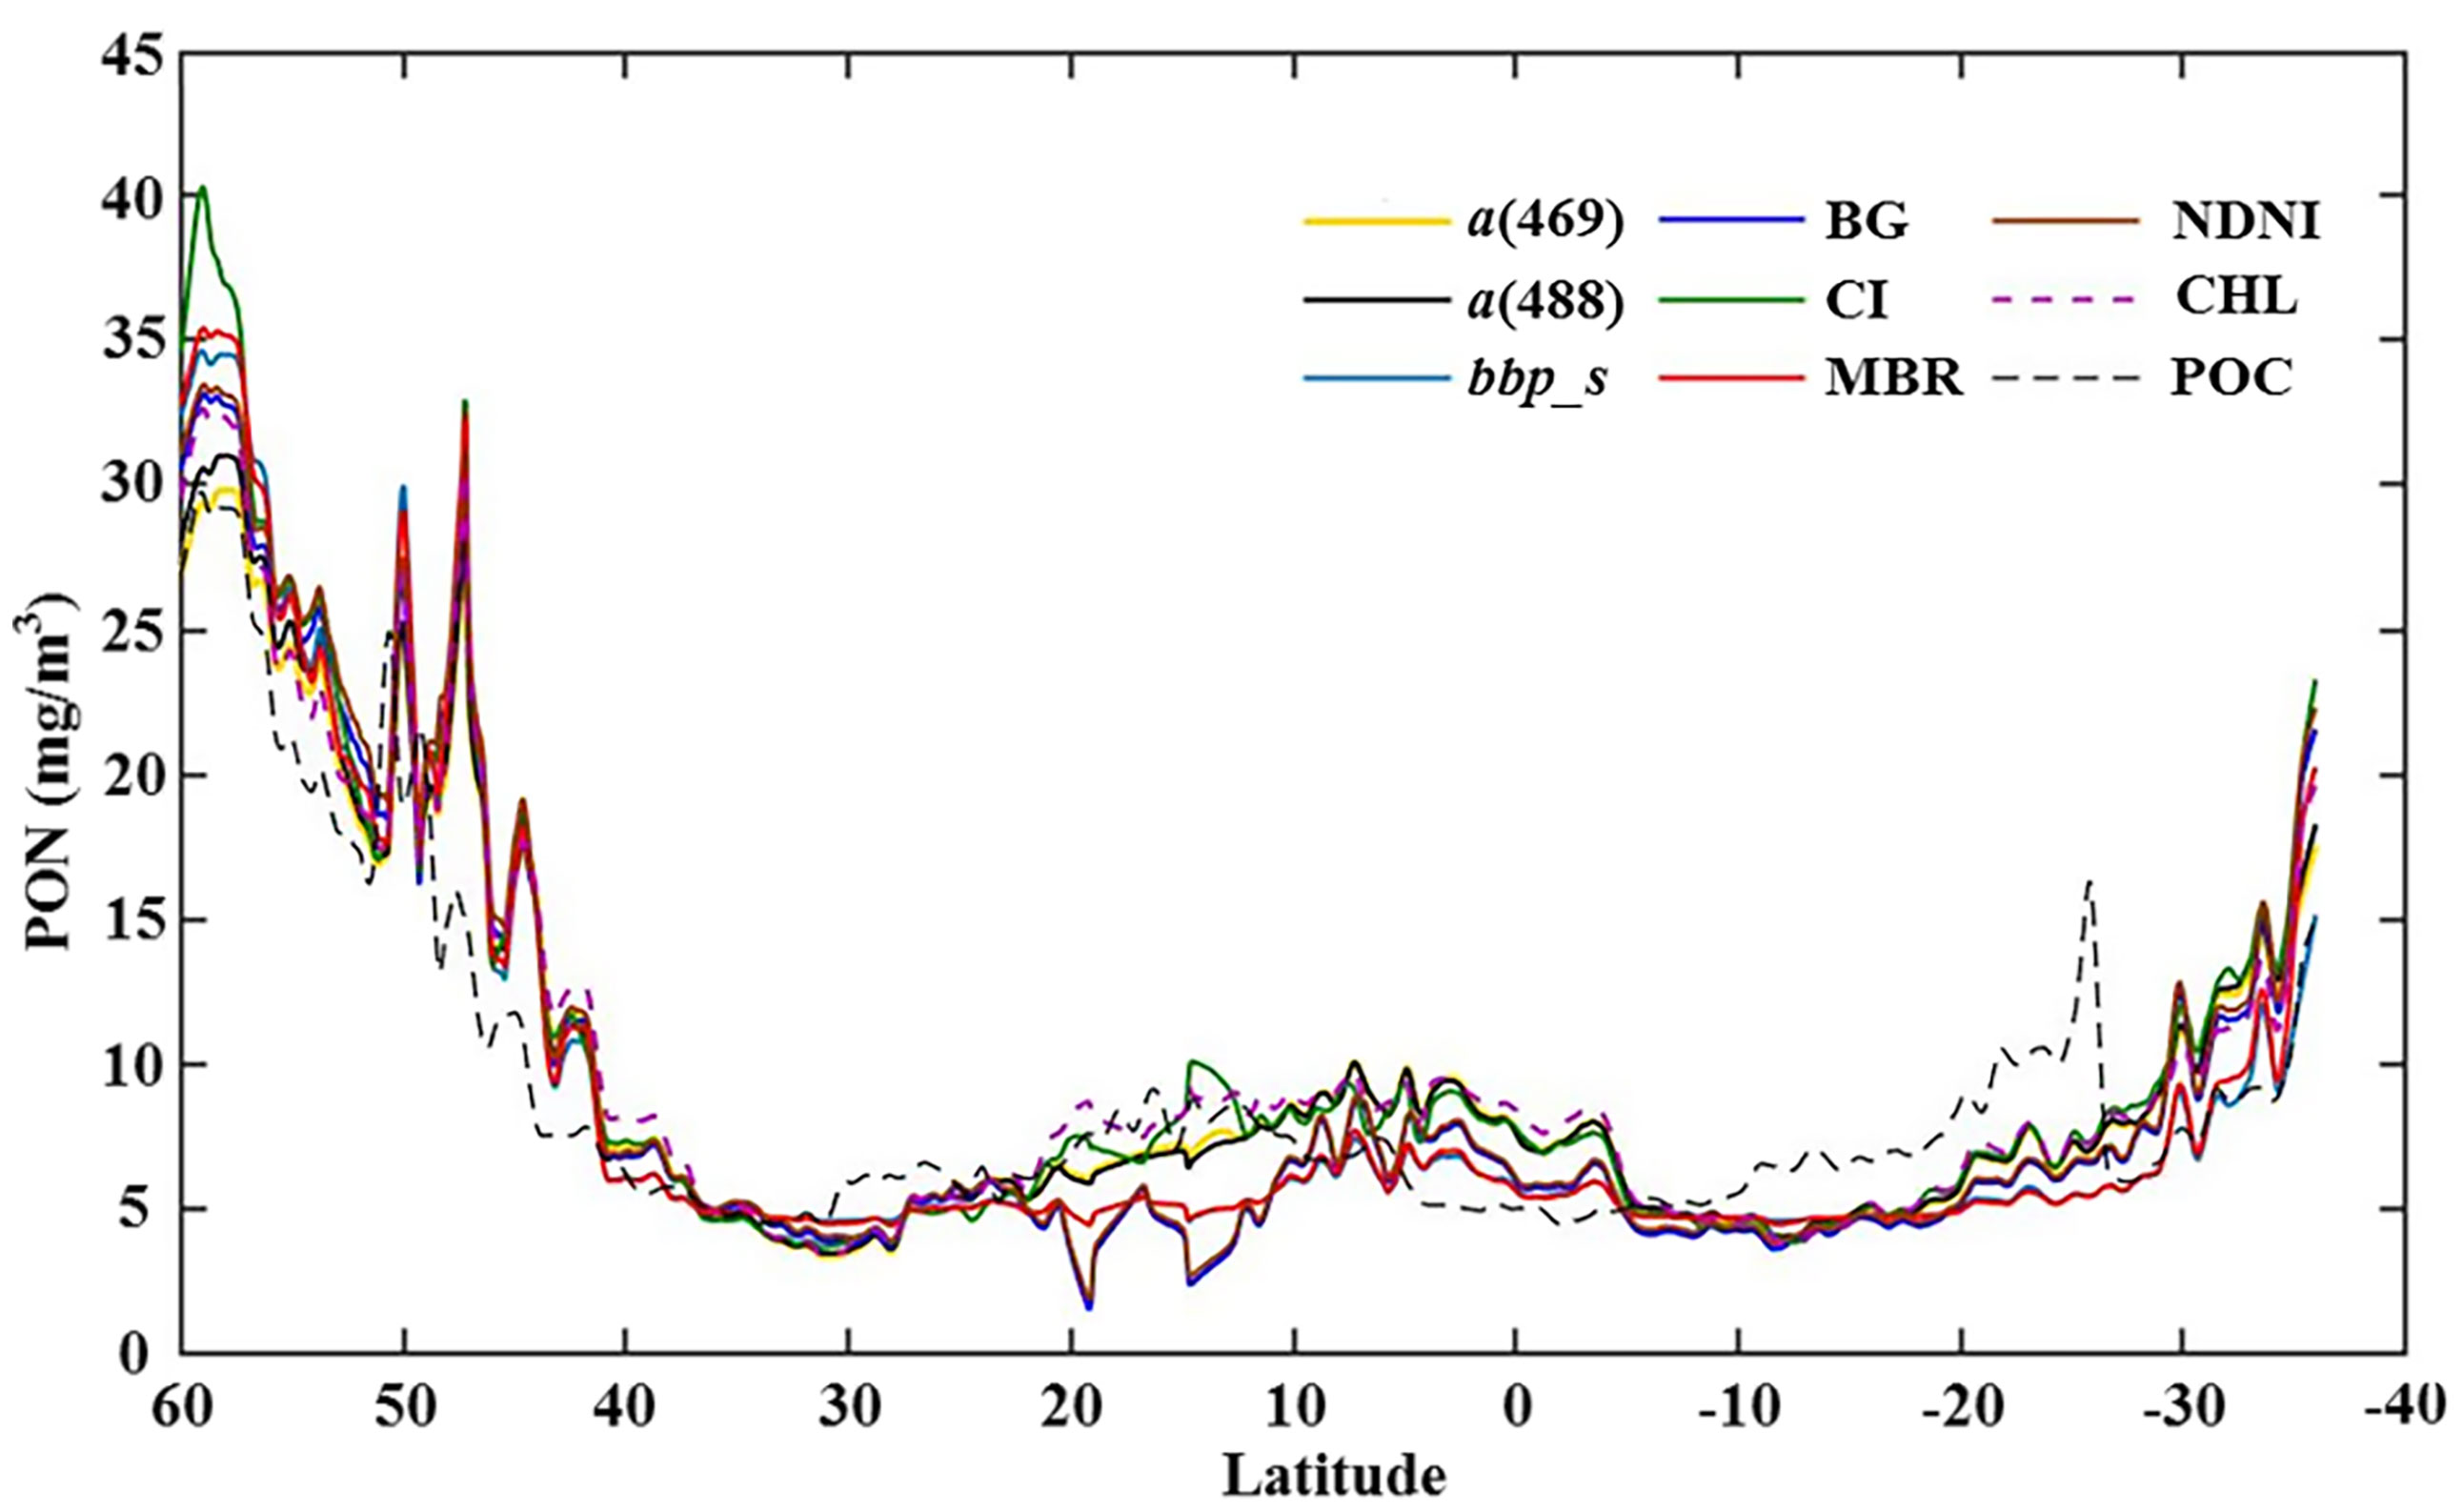
Figure 9 PON associated with an extracted transect through the Atlantic Ocean at 30° W for each model.
A 20-year trend analysis for the 2002–2022 global ocean monthly mean PON estimations obtained from a(488)-, CHL-, and NDNI-based models are presented in Figures 10A, B shows the variations of POC and CHL concentrations. The global monthly mean PON concentrations derived from the three models varied from about 10 to 14 mg/m3, and most periodical peaks and valley were observed in the summer (June, July, and August) and winter (December, January, and February) seasons, respectively. The PON concentrations retrieved from a(488)- and CHL-based models tended to produce higher PON concentrations than the NDNI-based model, because the NDNI-based model worked better in some stations with low PON concentrations (Figures 5G, 6B) and oligotrophic areas with low PON concentrations make up a large proportion of the global ocean (Figure 7). The seasonal variations of PON concentrations showed similar patterns with those of POC and CHL (Figure 10).
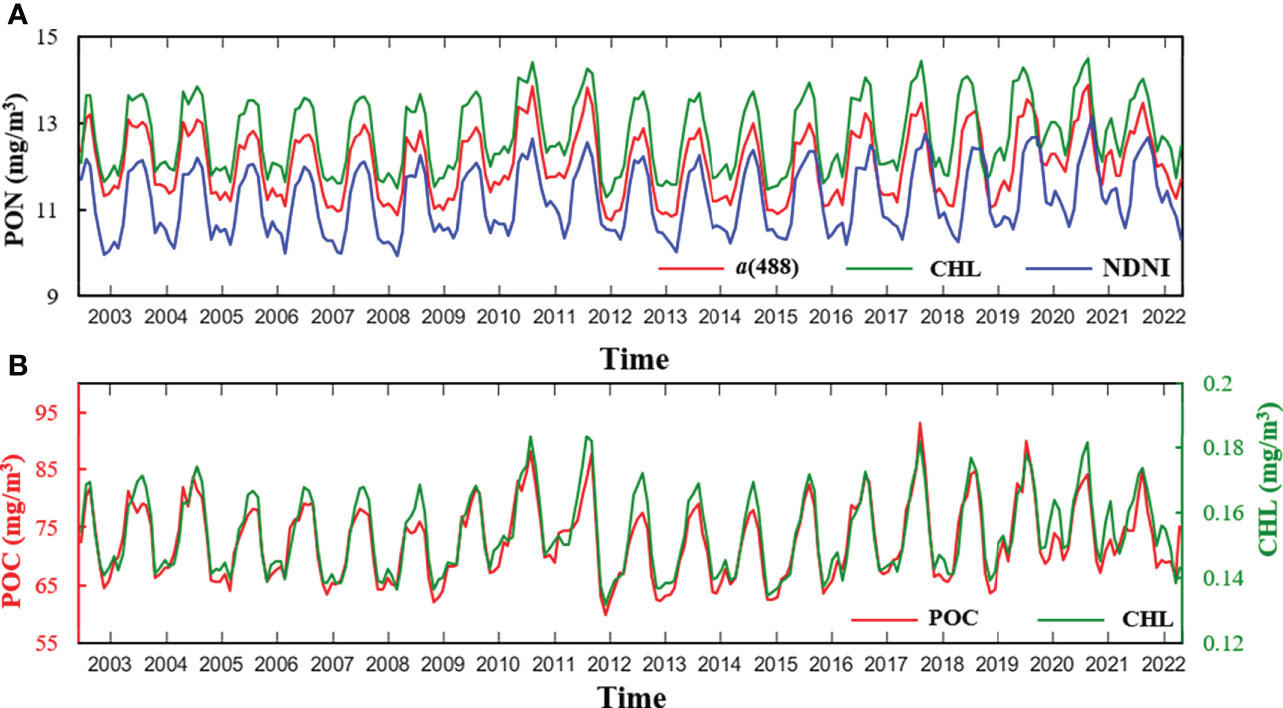
Figure 10 Plot (A) shows the variations of global monthly mean PON concentrations retrieved with the a(488)-, CHL-, and NDNI-based models. Plot (B) shows global monthly mean POC and CHL concentrations.
The relationships between the global monthly mean values of PON derived from the three models, POC and CHL were further explored and are illustrated with the scatterplots in Figure 11. All of the nine data pairs had strong correlations with r ≥0.81. The r between PON concentrations derived from a(488)- and CHL-based models was stronger with r = 0.96 than the other two PON data pairs with r = 0.86 and 0.82, respectively, for that of a(488)-based vs. NDNI-based models and CHL-based vs. NDNI-based models (Figures 11A–C). As for the relationships between POC and PON as well as CHL and PON concentrations, satellite-derived POC and CHL concentrations had the highest correlations with PON derived with the a(488)-based model with an r of 0.95 and 0.97, respectively, which is followed by the CHL-based model with r = 0.93 between POC and PON and r = 0.94 between CHL and PON. Both POC and CHL concentrations were derived with blue-to-green band ratio algorithms, and the variations of the blue-to-green band ratio are mainly driven by the total absorption coefficient, especially for chlorophyll-a absorption (Lee et al., 2002). Therefore, satellite-derived POC and CHL concentrations had higher correlations with PON concentrations derived with a(488)- and CHL-based models than the NDNI-based model with r = 0.81 between POC and PON and r = 0.87 between CHL and PON.
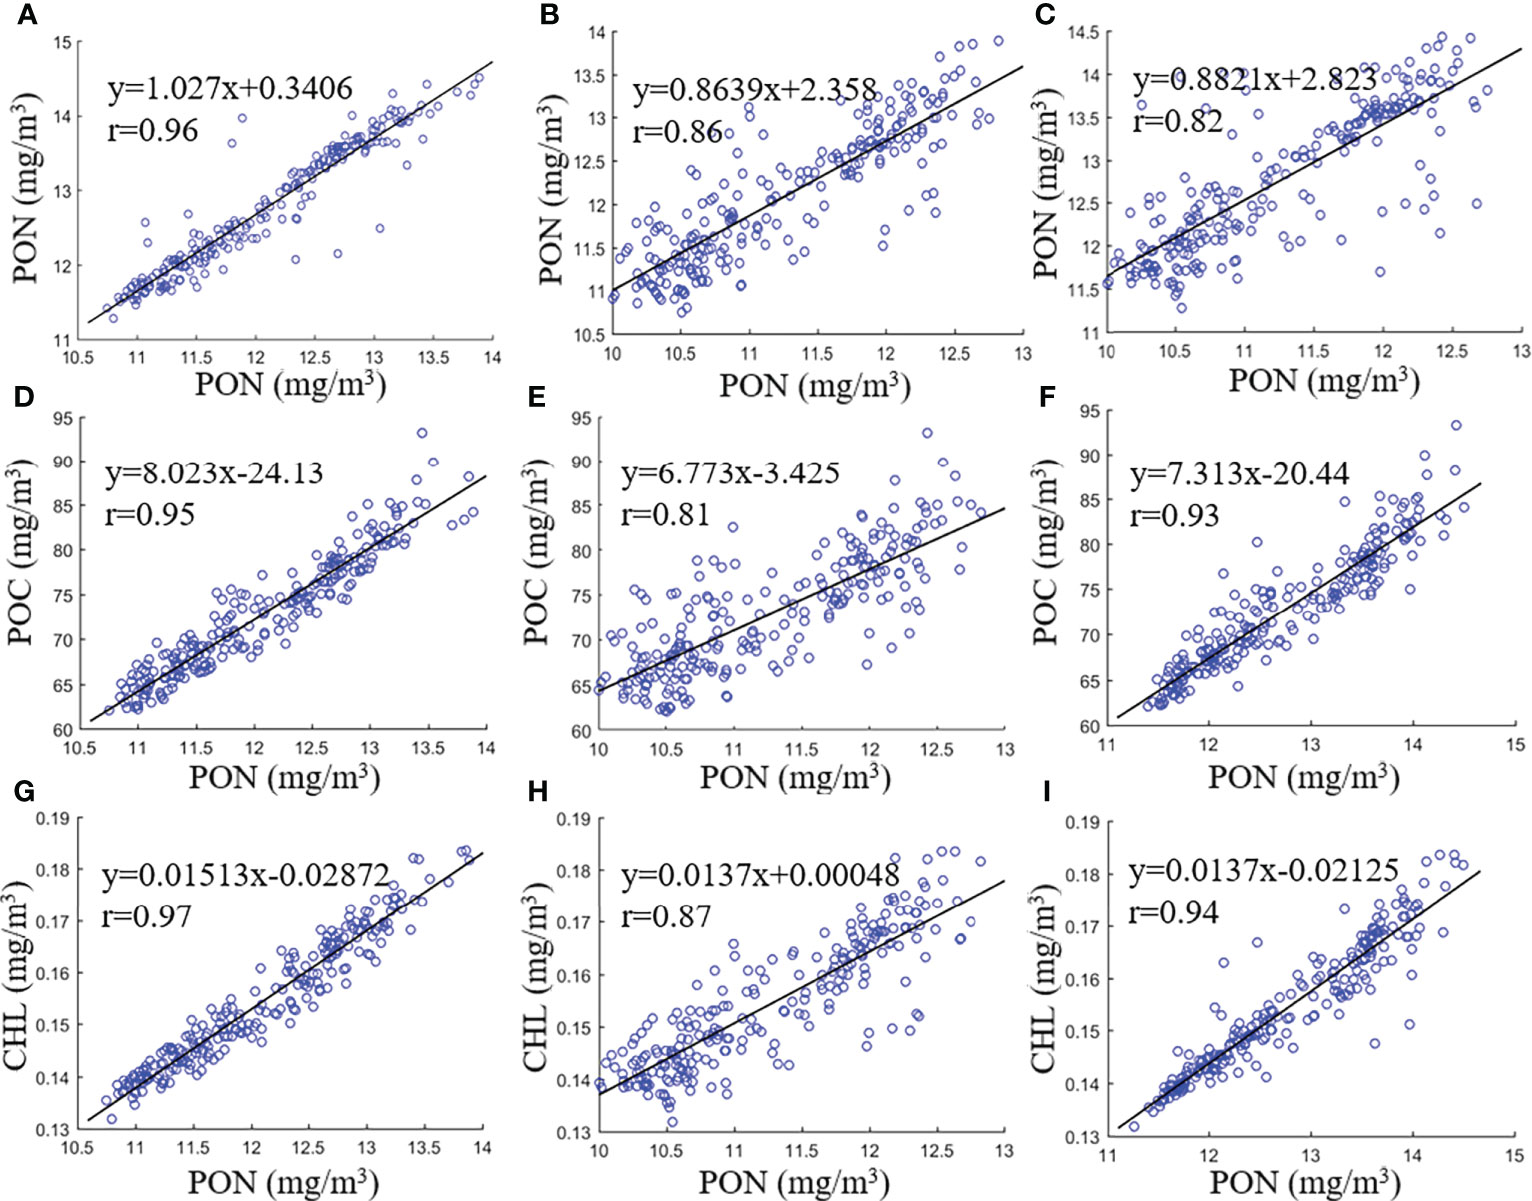
Figure 11 Scatterplots of global monthly mean PON concentrations with the CHL- vs. a(488)-based models (A), a(488)- vs. NDNI-based models (B), and CHL- vs. NDNI-based models (C), respectively. Plots (D-F) are the scatterplots of POC vs. PON concentrations derived with the a(488)-, NDNI-, and CHL-based models, respectively, and plots (G-I) are the scatterplots of CHL vs. PON concentrations derived with the a(488)-, NDNI-, and CHL-based models, respectively. The solid black line in each subplot is the linear regression line fitted with 238 data pairs of global monthly mean results.
Discussion
This study demonstrated the feasibility of retrieving oceanic PON concentrations from ocean color remote sensing data. By relating PON concentrations to ocean color parameters, this study developed satellite retrieval models for oceanic PON concentrations. Accurately retrieving PON concentrations from ocean color remote sensing data relies on the relationships between PON and oceanic inherent/apparent optical properties. Although PON is not any of the three optically active matters, i.e., CHL, non-agal particles (NAPs), and colored dissolved organic matter (CDOM), it generally comes from phytoplankton and NAPs. Thus, PON concentrations could be indirectly related to ocean color through phytoplankton and/or NAPs. Therefore, the key steps for PON estimation from satellite data are to identify reasonable proxies to PON and to develop PON retrieval models.
This study identified nine optical proxies for satellite retrieval of oceanic PON concentrations. The total absorption coefficient (a) and bbp_s were selected as optical proxies to PON concentrations, which should be a result of the relationship between PON and particulate matters (Stramski and Tegowski, 2001; Hunter et al., 2008). Studies based on BGC-Argo measurements suggested that the particulate scattering or backscattering coefficients are strongly correlated with PON concentrations and could serve as a proxy for PON concentrations, especially in the open ocean where organic particles are a primary source of optical variability (Fumenia et al., 2020). However, this study did not use them for PON retrieval because of their low performance. This might be explained by the following reasons: 1) the dataset used in this study covered larger variations with PON ranging from 1.21 to 254.00 mg/m3 than that of Fumenia et al. (2020) with PON<14 mg/m3, and the relationship between bbp and PON might be complicated for a large diverse dataset, 2) satellite-derived bbp was less accurate than in situ measured by the BGC-Argo, and 3) the variability of the backscattering coefficient is driven by several aspects of factors, such as the concentration of bulk particulate matter, particulate size distribution, refractive index, and particle morphology (Stramski et al., 2004).
This study found that AOP-based PON retrieval models worked better than other two types of models, which might be partially accounted by the uncertainties induced from satellite-derived IOPs and biological properties. Rrs band indexes, i.e., BG, CI, NDNI, and MBR, were found to be sensitive to PON concentrations. BG, CI, and MBR were initially proposed to retrieve chlorophyll-a concentrations (O'reilly et al., 1998; Hu et al., 2012; Wang and Son, 2016) and also used for POC retrieval (Le et al., 2018). The variations BG and MBR are mainly driven by the total absorption coefficient, especially for chlorophyll-a absorption (Lee et al., 2002), while phytoplankton is the primary source of PON especially in the open ocean. The CI-based model produced lower fitting and validation performance. However, it produced reasonable results for the Canary Basin, indicating its application potential for productive coastal waters, because CI is sensitive to both absorption and backscatter coefficients but less sensitive to Rrs uncertainties. NDNI was also considered in this study, because the NDNI with the wavelengths of nitrogen absorption feature has a direct connection with the nitrogen content and provided good estimating canopy nitrogen concentrations in vegetation (Serrano et al., 2002; Wang and Wei, 2016).
As for the biological property-based models, CHL and POC were identified as proxies. Inliterature, POC and PON were found to covary with each other (Raimbault et al., 2008; Moutin et al., 2018), and the Redfieldration of 106 carbon:16 nitrogen:1 phosphorus in marine phytoplankton was well accepted (Sanudo-Wilhelmy et al., 2004). This study also confirmed the highly correlated relationship between PON and POC (Figure 4I). However, retrieving PON concentrations from satellite-derived POC concentrations might be problematic, considering its relatively lower validation performance than other models. The lower performance of biological property-based models might be due to (1) the varying relationship between CHL and nitrogen influenced by multiple factors (Daughtry et al., 2000) and (2) uncertainties in the derivation of POC from satellite images (Cetinic et al., 2012; Evers-King et al., 2017; Roy et al., 2017), which undermines the application potentials of the POC-based model.
With the models developed in this study and the readily available ocean color products, PON variations in the surface ocean could be better explored. In literature, the assimilation of biogeochemical and ecological models with in situ data was used to explore spatiotemporal variations of PON (Guo et al., 2003; Wang et al., 2008; Wang Y. C. et al., 2019), and its performance depends on the consistence of the model with the real scenario as well as the input of ground truth, which might be undermined due to lacking enough in situ data. With the models developed in this study, ocean color remote sensing would be an alternative technique for exploring the oceanic PON variations in the global ocean. In addition, the assimilation of satellite-derived oceanic PON products with biogeochemical models might be promising for better understanding the oceanic nitrogen cycle and the underlying driving forces.
However, there are still works to be done in further research. First, more high-quality field samples covering the diverse depth and oceanic biogeochemical variations could further improve the model robustness. The standard deviation of every field sampling point with more than one measurement and the difference between NDNI-based model and in situ measurements are shown in Figure 12. It suggests that PON exhibits a certain variability with depth. Optical proxy could be better identified, and models could be better calibrated with a large diverse synchronous in situ dataset of PON concentrations and oceanic biogeochemical properties. Secondly, the potential internal methodological inconsistencies within the data sets used in the algorithm development may also introduce uncertainties. The formulation of algorithms in this study was based on matchup data of satellite-derived products and in situ PON shared by many different groups of researchers. Therefore, any potential inconsistencies in dataset may affect the established algorithm relationships.
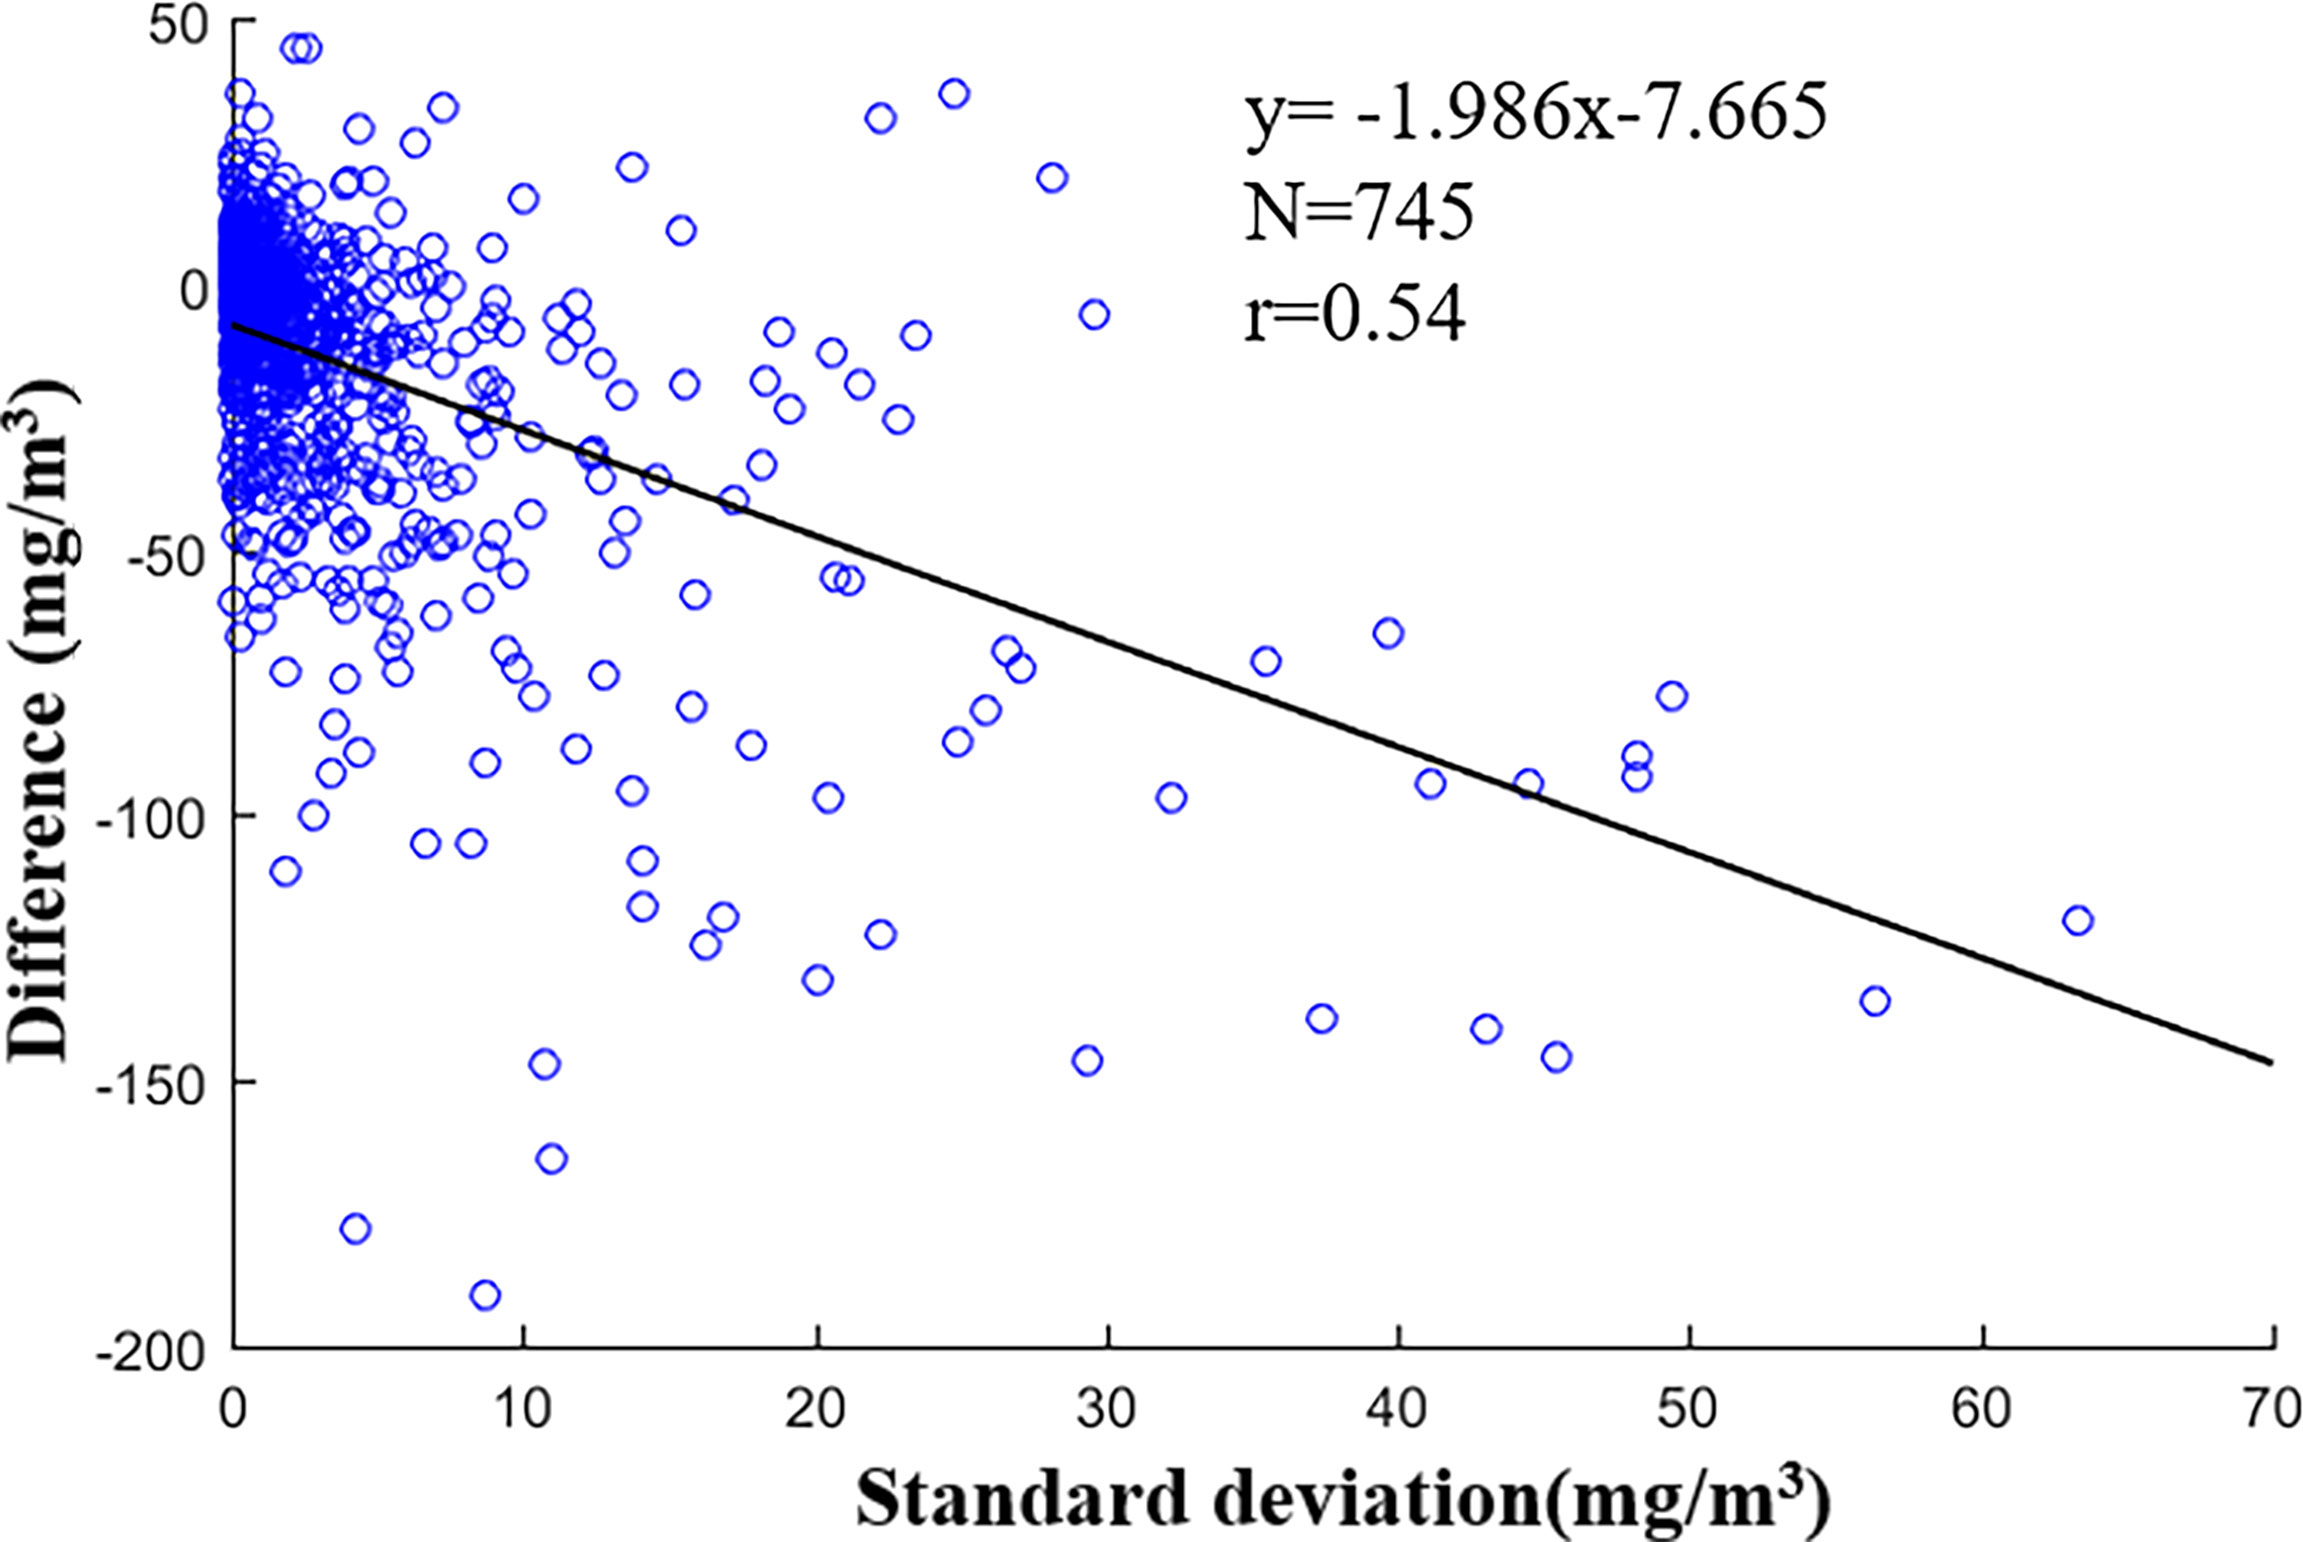
Figure 12 Relationships between standard deviation and difference.
Moreover, the accuracy of satellite-derived proxy could directly affect the final PON retrieval performance, which could be clearly supported by the distinct performance of the POC-based model for the training and validation datasets (Figures 4I and 5I). On one aspect, uncertainties in Rrs due to imperfect atmospheric correction performance (Liu et al., 2019b; Liu et al., 2022b), especially over productive turbid waters (Liu et al., 2019a), directly affected the performance of the AOP-based model and could also indirectly undermine the performance IOP- and biological property-based models by affecting the retrieval accuracy of these proxies. One the other aspect, the uncertainties in satellite-derived IOPs and biological properties due to the imperfect of their retrieval algorithms should also be an importance factor for satellite retrieval of PON concentrations. These two aspects might be partially accounted for the underestimation of the high PON concentrations.
Conclusion
This study explored the feasibility of estimating oceanic PON concentrations from satellite ocean color remote sensing. Based on a large diverse synchronous MODIS and in situ PON data, nine ocean color parameters were identified as optical proxies for satellite retrieval of oceanic PON concentrations. This study found that PON concentrations can be effectively estimated from ocean color products. With these nine selected proxies, three types of empirical model based on AOPs, IOPs, and biological properties were developed. Results showed that AOP-based models generally worked better than other two types of models. Especially, BG, MBR, and NDNI obtained comparable and better fitting and validation performance than other proxies, and they should be suitable for satellite retrieval of oceanic PON concentrations. Although POC and PON covaried with each other, however, retrieving PON concentrations from satellite-derived POC produced the lowest performance. Overall, this study demonstrated that ocean color remote sensing is a promising technique for oceanic PON retrieval in the global ocean. More in-depth work to examine and evaluate these proxies on other satellites for PON estimation and its potential implementation in the processing of ocean color measurements are needed. In addition, it would be improved to use deep learning method with large amounts of quality ocean color products and co-located in-situ data sets of POC concentration in various oceanic environments. Further studies will be focused on exploring the spatiotemporal variations of PON concentrations in the global ocean and analyzing the underlying driving forces.
Data availability statement
The original contributions presented in the study are included in the article/Supplementary Material. Further inquiries can be directed to the corresponding author.
Author contributions
YW analyzed the data and wrote original manuscript. HL conceptualized the idea and edited the manuscript. GW reviewed and edited the manuscript. All authors contributed to manuscript revision and read and approved the submitted version.
Funding
This study was supported by the National Natural Science Foundation of China grants (No. 42001281), Shenzhen Science and Technology Innovation Committee (No. JCYJ20210324120207020), and the Key-Area Research and Development Program of Guangdong Province (No. 2020B1111020005).
Acknowledgments
We thank NASA’s Ocean Biology Processing Group for providing MODIS ocean color products and thank NASA GSFC and Dryad Digital Repository as well as all contributors and for sharing the in situ PON data.
Conflict of interest
The authors declare that the research was conducted in the absence of any commercial or financial relationships that could be construed as a potential conflict of interest.
Publisher’s note
All claims expressed in this article are solely those of the authors and do not necessarily represent those of their affiliated organizations, or those of the publisher, the editors and the reviewers. Any product that may be evaluated in this article, or claim that may be made by its manufacturer, is not guaranteed or endorsed by the publisher.
References
blondeau-Patissier D., Gower J. F. R., Dekker A. G., Phinn S. R., Brando V. E. (2014). A review of ocean color remote sensing methods and statistical techniques for the detection, mapping and analysis of phytoplankton blooms in coastal and open oceans. Prog. Oceanography 123, 123–144. doi: 10.1016/j.pocean.2013.12.008
Capone D. G., Bronk D. A., Mulholland M. R., Carpenter E. J. (2008). Nitrogen in the marine environment (New York:Elsevier) 686–687.
Cetinic I., Perry M. J., Briggs N. T., Kallin E., D'asaro E. A., Lee C. M. (2012). Particulate organic carbon and inherent optical properties during 2008 north Atlantic bloom experiment. J. Geophysical Res Oceans 117, C06028. doi: 10.1029/2011JC007771
Daughtry C. S. T., Walthall C. L., Kim M. S., De Colstoun E. B., Mcmurtrey J. E. (2000). Estimating corn leaf chlorophyll concentration from leaf and canopy reflectance. Remote Sens. Environ. 74, 229–239. doi: 10.1016/S0034-4257(00)00113-9
Deutsch C., Sarmiento J. L., Sigman D. M., Gruber N., Dunne J. P. (2007). Spatial coupling of nitrogen inputs and losses in the ocean. Nature 445, 163–167. doi: 10.1038/nature05392
Enriquez C., Marino-Tapia I. J., Herrera-Silveira J. A. (2010). Dispersion in the Yucatan coastal zone: Implications for red tide events. Continental Shelf Res. 30, 127–137. doi: 10.1016/j.csr.2009.10.005
Evers-King H., Martinez-Vicente V., Brewin R. J. W., Dall'olmo G., Hickman A. E., Jackson T., et al. (2017). Validation and intercomparison of ocean color algorithms for estimating particulate organic carbon in the oceans. Front. Mar. Sci. 4. doi: 10.3389/fmars.2017.00251
Falkowski P. G. (1997). Evolution of the nitrogen cycle and its influence on the biological sequestration of CO2 in the ocean. Nature 387, 272–275. doi: 10.1038/387272a0
Fennel K., Wilkin J., Levin J., Moisan J., O'reilly J., Haidvogel D. (2006). Nitrogen cycling in the middle Atlantic bight: Results from a three-dimensional model and implications for the north Atlantic nitrogen budget. Global Biogeochemical Cycles 20, GB3007. doi: 10.1029/2005GB002456
Fumenia A., Petrenko A., Loisel H., Djaoudi K., Deverneil A., Moutin T. (2020). Optical proxy for particulate organic nitrogen from BGC-argo floats. Opt Express 28, 21391–21406. doi: 10.1364/OE.395648
Gruber N., Galloway J. N. (2008). An earth-system perspective of the global nitrogen cycle. Nature 451, 293–296. doi: 10.1038/nature06592
Guo X. Y., Hukuda H., Miyazawa Y., Yamagata T. (2003). A triply nested ocean model for simulating the kuroshio - roles of horizontal resolution on JEBAR. J. Phys. Oceanography 33, 146–169. doi: 10.1175/1520-0485(2003)033<0146:ATNOMF>2.0.CO;2
Holm-Hansen O. (1968). DETERMINATION OF PARTICULATE ORGANIC NITROGEN 1. Limnol Oceanography 13, 175–178. doi: 10.4319/lo.1968.13.1.0175
Hu C., Lee Z., Franz B. (2012). Chlorophyll aalgorithms for oligotrophic oceans: A novel approach based on three-band reflectance difference. J. Geophysical Res: Oceans 117. doi: 10.1038/sdata.2014.48
Hu S., Liu H., Zhao W., Shi T., Hu Z., Li Q., et al. (2018). Comparison of machine learning techniques in inferring phytoplankton size classes. Remote Sens. 10, 191. doi: 10.3390/rs10030191
Hunter P. D., Tyler A. N., Presing M., Kovacs A. W., Preston T. (2008). Spectral discrimination of phytoplankton colour groups: The effect of suspended particulate matter and sensor spectral resolution. Remote Sens. Environ. 112, 1527–1544. doi: 10.1016/j.rse.2007.08.003
Lee Z., Carder K. L., Arnone R. A. (2002). Deriving inherent optical properties from water color: A multiband quasi-analytical algorithm for optically deep waters. Appl. Optics 41, 5755–5772. doi: 10.1364/AO.41.005755
Le C., Zhou X., Hu C., Lee Z., Li L., Stramski D. (2018). A color-Index-Based empirical algorithm for determining particulate organic carbon concentration in the ocean from satellite observations. J. Geophysical Res: Oceans 123, 7407–7419. doi: 10.1029/2018JC014014
Lipizer M., De Vittor C., Falconi C., Comici C., Tamberlich F., Giani M. (2012). Effects of intense physical and biological forcing factors on CNP pools in coastal waters (Gulf of Trieste, northern Adriatic Sea). Estuar. Coast. Shelf Sci. 115, 40–50. doi: 10.1016/j.ecss.2012.03.024
Liu H., He X., Li Q., Hu X., Ishizaka J., Kratzer S., et al. (2022a). Evaluation of ocean color atmospheric correction methods for sentinel-3 OLCI using global automatic in situ observations. IEEE Trans. Geosci. Remote Sens. 60, 1–19. doi: 10.1109/TGRS.2021.3136243
Liu H., He X., Li Q., Kratzer S., Wang J., Shi T., et al. (2021a). Estimating ultraviolet reflectance from visible bands in ocean colour remote sensing. Remote Sens. Environ. 258, 112404. doi: 10.1016/j.rse.2021.112404
Liu H., Hu S., Zhou Q., Li Q., Wu G. (2019a). Revisiting effectiveness of turbidity index for the switching scheme of NIR-SWIR combined ocean color atmospheric correction algorithm. Int. J. Appl. Earth Observation Geoinform 76, 1–9. doi: 10.1016/j.jag.2018.10.010
Liu H., Li Q., Bai Y., Yang C., Wang J., Zhou Q., et al. (2021b). Improving satellite retrieval of oceanic particulate organic carbon concentrations using machine learning methods. Remote Sens. Environ. 256, 112316. doi: 10.1016/j.rse.2021.112316
Liu H., Li Q., Zhu P., Hu Z., Yang C., Wang Y., et al. (2022b). A glimpse of ocean color remote sensing from moon-based earth observations. IEEE Trans. Geosci. Remote Sens., 60, 4206811. doi: 10.1109/TGRS.2022.3168937
Liu H., Zhou Q., Li Q., Hu S., Shi T., Wu G. (2019b). Determining switching threshold for NIR-SWIR combined atmospheric correction algorithm of ocean color remote sensing. ISPRS J. Photogrammetry Remote Sens. 153, 59–73. doi: 10.1016/j.isprsjprs.2019.04.013
Loh A. N., Bauer J. E. (2000). Distribution, partitioning and fluxes of dissolved and particulate organic c, n and p in the eastern north pacific and southern oceans. Deep Sea Res. Part I Oceanographic Res. Papers 47, 2287–2316. doi: 10.1016/S0967-0637(00)00027-3
Martiny A. C., Vrugt J. A., Lomas M. W. (2014). Concentrations and ratios of particulate organic carbon, nitrogen, and phosphorus in the global ocean. Sci. Data 1, 140048. doi: 10.1038/sdata.2014.48
Mathew M. M., Rao N. S., Mandla V. R. (2017). Development of regression equation to study the total nitrogen, total phosphorus and suspended sediment using remote sensing data in Gujarat and maharashtra coast of India. J. Coast. Conserv. 21, 917–927. doi: 10.1007/s11852-017-0561-1
Mcclain C. R. (2009). A decade of satellite ocean color observations. Annu. Rev. Mar. Sci. 1, 19–42. doi: 10.1146/annurev.marine.010908.163650
Mckinna L. I. W. (2015). Three decades of ocean-color remote-sensing trichodesmium spp. in the world's oceans: A review. Prog. Oceanography 131, 177–199. doi: 10.1016/j.pocean.2014.12.013
Moore C. M., Mills M. M., Arrigo K. R., Berman-Frank I., Bopp L., Boyd P. W., et al. (2013). Processes and patterns of oceanic nutrient limitation. Nat. Geosci. 6, 701–710. doi: 10.1038/ngeo1765
Moutin T., Wagener T., Caffin M., Fumenia A., Gimenez A., Baklouti M., et al. (2018). Nutrient availability and the ultimate control of the biological carbon pump in the western tropical South Pacific Ocean. Biogeosciences 15, 2961–2989. doi: 10.5194/bg-15-2961-2018
O'reilly J. E., Maritorena S., Mitchell B. G., Siegel D. A., Carder K. L., Garver S. A., et al. (1998). Ocean color chlorophyll algorithms for SeaWiFS. J. Geophysical Res: Oceans 103, 24937–24953. doi: 10.1029/98JC02160
O'reilly J. E., Werdell P. J. (2019). Chlorophyll algorithms for ocean color sensors-OC4, OC5 & OC6. Remote Sens. Environ. 229, 32–47. doi: 10.1016/j.rse.2019.04.021
Pajares S., Ramos R. (2019). Processes and microorganisms involved in the marine nitrogen cycle: Knowledge and gaps. Front. Mar. Sci. 6. doi: 10.3389/fmars.2019.00739
Pujopay M., Raimbault P. (1994). Improvement of the wet-oxidation procedure for simultaneous determination of particulate organic nitrogen and phosphorus collected on filters. Mar. Ecol. Prog. Ser., 105, 203–207. doi: 10.3354/meps105203
Raimbault P., Garcia N., Cerutti F. (2008). Distribution of inorganic and organic nutrients in the south pacific ocean - evidence for long-term accumulation of organic matter in nitrogen-depleted waters. Biogeosciences 5, 281–298. doi: 10.5194/bg-5-281-2008
Roy S., Sathyendranath S., Platt T. (2017). Size-partitioned phytoplankton carbon and carbon-to-chlorophyll ratio from ocean colour by an absorption-based bio-optical algorithm. Remote Sens. Environ. 194, 177–189. doi: 10.1016/j.rse.2017.02.015
Sanudo-Wilhelmy S. A., Tovar-Sanchez A., Fu F. X., Capone D. G., Carpenter E. J., Hutchins D. A. (2004). The impact of surface-adsorbed phosphorus on phytoplankton redfield stoichiometry. Nature 432, 897–901. doi: 10.1038/nature03125
Seitzinger S., Harrison J. A., Bohlke J. K., Bouwman A. F., Lowrance R., Peterson B., et al. (2006). Denitrification across landscapes and waterscapes: A synthesis. Ecol. Appl. 16, 2064–2090. doi: 10.1890/1051-0761(2006)016[2064:DALAWA]2.0.CO;2
Serrano L., Peñuelas J., Ustin S. L. (2002). Remote sensing of nitrogen and lignin in Mediterranean vegetation from AVIRIS data: Decomposing biochemical from structural signals. Remote Sens. Environ. 81, 355–364. doi: 10.1016/S0034-4257(02)00011-1
Sharp J. H. (1974). Improved analysis for particulate organic carbon and nitrogen from seawater. Limnol Oceanography 19, 984–989. doi: 10.4319/lo.1974.19.6.0984
Smith S. V., Kimmerer W. J., Walsh T. W. (1986). Vertical flux and biogeochemical turnover regulate nutrient limitation of net organic production in the north pacific gyre. Limnol Oceanography 31, 161–166. doi: 10.4319/lo.1986.31.1.0161
Stramski D., Boss E., Bogucki D., Voss K. J. (2004). The role of seawater constituents in light backscattering in the ocean. Prog. Oceanography 61, 27–56. doi: 10.1016/j.pocean.2004.07.001
Stramski D., Tegowski J. (2001). Effects of intermittent entrainment of air bubbles by breaking wind waves on ocean reflectance and underwater light field. J. Geophysical Res Oceans 106, 31345–31360. doi: 10.1029/2000JC000461
Tehrani N. A., Janalipour M., Babaei H. (2021). Estimating water surface chlorophyll-a concentration by big remote sensing data in the Persian gulf, bushehr. Remote Sens. Earth Syst. Sci. 4, 87–95. doi: 10.1007/s41976-021-00045-2
Tyrrell T. (1999). The relative influences of nitrogen and phosphorus on oceanic primary production. Nature 400, 525–531. doi: 10.1038/22941
Voss M., Bange H. W., Dippner J. W., Middelburg J. J., Montoya J. P., Ward B. (2013). The marine nitrogen cycle: Recent discoveries, uncertainties and the potential relevance of climate change. Philos. Trans. R. Soc. B Biological Sci. 368, 20130121. doi: 10.1098/rstb.2013.0121
Wada E., Hattori A. (1990). Nitrogen in the sea: forms, abundance, and rate processes (Boca Raton, Florida: CRC press).
Wang Y. C., Guo X. Y., Zhao L., Zhang J. (2019b). Seasonal variations in nutrients and biogenic particles in the upper and lower layers of East China Sea shelf and their export to adjacent seas. Prog. Oceanography 176, 102138. doi: 10.1016/j.pocean.2019.102138
Wang X. J., Le Borgne R., Murtugudde R., Busalacchi A. J., Behrenfeld M. (2008). Spatial and temporal variations in dissolved and particulate organic nitrogen in the equatorial pacific: Biological and physical influences. Biogeosciences 5, 1705–1721. doi: 10.5194/bg-5-1705-2008
Wang W. L., Moore J. K., Martiny A. C., Primeau F. W. (2019). Convergent estimates of marine nitrogen fixation. Nature 566, 205–20+. doi: 10.1038/s41586-019-0911-2
Wang M., Son S. (2016). VIIRS-derived chlorophyll-a using the ocean color index method. Remote Sens. Environ. 182, 141–149. doi: 10.1016/j.rse.2016.05.001
Wang L., Wei Y. (2016). Revised normalized difference nitrogen index (NDNI) for estimating canopy nitrogen concentration in wetlands. Optik 127, 7676–7688. doi: 10.1016/j.ijleo.2016.05.115
Werdell P. J., Franz B. A., Bailey S. W., Feldman G. C., Boss E., Brando V. E., et al. (2013). Generalized ocean color inversion model for retrieving marine inherent optical properties. Appl. Optics 52, 2019–2037. doi: 10.1364/AO.52.002019
Xu Y., Zhang Y., Zhang D. (2010). Retrieval of dissolved inorganic nitrogen from multi-temporal MODIS data in Haizhou bay. Mar. Geodesy 33, 1–15. doi: 10.1080/01490410903530257
Yu Y., Song J. M., Li X. G., Yuan H. M., Li N. (2012). Distribution, sources and budgets of particulate phosphorus and nitrogen in the East China Sea. Continental Shelf Res. 43, 142–155. doi: 10.1016/j.csr.2012.05.018
Zehr J. P., Kudela R. M. (2011). “Nitrogen cycle of the open ocean: From genes to ecosystems,” in Annual review of marine science 3, 197–225. doi: 10.1146/annurev-marine-120709-142819
Keywords: ocean color remote sensing, particle organic nitrogen, optical proxies, global ocean, nitrogen cycle
Citation: Wang Y, Liu H and Wu G (2022) Satellite retrieval of oceanic particulate organic nitrogen concentration. Front. Mar. Sci. 9:943867. doi: 10.3389/fmars.2022.943867
Received: 14 May 2022; Accepted: 25 July 2022;
Published: 30 August 2022.
Edited by:
Takafumi Hirata, Hokkaido University, JapanReviewed by:
Milad Janalipour, Ministry of Science, Research, and Technology, IranShawn R. Campagna, The University of Tennessee, Knoxville, United States
Copyright © 2022 Wang, Liu and Wu. This is an open-access article distributed under the terms of the Creative Commons Attribution License (CC BY). The use, distribution or reproduction in other forums is permitted, provided the original author(s) and the copyright owner(s) are credited and that the original publication in this journal is cited, in accordance with accepted academic practice. No use, distribution or reproduction is permitted which does not comply with these terms.
*Correspondence: Huizeng Liu, aHVpemVuZy5saXVAc3p1LmVkdS5jbg==