Abstract
Ocean acidification has critical impacts on marine ecosystems, but presents knowledge gaps on the ecological impacts requiring large-scale monitoring of physicochemical conditions to predict biological responses to ocean pH projections. The threat is especially significant in coastal regions like upwelling areas which are more sensitive and appear to respond more rapidly to anthropogenic perturbations. These ecosystems, such as the northwest coast of the Iberian Peninsula are characterized by complex physical and biogeochemical interactions, supporting enormous biological productivity and productive fisheries. The distribution of pH in upwelling systems has high variability on short temporal and spatial scales preventing a complete picture of acidification, which exhibit long-term pH rates markedly different from the measured in open waters. This motivation to significantly expand the coverage of pH monitoring in coastal areas has driven us to develop an autonomous pH monitoring instrument (from now on SURCOM) based on the Honeywell Durafet® pH electrode. A relevant feature is that SURCOM transmits near real-time pH and temperature measurements every 10.5 min through SIGFOX®, a low-power, low-bandwidth network for data transmission. This very careful design allows us to achieve a very low power consumption for the complete system resulting in 3 years of full autonomy with no other need than external cleaning and calibration. In this paper we describe the setup and the data set obtained by a SURCOM instrument over 240 days in a highly productive and dynamic coastal ecosystem, the Ría de Arousa embayment, providing valuable information on the performance of these low-cost and highly stable sensors, with potential for improving the pH variability description in nearshore systems and for reinforcing the monitoring-modeling of coastal acidification.
Introduction
The continued absorption by the oceans of the atmospheric carbon dioxide produced by human activities, causes a reduction in the pH of the oceans known as ocean acidification (IPCC, 2021). The average surface ocean pH has thus decreased by approximately 0.11 from a preindustrial mean value of 8.17, corresponding to a 30% increase in H+ concentration. This pH declination, estimated around 0.02 per decade in open-ocean waters (Doney et al., 2009; Bates et al., 2014; Ríos et al., 2015) has critical impacts on marine ecosystems (Doney et al., 2012; Branch et al., 2013), especially in marine calcifiers such as corals and mollusks (Orr et al., 2005; Kroeker et al., 2013; Gattuso et al., 2014). By the end of this century, the pH of the ocean surface water is projected to drop by further 0.1-0.4 (Feely et al., 2004; Orr et al., 2005; Doney et al., 2009; Gattuso et al., 2015). In this hypothetical scenario, the concentration of carbonate ions will excess 50% compared to pre-industrial conditions (Feely et al., 2004; Orr et al., 2005; Doney et al., 2009; Gattuso et al., 2015) resulting in corrosive conditions for calcareous structures such as shells or skeletons (Kroeker et al., 2013; Bednaršek et al., 2014; Albright, 2018; Eyre et al., 2018; Harvey et al., 2018). For this reason, ocean acidification is a headline climate indicator according to the World Meteorological Organization and a target for the United Nations (UN) Sustainable Development Goals (SDG) on the conservation and sustainable use of marine resources.
Growing concern in the international community about ocean acidification has stimulated the collection of discrete measurements in high-quality time series (Dore et al., 2009; Hofmann et al., 2011; Ishii et al., 2011; Andersson and Mackenzie, 2012; McElhany and Busch, 2013; Takeshita et al., 2015; Wahl et al., 2015; Padin et al., 2020) and the establishment of sensor based ones, such as ESTOC (González-Dávila et al., 2010), GIFT (Flecha et al., 2015) and Balearic Sea (Flecha et al., 2022) along Iberian Peninsula. However, knowledge gaps on the ecological impacts of ocean acidification require more intensive large-scale monitoring of the physico-chemical conditions of marine ecosystems to predict biological responses to future changes. The success of these observation networks must be based on a multidisciplinary approach (physics, chemistry, biology, etc.), on the development of technologies that allow public access to information, and on integration with other observational networks focusing on similar measurements or related issues. For this purpose, the Global Ocean Acidification Observing Network (GOA-ON) (Newton et al., 2015; Tilbrook et al., 2019) was created with the aim of improving the understanding of ocean acidification conditions globally, using commercially available sensors and low-cost technologies, with a particular focus on monitoring shelf and coastal seas.
Ocean acidification in coastal waters is affected by an intricate set of local processes that cause extremely complicated and variable pH patterns (Borges et al., 2010; Provoost et al., 2010; Johnson et al., 2013; Baumann et al., 2015; Carstensen and Duarte, 2019). Among nearshore waters, the coastal upwelling areas are more sensitive and appear to respond faster to anthropogenic perturbations (Feely et al., 2008; Gruber et al., 2012; Hauri et al., 2013; Lachkar, 2014; Padin et al., 2020). These ecosystems characterized by complex physical and biogeochemical interactions support an enormous biological productivity (Pauly and Christensen, 1995; Hauri et al., 2009). The large physico-chemical variability of upwelling systems and the lack of regular sampling in these waters prevents a complete picture of the acidification of these ecosystems.
Along the Iberian upwelling system, accurate discrete measurements of marine inorganic carbon system and ancillary parameters were gathered in the ARIOS dataset (Acidification in the Rías and the Iberian Continental Shelf; 1976-2018) by Padin et al. (2020) and Pérez et al. (2020). However, this dataset is not designed to identify relative spatial patterns and short-term variation, so there are several gaps in knowledge about the impact of ocean acidification and ecosystem responses. Discrete sampling from oceanographic cruises do not allow identifying relative spatial patterns and short-term variation or the synthesis of near real time products for coastal managers. Addressing these identified gaps requires the use of sensor technologies in a nested observational network that can collect concurrent data covering an entire area to document changes in pH and other key biogeochemical parameters as well as biological impacts in the study area.
In this paper, we present the development and performance of a prototyped instrument (SURCOM) based on the usage of a commercial ion sensitive field effect electrode (ISFET) sensor and a communications network in an inner area of the Ría de Arousa. This initiative is a first step of a next implementation of a network of autonomous pH sensors for incorporating this coastal upwelling region of great socio-economic importance due to production of shellfish and fish in the GOA-ON network.
Material and methods
Description of monitoring area
The coastline of Galicia in the Northwestern region of the Iberian Peninsula (Figure 1) represents the northern limit of the Canary/Iberian Current Upwelling System and is one of the world’s major upwelling zones in terms of biological productivity (Pauly and Christensen, 1995; Varela et al., 2015; Lovecchio et al., 2022). The northerly component of shelf wind stress, which dominates between May and October (Pardo et al., 2011), induces the rise to surface of the cool and nutrient-rich subsurface waters close to the coast (Arístegui et al., 2009; Álvarez-Salgado et al., 2010). These nutrient pulses stimulate phytoplankton growth, making this coastal upwelling ecosystem highly productive, especially in the four large coastal embayments on the south Galician coast (Pérez-Camacho, 1995; Fernández-Reiriz et al., 1996; Babarro et al., 2000). These embayments, collectively known as the Rías Baixas, have the highest mussel growth rates worldwide (Pérez-Camacho, 1995) and an annual mussel production in Galicia of approximately 250,000 t, representing around 12% of the worldwide production (FAO, 2018).
Figure 1

Geographical location of the SURCOM sensor deployment, CTD instruments and meteorological station (black star), at the Cortegada floating platform (42°37.54’N; 8°47.03’W), in the inner basin of Ría de Arousa.
The Ría de Arousa is the largest embayment of the Rías Baixas, covering an area of 245 km2 and containing 2404 floating mussel rafts. The inner area of the Ría de Arousa, with a maximum depth of 10 m, is highly dynamic due to the combined effect of the tide, which has a semidiurnal tidal regime with a tidal range of 2 m in neap tides and 4 m in spring tides (Fanjul et al., 1997), the continental inputs from the nearby Ulla River with a maximum discharge in February and the changes in the residual estuarine circulation induced by the shelf wind forcing (Álvarez-Salgado, 2000).
The spot selected for the mooring is a floating platform in the inner area of the Ría de Arousa (Figure 1; 42°37.54’N; 8°47.03’W), near the island of Cortegada, within the boundaries of the Atlantic Islands of Galicia National Park. The spot is part of the Xunta de Galicia oceanographic observation stations network and RAIA network (www.marnaraia.org) maintained by a collaboration among Meteogalicia and CETMAR (www.cetmar.org). Meteorological and oceanographic parameters such as wind speed, temperature, salinity and the current velocity are logged every 10 minutes and are publicly accessible through the Meteogalicia website (www.meteogalicia.gal).
Autonomous instrument for pH monitoring in surface waters
A commercial pH sensor (Honeywell Durafet III) using ISFET technology (Bris and Birot, 1997; Bausells et al., 1999; Bergveld, 2003) was selected for the development of a prototype instrument called SURCOM. The Durafet III, produced actually by Honeywell, offers advantages like robustness, small size, high reproducibility, high long-term stability and reproducibility in ocean and in a variety of nearshores habitat types (Kroeker et al., 2011; Yu et al., 2011; Bresnahan et al., 2014; Martz et al., 2015b; Martz et al., 2015a; Johnson et al., 2016).
The structure of the developed prototype followed an ideal of low-cost and easy assembling, thus enabling scalability of production with common resources, and consists of a PVC pipe, 9 cm in diameter and 100 cm long, on which a segment of about 30 cm is cut to make the perforated element that will protect the Honeywell Durafet III pH sensor (Figure 2). The pH sensor was attached to the bottom of the main pipe, ensuring that the inside of the pipe remains watertight. A bag containing about 200 g of Drierite™ (Anhydrous Calcium Sulfate) desiccant is also placed inside the pipe to keep the moisture low. The electronics and the antenna are installed in the upper part of the pipe, which has a larger diameter. The internal thermistor of the Durafet sensor is located in a middle position inside the body, in contact with the KCl gel of internal reference, so, it’s relevant to keep the sensor body in direct contact with water to achieve rapid temperature adaptation.
Figure 2

Image, layout and dimensions of the SURCOM instrument, case design and location of main components. The upper panel shows the schematic diagram of operation, including involved components and data flow direction.
An SAMD21 Cortex®-M0+ 32-bit low power ARM® ATMEL processor is the processing core (MCU) of the electronic system following Figure 2, fitted with a low power ATA8520 ATMEL ultra-narrow band Sigfox transceiver, which allow us to achieve a very low power consumption for the assembly. Electronic system is completed by a microSD card slot and a MCP3424 low-noise, high accuracy, delta-sigma 18 bits analog-to-digital converter from Microchip Technologies. This module is used to discretize the voltage range of the pH signal from the Honeywell Durafet III sensor and its internal thermistor. In addition, a digital secondary temperature sensor is installed to complement the thermistor signal of the Honeywell Durafet III sensor to detect drifts in temperature measurements. By using single integrated components in the signal processing, we minimize the electronic noise. Furthermore, this processor integrates real-time clock (RTC), WatchDog Timer (WDT), Power-on reset (POR) and brown-out detection (BOD), needed and helpful for ensuring the continuous operational state, while having enough performance (48 MHz 32-bit ARM® Cortex®-M0+) and integrates a 32 KHz ultra-low-power internal oscillator for providing ultra-low power sleep modes among measurements.
The use of the SIGFOX network for coastal coverage allows reduced energy consumption and costs for connected devices. SIGFOX network is a worldwide cellular connectivity network focused on the Internet of things (IoT), a low-capacity, low-power network with worldwide coverage (in antenna proximity) using public radio frequencies (Mekki et al., 2019). These public radio frequencies (ISM Bands) have a regulation on the allowable usage (duty cycles). In Europe ETSI regulation allows sending messages during 1% of time per hour (36 seconds) which translates in a total of 140 uplinks of 12-byte packets of information per day, i.e., a message every 10.5 minutes. The communication is bi-directional, allowing the device to receive packets of up to 8 bytes from the network and thus offering the possibility to remotely modify the configuration of the device (sampling frequency, resolution, storage and sampling frequency in microSD). The small payload and low protocol overhead is key for maintaining a very low power consumption and allowing about 3 years of full autonomy without replacing batteries in a contained instrument size.
The MCP3424 Series Analog-to-Digital Converters (ADC) used for voltage measurement and analog to digital conversion fulfills our requirements while helping to contain consumption. The devices include an input channel selection multiplexer (MUX) which account for the 4 channels, a programmable gain amplifier (PGA) with a good linear response, an on-board voltage reference, and an internal oscillator. It offers 18-bit conversions with high accuracy and low noise, and makes self-calibration of internal offset and gain per conversion which prevents errors from temperature or power supply variations.
The power supply for the instrument is provided by a removable battery module of 6 D-type alkaline batteries. Two of these batteries are connected in series to obtain +3V, which are raised to 3.3V by means of a step-up regulator and then used to feed all the electronic components. The other 4 D-type batteries are connected in series in a -3V – Ground – +3V scheme, and then also raised to -3.3V – Ground – +3.3V to power the SURCOM sensor system. The different devices connected to MCU are powered by programmable pins, which enables them to be disconnected by deep sleep routines during sleep periods, thus minimizing power consumption for sleep periods of ~10.3 minutes.
The firmware developed and embedded in the MCU performs the acquisition of 11 raw readings of voltage values from the pH sensor with a frequency of 0.3 s-1 and 18-bit discretization through the analog-to-digital converter module. The median value of these measurements is stored on the internal microSD card. Median voltage values of pH and temperature of external probe are also packed for uplink to the Sigfox network. As the payload of a Sigfox message size is limited to 12 bytes, measurement values are bit-encoded according to precision and packed into bitfields to minimize the payload and allow for the inclusion of further sensors.
Prototype setup
The Arduino MKR 1200 was chosen for our prototype as it comes with our choice of hardware for MCU and communications, the SAMD21 ATMEL MCU and the ATA8520 ATMEL Sigfox communications device. As the MKR Series is designed for professional applications, it’s easy to avoid the extra Arduino components of the MKR1200 allowing a raw usage of MCU and communications device as it could be done in an own designed board. A custom-built breadboard with MKR shield form factor was then built for integrating the remaining electronic devices, such as the ADC converter and microSD slot.
Uplink radio messages are received by the SIGFOX radio network, which provides a backend that serves as a gateway for Internet communications. Upon reception of a message, a callback API is then used for transmitting that message to our own managed servers, which do the processing of the message, computing pH and temperature values and storing them in a time-series database system. Preliminary quality control (QC) checks and calibrations are also performed at this step. This information is then presented through an open-source panel (Grafana Labs), which can configure different access permissions, display options and alerts
Days before deployment, the equipment is activated and sealed in our laboratory and kept in a seawater tank. The commissioning of the system consists solely in removing the cover that keeps the pH sensor wet and verifying the data reception. The upper part of the equipment must be kept exposed to the air, above the surface water layer to allow data transmission, the lower part must be permanently submerged to avoid the presence of air bubbles in the sensor that could cause anomalies in measurements. The pH measurements of the probe are, so, taken at a depth of about 0.7-0.9 meter.
The SURCOM was deployed on the floating platform described above (Figure 1) from July 8, 2020 to March 6, 2021. The pH sensor was located at about 0.8-meter depth from the surface and was wrapped with a copper wire mesh at its submerged end to prevent the development of biofouling (Figure 2). Biomass accumulation on the surface of the equipment was routinely removed with a monthly maintenance and cleaning of the complete mooring by CETMAR.
Discrete carbon system measurements
Discrete duplicate samples of pH, total alkalinity (AT) and salinity were collected in a 2L Niskin bottle in the proximity of the SURCOM and at its same depth before and after the maintenance and biofouling minimization operations.
Discrete pH was quantified spectrophotometrically at 25 °C by using m-cresol purple indicator dye scale following Clayton and Byrne (1993). The pH values were reported on the total pH scale (pHT) at 0 dbar of pressure and both at 25 °C and in-situ temperature, following the same procedures of GLODAPv2 (Lauvset et al., 2021). The precision of the spectrophotometric measurements was ±0.003.
The seawater AT was measured following Pérez and Fraga (1987a) and Pérez et al., (2000b) with an analytical error of 2 μmol·kg-1 and a precision of 0.1%. Certified reference material (CRM) was used to ensure accuracy.
The salinity was determined with an Autosal 8400A inductive salinometer calibrated with normal IAPSO water, whose estimated analytical error was 0.003, using the equation of practical salinity given by UNESCO (1981). The correlation between salinity and AT was very high (N=14; AT = 59.67±1.43 * S + 208.84±37.90; r2 =0.99) (Figure 3, inner panel)
Figure 3

Spectrophotometric pH values from discrete samples versus calibrated pH values taken from SURCOM sensor and AT versus salinity values (inner panel) measured in discrete samples taken during the SURCOM sensor mooring. Linear regression equations, the number of samples (N) and the coefficient of determination (r2) of both x-y plots are included.
Duplicated sample measurements of pH were averaged prior conversion at the in-situ temperature measured by the thermistor of the SURCOM. CO2SYS (Lewis and Wallace, 1998) for MATLAB (Sharp et al., 2021) and python (Humphreys et al., 2022) were used for carbon calculations, with pH and AT as inputs. The conversion was conducted with the carbonate dissociation constants of Lueker et al. (2000) for waters with salinity higher than 20 and Waters et al. (2014) for the salinity range between 0 and 20, the equilibrium constant for hydrogen fluoride and hydrogen sulfate followed Perez and Fraga (1987b) and Dickson (1990), respectively, and the borate-to-salinity ratio formulated by Uppström (1974).
The in-situ degree of aragonite saturation was also estimated to track the acidification in the inner surface waters of the Ría de Arousa as this is one of the more soluble forms of calcium carbonate (CaCO3) and is widely used by marine calcifiers to build their skeletons and shells. Calculation was done with the CO2SYS toolbox using the in-situ measurements of pH, AT estimations from in-situ salinity measurements and the same set of constants indicated above.
Laboratory validation
Before deployment, sensor sensitivity verification was performed in the laboratory for 11 days of May in 2020, using two tanks of seawater equilibrated with two different CO2 concentrations, namely 358 ± 2 ppm and 1600 ± 1 ppm that were measured with a non-dispersive infrared gas analyzer with a ±1 ppm resolution (Biogeosciences LiCOR model 850). Equilibration between the water and CO2 gas mixture was accomplished by bubbling air directly into the water through a diffuser. The low CO2 tank had a temperature of 15.25 ± 0.21°C while the water in the high CO2 tank was heated to a fixed temperature with an electrical resistance showing a value of 18.07 ± 0.04°C. Two SURCOM instruments recorded the pH and temperature of both tanks every minute (N=16893) showing practically constant values of 8.004 ± 0.003 and 7.517 ± 0.007 during these 11 days, with a high sensitivity to the minimal temperature changes observed. Figure 4 shows a 12-hour period extracted during the validation of the sensors, where it can be highlighted the high sensitivity of the SURCOM instrument to changes in CO2 concentration and temperature as well as the low noise of the ISFET sensor and the electronics assembly of the SURCOM.
Figure 4

Laboratory validation of SURCOMs under controlled conditions, a 12h period is shown. (A) shows the xCO2 (ppm) on low CO2 tank, with (B) showing the temperature and pH from the SURCOM during that period. (C) shows the xCO2 (ppm) on high CO2 tank, with panel (D) showing the temperature and pH from the SURCOM during that period. As it can be seen pH measurements are constrained under ±0.001, demonstrating the high sensitivity and low noise of the system.
Acquisition and preliminary quality control
The instrument took a total of 32182 measurements during the deployment with a period of 10.5 minutes, which were transmitted in real-time through SIGFOX network and collected on our servers. The quality of data transmission, based on a link quality indicator (LQI), was rated as good (29%), fair (70%) or poor (1%). The dataset for this study is accessible through Velo et al. (2022). The original data were quality controlled and values flagged as bad based on two criteria:
a) pH measurements during reconditioning of the SURCOM after sensor cleaning and instrument maintenance were rejected (typically about 30 minutes);
b) identification of apparently unexplained pH values was discarded if measurements exceeded ±2 standard deviations from the median value for a time interval corresponding to the tidal period (12.25 hours). Following this first quality control process to ensure reliable results, 720 measurements were flagged as unusable data points, representing 2.25% of the entire SURCOM record (Figures 5, 6). The erroneous measurements were removed from the final dataset before comparison with the spectrophotometric pH measurements of the discrete samples, in order to estimate the uncertainty and drift corrections for pH measurements.
Figure 5
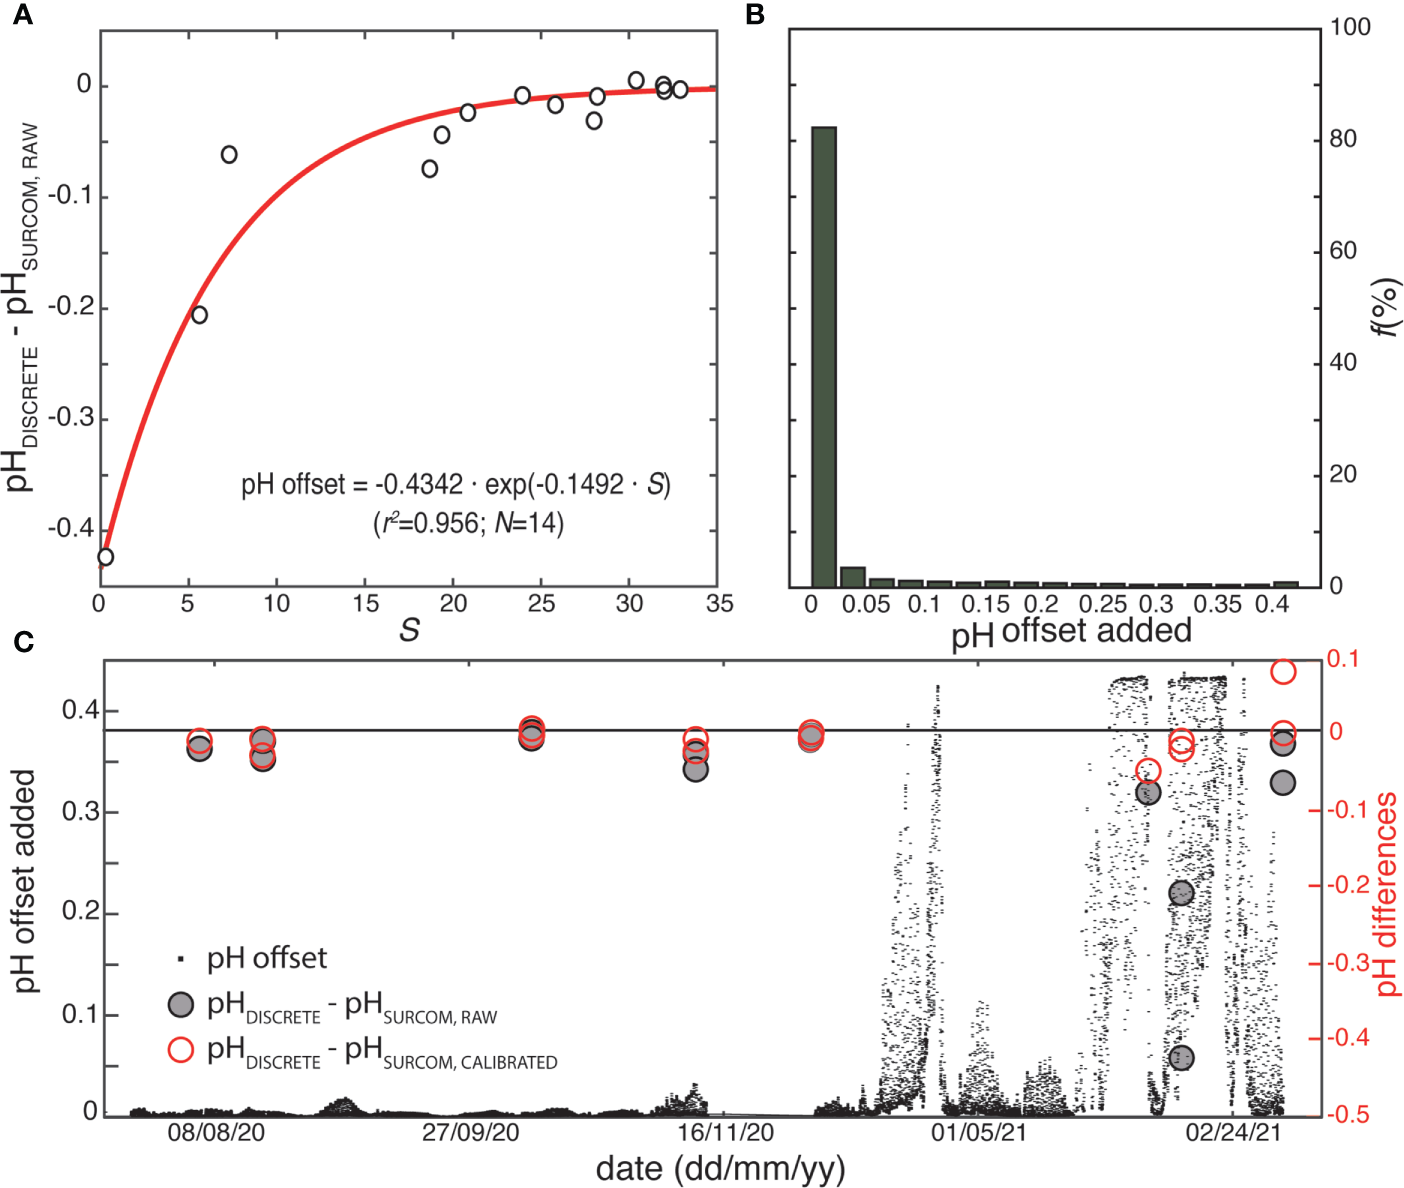
(A) Differences in pH between discrete samples and raw SURCOM values (as converted from volts) fitted to an exponential equation for the estimation of the pH offset as a function of salinity, including determination coefficient (r2) and number of samples (N). (B) Percentage of pH adjustments values added as offset for calibrating raw SURCOM pH. (C) pH calibration offset added to SURCOM raw values (black dots) throughout the study period including the differences between discrete samples and raw SURCOM pH values (dark circles) and the differences between discrete samples and calibrated SURCOM pH values (red circles).
Figure 6
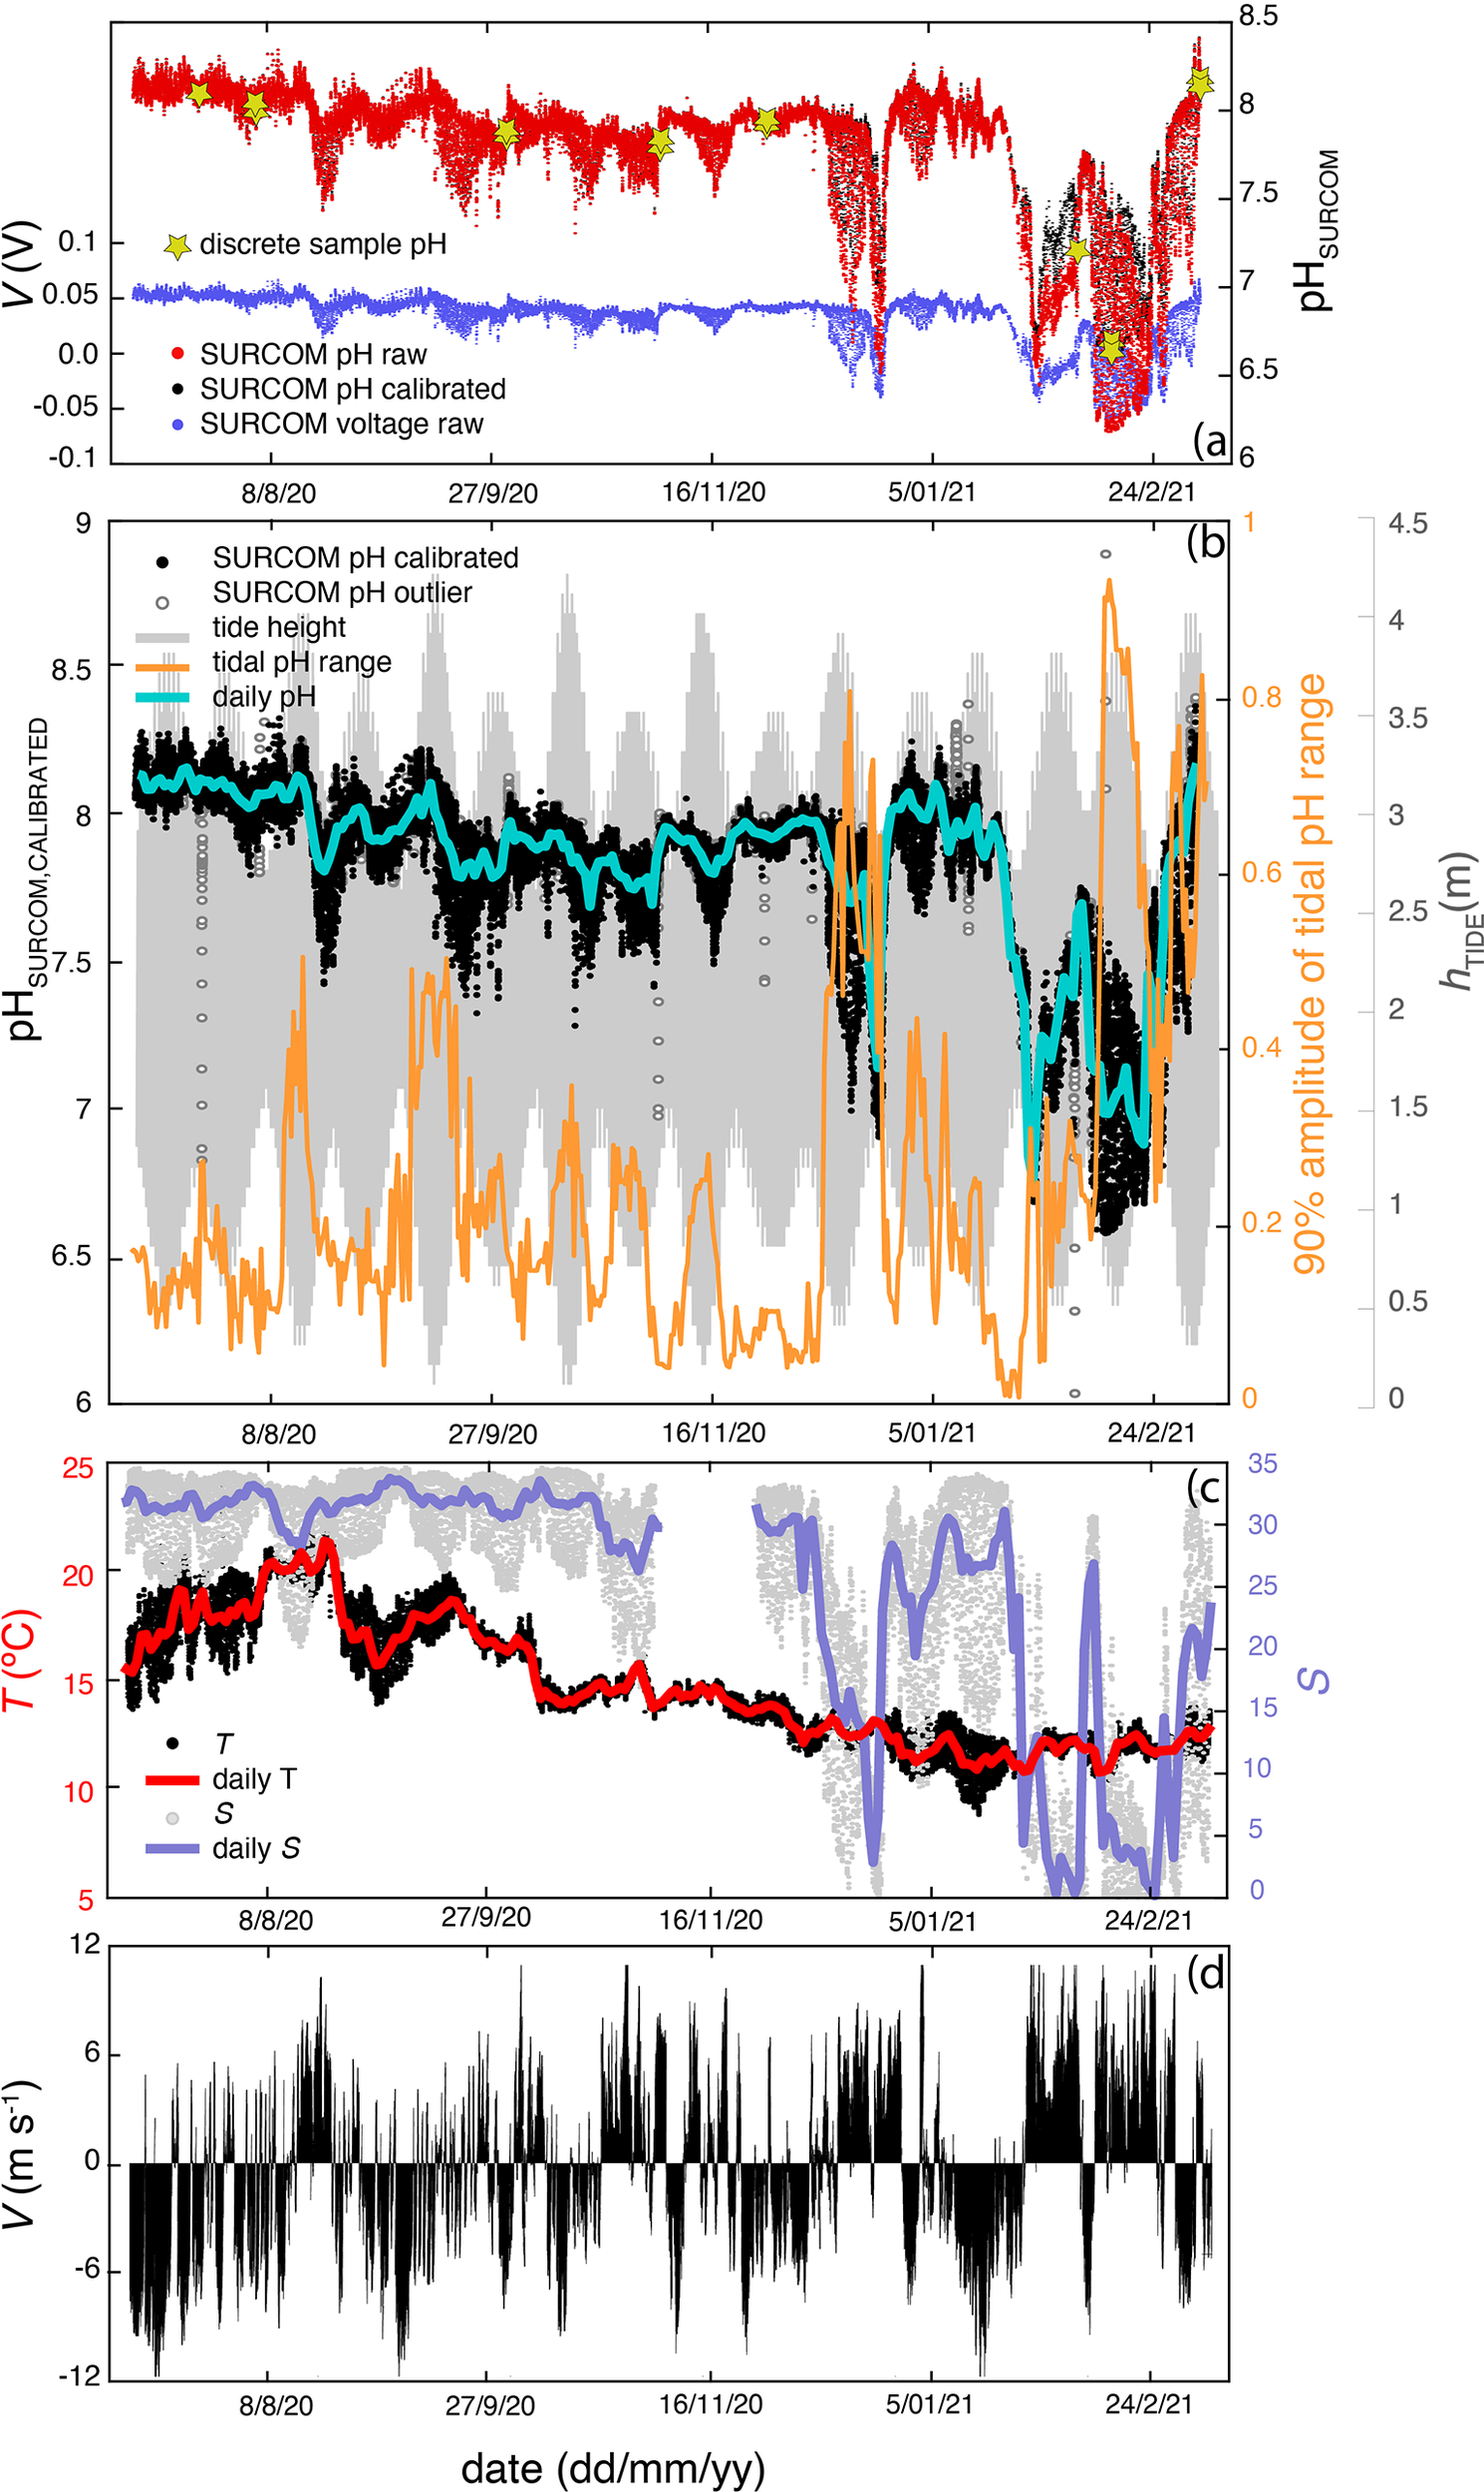
Time series of measurements with a frequency of 10.5 minutes gathered from July 8, 2020 to March 6, 2021 at the mooring station. (A) raw voltages from SURCOM (blue dots), raw SURCOM pH (red dots), calibrated SURCOM pH (black dots) and pH values of discrete samples used for calibration (yellow stars). (B) pH calibrated values from SURCOM (black dots) and outliers (white dots) after pH quality control. The daily mean calibrated pH values (cyan line), the tidal height (gray line) and the pH range between the 5th and 95th percentile during each tidal cycle (orange line) are also plotted. (C) Temperature measured by the SURCOM sensor (black dots) and salinity (gray dots) obtained with a CTD instrument at a depth of 1 meter in same mooring line. The daily mean temperature (red line) and salinity (blue line) are also shown. (D) Meridional component of wind speed V.
Calibration
The voltage (V) readings acquired directly from the pH sensor (VSURCOM,raw) were converted to pH (pHSURCOM,raw) using the Nernst equations and corrections described in Bresnahan et al. (2014) that relate pH to voltage and temperature. The initial reference voltage for calibration (E025) according Bresnahan et al. (2014), was computed as a single, constant value for the entire study by relating it to the discrete sample values of pH. The selected SURCOM pH measurements were the closest in time to the collection of the 14 discrete samples. Spectrophotometric pH values (pHDISCRETE) and raw pH from the SURCOM instrument (pHSURCOM,raw) exhibited remarkable consistency in waters with salinities above 25, reproducing the known minimum drift over time in oceanic conditions (Martz et al., 2010; Bresnahan et al., 2014; Takeshita et al., 2014; Martz et al., 2015a). However, the sensor response in waters with salinities below 25 presented increasing anomalies affected by salinity reduction (Figure 5A). Therefore, a correction for the raw pH data was implemented as an inverse exponential function in relation to salinity, that allows us to maintain a quasi-constant offset in oceanic conditions and improve the pH accuracy in low salinity waters (Eq. 1; Figures 5B, C).
The pH corrections added to the SURCOM pH values throughout the study period were in the range from 0 to 0.45, being lower than 0.025 for 82% of the measurements (Figure 5B). The discrete samples and SURCOM calibrated (pHSURCOM,calibrarted) measurements showed a linear relationship with a coefficient of determination (r2) of 0.99 (Figure 3) and pH difference of ±0.029 (std). The value of 0.029 is considered the uncertainty of the SURCOM instrument.
Results
The seasonal variability of pH values presented maximum values during July and the first days of March, when the absolute maximum pH of 8.41 was measured. In contrast, minimum pH values of 6.60 were measured during January and February (Figure 6A). This seasonal variability of pH values closely followed salinity changes, as can be seen in the matrix of correlation plots (Figure 7). This direct relationship was more pronounced when fresh water with salinity of 0.1 and minimum pH values filled the surface of the inner Ría de Arousa (Figure 6B). Other salinity oscillations of lower intensity observed throughout the study period also revealed the direct relationship with pH changes (Figure 7A). Surface water temperature, with a maximum of 22.3°C in August and a minimum of 9.9°C in January exhibited also a direct correlation with pH variability but less evident than that shown by salinity variability (Figure 7A).
Figure 7
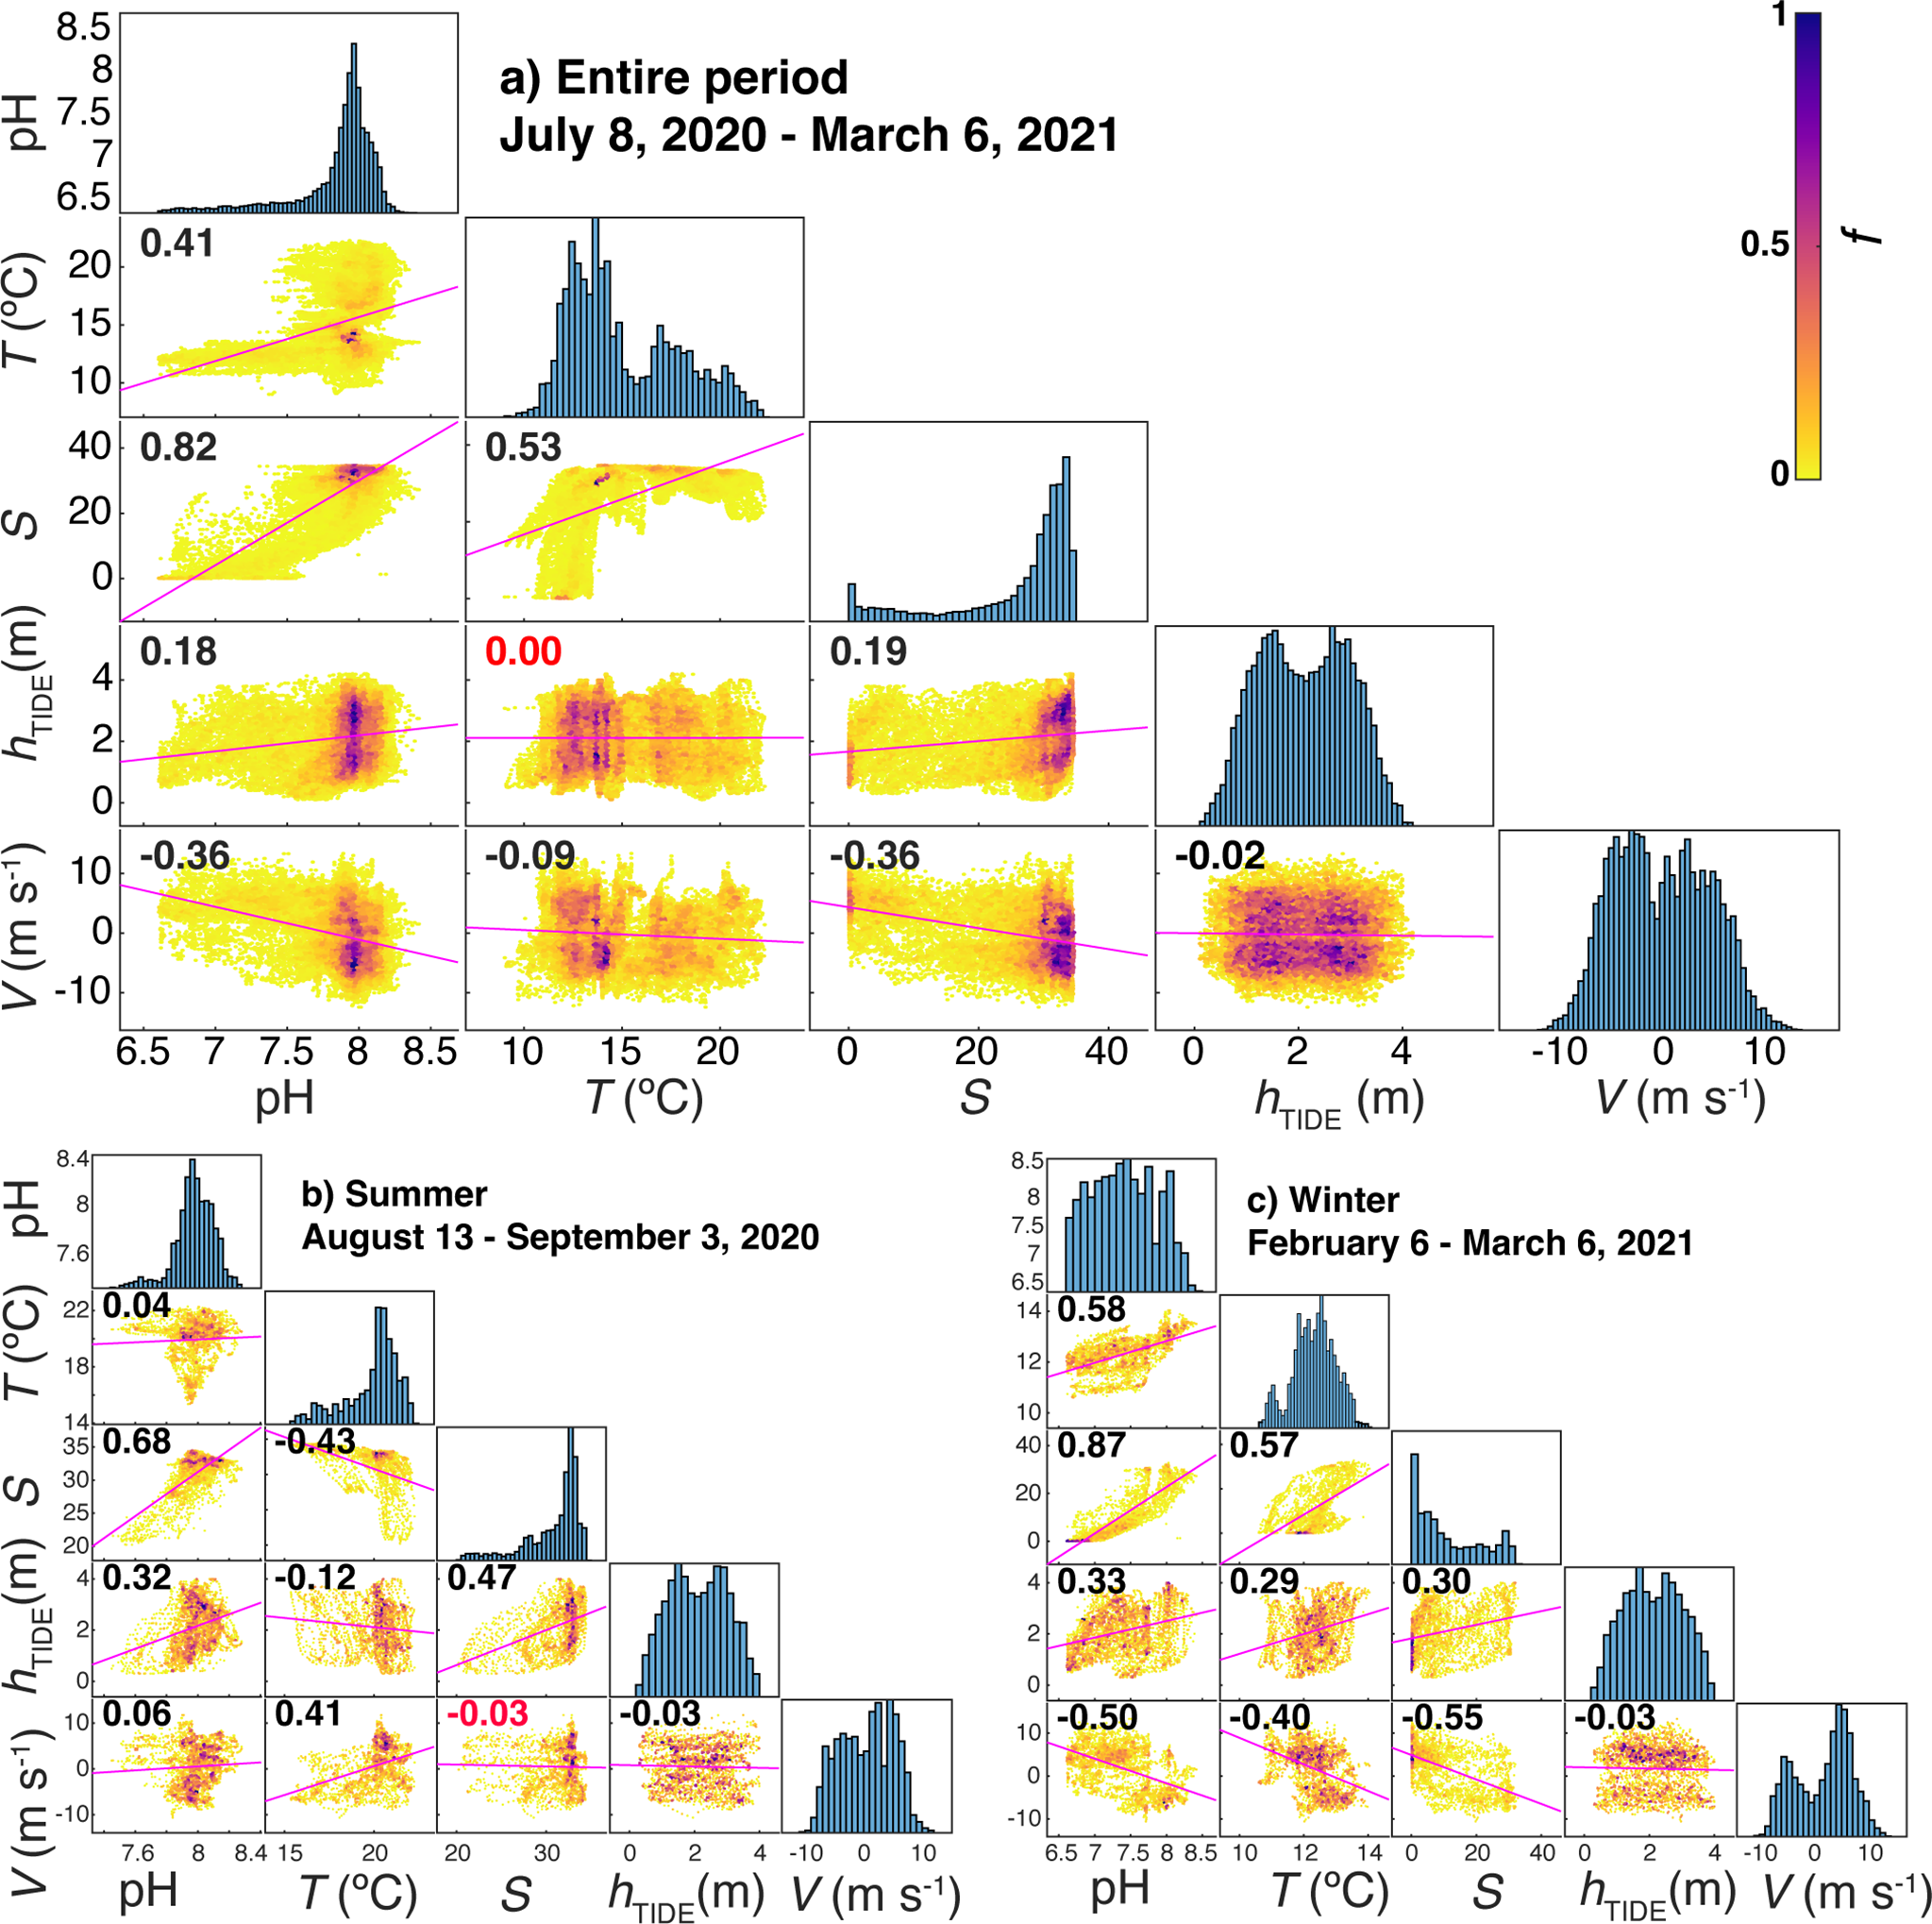
Correlation plot matrices between pH, temperature (T), salinity (S), tide height (hTIDE) and the meridional component of the wind speed (V) during full period of the study (A), summer (B) and winter (C) with p-value<0.01. Color in scatter plots represent frequency of occurrences (heatscatter) following the colorbar on the top-right, with f being the frequency from 0 to 1 for the highest bar in the histogram. The correlation coefficient value is presented in each box, with red color for non-significative ones.
On the opposite, the meridional component of wind speed generally presented a negative relationship with pH oscillations with the exception of summer, when northerly winds were related to the decrease in temperature and, in a less evident relation, to the decrease in pH (Figure 7B). The southerly winds that prevailed during the winter period caused the presence of warm waters of low salinity and minimum pH values in the interior of the estuary (Figure 7C). This period was characterized by very abrupt changes in salinity and pH, and to a lesser extent also in temperature, following the alternation between the meridional component of the wind. Thus, a brief event of northerly winds in period dominated by southerly winds (January 15th - February 25th) caused an increase of 20 in salinity and 0.5 in pH (Figure 6).
The variation in tidal height between spring and neap tides also directly impacted the variability of pH but not the mean pH values at a time scale that exceeded tidal periodicity. The effect of tide on pH was analyzed from the tidal pH range estimated as the pH difference between the 5th and 95th percentile observed during a tidal period (12.25 hours) throughout the study period (Figure 6A). The tidal amplitude of pH, with a mean value ( ± standard deviation) of 0.22( ± 0.16), reproduced the oscillation between spring and neap tides every 13.6 days corresponding to half the length of the lunar cycle. The maximum tidal range pH value of 0.92 was observed on February 12th during spring tides and low salinity periods, while the minimum variability of 0.10 was observed on January 20th during neap tides in high salinity waters. It should be noted that the mean value of 90% of the pH range amplitude was 6 times higher than the accuracy of the SURCOM instrument ( ± 0.029). In addition, 86% of the tidal periods monitored by the SURCOM showed a 90% pH amplitude that was at least three times higher than the estimated accuracy.
SURCOM performance was also analyzed on a short time scale (Figure 8) from 2 hour average bins of pH and other supplementary parameters during two periods: summer (Figures 8A, C, E); August 13th - September 3rd) and winter (Figures 8B, D, F); February 6th - March 6th. The variability of mean pH values directly followed tidal height, which ranged from 1 to 3.5 m over 12.25-hour periods, showing the amplification (minorization) described during spring (boreal) tides. Salinity values that also paralleled tidal height showed a stronger correlation with pH measurements throughout the study period (Figure 7A). Summer pH values showed a weak correlation with temperature while winter pH changes did follow temperature oscillations (Figures 7B, C). The meridional component of wind V (Figures 8E, F) was inversely linked to salinity, temperature and pH variations during winter (Figure 7C; Figures 8B, F). However, the meridional wind component during the summer exhibited only a clear direct control on surface temperature as observed in the cooling of the surface waters between August 28th and September 3rd under northerly winds (Figure 7B) or in the warming found during a southerly wind event during the second half of August (Figure 6).
Figure 8

2-hourly mean bins during summer 2020 (left panels: (A, C, E) and winter 2021 (right panels: (B, D, F) of pH and temperature (TSURCOM upper panels: A,B), salinity (S) and tide height (hTIDE) (center panels: (C, D) and wind vectors (V bottom plots: (E, F).
Based on the pH variability measured by the SURCOM, salinity associated with tidal wave displacement or river discharge is the main factor controlling pH values in the interior of the Ría de Arousa. According to Figure 3B, salinity changes also controlled the variability of AT. The linear relationship between these variables showed a very high coefficient of determination of 0.99 that points to a behavior of AT as a quasi-conservative variable explained by the mixing between freshwater from the Ulla River and seawater. Thus, the range of estimated AT goes from 215 μmol·kg-1 when freshwater flooded the interior of the estuary to 2300 μmol·kg-1 for waters of maximum salinity of 35.1. Knowing the strong direct relationship between salinity and AT, the maximum tidal ranges of pH observed during spring tides were related to the amplification of AT variability while the decrease in AT during winter events of minimum salinity extremes were linked to the more acidic waters of the interior of the Ría de Arousa.
The saturation state of aragonite (ΩAr) is commonly used to track ocean acidification and connect seawater chemistry with biological activity, specifically the solubility of biogenic calcium carbonate (CaCO3) structures. This parameter was calculated from the pH data measured by the SURCOM and the estimated AT, to determine the corrosivity of the inner surface waters of the Ría de Arousa. Corrosive waters for CaCO3 structures have values of saturation state of aragonite less than one unit (ΩAr<1). This parameter was calculated from daily means of pH measurements from the SURCOM sensor and estimates of AT.
A maximum ΩAr of 2.64±0.21 was obtained in August, while a minimum ΩAr of 0.01 calculated in February (Figure 9). Waters with salinity values lower than 20 or waters with a temperature lower than 13 °C were undersaturated in carbonate and calcium ions (ΩAr<1). The presence of these waters occupied the interior of the estuary during most of the winter days, covering the entire February. In summer, the surface waters with values above the salinity and temperature thresholds were supersaturated with respect to calcium and carbonate ion concentration (ΩAr>1).
Figure 9
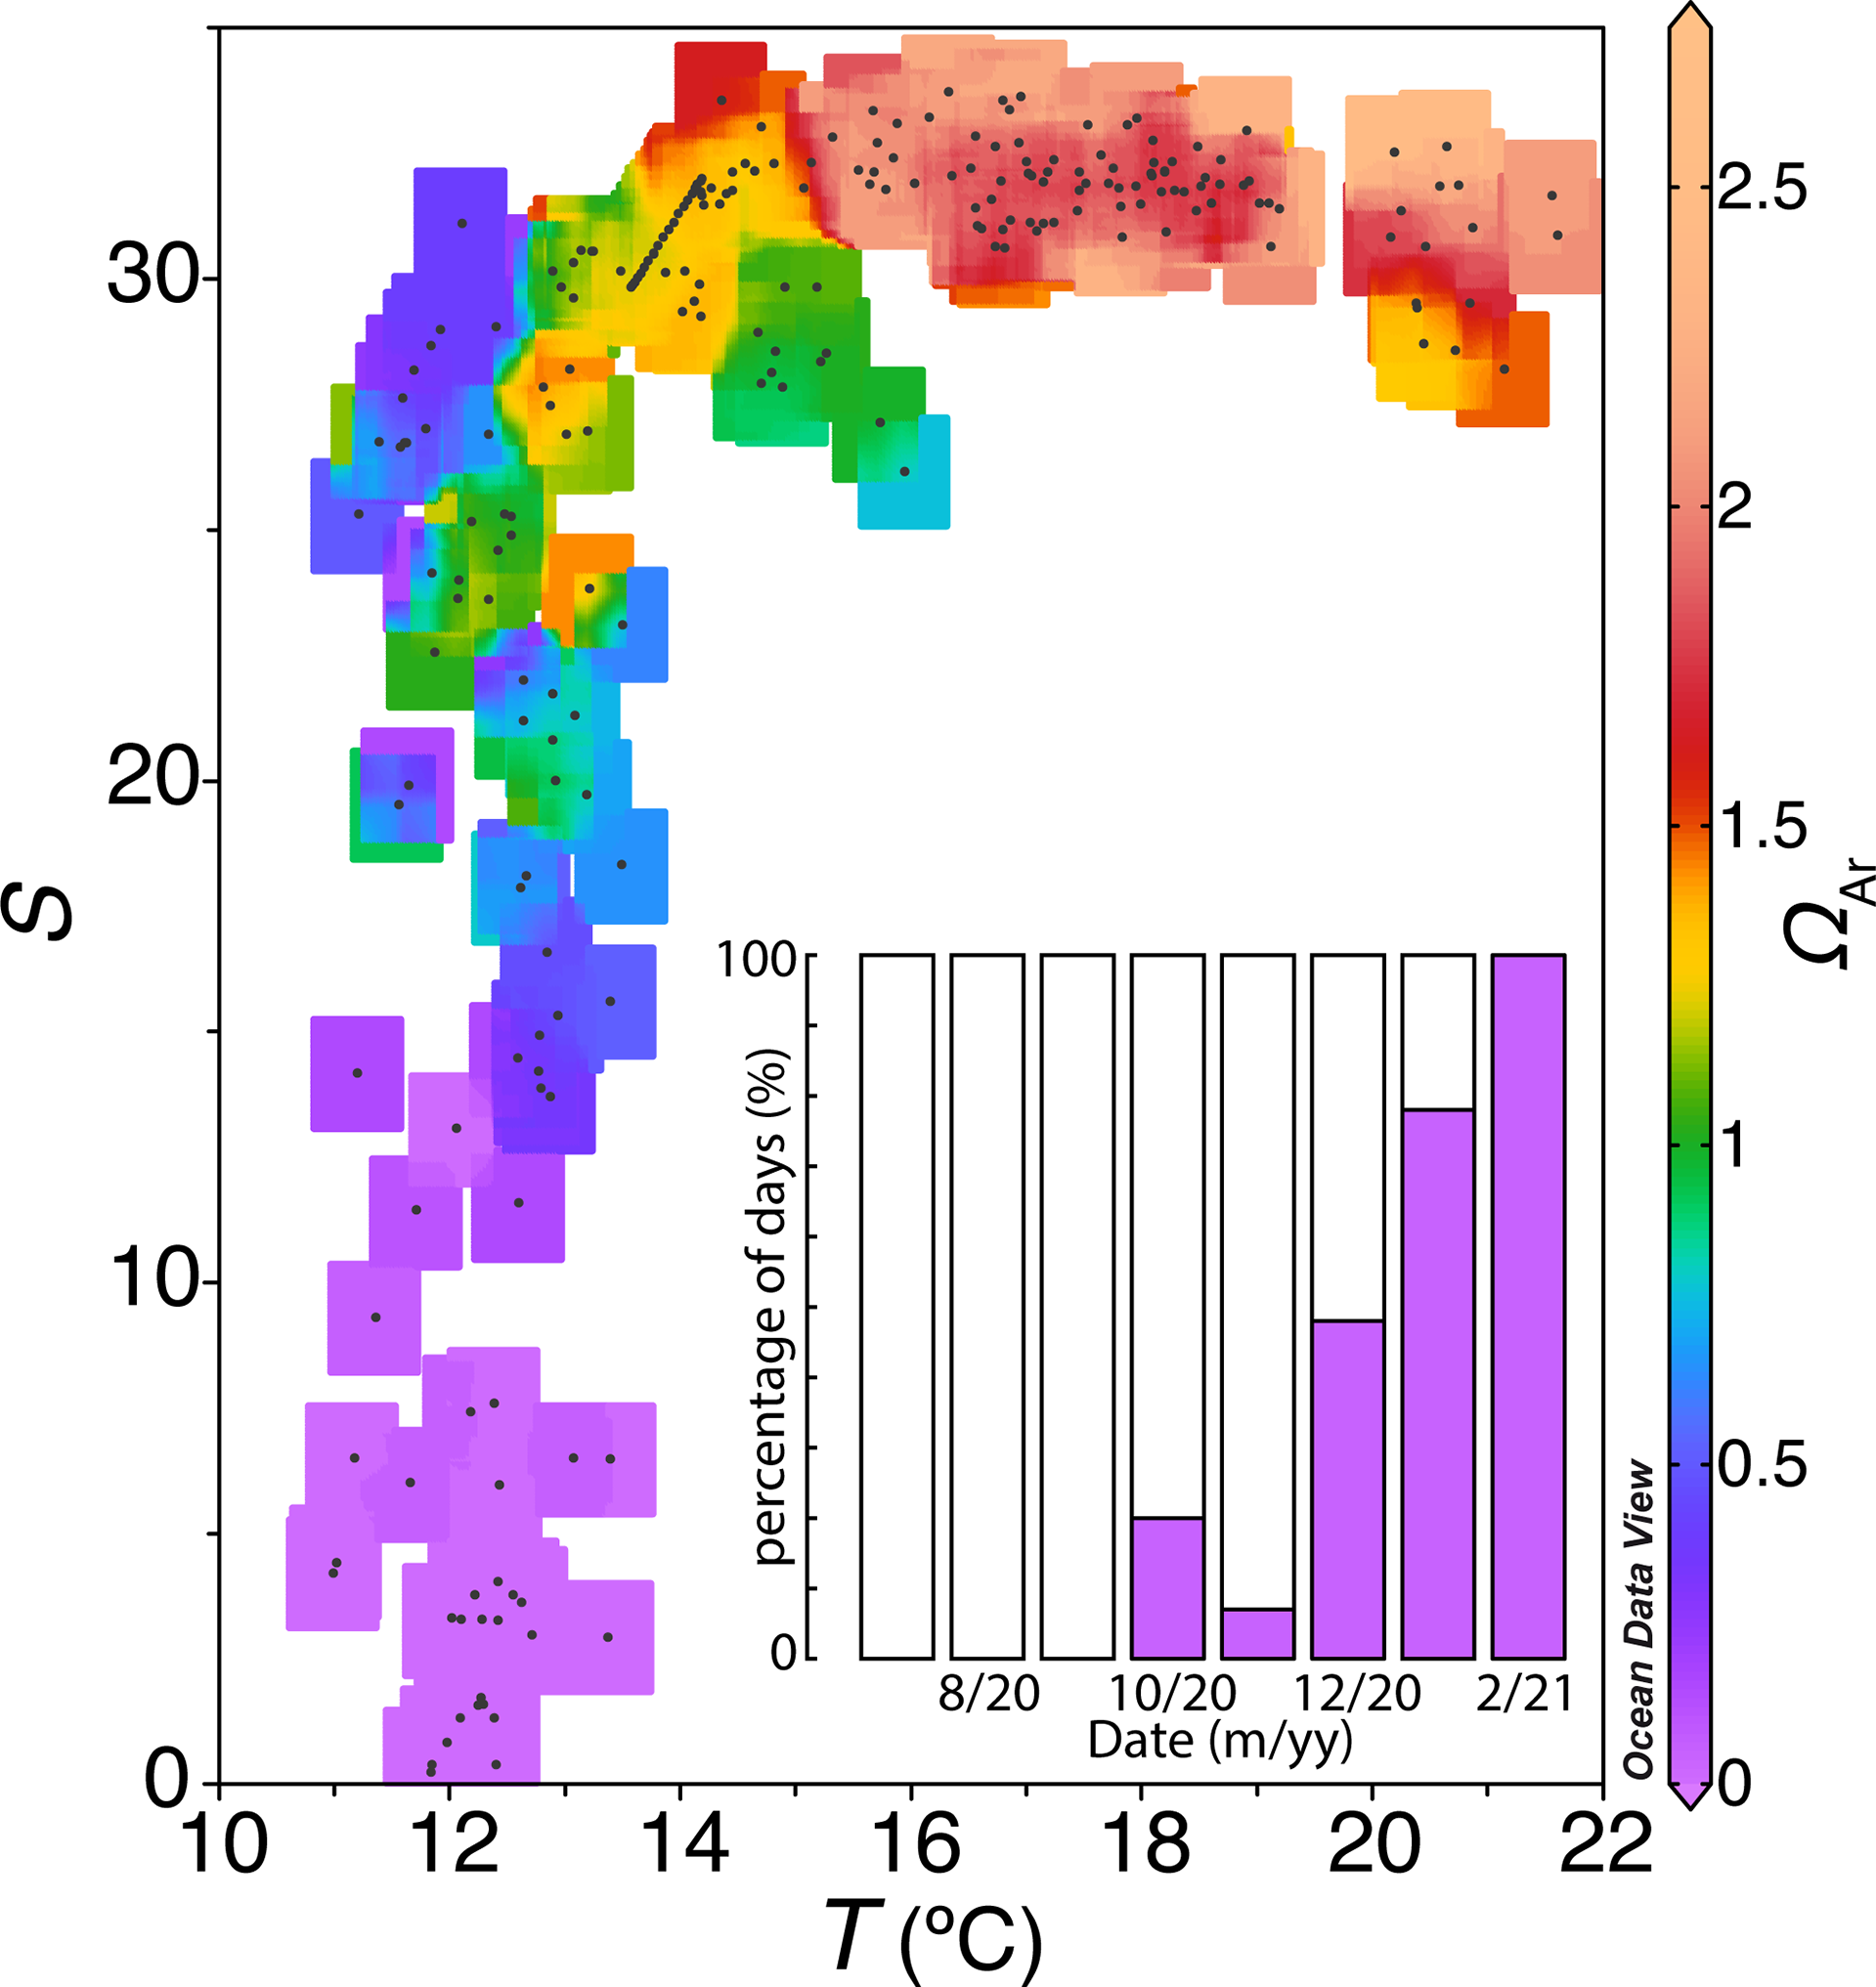
Daily averages of salinity versus temperature with colors indicating aragonite saturation status and the percentage of days with aragonite unsaturated water for each month (purple bar).
Discussion
During the last decades, biogeochemical changes and significant trends in the variability of marine resources in the coastal waters of the Galician upwelling system were reported and linked to changes in the long-term variability of the coastal upwelling and climate change (Álvarez-Salgado et al., 2008; Bode et al., 2009; Pérez et al., 2010; Pardo et al., 2011). Among these findings, acidification of Galician coastal waters was also reported from the ARIOS dataset (Pérez et al., 2020), which collects discrete pH measurements from oceanographic cruises conducted from 1976 to 2018. These data have shown that acidification is being particularly intense in the most inner waters, doubling the interannual decrease in pH observed in the ocean. Despite the socioeconomic importance of the Ría de Arousa which is mainly based on the production of calcareous shelled mollusks (mussels, clams and cockles) only 16% of the discrete measurements of the ARIOS dataset were made in this estuary. This poor coverage of pH data in the Ría de Arousa makes it difficult to understand the significant role of the intense CaCO3 shell production in the variability of pH and AT of the inner waters of the Ria de Arousa together with the effect of other local factors (river discharge, estuarine circulation, coastal upwelling, ecosystem metabolism…). For these reasons, the Ría de Arousa was selected as a mooring site to validate the performance of the analytical and operational capabilities of SURCOM following the recommendations to use autonomous devices to monitor acidification in coastal environments (Newton et al., 2015; Tilbrook et al., 2019).
SURCOM pH sensor performance
The consistency of the uncertainties during these 240 days of deployment, confirmed the known high stability and sensitivity of the instrument sensor (Martz et al., 2015b; Johnson et al., 2016) and the adequacy of the cleaning and calibration protocol. The differences between the SURCOM pH calibrated values and 14 discrete pH samples measured in the laboratory revealed a standard deviation of ±0.029 which was interpreted as the precision of the instrument and is within the range found in similar coastal studies using Durafet sensors in dynamic environmental conditions (McLaughlin et al., 2017; Gonski et al., 2018). This uncertainty, in addition to the limitations inherent to the pH sensor, which was extraordinarily robust and accurate in laboratory tests (Figure 4), is also result of the inaccuracy associated with the spectrophotometric measurements (Carter et al., 2013), estimated at 0.003 based on replicate measurements, but also to the water sampling and especially the impact of the environmental dynamics on the measurements (biofouling, changes in salinity and temperature, etc.). In this sense, the anomalies between discrete samples and the SURCOM calibrated pH values were higher towards the end of the study period (Figure 5), coinciding with the abrupt changes in salinity and the high pH variability throughout the tidal cycle (Figure 6). The calibration used as a function of salinity significantly corrected the worsening sensor response in that low salinity events, which probably lacks enough conditioning time (Bresnahan et al., 2014) in an environment of such rapid changing in haline characteristics. These circumstances prevented the analysis of a possible drift over time on the sensor response, that is described as minimal in oceanic conditions (Martz et al., 2010; Martz et al., 2015a; Bresnahan et al., 2014; Takeshita et al., 2014), as was observed during summer and autumn were salinity values were higher than 20. Detection and evaluation of the SURCOM instrument drift within an estuary with this thermohaline variability would require a longer monitoring period, presumably covering at least one complete seasonal cycle, thus allowing to evaluate the evolution of the sensor when revisiting periods with similar thermohaline conditions.
A better analysis of the sources of uncertainty could be approached by deploying an observational mesh of SURCOM sensors over a more long period, that would allow to improve the correction of the impact of the large spatial and temporal variability of these environments, and also to apply different quality control techniques (McLaughlin et al., 2017). In any case, the precision of the SURCOM instrument was comparable to the performance of commercial pH sensors found in similar coastal implementations (Hoppe et al., 2012; Wootton and Pfister, 2012; McLaughlin et al., 2017; Gonski et al., 2018; Miller and Kelley, 2021). Moreover, this uncertainty of ±0.029 is in the range of magnitude to 0.02, an acidification measurement criterion that distinguishes “weather” quality datasets (Newton et al., 2015) proving the potential suitability of this sensor for studies at this level of quality (Gonski et al., 2018) once we gain increased expertise in the equipment and protocols (McLaughlin et al., 2017).
The deployment of the SURCOM described in this work was the first mooring in Galician coastal waters in which high frequency pH measurements were made for months. The resulting data set revealed particular characteristics of pH variability in surface waters that had not been previously described. The minimum and maximum pH values of 6.60 and 8.41, respectively, exceeded the pH range between 7.06 and 8.41 from discrete samples taken in the surface seawater collected by the ARIOS database from 1976 to 2018 (Pérez et al., 2020). The SURCOM pH measurements showed two periods of maximum values in July and in March.
These high pH values were observed despite the entrance of cold water with low pH values (Borges and Frankignoulle, 2002; Gago et al., 2003) in Ría de Arousa driven by northerly winds. The station at Cortegada platform seems to be separated from the upwelling processes occurring on the shelf and the outer estuary (Rosón et al., 1999) in spite of the fact that the inner estuary may also be an extension of the continental shelf during certain upwelling events (Doval et al., 1997; Nogueira, 1997; Nogueira, 1998; Álvarez-Salgado, 2000) The maximum pH values measured in March repeated the annual pH maximum described in the Ría de Vigo (Padin et al., 2020; Broullón et al., 2021) linked to the spring phytoplankton bloom that can generate important pH variability in shallow coastal waters (Borges et al., 2010; Hofmann et al., 2011). It should be noted that this pH maximum was obtained despite not monitoring most days in March or the period between April and June. Therefore, pH values throughout the seasonal cycle in these waters could be even higher attending to the still increasing trend of pH data at the end of the study period (Figure 6, Figure 8) and the fact that the spring phytoplankton bloom in the interior of the estuary extends throughout March (Padin et al., 2020; Broullón et al., 2021).
In contrast to the highest pH values, the lowest pH values measured in winter in the Ría de Arousa did not coincide with the minimum pH of the seasonal cycle estimated for the surface inner waters of the Ría de Vigo. These low pH values estimated from the ARIOS database (Pérez et al., 2020) were found between August and November coinciding with the minimum values of oxygen concentration and salinity higher than 33 (Padin et al., 2020; Broullón et al., 2021). Benthic respiration (Alonso-Pérez and Castro, 2014) and resuspension of organic matter from the sediment (Rosón et al., 1999) following the breakdown of summer stratification of the water column were identified as possible causes of these low pH values. The pH decrease events were also found during the summer and autumn in the Ría de Arousa under southerly winds, when the piling-up of shelf waters at the mouth of the estuary increases the residence time of the inner waters and enhances the impact of water-sediment fluxes on the pH of the water column (Pérez et al., 2000a). The absolute pH minimum measured in the interior of the Ría de Arousa during February also occurred during southerly wind events and, therefore, under the blockage of the horizontal circulation in the estuary generated by downwelling events (Barton et al., 2016). Freshwater flooding of the interior of the Ría de Arousa produced during the isolation of this inner area brought the pH to minimum values significantly below of those observed in the Ría de Vigo (Barton et al., 2016). The fluvial discharges from the Ulla River, the largest of the rivers with direct discharge into the Galician estuaries (Parada et al., 2012) and the Umia River (Alvarez et al., 2005) are three-fold the continental inputs of the Vigo estuary (Otero et al., 2010) and have a drainage basin nine-fold larger. These fluvial discharges are characterized by the acidity of their waters, so that the pH of 6.6 measured with a salinity of 0.1 is practically the pH end-member of the river Ulla. In addition, the influx of dissolved and particulate organic matter from riverine inputs converts these nearshore areas into systems dominated by heterotrophic processes and highly CO2 oversaturated (Bakker et al., 1997; Frankignoulle et al., 1998; Borges and Frankignoulle, 1999; Brasse et al., 1999; Hoppema et al., 1999; Gago et al., 2003). Another notable difference between the inner region of both estuaries is the sediment composition. Muddy sediments that characterize the more enclosed interior of the Ría de Vigo have a high organic carbon burial rate, accounting for 2-8% of the sediment (García-Gil et al., 2011). Siliciclastic sandy sediments with low organic content characterize the open waters of the interior of the Ría de Arousa. These sandy sediments are efficient bioreactors for organic carbon remineralization and thus intense heterotrophic processes would determine the pH of the water column, especially in periods of intense vertical mixing such as winter.
Biogeochemical impacts
Extreme changes in salinity in these waters resulted in strong variations in AT. This variable of the carbonic system, defined as the excess of proton acceptors over donors, represents the buffering capacity of seawater to neutralize acids. Thus, dissolved CO2 inputs are converted into stable bicarbonate and carbonate molecules to minimize pH changes. The decrease in AT causes a progressively stronger reduction in pH as the acidification increases. This effect would explain the amplification of the tidal pH range during the higher AT (salinity) variability observed during spring tides and especially during extreme low salinity events. These ranges in salinity (0.1-35.1), AT (285 - 2300 µmol·kg-1) and pH (6.6-8.4) between freshwater from the Ulla River and seawater, establish a CO2 fugacity range of 3200±244-185±18 μatm estimated at 15 °C using the same carbonic system constants (Lueker et al., 2000; Waters et al., 2014).
The pH measured by the SURCOM and the estimated AT also allowed us to evaluate the saturation state of the aragonite. (ΩAr). The inner waters of the Ría de Arousa were supersaturated with calcium and carbonate ions (ΩAr>1) in summer, allowing the precipitation of CaCO3 minerals. In contrast, undersaturated waters with respect to aragonite (ΩAr<1) associated with salinites below 20 or temperatures lower than 13°C were found occasionally in autumn and predominantly in winter. Unsaturated waters in aragonite would cause dissolution of these CaCO3 structures which is 1.6 times more soluble than calcite (Feely et al., 2008) although slight corrosion was also observed under slightly supersaturated saturation states (Ries et al., 2016). The dissolution of CaCO3 structures would be exceptionally harmful during an uninterrupted period of 54 days observed in January and February when the inner part of the estuary was flooded by strongly undersaturated aragonite waters with a mean value (± standard deviation) of 0.2( ± 0.3) for a mean pH value of 7.3( ± 0.4). This damage would be enhanced by the intense vertical mixing of this season (Gago, 2003) that would carry these corrosive waters to the shellfish beds, compromising the survival of infaunal bivalves in the inner part of the Ría de Arousa.
Ecosystems impact
A massive mortality in shellfish during the last days of February in shellfish beds (i.e., clams and cockles) surrounding the mooring station was linked to the decreasing salinity abruptly and was reported by local media. Similar mortality episodes had been previously reported in the Ría de Arousa Arousa (Parada and Molares, 2008; Parada et al., 2012; Aranguren et al., 2014). These unexpected oscillations are a challenge for species adaptation that particularly affect sessile organisms, such as bivalves, which due to their reduced mobility (Berger and Kharazova, 1997; Helmuth and Hofmann, 2001; Alves de Almeida et al., 2007). These extreme salinity events are expected to be more frequent in coastal areas (Levinton et al., 2011; Collins et al., 2020) due to heavy rainfall, as was also forecasted for the coast of Galicia (Alvarez et al., 2005; Parada et al., 2012) particularly in winter (Cardoso Pereira et al., 2020; Lorenzo and Alvarez, 2020).
Ocean acidification is another abiotic feature of the marine environment that is stressful for the marine biological community due to its capacity to dissolve CaCO3 structures (Gazeau et al., 2007). In addition to conditioning the synthesis of calcium carbonate shells and skeletons, ocean acidification also affects other effects on different physiological processes such as survival, growth, development, abundance, etc. (Tyrrell et al., 1999; Gazeau et al., 2013). Most of these studies were based on experiments for single species in the laboratory, which usually has a remarkable economic importance for aquaculture such as mussels (Fernández-Reiriz et al., 2001; Fernández-Reiriz et al., 2012; Gazeau et al., 2013; Navarro et al., 2013; Clements et al., 2018; Lassoued et al., 2019; Lassoued et al., 2021; Ramajo et al., 2021).
Like salinity, the pH variability presented here will also increase in a future ocean acidification scenario with more extreme values and greater short-term changes (Gruber et al., 2012; Hauri et al., 2013; Waldbusser and Salisbury, 2014). These abrupt pH variations observed at short scales as a result of river discharge, ecosystem metabolism and tidal effects should be included in the analysis of acidification projections in coastal waters (Jury et al., 2013). The effects of extreme variability events on biogeochemical conditions with importance in physiological and metabolic processes, such as salinity or acidification, must be analyzed integrally to deepen the understanding of the risks to the coastal ecosystem. In addition to mortality, these investigations should also focus on sublethal effects and on the impact on interspecific relationships (Waldbusser and Salisbury, 2014; Seitz et al., 2015; Rosenblatt et al., 2017; Kapsenberg and Cyronak, 2019). These studies about the extreme variability of biogeochemical conditions and their ecological impact should be especially addressed in coastal communities such as the Ría de Arousa with a high socioeconomic dependence on aquaculture and fisheries.
Conclusions
This experience was the first time that pH measurements were acquired with this time resolution on a mooring in the Ría de Arousa. The results revealed patterns of pH variability that could not have been previously observed with discrete sampling. The short-scale pH variability reproduced the tidal periodicity, with maximum values at tidal height peaks. This tidal variability was especially intense during spring tides and during low salinity events, when freshwaters with low AT and minimal buffering capacity to dampen pH changes, flooded the interior of the Ría de Arousa. The pH measurements between July and March showed maximum pH values in summer and the beginning of the spring bloom during March. Minimum values in winter associated with minimum salinity values that became zero during low tide over several days in January and therefore related to continental fluvial discharges. This extreme variability of salinity, pH and other parameters of the carbon system was responsible for the massive mortality of shellfish on the beaches surrounding the mooring point. This fact that had already been observed in the inland waters of the Ría de Arousa (Parada and Molares, 2008; Parada et al., 2012; Aranguren et al., 2014) may be more frequent in a future characterized by ocean acidification (IPCC, 2021) and events of heavy rainfall (Alvarez et al., 2005; Parada et al., 2012; Cardoso Pereira et al., 2020; Lorenzo and Alvarez, 2020) according to climate projections.
The results presented here were obtained during the deployment of the SURCOM instrument in highly productive and dynamic waters such as the interior of the Ría de Arousa. The stability and accuracy shown during this study confirm that the Honeywell Durafet pH sensors, based on ISFET technology, that were installed in the SURCOM instrument, are an economical and suitable alternative for pH monitoring in coastal deployments. The comparison between SURCOM pH values and discrete pH measurements reported an accuracy of 0.029 which is adequate to describe the high variability observed in the Ría de Arousa.
The SURCOM instrument designed by the Instituto de Investigacións Mariñas de Vigo (IIM-CSIC, Spain) has the capacity to be the basis of an observational network of pH variability (McLaughlin et al., 2015; Newton et al., 2015; McLaughlin et al., 2017) to assess acidification and comprehend climate change in the Galician coast. To this end, minimizing sources of uncertainty from the SURCOM should be a short-term goal to improve the description of pH variability and incorporate this region into the GOA-ON network. The incorporation of other sensors, such as dissolved oxygen concentration into upcoming versions of the SURCOM instrument, or as part of an acidification sensor suite, would represent a significant improvement, as it would allow a better assessment of biological processes and its impacts as drivers for pH oscillations. Recent studies have shown that ecosystem metabolism can cause significant short-term pH changes in addition to being a strong seasonal driver (Feely et al., 2018; Pacella et al., 2018; Lowe et al., 2019; Miller and Kelley, 2021). The information obtained by pH observation networks coupled to other biogeochemical sensors is necessary for understanding the impact of acidification on coastal ecosystems, for the development of predictive models (Mongin et al., 2016; Siedlecki et al., 2016; Turi et al., 2016) and for the design of response strategies to ocean acidification by policy makers. This objective is especially relevant in a region such as the Ría de Arousa where the aquaculture and fishing industry is of great socio-economic importance.
Funding
Funding for AV was received from AtlAzul (0755_ATLAZUL_6_E) co-funded by the INTERREG V-A Spain-Portugal Cooperation Program (POCTEP) 2014-2020. Funding for XP comes from Observatorio TIAMAT project (2715-2021) funded by the Autonomous Agency of National Parks of the Ministry for Ecological Transition and Demographic Challenge. This work has also been supported from the MarRISK project (0262_MarRISK_1_E) co-funded by INTERREG V-A Spain-Portugal Cooperation Program (POCTEP) 2014-2020 and from the European Union’s Horizon 2020 research and innovation programme under grant agreement no. 820989 (COMFORT). This work was also contributed by WATER:iOS CSIC PTI.
Acknowledgments
We would like to thank Professor Fiz Fernández Pérez for his invaluable collaboration and support for the development of the SURCOM instrument. We thank technicians of Instituto de Investigacións Mariñas (CSIC), and mainly Jesús Rey, who were responsible for the collection and analysis of the discrete samples. We also thank Silvia Torres, Pablo Álvarez and Clara Almécija from CETMAR (Vigo, Spain) for their assistance and for their kind support in fieldwork activities. We would also thank Meteogalicia for allowing us to use data collected by their sensors at the mooring point.
Publisher’s note
All claims expressed in this article are solely those of the authors and do not necessarily represent those of their affiliated organizations, or those of the publisher, the editors and the reviewers. Any product that may be evaluated in this article, or claim that may be made by its manufacturer, is not guaranteed or endorsed by the publisher.
Statements
Data availability statement
The datasets presented in this study can be found in online repositories. The names of the repository/repositories and accession number(s) can be found below: https://co2.iim.csic.es/monitoring/d/surcom_cortegada/surcom-cortegada?orgId=1&from=1594142392154&to=1631657237133https://doi.org/10.5281/zenodo.6905396.
Author contributions
All authors listed have made a substantial, direct, and intellectual contribution to the work and approved it for publication.
Conflict of interest
The authors declare that the research was conducted in the absence of any commercial or financial relationships that could be construed as a potential conflict of interest.
References
1
Albright R. (2018). “Ocean acidification and coral bleaching,” in Ecological studies: Coral bleaching (Cham: Springer International Publishing), 295–323.
2
Alonso-Pérez F. Castro C. G. (2014). Benthic oxygen and nutrient fluxes in a coastal upwelling system (Ria de vigo, NW Iberian peninsula): seasonal trends and regulating factors. Mar. Ecol. Prog. Ser.511, 17–32. doi: 10.3354/meps10915
3
Alvarez I. deCastro M. Gomez-Gesteira M. Prego R. (2005). Inter- and intra-annual analysis of the salinity and temperature evolution in the Galician rías baixas–ocean boundary (northwest Spain). J. Geophys. Res. Oceans110, C04008. doi: 10.1029/2004JC002504
4
Álvarez-Salgado X. (2000). Surface waters of the NW Iberian margin: Upwelling on the shelf versus outwelling of upwelled waters from the rías baixas. Estuar. Coast. Shelf Sci.51, 821–837. doi: 10.1006/ecss.2000.0714
5
Álvarez-Salgado X. A. Borges A. V. Figueiras F. G. Chou L. (2010). “Iberian Margin: the Rías”. in Carbon and Nutrient Fluxes in Continental Margins: A Global Synthesis. Eds. LiuK.-K.AtkinsonL.QuiñonesR.Talaue-McManusL. IGBP Book Series, (Berlin: Springer) 102–119.
6
Álvarez-Salgado X. A. Labarta U. Fernández-Reiriz M. J. Figueiras F. G. Rosón G. Piedracoba S. et al . (2008). Renewal time and the impact of harmful algal blooms on the extensive mussel raft culture of the Iberian coastal upwelling system (SW Europe). Harmful Algae7, 849–855. doi: 10.1016/j.hal.2008.04.007
7
Alves de Almeida E. Celso Dias Bainy A. Paula de Melo Loureiro A. Regina Martinez G. Miyamoto S. Onuki J. et al . (2007). Oxidative stress in perna perna and other bivalves as indicators of environmental stress in the Brazilian marine environment: antioxidants, lipid peroxidation and DNA damage. Comp. Biochem. Physiol. A Mol. Integr. Physiol.146, 588–600. doi: 10.1016/j.cbpa.2006.02.040
8
Andersson A. J. Mackenzie F. T. (2012). Revisiting four scientific debates in ocean acidification research. Biogeosciences9, 893–905. doi: 10.5194/bg-9-893-2012
9
Aranguren R. Gomez-León J. Balseiro P. Costa M. M. Novoa B. Figueras A. (2014). Abnormal mortalities of the carpet shell clam ruditapes decussatus (Linnaeus 1756) in natural bed populations: A practical approach. Aquac Res.45, 1303–1310. doi: 10.1111/are.12074
10
Arístegui J. Barton E. D. Álvarez-Salgado X. A. Santos A. M. P. Figueiras F. G. Kifani S. et al . (2009). Sub-Regional ecosystem variability in the canary current upwelling. Prog. Oceanogr83, 33–48. doi: 10.1016/j.pocean.2009.07.031
11
Babarro J. M. F. Fernández-Reiriz M. J. Labarta U. (2000). Feeding behavior of seed mussel mytilus galloprovincialis: Environmental parameters and seed origin. J. Shellfish. Res. 19, 195–201.
12
Bakker D. C. E. De Baar H. J. W. Bathmann U. V. (1997). Changes of carbon dioxide in surface waters during spring in the southern ocean. Deep Sea Res. Part II Top. Stud. Oceanogr44, 91–127. doi: 10.1016/S0967-0645(96)00075-6
13
Barton E. D. Torres R. Figueiras F. G. Gilcoto M. Largier J. (2016). Surface water subduction during a downwelling event in a semienclosed bay. J. Geophys. Res. Oceans121, 7088–7107. doi: 10.1002/2016JC011950
14
Bates N. Astor Y. Church M. Currie K. Dore J. Gonaález-Dávila M. et al . (2014). A time-series view of changing ocean chemistry due to ocean uptake of anthropogenic CO2 and ocean acidification. Oceanography27, 126–141. doi: 10.5670/oceanog.2014.16
15
Baumann H. Wallace R. B. Tagliaferri T. Gobler C. J. (2015). Large Natural pH, CO2 and O2 fluctuations in a temperate tidal salt marsh on diel, seasonal, and interannual time scales. Estuaries Coasts38, 220–231. doi: 10.1007/s12237-014-9800-y
16
Bausells J. Carrabina J. Errachid A. Merlos A. (1999). Ion-sensitive field-effect transistors fabricated in a commercial CMOS technology. Sens Actuators B Chem.57, 56–62. doi: 10.1016/S0925-4005(99)00135-5
17
Bednaršek N. Tarling G. A. Bakker D. C. E. Fielding S. Feely R. A. (2014). Dissolution dominating calcification process in polar pteropods close to the point of aragonite undersaturation. PLoS One9, e109183. doi: 10.1371/journal.pone.0109183
18
Berger V. J. Kharazova A. D. (1997). Mechanisms of salinity adaptations in marine molluscs. Hydrobiologia355, 115–126. doi: 10.1023/A:1003023322263
19
Bergveld P. (2003). Thirty years of ISFETOLOGY: What happened in the past 30 years and what may happen in the next 30 years. Sens Actuators B Chem.88, 1–20. doi: 10.1016/S0925-4005(02)00301-5
20
Bode A. Alvarez-Ossorio M. T. Cabanas J. M. Miranda A. Varela M. (2009). Recent trends in plankton and upwelling intensity off Galicia (NW Spain). Prog. Oceanogr83, 342–350. doi: 10.1016/j.pocean.2009.07.025
21
Borges A. V. Alin S. R. Chavez F. P. Vlahos P. Johnson K. S. Holt J. T. et al . (2010)A global sea surface carbon observing system: inorganic and organic carbon dynamics in coastal oceans. In: Proceedings of OceanObs’09: Sustained ocean observations and information for society (European Space Agency). Available at: http://eprints.soton.ac.uk/340376/ (Accessed August 19, 2013).
22
Borges A. V. Frankignoulle M. (1999). Daily and seasonal variations of the partial pressure of CO2 in surface seawater along Belgian and southern Dutch coastal areas. J. Mar. Syst.19, 251–266. doi: 10.1016/S0924-7963(98)00093-1
23
Borges A. V. Frankignoulle M. (2002). Aspects of dissolved inorganic carbon dynamics in the upwelling system off the Galician coast. J. Mar. Syst.32, 181–198. doi: 10.1016/S0924-7963(02)00031-3
24
Branch T. A. DeJoseph B. M. Ray L. J. Wagner C. A. (2013). Impacts of ocean acidification on marine seafood. Trends Ecol. Evol.28, 178–186. doi: 10.1016/j.tree.2012.10.001
25
Brasse S. Reimer A. Seifert R. Michaelis W. (1999). The influence of intertidal mudflats on the dissolved inorganic carbon and total alkalinity distribution in the German bight, southeastern north Sea. J. Sea Res.42, 93–103. doi: 10.1016/S1385-1101(99)00020-9
26
Bresnahan P. J. Martz T. R. Takeshita Y. Johnson K. S. LaShomb M. (2014). Best practices for autonomous measurement of seawater pH with the Honeywell durafet. Methods Oceanogr9, 44–60. doi: 10.1016/j.mio.2014.08.003
27
Bris N. Birot D. (1997). Automated pH-ISFET measurements under hydrostatic pressure for marine monitoring application. Anal. Chim. Acta356, 205–215. doi: 10.1016/S0003-2670(97)00533-3
28
Broullón D. Pérez F. Doval M. D. (2021). Weekly reconstruction of pH and total alkalinity in an upwelling-dominated coastal ecosystem through neural networks: The case of ría de vigo (NW Spain) between 1992 and 2019. Biogeosciences Discuss. doi: 10.5194/bg-2021-33
29
Cardoso Pereira S. Marta-Almeida M. Carvalho A. C. Rocha A. (2020). Extreme precipitation events under climate change in the Iberian peninsula. Int. J. Climatol.40, 1255–1278. doi: 10.1002/joc.6269
30
Carstensen J. Duarte C. M. (2019). Drivers of pH variability in coastal ecosystems. Environ. Sci. Technol.53, 4020–4029. doi: 10.1021/acs.est.8b03655
31
Carter B. R. Radich J. A. Doyle H. L. Dickson A. G. (2013). An automated system for spectrophotometric seawater pH measurements. Limnol Oceanogr Methods11, 16–27. doi: 10.4319/lom.2013.11.16
32
Clayton T. D. Byrne R. H. (1993). Spectrophotometric seawater pH measurements: total hydrogen ion concentration scale calibration of m-cresol purple and at-sea results. Deep Sea Res. Part Oceanogr Res. Pap40, 2115–2129. doi: 10.1016/0967-0637(93)90048-8
33
Clements J. C. Comeau L. A. Carver C. E. Mayrand É. Plante S. Mallet A. L. (2018). Short-term exposure to elevated pCO2 does not affect the valve gaping response of adult eastern oysters, Crassostrea virginica, to acute heat shock under an ad libitum feeding regime. J. Exp. Mar. Biol. Ecol.506, 9–17. doi: 10.1016/j.jembe.2018.05.005
34
Collins C. Bresnan E. Brown L. Falconer L. Guilder J. Jones L. et al . (2020). “Impacts of climate change on aquaculture” in MCCIP Science Review 2020. Lowestoft: Marine Climate Change Impacts, pp. 482–520. doi: 10.14465/2020.arc21.aqu
35
Dickson A. G. (1990). Thermodynamics of the dissociation of boric acid in synthetic seawater from 273.15 to 318.15 K. Deep Sea Res. Part Oceanogr Res. Pap. 37, 755–766. doi: 10.1016/0198-0149(90)90004-F
36
Doney S. C. Fabry V. J. Feely R. A. Kleypas J. A. (2009). Ocean acidification: the other CO2 problem. Annu. Rev. Mar. Sci.1, 169–192. doi: 10.1146/annurev.marine.010908.163834
37
Doney S. C. Ruckelshaus M. Duffy J. E. Barry J. P. Chan F. English C. A. et al . (2012). Climate change impacts on marine ecosystems. Annu. Rev. Mar. Sci.4, 11–37. doi: 10.1146/annurev-marine-041911-111611
38
Dore J. E. Lukas R. Sadler D. W. Church M. J. Karl D. M. (2009). Physical and biogeochemical modulation of ocean acidification in the central north pacific. Proc. Natl. Acad. Sci.106, 12235–12240. doi: 10.1073/pnas.0906044106
39
Doval M. Álvarez-Salgado X. Pérez F. (1997). Dissolved organic matter in a temperate embayment affected by coastal upwelling. Mar. Ecol. Prog. Ser.157, 21–37. doi: 10.3354/meps157021
40
Eyre B. D. Cyronak T. Drupp P. De Carlo E. H. Sachs J. P. Andersson A. J. (2018). Coral reefs will transition to net dissolving before end of century. Science359, 908–911. doi: 10.1126/science.aao1118
41
Fanjul E. A. Gómez B. P. Sánchez-Arévalo I. R. (1997). A description of the tides in the Eastern north Atlantic. Prog. Oceanogr40, 217–244. doi: 10.1016/S0079-6611(98)00003-2
42
FAO (2018). World food and agriculture: statistical pocketbook 2018. Rome, 254 pp.
43
Feely R. A. Okazaki R. R. Cai W.-J. Bednaršek N. Alin S. R. Byrne R. H. et al . (2018). The combined effects of acidification and hypoxia on pH and aragonite saturation in the coastal waters of the California current ecosystem and the northern gulf of Mexico. Cont Shelf Res.152, 50–60. doi: 10.1016/j.csr.2017.11.002
44
Feely R. A. Sabine C. L. Hernandez-Ayon J. M. Ianson D. Hales B. (2008). Evidence for upwelling of corrosive “acidified” water onto the continental shelf. Science320, 1490–1492. doi: 10.1126/science.1155676
45
Feely R. A. Sabine C. L. Lee K. Berelson W. Kleypas J. Fabry V. J. et al . (2004). Impact of anthropogenic CO2 on the CaCO3 system in the oceans. Science305, 362–366. doi: 10.1126/science.1097329
46
Fernández-Reiriz M. J. Labarta U. Babarro J. M. F. (1996). Comparative allometries in growth and chemical composition of mussel (Mytilus galloprovincialis lmk) cultured in two zones in the ria sada (Galicia, NW Spain). J. Shellfish Res. 15, 349–353.
47
Fernández-Reiriz M. Labarta U. Navarro J. Velasco A. (2001). Enzymatic digestive activity in mytilus chilensis (Hupé 1854) in response to food regimes and past feeding history. J. Comp. Physiol. B171, 449–456. doi: 10.1007/s003600100194
48
Fernández-Reiriz M. J. Range P. Álvarez-Salgado X. A. Espinosa J. Labarta U. (2012). Tolerance of juvenile mytilus galloprovincialis to experimental seawater acidification. Mar. Ecol. Prog. Ser.454, 65–74. doi: 10.3354/meps09660
49
Flecha S. Giménez-Romero À. Tintoré J. Pérez F. F. Alou-Font E. Matías M. A. et al . (2022). pH trends and seasonal cycle in the coastal Balearic Sea reconstructed through machine learning. Sci. Rep.12, 12956. doi: 10.1038/s41598-022-17253-5
50
Flecha S. Pérez F. F. García-Lafuente J. Sammartino S. Aida. F. Huertas I. E. (2015). Trends of pH decrease in the Mediterranean Sea through high frequency observational data: indication of ocean acidification in the basin. Sci. Rep.5, 16770. doi: 10.1038/srep16770
51
Frankignoulle M. Abril G. Borges A. Bourge I. Canon C. Delille B. et al . (1998). Carbon dioxide emission from European estuaries. Science282, 434–436. doi: 10.1126/science.282.5388.434
52
Gago J. (2003). Assessing the contrasting fate of dissolved and suspended organic carbon in a coastal upwelling system (“Ría de vigo”, NW Iberian peninsula). Estuar. Coast. Shelf Sci.56, 271–279. doi: 10.1016/S0272-7714(02)00186-5
53
Gago J. Álvarez-Salgado X. Pérez F. Ríos A. (2003). Partitioning of physical and biogeochemical contributions to short-term variability of pCO2 in a coastal upwelling system: a quantitative approach. Mar. Ecol. Prog. Ser.255, 43–54. doi: 10.3354/meps255043
54
García-Gil S. de Blas E. Martínez-Carreño N. Iglesias J. Rial-Otero R. Simal-Gándara J. et al . (2011). Characterisation and preliminary quantification of the methane reservoir in a coastal sedimentary source: San simón bay, ría de vigo, NW Spain. Estuar. Coast. Shelf Sci.91, 232–242. doi: 10.1016/j.ecss.2010.10.038
55
Gattuso J.-P. Brewer P. G. Hoegh-Guldberg O. Kleypas J. A. Pörtner H.-O. Schmidt D. N. (2014). Cross-chapter box on ocean acidification. IPC 2014 Climate change 2014: Impacts, adaptation, and vulnerability. part a: Global and sectoral aspects. contribution of working group II to the fifth assessment report of the intergovernmental panel on climate change. Eds. FieldC. B.BarrosV. R.DokkenD. J.MachK. J.MastrandreaM. D.BilirT. E.ChatterjeeM.EbiK. L.EstradaY. O.GenovaR. C.GirmaB.KisselE. S.LevyA. N.MacCrackenS.MastrandreaP. R.WhiteL. L. (Cambridge, United Kingdom and New York, NY, USA: Cambridge University Press), 129–131.
56
Gattuso J.-P. Magnan A. Billé R. Cheung W. W. L. Howes E. L. Joos F. et al . (2015). Contrasting futures for ocean and society from different anthropogenic CO2 emissions scenarios. Science349, aac4722. doi: 10.1126/science.aac4722
57
Gazeau F. Parker L. M. Comeau S. Gattuso J.-P. O’Connor W. A. Martin S. et al . (2013). Impacts of ocean acidification on marine shelled molluscs. Mar. Biol.160, 2207–2245. doi: 10.1007/s00227-013-2219-3
58
Gazeau F. Quiblier C. Jansen J. M. Gattuso J.-P. Middelburg J. J. Heip C. H. R. (2007). Impact of elevated CO2 on shellfish calcification. Geophys. Res. Lett.34, L07603. doi: 10.1029/2006GL028554
59
Gonski S. F. Cai W.-J. Ullman W. J. Joesoef A. Main C. R. Pettay D. T. et al . (2018). Assessment of the suitability of durafet-based sensors for pH measurement in dynamic estuarine environments. Estuar. Coast. Shelf Sci.200, 152–168. doi: 10.1016/j.ecss.2017.10.020
60
González-Dávila M. Santana-Casiano J. M. Rueda M. J. Llinás O. (2010). The water column distribution of carbonate system variables at the ESTOC site from 1995 to 2004. Biogeosciences7, 3067–3081. doi: 10.5194/bg-7-3067-2010
61
Gruber N. Hauri C. Lachkar Z. Loher D. Frölicher T. L. Plattner G.-K. (2012). Rapid progression of ocean acidification in the California current system. Science337, 220–223. doi: 10.1126/science.1216773
62
Harvey B. P. Agostini S. Wada S. Inaba K. Hall-Spencer J. M. (2018). Dissolution: the achilles’ heel of the triton shell in an acidifying ocean. Front. Mar. Sci.5. doi: 10.3389/fmars.2018.00371
63
Hauri C. Gruber N. Plattner G.-K. Alin S. Feely R. Hales B. et al (2009). 2009: Ocean acidification in the California Current System. Oceanography22, 60–71. doi: 10.5670/oceanog.2009.97
64
Hauri C. Gruber N. McDonnell A. M. P. Vogt M. (2013). The intensity, duration, and severity of low aragonite saturation state events on the California continental shelf. Geophys. Res. Lett.40, 3424–3428. doi: 10.1002/grl.50618
65
Helmuth B. S. Hofmann G. E. (2001). Microhabitats, thermal heterogeneity, and patterns of physiological stress in the rocky intertidal zone. Biol. Bull.201, 374–384. doi: 10.2307/1543615
66
Hofmann G. E. Smith J. E. Johnson K. S. Send U. Levin L. A. Micheli F. et al . (2011). High-frequency dynamics of ocean pH: A multi-ecosystem comparison. PLoS ONE6 (12), e28983. doi: 10.1371/journal.pone.0028983
67
Hoppe H.-G. Giesenhagen H. C. Koppe R. Hansen H.-P. Gocke K. (2012). Impact of change in climate and policy from 1988 to 2007 on environmental and microbial variables at the time series station boknis eck, Baltic Sea. Biogeosciences10, 452945–46. doi: 10.5194/bg-10-4529-2013
68
Hoppema M. Fahrbach E. Stoll M. H. C. de Baar H. J. W. (1999). Annual uptake of atmospheric CO2 by the weddell Sea derived from a surface layer balance, including estimations of entrainment and new production. J. Mar. Syst.19, 219–233. doi: 10.1016/S0924-7963(98)00091-8
69
Humphreys M. P. Lewis E. R. Sharp J. D. Pierrot D . (2022). PyCO2SYS v1.8: Marine carbonate system calculations in Python. Geosci. Model Dev. 15, 15–43. doi: 10.5194/gmd-15-15-2022
70
IPCC (2021). “Climate change 2021: The physical science basis,” in Contribution of working group I to the sixth assessment report of the intergovernmental panel on climate change. Eds. Masson-DelmotteV.ZhaiP.PiraniA.ConnorsS. L.PéanC.BergerS.et al. (Cambridge, United Kingdom and New York, NY, USA: Cambridge University Press), 2391 pp. doi: 10.1017/9781009157896
71
Ishii M. Kosugi N. Sasano D. Saito S. Midorikawa T. Inoue H. Y. (2011). Ocean acidification off the south coast of Japan: A result from time series observations of CO2 parameters from 1994 to 2008. J. Geophys. Res.: Oceans116 (6), 1–9. doi: 10.1029/2010JC006831
72
Johnson K. S. Jannasch H. W. Coletti L. J. Elrod V. A. Martz T. R. Takeshita Y. et al . (2016). Deep-Sea DuraFET: A pressure tolerant pH sensor designed for global sensor networks. Anal. Chem.88, 3249–3256. doi: 10.1021/acs.analchem.5b04653
73
Johnson Z. I. Wheeler B. J. Blinebry S. K. Carlson C. M. Ward C. S. Hunt D. E. (2013). Dramatic variability of the carbonate system at a temperate coastal ocean site (Beaufort, north Carolina, USA) is regulated by physical and biogeochemical processes on multiple timescales. PLoS ONE8 (12), e85117. doi: 10.1371/journal.pone.0085117
74
Jury C. Thomas F. Atkinson M. Toonen R. (2013). Buffer capacity, ecosystem feedbacks, and seawater chemistry under global change. Water5, 1303–1325. doi: 10.3390/w5031303
75
Kapsenberg L. Cyronak T. (2019). Ocean acidification refugia in variable environments. Glob. Change Biol.25, 3201–3214. doi: 10.1111/gcb.14730
76
Kroeker K. J. Micheli F. Gambi M. C. (2013). Ocean acidification causes ecosystem shifts via altered competitive interactions. Nat. Clim. Change3, 156–159. doi: 10.1038/nclimate1680
77
Kroeker K. J. Micheli F. Gambi M. C. Martz T. R. (2011). Divergent ecosystem responses within a benthic marine community to ocean acidification. Proc. Natl. Acad. Sci. U. S. A.108, 14515–14520. doi: 10.1073/pnas.1107789108
78
Lachkar Z. (2014). Effects of upwelling increase on ocean acidification in the California and canary current systems. Geophys. Res. Lett.41, 90–95. doi: 10.1002/2013GL058726
79
Lassoued J. Babarro J. M. F. Padín X. A. Comeau L. A. Bejaoui N. Pérez F. F. (2019). Behavioural and eco-physiological responses of the mussel mytilus galloprovincialis to acidification and distinct feeding regimes. Mar. Ecol. Prog. Ser.626, 97–108. doi: 10.3354/meps13075
80
Lassoued J. Padín X. A. Comeau L. A. Bejaoui N. Pérez F. F. Babarro J. M. F. (2021). The Mediterranean mussel Mytilus galloprovincialis: Responses to climate change scenarios as a function of the original habitat. Conserv. Physiol. 9 (1), 1–16. doi: 10.1093/conphys/coaa114
81
Lauvset S. K. Lange N. Tanhua T. Bittig H. C. Olsen A. Kozyr A. et al . (2021). An updated version of the global interior ocean biogeochemical data product, GLODAPv2.2021. Earth Syst. Sci. Data Discuss13, 5565–5589. doi: 10.5194/essd-2021-234
82
Levinton J. Doall M. Ralston D. Starke A. Allam B. (2011). Climate change, precipitation and impacts on an estuarine refuge from disease. PLoS One6, e18849. doi: 10.1371/journal.pone.0018849
83
Lewis E. Wallace D. W. R. (1998). “Program developed for CO2 system calculations,” in ORNL/CDIAC-105, carbon dioxide information analysis center, oak ridge national laboratory (Oak Ridge, TN: US Department of Energy).
84
Lorenzo M. N. Alvarez I. (2020). Climate change patterns in precipitation over Spain using CORDEX projections for 2021-2050. Sci. Total Environ.723, 138024. doi: 10.1016/j.scitotenv.2020.138024
85
Lovecchio E. Gruber N. Münnich M. Frenger I. (2022). On the processes sustaining biological production in the offshore propagating eddies of the northern canary upwelling system. J. Geophys. Res. Oceans127, e2021JC017691. doi: 10.1029/2021JC017691
86
Lowe A. T. Bos J. Ruesink J. (2019). Ecosystem metabolism drives pH variability and modulates long-term ocean acidification in the northeast pacific coastal ocean. Sci. Rep.9, 963. doi: 10.1038/s41598-018-37764-4
87
Lueker T. J. Dickson A. G. Keeling C. D. (2000). Ocean pCO2 calculated from dissolved inorganic carbon, alkalinity, and equations for K1 and K2: validation based on laboratory measurements of CO2 in gas and seawater at equilibrium. Mar. Chem.70, 105–119. doi: 10.1016/S0304-4203(00)00022-0
88
Martz T. R. Connery J. G. Johnson K. S. (2010). Testing the Honeywell durafet® for seawater pH applications. Limnol Oceanogr Methods8, 172–184. doi: 10.4319/lom.2010.8.172
89
Martz T. Daly K. Byrne R. Stillman J. Turk D. (2015a). Technology for ocean acidification research: needs and availability. Oceanography25, 40–47. doi: 10.5670/oceanog.2015.30
90
Martz T. McLaughlin K. Weisberg S. B. (2015b). Best practices for autonomous measurement of seawater pH with the Honeywell durafet pH sensor. California: California Current Acidification Network (C-CAN).
91
McElhany P. Busch D. S. (2013). Appropriate pCO2 treatments in ocean acidification experiments. Mar. Biol.160, 1807–1812. doi: 10.1007/s00227-012-2052-0
92
McLaughlin K. Dickson A. Weisberg S. B. Coale K. Elrod V. Hunter C. et al . (2017). An evaluation of ISFET sensors for coastal pH monitoring applications. Reg Stud. Mar. Sci.12, 11–18. doi: 10.1016/j.rsma.2017.02.008
93
McLaughlin K. Weisberg S. Dickson A. Hofmann G. Newton J. Aseltine-Neilson D. et al . (2015). Core principles of the California current acidification network: linking chemistry, physics, and ecological effects. Oceanography25, 160–169. doi: 10.5670/oceanog.2015.39
94
Mekki K. Bajic E. Chaxel F. Meyer F. (2019). A comparative study of LPWAN technologies for large-scale IoT deployment. ICT Express5, 1–7. doi: 10.1016/j.icte.2017.12.005
95
Miller C. A. and Kelley A. L. (2021). Alkalinity cycling and carbonate chemistry decoupling in seagrass mystify processes of acidification mitigation. Res. Sq. 11, 13500. doi: 10.21203/rs.3.rs-419885/v1
96
Mongin M. Baird M. E. Hadley S. Lenton A. (2016). Optimising reef-scale CO2 removal by seaweed to buffer ocean acidification. Environ. Res. Lett.11, 34023–34032. doi: 10.1088/1748-9326/11/3/034023
97
Navarro J. M. Torres R. Acuña K. Duarte C. Manriquez P. H. Lardies M. et al . (2013). Impact of medium-term exposure to elevated pCO2 levels on the physiological energetics of the mussel Mytilus chilensis. Chemosphere90, 1242–1248. doi: 10.1016/j.chemosphere.2012.09.063
98
Newton J. A. Feely R. A. Jewett E. B. Williamson P. Mathis J. (2015). Global ocean acidification observing network: requirements and governance plan (Washington: GOA-ON).
99
Nogueira E. (1997). Modelling thermohaline properties in an estuarine upwelling ecosystem (Ría de vigo: NW Spain) using box-Jenkins transfer function models. Estuar. Coast. Shelf Sci.44, 685–702. doi: 10.1006/ecss.1996.0143
100
Nogueira E. (1998). Modelling nutrients and ChlorophyllaTime series in an estuarine upwelling ecosystem (Ría de vigo: NW Spain) using the box–Jenkins approach. Estuar. Coast. Shelf Sci.46, 267–286. doi: 10.1006/ecss.1997.0266
101
Orr J. C. Fabry V. J. Aumont O. Bopp L. Doney S. C. Feely R. A. et al . (2005). Anthropogenic ocean acidification over the twenty-first century and its impact on calcifying organisms. Nature437, 681–686. doi: 10.1038/nature04095
102
Otero P. Ruiz-Villarreal M. Peliz Á. Cabanas J. M. (2010). Climatology and reconstruction of runoff time series in northwest Iberia: influence in the shelf buoyancy budget off ría de vigo. Sci. Mar.74, 247–266. doi: 10.3989/scimar.2010.74n2247
103
Pacella S. R. Brown C. A. Waldbusser G. G. Labiosa R. G. Hales B. (2018). Seagrass habitat metabolism increases short-term extremes and long-term offset of CO2 under future ocean acidification. Proc. Natl. Acad. Sci. U.S.A.115, 3870–3875. doi: 10.1073/pnas.1703445115
104
Padin X. A. Velo A. Pérez F. F. (2020). ARIOS: a database for ocean acidification assessment in the Iberian upwelling system, (1976–2018). Earth Syst. Sci. Data12, 2647–2663. doi: 10.5194/essd-12-2647-2020
105
Parada C. Colas F. Soto-Mendoza S. Castro L. (2012). Effects of seasonal variability in across- and alongshore transport of anchoveta (Engraulis ringens) larvae on model-based pre-recruitment indices off central Chile. Prog. Oceanogr92–95, 192–205. doi: 10.1016/j.pocean.2011.07.015
106
Parada J. M. Molares J. (2008). Natural mortality of the cockle cerastoderma edule (L.) from the ria of arousa (NW Spain) intertidal zone. Rev. Biol. Mar. Oceanogr43, 501–511. doi: 10.4067/S0718-19572008000300009
107
Pardo P. C. Padín X. A. Gilcoto M. Farina-Busto L. Pérez F. F. (2011). Evolution of upwelling systems coupled to the long-term variability in sea surface temperature and ekman transport. Clim. Res.48, 231–246. doi: 10.3354/cr00989
108
Pauly D. Christensen V. (1995). Primary production required to sustain global fisheries. Nature374, 255–257. doi: 10.1038/374255a0
109
Pérez F. F. Álvarez-Salgado X. A. Rosón G. (2000a). Stoichiometry of the net ecosystem metabolism in a coastal inlet affected by upwelling. the Rıía de arousa (NW Spain). Mar. Chem.69, 217–236. doi: 10.1016/S0304-4203(99)00107-3
110
Pérez-Camacho E. (1995). rowth of mussels (Mytilus edulisgalloprovincialis) on cultivation rafts: influence of seed source, cultivation siteand phytoplankton availability. Aquaculture138, 349–362. doi: 10.1016/0044-8486(95)01139-0
111
Pérez F. F. Fraga F. (1987a). A precise and rapid analytical procedure for alkalinity determination. Mar. Chem.21, 169–182. doi: 10.1016/0304-4203(87)90037-5
112
Pérez F. F. Fraga F. (1987b). Association constant of fluoride and hydrogen ions in seawater. Mar. Chem.21, 161–168. doi: 10.1016/0304-4203(87)90036-3
113
Pérez F. F. Padín X. A. Pazos Y. Gilcoto M. Cabanas M. Pardo P. C. et al . (2010). Plankton response to weakening of the Iberian coastal upwelling. Glob. Change Biol.16, 1258–1267. doi: 10.1111/j.1365-2486.2009.02125.x
114
Pérez F. F. Rios A. F. Rellán T. Alvarez M. (2000b). Improvements in a fast potentiometric seawater alkalinity determination. Cienc. Mar.26, 463–478. doi: 10.7773/cm.v26i3.592
115
Pérez F. F. Velo A. Padín X. A. Doval M. D. Prego R. (2020). ARIOS database: An acidification ocean database for the Galician upwelling ecosystem. doi: 10.20350/digitalCSIC/12498
116
Provoost P. van Heuven S. Soetaert K. Laane R. Middelburg J. J. (2010). Seasonal and long-term changes in pH in the Dutch coastal zone. Biogeosciences7, 3869–3878. doi: 10.5194/bg-7-3869-2010
117
Ramajo L. Osores S. J. Lagos N. A. Broitman B. R. Navarro J. M. Vargas C. A. et al . (2021). Estuarine conditions more than pH modulate the physiological flexibility of mussel Perumytilus purpuratus populations. Estuarine Coast. Shelf Sci. 249, 1–12. doi: 10.1016/j.ecss.2020.107098
118
Ries J. B. Ghazaleh M. N. Connolly B. Westfield I. Castillo K. D. (2016). Impacts of seawater saturation state (ΩA = 0.4 – 4.6) and temperature (10, 25 °C) on the dissolution kinetics of whole-shell biogenic carbonates. Geochim Cosmochim Acta192, 318–337. doi: 10.1016/j.gca.2016.07.001
119
Ríos A. F. Resplandy L. García-Ibáñez M. I. Fajar N. M. Velo A. Padin X. A. et al . (2015). Decadal acidification in the water masses of the Atlantic ocean. Proc. Natl. Acad. Sci.112, 9950–9955. doi: 10.1073/pnas.1504613112
120
Rosenblatt A. E. Smith-Ramesh L. M. Schmitz O. J. (2017). Interactive effects of multiple climate change variables on food web dynamics: Modeling the effects of changing temperature, CO2, and water availability on a tri-trophic food web. Food Webs13, 98–108. doi: 10.1016/j.fooweb.2016.10.002
121
Rosón G. Álvarez-Salgado X. Pérez F. (1999). Carbon cycling in a large coastal embayment, affected by wind-driven upwelling:short-time-scale variability and spatial differences. Mar. Ecol. Prog. Ser.176, 215–230. doi: 10.3354/meps176215
122
Seitz F. Lüderwald S. Rosenfeldt R. R. Schulz R. Bundschuh M. (2015). Aging of TiO2 nanoparticles transiently increases their toxicity to the pelagic microcrustacean daphnia magna. PLoS One10, e0126021. doi: 10.1371/journal.pone.0126021
123
Sharp J. D. Pierrot D. Humphreys M. P. Epitalon J.-M. Orr J. C. Lewis E. R. et al . (2021). CO2SYSv3 for MATLAB. doi: 10.5281/zenodo.4774718
124
Siedlecki S. A. Kaplan I. C. Hermann A. J. Nguyen T. T. Bond N. A. Newton J. A. et al . (2016). Experiments with seasonal forecasts of ocean conditions for the northern region of the California current upwelling system. Sci. Rep.6, 27203. doi: 10.1038/srep27203
125
Takeshita Y. Frieder C. A. Martz T. R. Ballard J. R. Feely R. A. Kram S. et al . (2015). Including high frequency variability in coastal ocean acidification projections. Biogeosciences Discuss12, 7125–7176. doi: 10.5194/bgd-12-7125-2015
126
Takeshita Y. Martz T. R. Johnson K. S. Dickson A. G. (2014). Characterization of an ion sensitive field effect transistor and chloride ion selective electrodes for pH measurements in seawater. Anal. Chem.86, 11189–11195. doi: 10.1021/ac502631z
127
Tilbrook B. Jewett E. B. DeGrandpre M. D. Hernandez-Ayon J. M. Feely R. A. Gledhill D. K. et al . (2019). An enhanced ocean acidification observing network: from people to technology to data synthesis and information exchange. Front. Mar. Sci. 6, 337. doi: 10.3389/fmars.2019.00337
128
Turi G. Lachkar Z. Gruber N. Münnich M. (2016). Climatic modulation of recent trends in ocean acidification in the California current system. Environ. Res. Lett.11, 14007. doi: 10.1088/1748-9326/11/1/014007
129
Tyrrell T. Holligan P. M. Mobley C. D. (1999). Optical impacts of oceanic coccolithophore blooms. J. Geophys. Res.104, 3223–3241. doi: 10.1029/1998JC900052
130
UNESCO ICES SCOR IAPSO . (1981). “Background Papers and Supporting Data on the Practical Salinity Scale 1978,” in Unesco technical papers in marine science (Paris: UNESCO), 37.
131
Uppström L. R. (1974). The boron/chlorinity ratio of deep-sea water from the pacific ocean. Deep Sea Res. Oceanogr. Abstr.21, 161–162. doi: 10.1016/0011-7471(74)90074-6
132
Varela R. Álvarez I. Santos F. deCastro M. Gómez-Gesteira M. (2015). Has upwelling strengthened along worldwide coasts over 1982-2010? Sci. Rep.5, 10016. doi: 10.1038/srep10016
133
Velo A. Padín X. A. Álvarez P. Rey-Muras J. Almécija C. Torres S. et al . (2022). SURCOM pH and temperature data collection registered at cortegada platform (Ria de arousa - Spain) from 2020 to 2021. doi: 10.5281/ZENODO.6905396
134
Wahl M. Sawall Y. Saderne V. (2015). How good are we at assessing the impact of ocean acidification in coastal systems? limitations, omissions and strengths of commonly used experimental approaches with a special emphasis on the neglected role of fluctuations. Mar. Freshw. Res.67, 25–36. doi: 10.1071/MF14154
135
Waldbusser G. G. Salisbury J. E. (2014). Ocean acidification in the coastal zone from an organism’s perspective: multiple system parameters, frequency domains, and habitats. Annu. Rev. Mar. Sci.6, 221–247. doi: 10.1146/annurev-marine-121211-172238
136
Waters J. Millero F. J. Woosley R. J. (2014). Corrigendum to “The free proton concentration scale for seawater pH”, [MARCHE: 149 (2013) 8–22]. Mar. Chem.165, 66–67. doi: 10.1016/j.marchem.2014.07.004
137
Wootton J. T. Pfister C. A. (2012). Carbon system measurements and potential climatic drivers at a site of rapidly declining ocean pH. PLoS ONE7 (12), e53396. doi: 10.1371/journal.pone.0053396
138
Yu P. C. Matson P. G. Martz T. R. Hofmann G. E. (2011). The ocean acidification seascape and its relationship to the performance of calcifying marine invertebrates: laboratory experiments on the development of urchin larvae framed by environmentally-relevant pCO2/pH. J. Exp. Mar. Biol. Ecol.400, 288–295. doi: 10.1016/j.jembe.2011.02.01
Summary
Keywords
ocean acidification, upwelling, coastal waters, aquaculture, IoT, Durafet, SIGFOX, Ría de Arousa
Citation
Velo A and Padin XA (2022) Advancing real-time pH sensing capabilities to monitor coastal acidification as measured in a productive and dynamic estuary (Ría de Arousa, NW Spain). Front. Mar. Sci. 9:941359. doi: 10.3389/fmars.2022.941359
Received
11 May 2022
Accepted
02 November 2022
Published
17 November 2022
Volume
9 - 2022
Edited by
Johannes Karstensen, Helmholtz Association of German Research Centres (HZ), Germany
Reviewed by
Luca Possenti, Royal Netherlands Institute for Sea Research (NIOZ), Netherlands; Tobias Steinhoff, Helmholtz Association of German Research Centres (HZ), Germany
Updates
Copyright
© 2022 Velo and Padin.
This is an open-access article distributed under the terms of the Creative Commons Attribution License (CC BY). The use, distribution or reproduction in other forums is permitted, provided the original author(s) and the copyright owner(s) are credited and that the original publication in this journal is cited, in accordance with accepted academic practice. No use, distribution or reproduction is permitted which does not comply with these terms.
*Correspondence: Anton Velo, avelo@iim.csic.es
This article was submitted to Ocean Observation, a section of the journal Frontiers in Marine Science
Disclaimer
All claims expressed in this article are solely those of the authors and do not necessarily represent those of their affiliated organizations, or those of the publisher, the editors and the reviewers. Any product that may be evaluated in this article or claim that may be made by its manufacturer is not guaranteed or endorsed by the publisher.