 Si Wang
 Lin Mu
 Hao Qin3*
 Enjin Zhao
- 1College of Computer Science and Software Engineering, Shenzhen University, Shenzhen, China
- 2College of Life Sciences and Oceanography, Shenzhen University, Shenzhen, China
- 3Hubei Key Laboratory of Marine Geological Resources/College of Marine Science and Technology, China University of Geosciences, Wuhan, China
- 4College of Computer Science, China University of Geosciences, Wuhan, China
- 5Marine Resources Information Cente, Department of Natural Resources of Huizhou Bureau, Huizhou, China
Quantitative analyses of storm surge risk, which are mostly focused on physical vulnerability, have been widely used to help coastal communities mitigate impacts and damage. Such assessments, however, overlook the social aspect of vulnerability in storm surge risk. By considering both the community’s social vulnerability and buildings’ physical vulnerability, this study proposed a methodology that incorporates social vulnerability into the framework for making quantitative risk assessments of storm surge using a coupled hydrodynamic and wave model, Geographical Information System (GIS) techniques, and the Principal Component Analysis (PCA) method. The coastal area of Huizhou was chosen as the case study due to its high concentration of oil and gas infrastructure in China’s southern Guangdong Province. By combining hazard, exposure, physical vulnerability, and social vulnerability, it was possible to explore the effect of social vulnerability on the physical vulnerability-based risk assessment of storm surge and determine the overall risk level. First, the Gumbel distribution was utilized to establish five representative and plausible hypothetical typhoon events with different return periods (10, 20, 50, 100, and 1000 years) for the study area. Then, using the well-validated fully-coupled model, the Simulating Waves Nearshore (SWAN) model and the ADvanced CIRCulation (ADCIRC) model, storm surge simulations for defined return periods were run, and the geographical distribution of the maximum surge elevations displayed on a GIS platform was used to assess hazard levels. In terms of the physical aspect, the depth-damage functions for buildings were established to estimate direct economic losses and assign risk levels accordingly. For the social vulnerability of a community, a composite score was computed using the PCA method by combining and aggregating indicators representing various characteristics of the social group. The results show that the overall risk level, taking into account both social vulnerability and physical vulnerability, has decreased on average. It suggests that social vulnerability-based risk assessment may account for a significant portion of the overall risk assessment, which is frequently overlooked in traditional storm surge risk assessment. Additionally, the comprehensive and precise risk maps can assist local policymakers in identifying areas at different risk levels and developing evacuation plans, thereby minimizing potential losses, especially in high-risk areas.
Introduction
A storm surge is an abnormal rise in sea level, mainly resulting from tropical cyclones or hurricane winds moving toward the coast. This sudden rise in sea level can lead to significant flooding, particularly when a storm surge coincides with the astronomical tide. The storm surge flooding therefore has the potential to breach levees in low-lying zones and inundate settlements, resulting in a substantial loss of life and major damage to property and public infrastructure along the coast. This makes storm surge associated with tropical cyclone landfalls highly risky for coastal regions. Located in the west of the Pacific Ocean, China’s southeastern coastal regions have been hit by around seven tropical cyclones per year since 1949 (Ying et al., 2014; Lu et al., 2021). As frequently threatened by tropical cyclones, China’s wide coastline has been severely impacted by tropical storm surges each year. According to the Bulletin of China Marine Disaster statistics, between 2011 and 2020, an average of 17 storm surge events associated with tropical cyclones occur annually in Chinese coastal regions, resulting in an average economic loss of 80.82 billion RMB per year, approximately 92.18% of total economic losses due to marine disaster events (Ministry of Natural Resources of the People ‘s Republic of China, 2021; Wang et al., 2021a). Thus, tropical cyclone-induced storm surge is by far the most destructive and deadliest coastal natural disaster in China. Globally, the frequency and intensity of storm surge flooding are likely to increase over the next century as a result of global warming and sea level rise (Church et al., 2013; Stocker, 2014; Domingues et al., 2018; Zhang and Li, 2019; Knutson et al., 2021). Additionally, as a result of urbanization and globalization, China’s coastal population reached 5.9 billion, accounting for 44.03% of the national population in 2010, up from 41.54% in 1978 (He et al., 2014). Nowadays, the population density in China’s coastal regions is significantly higher than in the hinterland, and more economic activity will be exposed to the catastrophic storm surge as coastal communities’ populations grow in the future decades. Together, these factors increase the risk of storm surge in China’s coastal regions.
In this context, structural measures such as constructing sea walls and dikes were used in order to protect urban settlements located behind the defense infrastructure from storm surge flooding. However, the detrimental effects of storm surge cannot be completely eliminated by physical barriers, and the expense of constructing and maintaining them is considerably high (Shaw, 2006; Burrell et al., 2007). Therefore, academics have recently placed a greater emphasis on the implementation of a non-structural approach referred to as Disaster Risk Reduction (DRR) in order to achieve the largest reduction and migration of consequences at the lowest cost (Wisner et al., 2012; Desai et al., 2015; Twigg, 2015). Risk assessment, as a fundamental component in DRR, can be used to predict risk and identify areas that might be subject to flooding prior to the occurrence of storm surges, thereby reducing storm surge-related damage, loss, and mortality. According to the terminology used in previous and recent work on risk analysis, risk assessment generally involves combining assessment of hazard (a dangerous phenomenon with a specified intensity and frequency that results in damage), exposure (elements located in hazard-prone areas, thereby subject to potential losses), and vulnerability (the characteristics of an element that make it susceptible to the damaging hazard event) (Crichton, 1999; Kron, 2002; Granger, 2003; Greiving et al., 2007; Samuels et al., 2009; Safaie, 2017; Ward et al., 2020). While the understanding of hazard and exposure has increasingly improved in recent years, vulnerability, as the most complicated component in risk assessment, remains a challenging concept to define and measure.
In general, vulnerability can be decomposed into two complementary aspects: physical vulnerability and social vulnerability (Van Westen; Huang, 2017; UNDRR, 2017). Social vulnerability refers to how well groups within a society may withstand the adverse impacts of a natural disaster (Cutter et al., 2006; Cutter et al., 2008). Social vulnerability is commonly assessed based on socio-economic analysis of communities, which is a combination of a variety of indicators such as age, gender, education, and occupation, because these characteristics determine the susceptibility and resilience of a community to the damaging effects of hazards (Rufat et al., 2015a; Kashem et al., 2016). The crucial variables affecting social vulnerability can be exploited, and the relative level of social vulnerability for every county or census tract can be determined by the calculated composite social vulnerability score. Then, the levels of social vulnerability are combined with hazard levels to delineate risk zones, and the risk zoning map is one tool that communities use to identify the areas that are at the highest risk of natural disasters (Guillard-Goncąlves et al., 2014; Koks et al., 2015; Frigerio et al., 2016). Physical vulnerability is related to the properties of physical structures that determine the degree of loss and is measured on a scale of 0 (no loss at all) to 1 (complete destruction) (Fuchs et al., 2018). For measuring physical damages caused by storm surge flooding, the vulnerability curve, which relates the degree of damage for a group of structures to storm surge intensity, is the most widely used approach (Hatzikyriakou et al., 2015; Hatzikyriakou and Lin, 2017; Hatzikyriakou and Lin, 2018). With regard to the vulnerability curve, the intensity parameters might be inundation depth, velocity, rate of rise, and direction of flood water (Merz et al., 2010; Amirebrahimi et al., 2015; Hendrawan and Komori, 2021). The majority of previous studies regard inundation depth as the commonly used intensity parameter for estimating the expected damage to different types of buildings affected by storm surge (Arrighi et al., 2020; Baky et al., 2020; Wing et al., 2020).
However, to date, these two complementary aspects are rarely considered simultaneously in a vulnerability assessment and a few research have integrated social vulnerability into the comprehensive risk assessment of storm surge for a specific region. In developed countries, studies on storm surge risk assessment have primarily focused on the physical aspect of vulnerability and the risk has been quantified using the risk function (hazards, exposure, and physical vulnerability), thereby omitting the social dimension of vulnerability (McGrath et al., 2019; Apollonio et al., 2020; Nofal and van de Lindt, 2020). In China, due to a lack of local depth–damage curves and a scarcity of building footprint data, the qualitative risk matrix approach is frequently used to assess storm surge risk by combining hazard (inundation depth) and vulnerability (land use/land cover) (Zhang et al., 2016; Xianwu et al., 2020; Wang et al., 2021d). However, in comparison to the quantitative risk function focusing on the physical aspect of vulnerability, this qualitative risk matrix approach for evaluating risk tends to be more subjective, and so the results are not completely accurate (Simmons et al., 2017; Van Westen). Therefore, there are few studies in China that assess risk using a quantitative risk function, and there is still a lack of research focusing on the comprehensive risk assessment of storm surge, taking both social and physical aspects of vulnerability into account. Based upon the above concerns, the present study proposes a methodology for comprehensive analysis of storm surge risk by integrating the social aspect of vulnerability into the framework for making the quantitative risk assessment combining the physical vulnerability, the hazard and the exposure. The proposed method is applied to the southeast coastal area of Huizhou, which is a densely populated region and a petrochemical industrial belt in China, in order to quantify the overall risk levels utilizing a hydrodynamic and wave model, Geographical Information System (GIS) techniques, and Principal Component Analysis (PCA) method. The comprehensive risk assessment can provide much more precise and reliable risk-based zoning maps of storm surge. These maps were developed to assist government officials in locating storm surge flooding zones, determining the elements contributing to overall vulnerability to storm surge, understanding varying levels of storm surge risk among the communities, and identifying evacuation routes and convenient emergency shelters in advance.
The paper is a continuation of our previous studies. In the published paper (Wang et al., 2021c), the typhoon events under different scenarios of 10-, 20-, 50-, 100-, and 1000-year return periods for the study area were defined, and the Jelesnianski wind model and the coupled ADCIRC+ SWAN model were setup to simulate wind, water level, current, and wave. The simulated inundated depth was subsequently used to conduct hazard assessment, and the qualitative risk assessment of storm surge was performed in Huizhou. Based upon the data regarding simulated inundation depth and extent of storm surge flooding from the previous study, this paper is intended to perform exposure assessment, physical vulnerability assessment, and detailed quantitative risk assessment of storm surge using depth-damage functions and building footprints in Huizhou. Then, social vulnerability was evaluated, and the results of social vulnerability-based risk assessment was integrated into the framework of physical vulnerability-based risk assessment to make a comprehensive risk assessment in Huizhou. The remainder of the paper is divided into four sections: an overview of the study area and multi-source datasets are presented in Section 2; the methods for conducting model construction and verification, hazard assessment, social vulnerability assessment, physical vulnerability of buildings, and comprehensive risk assessment are introduced in Section 3; Section 4 provides the experimental results and analysis, and is followed by the conclusion of the paper in Section 5.
Study area and data
Study area
Huizhou, located between 22˚4’N and 23˚57’N latitudes and between 113˚51’W and 115˚28’W longitudes, is situated in China’s southern Guangdong Province, as shown in Figure 1A. Huizhou’s topography is characterized by low-lying south-eastern coastal districts with an elevation of less than ten meters, and storm surges reaching a height of 50 cm or more occurred 33 times and exceeding 100 cm occurred 7 times in Huizhou between 2006 and 2018.
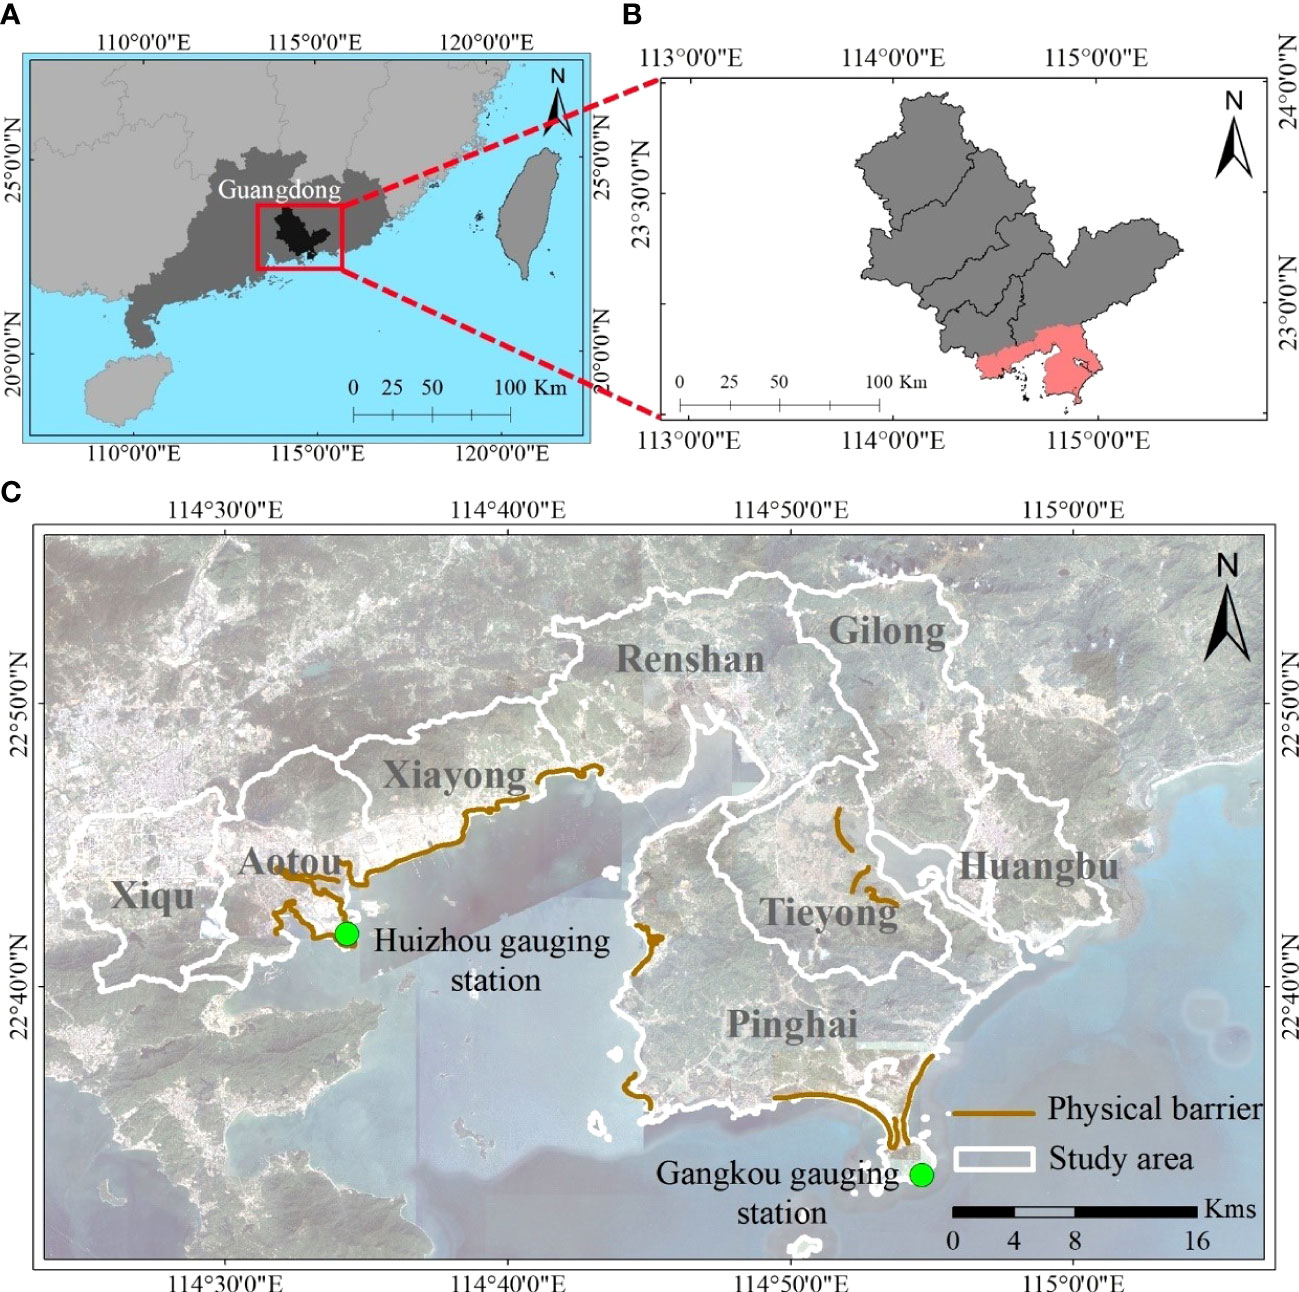
Figure 1 (A) The geographic location of Huizhou in China’s southern Guangdong Province; (B) The geographic location of the study area in Huizhou; (C) The satellite imagery of the study area (eight administrative units at the street/town level).
In coastal areas of Huizhou, there are a large number of tourism zones, residential buildings, and petrochemical complexes that are prone to coastal flooding due to storm surge. In particular, the Huizhou Daya Bay Zone has achieved an annual capacity of approximately 22 million tons/year of oil refining and 2.2 million tons/year of ethylene production in 2021, placing it first in China in terms of petroleum refining capacity (Huizhou, 2021). The storm surge flooding can cause damage to critical fuel facilities in the Daya Bay Zone. As shown in Figure 1B, the target region of study covers the area that extends inland approximately 10 kilometers from the coastline of Huizhou.
As displayed in Figure 1C, The territorial extent of the study area encompasses eight administrative divisions, which could be affected by the tropical cyclone-generated storm surge, namely Xiqu street, Aotou street, Xiayong street, Renshan twon, Pinghai twon, Tieyong town, Huangpu town, and Gilong town. In this study, the demographic information was collected, calculated, and aggregated for eight streets/towns, and risk levels of storm surge among these streets/towns were compared and analyzed.
Data
The observational data and survey data utilized in this study were acquired from national population censuses and government organizations. These datasets, which can be accessed through the website (https://doi.org/10.6084/m9.figshare.20407446.v5) were used to conduct the comprehensive risk assessment of storm surge, as described below.
1. The topographic data (Digital Elevation Models of Huizhou City) and the nearshore underwater topography data (the depth of underwater land) were used to construct the numerical model for simulating inundation depth and extent caused by storm surge. The data on topographic obstructions (barriers, rivers, coastal levees, and roads), which characterize local geographic features, were used to improve the accuracy of storm surge simulations.
2. The dataset (1949–2017) regarding historical tropical cyclones that affected the coastal area of Huizhou, which provides information on time, TC track, location, size, and intensity, was utilized to compute typhoon parameters for different return periods using Gumbel distribution. The dataset was downloaded from the China Meteorological Administration (CMA).
3. The water level data at the Huizhou tide gauge station constructed in 1974 and the Gangkou tide gauge station built in the 2006, both located in Huizhou’s coastal area, were used to track changes in peak sea level from 2006 to 2018. The recorded storm surge level data and water level data were used to validate the performance of numerical models by comparing predicted results with measured data.
4. The land use and land cover (LULC) dataset of Huizhou was obtained from the Huizhou Land and Resources Bureau. The numerical model for storm surge simulation uses Manning’s n values, which can be derived from the land cover and land use data, to parameterize bottom friction.
5. The socio-demographic dataset was obtained from the Huizhou Statistical Yearbook in 2020, the Da YA WAN Statistical Yearbook in 2019, and the Tabulation on the 2010 Population Census of Huizhou City (the Tabulation on the 2020 Population Census of Huizhou City was not available during the current study). The Economic and social data, which were accessible at the township level, were used to conduct social vulnerability assessments in the study area.
6. The dataset of building footprints of Huizhou, which includes information related to buildings’ locations and total areas, was utilized to assess physical vulnerability. The dataset was derived from the national administration of surveying.
Methodology and materials
The methodology aims to develop a procedure for conducting the comprehensive analysis of storm surge risk through the following: construction of hypothetical typhoon events, hazard assessment, physical vulnerability-based quantitative risk assessment, social vulnerability assessment, and comprehensive assessment, as shown in Figure 2.
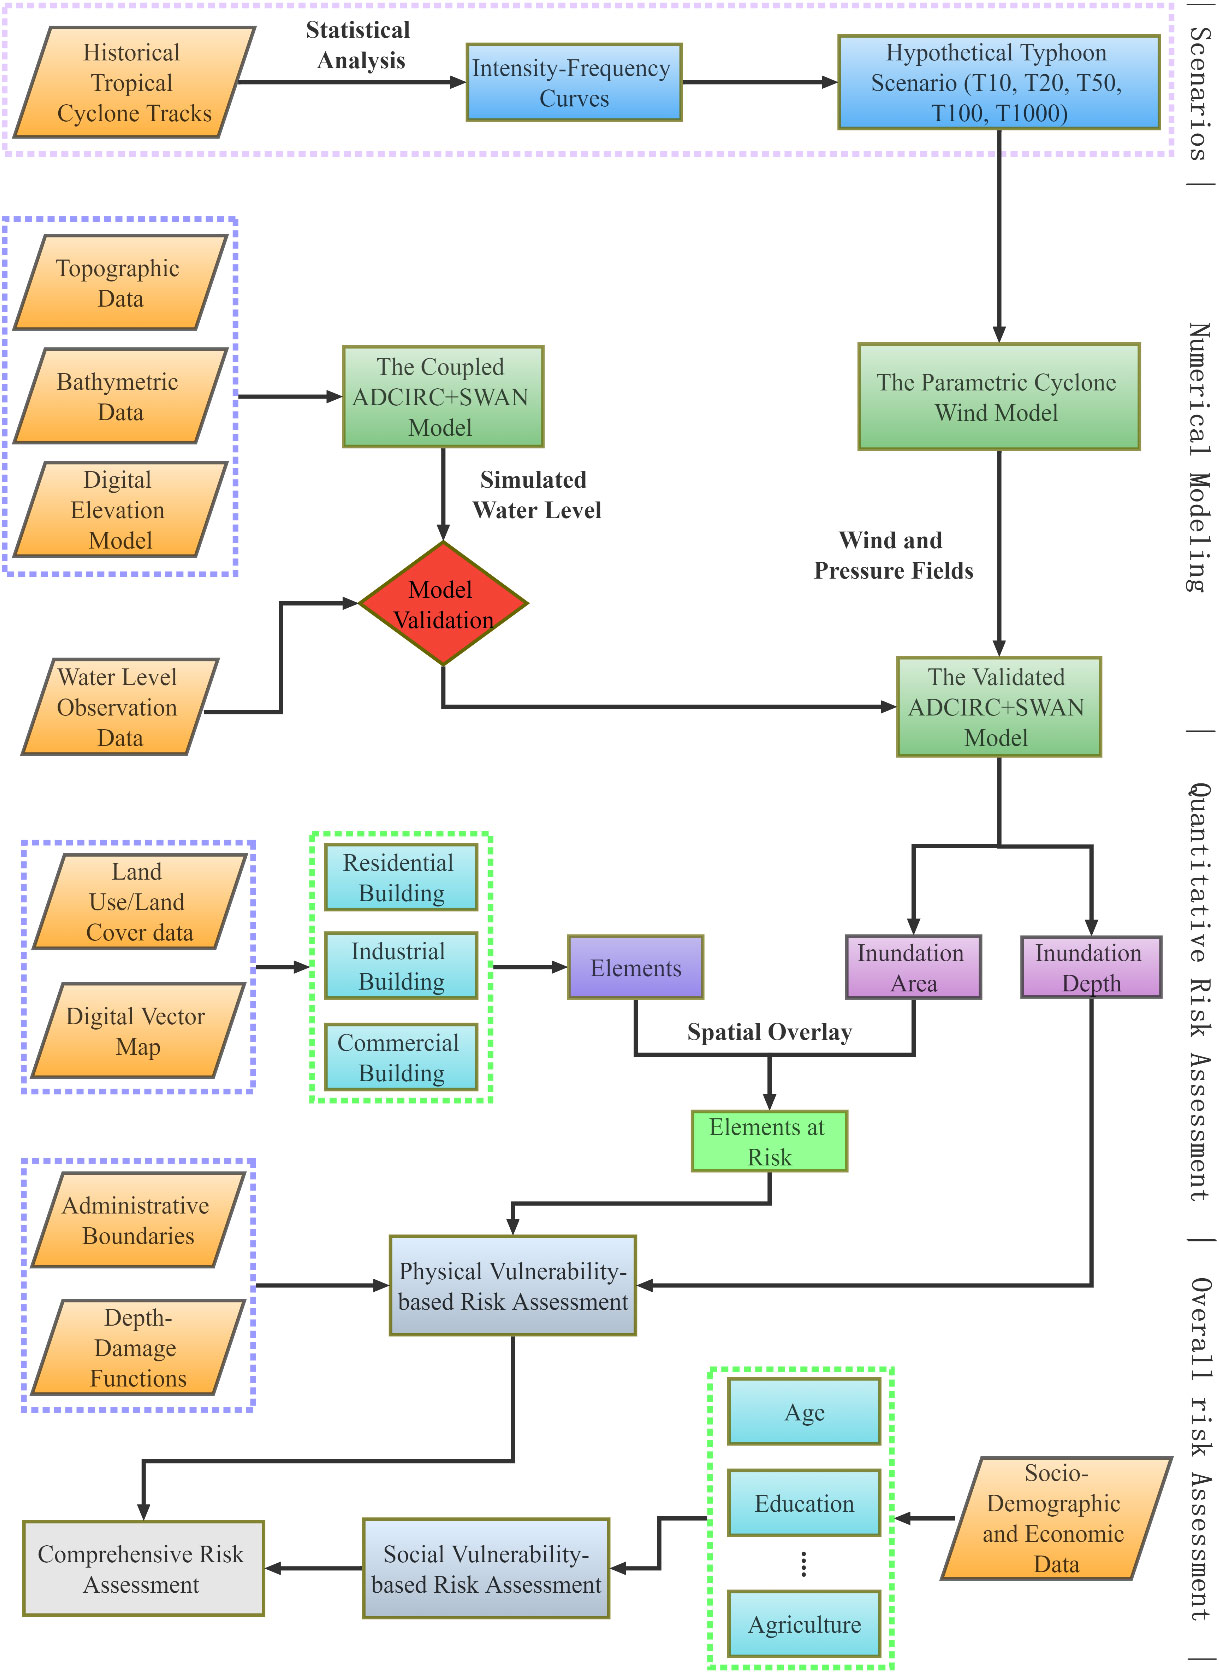
Figure 2 Flowchart of the proposed method for conducting the comprehensive risk assessment.
First, intensity-frequency curves were constructed using the Gumbel distribution, and values of parameters of tropical cyclones corresponding to define hypothetical typhoon scenarios were estimated. After that, the parametric cyclone wind model was utilized to simulate wind and pressure fields for each of typhoon scenarios, which can be transformed into wave and surge events through the calibrated 2D coupled model (ADCIRC+SWAN), generating the extent and depth of inundation from storm surge. For hazard assessment, hazard levels were evaluated based on defined critical inundation depths, and the hazard map, which presents the spatial distribution of hazard levels, was made at a specific return period. Then, the physical vulnerability-based risk assessment was performed according to the quantification of elements-at-risk and their corresponding depth-damage functions. Subsequently, the composite social vulnerability of communities to storm surge was quantified and assessed based on the Social Vulnerability Index (SoVI) and PCA method. Finally, the comprehensive risk level of storm surge was determined by merging the social vulnerability-based risk assessment with the previously obtained physical vulnerability-based risk assessment. The study area was divided into several zones with different risk levels according to estimations of economic damage and the distribution of composite social vulnerability.
Numerical model
Model setup
Although precipitation can increase the risk of coastal flooding, it is commonly associated with inland flooding (US Department of Health and Human Services and Centers for Disease Control and Prevention, 2019). Therefore, in this study, three numerical models, including the Jelesnianski wind model, the ADCIRC (ADvanced CIRCulation) model, and the SWAN (Simulating Waves Nearshore) model, were used to compute water elevations resulting from the combined effects of storm surge, astronomical tide, and waves during various typhoon periods without taking precipitation into consideration. The coastal inundation caused by the combined effects of storm surge, astronomical tide, and waves in the study area can be used to investigate the assessment of storm surge risk (Jelesnianski, 1965; Luettich et al., 1992; Booij et al., 1999).
The wave-current coupled model, consisting of the hydrodynamic ADCIRC and the wave SWAN, was executed in parallel with unstructured grids, considering the effects of waves on circulations. The ADCIRC model first interpolates the wind fields spatially and temporally to project them onto the computational vertices, and then simulates currents and water elevations. The data regarding currents and water elevations is transmitted to the wave model in order to compute the wave spectrum, which is subsequently retransmitted to the hydrodynamic model to recalculate the elevation and current velocity. Detailed information on the coupling mechanism can be found in the literature. (Dietrich et al., 2011; Dietrich et al., 2012). The coupled SWAN+ADCIRC model is driven by the wind field and pressure field, which are generated by the Jelesnianski parametric wind model. The basic equations of the Jelesnianski wind model are given in the Appendix.
The computational domain for simulating tide-surge and waves is 106.0° E–128.0° E and 13.0° N–28.0° N (Figure 3), covering the northern waters of the South China Sea and western parts of the East China Sea (Wang et al., 2021c). There are 74,328 elements and 38,407 nodes in the unstructured mesh. The unstructured grid resolution ranges from 100 m to 200 m near the coastlines up to 3 and reaches 30 km at the ocean boundary. Eleven tidal constituents (M2, N2, S2, K2, K1, O1, P1, Q1, MS4, M4, M6) (Wang et al., 2021b) were utilized to simulate tidal elevations at the ocean boundary during the simulation period. Moreover, according to the position and shape of the seawall, the elevation and shape of the seawall can be determined in the computation domain. In solving the continuity equation and the momentum equation, the seawall was discretized in the grid. The velocity vector can be partially differentially solved in three directions (x, y, and z) based on the shape of the seawall to guarantee mass conservation and momentum conservation. Thus, seawalls can be incorporated into storm surge simulation.
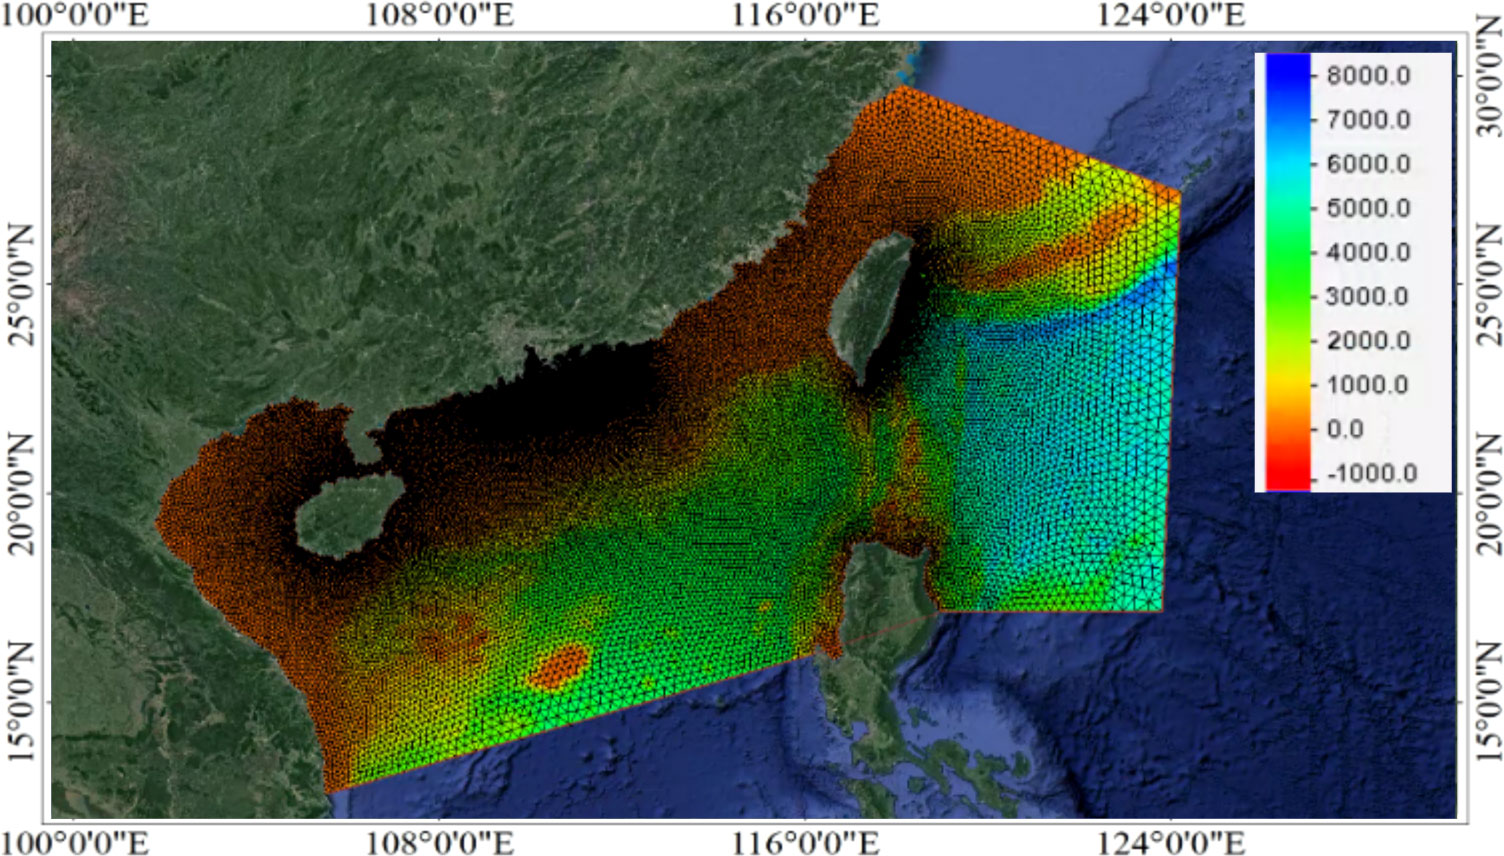
Figure 3 The computational domain with unstructured triangular grids.
Model calibration and validation
For accurately assessing storm surge hazard, the precision of water elevation prediction plays an important role. In this study, typhoon Hagupit (No. 0814), Molave (No. 0906), and Nida (No. 1604) events, which struck coastal areas of Huizhou and caused severe storm surge damage, were chosen to validate the wave-current (SWAN+ADCIRC) coupled model. Its performance is evaluated by comparing predicted total water elevations during these typhoon periods with the corresponding height of the maximum water level measured at Huizhou and Gangkou tide gauge stations. The time series of predicted total water elevations and measured resultant sea level summed of the astronomical tide level and storm surge level are shown in Figure 4 and statistical measures (RMSE and R2) calculated errors of the coupled model in predicted total water elevations are shown in Figure 5.
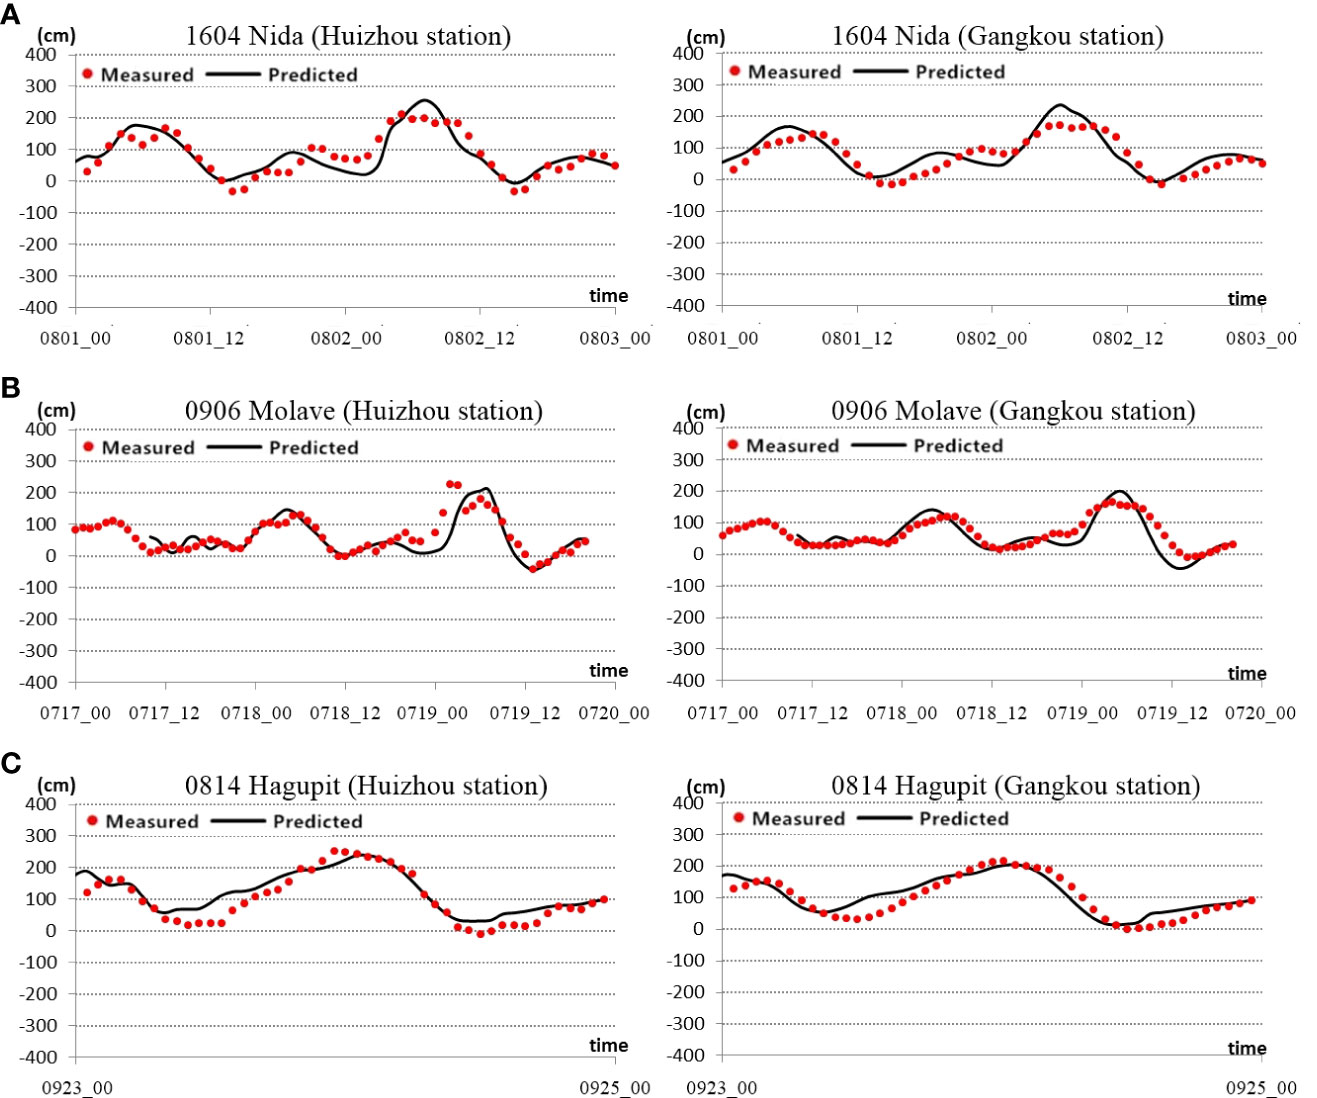
Figure 4 Time series of predicted total water elevations and actual water levels measured by tide gauge stations under the typhoon events (Hagupit (A), Molave (B), and Nida (C).
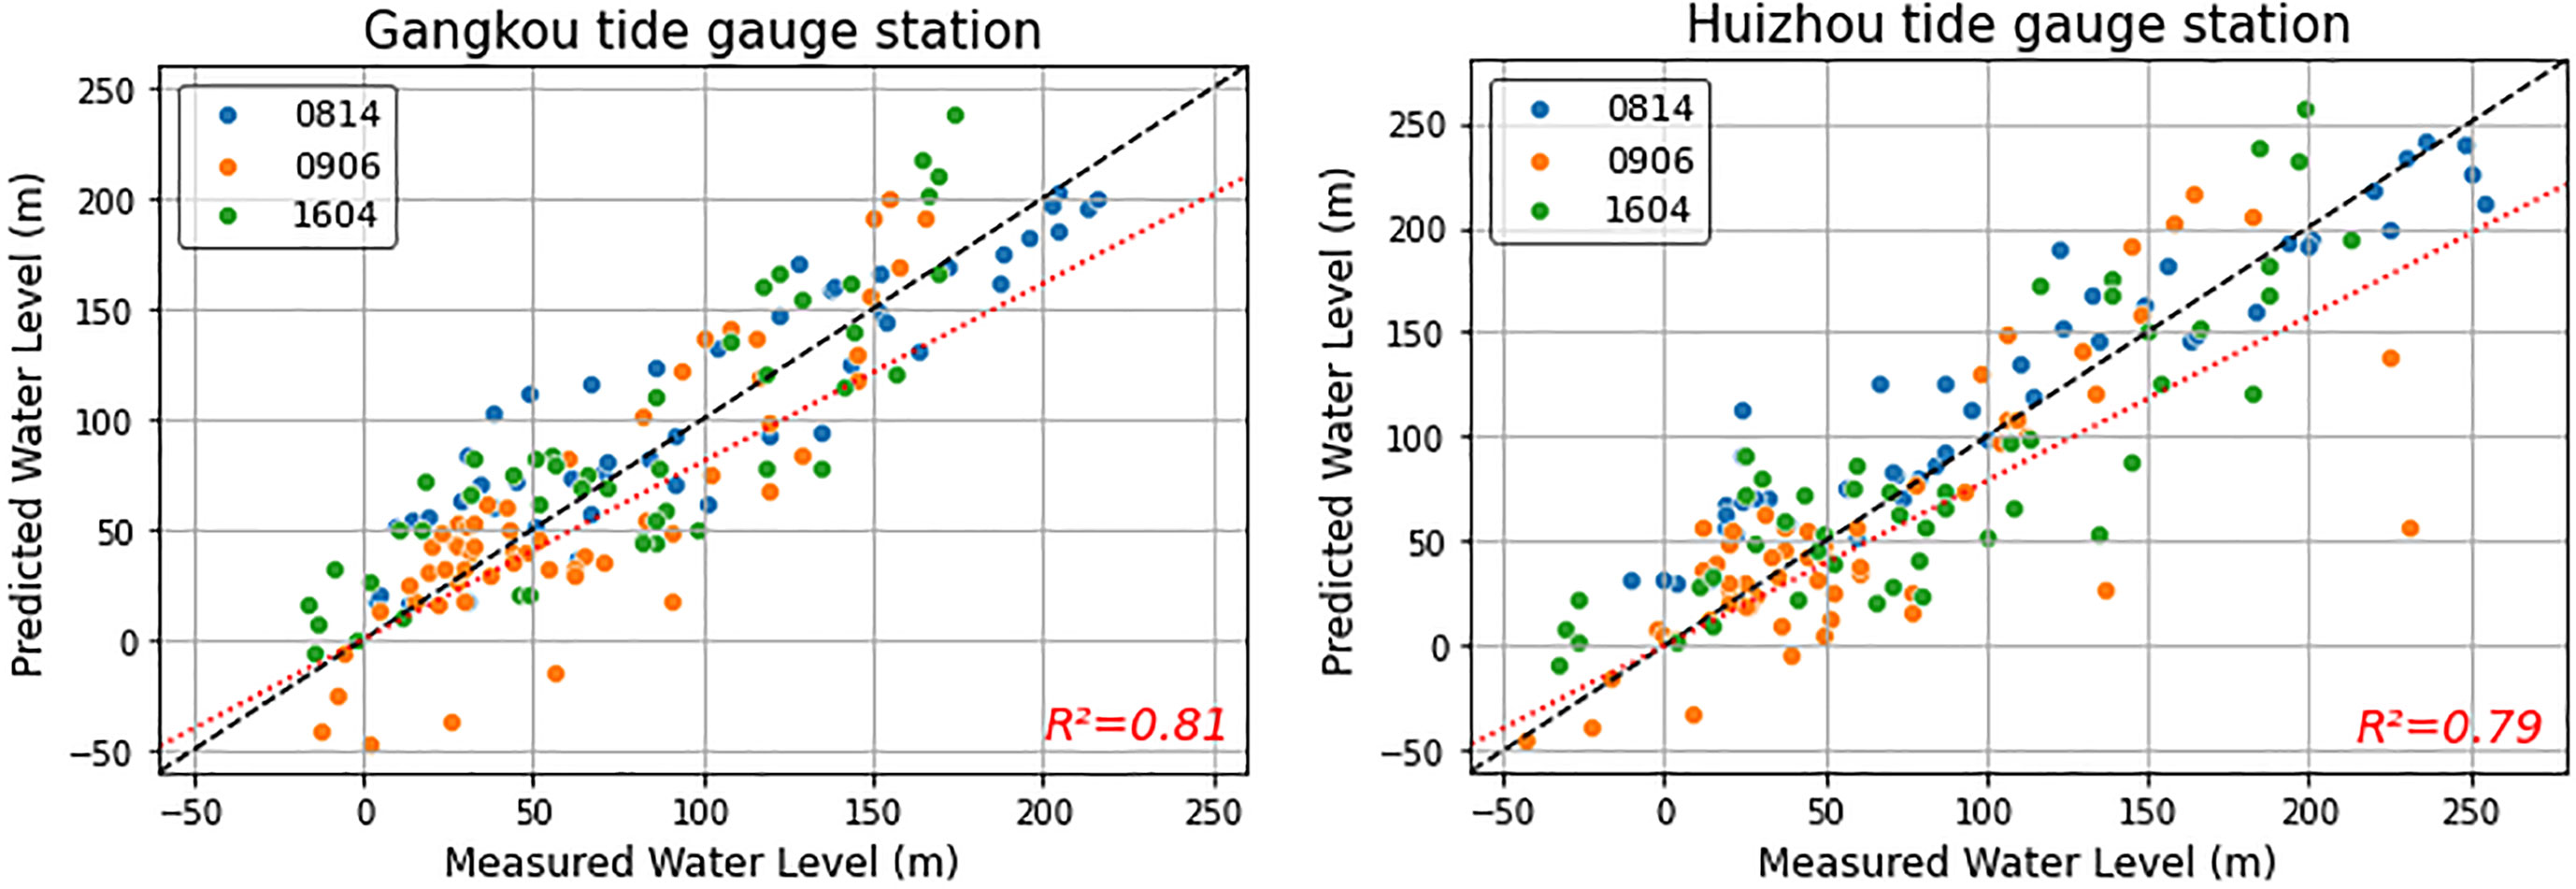
Figure 5 R-Squared between measured and predicted water elevations (astronomic tides and storm surges) during typhoon Hagupit (No. 0814), Molave (No. 0906), and Nida (No. 1604).
It can be noticed from Figure 4 that the predicted curves obtained from the coupled model are generally consistent with the observed water level data in phase and magnitude. The largest prediction errors that predicted data is lower than that of measured water elevation occurred in peak regions of water elevations during the 1604 typhoon event, which might be due to the coupled approach being less effective in simulating strong surge-tide interactions. Figure 5 shows that the R2 values resulting from the coupled model at Huizhou and Gangkou tidal stations during typhoon events are 0.81 and 0.79, respectively. The high values of R2 indicate that the coupled model has a good fit generated between predicted water elevations and observed data. Overall, the coupled model predicts total water elevations with high accuracy, demonstrating that the setup of the coupled model can be considered suitable and plausible for the study area.
Comprehensive risk assessment
Hazard and exposure assessment
As the greatest damage during typhoons is flooding from storm surges and associated inundation, the inundation depth and extent of the probable maximum storm surge (PMSS) are commonly used to assess hazard levels. In order to simulate PMSS, typhoon wind fields need to be used as input data to the validated coupled model. The wind field is uniquely determined by the key cyclone parameters, including the minimum central pressure (P0), the radius of maximum wind speed (Rmax), the maximum wind velocity (Vmax), and the cyclone track, in this study.
In terms of the first parameter, the minimum central pressure (P0) can be calculated using the probability distribution curve, cited from the published paper (Wang et al., 2021c). For example, the expected minimum central pressure for a typhoon with a return period of 100 years hitting the study area is estimated to be 910hPa.
For the second parameter, the radius of maximum wind speed (Rmax) was calculated based on the empirical statistical equations (1)-(3) and the empirical formula (4) developed from northwest Pacific typhoon data (2001-2016).
Where ΔP is pressure deficit, ∅ denotes the latitude of the center position of the tropical cyclone, and Rk takes a constant value of 50.
For the typhoon with a 100-year return period (P0 = 910hPa), Rmax was calculated as 31 km by averaging the values computed from equations (1)-(4) and the measured values from northwest Pacific typhoon data.
With respect to the third parameter, the maximum wind velocity (Vmax) is computed from the empirical equation (5). As a result, the Vmax for the typhoon with a 100-year return period landing in the study area is approximately 61 m/s.
The fourth parameter, cyclone track, was set to the 33synthetic parallel tracks of the tropical cyclone at an interval of a fixed distance of 5 km deviated from the observed track of super typhoon Mangkhut (1822). Detailed information on computing cyclone parameters can be found in the previously published paper (Wang et al., 2021c).
Consequently, the values of cyclone parameters corresponding to representative defined typhoon scenarios (10, 20, 50, 100, and 1000-year) were calculated according to the process above, as shown in Table 1.
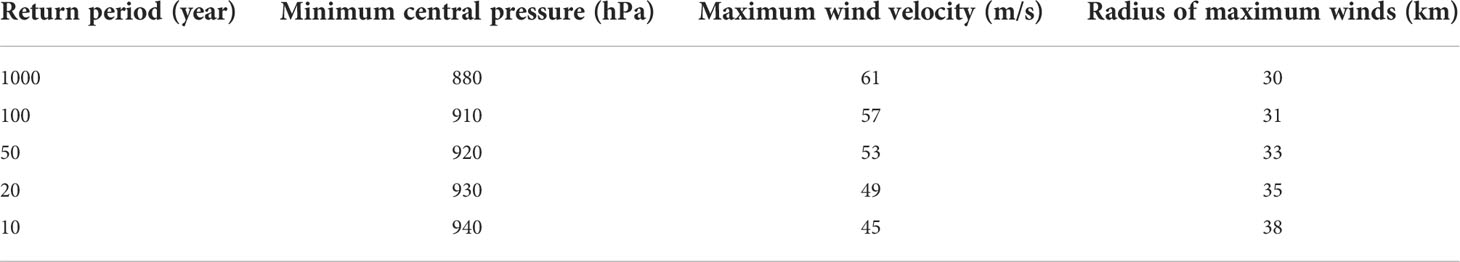
Table 1 Values of typhoon parameters for different hypothetical typhoon scenarios.
For each scenario, the typhoon wind field was transformed into a storm surge event by the coupled SWAN+ADCIRC model, producing a time series of total water elevations. The storm surge simulation during the ADCIRC+ SWAN stage was run for 83 hours. The simulated maximum water elevations outputted from the surge-tide-wave model for the last 12 hours under the each of scenarios were imported as points into the GIS environment. Then, the Inverse Distance Weighted (IDW), Buffer command, and Extract by Mask methods were carried out to obtain the inundation mapping of storm surge flooding within the study area from these discrete points. Consequently, hazard maps can be generated based on maximum inundation depths of storm surge flooding on the ArcGIS platform. Four hazard levels of storm surge were assigned by the inundation depth ranges (very high hazard: >3.0 m, high hazard: 1.2 m-3.0 m, moderate hazard: 0.5 m-1.2 m, and low hazard: 0.15 m-0.5 m) according to the criterion in the guideline of storm surge risk assessment (Liu et al., 2019).
Subsequently, inundated layers were overlaid on element layers to perform exposure assessment, which can identify and quantify elements situated in storm surge hazard-prone regions, using mapping and analysis tools of ArcGIS 10.5. In this study, the element layers, including commercial, residential, and industrial buildings, were generated from the building footprint dataset. The overlapping areas of inundated layers and element layers allow for the analysis of the impact of storm surges on different types of buildings within the study area.
Quantitative risk assessment
The physical vulnerability-based risk is quantified based on many factors: the amount of element-at-risk, the type of individual building, the inundated total area, and vulnerability curves. The potential monetary damage for different types of buildings is generally estimated by using vulnerability curves. In this study, inundation depth was regarded as the input parameter in vulnerability curves for estimating momentary damage, and the country-specific depth-damage curves for each type of building in China were adapted from a database provided by JRC (Huizinga et al., 2017). Because these maximum damage values were calculated at the 2010 price level, it is necessary to adjust them for the year 2020 using equation 6.
Where Maxdamage2020 represents the maximum damage value for the year 2020, Maxdamage2010 represents the maximum damage value computed at the year 2010, CPI is Consumer Price Index for the year 2020.
The CPI data for China were obtained from the World Bank (The World Bank, 2021), using the year 2010 as the reference, and thus the value of CPI is around 128. The inflation-adjusted maximum damage values corresponding to the year 2020 specifically for buildings in China and the relationship of storm surge damage to the individual building at a given inundation depth are presented in Figure 6.
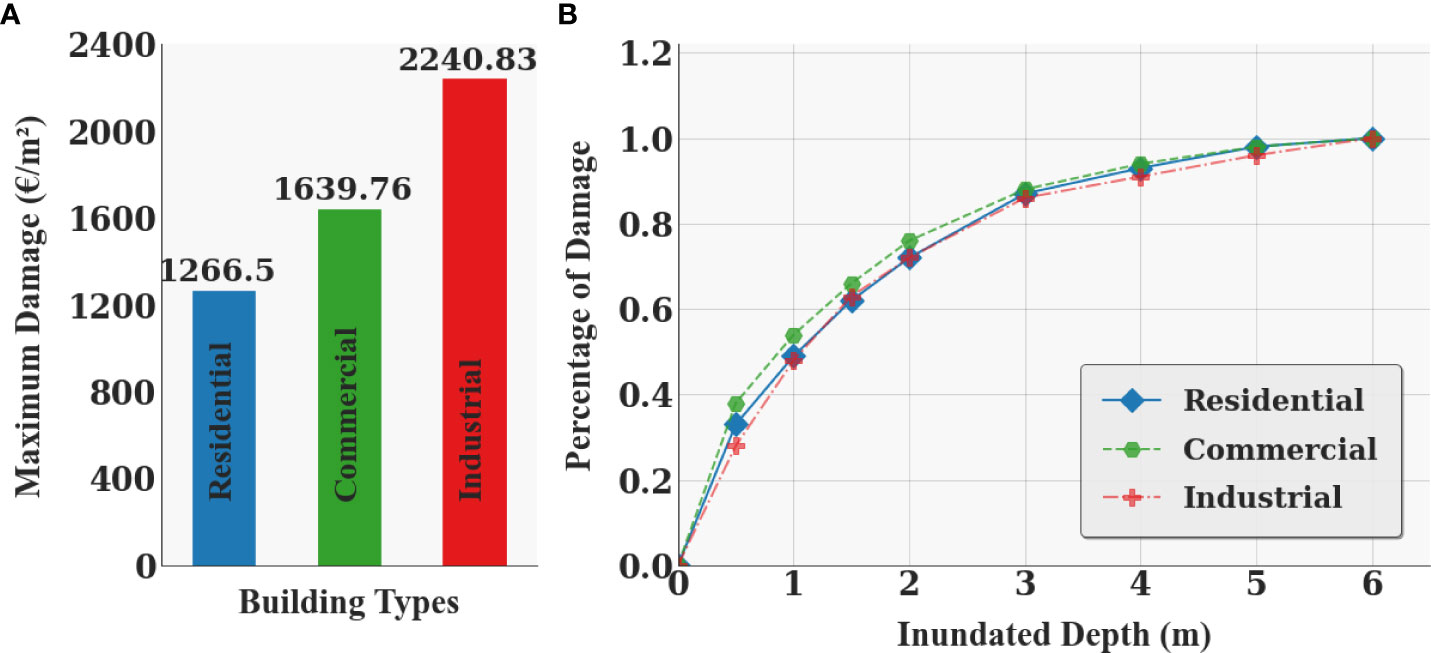
Figure 6 Depth–damage curves for different types of buildings. (A) The maximum monetary damage per square meter for Chinese buildings. (B) Relative depth-damage curves relate the damage fraction to the inundation depth.
As observed in Figure 6, the relative depth–damage curves in Figure 6B characterize the degrees of damage for residential, commercial, and industrial buildings that could result from a certain inundation depth. These damage fraction values range from 0 to 1, and are scaled with the corresponding maximum damage value per square meter in Figure 6A.
The inundated areas were combined spatially with building footprints to determine the number and total inundated area of exposed elements. Based on depth-damage curves for each type of building, the expected damage was calculated using equation 7.
Where ED is the expected damage due to storm surge for each of streets/towns, n refers to the number of exposed buildings T(i) is the building type of the i-th building and DT(i) is the corresponding maximum damage value. The peak storm surge height hi is computed for the i-th building and PD (hi) is the damage percentage for the i-th building at a specific surge height. ARi refers to the area of the i-th building inundated by storm surge flooding.
The expected monetary damage value was categorized into four defined levels using the quartile classification method, and a storm surge risk zoning map based on physical vulnerability for eight streets/towns was created.
Social vulnerability
Social vulnerability refers to the characteristics of social groups or communities that determine their ability to withstand and respond to the adverse impact of a hazard (Van Zandt et al., 2012). The use of the Social Vulnerability Index (SoVI), originally developed by Cutter (Cutter et al., 2003), is nowadays a widely prevalent approach to assess and quantify social vulnerability. The SoVI is an aggregate composite index that combines a set of social indicators representing the diverse dimensions of vulnerability to evaluate variations in relative levels of social vulnerability across regions. The assessment of social vulnerability to storm surge for this study area using the indicator-based approach SoVI was conducted in three steps.
Step I: Obtaining statistical data for eight streets/towns in the study area and selecting social vulnerability indicators to construct the indicator framework. However, there is no standard set of established indicators, and the indicator selection is subjective and often depends strongly on the data availability. After reviewing previous academic literature (Cutter et al., 2009; Rufat et al., 2015b; Fatemi et al., 2017) on the selection of indicators, it is generally accepted that indicators used in social vulnerability assessment tend to focus on demographic and socioeconomic aspects.
Based on collected statistical data, nine commonly used indicators characterizing the demographic, social, and economic features of a community were selected to quantify social vulnerability, ignoring belief in protection measures, attitudes towards disaster, and perceptions of risk in this study. These selected nine indicators and the numerical ranges of the indicators for eight streets/towns were summarized in Table 2, and their assumed influence on social vulnerability were described below.

Table 2 Indicators utilized to assess social vulnerability in the study area.
Children below the age of 15 years lack the knowledge, experience, and physical strength to withstand disasters. People aged 65 and over have lower disease resistance and cannot relocate quickly from one location to another. Their high proportion can increase the vulnerability of a community (Cutter et al., 2003; Koks et al., 2015). People without a level of education might have difficulty understanding emergency plans or warning information to avoid risky situations (Wamsler et al., 2012). A high ratio of it can increase a community’s vulnerability. Because of biological differences, women and girls are more likely to experience adverse effects from hazards than men, which can increase a community’s vulnerability (Kuhlicke et al., 2011). Larger households are associated with more people sharing fewer available resources, which can cause a higher risk of being vulnerable to storm surge flooding (Rogelis et al., 2016; Heß, 2017). The minority groups might experience difficulty in communicating with the largest ethnic group, the Han, in China during a flooding event. Thus, the high minority proportion generally leads to a high vulnerability (de Sherbinin and Bardy, 2015). Natural disasters may cause more deaths in areas with a high population density, making these areas more vulnerable to natural disasters (Cutter et al., 2003; Yoon, 2012). Agriculture is a highly nature-dependent economic activity and is susceptible to coastal flooding (Gayen et al., 2021). The region with more agricultural output might suffer agricultural damage and a declining rice yield from storm surge flooding due to a higher value of exposed agricultural production. Rural areas are more vulnerable to storm surge flooding compared to urban areas due to poverty and limited public facilities (Chen et al., 2013; Kumar et al., 2016). So, agricultural output value per capita and the proportion of rural areas are considered as vulnerability-increasing indicators.
Step II: Performing normalization, reduction, analysis, and aggregation on the data of selected indicators. On the basis of the obtained data, values of these nine variables were standardized using the z-score transformation. A z-score with a positive value indicates the data value is above the mean, and the z-score is negative if it lies below the mean. It can convert indicators to be on the same scale, allowing the comparison of different types of indicators. Then, the Principal Components Analysis (PCA) method was applied to the normalized values of variables by running the SPSS, and varimax rotation was employed to reduce a large number of selected indicators into a smaller set of latent components that are orthogonal to one another. Each component can represent a particular characteristic of vulnerability. After that, a composite SoVI score was computed by the additive combination of all equally unweighted component scores. The low SoVI score indicates low social vulnerability.
Step III: Mapping social vulnerability through the classification of SoVI scores. The composite SoVI scores were categorized into four equal groups, which correspond to four levels of social vulnerability, using the quartile classification method. Based on the composite SoVI scores, a SoVI map was made to visualize the spatial distribution and compare social vulnerability levels among eight streets/towns. The SoVI map was overlaid with the storm surge hazard layer in ArcGIS 10.5 to generate the social vulnerability-based risk map for the study area.
Results and discussion
Hazard and exposure assessment
The spatial distribution and evolution trend of storm surge flooding were displayed on the ArcGIS platform. To understand the variation in the inundation, maps of storm surge-induced flooding under typhoon scenarios with different time periods were made. As shown in Figure 7, potential storm surge flooding under the typhoon event with an assumed return period of 100 years was selected for mapping. The maps of the inundation area were updated every two hours for the 12 hours of the simulation.
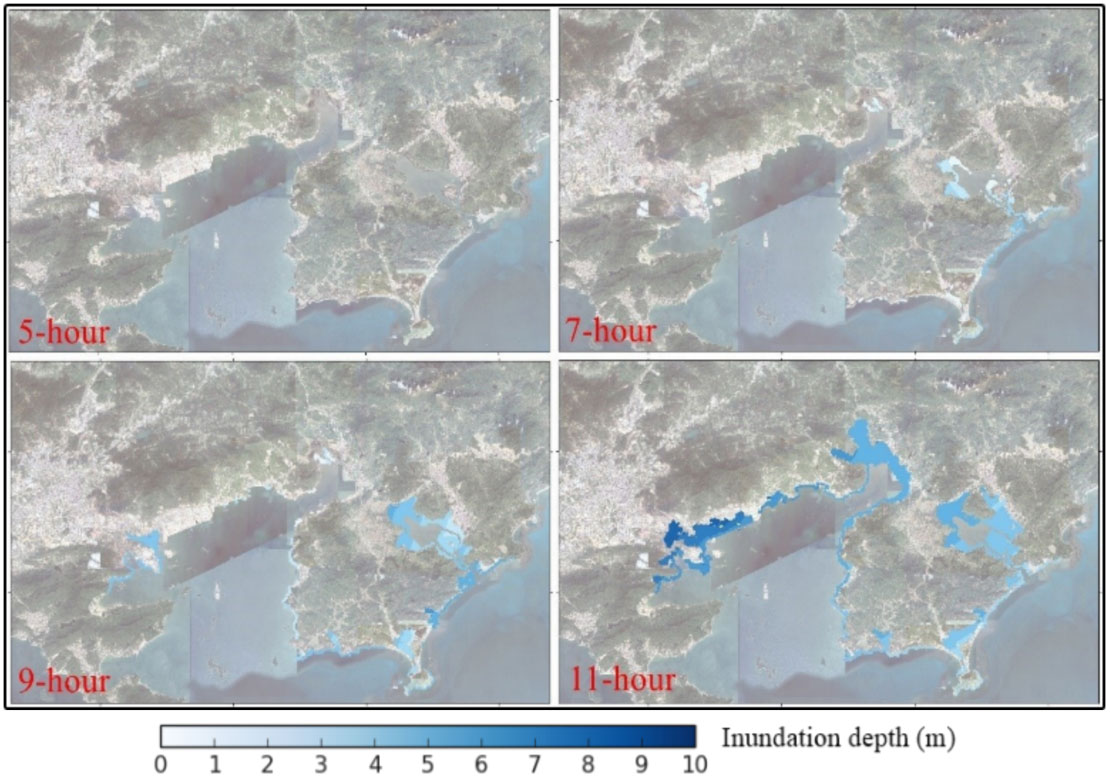
Figure 7 The spatially inundated area of storm surge flooding from the hydrodynamic simulation for 100-year return period of typhoon.
It can be seen from Figure 7 that the study area has been inundated since the sixth hour, and the extent of inundated areas rises with time for the hypothetical typhoon of the 100-year return period. The southeastern parts of the study area mainly were severely impacted by storm surge-induced coastal inundation at the seventh hour. The reason for this phenomenon is the combined effects of river water flow within southeastern regions and storm surges over the top of barriers. The majority of coastal areas within the study area were inundated as storm surge levels had risen above the height of flood barriers since the ninth hour. The largest inundation extent of storm surge flooding is observed at the eleventh hour, following which it gradually decreases due to the typhoon’s weakened intensity.
According to different ranges of maximum inundation depths, the storm surge hazard was categorized into four levels (low: 0.15 m-0.5 m; moderate: 0.5 m-1.2 m; high: 1.2 m-3.0 m; very high: 3.0 m-+∞). The statistical data regarding the inundation depth of storm surge flooding and total areas at storm surge hazard are presented in Table 3 and Figure 8. Figure 9 shows the building footprint layer spatially overlaid with inundated area layers for the subsequent investigation of exposure.

Table 3 Values of total inundated area and areas that are at hazard of storm surge inundation.
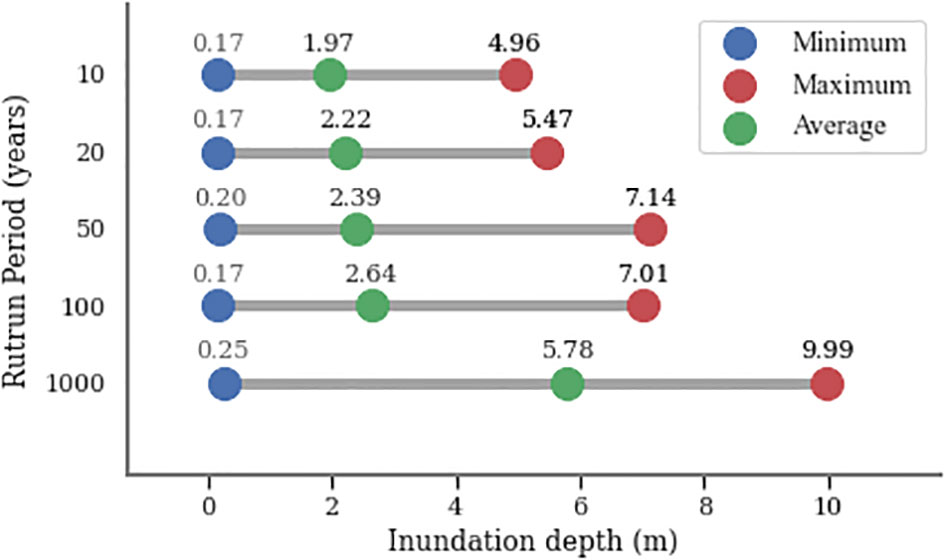
Figure 8 The maximum and minimum inundation depth for different defined typhoon scenario.
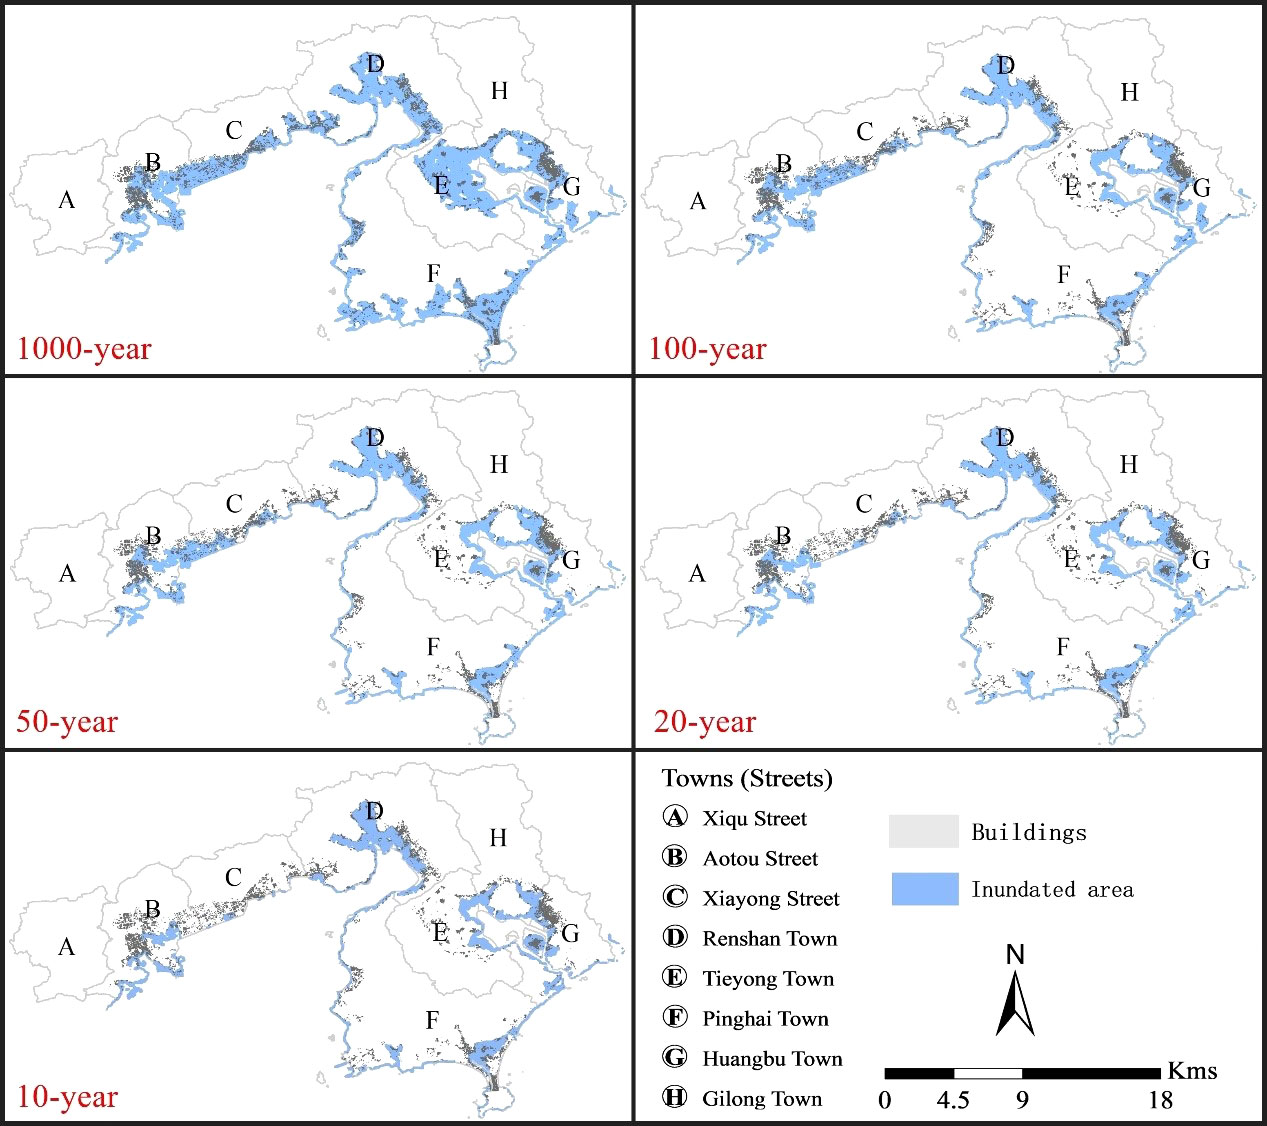
Figure 9 The maps of exposure assessment under five typhoon scenarios. Different letters mean different name of towns or street in the study area.
The following can be observed from Figure 8, Figure 9, and Table 3: (1) The average inundation depth and maximum inundated area obviously increase overall with the increase in return period. The total inundated areas under the typhoon scenario with return periods of 1000, 100, 50, 20, and 10 years are 266.07 km2, 156.64 km2, 145.81 km2, 127.16 km2, and 112.56 km2, respectively. The average inundation depths for the various scenarios are 5.78 m for 1000-year, 2.64 m for 100-year, 2.39 m for 50-year, 2.22 m for 20-year, and 1.97 m for 10-year. (2) For the return period of 1000 years, the range of the inundated depth is 0.25–9.99 m, and 221.88 km2 and 38.01 km2 correspond to a very high level and a high level, respectively, of hazard from storm surge, which account for about 97.68% of the total inundated area. It indicates the coastal defense structures covering a total distance of approximately 79.488 km are subjected to storm surge flooding under the one-in-1000-year typhoon event. (3) The average inundation depth is about 2.64 m for a return period of 100 years and it is estimated to be 2.39 m for a return period of 50 years. The difference in the geographical area mapped under high, moderate, and low level between these two return periods is not significant, and the only difference is the area in the very high level of storm surge hazard. The reason might be that the storm surge flooding resulting from a 50-year typhoon event cannot propagate further through the inland areas where the elevation is relatively higher than that in coastal areas. (4) For the 20-year return period, the total inundated area is 127.16 km2, and the area occupied by different levels ranged from low (3.36 km2), moderate (23.72 km2), high (77.36 km2), and very high (22.72 km2). Among them, the inundated area at high level hazard accounted for 60.84%, occupied the maximal percentage, and the total inundated area would barely reduce from the 20-year return period towards the return period of 10 years. It suggests that coastal defense structures are able to alleviate the storm surge hazard during typhoon events with a return period of less than 20 years. (5) According to the exposure assessment, Aoto Street (B), Renshan Town (D), Pinghai Town (F), and Huangbu Town (G) could suffer severely storm surge-related damage under the typhoon event with a return period of 1000 years because these regions with a high building density are exposed to the increased storm surge hazards. During simulation of lower return periods (10, 20, 50, 100 years), the inundated areas are not substantially expanded, and the noticeable difference is the maximum inundation depth, and thus huge economic losses might occur in Renshan Town (D) and Huangbu Town (G).
Social vulnerability assessment
After carrying out the PCA method on the normalized values of the selected variables introduced in Table 2, the Eigenvalue and proportion of the variance associated with each principal component are presented in Table 4.
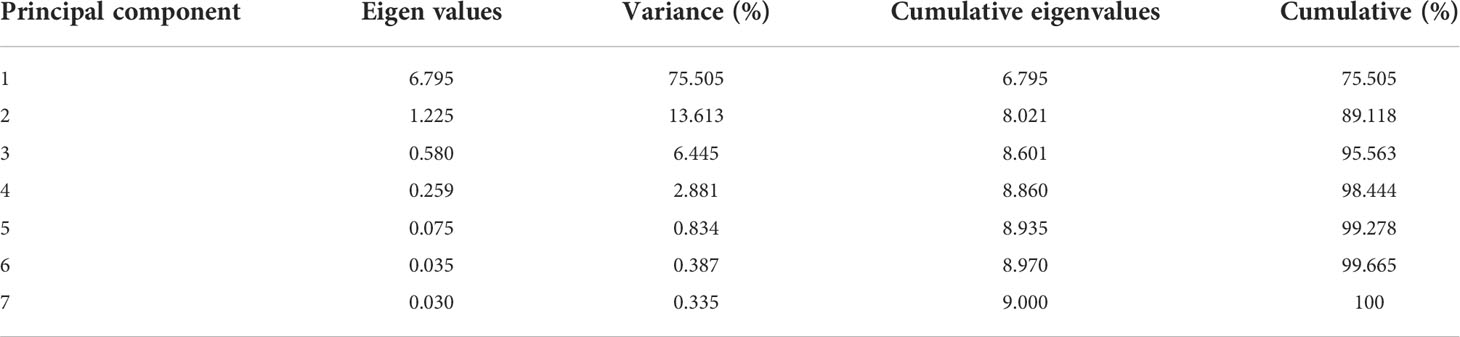
Table 4 Principal component analysis, eigenvalues and variance.
Table 4 shows that the first principal component accounted for the most variance (75.51%) and the second one for 13.61%. These two principal components explained 89.12% of the variance in the original data, which can cover most of the information in the initial indicators due to the cumulative value ≥ 80% (Liu and Li, 2016). Therefore, the principal components can be interpreted to represent indicators to assess social vulnerability. Then, the principal components PC1 and PC2 can be derived by linear combination using the elements of the eigenvectors and standardized variables. Subsequently, the composite SoVI score for each of the streets/towns in the study area was calculated by adding the value of each principal component multiplied by the corresponding percentage of variance explained, and the equation is as follows:
The composite SoVI scores for all eight streets/towns are listed in Table 5, and the streets/towns are ranked based on their corresponding SoVI score. The higher composite SoVI score indicates that the street/town is more vulnerable to storm surge flooding.
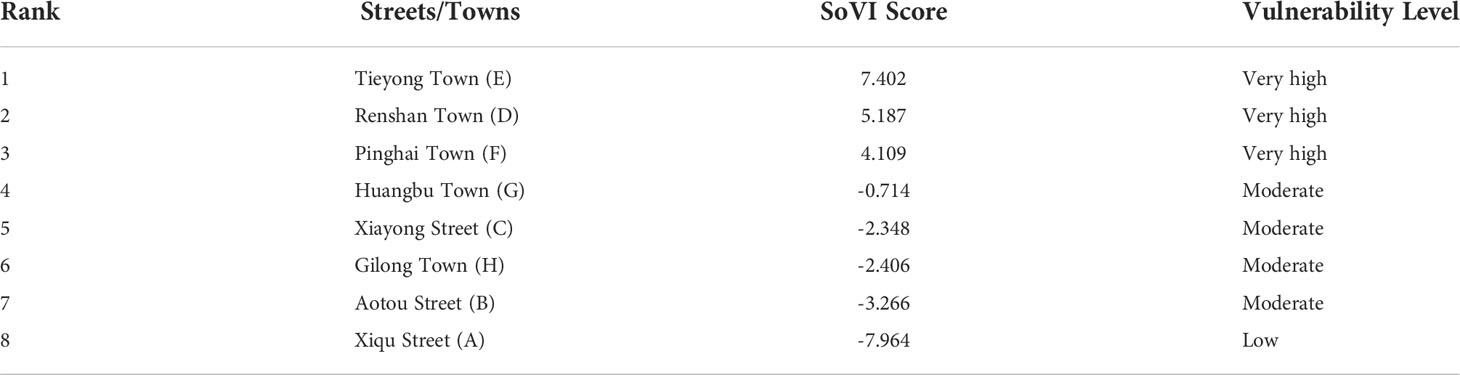
Table 5 SoVI scores and vulnerability levels for different streets/towns in the study area.
In order to describe the SoVI-based vulnerability level for each town/street, the composite SoVI scores were classified into four different levels (low, moderate, high, and very high) using an equal interval classification (Table 5).
To identify some of those most vulnerable towns/streets, composite SoVI scores were mapped according to the defined four levels. Maps of the spatial distribution of selected indicators and the level of social vulnerability in the study area are shown in Figure 10. The geographic distribution of social vulnerability levels based on composite SoVI scores is displayed in Figure 11.
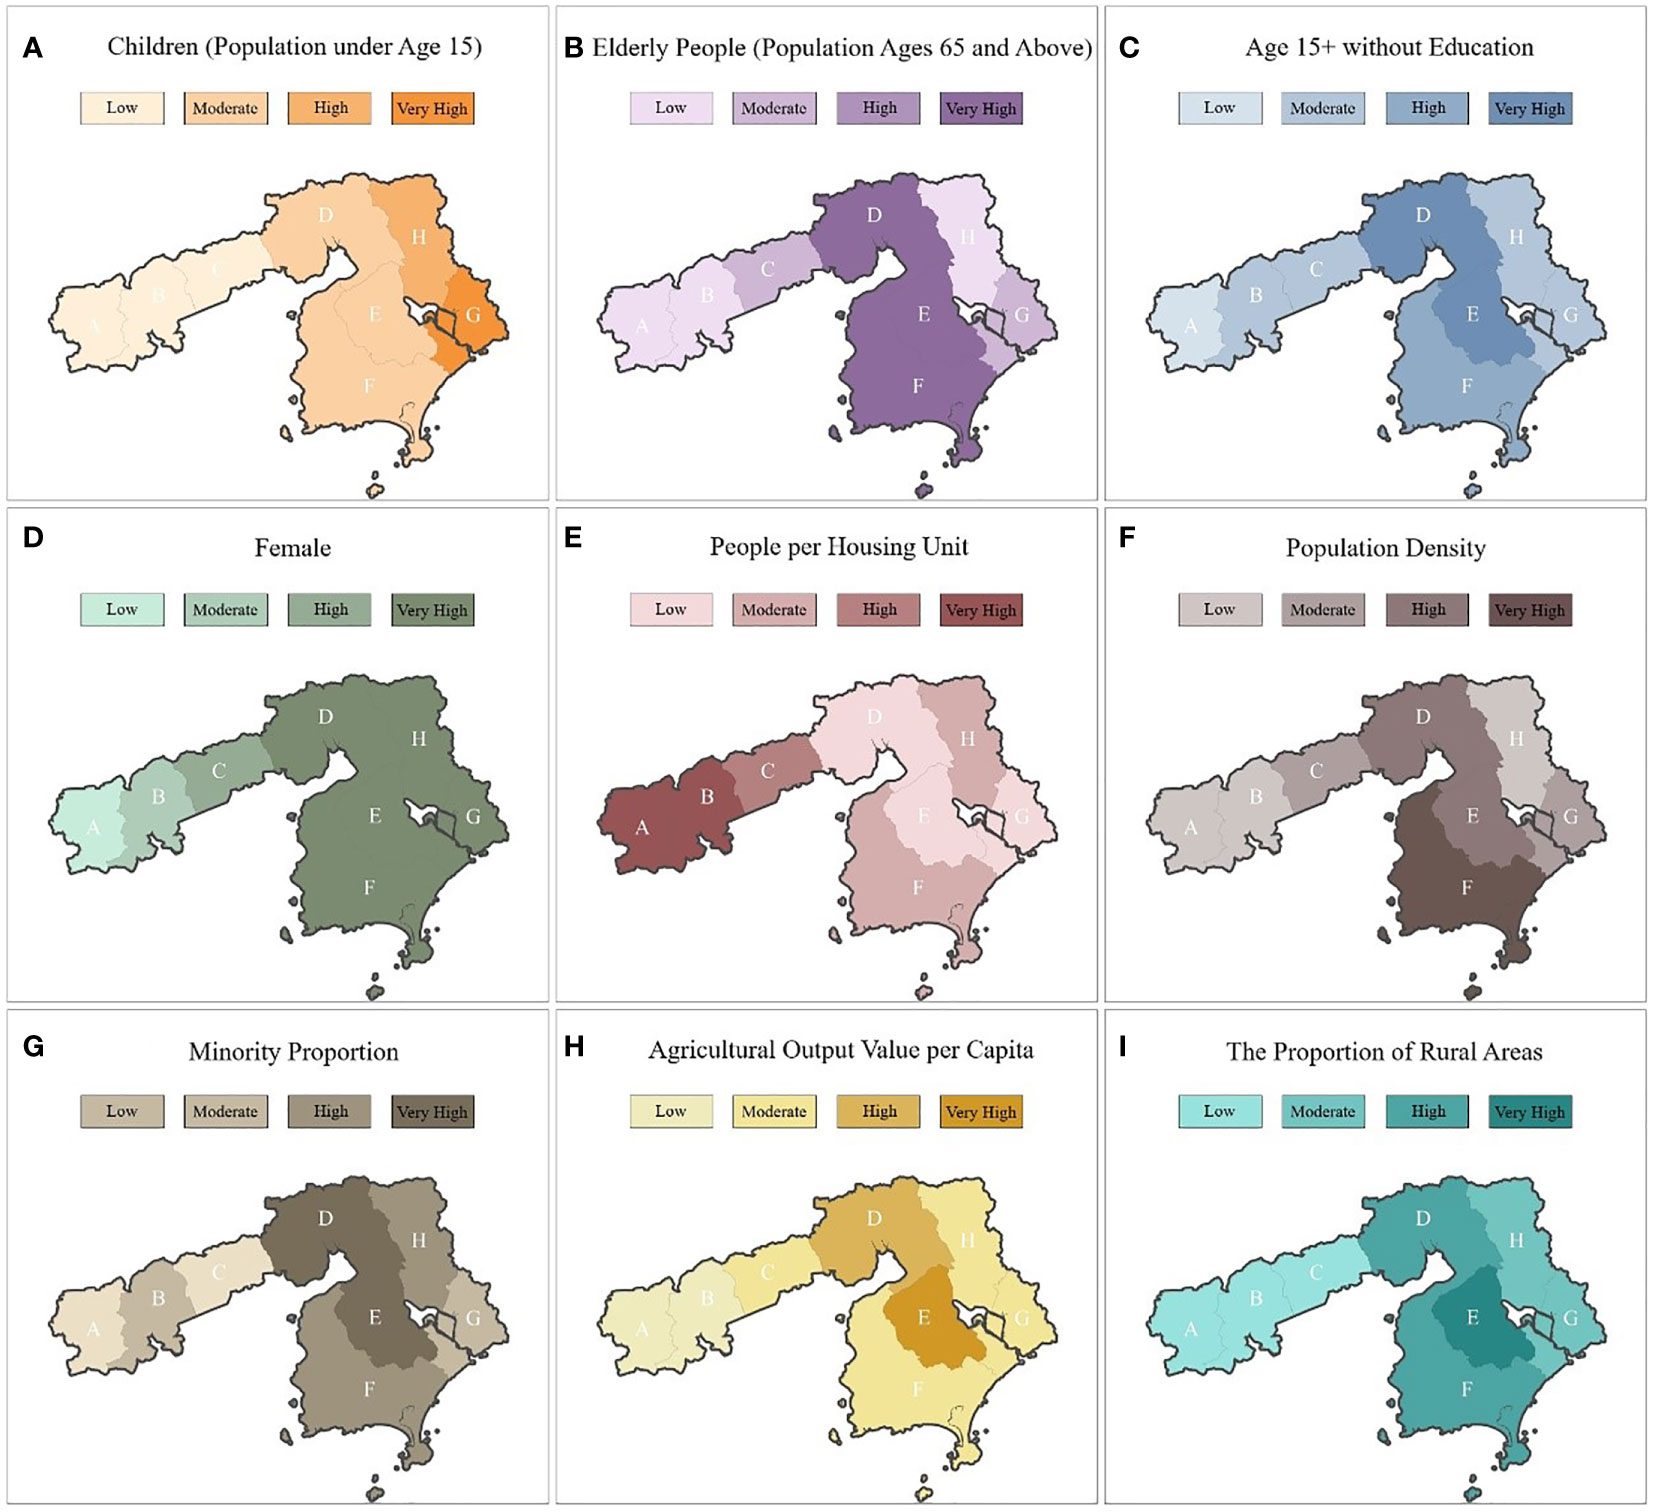
Figure 10 Mapping of spatial distribution of individual indictor and level of social vulnerability in the study area [(A) Children (Population under age 15,); (B) Elderly people (Population ages 65 and above); (C) Age 15+ without education; (D) Female; (E) People per housing unit; (F) Population density; (G) Minority proportion; (H) Agricultural output value per capita; (I) The proportion of rural areas].
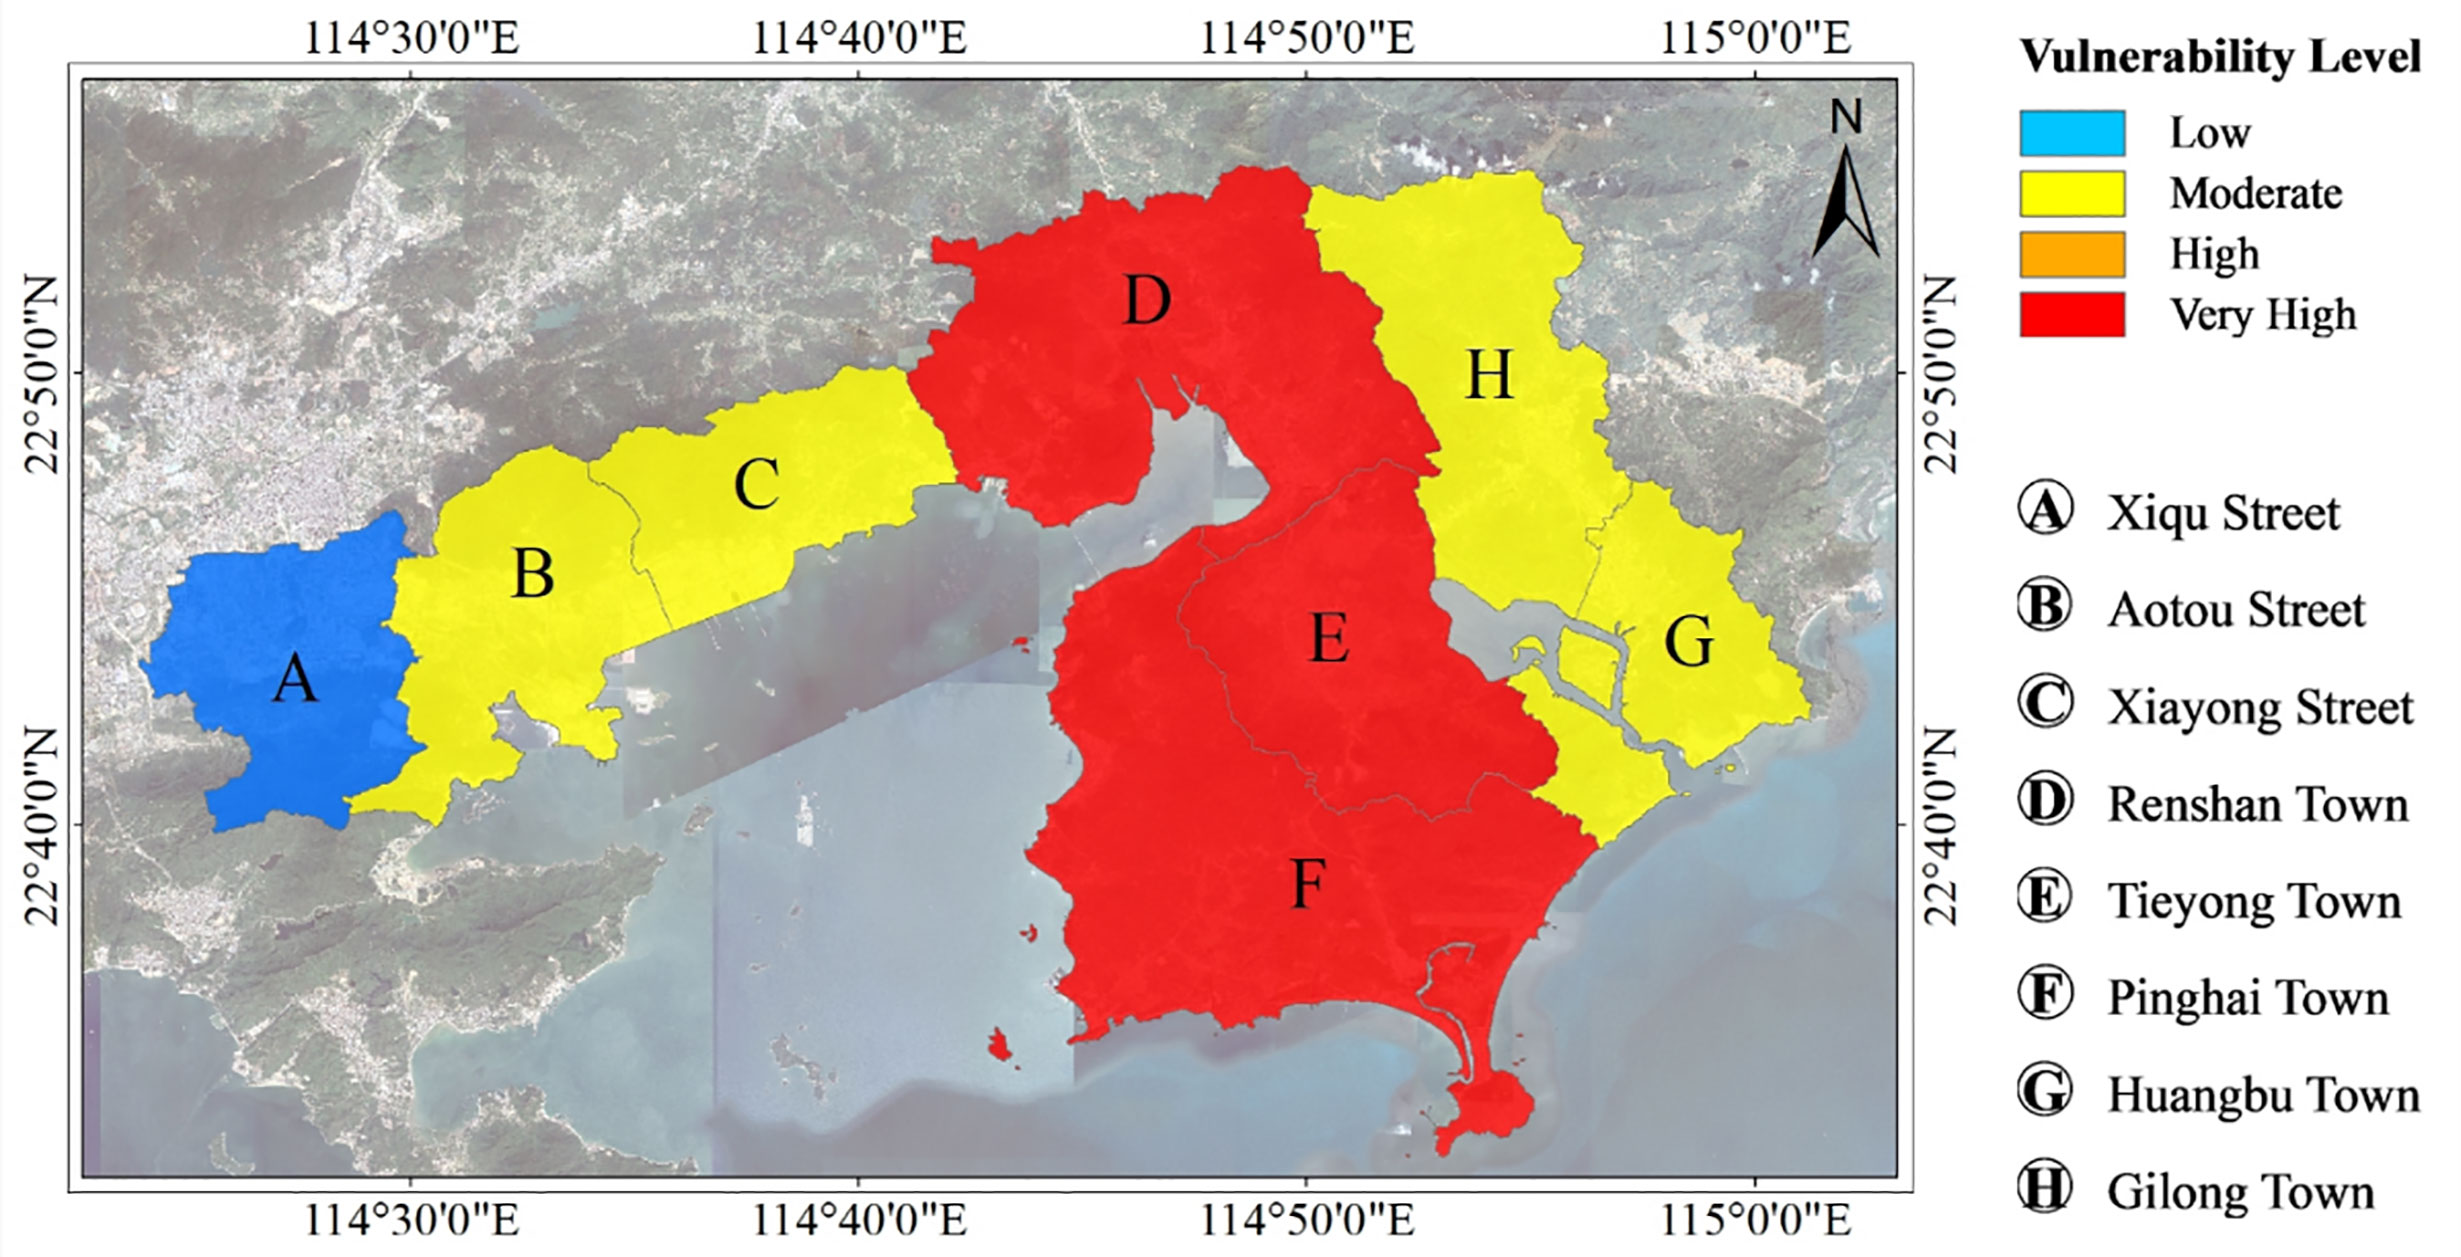
Figure 11 Mapping of the comparative social vulnerability of streets/towns based on the SoVI in the study area.
The following can be observed from Figure 10, Figure 11, and Table 5: (1) The SoVI score ranges from -7.964 (least vulnerable) to 7.402 (most vulnerable). Among eight streets/towns, Tieyong Town (E) has the highest SoVI at 7.402, which indicates it is most vulnerable to the negative effects of a natural disaster. It might be attributed to its high scores for agricultural value and people per housing unit. Xiqu Street (A) shows the lowest vulnerability value of -7.964 because the low scores on its relevant indicators result in a low level of social vulnerability. (2) Four streets/towns, including Aotou Street (B), Gilong Town (H), Xiayong Street (C), and Huangbu Town (G), are categorized as having a moderate level of social vulnerability, with SoVI values ranging from -3.266 to -0.714. These streets/towns are at a moderate level because five indicators, including females, children, age 15+ without education, agricultural output value per capita, and the proportion of rural areas, have low scores. (3) Due to high scores on indicators of population density, females, children, elderly people, age 15+ without education, people per housing unit, agricultural output value per capita, and the proportion of rural areas, a very high level of social vulnerability can be found in Tieyong Town (E), Renshan Town (D), and Pinghai Town (F).
Comprehensive risk assessment
The inundated areas of residential buildings, commercial buildings, and industrial buildings within the study area were calculated from the exposure map (Figure 9), as presented in Table 6. Using the exposure map and depth-damage curve described in Section 3, the estimated economic damages for a range of building types in eight distinguished streets/towns are displayed in Figure 12.
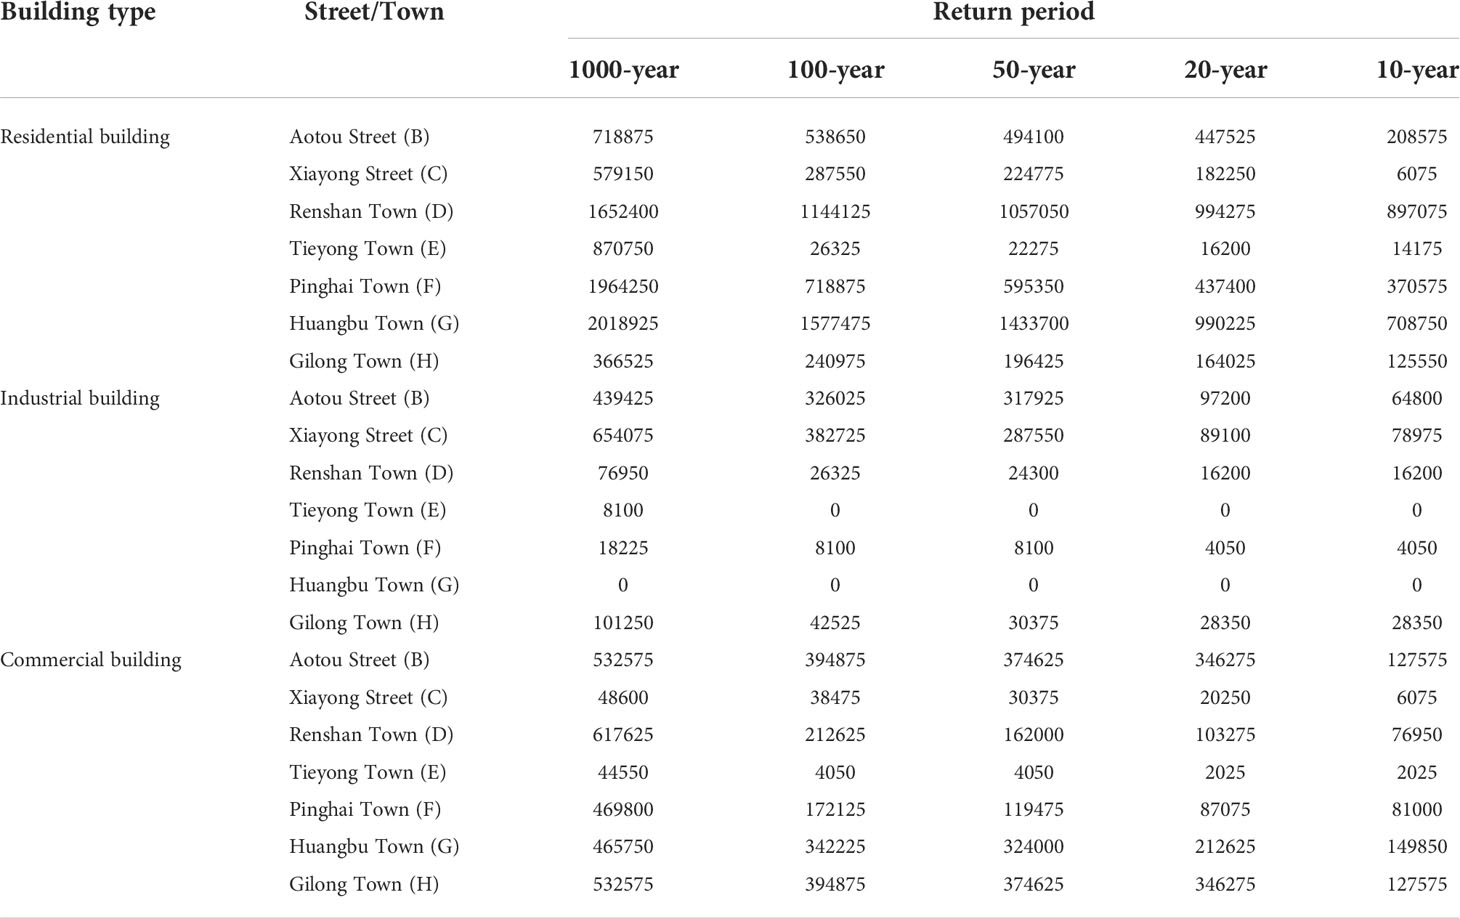
Table 6 Statistics of inundated area for different types of building in 8 streets/towns under different return periods of typhoon (m2).
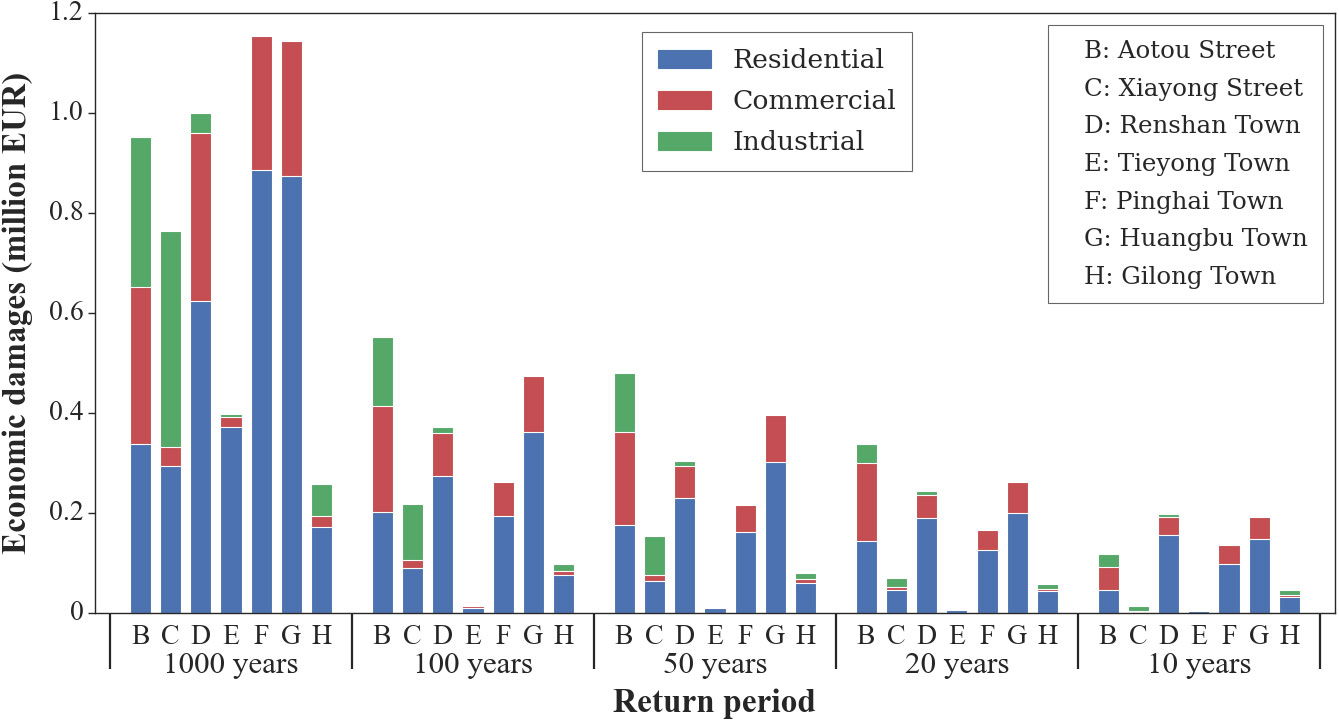
Figure 12 The estimated economic damage for different categories of buildings in 8 streets/towns under five different typhoon scenarios.
The following can be observed from Figure 12 and Table 6: (1) As expected, the total economic damage due to storm surge increases with the increase in the return period of a typhoon. During a 1000-year typhoon event, the most affected building is the residential building, with an estimated economic loss of €3,559,218 EUR, followed by the commercial building and the industrial buildings. The estimated areas of residential buildings, commercial buildings, and industrial buildings inundated by storm surge flooding are 8.17 km2, 1.30 km2, and 2.22 km2 correspondingly, accounting for 70%, 11.1%, and 18.9% of the total inundated area. The results are consistent with earlier research (Wang et al., 2021c) indicating that the majority of total potential losses were reflected in settlements. The considerable economic damage to the industrial zones in Aotou Street (B) and Xiayong Street (C) is due to the fact that industrial areas have a large area exposed to the storm surge hazard, whereas settlements in these two streets have less affected areas by the hazard. (2) Buildings with a total building footprint area of 6.879 km2 and a total economic loss of €551,783 EUR would be affected by storm surge under the 100-year typhoon scenario, which is not a noticeable difference from the affected area of 6.081 km2 and the economic loss stood at €479,119 EUR under the 50-year typhoon scenario. This is attributed to the fact that there is no significant increase in inundation extent from one scenario to another. Damages and losses are most likely geographically concentrated in Aotou Street (B), Renshan Town (D), and Huangbu Town (G), which have greater concentrations of buildings. (3) The expected economic losses for a 20-year and 10-year return period are €1,142, 383 EUR and €709, 024 EUR, respectively. The economic damage value for the typhoon event with a 1,000-year return period is nearly three times greater than the economic damage value for the 20-year and seven times greater than the economic damage value for the 10-year. This is owing to the fact that standards-based levees in the study area can defend against storm surges caused by typhoons with a 10 or 20-year return period.
Thus, the physical vulnerability-based risk maps of storm surge under different return periods of typhoon were constructed according to the total estimated economic damage, as shown in Figure 13. The social vulnerability-based risk maps of storm surge were derived from the combination of the hazard maps of storm surge and the map of SoVI-based social vulnerability (Figure 11) using the risk matrix method. By incorporating vulnerability-based risk maps with equal weighting into these physical vulnerability-based risk maps, more reliable and accurate risk maps were made, allowing for a more comprehensive understanding of streets/towns at risk, as presented in Figure 14.
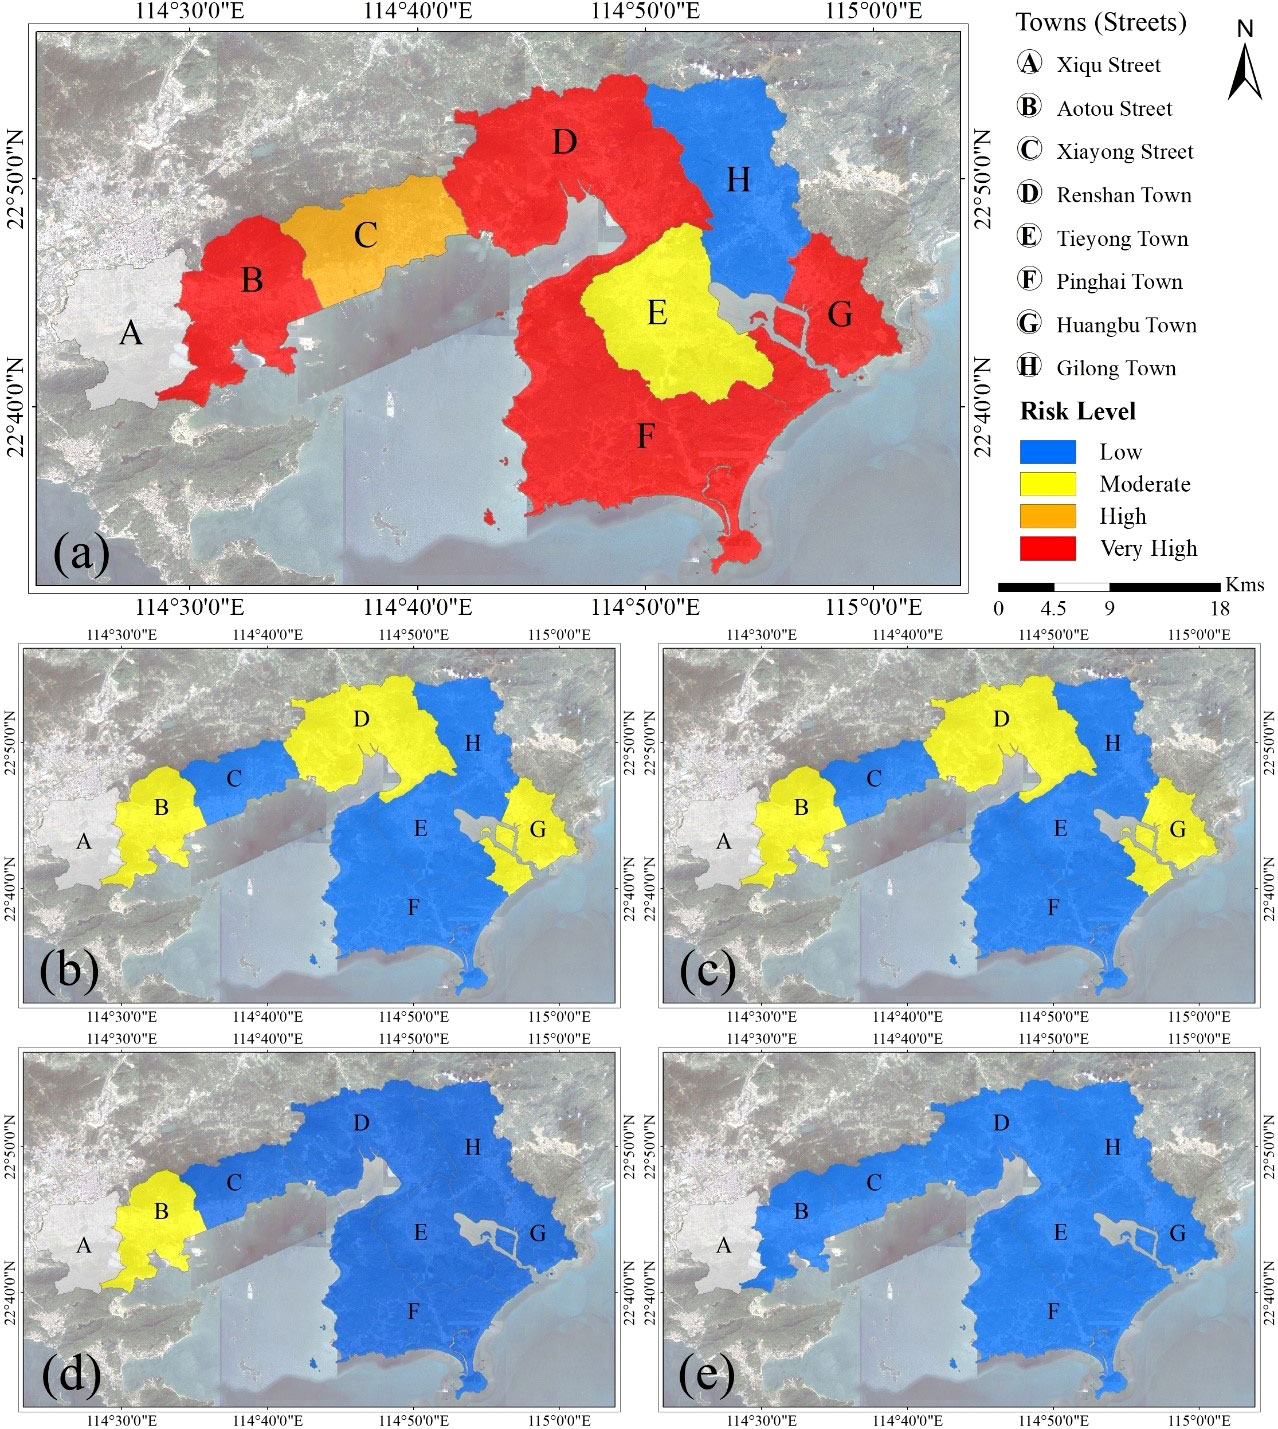
Figure 13 The risk zonation maps based on quantitative risk assessment of storm surge under different typhoon scenarios (1000-year (A), 100-year (B),50-year (C), 20-year (D) and 10-year (E) return period).
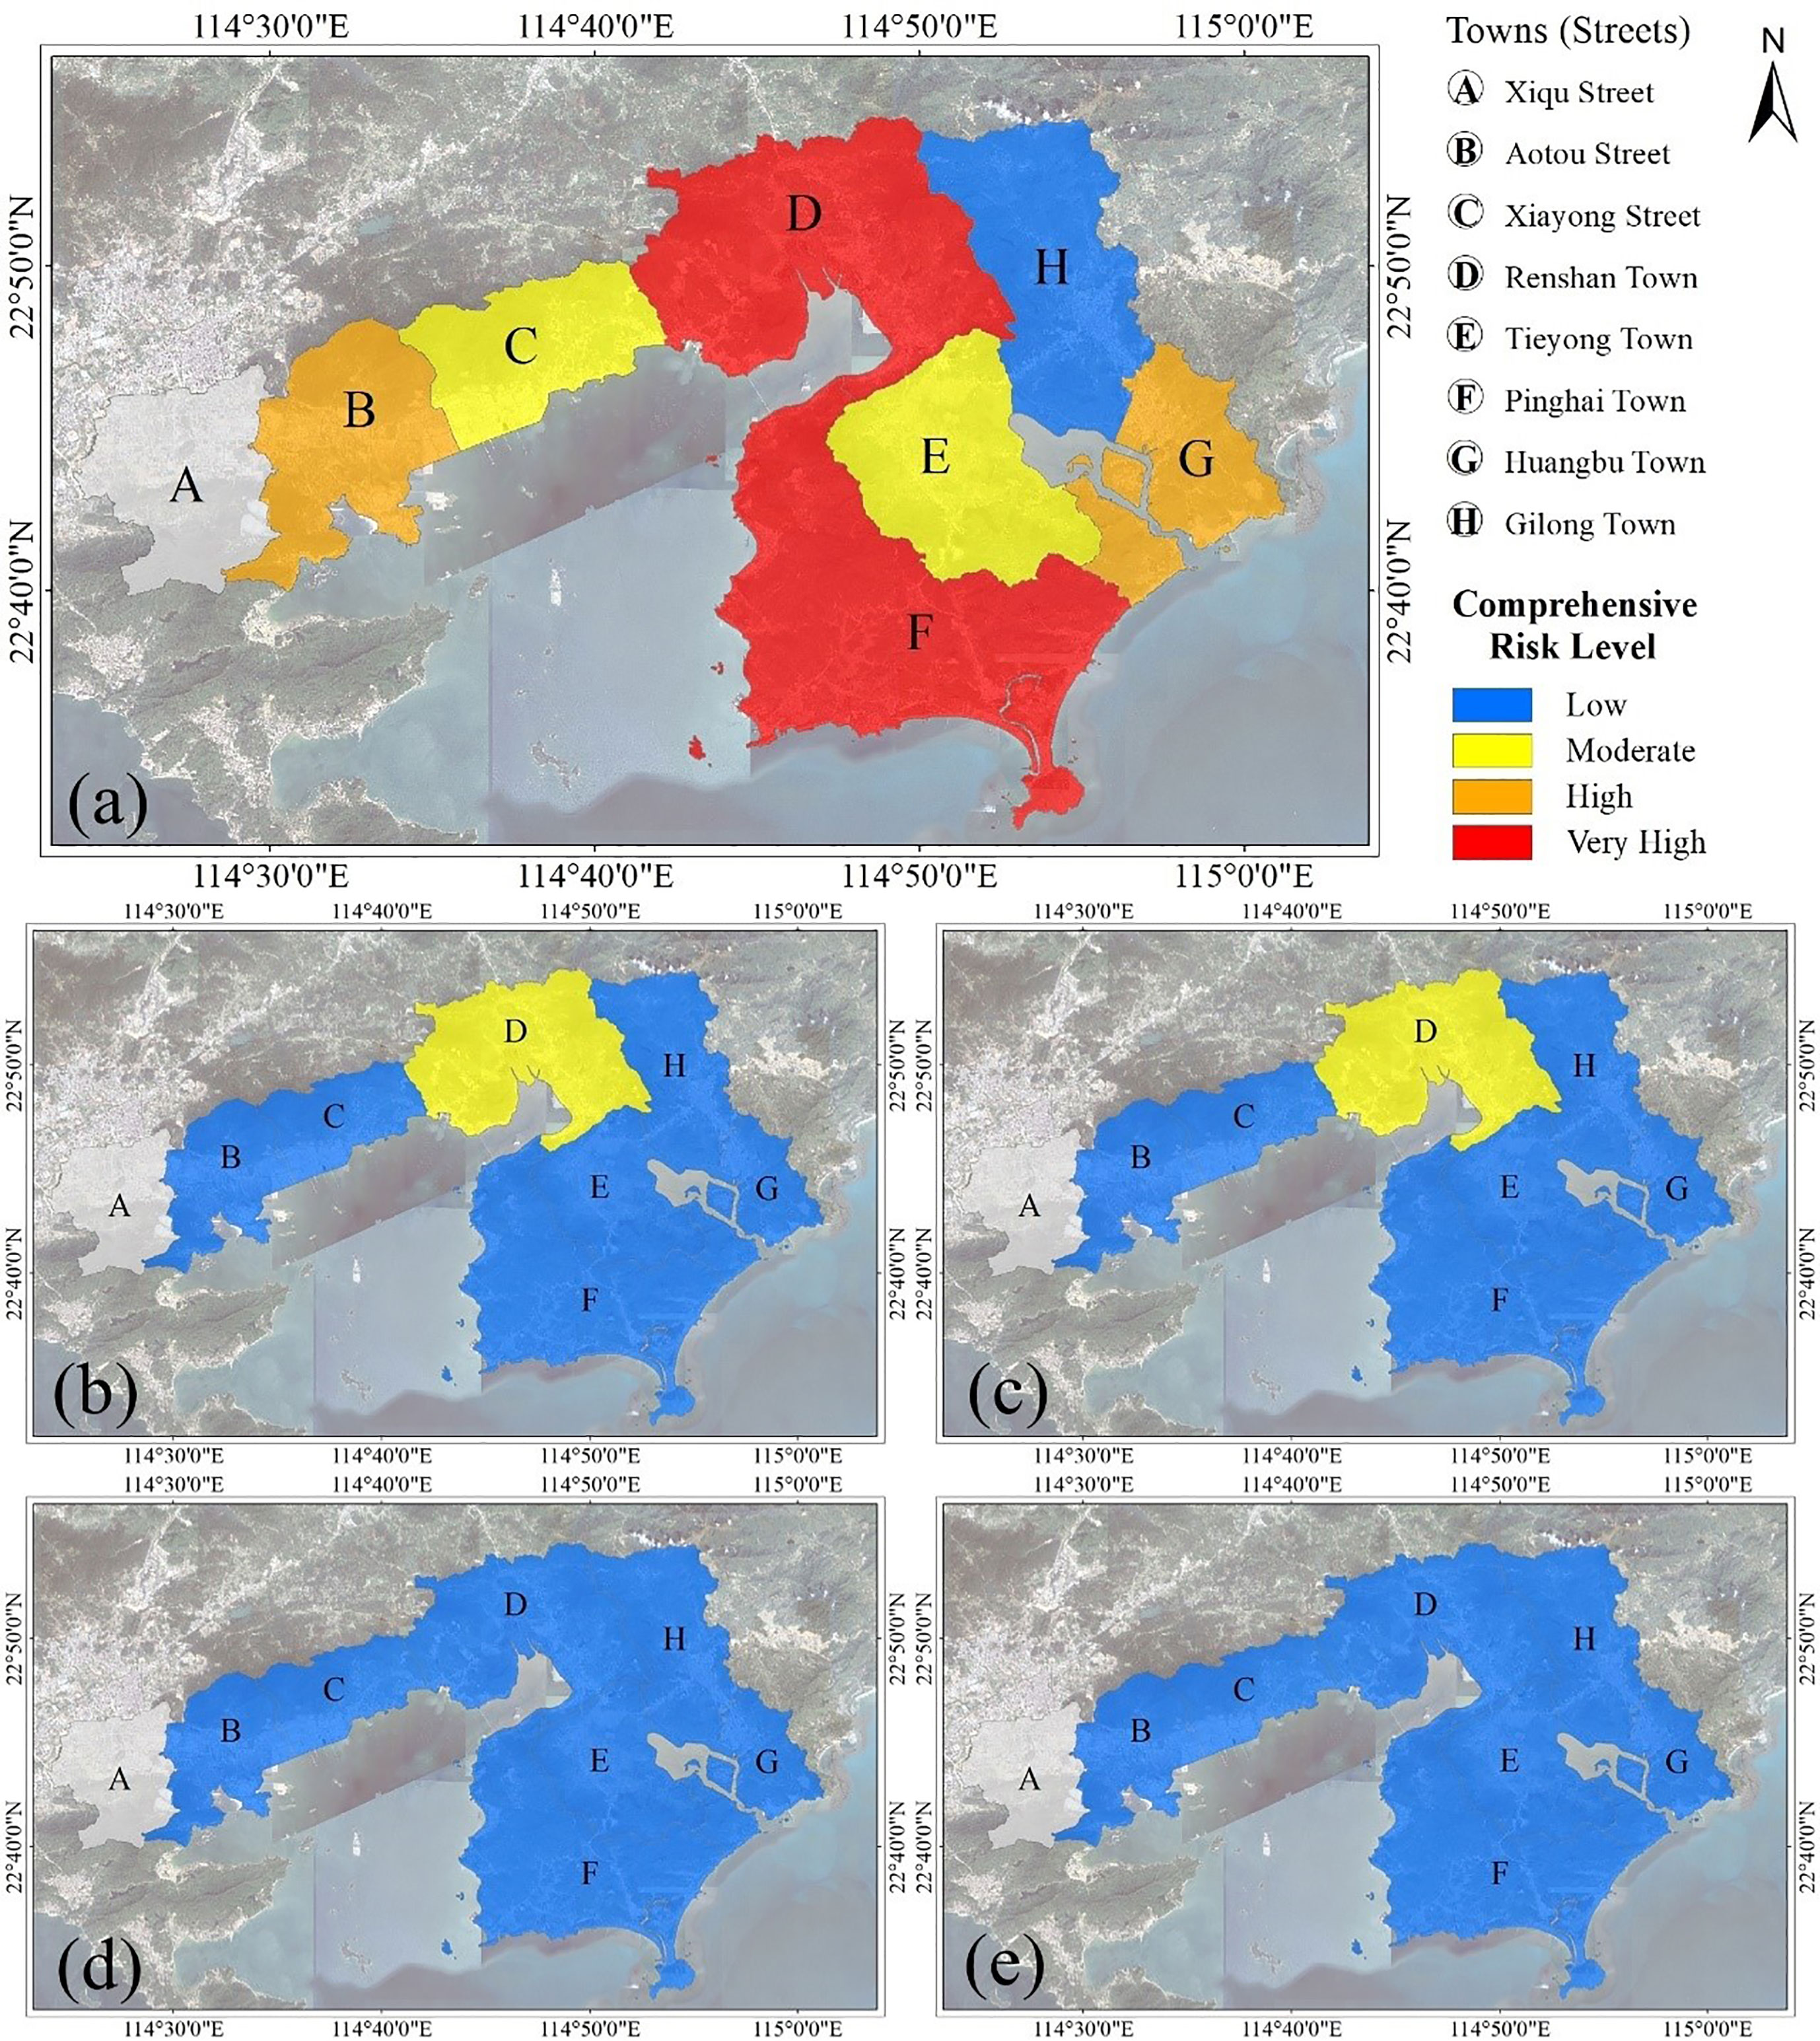
Figure 14 The comprehensive risk zonation maps of storm surge under different typhoon scenarios (1000-year (A), 100-year (B), 50-year (C), 20-year (D) and 10-year (E) return period).
Figure 13 shows that, as only the physical aspect of vulnerability was considered in the risk assessment, all streets/towns except Xiqu Street (A) within the study area tend to be at risk, and the spatial distributions of storm surge risk for shorter return periods of typhoon are similar. Except for Aotou Street (B), all streets/towns are considered low-risk areas for return periods of less than twenty years. This can be explained by the fact that coastal areas of the study area can be greatly protected by sea walls along its coastline, which were designed to withstand a 50-year return period of typhoon. At relatively longer return periods of typhoon, three street/towns including Aotou street (B), Renshan town (D), Huangbu town (G), mainly in the western and eastern region of the study area, are identified as the moderate risk level. This may be due to the fact that the extent and depth of storm surge flooding are considerably increased under longer return periods and the presence of a large number of buildings in the flooded zone could further increase the risk. The typhoon with the relatively lowest probability (1000-year) might have a significant risk impact level across coastal streets/towns in the study area. Very high risk occurs in streets/towns, including Aotou Street (B), Renshan Town (D), Pinghai Town (F), and Huangbu Town (G), because these streets/towns have low elevation and relatively flat slope, making them more prone to storm surge flooding under the 1000-year scenario. Gilong town (C) has a low level of social vulnerability to storm surge flooding, and Tieyong town (E) is at moderate risk of storm surge from a 1000-year typhoon.
As shown in Figure 14, when social and physical vulnerability were fully considered in storm surge risk assessment, for increasing return periods, the number of streets/towns classified as very high or high-risk increased, while the number of streets/towns classified as moderate or low-risk decreased. Compared to risk zoning maps deriving from quantitative risk assessments focused on the physical aspect of vulnerability, the comprehensive risk that incorporates the social aspect of vulnerability into the framework for making quantitative risk assessment is, on average, lower. It suggests that the risk assessment based on social vulnerability might have a greater proportion of the overall risk. For typhoon scenarios with 10-year and 20-year periods, all streets/towns except Aotou Street (B) were found to be at low risk. which is approximately consistent with those in Figure 13. In 50-year and 100-year typhoon scenarios, the storm surge risk level in many areas was low, and the moderate level of storm surge was mainly observed in Renshan town (D), and the spatial distributions of risk levels are similar to those of the risk zoning maps for 50-year and 100-year typhoons in Figure 13. With the return period increased to 1000 years, Aotou Street (B) and Huangbu Town (G) have been classified as high-risk areas. Xiayong street (C) and Tieyong town (E) were identified as having moderate risk levels. The low storm surge risk was mainly observed in Gilong town (H), and the very high risk was generally distributed in residential areas such as Renshan town (D) and Pinghai town (F). It is important to note that Aotou Street (B) and Huangbu Town (G) have moved from being very high-risk to high-risk because of the moderate level of social vulnerability concentrated in these regions. Social variables such as elderly people and females were identified at a very high level in three towns, including Renshan town (D), Tieyong town (E), and Pinghai town (F), while population density, minority proportion, and agricultural output value were defined at a high or very high social vulnerability level, and thus considering social vulnerability cannot affect the risk level in Renshan town (D), Tieyong town (E), and Pinghai town (F). Xiayong street (C)’s storm surge risk is changing from a high-risk zone to a moderate-risk zone, and it can be attributed to the fact that the moderate level of social vulnerability was located in Aotou street (B), Xiayong street (C), Gilong town (H), and Huangbu town (G). Therefore, the comprehensive analysis of storm surge risk based on both physical and social vulnerability can help policymakers identify the location of more vulnerable communities intersected with buildings in storm surge flooding-prone areas.
In this study, the comprehensive risk assessment of storm surge is composed of storm surge simulation, hazard assessment, exposure assessment, physical assessment, and social assessment. Uncertainties in comprehensive risk assessment can be present in each assessment. For storm surge simulation uncertainties, the coupled ADCIRC+SWAN model with higher R2 values of 0.81 and 0.79 indicates adjusted parameters in the model can bring a low uncertainty in simulated water level for the study area. Subsequently, the spatial interpolation method and the defining hazard level are regarded as contributing to introducing uncertainty in hazard assessment. The spatial interpolation method was carried out to create a continuous surface from these discrete points outputted from the surge-tide-wave model, which can produce the uncertainty in the results. The subjectively defined hazard level based on the inundation depth ranges can result in uncertainty. For the exposure assessment, the uncertainty occurs in identifying and quantifying the elements at risk, mainly because the building footprint map is updated periodically. Physical assessment can have uncertainty due to the construction of the damage-depth function and the maximum damage value of elements at risk. Finally, uncertainty occurs in social assessment because of subjective indicator selection, the limitations of available data, and dynamic changes of indicators.
Conclusion
Traditionally, the qualitative risk matrix approach, which is less reliable compared with the quantitative assessment method, is broadly employed to perform risk assessment of storm surge in China due to the unavailability of data regarding physical vulnerability curves and building footprints. In addition, many established frameworks for making quantitative assessments of storm surges to quantify the risk level in terms of economic damage have focused on the physical aspect of vulnerability without considering the social dimension of vulnerability. This study first proposed a methodology that incorporates social vulnerability into the framework for conducting quantitative risk assessment of storm surge based only on physical vulnerability. The proposed methodology was applied to a case study in the coastal areas of Huizhou, which allows for a comprehensive study of the streets/towns requiring focus and attention in risk assessment based on both physical and social vulnerability. In the previous study (Wang et al., 2021c), hypothetical typhoon scenarios with different return periods of 10, 20, 50, 100, and 1000 years were defined according to intensity-frequency curves for the study area, and the coupled hydrodynamic-wave model was utilized to delineate the potential inundation extent of storm surge flooding at a given recurrence interval of a typhoon. In the present study, the hazard assessment layers based on defined critical inundation depths were overlaid with building footprint layers to quantify the element-at-risk. Then, the physical vulnerability-based risk assessment was conducted by combining quantification of the element-at-risk with its corresponding depth-damage functions. Subsequently, the social vulnerability level to storm surge was evaluated based on a set of social indicators using the principal component analysis method. Finally, the overall risk of storm surge was analyzed by the combination of physical vulnerability-based risk assessment and social vulnerability-based risk assessment. The results of the study reveal that the total economic damage caused by storm surge rises as the return time of typhoons increases, and the most affected building type is residential buildings. Moreover, the comprehensive risk considering physical vulnerability and social vulnerability is, on average, lower. This means that a risk assessment based on social vulnerability could account for a larger proportion of the overall risk.
From the results, two important conclusions for conducting risk assessment of storm surge can be drawn. First, assessment and zonation of storm surge damage can be made by combining hazard, exposure, and physical vulnerability with the quantitative risk method on limited data in China. Utilizing the quantitative risk method can provide more objective information than the traditional qualitative analysis, as well as an estimate of economic damage caused by storm surge, which assists decision-makers in conducting the cost-benefit analysis to make effective decisions. Second, the incorporation of social vulnerability into the quantitative framework for assessing storm surge risk in terms of economic damage allows for making more comprehensive and accurate risk zoning maps to understand spatial variation in overall risk, and the comprehensive assessment can provide information about not only buildings in high storm surge risk areas but also more vulnerable communities to storm surge so that policy makers can develop corresponding disaster management strategies to reduce risk.
However, the study has several limitations, mainly due to a lack of the latest data and time constraints. One of them is that the direct economic damage due to storm surge is influenced by many factors, such as the inundation depth of storm surge flooding, flow velocity, sediment concentration, duration of storm surge flooding, etc. Nevertheless, this study only considers inundation depth as the main factor for assessing storm surge damage functions for buildings and communities. While flow velocity and flow direction are two important parameters for hazard assessment of storm surge, these parameters should be considered in future studies. Another limitation is that the validation of the simulated inundation extent of storm surge flooding is challenging because of a lack of observations after typhoon events. In the present study, post-typhoon field investigations in the study area after a typhoon event were carried out to map the actual inundated area. In order to delineate more reliable and accurate boundaries of storm surge flooding to validate the spatial distribution of the inundation resulted from the numerical model, the field investigations can be accompanied by other techniques such as high-resolution satellite data before and after typhoon events. The last limitation regards the issues of social vulnerability, which could be assessed based on socio-demographic datasets extracted from the latest national population statistics in 2022, which can give a more accurate analysis of the social vulnerability of every town/street.
Data availability statement
The datasets presented in this study can be found in online repositories. The names of the repository/repositories and accession number(s) can be found below: https://doi.org/10.6084/m9.figshare.20407446.v5.
Author contributions
LM designed the research. HQ and ZY collected the data. SW and EZ set up and validated the model. SW and LM carried out experiments. SW and LW analyzed experimental results. SW and LM wrote the manuscript. All authors contributed to the article and approved the submitted version.
Funding
This work was supported by Shenzhen Special Sustainable Development Science and Technology Project (Grant No. KCXFZ20211020164015024) and Shenzhen Fundamental Research Program (Grant No. JCYJ20200109110220482).
Conflict of interest
The authors declare that the research was conducted in the absence of any commercial or financial relationships that could be construed as a potential conflict of interest.
Publisher’s note
All claims expressed in this article are solely those of the authors and do not necessarily represent those of their affiliated organizations, or those of the publisher, the editors and the reviewers. Any product that may be evaluated in this article, or claim that may be made by its manufacturer, is not guaranteed or endorsed by the publisher.
References
Amirebrahimi S., Rajabifard A., Mendis P., Ngo T. (2015). A framework for a microscale flood damage assessment and visualization for a building using BIM–GIS integration International Journal of Digital Earth 9, 363–386. doi: 10.1080/17538947.2015.1034201
Apollonio C., Bruno M. F., Iemmolo G., Molfetta M. G., Pellicani R. (2020). Flood risk evaluation in ungauged coastal areas: The case study of ippocampo (Southern Italy). Water 12, 1466. doi: 10.3390/W12051466
Arrighi C., Mazzanti B., Pistone F., Castelli F. (2020). Empirical flash flood vulnerability functions for residential buildings. SN Appl. Sci. 2, 1–12. doi: 10.1007/S42452-020-2696-1/TABLES/4
Baky M. A., Islam M., Paul S. (2020). Flood hazard, vulnerability and risk assessment for different land use classes using a flow model. Earth Syst. Environ. 4, 225–244. doi: 10.1007/S41748-019-00141-W/FIGURES/17
Booij N., Ris R. C., Holthuijsen L. H. (1999). A third-generation wave model for coastal regions 1. model description and validation. J. Geophys. Res. Ocean 104, 7649–7666. doi: 10.1029/98JC02622
Burrell B. C., Davar K., Hughes R. (2007). A review of flood management considering the impacts of climate change. Water Int. 32, 342–359. doi: 10.1080/02508060708692215
Chen W., Cutter S. L., Emrich C. T., Shi P. (2013). Measuring social vulnerability to natural hazards in the Yangtze river delta region, China. Int. J. Disaster Risk Sci. 4, 169–181. doi: 10.1007/s13753-013-0018-6
Church J., Clark P., Cazenave A., Gregory J. (2013). “Chapter 13: Sea level change” in climate change 2013,” in The physical science basis: Contribution of working group I to the fifth assessment report of the intergovernmental panel on climate change (Cambridge, United Kingdom and New York, NY, USA: Cambridge University Press). Available at: https://digitalcommons.humboldt.edu/hsuslri_state/25/ (Accessed Sep 18, 2022).
Crichton D. (1999). The risk triangle. Nat. disaster Manage. 102, 102–3. Available at: https://www.ilankelman.org/crichton/1999risktriangle.pdf (Accessed Sep 18, 2022).
Cutter S. L., Barnes L., Berry M., Burton C., Evans E., Tate E., et al. (2008). A place-based model for understanding community resilience to natural disasters. Glob. Environ. Change 18, 598–606. doi: 10.1016/J.GLOENVCHA.2008.07.013
Cutter S. L., Boruff B. J., Shirley W. L. (2003). Social vulnerability to environmental hazards. Soc Sci. Q. 84, 242–261. doi: 10.1111/1540-6237.8402002
Cutter S., Boruff B., W. L. S. (2006). Hazards vulnerability and environmental justice. In Hazards vulnerability and environmental justice (Routledge) 143–160. doi: 10.4324/9781849771542
Cutter S. L., Emrich C. T., Webb J. J., Morath D. (2009). Social vulnerability to climate the literature social vulnerability to climate literature. (Columbia, USA) 1–44.
Desai B., Maskrey A., Peduzzi P., De Bono A., Herold C. (2015) Making development sustainable: the future of disaster risk management, global assessment report on disaster risk reduction. Available at: https://archive-ouverte.unige.ch/unige:78299.
de Sherbinin A., Bardy G. (2015). Social vulnerability to floods in two coastal megacities: New York city and Mumbai. Vienna Yearb. Popul. Res. 13, 131–166. doi: 10.1553/populationyearbook2015s131
Dietrich J. C., Tanaka S., Westerink J. J., Dawson C. N., Luettich R. A., Zijlema M., et al. (2012). Performance of the unstructured-mesh, SWAN+ ADCIRC model in computing hurricane waves and surge. J. Sci. Comput. 52, 468–497. doi: 10.1007/s10915-011-9555-6
Dietrich J. C., Zijlema M., Westerink J. J., Holthuijsen L. H., Dawson C., Luettich R. A., et al. (2011). Modeling hurricane waves and storm surge using integrally-coupled, scalable computations. Coast. Eng. 58, 45–65. doi: 10.1016/j.coastaleng.2010.08.001
Domingues R., Goni G., Baringer M., Volkov D. (2018). What caused the accelerated Sea level changes along the U.S. East coast during 2010–2015? Geophys. Res. Lett. 45, 367–313. doi: 10.1029/2018GL081183
Fatemi F., Ardalan A., Aguirre B., Mansouri N., Mohammadfam I. (2017). Social vulnerability indicators in disasters: Findings from a systematic review. Int. J. Disaster Risk Reduct. 22, 219–227. doi: 10.1016/j.ijdrr.2016.09.006
Frigerio I., Ventura S., Strigaro D., Mattavelli M., De Amicis M., Mugnano S., et al. (2016). A GIS-based approach to identify the spatial variability of social vulnerability to seismic hazard in Italy. Appl. Geogr. 74, 12–22. doi: 10.1016/J.APGEOG.2016.06.014
Fuchs S., Frazier T., Siebeneck L. (2018). “Physical vulnerability,” in Vulnerability and resilience to natural hazards (United Kingdom: Cambridge University Press) 32–52. Available at: https://books.google.com/books?hl=en&lr=&id=uY5LDwAAQBAJ&oi=fnd&pg=PA32&dq=Physical+vulnerability++Vulnerability+curves&ots=WCvJInJUYU&sig=HD9g1Ku8iNkUXFhfZrRIE5-jNsI (Accessed April 18, 2022).
Gayen S., Vallejo-Villalta L. I., Mafizul Haque S. (2021). Assessment of social vulnerability in malaga province, Spain: A comparison of indicator standardization techniques. Rev. Estud. Andaluces 41, 87–108. doi: 10.12795/rea.2021.i41.05
Granger K. (2003). Quantifying storm tide risk in cairns. Nat. Hazards 30, 165–185. doi: 10.1023/A:1026166300914
Greiving S., Fleischhauer M., Lückenkötter J. (2007). A methodology for an integrated risk assessment of spatially relevant hazards Journal of environmental planning and management 49, 1–19. doi: 10.1080/09640560500372800
Guillard-Goncąlves C., Cutter S. L., Emrich C. T., Zêzere J. L. (2014). Application of social vulnerability index (SoVI) and delineation of natural risk zones in greater Lisbon, Portugal Journal of Risk Research 18 (5), 651–674. doi: 10.1080/13669877.2014.910689
Hatzikyriakou A., Lin N. (2017). Simulating storm surge waves for structural vulnerability estimation and flood hazard mapping. Nat. Hazards 89, 939–962. doi: 10.1007/S11069-017-3001-5/FIGURES/10
Hatzikyriakou A., Lin N. (2018). Assessing the vulnerability of structures and residential communities to storm surge: An analysis of flood impact during hurricane sandy. Front. Built Environ. 4. doi: 10.3389/FBUIL.2018.00004/BIBTEX
Hatzikyriakou A., Lin N., Gong J., Xian S., Hu X., Kennedy A. (2015). Component-based vulnerability analysis for residential structures subjected to storm surge impact from hurricane sandy. Nat. Hazards Rev. 17, 05015005. doi: 10.1061/(ASCE)NH.1527-6996.0000205
Heß V. D. C. (2017). Weigh(t)ing the dimensions of social vulnerability based on a regression analysis of disaster damages. Nat. Hazards Earth Syst. Sci. 1–18. doi: 10.5194/nhess-2017-74
He Q., Bertness M. D., Bruno J. F., Li B., Chen G., Coverdale T. C., et al. (2014). Economic development and coastal ecosystem change in China. Sci. Rep. 4, 1–9. doi: 10.1038/srep05995
Hendrawan V. S. A., Komori D. (2021). Developing flood vulnerability curve for rice crop using remote sensing and hydrodynamic modeling. Int. J. Disaster Risk Reduct. 54, 102058. doi: 10.1016/J.IJDRR.2021.102058
Huang B. (2017) Comprehensive geographic information systems. Available at: https://www.google.com/books?hl=en&lr=&id=c-lGDgAAQBAJ&oi=fnd&pg=PP1&dq=Comprehensive+Geographic+Information+Systems&ots=_y4Vn72i5J&sig=pCsRyN9WrBGgoajAtbXnTSnDNcc.
Huizhou (2021) Most of the construction of the hengli petrochemical’s huizhou project to complete at the end of 2021. Available at: http://www.huizhou.gov.cn/hzszfmhwywb/newscenter/content/post_4227183.html.
Huizinga J., de Moel H., Szewczyk W. (2017). Global flood depth-damage functions: Methodology and the database with guidelines (No. JRC105688). (Luxembourg:Publications Office of the European Union). doi: 10.2760/16510
Jelesnianski C. P. (1965). A numerical calculation of storm tides induced by a tropical storm impinging on a continental shelf. Mon. Weather Rev.(Luxembourg: Publications Office of the European Union) 93 (6), 343–358. doi: 10.1175/1520-0493(1993)093%3C0343:ANCOS%3E2.3.CO;2
Kashem S., Wilson B., Van Zandt S. (2016). Planning for climate adaptation: Evaluating the changing patterns of social vulnerability and adaptation challenges in three coastal cities. J. Plan. Educ. Res. 36, 304–318. doi: 10.1177/0739456X16645167
Knutson T. R., Chung M. V., Vecchi G., Sun J., Hsieh T.-L., Smith A. J. P. (2021). ScienceBrief review: Climate change is probably increasing the intensity of tropical cyclones. Crit. Issues Clim. Change Sci. 1, 1–8. doi: 10.5281/zenodo.4570334
Koks E. E., Jongman B., Husby T. G., Botzen W. J. W. (2015). Combining hazard, exposure and social vulnerability to provide lessons for flood risk management. Environ. Sci. Policy 47, 42–52. doi: 10.1016/J.ENVSCI.2014.10.013
Kron W. (2002). Keynote lecture: Flood risk = hazard × exposure × vulnerability (Flood defence) 82–97
Kuhlicke C., Scolobig A., Tapsell S., Steinführer A., de Marchi B. (2011). Contextualizing social vulnerability: Findings from case studies across Europe. Nat. Hazards 58, 789–810. doi: 10.1007/s11069-011-9751-6
Kumar V., Cheng S. Y. C., Singh A. K. (2016). Impact of flood on rural population and strategies for mitigation: A case study of darbhanga district, bihar state, India. Contemp. Rural Soc Work 8, 45–56. Available at: https://digitalcommons.murraystate.edu/crsw/vol8/iss1/5 (Accessed Sep 18, 2022).
Liu D., Li Y. (2016). Social vulnerability of rural households to flood hazards in western mountainous regions of henan province, China. Nat. Hazards Earth Syst. Sci. 16, 1123–1134. doi: 10.5194/nhess-16-1123-2016
Liu Q., Shi X., Guo Z., Wang X. (2019) Technical directives for risk assessment and zoning of marine disaster–part 1: Storm surge. Available at: https://www.doc88.com/p-67716956739613.html?r=1.
Luettich R., Westerink J., Scheffner N. (1992) ADCIRC: an advanced three-dimensional circulation model for shelves, coasts, and estuaries. report 1, theory and methodology of ADCIRC-2DD1 and ADCIRC-3DL. Available at: https://erdc-library.erdc.dren.mil/jspui/handle/11681/4618.
Lu X., Yu H., Ying M., Zhao B., Zhang S., Lin L., et al. (2021). Western North pacific tropical cyclone database created by the China meteorological administration. Adv. Atmos. Sci. 38, 690–699. doi: 10.1007/s00376-020-0211-7
McGrath H., Abo El Ezz A., Nastev M. (2019). Probabilistic depth–damage curves for assessment of flood-induced building losses. Nat. Hazards 97, 1–14. doi: 10.1007/S11069-019-03622-3
Merz B., Kreibich H., Schwarze R., Thieken A. (2010). Review article” assessment of economic flood damage”. nhess.copernicus.org. 10, 1697–1724. doi: 10.5194/nhess-10-1697-2010
Ministry of Natural Resources of the People ‘s Republic of China (2021) China Marine disaster bulletin. Available at: http://www.mnr.gov.cn/sj/sjfw/hy/gbgg/zghyzhgb/.
Nofal O. M., van de Lindt J. W. (2020). Probabilistic flood loss assessment at the community scale: Case study of 2016 flooding in lumberton, north Carolina. ASCE-ASME J. Risk Uncertain Eng. Syst. Part A Civ. Eng. 6, 05020001. doi: 10.1061/AJRUA6.0001060
Rogelis M. C., Werner M., Obregón N., Wright N. (2016). Regional prioritisation of flood risk in mountainous areas. Nat. Hazards Earth Syst. Sci. 16, 833–853. doi: 10.5194/nhess-16-833-2016
Rufat S., Tate E., Burton C. G., Maroof A. S. (2015a). Social vulnerability to floods: Review of case studies and implications for measurement. Int. J. Disaster Risk Reduct. 14, 470–486. doi: 10.1016/J.IJDRR.2015.09.013
Rufat S., Tate E., Burton C. G., Maroof A. S. (2015b). Social vulnerability to floods: Review of case studies and implications for measurement. Int. J. Disaster Risk Reduct. 14, 470–486. doi: 10.1016/J.IJDRR.2015.09.013
Safaie S. (2017). National disaster risk assessment words into action guidelines governance system, methodologies, and use of results (United Nations Office for Disaster Risk Reduction (UNISDR)).
Samuels P., Gouldby B., Frans K., Messner F., van Os A., Sayers P., et al. (2009) Language of risk: project definitions. floodsite.net. Available at: http://floodsite.net/html/partner_area/project_docs/T32_04_01_FLOODsite_Language_of_Risk_D32_2_v5_2_P1.pdf.
Shaw R. (2006). Critical issues of community based flood mitigation: examples from Bangladesh and Vietnam. Sci. Cult. 72, 62. Available at: https://citeseerx.ist.psu.edu/viewdoc/download?doi=10.1.1.474.6661&rep=rep1&type=pdf (Accessed Sep 18, 2022).
Simmons D. C., Dauwe R., Gowland R., Gyenes Z., King A. G., Riedstra D., et al. (2017). “Qualitative and quantitative approaches to risk assessment,” in Drmkc.jrc.ec.europa.eu (Luxembourg: Publications Office of the European Union). Available at: https://drmkc.jrc.ec.europa.eu/portals/0/Knowledge/ScienceforDRM/ch02/ch02_subch0201.pdf.
Stocker T. (2014) Climate change 2013: the physical science basis: Working group I contribution to the fifth assessment report of the intergovernmental panel on climate. Available at: https://books.google.com/books?hl=en&lr=&id=o4gaBQAAQBAJ&oi=fnd&pg=PR1&dq=%0AIPCC+(2013).+Climate+change+2013:+The+physical+science+basis.+Working+Group+I+Contribution+to+the+IPCC+5th+Assessment+Report+-+Changes+to+the+Underlying+Scientific/Technical+Asse.
The World Bank (2021) Consumer price index, (2010 = 100). WORLD BANK. Available at: https://data.worldbank.org/indicator/FP.CPI.TOTL?locations=CN.
Twigg J. (2015) Disaster risk reduction. Available at: http://bvpad.indeci.gob.pe/doc/pdf/esp/doc2601/doc2601-contenido.pdf.
UNDRR (2017) Understanding disaster risk. Available at: https://www.preventionweb.net/understanding-disaster-risk/component-risk/vulnerability.
US Department of Health and Human Services and Centers for Disease Control and Prevention (2019). Coastal flooding, climate change, and your health. what you can do to prepare. Available at: https://stacks.cdc.gov/view/cdc/52985. (Accessed Sep 18, 2022).
Van Westen C. J. Risk assessment methods. Available at: https://www.cdema.org/virtuallibrary/index.php/charim-hbook/methodology/5-risk-assessment/5-5-risk-assessment-methods.
Van Westen C. J. Vulnerability. Available at: http://www.charim.net/methodology/53.
Van Zandt S., Peacock W. G., Henry D. W., Grover H., Highfield W. E. (2012). Mapping social vulnerability to enhance housing and neighborhood resilience. Hous. Policy Debate 22, 29–55. doi: 10.1080/10511482.2011.624528
Wamsler C., Brink E., Rentala O. (2012). Climate change, adaptation, and formal education: The role of schooling for increasing societies’ adaptive capacities in El Salvador and Brazil. Ecol. Soc 17 (2). Available at: http://www.jstor.org/stable/26269029 (Accessed Sep 18, 2022).
Wang Y., Guo Z., Zheng S., Zhang M., Shu X., Luo J., et al. (2021d). Risk assessment for typhoon-induced storm surges in wenchang, hainan island of China Geomatics, Natural Hazards and Risk 12 (1), 880–899. doi: 10.1080/19475705.2021.1899060
Wang S., Mu L., Qi M., Yu Z., Yao Z., Zhao E. (2021b). Quantitative risk assessment of storm surge using GIS techniques and open data: A case study of daya bay zone, China. J. Environ. Manage. 289, 112514. doi: 10.1016/j.jenvman.2021.112514
Wang S., Mu L., Yao Z., Gao J., Zhao E., Wang L. (2021c). Assessing and zoning of typhoon storm surge risk with a geographic information system (GIS) technique: A case study of the coastal area of huizhou. Nat. Hazards Earth Syst. Sci. 21, 439–462. doi: 10.5194/NHESS-21-439-2021
Wang K., Yang Y., Reniers G., Huang Q. (2021a). A study into the spatiotemporal distribution of typhoon storm surge disasters in China. Nat. Hazards 108, 1237–1256. doi: 10.1007/S11069-021-04730-9
Ward P. J., Blauhut V., Bloemendaal N., Daniell E. J., De Ruiter C. M., Duncan J. M., et al. (2020). Review article: Natural hazard risk assessments at the global scale. Nat. Hazards Earth Syst. Sci. 20, 1069–1096. doi: 10.5194/NHESS-20-1069-2020
Westerink J., Luettich R., Blain C., Scheffner N. (1994) Adcirc: an advanced three-dimensional circulation model for shelves, coasts, and estuaries. report 2. user’s manual for adcirc-2ddi. Available at: https://apps.dtic.mil/sti/citations/ADA276150.
Wing O. E. J., Pinter N., Bates P. D., Kousky C. (2020). New insights into US flood vulnerability revealed from flood insurance big data. Nat. Commun. 11, 1–10. doi: 10.1038/s41467-020-15264-2
Wisner B., Gaillard J., Kelman I. (2012) Handbook of hazards and disaster risk reduction. Available at: https://www.taylorfrancis.com/books/mono/10.4324/9780203844236/handbook-hazards-disaster-risk-reduction-ben-wisner-gaillard-ilan-kelman.
Xianwu S., Jufei Q., Bingrui C., Xiaojie Z., Haoshuang G., Jun W., et al. (2020). Storm surge risk assessment method for a coastal county in China: case study of jinshan district, shanghai. Stoch. Environ. Res. Risk Assess. 34, 627–640. doi: 10.1007/S00477-020-01791-3
Ying M., Zhang W., Yu H., Lu X., Feng J., Fan Y. X., et al. (2014). An overview of the China meteorological administration tropical cyclone database. J. Atmos. Ocean Technol. 31, 287–301. doi: 10.1175/JTECH-D-12-00119.1
Yoon D. K. (2012). Assessment of social vulnerability to natural disasters: A comparative study. Nat. Hazards 63, 823–843. doi: 10.1007/s11069-012-0189-2
Zhang F., Li M. (2019). Impacts of ocean warming, Sea level rise, and coastline management on storm surge in a semienclosed bay. J. Geophys. Res. Ocean 124, 6498–6514. doi: 10.1029/2019JC015445
Zhang Y., Li T., Wang H., Guo J. (2016). Storm surge risk assessment for yuhuan county in taizhou city. Nat. Hazards 2016 841 84, 1–16. doi: 10.1007/S11069-016-2328-7
Appendix A
The wind field and pressure field driving forces on a water surface is constructed by the Jelesnianski parametric hurricane model. The equations are as follows:
where, R is the radius of maximum wind speed; V0 is the speed of moving wind; r is the radial distance from the center of the typhoon; WR is the maximum wind speed; (x,y) and (xc,yc) are the coordinates of the computed point and the typhoon center, respectively; θ is inlet angle (20 in this study); P0 and P∞ are the central pressure of a typhoon and the ambient pressure, respectively.
Keywords: storm surge, hydrodynamic and wave model, depth-damage function, quantitative risk assessment, social vulnerability, comprehensive risk assessment
Citation: Wang S, Mu L, Qin H, Wang L, Yao Z and Zhao E (2022) The utilization of physically based models and GIS techniques for comprehensive risk assessment of storm surge: A case study of Huizhou. Front. Mar. Sci. 9:939380. doi: 10.3389/fmars.2022.939380
Received: 09 May 2022; Accepted: 30 August 2022;
Published: 29 September 2022.
Edited by:
Athanasios Thomas Vafeidis, University of Kiel, GermanyReviewed by:
Hans Von Storch, Helmholtz Zentrum Hereon, GermanyClaudia Wolff, University of Kiel, Germany
Copyright © 2022 Wang, Mu, Qin, Wang, Yao and Zhao. This is an open-access article distributed under the terms of the Creative Commons Attribution License (CC BY). The use, distribution or reproduction in other forums is permitted, provided the original author(s) and the copyright owner(s) are credited and that the original publication in this journal is cited, in accordance with accepted academic practice. No use, distribution or reproduction is permitted which does not comply with these terms.
*Correspondence: Lin Mu, bW91bGluMTk3N0Bob3RtYWlsLmNvbQ==; Hao Qin, cWgxcWgxMDBAYWx1bW5pLnNqdHUuZWR1LmNu