 Ahmed Eladawy1,2*
 Takashi Nakamura1
 Mohamed Shaltout3
 Asmaa Mohammed4
 Kazuo Nadaoka1
 Michael D. Fox5
 Eslam O. Osman5,6*
- 1Department of Transdisciplinary Science and Engineering, School of Environment and Society, Tokyo Institute of Technology, Tokyo, Japan
- 2Irrigation and Hydraulics Engineering Department, Faculty of Engineering, Mansoura University, El Mansoura, Egypt
- 3Oceanography Department, Faculty of Science, Alexandria University, Alexandria, Egypt
- 4Marine Sciences Department, National Authority for Remote Sensing and Space Sciences, Cairo, Egypt
- 5Red Sea Research Center (RSRC), King Abdullah University of Science and Technology (KAUST), Thuwal, Saudi Arabia
- 6Marine Biology Lab, Zoology Department, Faculty of Science, Al-Azhar University, Cairo, Egypt
Corals in the northern Red Sea exhibit high thermal tolerance despite the increasing heat stress. It is assumed that corals throughout the Red Sea have similar bleaching thresholds (32°C or higher), and hence greater bleaching tolerance of corals in the northern Red Sea region is likely due to lower ambient water temperatures (25–28°C) that remain well below the corals’ physiological maxima. Whether bleaching patterns across the Red Sea are independent of the local maximum monthly mean of seawater temperature and aligned with an assumed 32°C threshold has yet to be determined. Here, we used remotely sensed surface sea temperature data spanning 1982–2020 to model spatial distributions of Degree Heat Weeks across the Red Sea in relation to assumed coral thermal threshold values of 30, 31, and 32°C. We also used the Coupled Model Intercomparison Project Phase 5 model outputs to predict warming trends in the Red Sea under different greenhouse gas representative concentration pathways (RCPs). We show that applying 32°C thresholds dramatically reduces effective Degree Heat Weeks in the north, but not in central or southern Red Sea regions, a finding that is consistent with historical bleaching observations (1998–2020) throughout the Red Sea. Further, model predictions under the most extreme RCP8.5 scenario exhibited ~3°C warming by the end of the 21st century throughout the Red Sea with less pronounced warming for the northern Red Sea (2–2.5°C) compared to the central and southern regions (2.7–3.1°C).This warming rate will remain below the assumed thermal threshold for the northern Red Sea which should help this region to serve as refugia (i.e., maintaining favorable temperatures) for corals to persist for decades ahead. Together, our results support the notion that corals have similar thresholds throughout the Red Sea; hence, coral bleaching thresholds are independent of the local maximum monthly mean. Consequently, where regional warming projections suggest the northern Red Sea will not reach assumed bleaching thresholds (32°C) before the end of the 21st century, coral reefs in the northern region may be among the last standing against climate change.
Introduction
Coral reefs provide essential ecosystem services for approximately one billion people worldwide (Sing Wong et al., 2022). However, coral reefs are rapidly deteriorating from the increasing frequency and magnitude of marine heatwaves under climate change (Hughes et al., 2018; Rogers-Bennett and Catton, 2019). In reef-building corals, thermal stress causes bleaching or disassociation between the cnidarian host and its algal endosymbionts (family Symbiodiniaceae), which can lead to starvation and mortality if temperatures did not return to unstressful levels (Suggett and Smith, 2020). However, coral thermal stress tolerance varies widely and can be influenced by the temperature regimes of specific locations (Morikawa and Palumbi, 2019; Cornwell et al., 2021; Logan et al., 2021). Selective mortality through successive heatwaves may shape coral responses to subsequent warming events (Fox et al., 2021) where repeated heatwaves may improve the ‘ecological memory’ of corals to further enhance thermal tolerance for future climate projections (Hackerott et al., 2021). Consequently, reconciling spatial patterns of coral thermal tolerance and their associated drivers is critical for improving projections of coral survival in the future.
Coral bleaching occurs when the temperature exceeds the thermal threshold [estimated as the temperature exceeding the maximum monthly mean (MMM) by 1°C (Goreau and Hayes, 1994)] for a prolonged period. Several indices using remote sensing measurements of sea surface temperature (SST) have been developed to quantify the cumulative duration and magnitude of thermal stress in efforts to better predict occurrences and severity of coral bleaching. Degree Heating Weeks (DHWs) – a heat stress accumulation index developed by the National Oceanic and Atmospheric Administration (NOAA) – is the most commonly used to predict thermal stress over large geographic scales (Liu et al., 2006). DHWs have successfully predicted bleaching for many regions (Eakin et al., 2010) but “false positives” for other regions were also observed (DeCarlo, 2020). In fact, the prediction capacity of DHWs has remained coarse; for example, early efforts using local MMMs appeared to predict only 40% of coral bleaching globally and was inconsistent with bleaching patterns, particularly in the central equatorial Pacific sites (Sandin et al., 2008; Donner, 2009; Donner, 2011). Several models have been developed to improve or fine-tune the predictability of bleaching indices (e.g., Skirving et al., 2020), and NOAA recently adopted the 90th percentile of heat stress above MMM to calculate DHWs rather than MMM+1°C (Lachs et al., 2021). A high-resolution model using optimized thermal thresholds and local environmental variables (ultraviolet-UV, water turbidity, and cooling effects) has also been developed (Kumagai and Yamano, 2018). Collectively, such models have highlighted that some reef regions, in fact, appear independent of the local thermal threshold (i.e., MMM+1°C) and suggest that other processes may also govern (or at least contribute to) the bleaching threshold. For example, corals in the Arabian Gulf (the warmest sea in the world) are populated by a distinct subpopulation with naturally high thermal tolerance (Smith et al., 2022). Corals in the Arabian Gulf can tolerate summer temperatures up to 34–35°C (Shuail et al., 2016) whereas bleaching occurs between 29°C and 30°C for many other biogeographic regions (Jokiel and Brown, 2004; McClanahan et al., 2014). Environmental selection processes thus likely play a critical role in shaping corals’ natural resistance across regions.
The Red Sea spans 15° of latitude and serves as a biodiversity hotspot. Although exposed to high heat stress (>15 DHWs), corals in the northern Red Sea region show exceptional thermal resistance and have not experienced mass bleaching (Osman et al., 2018). In contrast, corals in the central and southern Red Sea regions have historically experienced mass bleaching when exposed to similar (or less) DHWs (Osman et al., 2018). Such contrasting thermal tolerance from historical bleaching observations has been recently further verified through thermal heat stress experiments spanning the Red Sea (Osman et al., 2018; Voolstra et al., 2021; Evensen et al., 2022). This includes corals in the Gulf of Aqaba that do not exhibit bleaching despite exposure to thermal stress equal to 11 DHWs (Fine et al., 2013; Krueger et al., 2017). Elevated thermal tolerance in the northern Red Sea has been attributed to a historical selection process that has affected entire Red Sea coral populations. Specifically, it was proposed that coral populations in the Red Sea passed through a thermal barrier (32°C) at the southern entrance to the Red Sea, the Bab El Mandab strait (Figure 1), approximately 10,000 years ago after the Last Glacial Minimum (Trommer et al., 2010). This thermal barrier acted as a natural filter to select corals with the highest thermal tolerances and a minimum threshold of 32°C. Consequently, corals in the northern Red Sea, which experience cooler summer temperatures mean (25–29°C), are currently living below their proposed thermal maxima (Osman et al., 2018) whereas corals in the central and southern Red Sea experience higher ambient summer mean (30–32°C), and thus live closer to their thresholds, and are more susceptible to heat stress.
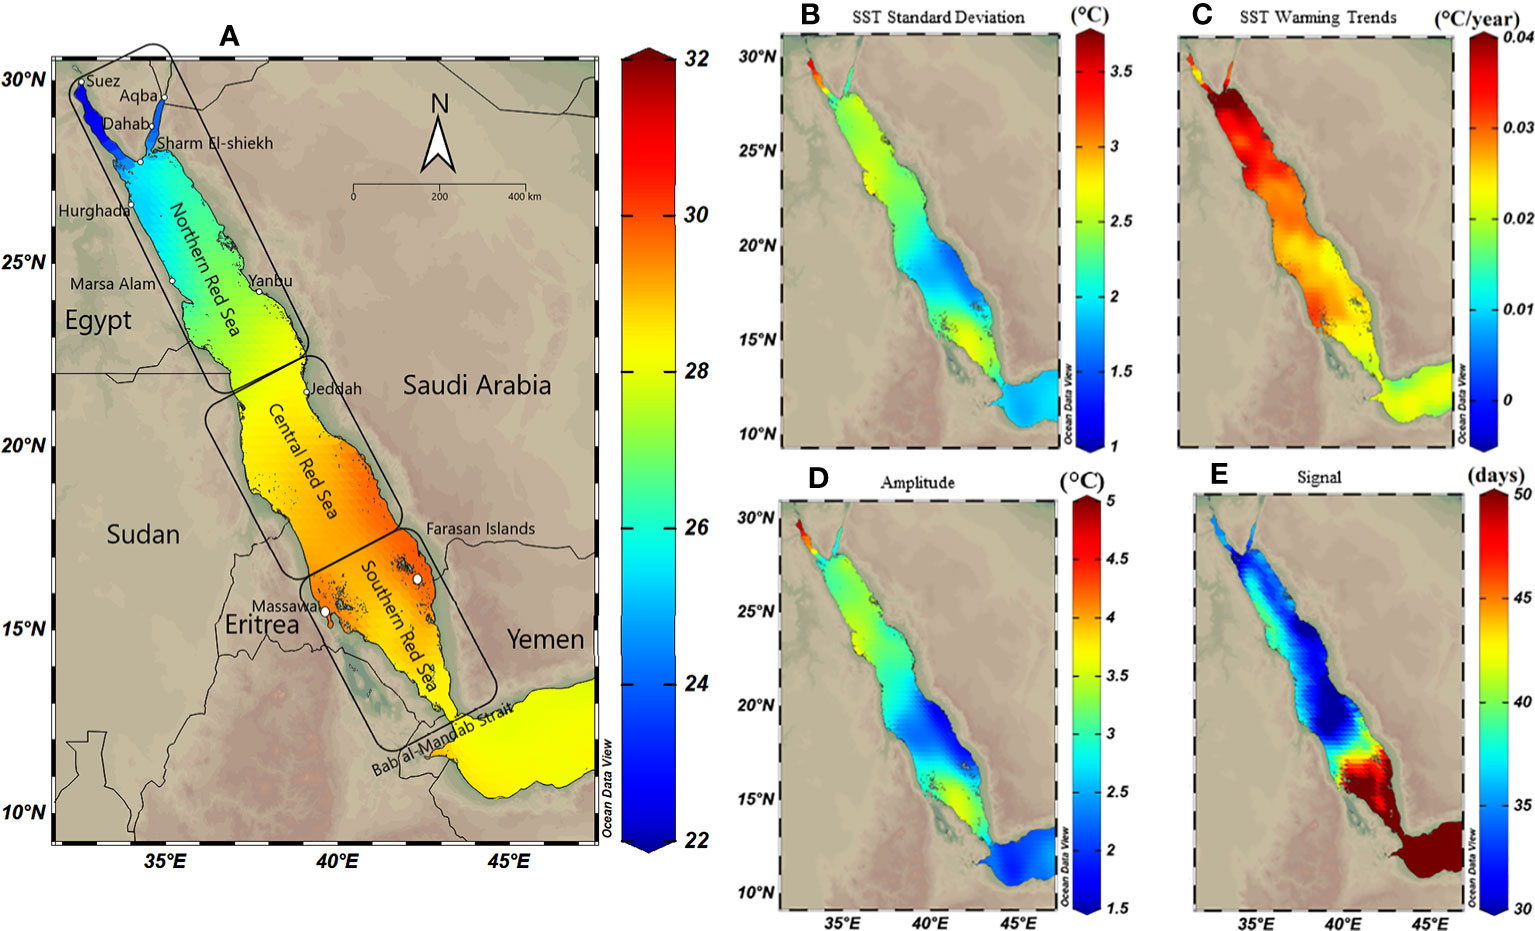
Figure 1 Spatial distribution maps of sea surface temperature (SST) variability along the Red Sea using Optimum Interpolation Sea Surface Temperature (OISST V.2) remote sensing data from 1982 to 2020. The Red Sea was divided into three regions; the northern, central and southern Red Sea. (A) Annual mean SST exhibiting a gradual decline toward the north. (B) SST standard deviation exhibiting declines to the south (except for the most southern region), suggesting higher SST variability in the north (particularly the Gulf of Suez) compared to the central and southern Red Sea. (C) Warming trend, using Theil–Sen estimator method (TSE), over 39 years along the Red Sea exhibiting a high trend in the northern compared to the southern region (warming trends using TSE represent slightly lower trends compared to the ordinary least square in the northern Red Sea – see Figure S3). (D) Spatial distribution of seasonal variations (i.e., the amplitude) exhibiting higher variability in the north compared to the south; and (E) Spatial shift in the seasonal cycle (i.e., phase lag), and the number of days highlighting ca. 30-50 days shift between seasons starts between north and south.
The northern Red Sea has been proposed to provide natural thermal refugia for corals in this region against the increasing severity of bleaching events seen worldwide (Fine et al., 2013; Osman et al., 2018). Nevertheless, SST warming trends have been predicted to be higher in the northern Red Sea, particularly in the Gulf of Aqaba (0.40°C decade−1), relative to the global average (0.075°C decade−1) (Raitsos et al., 2013; Brewin et al., 2015; Chaidez et al., 2017; Shaltout, 2019). As such, corals in the northern Red Sea may reach their proposed thermal threshold (32°C) faster than regions in the central and southern Red Sea, eroding the natural temperature buffer of the proposed the northern Red Sea refugia (Genevier et al., 2019). However, most warming predictions for this region have employed linear relationships with time (e.g., Chaidez et al. (2017); Osman et al. (2018)) and are thus subject to bias. Indeed, warming trends are largely time-dependent, and warming projections at regional scales may be influenced by atmospheric and oceanic forces (e.g., wind, current, air pressure, etc.) that may govern warming trends (Gleeson, 1994; Eladawy et al., 2017; Krokos et al., 2019). For example, Krokos et al. (2019) suggested that the warming trend along the Red Sea could be counteracted by the cooling effect of the Atlantic Multidecadal Oscillation (AMO) phase. Thus, predictions of warming trends require complex and dynamic models to improve prediction accuracy. For example, the Coupled Model Intercomparison Project (CMIP) is frequently used to predict warming trends (Meehl et al., 2000), but has yet to be applied within the context of bleaching thresholds for corals of the Red Sea. Specifically, whether the northern Red Sea will remain functional refugia from ocean warming or if the region will reach its proposed threshold (32°C) faster than central and southern Red Sea regions.
The purpose of our current study was to i) determine whether corals in the Red Sea possess similar thermal thresholds, and ii) determine if spatial patterns of ocean warming undermine past proposals of the northern Red Sea as thermal refugia. We used remotely sensed sea surface temperature (SST) measurements for the last four decades (1982–2020) and integrated these with long-term bleaching observations along the Red Sea. We compared spatial distributions of DHWs using classical thermal threshold values (MMM+1°C) but also manually adjusted thermal thresholds (of 30, 31, and 32°C) to recalculate DHWs and so, identify the threshold that best explains the spatial pattern of bleaching observations along the Red Sea. To assess whether the northern Red Sea will remain likely refugia by end of the 21st century, we used Coupled Model Intercomparison Project Phase 5 (CMIP5) to examine warming trends under different future greenhouse gas representative concentration pathway (RCP) scenarios. Our analysis revealed that using a 32°C adjusted thermal threshold produced DHWs that matched bleaching patterns along the Red Sea. This supports the notion that the northern Red Sea supports corals with higher thermal thresholds and require higher thermal stress to trigger bleaching. Further, the CMIP5 model predicted that overall SST would increase by 3°C along the Red Sea by 2100 under the most severe scenario (RCP8.5). Contrary to the central and southern regions, the northern Red Sea would experience the least amount of warming under all RCP scenarios, suggesting the northern region will likely continue to serve as functional coral refugia in the future.
Materials and methods
We used historical remote sensing data (1982–2020) to systematically evaluate the spatio-temporal variability of sea surface temperature (SST) (i.e., anomalies, seasonality, trend analysis, and DHW). To investigate whether corals have similar thresholds along the Red Sea, we compared DHWs using local maximum monthly mean+1°C (MMM+1°C, hereafter referred to as the classical threshold) but also thresholds that were manually adjusted to 30, 31, and 32°C (referred to as adjusted thresholds), and how DHWs for each model align with long-term bleaching observations (1998–2020). Finally, we used the CMIP5 model to predict the thermal projections along the Red Sea under different greenhouse gas representative concentration pathway scenarios, to understand whether the northern Red Sea will remain corals refugia by end of the 21st century.
SST remote sensing data
Sea Surface Temperature (SST) data were obtained from daily 0.25° remote sensing data from the NOAA Optimum Interpolation Sea Surface Temperature (OISST; Version 2, https://www.ncei.noaa.gov/data/sea-surface-temperature-optimum-interpolation/v2.1/access/avhrr/) dataset for the period 1982–2020. The OISST dataset provides daily means of SST collected throughout the day and thus, it is not confounded by temperature variance induced by diurnal variability or a particular time of day (Banzon et al., 2020). OISST data is also integrated with in situ data obtained from ships and buoys to enable large-scale adjustment of satellite biases (Reynolds et al., 2002; Banzon et al., 2014). OISST has been previously used to calculate DHW in different bioregions [e.g., Indian Ocean (Arora et al., 2021), and Eastern Tropical Pacific (Romero-Torres et al., 2020)]. DeCarlo (2020) in fact proposed OISST to be one of the most appropriate datasets to detect extreme events because of its high temporal resolution (daily SST). All OISST data were downloaded as NetCDF files and cropped for the Red Sea, and daily SST were analyzed using MATLAB (Version R2020b). All raster maps were plotted using Ocean Viewer (V.5.5.2) unless otherwise stated.
Variability of SST and warming trend analysis
To assess spatial and temporal variations in SST, we calculated the annual SST mean and SST standard deviation between 1982 to 2020 for each grid cell within the Red Sea. Warming trends along the Red Sea were also assessed using two methods; i) ordinary least squares (LSE), and ii) Theil–Sen estimator (TSE) (Chervenkov and Slavov, 2019). Each method estimates the SST trend (i.e., slope) over the studied period (1982–2020) for each pixel. However, it is noted that TSE is commonly used to calculate trends in nonparametric data, including meteorological and hydrological time series (Theil, 1950; Heras-Sánchez et al., 2019), and more robust than the LSE method, where the latter is more sensitive to outliers (see Fernandes and Leblanc, 2005; Chervenkov and Slavov, 2017).
Seasonality
We investigated variation in the seasonal cycle of SST for each pixel during 1982–2020 using Fourier analysis, which implements the transformation of periodic functions (Goela et al., 2016) to quantitatively represent their spectral composition as a function of time. The variation in seasonal cycles was represented by amplitude (i.e., half of the distance between the limits of the sine function) and phase angle (i.e., the function shifts horizontally) (Marullo et al., 1999; Shaltout and Omstedt, 2014). The amplitude and phase angle of the annual SST cycle were calculated using the daily SST at each grid (i, j) (0.25° * 0.25°). This was analyzed using Eqs. (1–3) as follows:
where an and bn are the Fourier coefficients, T is one-year period, and t the time. The Fourier analysis can be described if the seasonal cycle is predominant as follows:
where the subscript n = 1 is not indicated, and the amplitude A and the phase angle ϑ are defined as follows:
Thermal anomalies
Assessment of SST anomalies and their temporal evolution along the Red Sea was performed using Empirical orthogonal function (EOF) analysis. EOF is a commonly used analysis to examine the variance of spatiotemporal data by reducing time series into a few spatial patterns, or EOFs (Borzelli and Ligi, 1999). This method is considered a decomposition of any dataset in terms of orthogonal basis functions (Sonnewald et al., 2021). The EOF was determined by decomposing a Spatio-temporal signal along the Red Sea as per Björnsson and Venegas (1997) using equations 4 and 5. Seasonal detrending (i.e., subtracting the trend component from the data, see Deser et al. (2010)) was performed before applying the EOF.
where ai (t) is a weighted time-dependent coefficient (principal component time series), ϕ1 (x,y) is the spatial mode (Mode), and M is the total number of modes.
Thermal threshold and DHWs
We calculated the thermal threshold and Degree Heating Weeks (DHWs) along the Red Sea during the study period (1982–2020) to retrieve the accumulative heat stress for corals when the SST exceeds the long-term MMM (i.e., maximum climatology; Donner et al., 2005). The long-term MMM over the last 39 years was calculated for each pixel, while the thermal threshold was calculated as 1°C above the MMM. We subsequently calculated the hotspot which is a daily SST that is larger than MMM (HotSpot = daily SST – MMM) for each pixel, while negative values were adjusted to zero (Skirving et al., 2020). The DHW was calculated by summing hotspots >1°C over a 12-week window to combine the duration and intensity of the heat stress (Liu et al., 2006). The maximum value for degree heating week at each grid was extracted for each year during 1982–2020, and mapped along the Red Sea.
Adjusted thermal threshold models
An assumption that corals have a similar threshold (32°C) throughout the Red Sea (Fine et al., 2013) suggests that the northern Red Sea does not conform to the classical threshold (MMM+1°C) that triggers bleaching and mortality elsewhere (according to DHW>4 for widespread mortality and DHW>8 for mass mortality, Liu et al., 2013). Classical thresholds would, in fact, lead to high DHWs and hence potentially false positive bleaching alarms in the north, unlike central and southern Red Sea regions that experience bleaching at less DHWs. We therefore manually adjusted the thermal threshold to 30, 31, or 32°C to recalculate DHWs in three separate models to test whether corals have a similar threshold (32°C) along the Red Sea. To do so, we used the classical threshold (MMM+1°C, see above) as a reference to manually adjust the thresholds. Pixels with values of MMM+1°C below 30, 31, or 32°C were adjusted to either 30, 31, or 32°C respectively in the three separate model runs (and so pixels with values of MMM ≥30, 31, and 32°C remained unchanged). The adjusted threshold values were then used to recalculate the DHWs (as described above) to assess changes in the spatial DHWs pattern in each adjusted model. This enabled us to assess which DHW model(s) likely aligned with long-term bleaching observation along the Red Sea.
Bleaching data
Bleaching data were obtained from three different sources to identify the DHW model approach that most consistently aligned to bleaching patterns. Bleaching data was compiled from, i) literature survey of publications that reported coral bleaching events along the Red Sea. Data for bleaching intensity, coordinates, and year of bleaching were extracted for each site; ii) field surveys conducted at ten sites representing the Egyptian (n=5) and Saudi Arabian (n=5) coasts from 2015 to 2021 (see Figure S1). Data for these surveys were collected at 5–10m depth using the standard reef check method via SCUBA (Reef Check Foundation, 2020; Carriger et al., 2021). Description of surveyed sites can be found in the Supplementary Data; iii) Data obtained from the Reef Check Foundation include 558 surveys/sites along the Egyptian Red Sea conducted between 1998 and 2020.
The intensity of coral bleaching may correlate with several thermal indices that show significant correlations with the spatial variation of bleaching on regional (Pineda et al., 2013) and global scales (Sully and Van Woesik, 2020; Donovan et al., 2021). These indices include but are not limited to, SST anomaly (SSTA; weekly SST minus weekly climatological SST), SSTA frequency (the number of times over the previous 52 weeks that the SSTA was greater than or equal to 1°C), DHW, and many others. We, therefore, used the precalculated indices in the Global Coral Reef Temperature Anomaly Database (CoRTAD; Version 6; https://www.ncei.noaa.gov/data/oceans/cortad/Version6/), 4-km resolution, simultaneously with our bleaching record. Potential correlations between bleaching data and selected CoRTAD thermal indices during 1982–2020 were investigated using covariate correlation to investigate the strength of correlation between variables. Covariates were calculated using pair-wise Pearson’s correlation coefficients and plotted using "R" statistical software (Core R. Team et al., 2013).
Thermal projection under future scenarios
Coupled Model Intercomparison Project (CMIP) outputs were used to assess past, present, and future global warming that are influenced by natural variabilities or radiative forcing, and are based on validated global coupled ocean-atmosphere general circulation models (Meehl et al., 2000). Accuracy of CMIP simulation results have been regularly assessed and adopted in consecutive Intergovernmental Panel on Climate Change (IPCC) Reports (Hu et al., 2022). We used the output of 25 different experiments (models) from the Coupled Model Intercomparison Project Phase 5 (CMIP5, https://pcmdi.llnl.gov/mips/cmip5/) as previously applied for other regions (McWhorter et al., 2021). Each experiment output was downloaded as NetCDF, cropped, and manipulated by MATLAB (Version R2020b). We calculate the ensemble mean of 25 different experiments for the projected sea surface temperatures (Tos). Future Tos changes under the four RCP scenarios were then calculated using a 30-year running average from 2006 to 2100 under four representative concentration pathway scenarios [i.e., RCP2.6, RCP4.5, RCP6.0, and RCP8.5, where the numbers indicate the assumed radiative forcing in 2100 according to the IPCC (Moss et al., 2008)]. The output of each model was mapped along the Red Sea to assess the spatial variation in thermal projection along the Red Sea under each RCP scenario. To assess the temporal pattern of thermal projections over different Red Sea regions, we divided the Red Sea into three regions: namely the northern (21.5°–30°N), the central (16.5°–21.5°N), and the southern Red Sea (16.5°N–10.2°N in the Bab El Mandab strait). Further, expected SST warming (ΔTos) for all pixels within each region (i.e., North, Central, and South) were averaged and plotted against time to assess temporal variation in warming using R statistical software (Core R. Team et al., 2013). Specifically, to examine the rate of warming for the northern Red Sea versus central and southern regions and hence the extent to which the northern Red Sea is retained as potential refugia.
Results
SST variability
SST analysis using OISST data 1982-2020 revealed that the annual mean SST (i.e., climatological mean) increased from north to the south Red Sea, ranging from 22°C to 30°C (Figure 1A). In contrast, SST variability (i.e., standard deviation) exhibited the opposite pattern with the lowest and highest variability observed for the south (~ ±2°C) and the north, respectively, and particularly for the Gulf of Suez (~ ±3.5°C) (Figure 1B). LSE and TSE methods indicated strong warming trends in the northern compared to the central and southern Red Sea; however, either model exhibited slight spatial differences (Figures S3, 1C). TSE revealed higher warming trends in the northern region (range 0.4–0.18°C decade‐1) compared to the southern Red Sea (0.15–0.25°C decade‐1), particularly for the Farasan Islands (0.2°C decade‐1). LSE returned a similar warming trend (range, 0.43–0.2°C decade‐1) along the Red Sea but with greater warming particularly for the central region (0.27–0.32°C decade‐1 – see Figure S3).
Seasonal variability exhibited spatial patterns along the Red Sea, where SST seasonal variation was least in the southeast region of the Red Sea (amplitude<1.7°C) close to the Bab El Mandab strait (Figure 1D). In contrast, SST seasonal variation was greatest for the Gulf of Suez (amplitude >4.8°C), followed by the Gulf of Aqaba (amplitude 2.5°C). In addition, there was a 30–60 days shift (i.e., phase lag values) at the beginning of each seasonal cycle along the Red Sea highlighting that the summer season starts earlier in the north (July–August), which gradually moves southward (August–September, see also Figure S4). The latest summer peak is usually observed along the southern coast of Saudi Arabia (phase lag = 60 days at the Farasan Islands and Al Lith).
Thermal anomalies using EOF analysis returned relatively higher SST anomalies for the northern region compared to the southern region, where the first two modes of EOF combined explained approximately 61.3% of the total SST anomalies variances (Figure 2, see Figure S5 for temporal evolution). The first mode (explaining 35% of the total variance) showed higher SST anomalies in the north relative to the southern region and a zonal gradient between east-west coasts, where the eastern coast had higher anomalies than the western coast in the northern region (Figure 2A). The second mode (explaining 26.3% of the total variance) exhibited a similar gradient of SST anomalies pattern along the Red Sea, but with more meridional changes that did not change between the east and west coast in the northern region (Figure 2B).
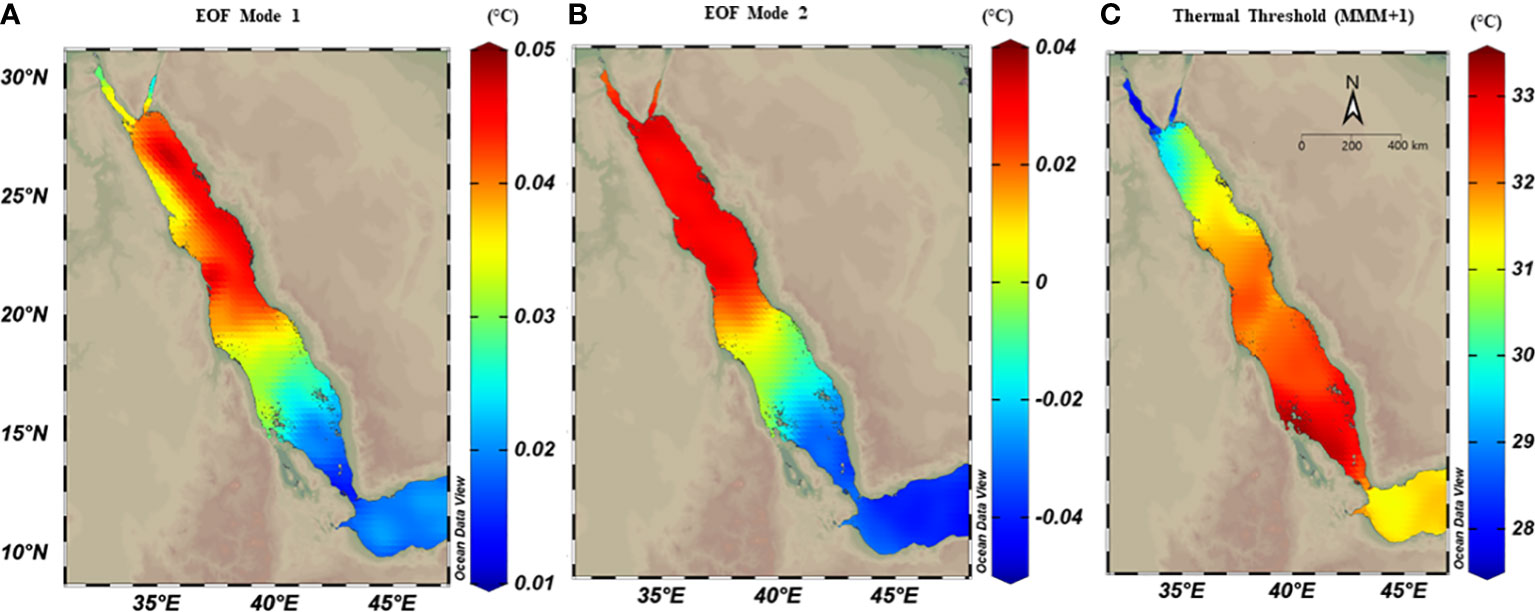
Figure 2 Spatial distribution maps of thermal anomalies using empirical orthogonal function (EOF) analysis on OSSIT remote sensing data (1982-2020) along the Red Sea. The first two modes of EOF (explaining 61%) were extracted and each mode was mapped separately. Both modes showed relatively higher thermal anomalies in the northern region compared to the southern regions. (A) The first mode (explained 35% of the total SST anomaly variance), and showed higher SST anomalies in the northern region, with a zonal gradient between east and west; (B) The second mode (explained 26.3% of SST anomaly variance) with a pronounced latitudinal difference. (C) spatial distribution of thermal threshold (°C) calculated as the maximum monthly mean over 39 years plus 1°C (MMM+1), where spatial variability exhibited a higher threshold in the southern region (ca.33°C) compared to the northern region (<29°C).
The thermal threshold based on the long-term SST monthly mean (i.e., MMM+1°C; see Glynn and D’croz, 1990) varied along the Red Sea latitudinal gradient, ranging from 28°C in the north to 33°C in the south (Figure 2C). Higher thresholds appeared near the Farasan Islands (Saudi Arabia) and Massawa (Eritrea), declining toward the north to reach 28.5°C in the Gulf of Aqaba and 27.5°C in the Gulf of Suez. Notably, the thermal threshold in the northern Red Sea also varied between the east and west coasts, where the Egyptian coast had a lower thermal threshold than the Saudi Arabian coast at the same latitudes (Figure 2C). DHWs over the past 39 years were largely restricted to the southern Red Sea region until the year 2000 (Figure 3). However, this pattern was altered in the last two decades (2000–2020) with a higher frequency and intensity of DHWs observed for the northern Red Sea region (Figure 3; see also DHWs in Figure S4).
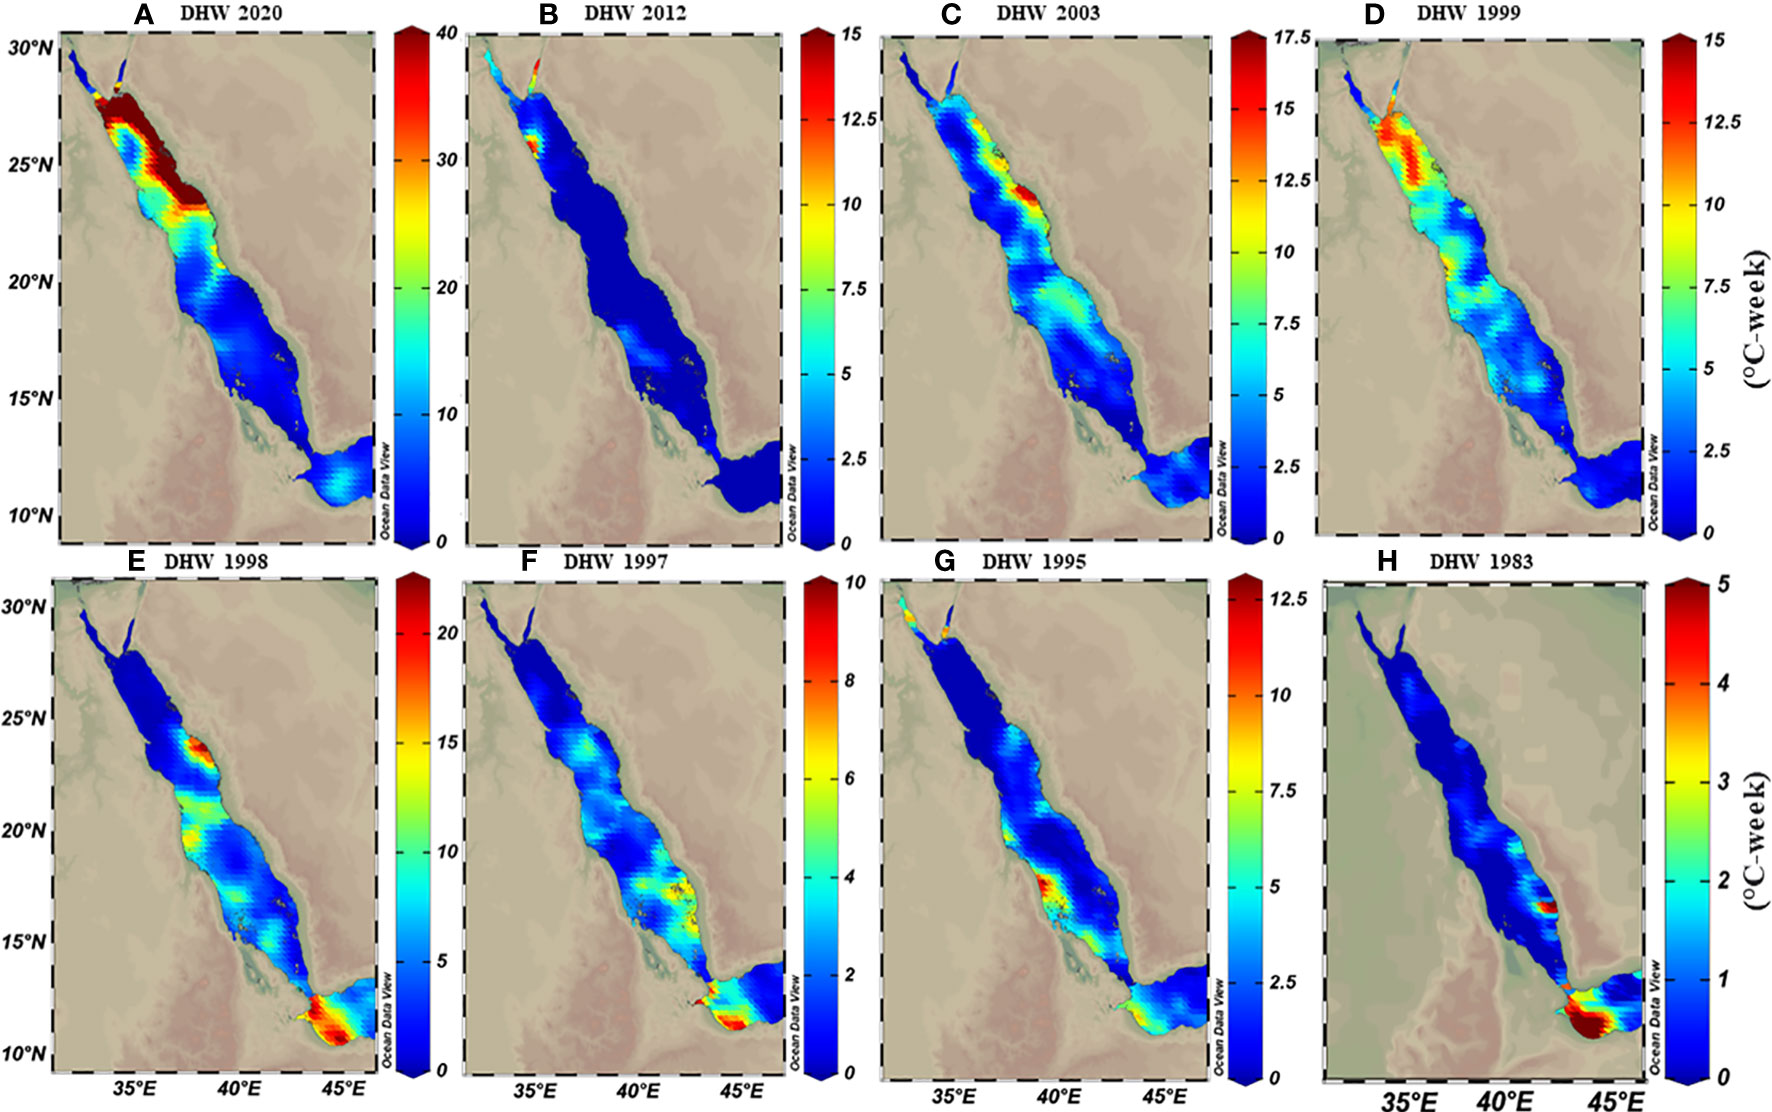
Figure 3 Calculated maximum degree heating weeks (DHWs) based on MMM+1°C for representative years over the 39 years data analysis period (1982-2020). Maps demonstrate how DHWs shifted from the southern (in E-H) to the northern region (A-D) over time, where DHWs were restricted to the southern regions until the 2000s. In contrast, the frequency and intensity of DHWs shifted toward the northern regions. Notably, the colour legend in each map has a different scale range to exemplify the increase of DHWs intensity over time along the Red Sea.
Field surveys and adjusted thermal threshold models
We used CoRTAD v.6 data to examine changes in thermal stress indices at the surveyed locations and investigate potential correlations between these indices and bleaching observations (see Sully et al., 2019). Similar to OSSIT, the unadjusted DHWs (MMM+1°C) for the same locations as the surveys increased with time (Figure 4A) but no correlation was ultimately returned between thermal indices and percentage of bleaching (Figure 4B, see also Figure S5). Therefore, we recalculated DHWs (previously developed from OISST; Version 2 dataset) over 39 years based on both the conventional/classical (MMM+1°C) and adjusted thermal thresholds (i.e., MMM+1°C values<30, 31, and 32°C were adjusted to 30, 31, and 32°C) to test whether corals have a similar threshold (32°C) along the Red Sea. Spatial distribution of DHWs was similar between the classical and the 30°C–adjusted thermal threshold models along the Red Sea, except for the Gulfs of Aqaba and Suez that experienced no DHWs after thermal threshold adjustment to 30°C (Figure 5A, B). Furthermore, the northern Red Sea region had high DHWs (up to 20 DHW) that declined toward the central and southern Red Sea regions, except in Massawa (Eritrea) (Figure 5A). In contrast, the 31°C–adjusted threshold model showed a remarkable decline of DHWs (<5 DHWs) along the west coast of the northern Red Sea (i.e., Egypt), while DHWs along other regions of the Red Sea remained similar to 30°C–adjusted threshold model. Finally, the 32°C–adjusted thermal thresholds exhibited a dramatic decline in the spatial distribution of DHWs where no DHWs were shown over the entire northern region, while the southern and central regions had DHWs similar to those observed in previous models (Figure 5).
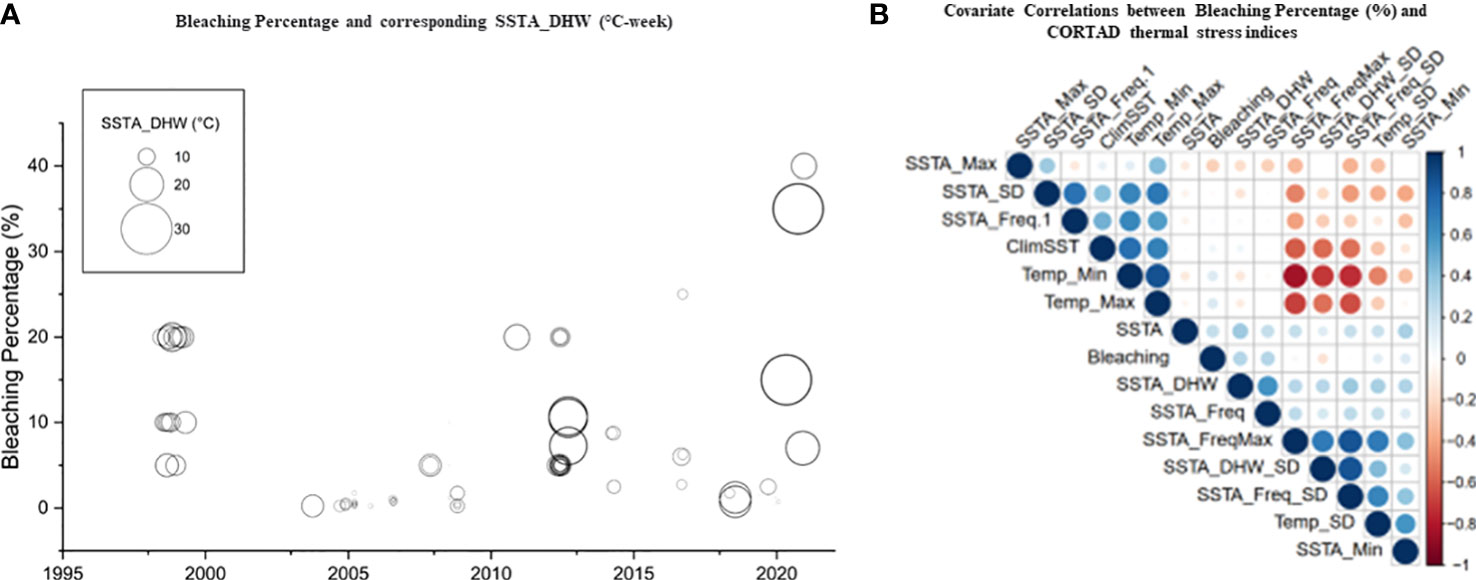
Figure 4 Percentage of bleaching from in situ observations and relationships with precalculated thermal indices obtained from remote sensed SST obtained from CORTAD v.6 data over the 1998-2020 period. (A) Relationship between DHWs and bleaching percentage where the circle size indicated the extent of percentage bleaching (indicating the increase in the severity of bleaching over time along the Red Sea). (B) Correlation plot between precalculated thermal indices (CoRTAD) and bleaching percentage. No correlation was evident between indices, unlike previously reported global studies. The colour and size of the circles indicate the strength of the correlation between variables.
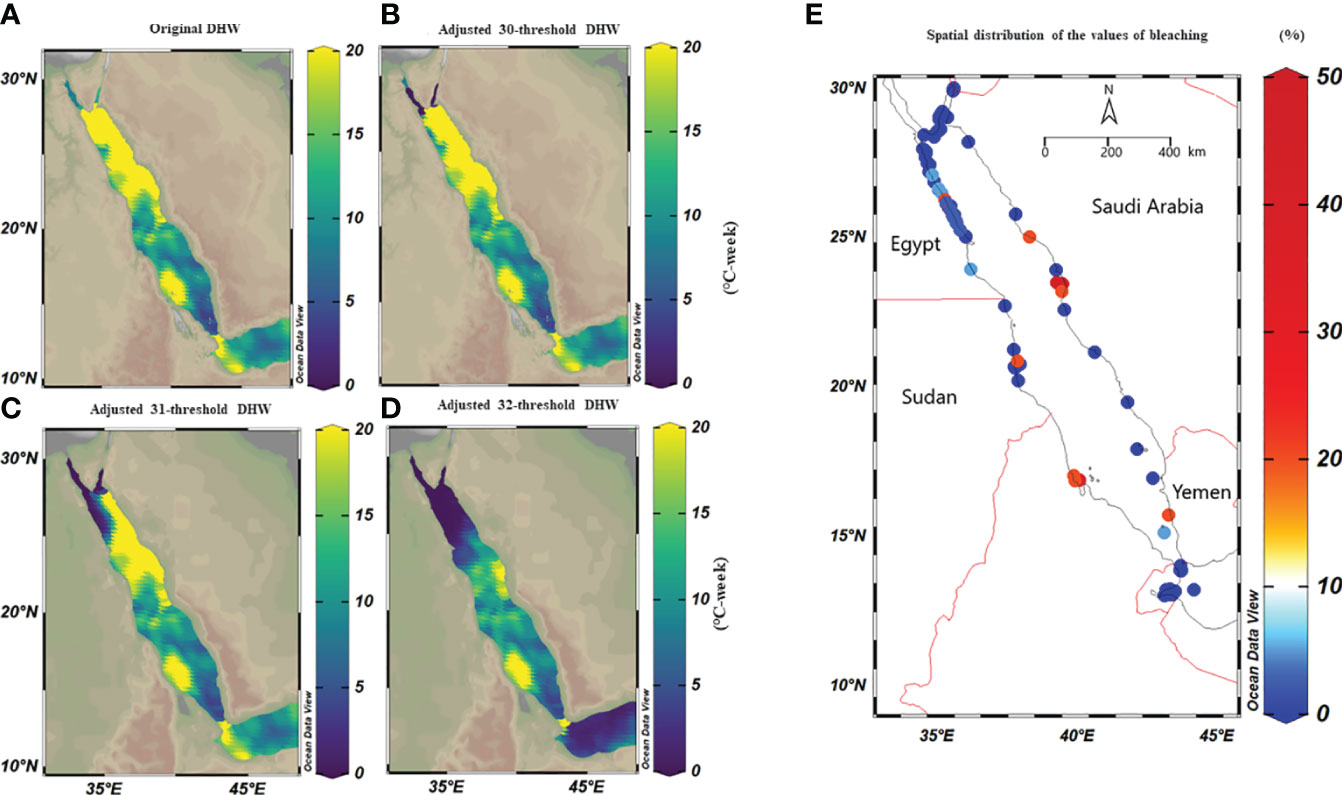
Figure 5 Spatial distribution maps of the maximum DHWs based on classical (i.e., MMM+1°C) and adjusted thermal threshold along the Red Sea over 39 years. We adjusted classical thresholds using a condition that any value less than 30°C, 31°C, and 32°C, for any given pixel are set to 30, 31, and 32°C respectively. (A) DHWs based on the classical thermal thresholds, where the maximum DHWs were higher in the northern compared to the southern Red Sea regions, except for the Gulf of Aqaba and Suez. (B) DHWs at a 30°C–adjusted thermal threshold (i.e., threshold values<30 were adjusted to 30°C) where DHWs decreased to zero in the Gulf of Aqaba and Suez, while DHWs were partially less than the original threshold along the Egyptian coast. (C) DHWs at a 31°C–adjusted threshold, where DHWs appeared less in the northwest region while the eastern region of the northern Red Sea remained unchanged; and (D) DHWs at a 32°C–adjusted threshold shows less DHWs in the northern Red Sea, while DHWs were restricted to the central and southern regions. (E) Map shows the spatial distribution of bleaching observations along the Red Sea obtained from Reef Check data from 1998-2020 and field surveys (total n=568 sites). It highlights that the most of bleaching was recorded in the central and southern of the Red Sea, while the northern Red Sea did not experience bleaching over this period except in 2012. Notably, the number of surveys was more extensive in the north (particularly Egypt and a few in Saudi Arabia) compared to the southern regions (Yemen and Eritrea) highlighting the data limitation.
Historical bleaching observations over the last four decades (total n=568) were used to validate our adjusted threshold models. Overall, no mass coral bleaching events were recorded along the northern Red Sea region from 1998 to 2020, while bleaching was restricted to the central and south (Figure 5E). This pattern was aligned with the 32°C–adjusted thresholds model where the recalculated DHWs markedly declined in the whole northern region, unlike the central and southern region where DHWs remained unchanged in all models (classical vs adjusted threshold). Our field surveys also confirmed this pattern and revealed a lack of bleaching along the northern region (Dahab, Sharm El-Sheikh, and Hurghada) from 2015 to 2020 despite high DHWs (based on MMM+1°C). In contrast, bleaching was recorded in the central region (35%, Ash Shuaybah, Jeddah–2015), while little bleaching was also observed during the summer of 2020 (2%) and of 2021 (<2%) further north of the Saudi Arabian coast (i.e., Yanbu region – Figure 5E). Our data showed that the 32°C–adjusted thermal threshold appears the most reliable model that explains the historical bleaching pattern along the Red Sea. This suggests that corals in the northern region thresholds are independent of changes in the local MMM and retain similar threshold as other regions across the Red Sea.
Thermal projections under future scenarios
Future SST projections under four RCP scenarios were calculated using a 30-year running average. By the end of the 21st century, SST increases for the Red Sea ranged from ~0.5°C under scenario RCP2.6 to 3°C under scenario RCP8.5. In fact, under RCP8.5 (the worst scenario or business-as-usual), the Red Sea could experience an SST increase of ~1°C by 2049 (and ~2°C by 2070 or ~3°C by 2100). In contrast, RCP2.6 (most optimistic) scenario, the maximum increase predicted was 0.45°C by 2060 and with insignificant cooling thereafter (Figure 6). Furthermore, the projected SST warming trends showed substantial differences between the Red Sea regions (i.e., north, central, and south). The warming trend was generally higher for the central and southern regions under all RCP scenarios. In contrast, the predicted warming trend for the northern region was ~0.2–0.5°C less than for the central and southern regions (and in contrast to our linear analysis using LSE and TSE results). Notably, more exposed southern areas (i.e., Farasan and Mussawa) exhibited the highest thermal projections under RCP6.0 and RCP8.5 scenarios (Figure 6). Importantly our model outputs suggest that under the RCP8.5, the northern region that currently experiences 25–28°C ambient SST summer mean will remain below the proposed thermal threshold (32°C) by the end of 21st century.
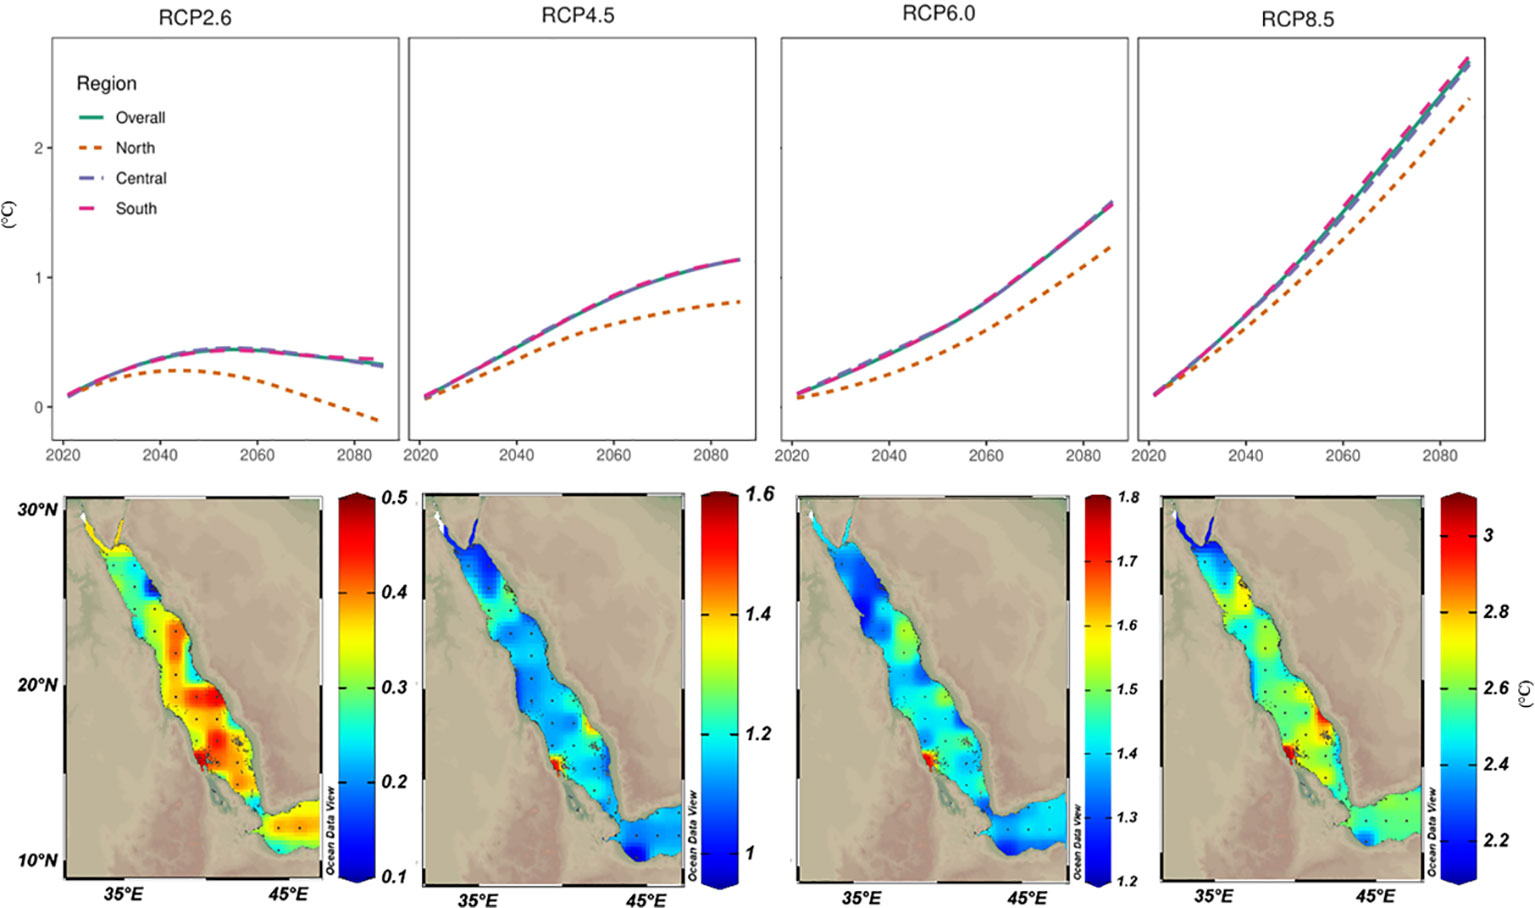
Figure 6 Projected warming trends for the year 2100 based on the CMIP5 ensemble mean models under various representative concentration pathway (RCP) scenarios. Projected sea surface temperature values (ΔTos= Tos2100 – Tos2006) were mapped to assess the spatial distribution of warming trends by 2100 along the Red Sea. Values were also averaged over the different regions of the Red Sea (North, Central, and South) and plotted over time to assess the temporal trends among Red Sea regions. Based on RCP2.6 (the least warming among all investigated scenarios), intriguingly the high values were restricted to the southern parts that may experience up to a 0.5°C increase in the SST by the end of the 21st century. In RCP4.5 and RCP6.0, higher warming trends were projected in the central and southern regions. With the business-as-usual scenario (i.e., RCP8.5), warming in the northern region is projected to be less (2.5°C) than the projected warming in the central and southern (3°C) regions with values less than the reported current warming values using TSE methods.
Discussion
Corals in the northern Red Sea region exhibit exceptional thermal tolerance, and contrast those in the central and southern regions that experienced frequent mass bleaching events (Osman et al., 2018). Higher thermal tolerance in the northern region has been particularly attributed to a natural selection event where corals passed through a thermal barrier (32°C) in the Bab El Mandab strait after the Last Glacial Minimum (6–7 kyr BP, Braithwaite, 1987; Trommer et al., 2010). Prior work has therefore assumed that corals along the Red Sea have a similar upper thermal threshold (32°C) despite their ambient temperature (Fine et al., 2013). As such, corals in the northern region that currently live under relatively lower ambient temperatures (25–28°C) remain below their thermal maxima, enabling the region to serve as refugia by greater buffer from thermal stress. To test this hypothesis, we used remote sensing data for the last four decades to assess the DHWs, where the thermal threshold is manually adjusted to a ubiquitous value of 32°C. We observed a remarkable decline in DHWs for the northern region, but not for the central or southern regions, when the 32°C–adjusted thermal threshold model was used instead of the classical threshold (MMM+1°C). Spatial distribution of 32°C–adjusted DHWs aligned with the bleaching pattern along the Red Sea, with a lack of bleaching in the north and mass bleaching in the central and southern Red Sea. Our data support the notion that corals have, indeed, been filtered to possess a similar threshold (32°C) along the Red Sea as previously proposed. As such, it was subsequently imperative to assess the extent to which this region will remain refugia for coral under future thermal projections. CMIP5 model predicted that the seawater temperatures will increase by ~3°C along the Red Sea by 2100 under the most extreme scenario (RCP8.5) – even so, this will result in SST remaining below the 32°C thresholds for coral bleaching in the northern (but not central or southern) region, highlighting that the northern region could be one of the last standing reefs in the future unless corals can thermally adapt.
Thermal variability along the Red Sea latitudinal gradient
Overall, the variability of thermal regimes may govern the thermal tolerance of corals. High daily and/or seasonal SST variability may improve the adaptive capacity of corals to tolerate heat stress (Palumbi et al., 2014; Schoepf et al., 2015). For example, corals in high variability backreef pools and/or mangroves that experience high-temperature fluctuations exhibit higher thermal tolerance relative to other nearby corals that experience less variable SST (Oliver and Palumbi, 2011; Camp et al., 2020). We observed higher SST standard deviation and seasonal variations in the northern compared to the southern Red Sea region (see Figure 2), which could in principle be considered to enhance thermal tolerance for the northern region. However, the thermal tolerance of corals may not always be enhanced by thermal variability; for example, massive corals (Porites lobata and Goniastrea retiformis) obtained from high and low thermal variability habitats exhibited similar susceptibility and physiological response to acute heat stress despite their thermal origin (Klepac and Barshis, 2020). Similarly, Acropora aspera preconditioned to constant and variable daily temperature exhibit the same physiological response and thermal susceptibility to heat stress (Schoepf et al., 2022). This suggests that SST variance is not a primary driver of enhanced tolerance for the northern region and other factors may govern this process.
We found higher thermal anomalies in the east than on the west coast of the northern Red Sea. This may contribute also, to some extent, to the observed differential bleaching susceptibility of corals between the east and west coast of the Red Sea. Mass corals bleaching was observed on the east side of the Red Sea (Rabigh) in 1998 and 2015 in Thuwal (Saudi Arabian coasts), while no bleaching was reported on the western coast of the Red Sea at the same latitude (Osman et al., 2018; DeCarlo et al., 2020). Such differential susceptibility between the east and west coast may be attributed to the cooling effect from the Gulf of Suez or high-speed cyclonic eddies in the west region. Specifically, the warm current moves toward the north of the Saudi Arabian coast (July to December) and then turns toward the west coast at the Gulf of Aqaba forming a cyclonic circulation (Eladawy et al., 2017). This movement is aligned with the mixing of cold water from the Gulf of Suez (Eladawy et al., 2018) and in turn, provides a high-speed cold-water current to the western coast of the northern Red Sea (Egypt). Notably, this process does not affect corals in the Gulf of Aqaba, and thus, it does not explain the exceptional thermal tolerance throughout the northern Red Sea region. High-speed currents can mediate thermal stress and enhance coral resistance (Nakamura and Van Woesik, 2001; Page et al., 2021), but this is a factor that yet to be also tested as a driver of thermal tolerance in the Red Sea region. We, therefore, propose that nested local hydrodynamic model(s) detailing the thermal heating and cooling dynamics are urgently needed to understand physical factors that affect corals’ resistance along the northern Red Sea.
Adjusted threshold versus bleaching observations
The dependency of coral bleaching on thermal stress dynamics in the northern Red Sea is currently unclear. The assumption that coral populations have a similar thermal threshold (32°C) along the Red Sea is a generally accepted theory that explains the exceptional tolerance of coral in the northern region. Corals in the Gulf of Aqaba, for example, that experience ~25°C mean summer temperatures remain ~7°C below their bleaching threshold. Thus, the currently used thermal threshold model (MMM+1°C) that relies on the long-term summer mean is lower than the actual threshold (32°C) that triggers bleaching. We adjusted the thermal threshold up to 32°C and recalculated DHWs to assess how the spatial distribution of the adjusted DHWs aligns with the lack of bleaching observations along the Red Sea. Our 32°C–adjusted threshold, indeed, confirmed a dramatic decline in DHWs exclusively for the northern region whereas DHWs for the central and southern regions remained unchanged. Consequently, the thermal threshold in the central and southern Red Sea is already relatively close to 32°C, and thus, adjusting the threshold did not change DHWs for central and southern regions. This is unlike DHWs in the northern region which has a lower threshold value (<30°C) and thus, DHWs dramatically declined. Indeed, the classical thermal threshold (MMM+1°C) ranged from 31–33°C in the southern region compared to 25–29°C for the northern region (see Figure 2).
The bleaching pattern along the Red Sea matched the spatial distribution of the recalculated DHWs using a 32°C–adjusted threshold. Historical bleaching surveys (total n=568, 1998–2020) revealed a lack of mass bleaching along the northern region, while bleaching was restricted to the central and southern regions (Figure 5). Again, this supports the assumption that corals retain a similar thermal threshold (32°C) along the Red Sea, and coral thresholds do not follow the maximum summer temperature mean (MMM+1°C) as in other regions. Corals in the northern region, therefore, require higher thermal stress to bleach than corals in other Red Sea regions, which also explains previously highly reported DHWs values and false-positive bleaching alarms (NOAA Coral Reef Watch). The currently used method to calculate DHW by NOAA Coral Reef Watch (Liu et al., 2006) relies on MMM+1°C as a threshold, which is thus below corals’ physiological maxima and insufficient to trigger bleaching in the northern Red Sea. Such an outcome is in line with previous field observations, particularly during the El Niño event in 2015, where corals showed mass bleaching in central and southern regions but not in the northern region despite exposure to similar heat stress (Osman et al., 2018). Similarly, our sporadic bleaching surveys found similar findings where coral bleaching in Yanbu was 2%, while south Jeddah experienced 35% bleaching during 2015 (Figure S1). This also was consistent with bleaching observations during 2022 where the central Red Sea (Thwual, Saudi Arabia) showed mild bleaching, while no bleaching was observed in the northern region (e.g., Shusha Island, Saudi Arabia) despite NOAA bleaching alert (personal and anecdotal data). This highlights that corals in the northern Red Sea require more heat stress to bleach to reach their physiological threshold.
Interestingly, several lab experiments further support the notion of greater thermal tolerance in the northern region, unlike other studies that showed higher corals susceptibility in the central and southern regions. For example, three coral species in the Gulf of Aqaba appeared healthy and maintained energy reserves and biomass after exposure to +6°C above MMM for 37 days (equivalent to 32 DHWs – see Grottoli et al., 2017). Further, Krueger et al. (2017) exposed Stylophora pistillata in the Gulf of Aqaba for 11 DHWs and observed stability in host and symbiont biomass with only subtle cellular-level shifts in carbon and nitrogen metabolism under elevated temperatures. Similarly, the photo-physiological response of four coral species in the northern region (Hurghada, Egypt) showed higher tolerance than the same coral species in the central region (Thuwal, Saudi Arabia) when they were exposed to 4°C above their respective local MMM (Osman et al., 2018). Finally, Banc-Prandi et al. (2022) estimated the optimal temperature (Topt) that is needed for ideal coral metabolism and reproduction and observed that Topt in the Gulf of Aqaba was significantly above local MMM, while Topt for corals in DJibouti was closer to local MMM. This was also consistent with the assessment of the thermal threshold using the Coral Bleaching Automated Stress System (CBASS) which showed that corals in the Gulf of Aqaba are more resistant than corals in the central and southern regions (Voolstra et al., 2021; Evensen et al., 2022). Collectively, these examples provide important evidence for the Red Sea – outside of normal heat stress bleaching cycles – that use of MMM+1°C to define thresholds may lead to erroneous predictions of bleaching, but also the susceptibility of corals to future heat stress projections.
Molecular responses of the coral holobionts to heat stress also showed extensive variations among the Red Sea regions. The transcriptome of Stylophora pistillata from the Gulf of Aqaba showed fast and pervasive changes in gene expression after exposure to 32°C and followed by a return to baseline expression during recovery. In contrast, S. pistillata raised to 34.5°C, showed large differences in overall gene expression, with limited recovery to the baseline expression and dominance of opportunistic bacteria, indicating that the lethal temperature threshold was probably exceeded (Savary et al., 2021). This hypothesis was further supported by high instances of holobiont mortality at 34.5°C. On the other hand, S. pistillata sampled from the central Red Sea exhibited muted and fixed high gene expression, suggesting that corals cannot further attune heat stress (Voolstra et al., 2021). Sawall et al. (2015) similarly reported extensive phenotypic plasticity of Pocillopora verrucose in the northern Red Sea, unlike those sampled in the central and southern Red Sea. Osman et al. (2020) also found microbiome variations among six coral species along a latitudinal grant in the northern Red Sea, which included the identification of five novel endosymbionts. Taken together, we propose that coral holobionts in the northern Red Sea could have intrinsic molecular and physiological capacities to tolerate thermal stress. Importantly, the exact mechanism(s) underlying differences in thermal tolerance across Red Sea regions are likely different and part of a complex process that remains unresolved. Additional research is required to standardize response measures and/or the sampling/preparation protocols, ensuring comparable data along the Red Sea. Addressing the difficulties involved in identifying specific temperature thresholds that trigger bleaching at the coral holobiont level in the Red Sea should also be prioritized.
Thermal projections under future scenarios
The Red Sea has experienced a shift in the climate pattern along its latitudinal gradient over the last 3–4 decades (e.g., Raitsos et al., 2013; Chaidez et al., 2017; Osman et al., 2018; Shaltout, 2019). Our data were consistent with this notion and showed that DHWs were restricted to the southern region during the 1980-90s, while this pattern was altered with more intense and frequent DHWs in the northern region over the last two decades (see Figure 3). As such, higher warming trends appear evident for the northern compared to southern and central regions, which raises concerns about the capacity of marine life to adapt to warming across different Red Sea regions. We consider that the warming trend for the northern region though is overestimated for two reasons: First, most prior studies have used linear trends (slope) over relatively short time frames (2-4 decades) to predict future SST warming trends, an approach that can be hindered or intensified by natural and longer-term variability (Krokos et al., 2019). For example, the Red Sea is influenced by the Atlantic Multidecadal Oscillation (AMO) and higher warming trends coincide with the positive phase of this oscillation, and thus the SST trend is amplified (Krokos et al., 2019). Alawad et al. (2020) supported this notion and revealed that current warming for the Red Sea is largely amplified by the overlap of warming signals between the AMO and the Silk Road Pattern (SRP) in the non-uniform warming trends over the Red Sea basin, and thus might in fact decrease over the next few decades. Although it should be noted that Mann et al. (2020) did not support the presence of an internally generated multidecadal oscillatory signal in the last millennium. Second, the assumption of a linear trend to project future warming of thermal projection over time is unreliable as the warming rates will be intrinsically linked to many climatic and oceanographic processes that themselves can change the warming cycle (and hence the nature of the trend) in the future (Jonko, 2015).
Our results using LSE and TSE approaches were consistent with prior studies of greater warming trends for the northern region (0.18–0.4°C decade‐1) compared to the central and southern regions (0.15–0.25°C decade‐1) during the last four decades. However, these approaches suggest SST for the northern region will increase by 3°C by 2060 contradicting our CMIP5 predictions whereby SST will increase by a maximum of 3°C for the Red Sea by 2100 (and with the northern region experiencing lower warming trends under all RCP scenarios) (Figure 6). Krokos et al. (2019) predict that the Atlantic Multidecadal Oscillation will shift from a positive to a negative phase during the next decades, and thus, SST along the Red Sea may shift into a cooling phase. Such a shift would appear consistent with our CMIP5 predictions where the Red Sea will experience a slight cooling (or stable trend) phase under the optimistic RCP2.6 scenario. Overall, we argue that the highly reported prior warming trends for the northern Red Sea are likely overestimated, and more complex models need to be implemented to accurately forecast the warming trends over the Red Sea.
Using the output of CMIP5 models (i.e., the ensemble means of 25 experiments) predicted that the Red Sea would be subject to ~3°C warming a most by 2100, and where the northern region will experience ~2–2.5°C warming. Such projections are consistent with the previous estimation of thermal projections (3.3 ±> 0.6°C) for the entire Red Sea basin by 2100 under RCP8.5, but only 8 CMIP5 ensemble models were used (Agulles et al., 2021). Whilst warming scenarios of RCP8.5 draw an extremely bleak future for planet Earth, it provides a window of hope for corals in the Red Sea assuming the bleaching threshold in the region is 32°C. The northern region currently experiences low ambient temperature (summer mean, 25–28°C) predicted to be 28–31°C in 2100, and hence, still below the proposed thermal threshold (32°C) and assuming no catastrophic heatwaves during this period. Such an outcome contrasts with the previous assumption that the warming rates for the northern region are higher than the global average and may no longer retain corals refugia. Previous predictions suggest that the global area of thermal refugia will decline from 84% in the present-day climate to 0.2% at 1.5°C, and to 0% at 2.0°C of global warming (Dixon et al., 2022). We argue here that corals in the northern region do not follow the classical threshold that is used in such predictions, and the northern region of the Red Sea may be exceptional as one of the last standing corals refugia in the future.
Conclusion
Our study examines whether corals along the Red Sea have a similar threshold (32°C) despite the variation in their local ambient temperature. We used remote sensing SST data (1982–2020) to manually adjust the bleaching thresholds to 30, 31, or 32°C to test this hypothesis. We observed that DHWs were reduced for the northern region after using the 32°C–adjusted threshold – but not for the central and southern regions – and aligned with historical spatial bleaching patterns along the Red Sea. We suggest that corals in the northern Red Sea region remain below their thermal maxima and require higher thermal stress to trigger bleaching, highlighting that the northern region serves as refugia for corals even under extreme climate projections. It is noteworthy that the actual temperature that triggers in situ bleaching has yet to be experimentally determined. Further CMIP5 experimental outputs were used to predict Red Sea warming trends. We predict that SSTs will increase by 3°C maximum under the worst scenario (RCP8.5) by 2100, but where the northern region will warm 0.2–0.5°C less than compared to the central and southern regions. As a result, the northern region could represent an exceptional refuge for corals from climate change, and thus essential to prioritize conservation and management efforts for the wider Red Sea regions.
Data availability statement
The raw data supporting the conclusions of this article will be made available by the authors, without undue reservation.
Author contributions
EO, AE, and TN designed the study, AE, and MS analyzed the data and AE produced figures, while AM coordinated field surveys. EO primarily wrote the first draft with AE, while all authors contributed to the article and approved the submitted version.
Funding
Funding for this study was provided by JSPS KAKENHI Grant Number JP20F20396, JSPS KAKENHI Grant number JP20K12134, Environment Research and Technology Development Fund (JPMEERF20184006), and Environment Research and Technology Development Fund (JPMEERF20224M01). AE was supported by a Grant-in-Aid for Japan Society for the Promotion of Science (JSPS) postdoctoral fellows for research in Japan (grant # P20396). This research was also supported in part by a grant #NGS-60324R-20 from the National Geographic Society provided to EO, and by KAUST baseline fund provided to MF.
Acknowledgments
This study was funded by the Japan Society for the Promotion of Science (JSPS). The authors would like to acknowledge the Reef Check Foundation for providing their data. We would also like to thank Prof. Mohammed Kotb, Prof. Mahmoud Hanafy, divers and professional underwater photographers, including Dr. Wael Hefny, Mr. Amro Khalil, Mr. Ayman Nasr, and Mr. Hans Sjoeholm, for support during the field surveys. We are grateful to Prof. David Suggett for the editorial and intellectual input and to the two reviewers for their constructive comments and suggestions. We acknowledge the World Climate Research Programme’s Working Group on Coupled Modelling, which is responsible for CMIP, and we thank the climate modeling groups (listed in Figure 6 of this paper) for producing and making available their model output. Finally, the NOAA National Centers for Environmental Information, the Group for High-Resolution Sea Surface Temperature, and the U.S. National Centers for Environmental Information are acknowledged for providing seawater temperature data.
Conflict of interest
The authors declare that the research was conducted in the absence of any commercial or financial relationships that could be construed as a potential conflict of interest.
Publisher’s note
All claims expressed in this article are solely those of the authors and do not necessarily represent those of their affiliated organizations, or those of the publisher, the editors and the reviewers. Any product that may be evaluated in this article, or claim that may be made by its manufacturer, is not guaranteed or endorsed by the publisher.
Supplementary material
The Supplementary Material for this article can be found online at: https://www.frontiersin.org/articles/10.3389/fmars.2022.938454/full#supplementary-material
References
Agulles M., Jordà G., Hoteit I., Agustí S., Duarte C. M. (2021). Assessment of red Sea temperatures in CMIP5 models for present and future climate. PloS One 16, e0255505. doi: 10.1371/journal.pone.0255505
Alawad K. A., Al-Subhi A. M., Alsaafani M. A., Alraddadi T. M. (2020). Decadal variability and recent summer warming amplification of the sea surface temperature in the red Sea. PloS One 15, e0237436. doi: 10.1371/journal.pone.0237436
Arora M., Gujrati A., Chaudhury N. R., Chauhan P., Patel R. C. (2021). Assessment of coral reef thermal stress over India based on remotely sensed sea surface temperature. Geocarto Int. 36, 740–757. doi: 10.1080/10106049.2019.1624983
Banc-Prandi G., Evensen N. R., Barshis D. J., Perna G., Moussa Omar Y., Fine M. (2022). Assessment of temperature optimum signatures of corals at both latitudinal extremes of the red Sea. Conserv. Physiol. 10, coac002. doi: 10.1093/conphys/coac002
Banzon V. F., Reynolds R. W., Stokes D., Xue Y. (2014). A 1/4-spatial-resolution daily sea surface temperature climatology based on a blended satellite and in situ analysis. J. Climate 27, 8221–8228. doi: 10.1175/JCLI-D-14-00293.1
Banzon V., Smith T. M., Steele M., Huang B., Zhang H.-M. (2020). Improved estimation of proxy sea surface temperature in the Arctic. J. Atmospheric Oceanic Technol. 37, 341–349. doi: 10.1175/JTECH-D-19-0177.1
Björnsson H., Venegas S. A. (1997). A manual for EOF and SVD analyses of climatic data. CCGCR Rep. 97, 112–134.
Borzelli G., Ligi R. (1999). Empirical orthogonal function analysis of sst image series: a physical interpretation. J. Atmospheric Oceanic Technol. 16, 682–690. doi: 10.1175/1520-0426(1999)016<0682:EOFAOS>2.0.CO;2
Braithwaite C. J. R. (1987). Geology and palaeogeography of the red Sea region in Edwards A. J., Head S. M. B. T. -R. S. (Amsterdam: Pergamon Press Oxford). pp. 22–44
Brewin R. J. W., Raitsos D. E., Dall’Olmo G., Zarokanellos N., Jackson T., Racault M. F., et al. (2015). Regional ocean-colour chlorophyll algorithms for the red Sea. Remote Sens. Environ. 165, 64–85. doi: 10.1016/j.rse.2015.04.024
Camp E. F., Suggett D. J., Pogoreutz C., Nitschke M. R., Houlbreque F., Hume B. C. C., et al. (2020). Corals exhibit distinct patterns of microbial reorganisation to thrive in an extreme inshore environment. Coral Reefs 3, 1–16. doi: 10.1007/s00338-019-01889-3
Carriger J. F., Yee S. H., Fisher W. S. (2021). Assessing coral reef condition indicators for local and global stressors using Bayesian networks. Integrated Environ. Assess. Manage. 17, 165–187. doi: 10.1002/ieam.4368
Chaidez V., Dreano D., Agusti S., Duarte C. M., Hoteit I. (2017). Decadal trends in red Sea maximum surface temperature. Sci. Rep. 7, 1–8. doi: 10.1038/s41598-017-08146-z
Chervenkov H., Slavov K. (2017). Theil-sen estimator for the parameters of the generalized extreme value distributions: demonstration for meteorological applications. Comptes Rendus L’Académie Bulgare Des. Sci. 70, 12. Available at: https://link.gale.com/apps/doc/A570688685/AONE?u=anon~4d3efe2&sid=googleScholar&xid=2ca5f3f6.
Chervenkov H., Slavov K. (2019). Theil-sen estimator vs. ordinary least squares–trend analysis for selected ETCCDI climate indices. Comptes Rendus Acad. Bulg. Sci. 72, 47–54. doi: 10.7546/CRABS.2019.01.06
Core R. Team, et al. (2013). R: A language and environment for statistical computing. Available at: http://lib.stat.cmu.edu/R/CRAN/doc/manuals/r-devel/fullrefman.pdf.
Cornwell B., Armstrong K., Walker N. S., Lippert M., Nestor V., Golbuu Y., et al. (2021). Widespread variation in heat tolerance and symbiont load are associated with growth tradeoffs in the coral acropora hyacinthus in Palau. Elife 10, e64790. doi: 10.7554/eLife.64790.sa2
DeCarlo T. M. (2020). Treating coral bleaching as weather: a framework to validate and optimize prediction skill. PeerJ 8, e9449. doi: 10.7717/peerj.9449
DeCarlo T. M., Gajdzik L., Ellis J., Coker D. J., Roberts M. B., Hammerman N. M., et al. (2020). Nutrient-supplying ocean currents modulate coral bleaching susceptibility. Sci. Adv. 6, eabc5493. doi: 10.1126/sciadv.abc5493
Heras-Sánchez M. d. C., Valdez-Holguín J. E., Hazas-Izquierdo R. G. (2019). Sea-Surface temperature spatiotemporal analysis for the Gulf of California, 1998–2015: Regime change simulation, in Torres M., Klapp J., Gitler I., Tchernykh A. Supercomputing. ISUM 2018. Communications in Computer and Information Science (Springer, Cham) 948. doi: 10.1007/978-3-030-10448-1_16.
Deser C., Alexander M. A., Xie S.-P., Phillips A. S., et al. (2010). Sea Surface temperature variability: Patterns and mechanisms. Annu. Rev. Mar. Sci. 2, 115–143. doi: 10.1146/annurev-marine-120408-151453
Dixon A. M., Forster P. M., Heron S. F., Stoner A. M. K., Beger M. (2022). Future loss of local-scale thermal refugia in coral reef ecosystems. PloS Climate 1, e0000004. doi: 10.1371/journal.pclm.0000004
Donner S. D. (2009). Coping with commitment: projected thermal stress on coral reefs under different future scenarios. PloS One 4, e5712. doi: 10.1371/journal.pone.0005712
Donner S. D. (2011). An evaluation of the effect of recent temperature variability on the prediction of coral bleaching events. Ecol. Appl. 21, 1718–1730. doi: 10.1890/10-0107.1
Donner S. D., Skirving W. J., Little C. M., Oppenheimer M., Hoegh-Gulberg O. (2005). Global assessment of coral bleaching and required rates of adaptation under climate change. Global Change Biol. 11, 2251–2265. doi: 10.1111/j.1365-2486.2005.01073.x
Donovan M. K., Burkepile D. E., Kratochwill C., Shlesinger T., Sully S., Oliver T. A., et al. (2021). Local conditions magnify coral loss after marine heatwaves. Science 372, 977–980. doi: 10.1126/science.abd9464
Eakin C. M., Morgan J. A., Heron S. F., Smith T. B., Liu G., Alvarez-Filip L., et al. (2010). Caribbean Corals in crisis: record thermal stress, bleaching, and mortality in 2005. PloS One 5, e13969. doi: 10.1371/journal.pone.0013969
Eladawy A., Nadaoka K., Negm A., Abdel-Fattah S., Hanafy M., Shaltout M. (2017). Characterization of the northern red sea’s oceanic features with remote sensing data and outputs from a global circulation model. Oceanologia 59, 213–237. doi: 10.1016/j.oceano.2017.01.002
Eladawy A., Shaltout M., Sousa M. C., Dias J. M., Nadaoka K. (2018). Estimating the mean circulation and water exchange of the gulf of Suez-red Sea via a validated one-way atmospheric-hydrodynamic coupled model. Earth Syst. Environ. 2, 213–231. doi: 10.1007/s41748-018-0049-7
Evensen N. R., Voolstra C. R., Fine M., Perna G., Buitrago-López C., Cárdenas A., et al. (2022). Empirically derived thermal thresholds of four coral species along the red Sea using a portable and standardized experimental approach. Coral Reefs 30, 1–14. doi: 10.1007/s00338-022-02233-y
Fernandes R., Leblanc S. G. (2005). Parametric (modified least squares) and non-parametric (Theil–sen) linear regressions for predicting biophysical parameters in the presence of measurement errors. Remote Sens. Environ. 95, 303–316. doi: 10.1016/j.rse.2005.01.005
Fine M., Gildor H., Genin A. (2013). A coral reef refuge in the red Sea. Global Change Biol. 19, 3640–3647. doi: 10.1111/gcb.12356
Fox M. D., Cohen A. L., Rotjan R. D., Mangubhai S., Sandin S. A., Smith J. E., et al. (2021). Increasing coral reef resilience through successive marine heatwaves. Geophysical Res. Lett. 48, e2021GL094128. doi: 10.1029/2021GL094128
Genevier L. G. C., Jamil T., Raitsos D. E., Krokos G., Hoteit I. (2019). Marine heatwaves reveal coral reef zones susceptible to bleaching in the red Sea. Global Change Biol. 25, 2338–2351. doi: 10.1111/gcb.14652
Gleeson M. W. (1994). Correlation of coral bleaching events and remotely-sensed sea surface temperatures (United States: NAVAL ACADEMY ANNAPOLIS MD). Available at: https://apps.dtic.mil/sti/citations/ADA284907.
Glynn P. W., D’croz L. (1990). Experimental evidence for high temperature stress as the cause of El nino-coincident coral mortality. Coral Reefs 8, 181–191. doi: 10.1007/BF00265009
Goela P. C., Cordeiro C., Danchenko S., Icely J., Cristina S., Newton A. (2016). Time series analysis of data for sea surface temperature and upwelling components from the southwest coast of Portugal. J. Mar. Syst. 163, 12–22. doi: 10.1016/j.jmarsys.2016.06.002
Goreau T. J., Hayes R. L. (1994). Coral bleaching and ocean” hot spots”. Ambio-J. Hum. Environ. Res. Manage. 23, 176–180. Available at: http://www.botany.hawaii.edu/basch/uhnpscesu/pdfs/sam/Goreau1994bS.pdf.
Grottoli A. G., Tchernov D., Winters G. (2017). Physiological and biogeochemical responses of super-corals to thermal stress from the northern gulf of aqaba, red Sea. Front. Mar. Sci. 4. doi: 10.3389/fmars.2017.00215
Hackerott S., Martell H. A., Eirin-Lopez J. M. (2021). Coral environmental memory: causes, mechanisms, and consequences for future reefs. Trends Ecol. Evol. 36, 1011–1023. doi: 10.1016/j.tree.2021.06.014
Hughes T. P., Anderson K. D., Connolly S. R., Heron S. F., Kerry J. T., Lough J. M., et al. (2018). Spatial and temporal patterns of mass bleaching of corals in the anthropocene. Science 359, 80–83. doi: 10.1126/science.aan8048
Hu Q., Hua W., Yang K., Ming J., Ma P., Zhao Y., et al. (2022). An assessment of temperature simulations by CMIP6 climate models over the Tibetan plateau and differences with CMIP5 climate models. Theor. Appl. Climatol. 1, 1–14. doi: 10.1007/s00704-022-03944-6
Jokiel P. L., Brown E. K. (2004). Global warming, regional trends and inshore environmental conditions influence coral bleaching in Hawaii. Global Change Biol. 10, 1627–1641. doi: 10.1111/j.1365-2486.2004.00836.x
Jonko A. K. (2015). Adapting to nonlinear change. Nat. Climate Change 5, 103–104. doi: 10.1038/nclimate2510
Klepac C. N., Barshis D. J. (2020). Reduced thermal tolerance of massive coral species in a highly variable environment. Proc. R. Soc. B. 287, 20201379. doi: 10.1098/rspb.2020.1379
Krokos G., Papadopoulos V. P., Sofianos S. S., Ombao H., Dybczak P., Hoteit I. (2019). Natural climate oscillations may counteract red Sea warming over the coming decades. Geophysical Res. Lett. 46, 3454–3461. doi: 10.1029/2018GL081397
Krueger T., Horwitz N., Bodin J., Giovani M.-E., Escrig S., Meibom A., et al. (2017). Common reef-building coral in the northern red Sea resistant to elevated temperature and acidification. R. Soc. Open Sci. 4, 170038. doi: 10.1098/rsos.170038
Kumagai N. H., Yamano H. (2018). High-resolution modeling of thermal thresholds and environmental influences on coral bleaching for local and regional reef management. PeerJ 6, e4382. doi: 10.7717/peerj.4382
Lachs L., Bythell J. C., East H. K., Edwards A. J., Mumby P. J., Skirving W. J., et al. (2021). Fine-tuning heat stress algorithms to optimise global predictions of mass coral bleaching. Remote Sens. 13, 2677. doi: 10.3390/rs13142677
Liu G., Rauenzahn J. L., Heron S. F., Eakin C. M., Skirving W. J., Christensen T., et al. (2013). NOAA Coral reef watch 50 km satellite sea surface temperature-based decision support system for coral bleaching management. Available at: https://www.coris.noaa.gov/activities/sst_satellite_decision_support/welcome.html.
Liu G., Strong A. E., Skirving W., Arzayus L. F. (2006). “Overview of NOAA coral reef watch program’s near-real time satellite global coral bleaching monitoring activities,” in Proceedings of the 10th international coral reef symposium (Okinawa, Japan: Gurugram). 1783–1793.
Logan C. A., Dunne J. P., Ryan J. S., Baskett M. L., Donner S. D. (2021). Quantifying global potential for coral evolutionary response to climate change. Nat. Climate Change 11, 537–542. doi: 10.1038/s41558-021-01037-2
Mann M. E., Steinman B. A., Miller S. K. (2020). Absence of internal multidecadal and interdecadal oscillations in climate model simulations. Nat. Commun. 11, 1–9. doi: 10.1038/s41467-019-13823-w
Marullo S., Santoleri R., Malanotte-Rizzoli P., Bergamasco A. (1999). The sea surface temperature field in the Eastern Mediterranean from advanced very high resolution radiometer (AVHRR) data: Part II. Interannual Variability J. Mar. Syst. 20, 83–112. doi: 10.1016/S0924-7963(98)00072-4
McClanahan T. R., Ateweberhan M., Darling E. S., Graham N. A. J., Muthiga N. A. (2014). Biogeography and change among regional coral communities across the Western Indian ocean. PloS One 9, e93385. doi: 10.1371/journal.pone.0093385
McWhorter J. K., Halloran P. R., Roff G., Skirving W. J., Perry C. T., Mumby P. J. (2021). The importance of 1.5° C warming for the great barrier reef. Global Change Biol 28 (4). doi: 10.1111/gcb.15994
Meehl G. A., Boer G. J., Covey C., Latif M., Stouffer R. J. (2000). The coupled model intercomparison project (CMIP). Bull. Am. Meteorol. Soc. 81, 313–318. doi: 10.1175/1520-0477(2000)081<0313:TCMIPC>2.3.CO;2
Morikawa M. K., Palumbi S. R. (2019). Using naturally occurring climate resilient corals to construct bleaching-resistant nurseries. Proc. Natl. Acad. Sci. 116, 10586–10591. doi: 10.1073/pnas.1721415116
Moss R. H., Babiker M., Brinkman S., Calvo E., Carter T., Edmonds J. A., et al. (2008). Towards new scenarios for analysis of emissions, climate change, impacts, and response strategies, (No. PNNL-SA-63186) (Richland, WA United States: Pacific Northwest National Lab.(PNNL).
Nakamura T. V., Van Woesik R. (2001). Water-flow rates and passive diffusion partially explain differential survival of corals during the 1998 bleaching event. Mar. Ecol. Prog. Ser. 212, 301–304. doi: 10.3354/meps212301
Oliver T. A., Palumbi S. R. (2011). Do fluctuating temperature environments elevate coral thermal tolerance? Coral Reefs 30, 429–440. doi: 10.1007/s00338-011-0721-y
Osman E. O., Smith D. J., Ziegler M., Kürten B., Conrad C., El-Haddad K. M., et al. (2018). Thermal refugia against coral bleaching throughout the northern red Sea. Global Change Biol. 24, e474–e484. doi: 10.1111/gcb.13895
Osman E. O., Suggett D.J., Voolstra C. R., Pettay D. T., Clark D. R., Pogoreutz C., et al. Coral microbiome composition along the northern Red Sea suggests high plasticity of bacterial and specificity of endosymbiotic dinoflagellate communities. Microbiome 8, 8. doi: 10.1186/s40168-019-0776-5
Page C. E., Leggat W., Heron S. F., Fordyce A. J., Ainsworth T. D. (2021). High flow conditions mediate damaging impacts of sub-lethal thermal stress on corals’ endosymbiotic algae. Conserv. Physiol. 9, coab046. doi: 10.1093/conphys/coab046
Palumbi S. R., Barshis D. J., Traylor-Knowles N., Bay R. A. (2014). Mechanisms of reef coral resistance to future climate change. Science 344, 895–898. doi: 10.1126/science.1251336
Perkins-Kirkpatrick S. E., Lewis S. C. (2020). Increasing trends in regional heatwaves. Nat. Commun. 11, 1–8. doi: 10.1038/s41467-020-16970-7
Pineda J., Starczak V., Tarrant A., Blythe J., Davis K., Farrar T., et al. (2013). Two spatial scales in a bleaching event: Corals from the mildest and the most extreme thermal environments escape mortality. Limnol. Oceanography 58, 1531–1545. doi: 10.4319/lo.2013.58.5.1531
Raitsos D. E., Pradhan Y., Brewin R. J. W., Stenchikov G., Hoteit I. (2013). Remote sensing the phytoplankton seasonal succession of the red Sea. PloS One 8, e64909. doi: 10.1371/journal.pone.0064909
Reef Check Foundation N. (2020). Tropical monitoring instruction: Reef check foundation. reef check guide (United States: Marina del Rey, CA).
Reynolds R. W., Rayner N. A., Smith T. M., Stokes D. C., Wang W. (2002). An improved in situ and satellite SST analysis for climate. J. Climate 15, 1609–1625. doi: 10.1175/1520-0442(2002)015<1609:AIISAS>2.0.CO;2
Rogers-Bennett L., Catton C. A. (2019). Marine heat wave and multiple stressors tip bull kelp forest to sea urchin barrens. Sci. Rep. 9, 1–9. doi: 10.1038/s41598-019-51114-y
Romero-Torres M., Acosta A., Palacio-Castro A. M., Treml E. A., Zapata F. A., Paz-Garcia D. A., et al. (2020). Coral reef resilience to thermal stress in the Eastern tropical pacific. Global Change Biol. 26, 3880–3890. doi: 10.1111/gcb.15126
Sandin S. A., Smith J. E., DeMartini E. E., Dinsdale E. A., Donner S. D., Friedlander A. M., et al. (2008). Baselines and degradation of coral reefs in the northern line islands. PloS One 3, e1548. doi: 10.1371/journal.pone.0001548
Savary R., Barshis D. J., Voolstra C. R., Cárdenas A., Evensen N. R., Banc-Prandi G., et al. (2021). Fast and pervasive transcriptomic resilience and acclimation of extremely heat-tolerant coral holobionts from the northern red Sea. Proc. Natl. Acad. Sci. 118, 19. doi: 10.1073/pnas.2023298118
Sawall Y., Al-Sofyani A., Hohn S., Banguera-Hinestroza E., Voolstra C. R., Wahl M. (2015). Extensive phenotypic plasticity of a red Sea coral over a strong latitudinal temperature gradient suggests limited acclimatization potential to warming. Sci. Rep. 5, 8940. doi: 10.1038/srep08940
Schoepf V., Sanderson H., Larcombe E. (2022). Coral heat tolerance under variable temperatures: Effects of different variability regimes and past environmental history vs. Curr. Exposure Limnol. Oceanography 67, 404–418. doi: 10.1002/lno.12000
Schoepf V., Stat M., Falter J. L., McCulloch M. T. (2015). Limits to the thermal tolerance of corals adapted to a highly fluctuating, naturally extreme temperature environment. Sci. Rep. 5, 1–14. doi: 10.1038/srep17639
Shaltout M. (2019). Recent sea surface temperature trends and future scenarios for the red Sea. Oceanologia 61, 484–504. doi: 10.1016/j.oceano.2019.05.002
Shaltout M., Omstedt A. (2014). Recent sea surface temperature trends and future scenarios for the Mediterranean Sea. Oceanologia 56, 411–443. doi: 10.5697/oc.56-3.411
Shuail D., Wiedenmann J., D’angelo C., Baird A. H., Pratchett M. S., Riegl B., et al. (2016). Local bleaching thresholds established by remote sensing techniques vary among reefs with deviating bleaching patterns during the 2012 event in the Arabian/Persian gulf. Mar. pollut. Bull. 105, 654–659. doi: 10.1016/j.marpolbul.2016.03.001
Sing Wong A., Vrontos S., Taylor M. L. (2022). An assessment of people living by coral reefs over space and time. Global Change Biol 28 (23), 7139-7153. doi: 10.1111/gcb.16391
Skirving W., Marsh B., de la Cour J., Liu G., Harris A., Maturi E., et al. (2020). CoralTemp and the coral reef watch coral bleaching heat stress product suite version 3.1. Remote Sens. 12, 3856. doi: 10.3390/rs12233856
Smith E. G., Hazzouri K. M., Choi J. Y., Delaney P., Al-Kharafi M., Howells E. J., et al. (2022). Signatures of selection underpinning rapid coral adaptation to the world’s warmest reefs. Sci. Adv. 8, eabl7287. doi: 10.1126/sciadv.abl7287
Sonnewald M., Lguensat R., Jones D. C., Dueben P. D., Brajard J., Balaji V. (2021). Bridging observation, theory and numerical simulation of the ocean using machine learning Environmental Research Letters. Available at: https://iopscience.iop.org/article/10.1088/1748-9326/ac0eb0.
Suggett D. J., Smith D. J. (2020). Coral bleaching patterns are the outcome of complex biological and environmental networking. Global Change Biol. 26, 68–79. doi: 10.1111/gcb.14871
Sully S., Burkepile D. E., Donovan M. K., Hodgson G., Van Woesik R. (2019). A global analysis of coral bleaching over the past two decades. Nat. Commun. 10, 1–5. doi: 10.1038/s41467-019-09238-2
Sully S., Van Woesik R. (2020). Turbid reefs moderate coral bleaching under climate-related temperature stress. Global Change Biol. 26, 1367–1373. doi: 10.1111/gcb.14948
Theil H. (1950). A rank-invariant method of linear and polynomial regression analysis. Indagationes Mathematicae 12, 173.
Trommer G., Siccha M., Rohling E. J., Grant K., van der Meer M. T. J., Schouten S., et al. (2010). Millennial-scale variability in red Sea circulation in response to Holocene insolation forcing. Paleoceanography 25, 3. doi: 10.1029/2009PA001826
Keywords: climate change, future scenarios, SST variability, coral resilience, bleaching threshold, degree heating weeks
Citation: Eladawy A, Nakamura T, Shaltout M, Mohammed A, Nadaoka K, Fox MD and Osman EO (2022) Appraisal of coral bleaching thresholds and thermal projections for the northern Red Sea refugia. Front. Mar. Sci. 9:938454. doi: 10.3389/fmars.2022.938454
Received: 07 May 2022; Accepted: 27 September 2022;
Published: 22 November 2022.
Edited by:
Eric Jeremy Hochberg, Bermuda Institute of Ocean Sciences, BermudaReviewed by:
Colleen B. Bove, Boston University, United StatesMaoz Fine, Hebrew University of Jerusalem, Israel
Copyright © 2022 Eladawy, Nakamura, Shaltout, Mohammed, Nadaoka, Fox and Osman. This is an open-access article distributed under the terms of the Creative Commons Attribution License (CC BY). The use, distribution or reproduction in other forums is permitted, provided the original author(s) and the copyright owner(s) are credited and that the original publication in this journal is cited, in accordance with accepted academic practice. No use, distribution or reproduction is permitted which does not comply with these terms.
*Correspondence: Ahmed Eladawy, ZWxhZGF3eS5hLmFhQG0udGl0ZWNoLmFjLmpw; Eslam O. Osman, ZW9tLm9zbWFuQGdtYWlsLmNvbQ==