 Jiaze Zhang1,2†Shuxian Wang1,3†
 Shengmao Zhang1,5*Fenghua Tang1Wei Fan1
 Shenglong Yang1Yongwen Sun3Yang Liu2
 Wenbin Zhu4Shan Zhang6Ruilin He3
- 1Key Laboratory of Fisheries Remote Sensing, Ministry of Agriculture and Rural Affairs, P.R. China; East China Sea Fisheries Research Institute, Chinese Academy of Fishery Sciences, Shanghai, China
- 2College of Information, Shanghai Ocean University, Shanghai, China
- 3School of Navigation and Naval Architecture, Dalian Ocean University, Dalian, China
- 4Marine Fisheries Research Institute of Zhejiang, Key Laboratory of Sustainable Utilization of Technology Research for Fishery Resource of Zhejiang Province, Zhoushan, China
- 5Qingdao National Pilot Laboratory for Marine Science and Technology, Qingdao, China
- 6School of Tourism, Hainan University, Haikou, China
The refined monitoring and identification of fishing operations by fishing vessels is of great significance and value to fishing vessels. In order to solve the problem of inaccurate statistics of current Engraulis japonicus fishing quota and classification, this paper proposes an improved identification algorithm based on YOLOv5. This method introduces the SENet attention mechanism into the YOLOv5 backbone network structure, integrates the target information in different periods of fishing operations, reduces the interference of complex backgrounds, improves the precision of model detection, and ensures real-time detection efficiency. The artificially shot Engraulis japonicus videos are used as the dataset of the study, and the video is converted into a picture format to realize pre-labeling and processing. The 5550 images are divided into the training set, validation set, and test set according to 8:1:1. In order to verify the validity of the data, a set of in the control experiment, the YOLOv5 backbone network was replaced by MobileNetV2 and the SENet attention mechanism was introduced, and four models were implemented for comparison. The experimental results show that the research algorithm can obtain a mean average precision (mAP) of 99.3%, a precision of 98.9%, and a recall of 98.7%, which are improved by 1.4%, 1.7% and 2.5% respectively compared with the original model. The experimental results match the expectations. According to the statistics of some categories, the Kalman filter and the Hungarian matching method are used to count the main categories of fishing baskets, and an accuracy of 96.5% can be obtained. The threshold method for fishing nets and processing vessels can obtain 85.8% and 75% accuracy. These results shows that this target detection research can provide new ideas for job identification of Engraulis japonicus and provide auxiliary means for job statistics.
1 Introduction
Engraulis japonicus is a kind of small pelagic fish with strong clustering and a short life cycle, which is widely distributed in the East China Sea, the Bohai Sea, the Yellow Sea, and the coast of Japan, the coast of the Korean Peninsula and the coast of the Philippines (Xue and Liu, 2005; Zhu et al., 2022). Because of its strong adaptability to living conditions, low food chain level, rapid growth and development, short life cycle, and rapid generational renewal, it has relatively abundant resources, and people are often used in diet or condiment due to its delicious meat and rich nutrition (Zhu et al., 2022). For a long time, China's offshore fishery has shown a trend of overfishing, and the stock structure of fish has shown problems of underage, miniaturization and first sexual maturity (Jiang and Wang, 2007; Huang and Tang, 2019). Therefore, China has been continuously improving the specific implementation details of the quota system, as a way to promote the understanding of the quota system by management departments, fishermen and scientific researchers, and also greatly improving the level of catch monitoring.
In recent years, the statistics of fishing vessels operations mainly rely on manual recording methods. Therefore, there are phenomena such as omissions and misrecordings, which lead to inaccurate results of fishing statistics. With the development of deep learning, the key to fishing vessel operation statistics is to identify several main operation features. The higher the precision of the identification features, the more accurate the later statistics. Therefore, scientists have been continually exploring methods for identifying fishing vessel operations. Feng et al. (2019) used the BP neural network algorithm to identify the behavioural study on fishing vessel by selecting the trend of directional angle and speed of fishing vessels as the input parameters of the model. The recognition precision was 79%, but the data utilized were vessel position rather than video data, so it was not intuitive and the accuracy needed to be improved. Based on Inception and ResNet networks, Leclerc et al. (2018) used transfer learning to learn and fine-tune the vessel dataset, and obtained models that outperformed other classes.
The target detection algorithm with deep learning has the advantages of automatic feature extraction, parallelization and high detection precision. It is used in the field of high-precision measurement (Song et al., 2022). Before deep learning, traditional algorithms for object detection are usually divided into three stages: region selection, feature extraction and feature classification. With the development and research of deep learning, the deep neural network can extract features with better robustness and semantics, and the classifier performance is also better.
Object detection algorithms are mainly divided into one-stage algorithm (One stage) and two-stage algorithm (Two stage). Two stage algorithm needs to generate the region first, which is to generate a region proposal and then predict the classification and positioning of the target through the convolutional neural network. There are mainly R-CNN series of algorithms (Girshick et al., 2014; Girshick, 2015; Ren et al., 2015). One stage algorithm directly extracts features from the network to predict the classification and position of objects, mainly including the You Only Look Once (YOLO) algorithm and the Single Shot MultiBox Detector (SSD) algorithm. The code of the YOLOv5 algorithm is easy to read, the environment is easy to configure, the processing speed is fast, and the model is small, which can meet the real-time observation of users. Therefore, combined with the practical requirements, this paper adopts the YOLOv5 algorithm in the One stage algorithm to realize the detection and improve the detection performance. Chen et al. (2021) used YOLOv5 to identify the collected optical remote sensing images, the accuracy was improved by 17% comparing with YOLOv3. However, single and small targets has insignificant features, which increase detection difficulty. It is necessary to further improve the detection of small targets. To improve the target detection ability, Zhou et al. (2021) improved the YOLOv5s algorithm by re-clustering the initial frame of the target by improving K-means, expanding the receptive field area at the output, and optimizing the loss function.
Most of the research on fishing vessel operations is based on Automatic Identification System (AIS) and Vessel Monitoring System (VMS) data to identify fishing vessels' operation type and status (Shi et al., 2021; Yang et al., 2021; Zhang H. et al., 2021; Zhang R. H et al., 2021). The identification of fishing vessels type and operation status are often based on the drawn fishing vessels trajectory map, which has several disadvantages. There are few features that can be used for recognition, many different types of fishing vessels operations, and the classification standards are also different (Zhang et al., 2022; Kim et al., 2022). Due to these disadvantages, the fishing vessels trajectory map is not accurate. Comparing with trajectory map, using video monitoring operations is more intuitive, accurate and effective. This paper proposes an improved YOLOv5 method, making the fusion attention mechanism more accurate for feature extraction and achieving better recognition. In addition, some category statistics methods are added, and Kalman filtering and Hungarian matching. The number of fishing baskets by category is counted, and the threshold method is used to realize the number of fishing nets and processing vessels, which is a crucial decision for the precise operation of fishing vessels and provides a better method for identification and statistics of fishing vessels.
2 Materials and methods
The proposed algorithm is mainly divided into two parts: object detection and statistics. The overall flow of the proposed method is shown in Figure 1.
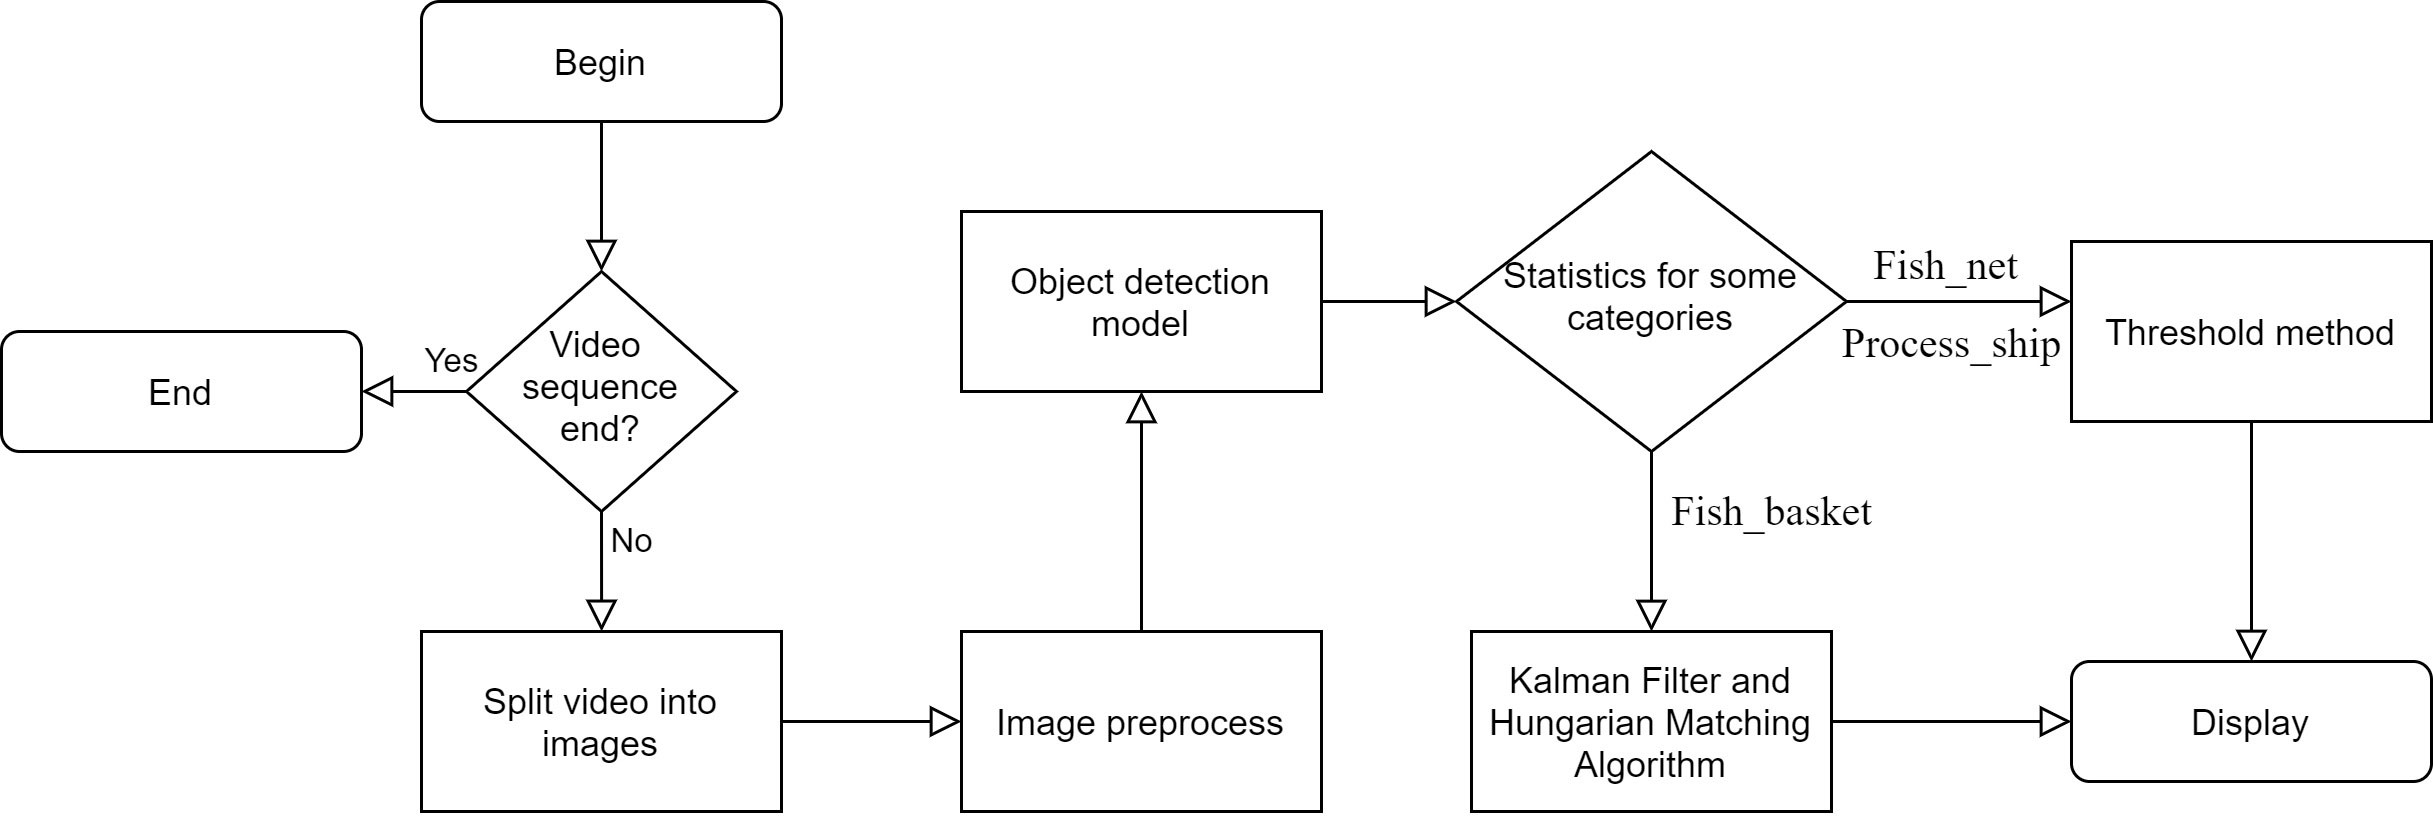
Figure 1 Overall flow chart of the proposed algorithm.
2.1 Data collections
According to the Announcement of Special Fishing Licenses for Special Economic Species and Supporting Service Arrangements for Fishing Auxiliary Vessels during the Holiday Period in 2021, the fishing quota of Engraulis japonicus is in the waters of Zhejiang, from May 1 to June 15, 2021. The nets of the Engraulis japonicus fishing vessels in this paper are double-vessels purse seines. Figure 2 is a schematic diagram of the double-vessels purse seines. Among them, the length of the upper and lower meshes of the net is 300 m, the mesh of the mesh port is 1.8 m, the length of the bag mesh is 45 m, and the minimum mesh is 5 mm (Neubeck and Van, 2006).
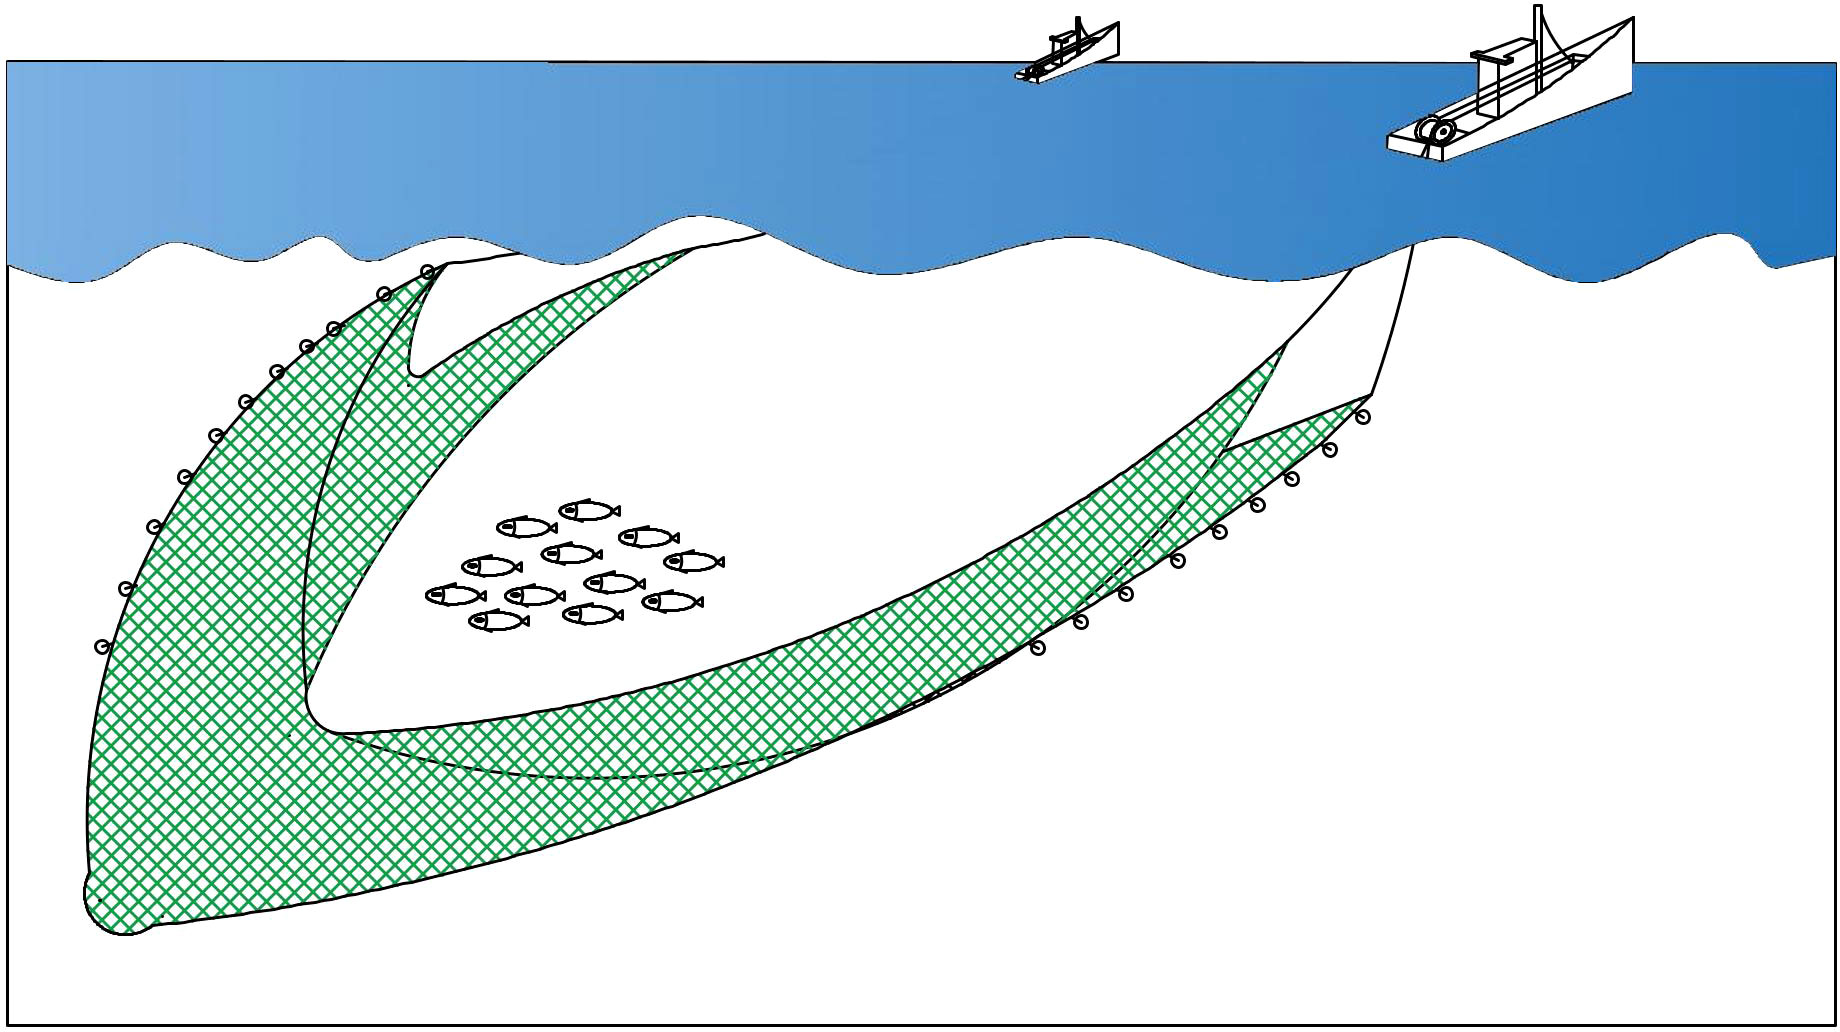
Figure 2 Schematic diagram of double-vessel purse seine operation.
The operating principle of double-vessel purse seine is to use two identical fishing boats towing left and right symmetrical long net wings to surround the fish and force the fish into the net bag to achieve the purpose of fishing (Pravin, 2002). Engraulis japonicus purse seining operation uses a bagged purse seine as a net, and depending on the characteristics of Engraulis japonicus cluster, it can achieve the goal of high yield, and at the same time, a small amount of by-catch will be produced (Zhu et al., 2022). Therefore, by-catch can be reduced by improving nets, so that the yield can be maximized, which is of great significance for Engraulis japonicus purse seine fishing operations.
In this experiment, Hikvision's DS-2CD6626B-IZHS high-definition camera with a resolution of 1920×1080 was deployed on the fishing boat to shoot Engraulis japonicus videos.
2.2 Data set production
The data collected through video surveillance was screened, and 60 videos data were used as the data of this experiment, and each video was 8 minutes as the data used in this experiment.
Firstly, convert the video data into pictures for labeling. After selecting and labeling the data with LabelImg software, an xml file is generated, and a total of 5550 photos required for the experiment are labelled. Among them, the label contains eight types of data, named Person, Buoy, Fish_tank, Empty_fish_tank, Fish_net, Fish_basket, Empty_fish_basket, Process_ship, representing person, buoy, fishing tank, empty fishing tank, fishing net, fishing basket, empty fishing basket, and processing vessels in turn. As shown in Figure 3, they are the original image data, which all contain the target to be labeled.
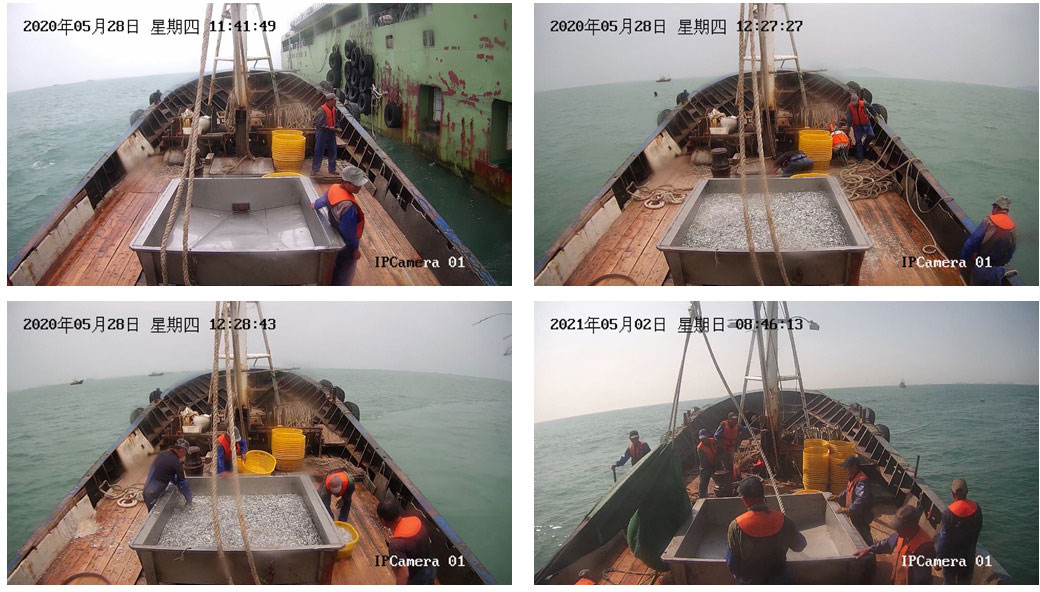
Figure 3 Original data graph.
The generated xml file is converted into text form, which contains the marked categories and the corresponding position coordinates. The experimental data is divided into training set, validation set and testing set according to 8:1:1 to form a standard coco128 format data set.
2 .3 Target detection
2.3 1 YOLOv5 network model
YOLOv5 has the characteristics of fast speed, high flexibility and small model size. The algorithm mainly includes the backbone network Darknet-53 and Path Aggregation Network (PANet) (Liu et al., 2018). As shown in Figure 4, YOLOv5 primarily consists of four parts: Input, Backbone, Neck and Prediction.
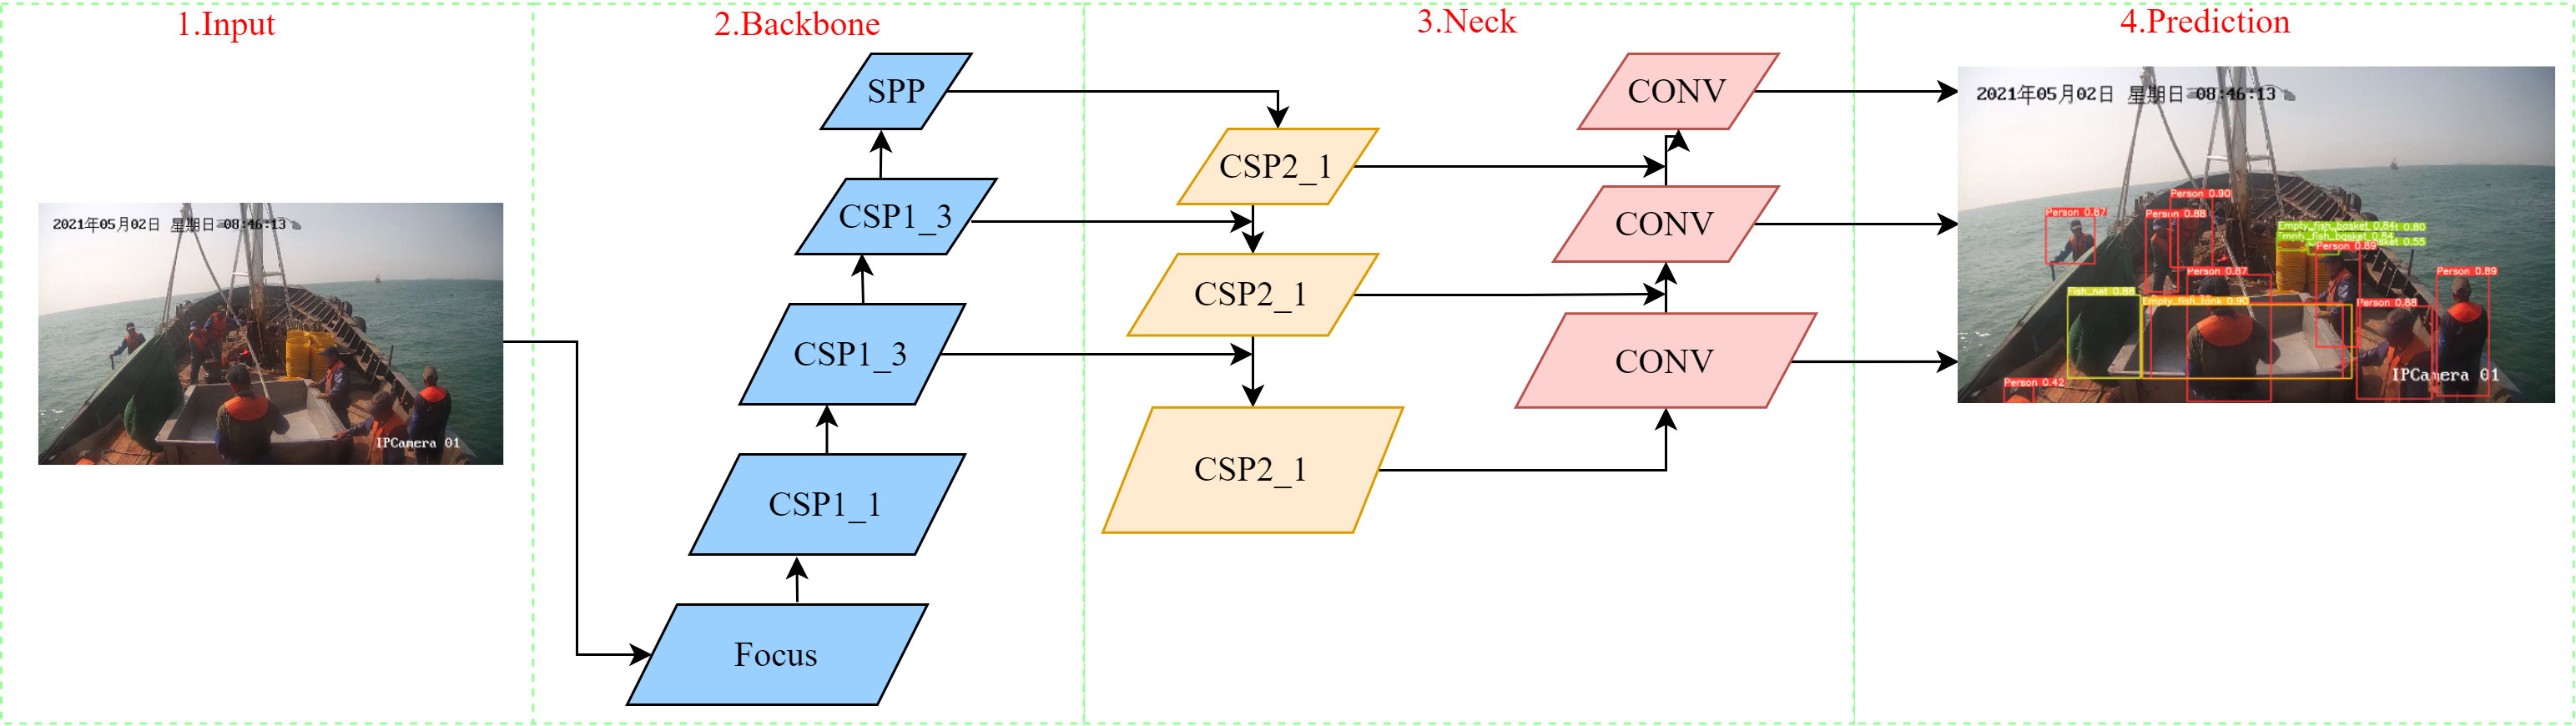
Figure 4 YOLOv5s algorithm network structure.
Input mainly completes data input, including Mosaic data enhancement, adaptive anchor box calculation and adaptive image scaling. The adaptive anchor box calculation is embedded in the code for the first time, and the program is no longer running separately to calculate the best anchor box. Adaptive image scaling greatly reduces the black borders filled in the image, making the model's inference faster. Compared with YOLOv4, Backbone increases the Focus structure and increases the number of channels through the slicing operation, so that the main feature information is preserved. Its backbone network Darknet-53 mainly adopts the CSP1_X structure, which mainly includes two branches. Branch 1 is connected in series by X bottleneck modules, branch 2 is a convolutional layer. These two branches are spliced together to deepen the network depth and greatly enhance the feature extraction ability. Neck adopts Feature Pyramid Networks (FPN) and PANet structure, which is a cyclic pyramid structure composed of convolution operation, upsampling operation, and CSP2_X, which can make the difference feature layers of the image fuse with each other for mask prediction. Non-Maximum Suppression obtains the final prediction box (Neubeck et al., 2006). GIOU is used in Prediction as a distance metric to solve the non-overlapping problem of common IOU.
2.3.2 Attention mechanism module
Squeeze-and-Excitation Networks (SENet), also known as compression and excitation network, is a channel convolutional attention mechanism module. As shown in Figure 5, the module comprises three parts: Squeeze, Excitation and Scale operations. Among them, the main operation of Squeeze is to compress H×W×C into 1×1×C by using an average pooling layer, so that the one-dimensional parameters can obtain the previous H×W global vision, and the perception area is wider. After that, the fully connected layer is used to perform nonlinear transformation through Excitation. The main purpose of the Excitation is to reduce the amount of computation by reduce the number of channels using scaling parameters. Finally, the scale operation is to multiply the channel weights, and multiply the channel weight values calculated by the SE module with the two-dimensional matrix of the corresponding channel of the original feature map to restore the channel dimension H×W×C. The sensitivity to channel features is increased through the SENet module, so that the network can learn more features while retaining information to avoid loss. The calculation formula is as follows (Hu et al., 2018; Lin et al., 2021):
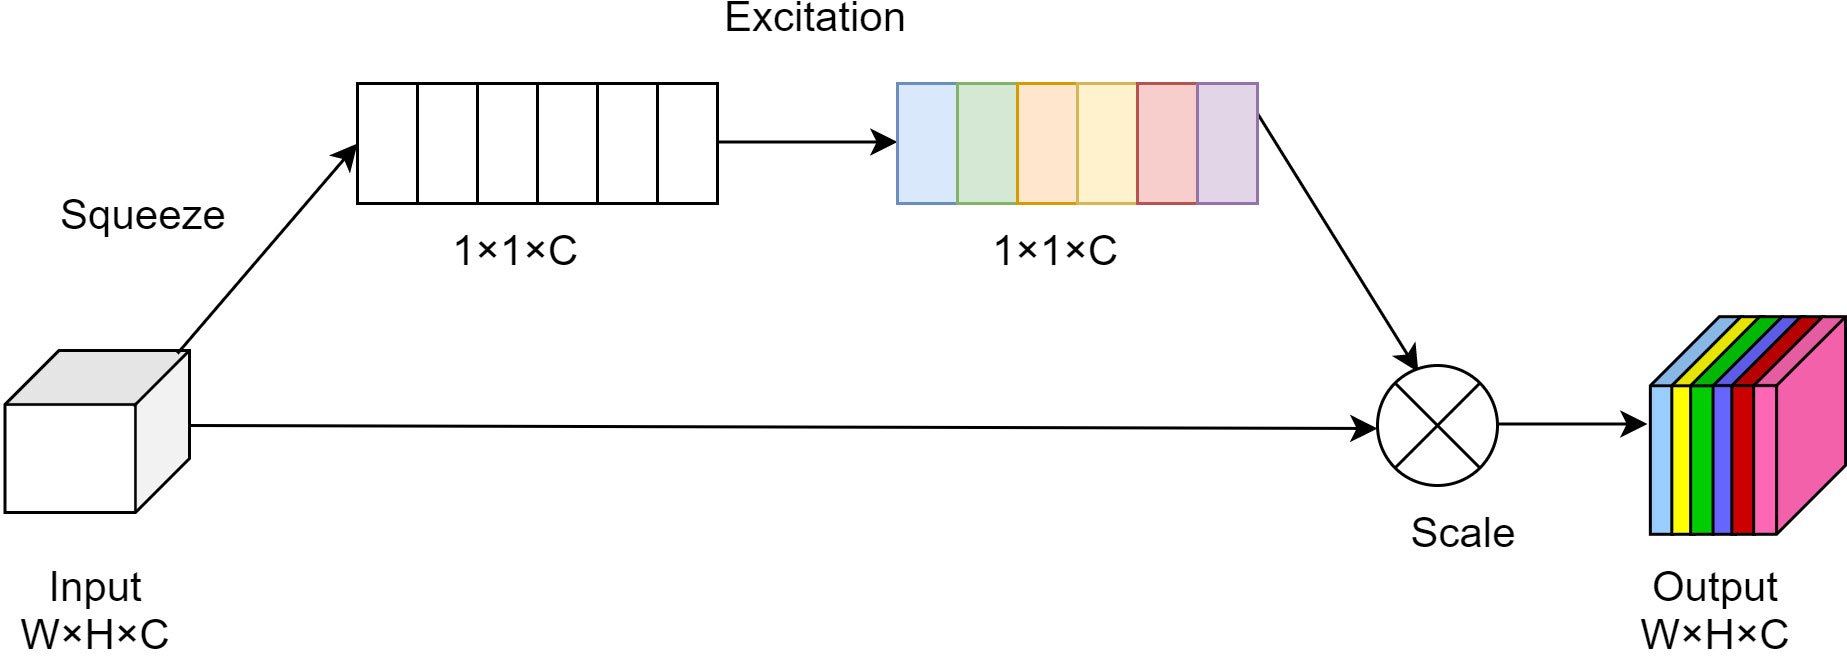
Figure 5 Structure diagram of attention mechanism.
Squeeze calculation formula, where H and W are the height and width of the feature map of a single feature channel respectively, and yc (i,j)is the value of each point on the feature map channel.
Excitation calculation formula, where z is the one-dimensional matrix obtained by Fsq σ is the Relu activation function, and W1and W2 are two fully connected layers.
Scale calculation formula, where sc is the weight value of the c channel, yc is the two-dimensional matrix of the original output of the C channel, and is the output feature of each channel after adding weights.
2.2.3 YOLOv5 fusion attention mechanism model
In order to improve the performance of the network, this paper introduces the SENet attention mechanism module and proposes an improved YOLOv5 network model. The improved network structure is shown in Figure 6. First, the image with a resolution of 1920 × 1080 is compressed to a resolution of 640 × 640 in the Input stage. After Mosaic data enhancement and adaptive image scaling and K-means algorithm, the anchor point coordinates are calculated, and the anchor frame is selected and then input to the improved in the network model. Secondly, the features of the network are extracted in the Backbone stage and the Leaky Relu function is used to avoid the negative value input being 0, thereby solving the problem of partial neural unit inactivation. Add the SENet attention mechanism module in the Neck stage to improve the model detection precision. At the same time, the feature fusion layer is reduced, that is, the number of convolution kernels of some Neck layers is reduced, and the calculation speed of the model is accelerated. Finally, three prediction results are obtained in the Prediction stage, which are 76×76, 38×38, and 19×19.
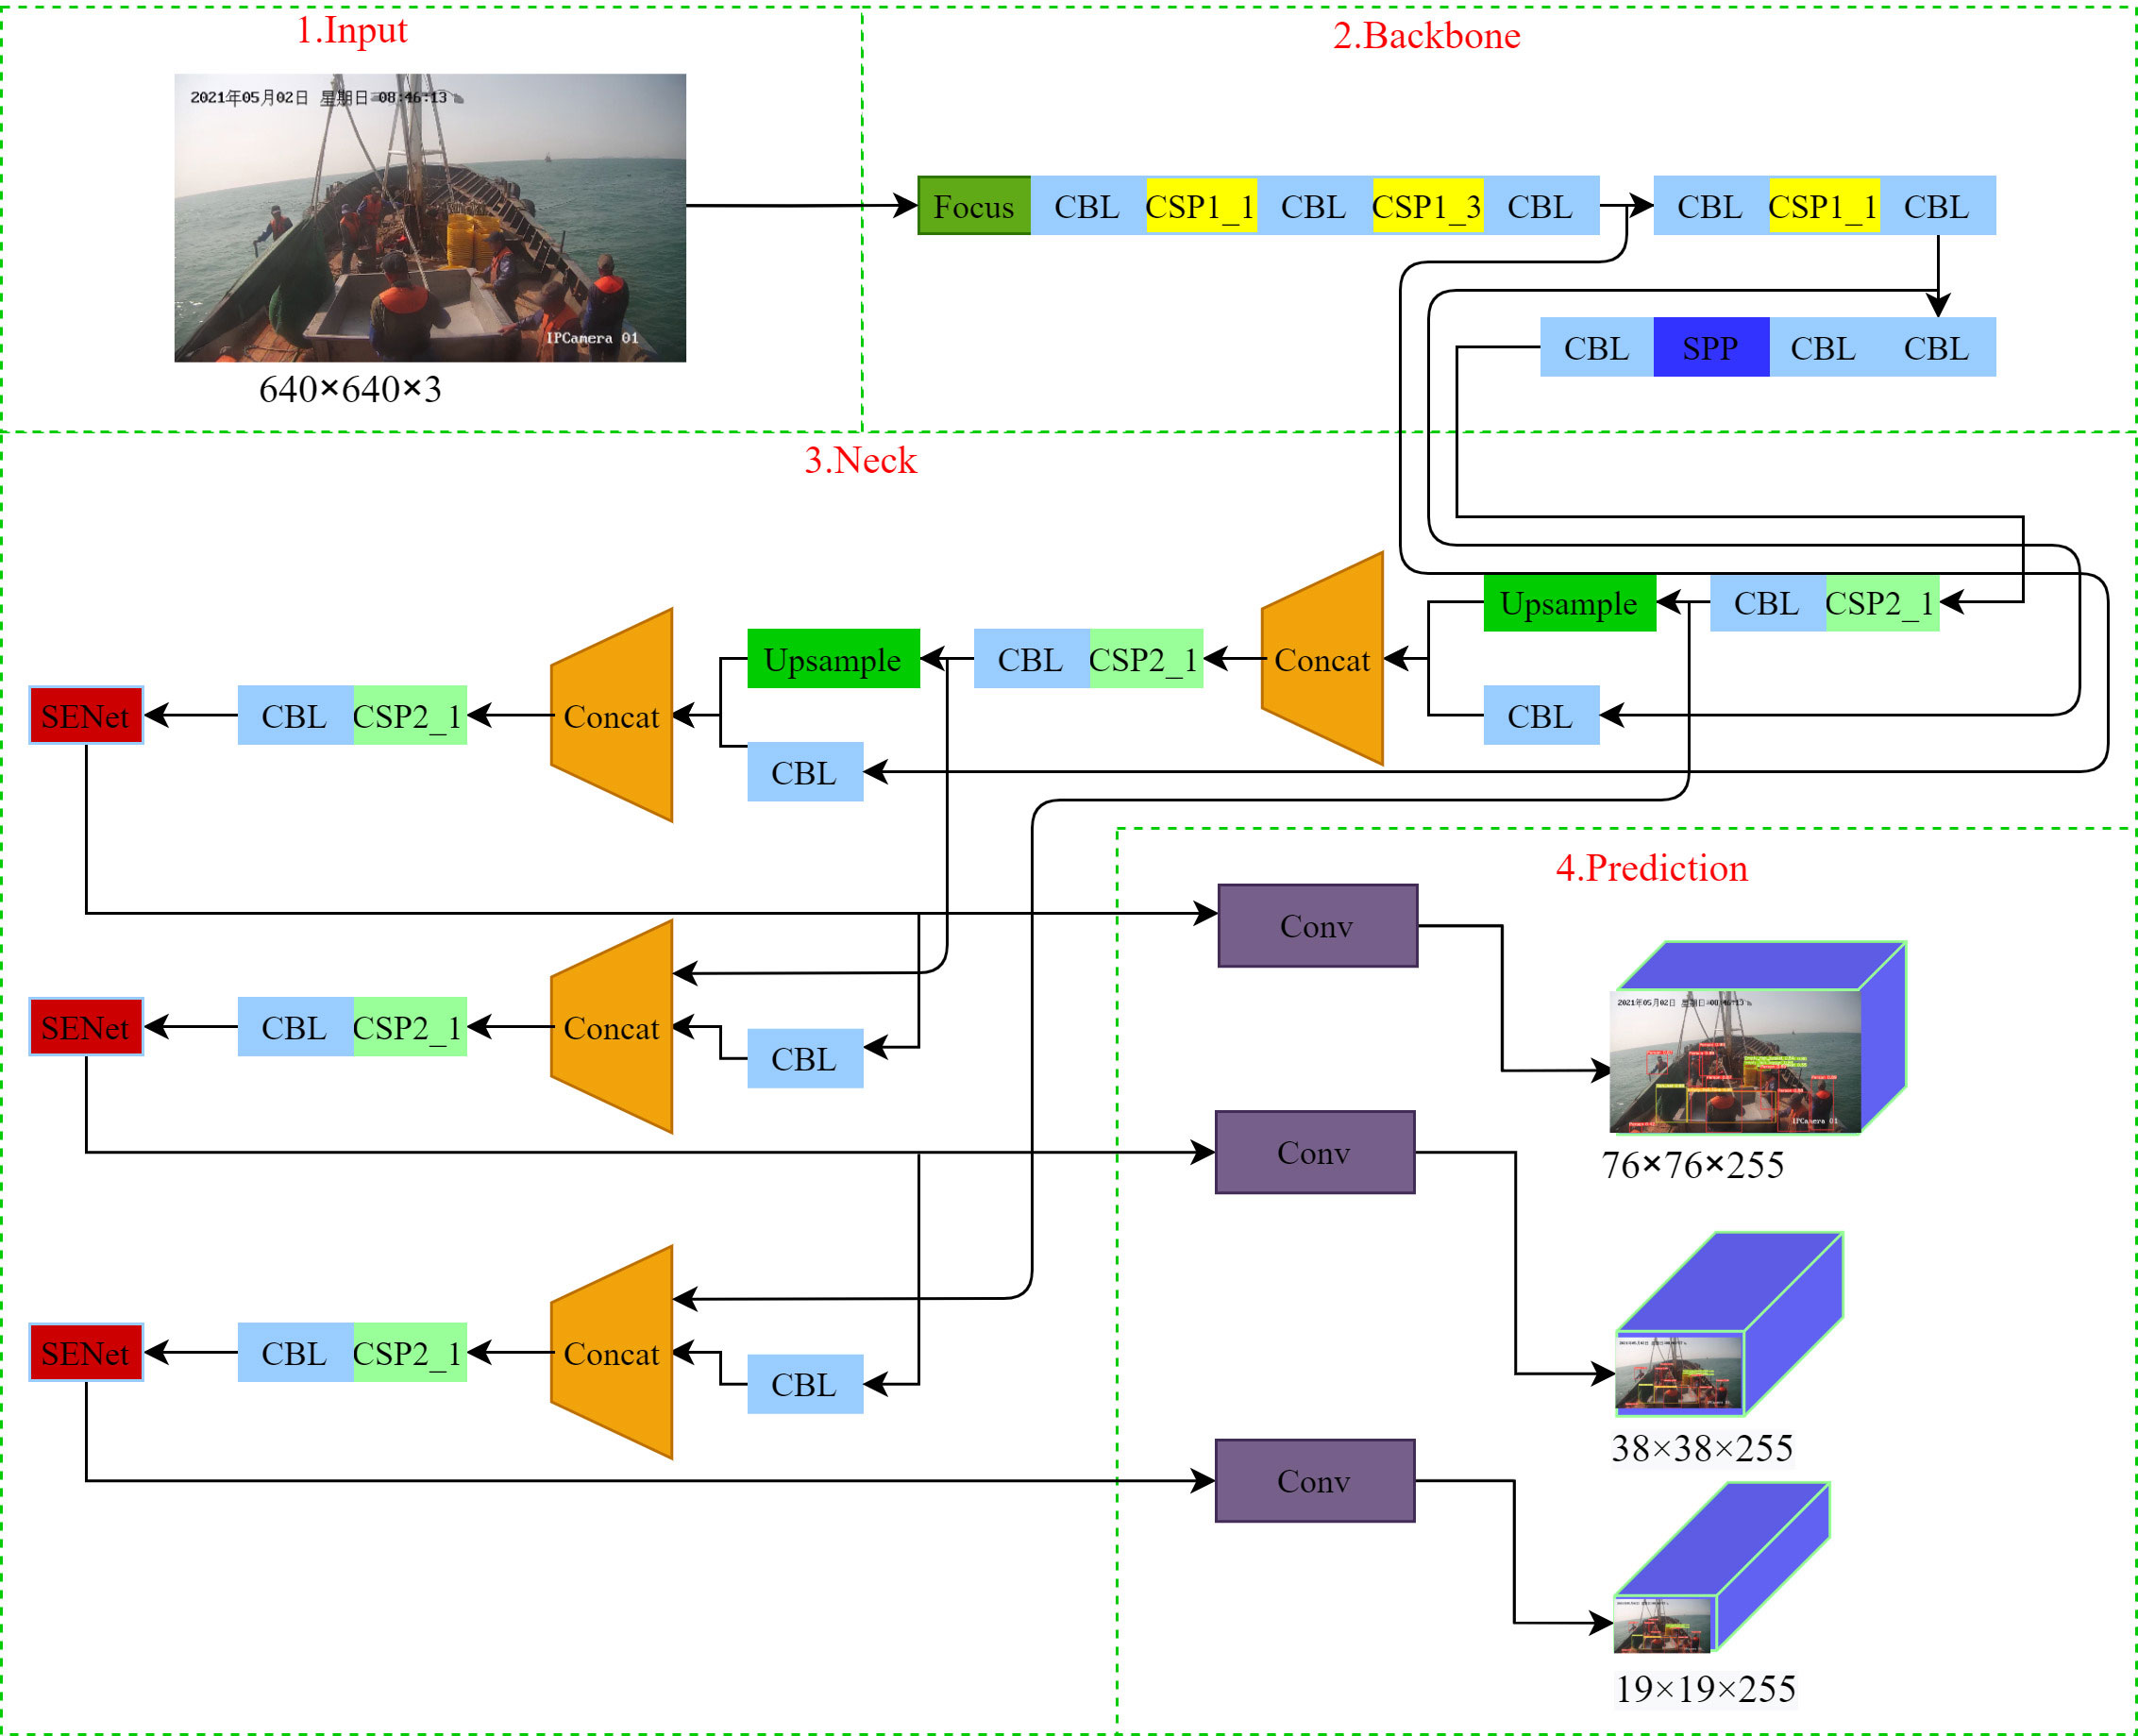
Figure 6 YOLOv5 fusion attention mechanism model.
2.4 Count the number of jobs
Based on the target detection model, the operation of Engraulis japonicus is counted, and the main statistical objects are three categories of fishing baskets, fishing nets and processing vessels.
2.4.1 Hungarian matching method and Kalman filter
Considering that the moving time of the fishing baskets in the video data is not fixed, there may be many situations, such as the deck being placed somewhere for a long time, which may cause miscounting. Therefore, the Hungarian matching method and the Kalman filter method can be used to track the target, convenient for achieving more accurate statistics on the fishing basket.
The Hungarian matching method is often used to solve the assignment problem in mathematical problems, i.e. the target of the previous frame and the target of the current frame have a one-to-one correspondence (Yang et al., 2020; Liu and Tong, 2002). In target tracking, the problem of allocation between the prediction frame and the detection frame is determined, that is, to determine whether the target of the current frame is the same as the target of the previous frame. For example, the fishing basket in this experiment is the target of this research, and the same fishing basket is matched through the analysis of the frames before and after.
Kalman Filter is an efficient autoregressive filter (Welch, 2020; Lai et al., 2021). Its main function is to obtain prediction data through sensor measurement. According to the prediction formula and update formula, the filter can predict the position at the current moment through the target’s position at the previous moment. The formula of the Kalman Filter is as follows:
where and are prior state estimates and prior error covariances. Kt, ,and Pt represent the correction matrix, updated observations, and error covariance. F, B, Q and ut-1 represent the state transition matrix, input state transition matrix, system covariance, and input value. H, R, and zt represent the observation transformation matrix, noise covariance, and measurements.
The track is predicted by Kalman filter, and the predicted tracks are matched with the detections in the current frame using the Hungarian algorithm. Then the Kalman filter is updated to realize the localization of the same object. Finally, through the collision detection method of line and line, the accurate statistics of fishing baskets are realized. The implementation method’s flow chart is shown in Figure 7.
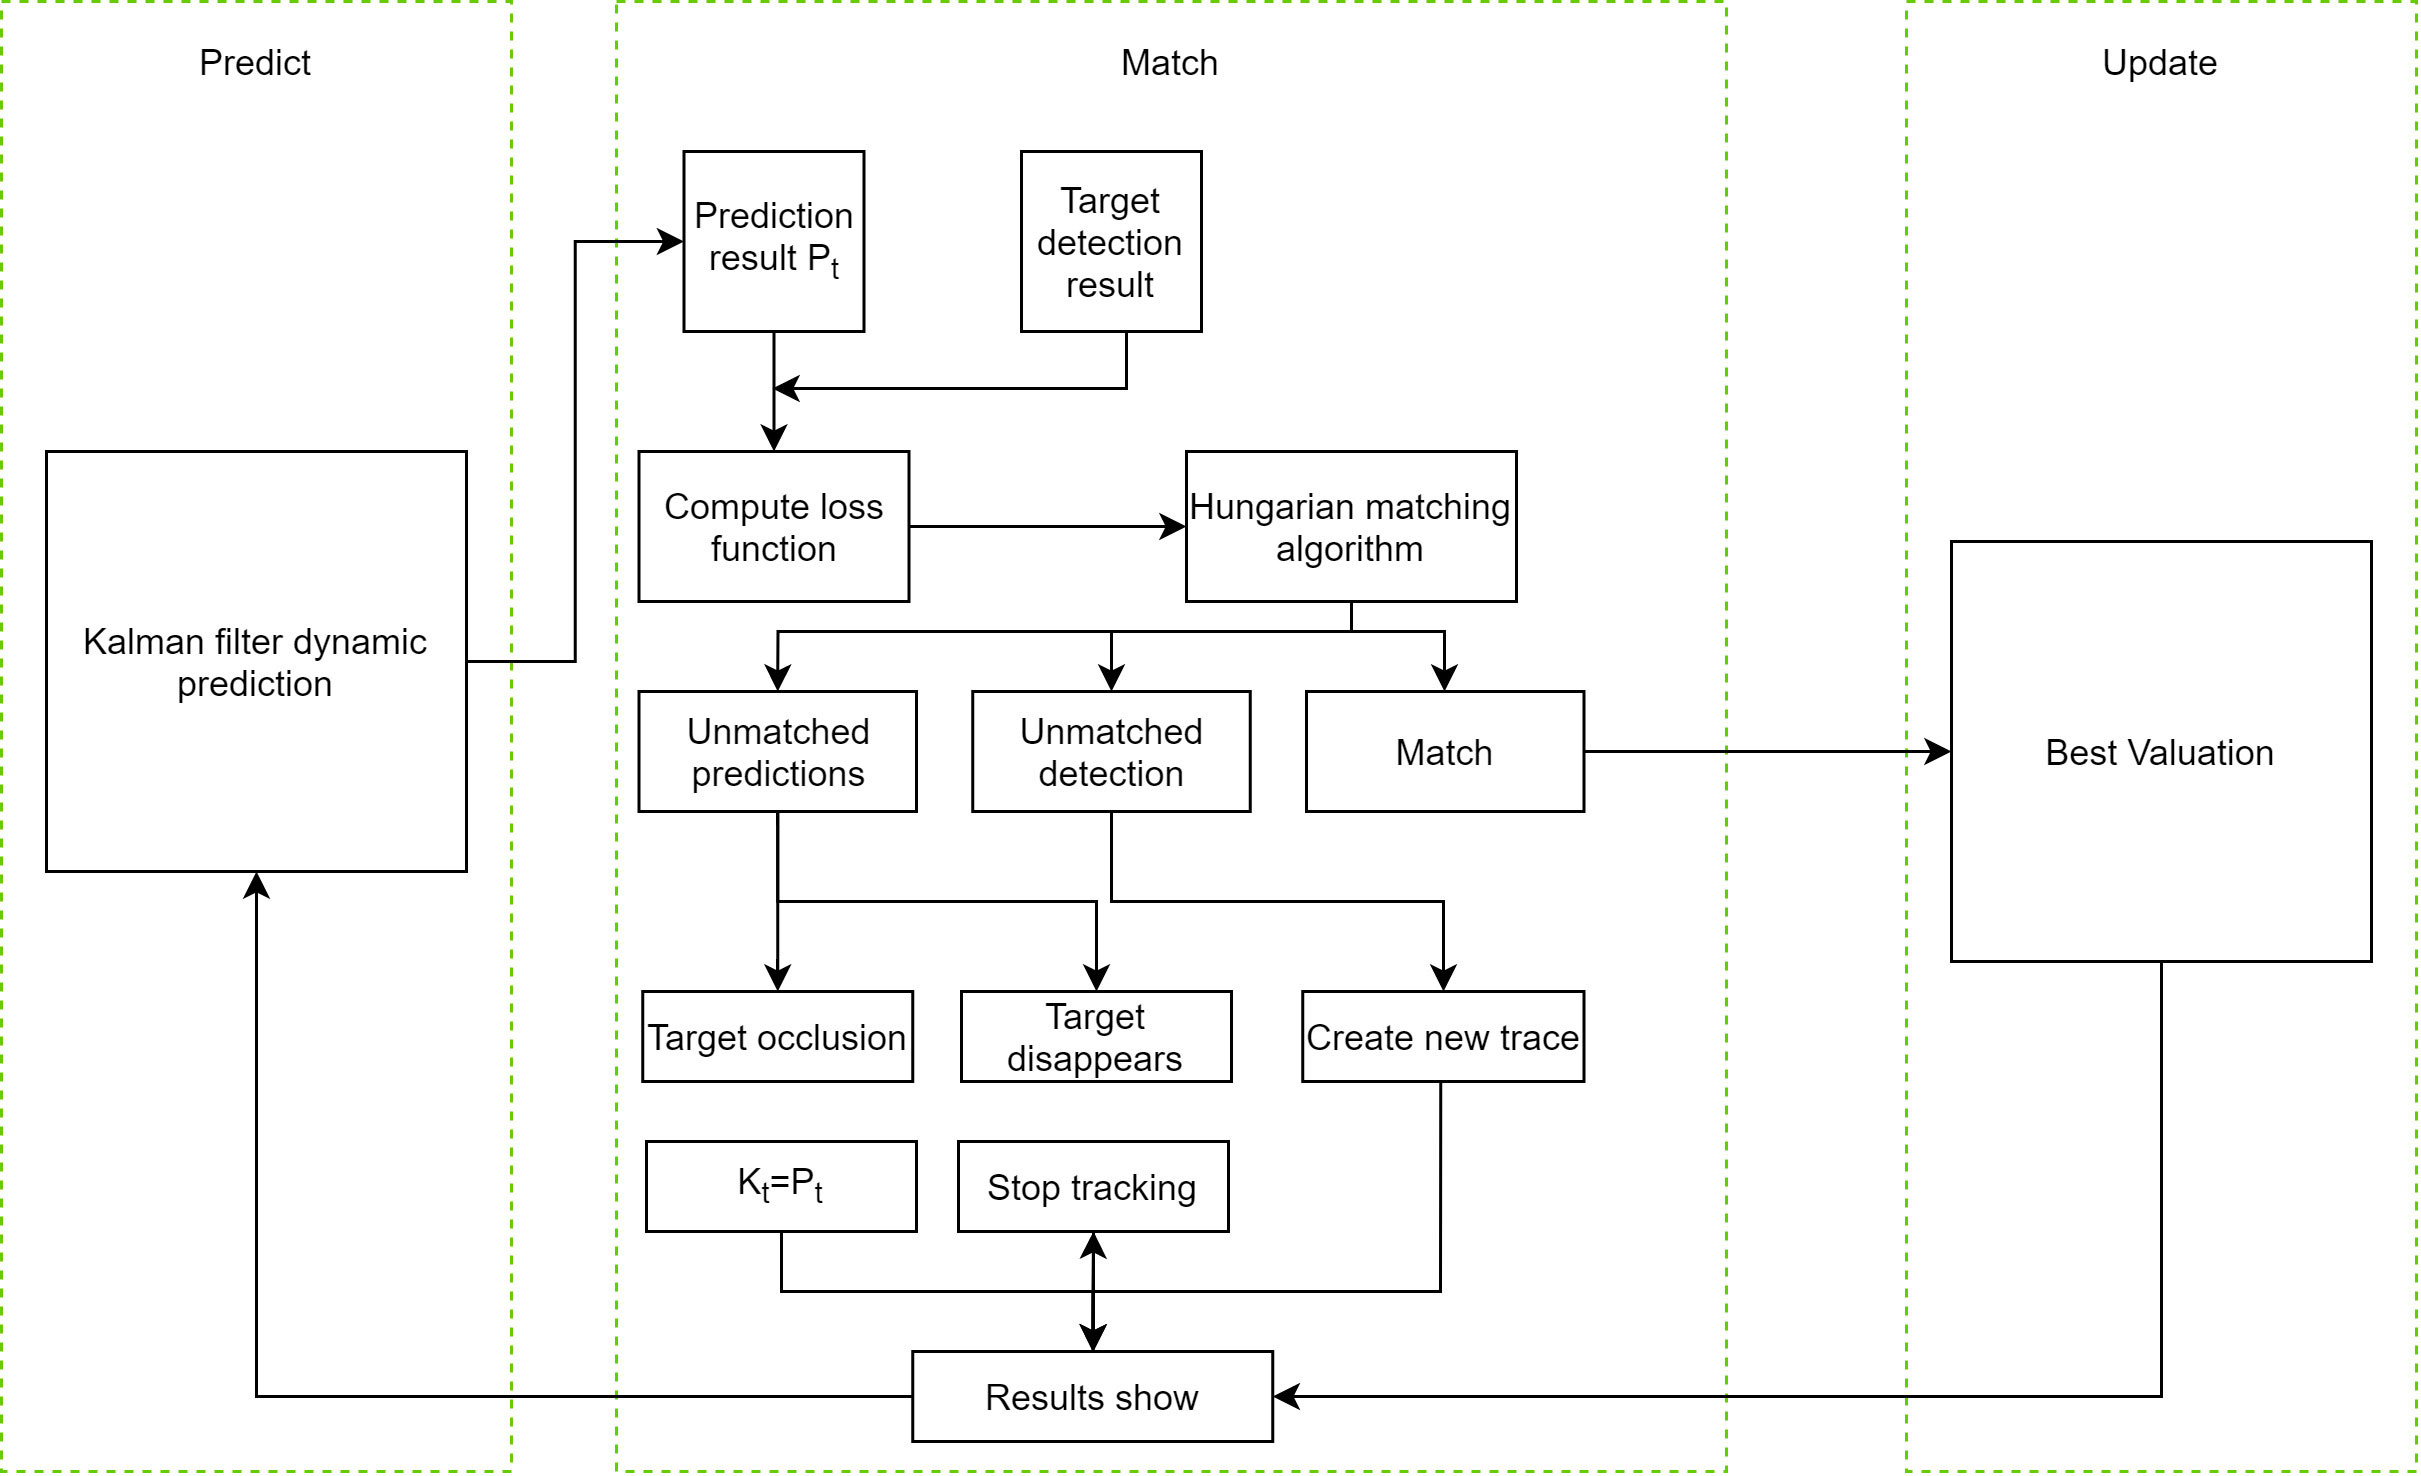
Figure 7 Flow chart of Kalman filter and Hungarian matching algorithm.
2.4.2 Threshold method
In this experiment, 1 second (12 frames) in the video is set as the cycle step, and the position of the previous frame and the category state of the current frame are recorded respectively. According to the characteristics of the operation time of Engraulis japonicus, the corresponding thresholds can be set by observing the video, in which the threshold of fishing net is 350, and the threshold of processing vessel is 3240, to achieve effective statistics on fishing nets and processing vessels.
3 Results
In this paper, the dataset is trained and tested through the Pytorch deep learning framework. The hardware devices used in the training process are Intel(R) Xeon Sliver 4210R CPU@2.40GHz central processing units and NVIDIA Tesla V100 GPUs. The software environment is Ubuntu 18.04 operating system, Python 3.8 programming language, and Pytorch 1.9.0 deep learning framework.
Hyperparameter settings in the training phase: the initial learning rate is 0.01, the decay coefficient is 0.0005, the momentum is 0.937, the batch size is 32, and the training Epoch is 100.
3.1 Evaluation index
When testing the effect of the model, this research used mean average precision (mAP), precision, recall and loss function as the main indicators of this experiment (Goutte and Gaussier, 2005).
As a commonly used indicator in target detection models, mAP is generally used to reflect the effect of model detection, and the formula is as following:
where n is the number of categories in the experiment.
In these formulas, TP refers to the number of correctly predicted positive samples, FP refers to the number of incorrectly predicted negative samples as positive samples, and FN refers to the number of positive samples predicted as negative samples.
In formula, p(x) is the value, and q(x)is the corresponding probability value.
3.2 Experimental comparison
An ablation experiment (Bai et al., 2020) is carried out to verify the validity of the model, in which a certain variable is controlled and the experimental results are compared to explore the importance of a certain factor to the experiment.
In this paper, three models are built for comparison with the proposed experimental model, and the three models are constructed as YOLOv5s, YOLOv5_M, and YOLOv5_SM. Among them, YOLOv5s is the original YOLOv5 model, which is used as the initial weight. YOLOv5_M modifies the backbone network in Backbone to MobileNetV2 network based on the YOLOv5s, which makes the model inference faster. YOLOv5_SM changed the backbone network to MobileNetV2 and add the SENet module based on the original YOLOv5s.
YOLOv5_SE is the model proposed in this paper, which adds the SENet module on the basis of YOLOv5s, so that YOLOv5 integrates the attention mechanism and improves the accuracy of feature detection.
As Tables 1, 2 shown, the mAP value of YOLOv5_SE in this experiment has increased 2.5% comparing with the original YOLOv5s. The effectiveness of the SENet attention mechanism is verified. SENet plays a major role in the channel features. In the process of network propagation, by extracting the main features, suppressing the propagation of the secondary features, and redistributing the weights, so that the During the entire back-propagation process of the network, focus on its main features, deepen the learning of the main features, and improve the network performance to a certain extent. In addition, compared with the previous YOLOv5s, YOLOv5_M, and YOLOv5_SM, the experimental YOLOv5_SE has 1.7%, 35.3%, and 3% improvements in precision. The recall also has 2.5%, 17.1%, and 3.8% improvement. It can be observed from the experimental data that the replacement of the original Darknet-53 network with MobileNetV2 simplifies the model of the network, but causes the decline of the model detection precision and the problem of a low detection recall. After that, the SENet attention mechanism was added to improve rapidly. The precision of the network and the importance of the attention mechanism in the entire network are proved again.

Table 1 Four network models.
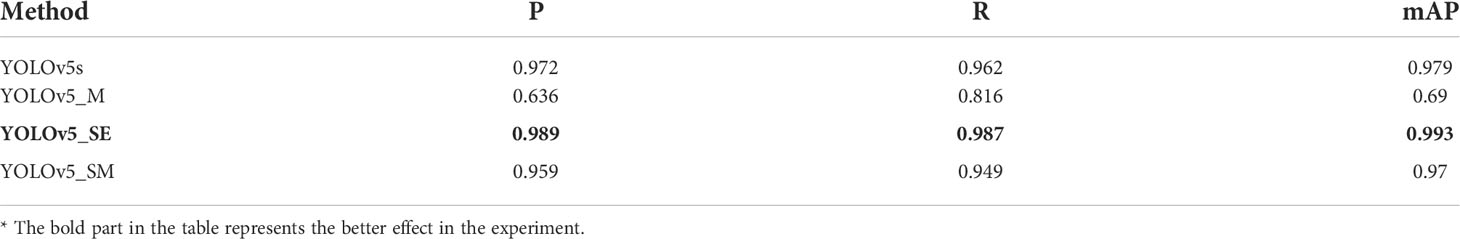
Table 2 Comparison of test results of four models.
In summary, the experimental model proposed in this paper has better performance in precision, recall and mAP than original network model. The experimental model also achieves the precision requirements of real-time detection, which proves the effectiveness of the attention mechanism used in the experiment.
3.3 Target detection result
During the experiment, Loss is an indicator that more intuitively reflects the difference between the predicted results and the actual value. The smaller the Loss, the smaller the gap between the predicted results and the experimental results, which signifies better effect of the model. As shown in Figure 8(a), the Loss value of the YOLOv5_SE model in this experiment decreased with the increase of Epoch, and finally decreased to 0.02224 at 100 Epoch.
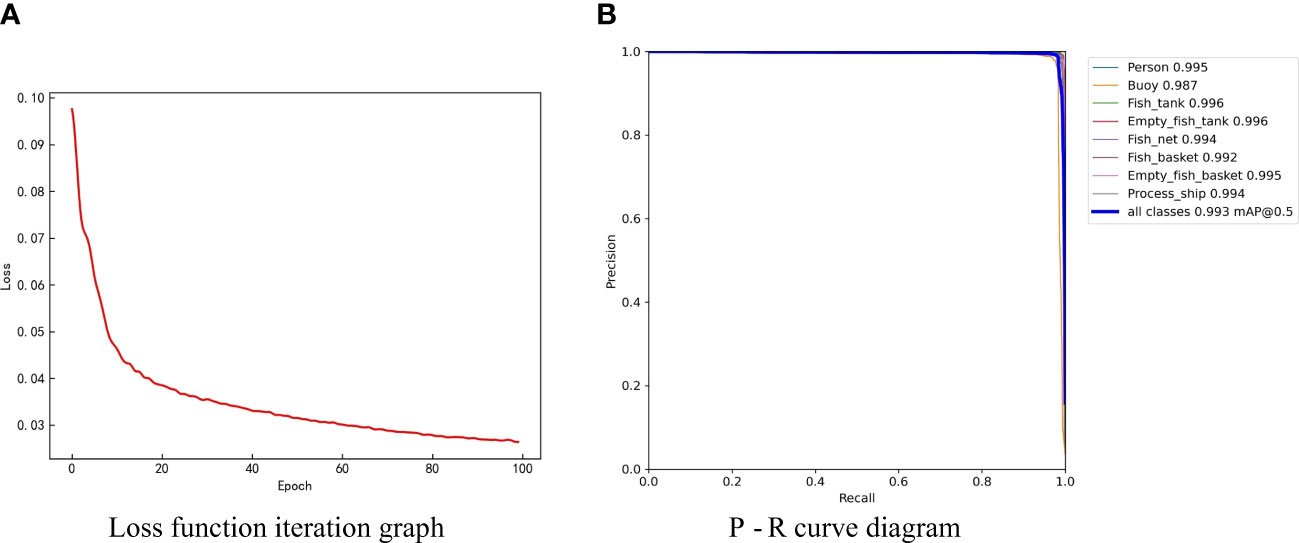
Figure 8 Image of Loss and P-R experimental results.
Figure 8(b) shows a comparison diagram of the overall and eight types of PR curves of the experimental model YOLOv5_SE. The horizontal axis represents Recall, and the vertical axis represents Precision. The area enclosed by the curve and the coordinate axis is the average precision (AP). The AP values of Person, Buoy, Fish_tank, Empty_fish_tank, Fish_net, Fish_basket, Empty_fish_basket and Process_ship are 0.995, 0.987, 0.996, 0.996, 0.994, 0.992, 0.995 and 0.994. The overall mAP value is 0.993. It can also be observed from Figure 8(b) that Fish_tank and Empty_fish_tank have the highest recognition, and Buoy recognizes the lowest. The main reason is that the positions of the fish box and the empty fish box are relatively fixed and easy to distinguish, while the relative movement of the buoy position is relatively large, so the recognition precision is low.
During the experiment, the model continuously trained and optimized the detection results for the eight categories of Person, Buoy, Fish_tank, Empty_fish_tank, Fish_net, Fish_basket, Empty_fish_basket, and Process_ship. Finally, the classification accuracy of the eight categories predicated in the experiment were recorded. As Figure 9 shows, the abscissa represents the real label, the ordinate represents the predicted label, and the diagonal data represents the correct prediction results in the confusion matrix. From the prediction results, it can be seen that the number of correct predictions of each category are more than 98%.
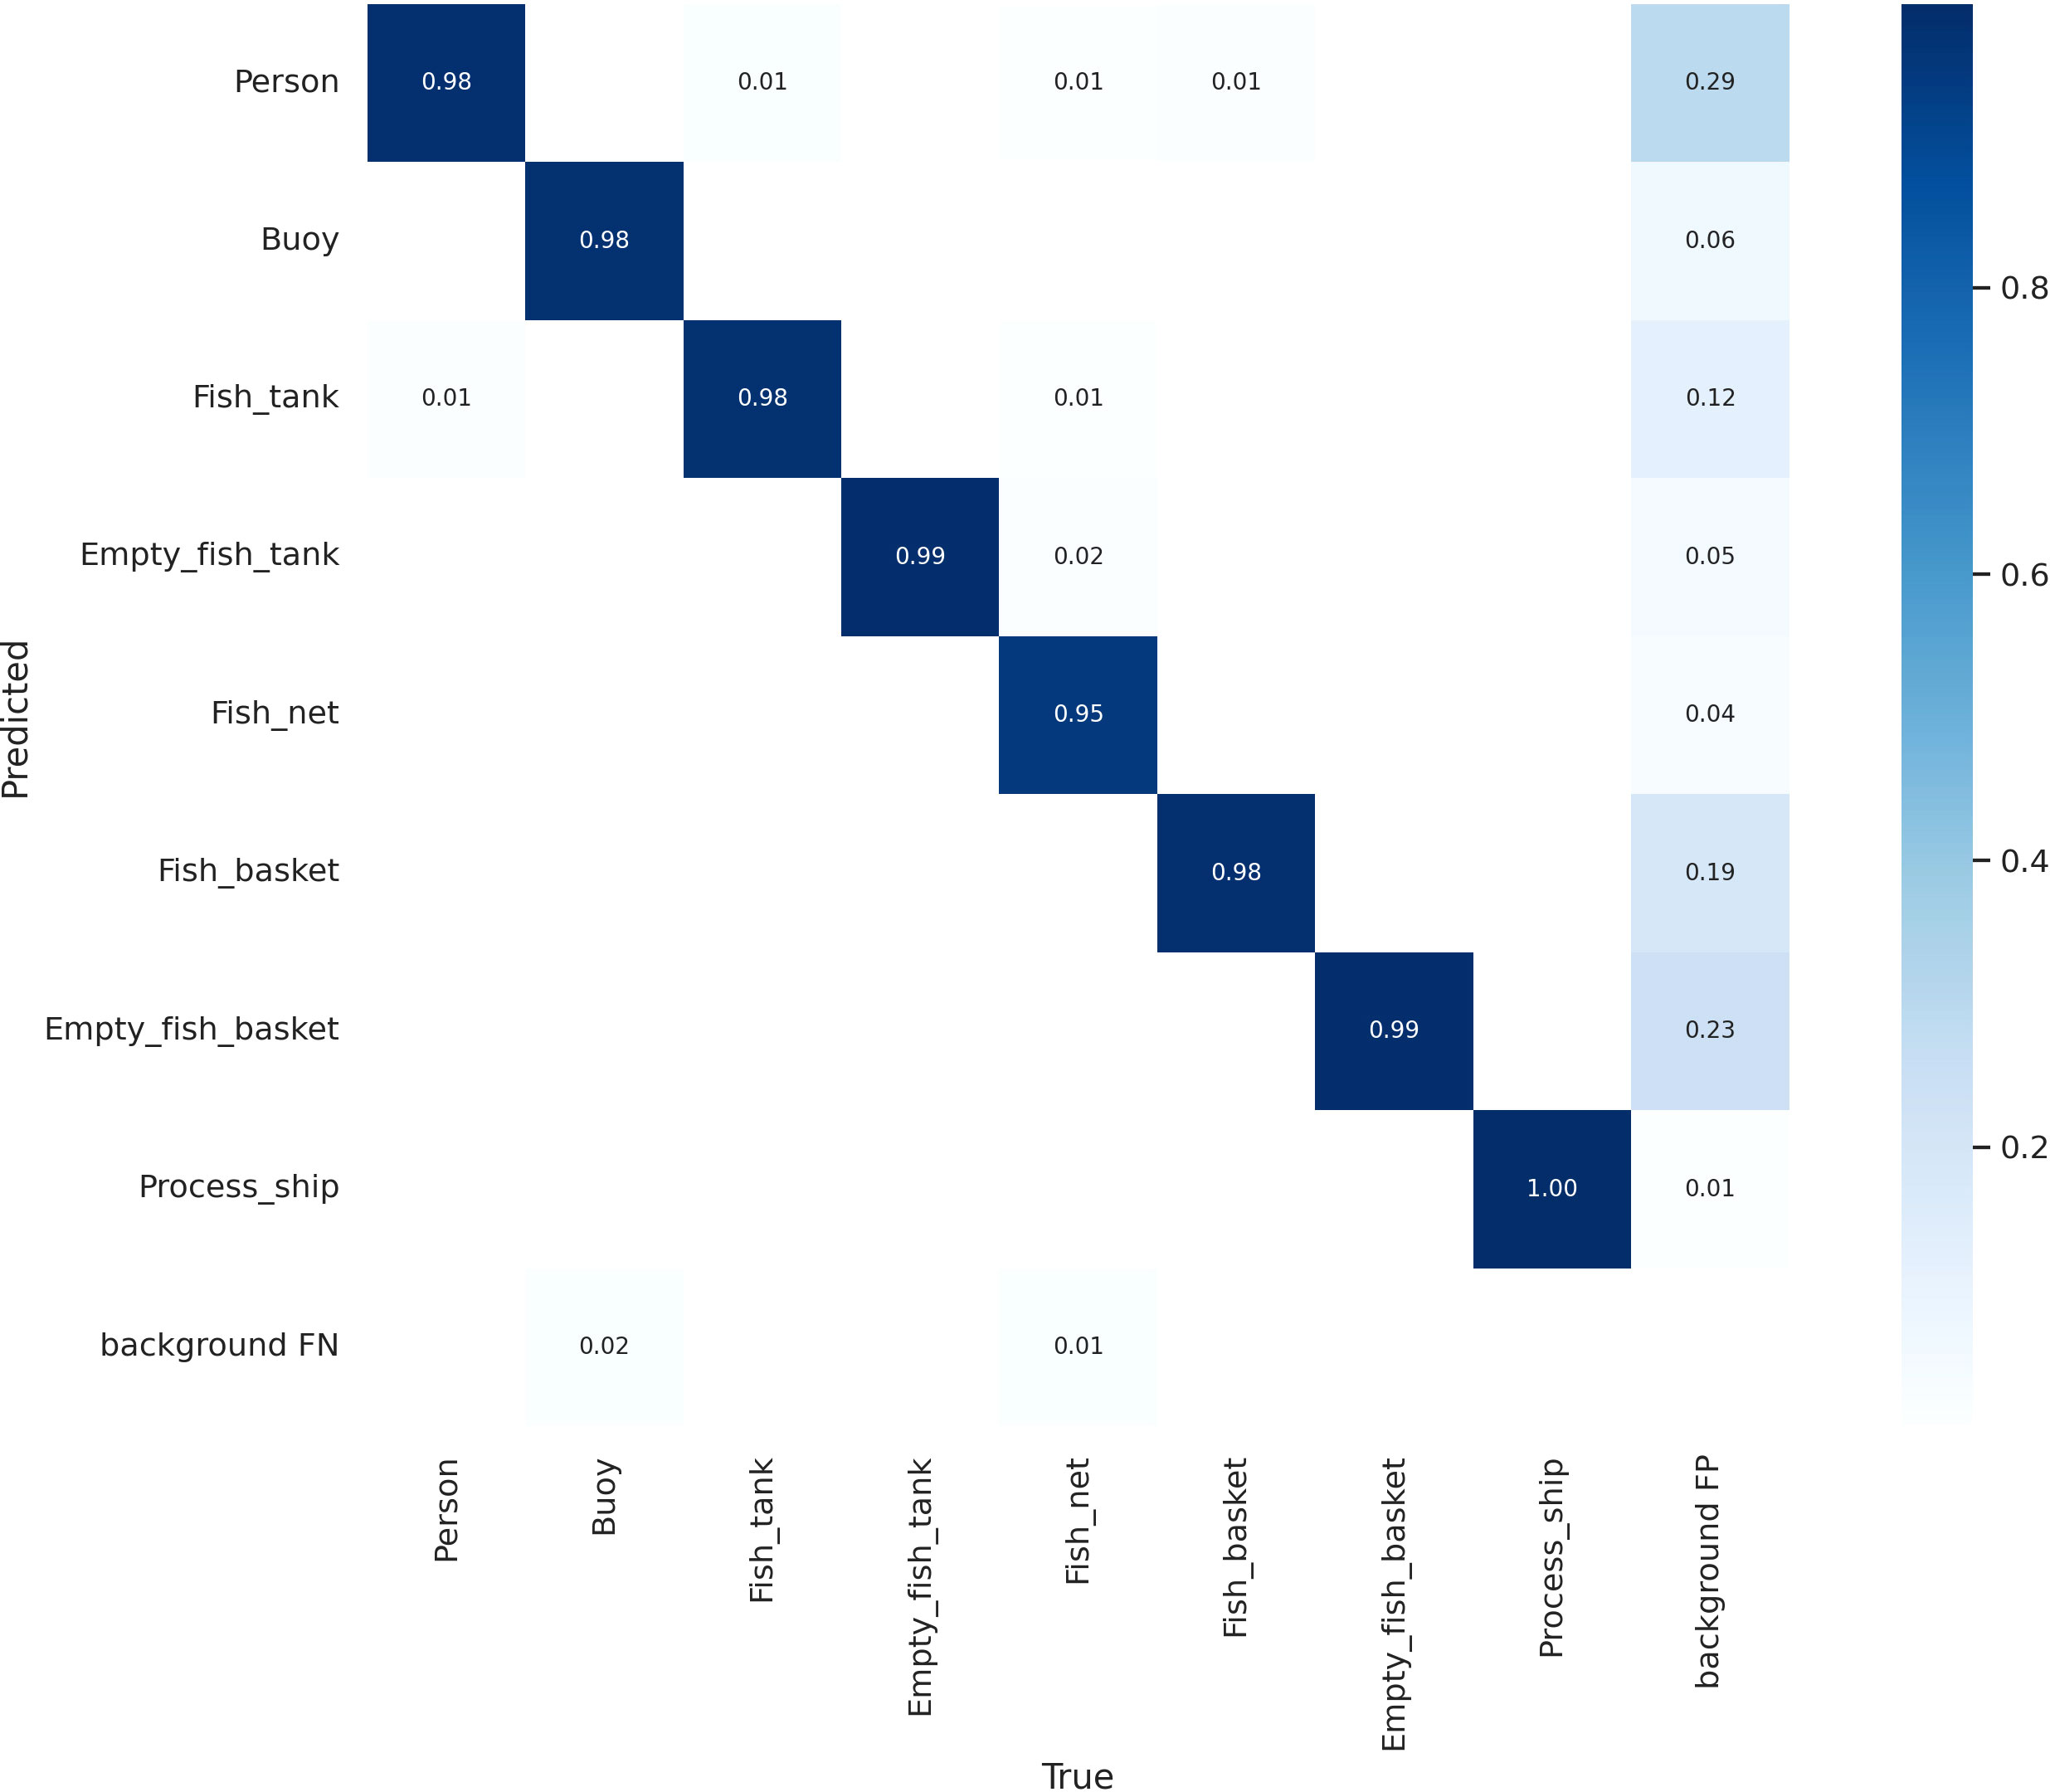
Figure 9 Confusion matrix.
The detection results of the experimental model YOLOv5_SE are shown in Figure 10(a). In all the detection video results, the detection results of Fish_basket, Fish_net and Process_ship are very accurate and not omitted. In addition, the other five types of detection are accurate, and the detection has better real-time performance and avoids omissions and misjudgments.
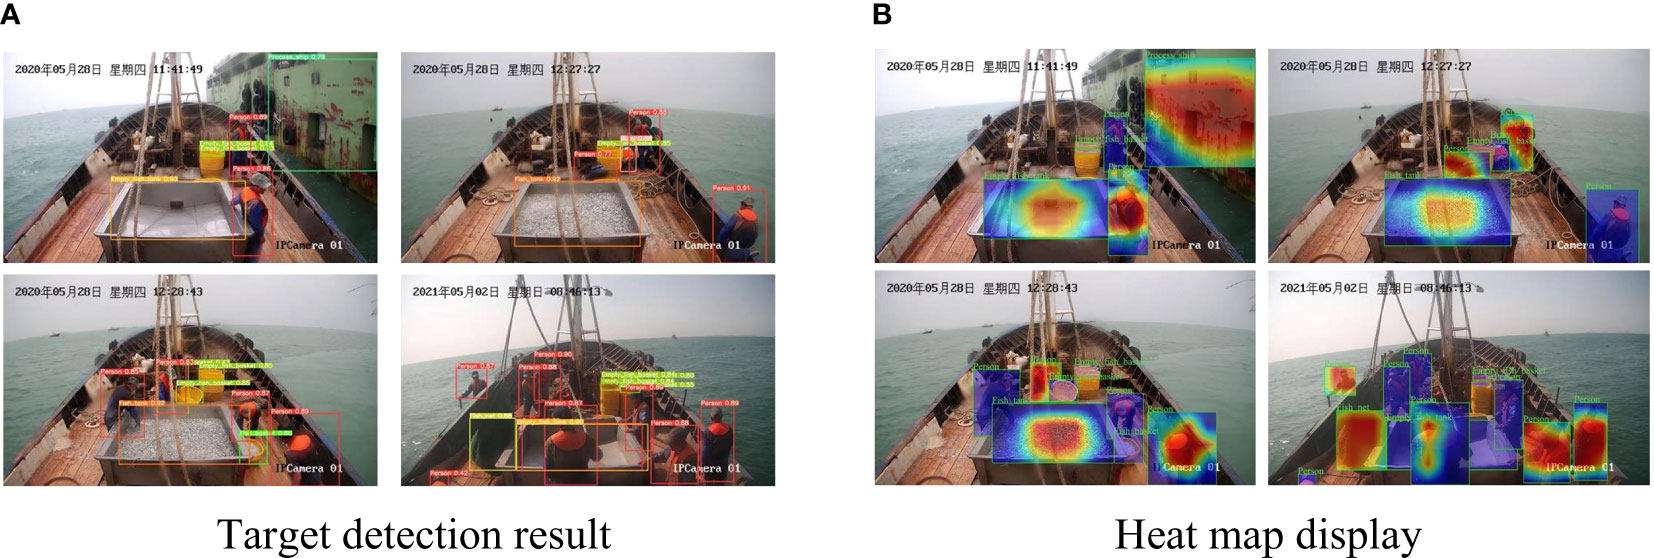
Figure 10 The target detection results in the experiment and the related results of the Heat map display.
Gradient-weighted Class Activation Mapping (Grad-CAM) usually displays its decision basis in the form of heat map, which is a visualization method in deep learning. Its main function is to determine which part of the image has the greatest impact on the final result (Zhou et al., 2016). It can intuitively display the correct classification and which network is more focused on. The purpose of the block area. As shown in Figure 10(b), from light color to dark red, the importance of the feature from small to large gradually shows of learning. Person, Buoy, Fish_tank, Empty_fish_tank, Fish_net, Fish_basket, Empty_fish_basket and Process_ship (Figure 10(b)) each have a centralized learning area, so the subsequent recognition precision can be continuously improved to achieve a better recognition effect.
In summary, the model proposed in this experiment can accurately mark the positions of eight categories of Person, Buoy, Fish_tank, Empty_fish_tank, Fish_net, Fish_basket, Empty_fish_basket and Process_ship data, which is more precision than the original YOLOv5 effect.
3.4 Statistics job results
Implement manual statistics on the main categories of Engraulis japonicus operations, and contrast the results. As shown in Figure 11, the green straight line is used as the collision detection line of the experiment, and the upper right corner of the picture is the counter used to count the fishing baskets. The Figure 11(a) is the picture before the fish basket pass the detection line. At this time, the counter does not count the fishing basket. The Figure 11(b) is the picture after the fish basket whole passes the detection line, the counter has counted the fishing basket, the data of all Fish_basket can be counted in turn.
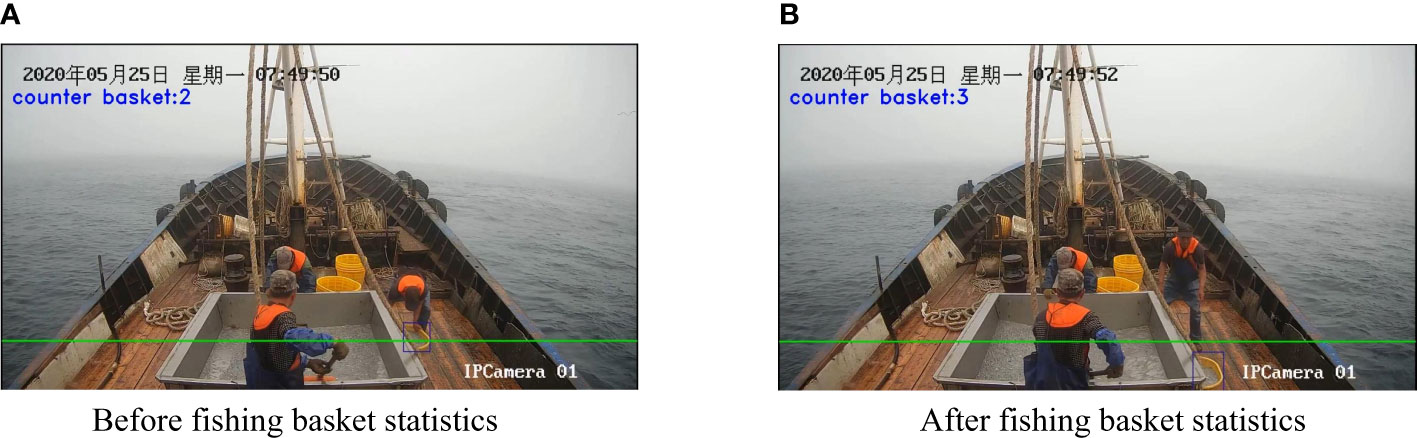
Figure 11 Statistics of fishing baskets.
Table 3 shows the statistical results of three types of data Fish_basket, Fish_net and Process_ship in the experimental video data, and the corresponding accuracy rates of the three types are 96.5%、85.8% and 75% respectively. Since there were less processing vessels data in the video, even a small fluctuation range of the predicted statistics may cause serious errors.
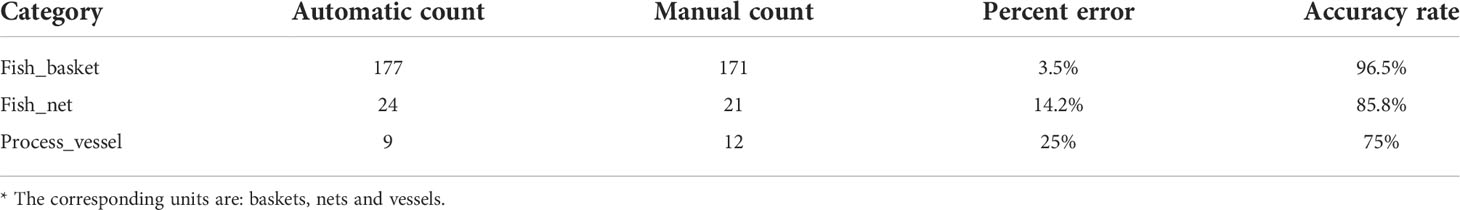
Table 3 Statistical results of experiments.
4 Discussion
4.1 Model improvement size issue
Implementing refined monitoring of fishing vessels operations is of great significance for standardizing fishing operations and protecting fishery resources. In order to realize the recognition effect of Engraulis japonicus work better, this paper uses four kinds of experiments to compare and observe the detection effect of the four models in recognising Engraulis japonicus working procedures. The research results show that the improvement of YOLOv5 can significantly improve the detection effect of fishing operations, but whether the method is effective for other fishing vessels needs further verification. In the model improvement of YOLOv5, some related researchers have made different explorations. Fan et al. (2022) in order to solve the problem of inconspicuous object recognition in nighttime photography, they firstly carried out image enhancement to distinguish the detected object from the background color, and then compared with other detection methods to prove the detection effect. But its detection accuracy is not high. Zhang et al. (2022) used the obtained marine vessel data to replace the CSP-DarkNet module in YOLOv5 with CSP-DenseNet to classify six types of vessel data and improve the detection accuracy. Kim et al. (2022) solved the problem of class imbalance through methods such as Copy and Paste, and enhanced the image with Mix-up, so as to solve the previous data problem and obtain better experimental results, but this did not provide a fundamental improvement to YOLOv5.
In deep learning models, the model size and its complexity directly affect the effect of practical applications. The size of the model (Model size) mainly refers to the model in megabytes (M), which directly affects the running speed of the model. The network complexity of the model can be mainly measured by parameters and GPU floating point operations (GFLOPs). These two describe the computational effort of data going through a complex network. The complexity of the model also directly affects the efficiency of the model. as shown in Table 4.

Table 4 Comparison of model parameters.
Through the comparison of the parameter results in Table 4, it can be found that the size of the YOLOv5_SE model in this experiment is 91.6M, which increases the model size while improving the accuracy, so the detection speed and time also increase. This will limit the running speed of video detection results. Therefore, how to reduce the model to improve the detection speed is an important problem in practical applications.
4.2 Statistics problem
Traditional manual statistics would take a lot of time and effort, and the accuracy of the results cannot be traced back. Therefore, through machine-to-video analysis, more accurate job statistics can be automatically obtained and the information of the entire job can be retained, which provides great significance for reducing manual statistical time and workload. In the video statistics results, it is found that the detection frame disappeared for a short time. Therefore, Kalman filtering is added to eliminate jitter in the experiment to keep the prediction frame stable in the whole process, so that the detection results will be more accurate and statistical results more believable (Welch and Bishop, 1995). In addition, the following problems will occur: A small number of fishing nets work for too long, the work is not standardized, and it is easy to be counted many times. In the video, it was found that the setting of the threshold according to the time of each fishing net collection is not accurate, with operation time too long and irregular operation, which makes it easy for a few fishing nets to be counted multiple times. In a several videos, the fishing baskets have been placed on the deck for too long without passing the collision line and have moved back and forth for many times. The fishing nets should be placed in the designated area and should not be placed under the camera for a long time, to avoid inaccurate statistics. The operation of the fishing net is carried out simultaneously with the loading of the fish in the fishing basket, so that the fishing basket is blocked by the fishing net, resulting in inaccurate statistics.
As the response to the problems found in the video above, some improvement plans are proposed: 1 The operation of the fishing net should be continuous and uninterrupted, and the operation time should be set within 40 seconds to ensure sufficient time. 2 When the fishing basket is not in use, it should be placed in certain area outside the camera. When the fishing basket is full of fish, it should continuously move from the place where the camera can shoot to outside the shooting range of the camera, and try to ensure that it is not blocked and moves in a straight line. 3 Ensure that fishing nets and fishing baskets cannot be operated at the same time. Otherwise, it will affect the number of statistics and easily cause repeated statistics. 4 The time from the appearance of the processing vessels to the end of the operation is within 6 minutes. When the fishing basket is exchanged, it should be recovered in time and placed in another location. 5 The camera can be installed on the flagpole of the splint of the vessels. The principal shooting range is still the fishing operation process, which is used to assist statistics and prevent the problem of inaccurate statistical results due to artificial occlusion.
In the statistics of Engraulis japonicus operation, the improved YOLOv5_SE model achieves a more accurate detection effect. In the statistical experiment, the statistical results of fishing baskets are relatively good, followed by the good statistical results of fishing nets and poor statistical results of processing vessels. Therefore, It needs to be further improved, and whether it is feasible in practical application still needs further research and exploration practice.
5 Conclusions
For the problems of the operation specification of the fishing vessels of Engraulis japonicus, the videos of the fishing vessels’ operation taken by the camera are used to improve the YOLOv5 model. The detection model of YOLOv5 fused with attention mechanism is constructed to identify and detect the main features of fishing vessels of Engraulis japonicus. The mAP of this model can reach 99.4% with better accuracy. After that, basing on target detection, Kalman filtering and Hungarian matching method are used to count the number of main categories of fishing baskets, and the threshold method is used to achieve the number of fishing nets and processing vessels to realize the statistics of some categories of Engraulis japonicus operations. Automated statistics to facilitate management and recording of vessels. The model solves the problem of identification and analysis of fishing vessels operations, which provides a reference for the subsequent realization of higher precision and faster identification and statistical methods of Engraulis japonicus operations.
In future, some shortcomings can be improved, such as the number of labels and network feature extraction. In terms of the number of labels, manual labeling consumes a lot of time, workforce and energy, so it is expected that automatic labeling software or programs can be implemented in the future, which can improve the label speed and quality of the data. In terms of network feature extraction, the original feature pyramid network in YOLOv5 can be replaced by AF-FPN. The adaptive attention mechanism (AAM) and the feature enhancement module (FEM) are used to reduce the information loss in the feature map generation process and enhance the feature pyramid of the representation ability, to solve the problem of incompatible model size and recognition accuracy, and improve the recognition efficiency, In addition to, the ability to scale objects and make an effective trade-off between recognition speed and accuracy, thus making the model more robust. In the statistical process of some categories, methods such as deepsort can be used to make the statistical results more accurate. These research directions still need to be further verified and explored in the actual research process in the future.
Data availability statement
The original contributions presented in the study are included in the article/Supplementary Material. Further inquiries can be directed to the corresponding author.
Ethics statement
Written informed consent was obtained from the individual(s) for the publication of any potentially identifiable images or data included in this article.
Author contributions
JZ, SW, and YL designed the study. SZ contributed to guide writing instructions and ideas. FT and SY grammar correction and writing instructions. YS, SW, and SZ contributed to the early data annotation. WF contributed to wrote the manuscript. WZ contributed to investigation, resources and supervision. RH contributed to grammar modification. All authors contributed to the article and approved the submitted version.
Funding
This work was supported by National Natural Science Foundation of China under Grant No. 61936014 & 41906176, Marine S&T Fund of Shandong Province for Pilot National Laboratory for Marine Science and Technology(Qingdao) under Grant No. 2022QNLM010104-4, Chinese Academy of Fishery Sciences basic scientific research fees under Grant No. 2020TD82, and National Key Research and Development Program of China under Grant No. 2019YFD0901405.
Acknowledgments
I am very grateful to my tutor, Professor Zhang, for his careful guidance, and my fellow students SW and YS for their support.
Conflict of interest
The authors declare that the research was conducted in the absence of any commercial or financial relationships that could be construed as a potential conflict of interest.
Publisher’s note
All claims expressed in this article are solely those of the authors and do not necessarily represent those of their affiliated organizations, or those of the publisher, the editors and the reviewers. Any product that may be evaluated in this article, or claim that may be made by its manufacturer, is not guaranteed or endorsed by the publisher.
Supplementary material
The Supplementary Material for this article can be found online at: https://www.frontiersin.org/articles/10.3389/fmars.2022.933735/full#supplementary-material
References
Bai L. L., Han Z. N., Ren J. J., Qin X. F. (2020). Research on feature selection for rotating machinery based on supervision kernel entropy component analysis with whale optimization algorithm. Appl. Soft. Comput. 92, 106245. doi: 10.1016/j.asoc.2020.106245
Chen Y., Zhang C., Qiao T., Xiong J. (2021). “Ship detection in optical sensing images based on YOLOv5,” in Twelfth International Conference on Graphics and Image Processing (ICGIP2020) (Bellingham, WA.:SPIE-INT SOC optical engineering), 117200E.
Fan Y. C., Zhang S. Y., Feng K., Qian K. C., Wang Y. T., Qin S. Z. (2022). Strawberry maturity recognition algorithm combining dark channel enhancement and YOLOv5. Sensors 22 419, 8–10. doi: 10.3390/s22020419
Feng Y., Zhao X. L., Han M. X., Sun T. Y., Chen L. (2019). “ICTCE 2019,” in The 3rd International Conference on Telecommunications and Communication Engineering (New York, NY: ACM). 63–68. doi: 10.1145/3369555.3369574
Girshick R. (2015). IEEE International Conference on Computer Vision (ICCV). (New York, NY: IEEE), 1440–1448.
Girshick R., Donahue J., Darrell T., Malik J. (2014). “Rich feature hierarchies for accurate object detection and semantic segmentation,” in IEEE conference on computer vision and pattern recognition (CVPR). (New York, NY: IEEE), 580–587.
Goutte C., Gaussier E. (2005). 2014 IEEE Conference on computer vision and pattern recognition (CVPR) New York, NY: IEEE. 3408 345–359. doi: 10.1007/978-3-540-31865-1_25
Huang S. L., Tang Y. (2019). Review and prospect of fisheries management and china’s practice. J. Fish. China 43, 211–231. doi: 10.11964/jfc.20181011512
Hu J., Shen L., Sun G. (2018). Squeeze-and-excitation networks. IEEE Conf. Comput. Vis. Pattern Recognit, 7132–41. doi: 10.1109/CVPR.2018.00745
Jiang M., Wang Y. (2007). Summer distributions of eggs and larvae of scomber japonicus and engraulis japonicus in the East China Sea. Oceanol. Limnol. Sin. 38, 350–351. doi: CNKI:SUN:HYFZ.0.2007-04-008
Kim J.-H., Kim N., Park Y. W., Won C. S. (2022). Object detection and classification based on YOLO-V5 with improved maritime dataset. J. Mar. Sci. Eng. 10, 376–377. doi: 10.3390/jmse10030377
Lai J. H., Wang Y., Luo T. T., Chen Y. Y., Liu S. (2021). Statistical method and verification of side-view video traffic flow based on YOLO_V3. Highway. Traffic. Technol. 38, 135–142. doi: 10.3969/j.issn.1002-0268.2021.01.017
Leclerc M., Tharmarasa R., Florea M. C., Boury A. C., Kirubarajan T., Duclos N. (2018). “Ship classification using deep learning techniques for maritime target tracking,” in 2018 21st International Conference on Information Fusion. New York, NY:IEEE737–744. doi: 10.23919/ICIF.2018.8455679
Lin S., Liu M. Y., Zhiyong T. (2021). Using attention mechanism and improving underwater treasure detection with YOLOv5. Trans. Chin. Soc. Agric. Eng. 37, 307–314. doi: 10.11975/j.issn.1002-6819.2021.18.035
Liu S., Qi L., Qin H. F., Shi J. P., Jia J. Y. (2018). “Path aggregation network for instance segmentation,” in IEEE/CVF conference on computer vision and pattern recognition (CVPR). (New York, NY:IEEE), 8759–8768.
Liu Y., Tong M. G. (2002). Application of Hungarian algorithm in multi-target assignment. Fire. Cont. & Command. Cont. 04, 34–37. doi: 10.3969/j.issn.1002-0640.2002.04.010
Neubeck A., Van G. L. (2006). “Efficient non-maximum suppression,” in 18th International Conference on Pattern Recognition (ICPR'06) (New York, NY:IEEE), Vol. 06. 850–855. doi: 10.1109/ICPR.2006.479
Pravin P. (2002). Purse seine and its operation. Cent. Ins. Fish. Technol.Matsyapuri P O, Cochin-682029, 5–6.
Ren S. Q., He K. M., Girshick R., Sun J. (2015). Faster r-cnn: Towards real-time object detection with region proposal networks. Adv. Neural Inf. Process. Syst. 28, 91–99. doi: 10.1109/TPAMI.2016.2577031
Shi H. M., Fan W., Zhang H., Yang S. L. (2021). Spatial analysis of fishing intensity of illex argentinus based on fishing vessel tracks. South China Fish. Sci. 17, 1–11. doi: 10.12131/20210010
Song M. Y., Chen L. R., Liang J. N., Li J. P., Niu Z. Z., Wang Z., et al. (2022). Real-time optical fiber end face defect detection model based on lightweight improved network. Lasers. Optoelectron. Prog. 59, 1–21. doi: 10.3788/lop59.2415006
Welch G. F. (2020). Kalman filter. In Ikeuchi K. (eds) computer vision (Springer:Cham), 1–3. doi: 10.1007/978-3-030-03243-2_716-1
Welch G., Bishop G. (1995). An introduction to the kalman filter. University of North Carolina at Chapel Hill. Chapel Hill, 05–06.
Xue L. J., Liu Z. F. (2005). Study on the number distribution and biological characteristics of Japanese anchovy in the East China Sea. J. Zhejiang. Ocean. Univ. (Nat Sci. Edition) 24, 312–317. doi: 10.3969/j.issn.1008-830X.2005.04.003
Yang S. L., Fan X. M., Wu Z. L., Wu Y. M., Dai Y. (2021). Analysis of the influence of the vertical structure of water temperature on the catch rate of yellowfin tuna in the tropical central and western pacific based on the GAM model. Haiyang Xuebao 43, 46–54. doi: 10.12284/hyxb2021040
Yang X., Zhao N., Yu S. (2020). Combined internal trucks allocation of multiple container terminals with Hungarian algorithm. J. Coast. Res. 103, 923–927. doi: 10.2112/SI103-192.1
Zhang H., Yang S., Fan W., Shi H. M., Yuan S. L. (2021). Spatial analysis of the fishing behaviour of tuna purse seiners in the western and central pacific based on vessel trajectory date. J. Mar. Sci. Eng. 9, 321–322. doi: 10.3390/jmse9030322
Zhang X., Yan M. Z., Zhu D. Q., Guan Y. (2022). Marine ship detection and classification based on YOLOv5 model. J. Phys.: Conf. Ser. 2181, 012025. doi: 10.1088/1742-6596/2181/1/012025
Zhang R. H., Zhang S. M., Fan W., Chen X. Z. (2021). Characteristic analysis of gillnet fishing effort in zhejiang province based on beidou ship position data. Mar. Fish. 43, 618–625. doi: 10.13233/j.cnki.mar.fish.2021.05.011
Zhou J., Jiang P., Zou A., Chen X., Hu W. (2021). Ship target detection algorithm based on improved YOLOv5. J. Mar. Sci. Eng. 9, 907–908. doi: 10.3390/jmse9080908
Zhou B., Khosla A., Lapedriza A., Oliva A., Torralba A. (2016). Learning deep features for discriminative localization. Proc. IEEE Conf. Comput. Vision Pattern Recog. 1512, 2921–2929. doi: 10.1109/CVPR.2016.319
Keywords: Engraulis japonicus, quota fishing, YOLOv5, attention mechanism, Kalman filter
Citation: Zhang J, Wang S, Zhang S, Tang F, Fan W, Yang S, Sun Y, Liu Y, Zhu W, Zhang S and He R (2022) Research on target detection of Engraulis japonicus purse seine based on improved model of YOLOv5. Front. Mar. Sci. 9:933735. doi: 10.3389/fmars.2022.933735
Received: 01 May 2022; Accepted: 07 July 2022;
Published: 29 July 2022.
Edited by:
Lin Zhang, Tongji University, ChinaReviewed by:
Zuozhi Chen, South China Sea Fisheries Research Institute (CAFS), ChinaShengyong Xu, Zhejiang Ocean University, China
Copyright © 2022 Zhang, Wang, Zhang, Tang, Fan, Yang, Sun, Liu, Zhu, Zhang and He. This is an open-access article distributed under the terms of the Creative Commons Attribution License (CC BY). The use, distribution or reproduction in other forums is permitted, provided the original author(s) and the copyright owner(s) are credited and that the original publication in this journal is cited, in accordance with accepted academic practice. No use, distribution or reproduction is permitted which does not comply with these terms.
*Correspondence: Shengmao Zhang, emhhbmdzbUBlY3NmLmFjLmNu
†These authors have contributed equally to this work