
94% of researchers rate our articles as excellent or good
Learn more about the work of our research integrity team to safeguard the quality of each article we publish.
Find out more
ORIGINAL RESEARCH article
Front. Mar. Sci., 09 December 2022
Sec. Marine Ecosystem Ecology
Volume 9 - 2022 | https://doi.org/10.3389/fmars.2022.933405
 Elizabeth B. Jewett1,2*
 Katherine N. Lawson3
 Kristen J. Larson1Brianna M. Tracy4
 Safra Altman5
 Andrew L. Chang1Scott Cowan1
 Jeffrey A. Crooks6Tamar Huber1
 Elizabeth H. Wells7
 Gregory M. Ruiz1
Sessile marine invertebrate (biofouling) communities have served as an important model in ecology for evaluating fundamental patterns and processes, including invasion dynamics, which vary at broad spatial and temporal scales. Here, we tested for differences in biofouling community development among three biogeographically distinct bays in North America (Chesapeake Bay, Tampa Bay, and San Francisco Bay), exploring possible explanations for differential non-native species success. In particular, we aimed to examine if San Francisco Bay (a global hotspot for non-native species richness) differed in composition and space occupation, especially since open space can facilitate colonization. Additionally, we explored how biogeography, assembly and succession dynamics over the short and long term, and space availability affect marine communities across broad spatial scales. Patterns of community assembly differed among bays, with more bare space and less secondary cover (species settling on species) in San Francisco Bay. San Francisco Bay was also distinguished by a higher percent cover of Tunicata (almost all of which are non-native and historically absent) over multiple time scales. Cirripedia recruited on bare panels in all three Bays but cover increased only in Tampa Bay, as soak time increased. Tube-dwelling Polychaeta distinguished Chesapeake Bay from Tampa Bay and San Francisco Bay. Low-salinity events temporarily restructured the communities in all three bays. Whether differences among bays reflect coastal versus bay-specific patterns remains to be tested.
The processes that drive marine community development are variable and not fully understood. One of these processes, the extent to which space is available for recruitment, may affect community structure (Marraffini and Geller, 2015; Reiter, 2020). Variations in resource availability, such as space in the fouling community, may be influenced by invasion history and have a strong influence on invasion success (Shea and Chesson, 2002; Fukami, 2015). For sessile invertebrates and plants, the extent of available space can strongly affect recruitment and subsequent species diversity at the scale of local plots (Dean and Hurd, 1980; Tilman and Kareiva, 1997; Underwood and Chapman, 2006). Various studies have tested this by providing an unoccupied substrate at multiple intervals at one location (Dean and Hurd, 1980; Underwood and Chapman, 2006). However, whether there are naturally-driven, broad geographic differences in space availability, for instance, between the North American West and East Coasts, has not been well documented.
The history of the establishment of non-native species, which can change the assemblage of available species as well as their interactions, can play an influential role in spatial and temporal community development. San Francisco Bay (Figure 1) has the highest documented number of non-native species, more than 300 (invertebrates, plants, algae, fish, etc.), of any estuary in the world. Of these, over 134 non-native marine fouling species have been identified in San Francisco Bay to date (Ruiz et al., 2000; Ruiz et al., 2011; Fofonoff et al., 2018). Identified vectors for the introduction of non-native species in San Francisco Bay include ballast water, hull fouling, live species trade, and marine debris (Ruiz et al., 2011). In contrast, relatively few non-native fouling species are known in other North American coastal bays or estuaries, and the science to unravel the reasons continues. For example, Chesapeake Bay and Tampa Bay (Figure 1), two other estuaries in North America, have 30 and 19 documented non-native marine fouling species, respectively (Fofonoff et al., 2018).
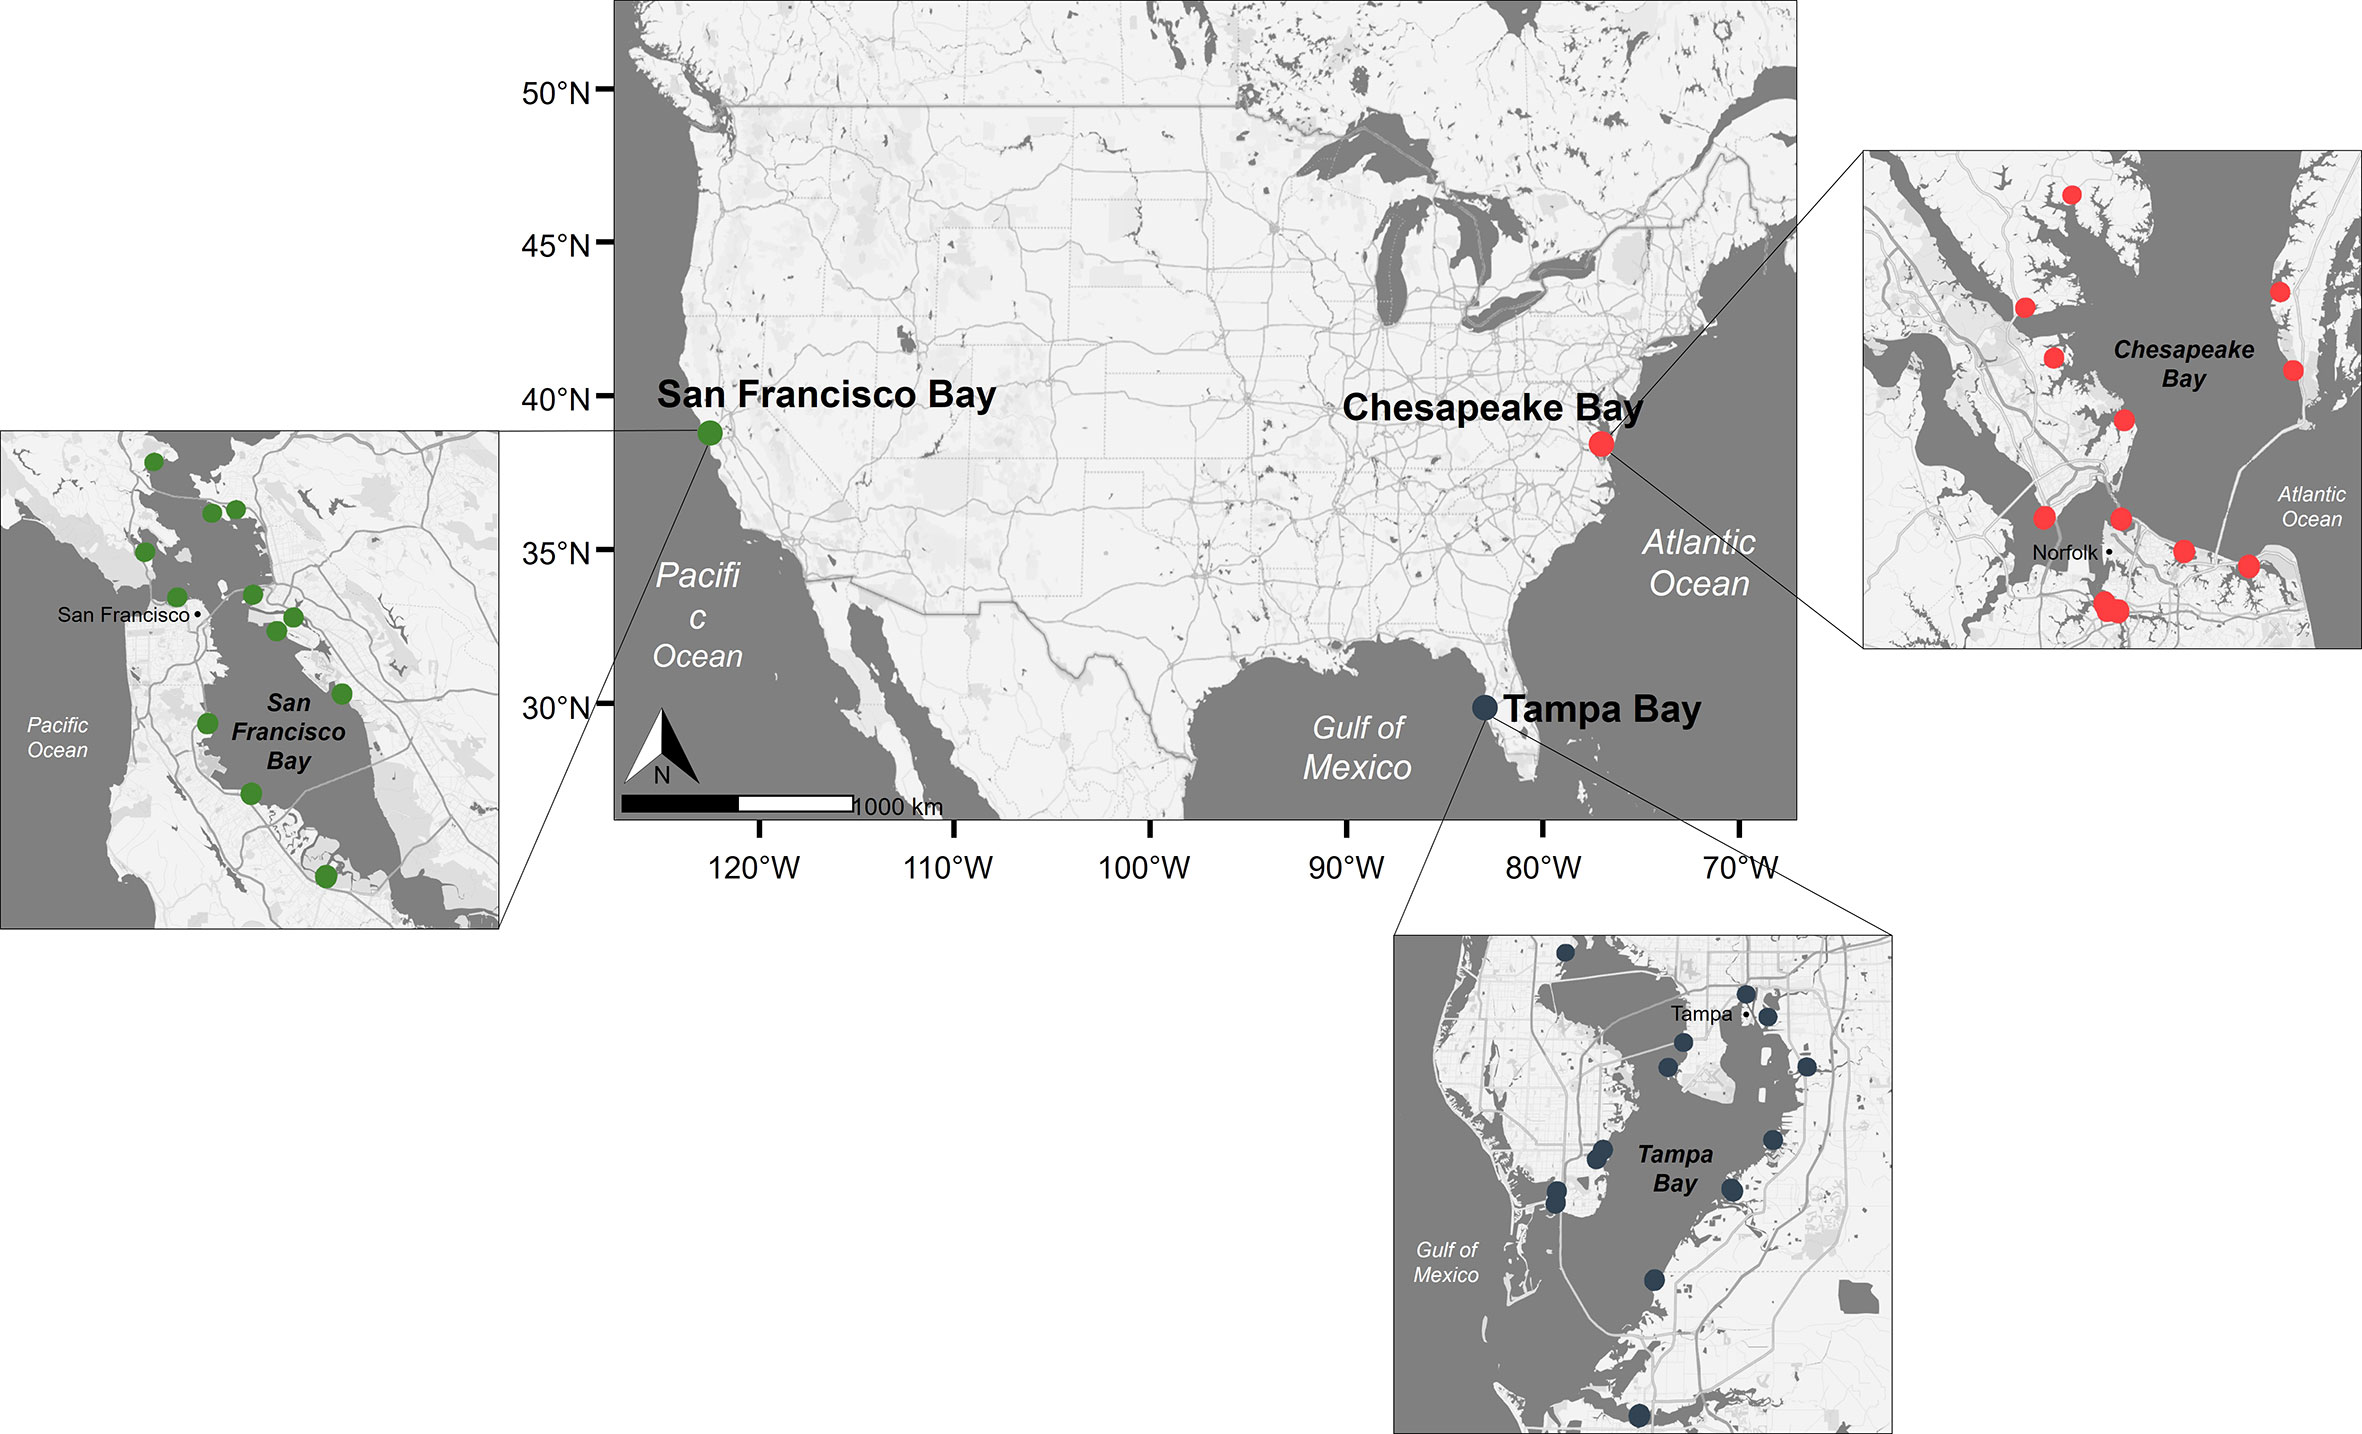
Figure 1 Map of panel deployment sites across periods 1 and 2. Colors indicate sites within each bay (red, Chesapeake Bay; green, San Francisco Bay; blue, Tampa Bay).
This difference in non-native species establishment among estuaries is exemplified by Tunicata, which occupy space in hard substrate communities. Nearly all Tunicata species documented in San Francisco Bay have been categorized as non-native (Fofonoff et al., 2018; Ruiz and Geller, 2018; Ruiz and Geller, 2021; Figure 2). Non-native solitary and colonial Tunicata in San Francisco Bay, first recorded in the 1930s, now stands at 14 individual species documented, more than three times as many as in Chesapeake Bay and Tampa Bay (Fofonoff et al., 2018), and has likely caused changes to settlement patterns and ecosystem processes due to their numerical abundance (e.g., Blum et al., 2007; Figure 2). The extent to which these now-dominant introduced species have changed the ecosystem (e.g., reducing resources for native species, making the community more susceptible to further introductions) is still being explored (Altman, 2011; Needles and Wendt, 2013) and provides a strong rationale for long-term monitoring and evaluation.
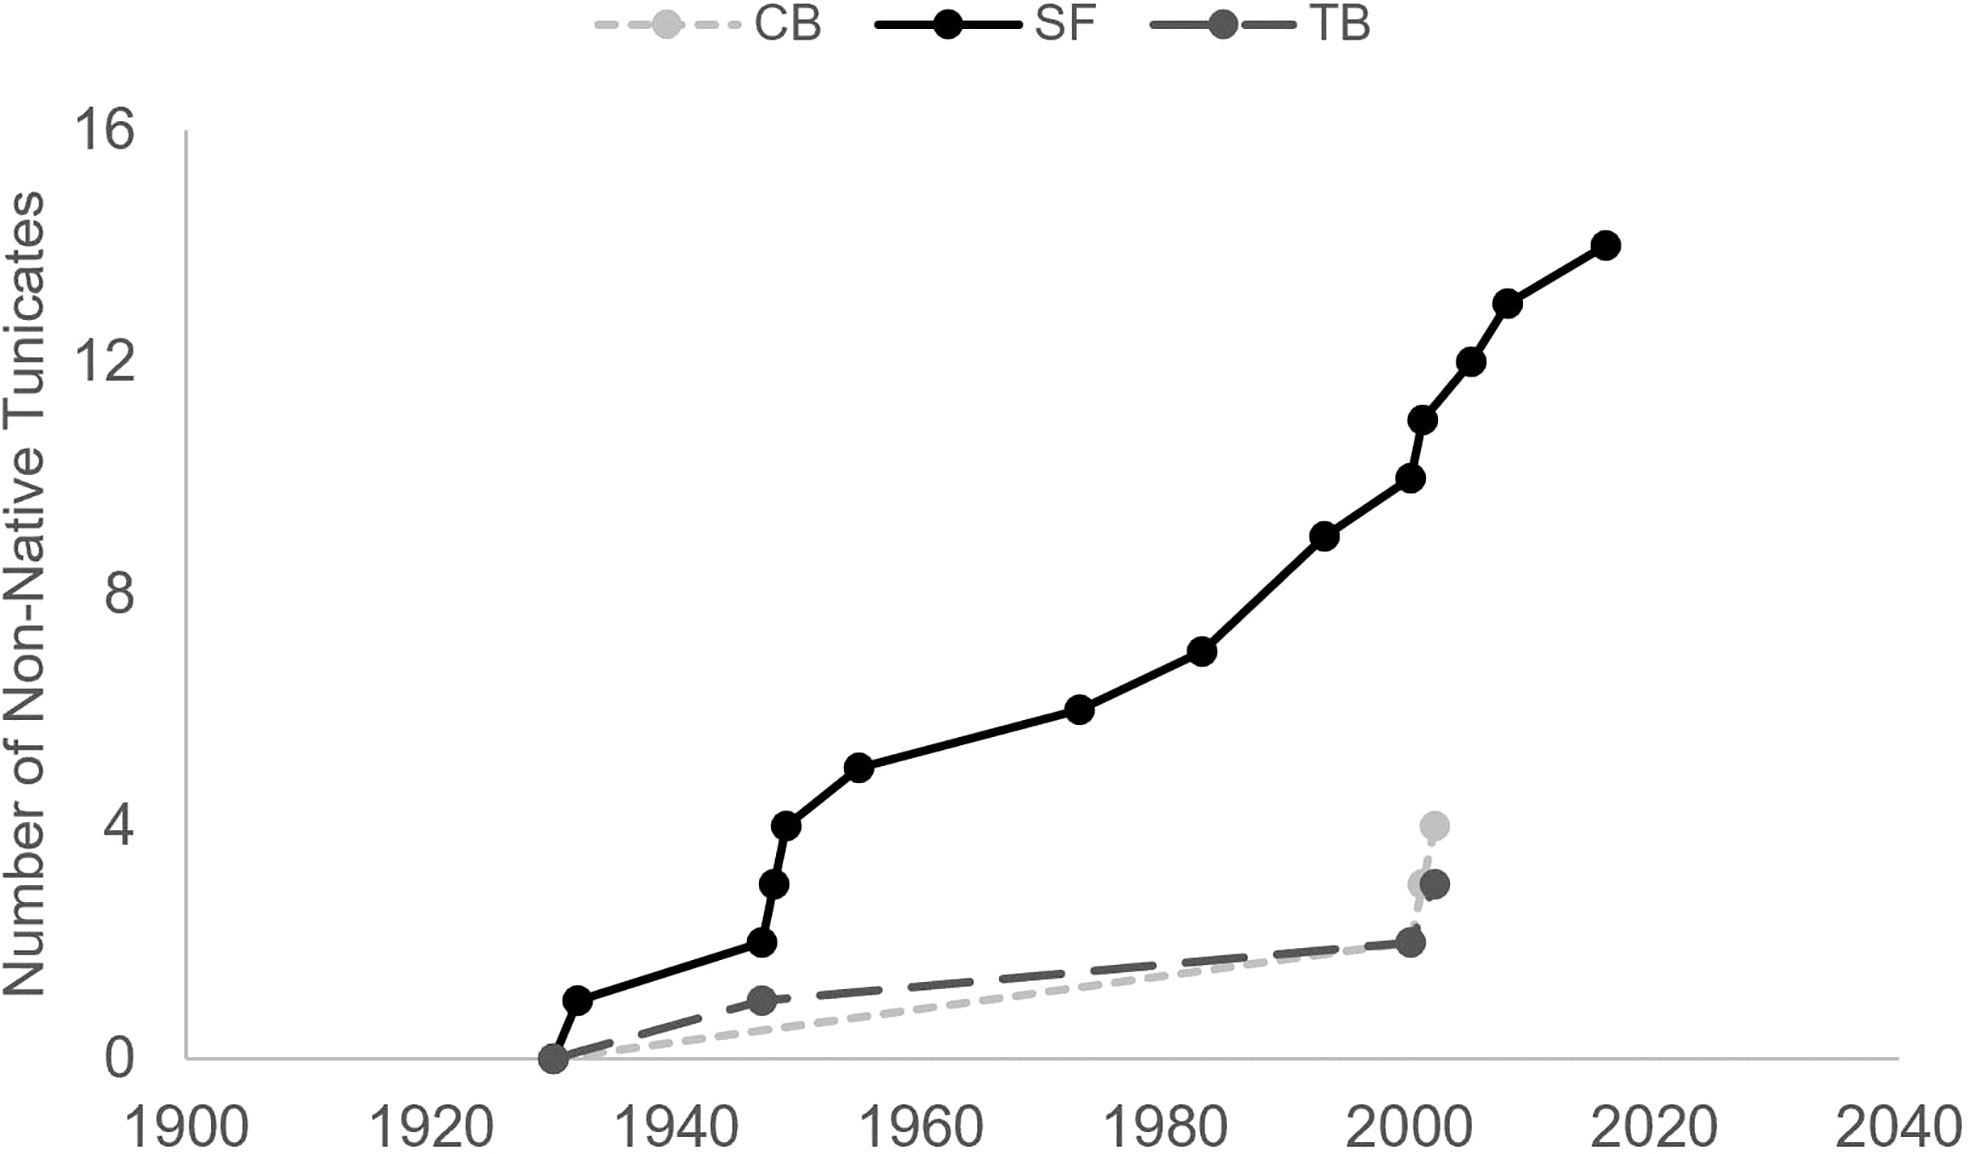
Figure 2 Cumulative number of distinct non-native Tunicata species by dates of first documentation in San Francisco Bay (SF), Chesapeake Bay (CB), and Tampa Bay (TB) (Fofonoff et al., 2018).
Community dynamics, such as patterns of species settlement and succession, can be greatly influenced by the species pool and general biogeography of a given system (Ruiz et al., 2011; Fukami, 2015; Vellend, 2016). The timing of initial community development on bare surfaces and seasonal assembly patterns are important and interrelated factors in structuring composition and succession within invertebrate communities. While many previous studies have examined the relationships between bare space (as a resource) and community dynamics, other analyses explore the effects of invasions by non-native species on both space availability and community structure, indicating that invasions can both reduce available space and local diversity (Stachowicz et al., 2002; Blum et al., 2007) while also increasing space through slough off dynamics (Reiter, 2020).
Hard substrate fouling communities rely on the recruitment of larvae that can be in the water column for periods that range from hours (Costello et al., 1957) to weeks (Toonen and Pawlik, 2001). Thus, the timing of bare substrate availability may impact the assemblage and determine which species dominate (Nandakumar, 1996). Seasonality can also play a significant role in determining the type of community that develops depending on the geographic location (Osman, 1978; Sams and Keough, 2012; Karlson and Osman, 2012; Tonkin et al., 2017). Some studies suggest that there is a predictable succession of species accumulation ultimately culminating in a stable climax community (Clements, 1916; Qvarfordt et al., 2006). Alternatively, communities might continue to change over time as a result of environmental factors, physical disturbance, competition, or predation (Sutherland, 1974; Cifuentes et al., 2007; Osman, 2015). The effect of timing, initial establishment, seasonality, and succession on community development is likely to differ depending on location and associated abiotic factors.
To evaluate how the community of fouling organisms and space use change across time (season, year, and length of soak time), which functional groups dominate both within and across different biogeographies, and the timing associated with functional group patterns, we conducted multiple surveys of the fouling community utilizing standardized fouling plates in three North American bays: San Francisco Bay, CA; Chesapeake Bay, MD/VA; and Tampa Bay, FL (Figure 1). The surveys were variously replicated in two different time periods using a range of soak times (durations). In the first time period (period 1; Table 1), soak times ranged from 1 to 30 months from 2001 to 2004. Three-month summer surveys, which capture the most diverse settlement and community development season, were resumed in 2012 and continued through the summer of 2018 in the same bays, resulting in three additional surveys per bay over this 6-year timeframe (period 2, Table 1). The composition of the communities that developed in these two sets of surveys was analyzed to determine if differences were consistent over time. The three bays were chosen due to the large amount of hard substrate present (often artificial/manmade), which hosts a substantial fouling community, the high degree of domestic and international ship traffic affecting each region, and the rate of invasion. Examining three bays that experience different environmental drivers provides a glimpse into the relative importance of these factors on community development in different regions.
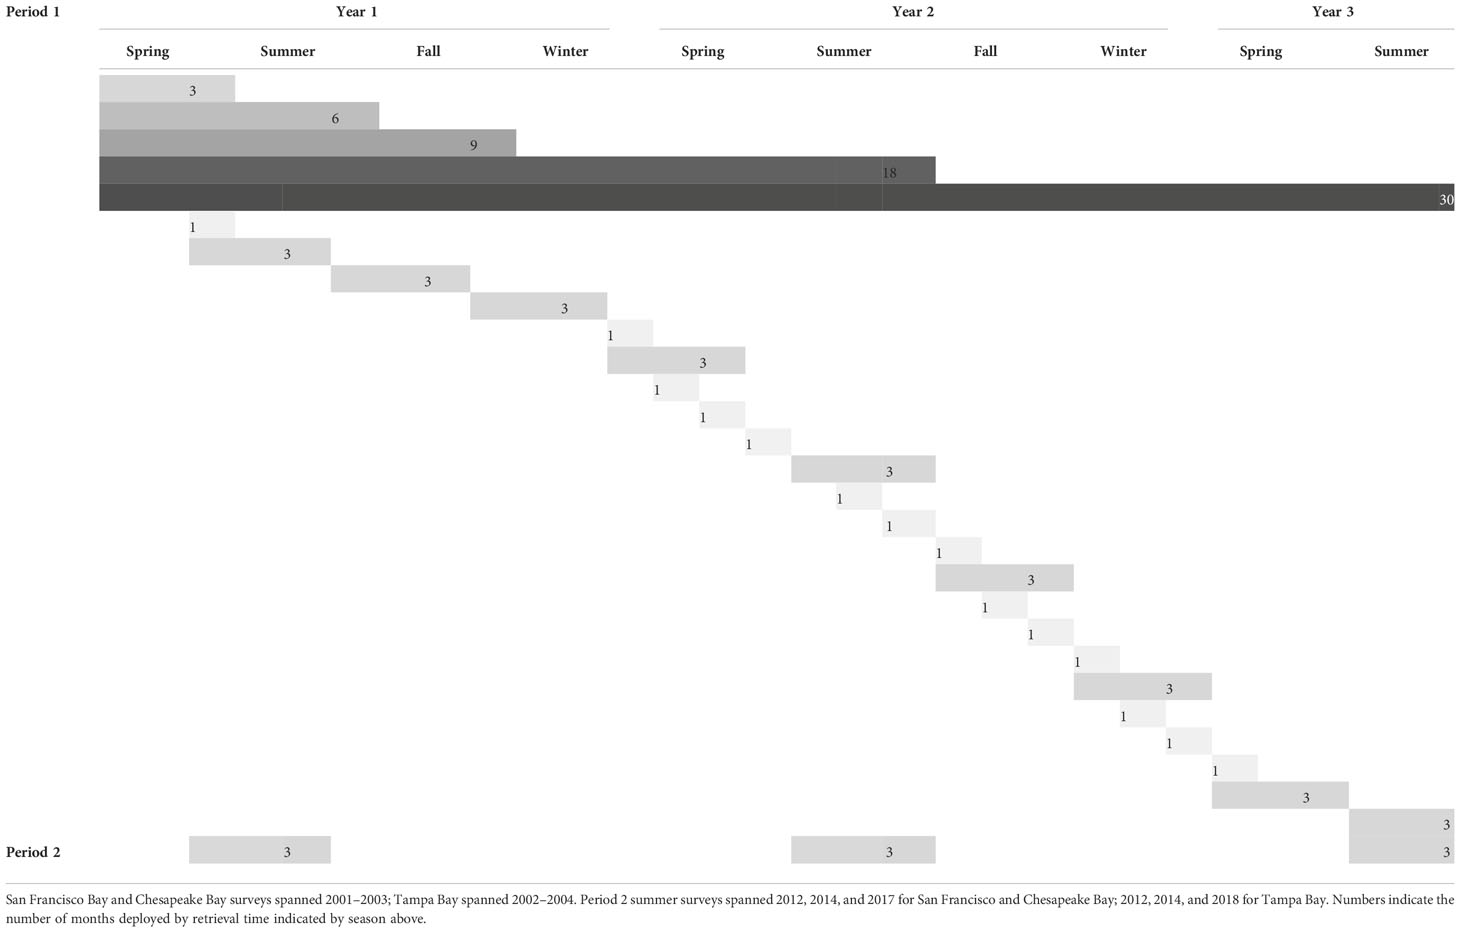
Table 1 Deployment schedule for period 1: Spring = deployed in February and retrieved in May; Summer = deployed in May and retrieved in August; Fall = deployed in August and retrieved in November, Winter = deployed in November and retrieved in February.
With this research, we sought to test whether the sessile invertebrate community in San Francisco Bay differed from those of other North American estuaries during the community assembly process. We hypothesized that resource availability (bare space) may be greater in San Francisco Bay, perhaps leading to greater invasion risk and thus the high number of non-native species established in this system. By comparing species composition over increasing soak times, the hypothesis that species accumulation leads to more complex communities and resistance to invasion was also considered. Several other community dynamics questions were analyzed, including how the community of fouling organisms changes between seasons and differs between bays; how the dominant summer fouling community has changed after 10 years within bays; and how functional groups change as the community matures and how that change differs between bays.
Fouling community development on sanded polyvinyl chloride (PVC) settlement panels was analyzed in three major embayments on different coasts (West, East, and Gulf) of the United States: San Francisco Bay, California; Chesapeake Bay, Virginia; and Tampa Bay, Florida (respectively). All sites in this study are known to host euryhaline species and generally have a salinity of >15 ppt. Settlement panels (hereafter referred to as “panels”) were cut to 14 × 14 cm squares, lightly sanded to facilitate settlement, and attached to bricks with the experimental surface facing downward to facilitate invertebrate settlement (Crooks et al., 2011; Marraffini et al., 2017). Panels served as passive collectors for the colonization of marine organisms and a standardized method to assess fouling community assemblages at each sampling location. Artificial substrates in all three bays studied are readily available in the form of marinas and docks (Ruiz et al., 2009), so the communities that developed on experimental panels are representative of the communities that developed on the manmade substrates in these systems. Past research indicates that manmade substrate is more susceptible to settlement by non-native species (Glasby et al., 2007; Ruiz et al., 2009; Simkanin et al., 2012).
Panels were suspended at a 1-m water depth at mean lower low water (MLLW) below docks at multiple representative sites chosen to provide comprehensive coverage within each bay (Figure 1). The deployment location for each individual panel was randomly assigned within each site. For period 1, panels were deployed across five sites per bay. For period 2, panels were deployed across nine sites per bay per year. Sites were not always the same for each year due to location accessibility (e.g., marina no longer available); however, a subset of sites did overlap between periods 1 and 2. Sites were selected to ensure the geographic spread of panels. Five panels were deployed per site for each intended soak period for period 1, and 10 panels per site for period 2. Panels were deployed over a multiyear timespan from 2001 to 2004 (2001–2003 for Chesapeake Bay and San Francisco Bay and 2002–2004 for Tampa Bay; period 1; Table 1) and again, for the summer season only, from 2012 to 2018 (2012, 2014, and 2017 for Chesapeake Bay and San Francisco Bay and 2012, 2014, and 2018 for Tampa Bay; period 2; Table 1). Ideally, for period 1, we would have deployed the panels across the three bays for the same years in order to remove temporal discrepancy as a rationale for the differences measured. However, the personnel requirements for deployment and retrieval prevented this.
As shown in Table 1, for the 2001–2004 (period 1) deployments, panels were systematically deployed and retrieved to compare communities across different recruitment windows over the four seasons (see below) and to assess successional community development through a planned increase in soak time (1, 3, 6, 18, and 30 months). All successional panels were deployed in the first deployment event in the period 1 surveys (spring of the first year of the 3-year cycle) and retrieved according to soak time. For period 2, only 3-month summer panels were deployed over 3 years. The 3-month panels in period 1 were deployed on an approximately seasonal basis (see Table 1): spring = deployed in February and retrieved in May, summer = deployed in May and retrieved in August, fall = deployed in August and retrieved in November, and winter = deployed in November and retrieved in February. All panels from 2012 to 2018 (period 2) were deployed in the summer season only.
Upon retrieval, all sessile macrofauna were identified by taxonomic experts while the organisms were still alive, pre-preservation. Percent cover estimates of major taxonomic groups (referred to as functional groups in this paper) were conducted by identifying individual organisms attached to the panel directly underneath grid intersections on an evenly spaced point count grid to the lowest possible taxonomic level. Unoccupied points were recorded as bare space. Points with one or more organisms atop another were recorded as secondary or even tertiary cover. The percentage cover of secondary settlers (i.e., organisms settling on another organism and not directly to the panel), which for the purposes of this study were analyzed as either present or absent and not according to a functional group, was used to develop the overall frequency of secondary settlement. Following live analysis, all panels were preserved in 10% buffered formalin for 24 h and then transferred into 70% ethanol for storage. This process was intended to preserve all associated organisms for further analysis.
After identification, each species was assigned to a broader functional group: Bivalvia, Bryozoa (encrusting), Bryozoa (erect), Cirripedia, Cnidaria (excluding Hydrozoa), Hydrozoa, Porifera, Tunicata (colonial), Tunicata (solitary), Polychaeta (calcareous), and Polychaeta (noncalcareous). An additional group representing visually unoccupied space with no visible macrofauna on the panels was labeled as “bare.”
Environmental data including salinity and temperature were measured using a YSI handheld meter at each site within each bay at 0-, 1-, and 2-M depth every time panels were deployed or retrieved. In addition, temperature and salinity data from standardized sampling programs in each bay were consulted for the relevant time periods (Beck et al., 2020; Schraga et al., 2020; NERRS, 2022).
To take into account community variability across sites, the site represents the statistical unit of replication within each bay. Percent cover was standardized as the total points recorded per functional group divided by the total number of points across all panels from each site for each retrieval period. Five sites were surveyed per time period during period 1 and nine sites during period 2 due to the loss of one site. For Figure 5B, the total percent cover per bay per year (vs. per site) was used to investigate graphically how communities change over time with Primer+ (PRIMER 6.1.10; Clarke and Gorley, 2006).
Multivariate statistical analyses were used to compare 3-month summer communities among bays (for all bays: five sites surveyed for 3 years in period 1, nine sites surveyed for 3 years in period 2; n = 42 per bay) and how soak time affected community composition on each panel (period 1: within each bay: five sites surveyed over four time periods; n = 20). Community composition was assessed after a square root transformation using hierarchical clustering and non-metric multidimensional scaling (nMDS) based on a Bray–Curtis similarity matrix (Clarke, 1993; Bray and Curtis, 1957; Clarke and Warwick, 2001) using the metaMDS function in the vegan package (Oksanen et al., 2020) in R version 4.0.2 (R Core Team, 2020).
The similarity percentage procedure (SIMPER function in the vegan package) was used to calculate the percent similarity of functional group composition and to determine which groups were primary contributors to the similarities in fouling communities according to the questions posed. SIMPER was also used to calculate the dissimilarity of community composition, where 0% indicates no difference and 100% indicates maximum difference, and to determine which functional group contributed the most to the differences in the fouling community.
Permutational multivariate analysis of variance (PERMANOVA—adonis2 function in the vegan package) was used to test the null hypothesis of no difference in functional group assemblage among bays. After initial tests, pairwise comparisons of each bay were also performed using a pairwise Adonis package in R (Arbizu, 2017). Percent cover of bare space and the total amount of secondary settlement were compared between bays by 1- and 3-month soak times using Kruskal–Wallis (KW) tests due to the non-parametric nature of percent cover data. To ensure equal replication, these comparisons were only limited to period 1 data. These analyses, along with a pairwise Wilcoxon test, were completed in R using the stats package (R Core Team, 2020). Although seasons are graphically depicted, only statistical difference by the bay was determined.
Space occupation varied on the 1- and 3-month panels among all three bays examined. Less space was occupied in San Francisco Bay, especially in the winter (Figures 3, 4; Table 2). Each bay’s percentage of bare space after 1 month is significantly different from each of the others (Figure 3; KW test, p < 0.001; Wilcoxon test, p < 0.05). San Francisco Bay had the highest average bare space for the repeated 1-month deployments; Tampa Bay had the lowest amount of bare space, whereas Chesapeake Bay had the largest variability in available bare space (Figures 3, 4). Tampa Bay has the least variability in the availability of bare space throughout the year, as evidenced in both the 1- and 3-month panels (Figures 3, 4). At 3 months, only San Francisco Bay and Chesapeake Bay remained significantly different in the amount of bare space (Wilcoxon test p = 0.03), although the bare space in Tampa Bay was still less than that in San Francisco Bay. Chesapeake Bay and San Francisco Bay have higher recruitment during summer with much less recruitment in winter (Figure 4).
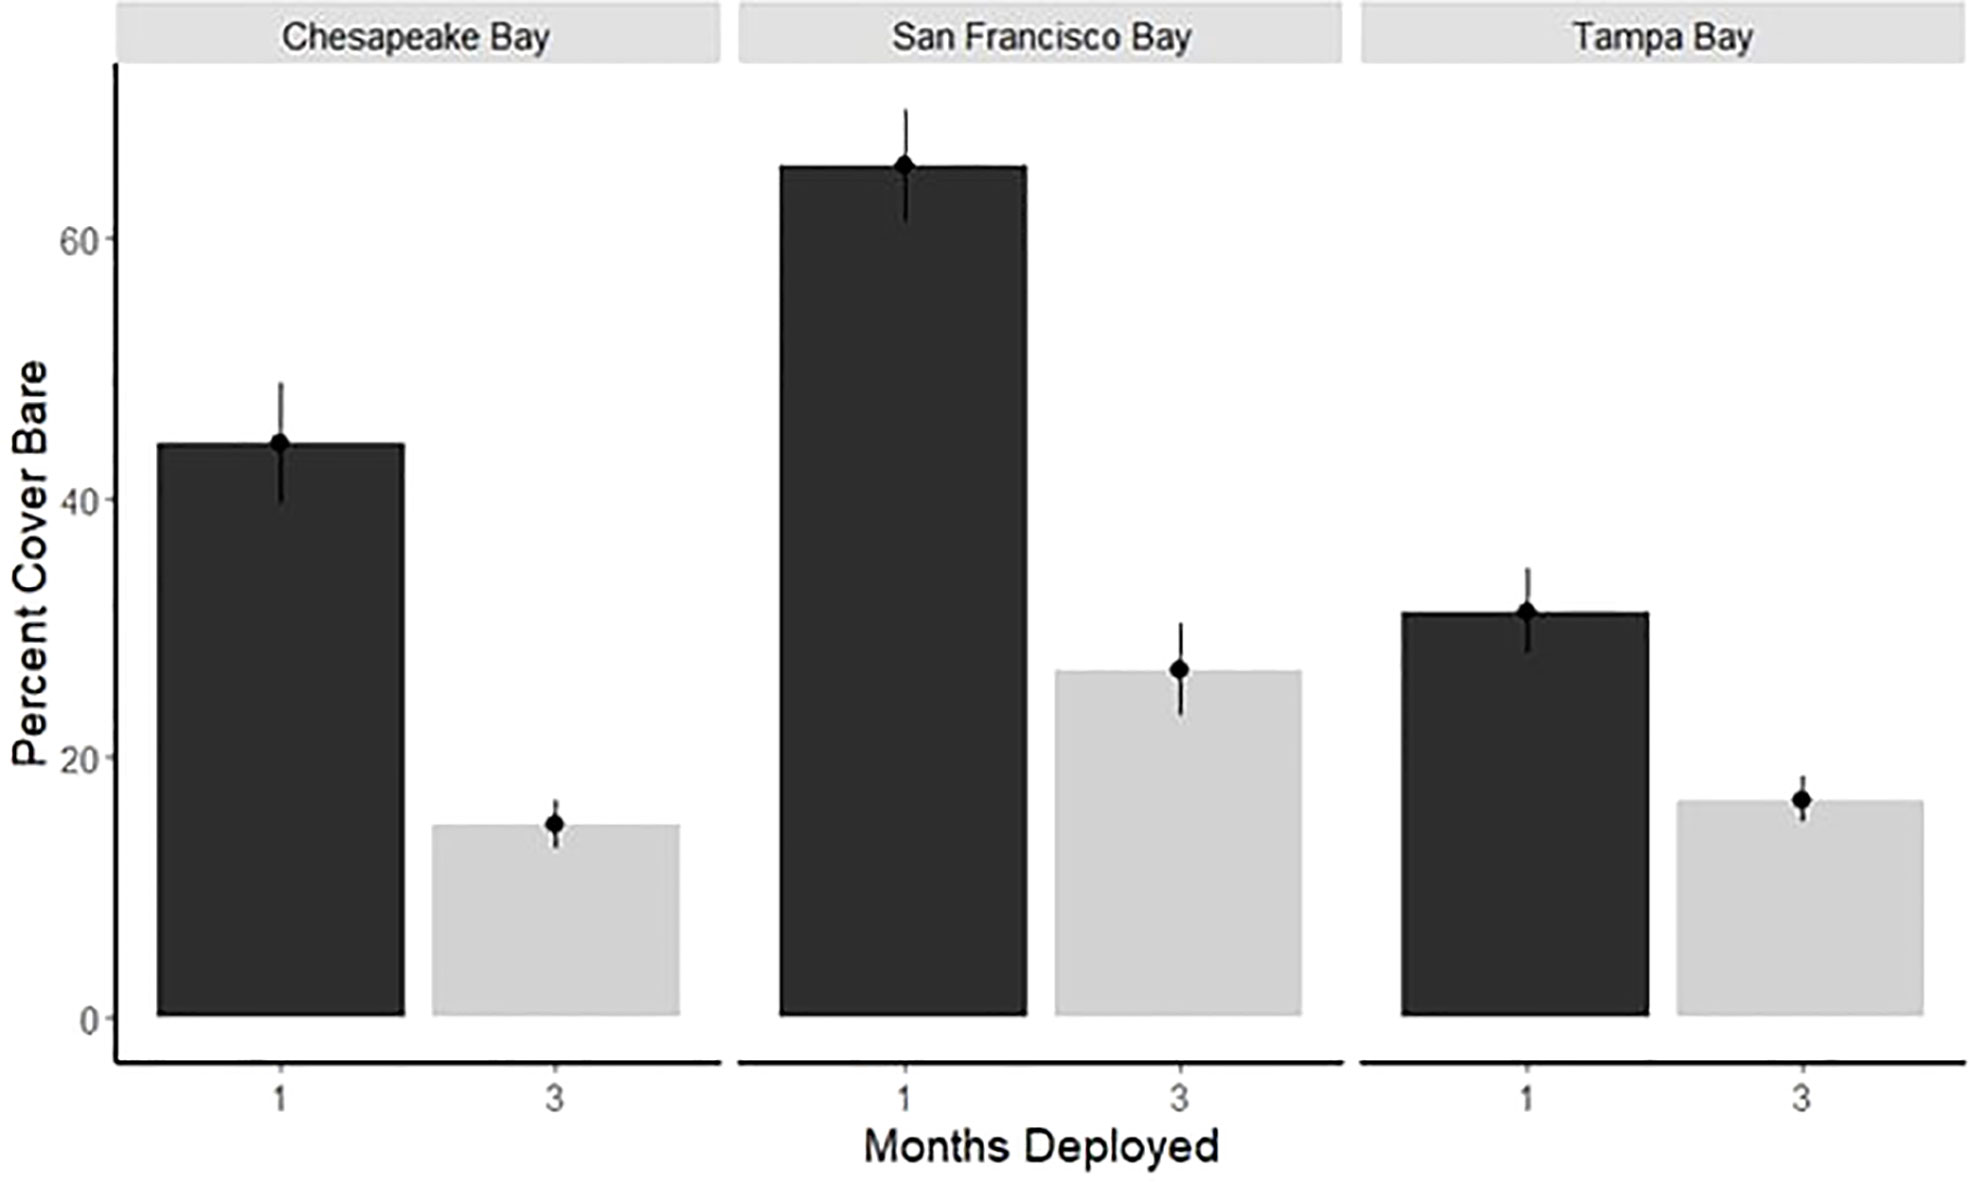
Figure 3 Average percent cover (± SE) of bare space by bay for 1- and 3-month panels deployed during period 1 only.
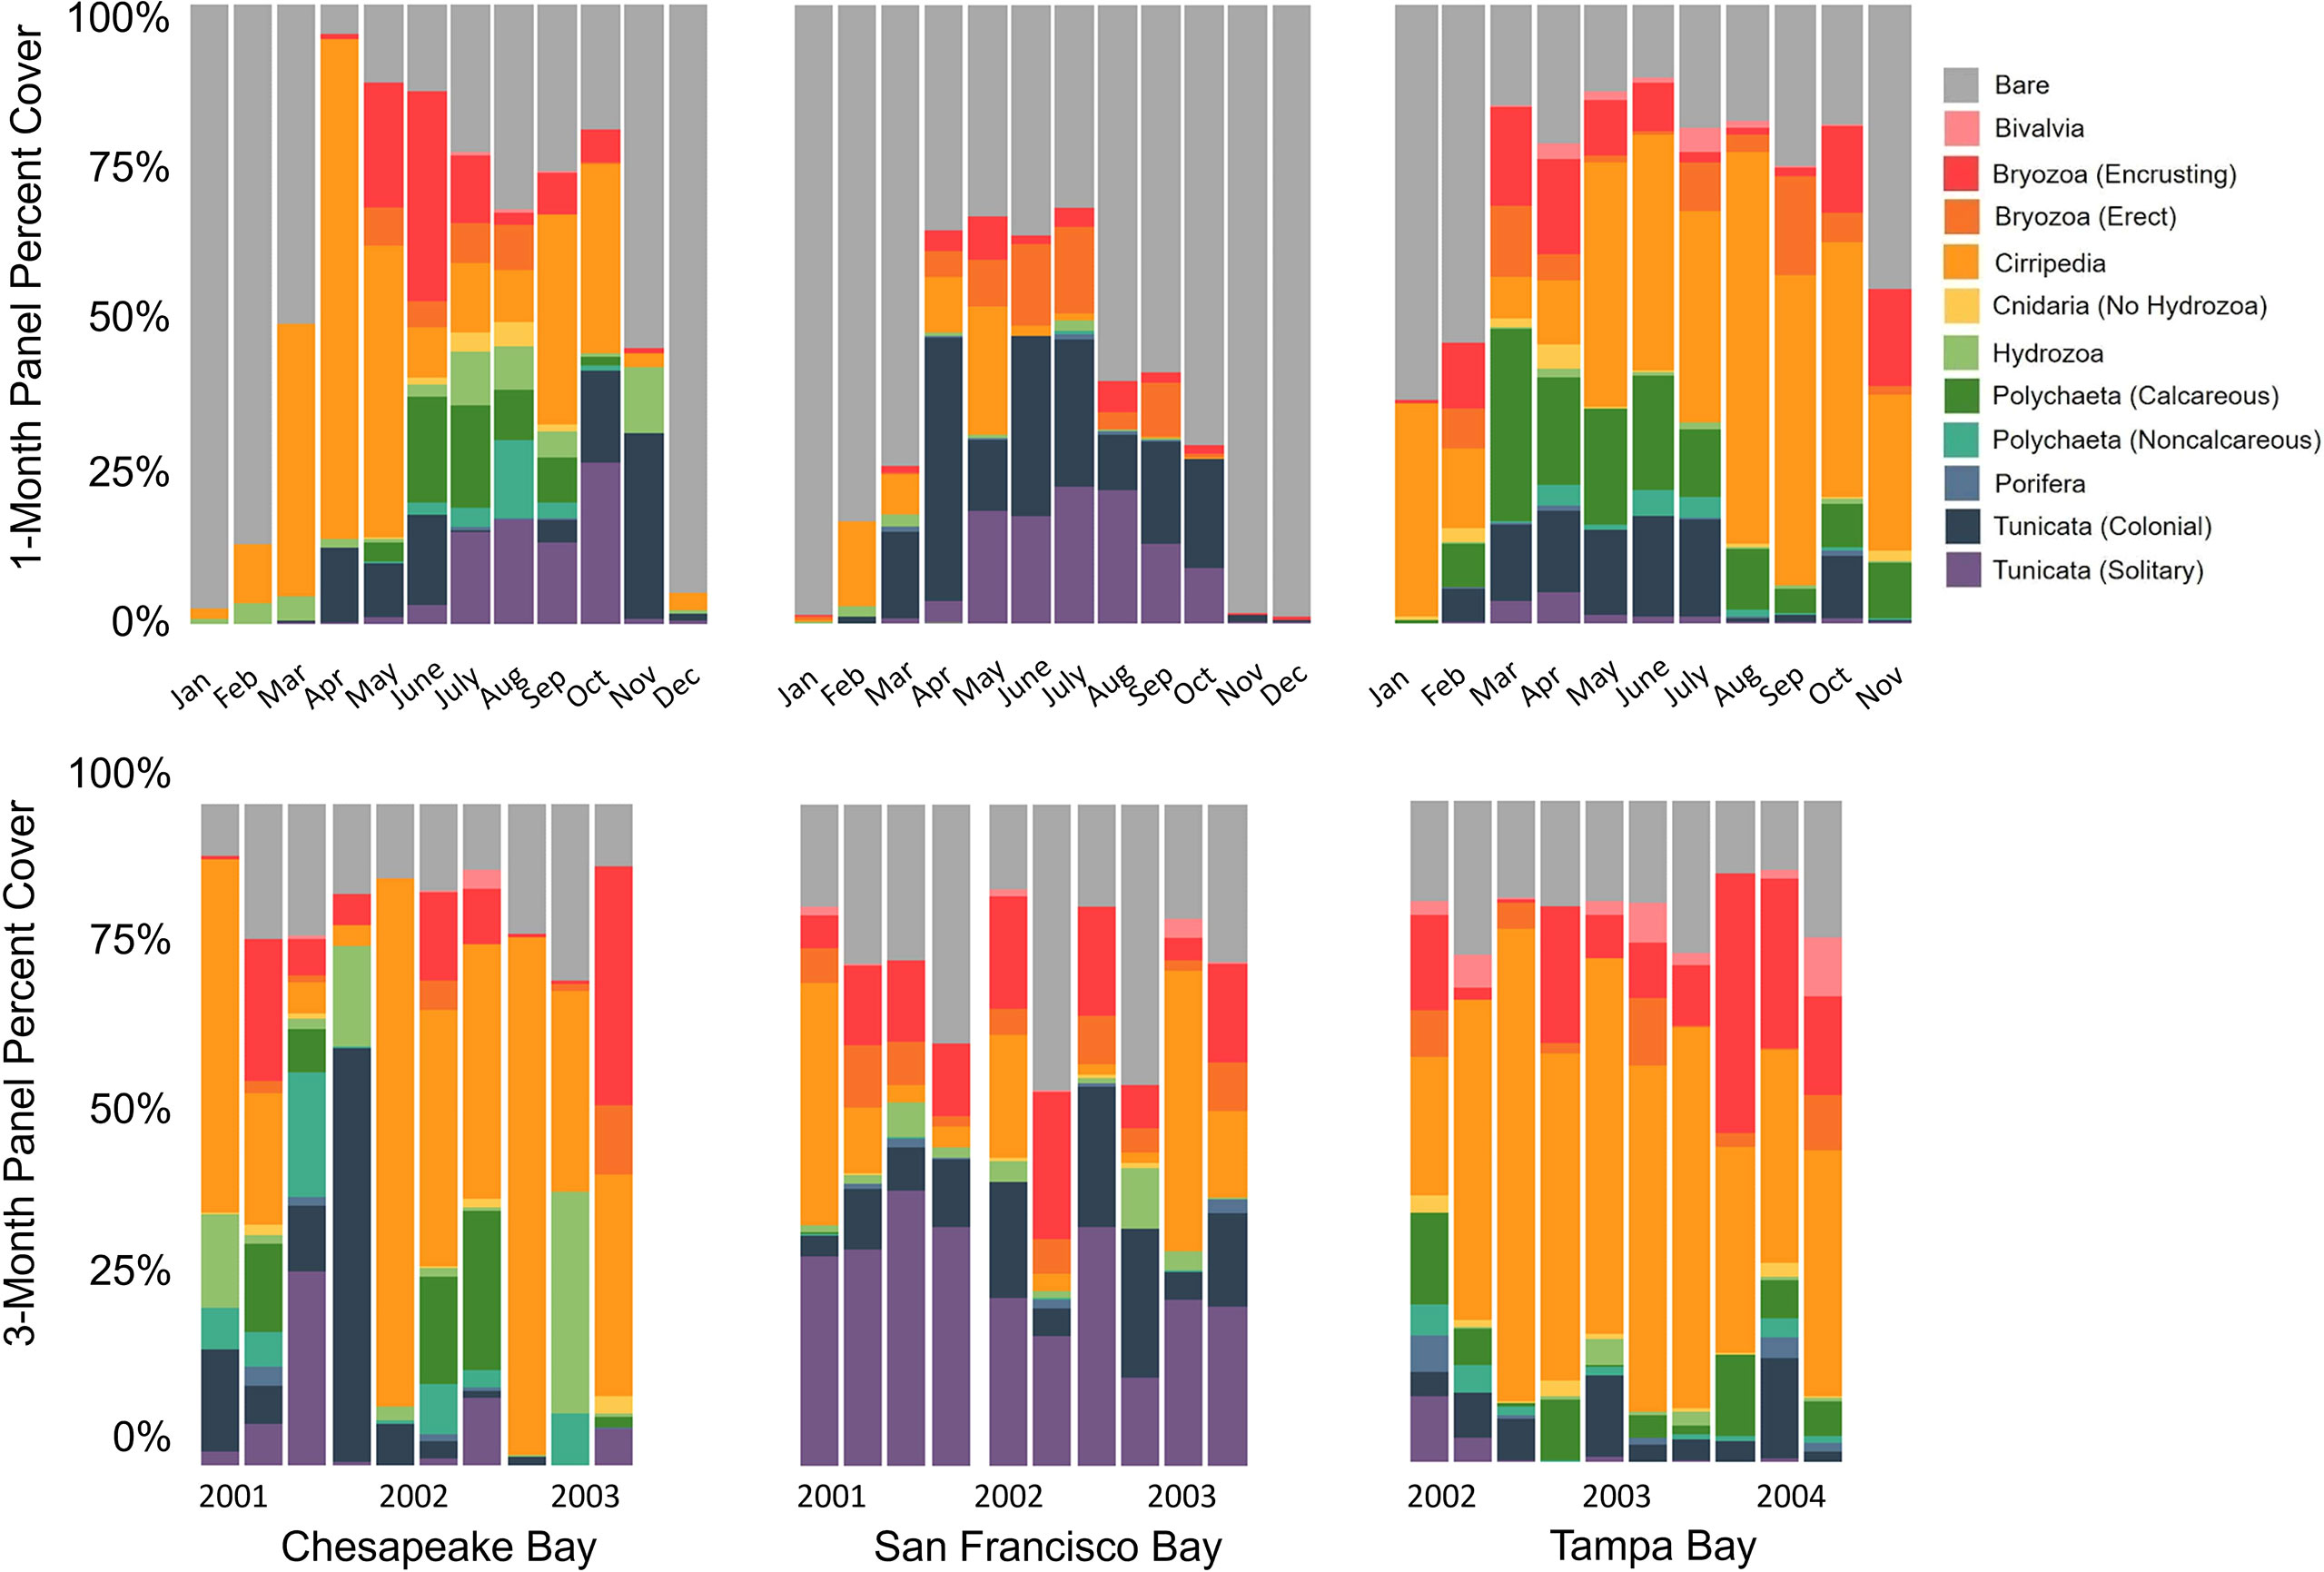
Figure 4 Average percent cover of 1-month (top) and 3-month (bottom) panels deployed over the course of period 1 in Chesapeake Bay, San Francisco Bay, and Tampa Bay (see Table 1 for deployment and retrieval schedule).
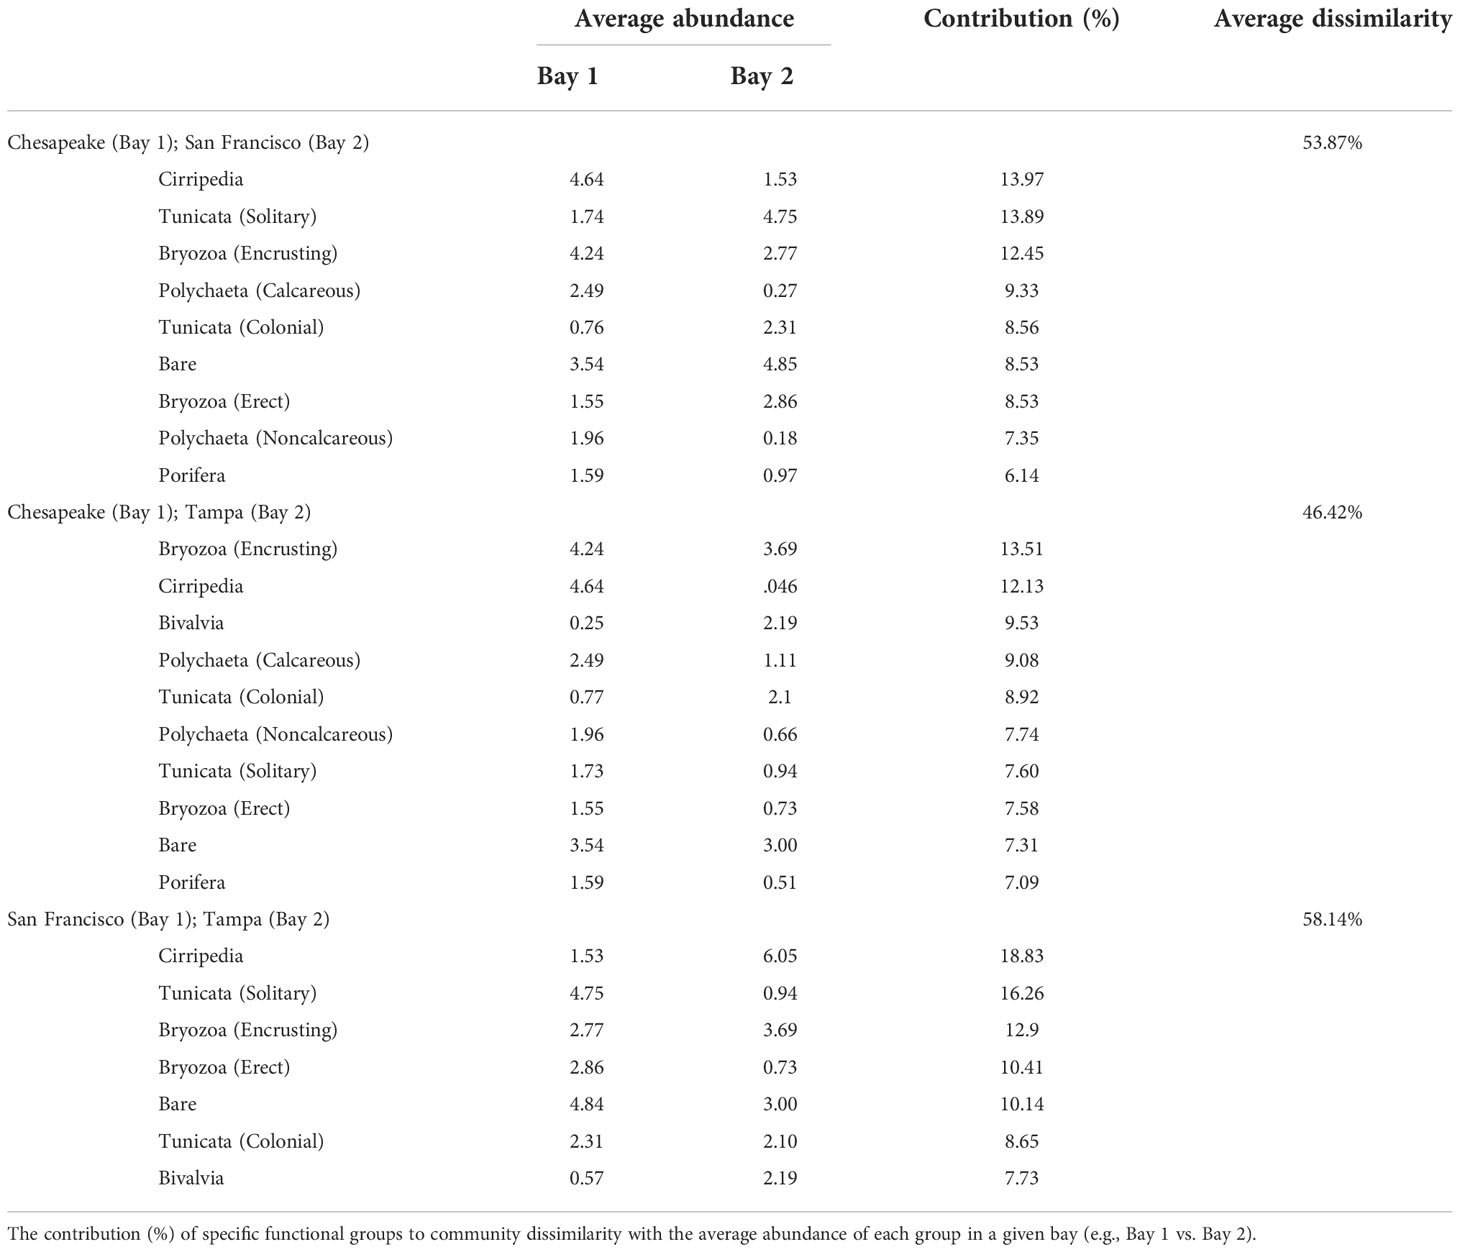
Table 2 SIMPER dissimilarity (%) of functional community composition of differing bays (Chesapeake, San Francisco, and Tampa) for the summer-deployed panels only deployed across periods 1 and 2.
In San Francisco Bay, the fouling community had a remarkably large proportion of solitary Tunicata in comparison to Tampa Bay and Chesapeake Bay, which is especially evident in the 3-month panels (Figure 4). Almost all solitary Tunicata recorded in San Francisco Bay were non-native species (Ruiz and Geller, 2018; Fofonoff et al., 2018) and were relatively abundant in all seasons.
Hierarchical clustering and non-metric multidimensional (nMDS) ordination of community composition based on functional groups in each bay comparing the 3-month spring/summer high recruitment period for all study years depicted bay-specific clustering, with Tampa Bay and Chesapeake Bay having slight overlap (three dimensions, stress = 0.13; Figure 5A). An additional figure (Figure 5B) was generated using Primer to provide graphical insight into changes over the years within and across bays. In this case, the total percent cover for the entire bay per year was used as the analysis unit. Notably, 2017 for San Francisco Bay and 2003 for Chesapeake Bay and Tampa Bay were outliers, which could be attributed to lower salinity experienced in those regions during these particular years (NERRS, 2022; Figures 5B, 6). Even though the period 1 offset in deployment years between Tampa Bay and the other two bays was not ideal, it did give us the opportunity to see that the community in Tampa Bay, which was likely disturbed by low salinity conditions in 2003, appeared to be reverting to the longer-term community structure by 2004 (Figure 5B). If we had deployed across the same 3 years as San Francisco Bay and Chesapeake Bay, we would not have had that additional year of insight.
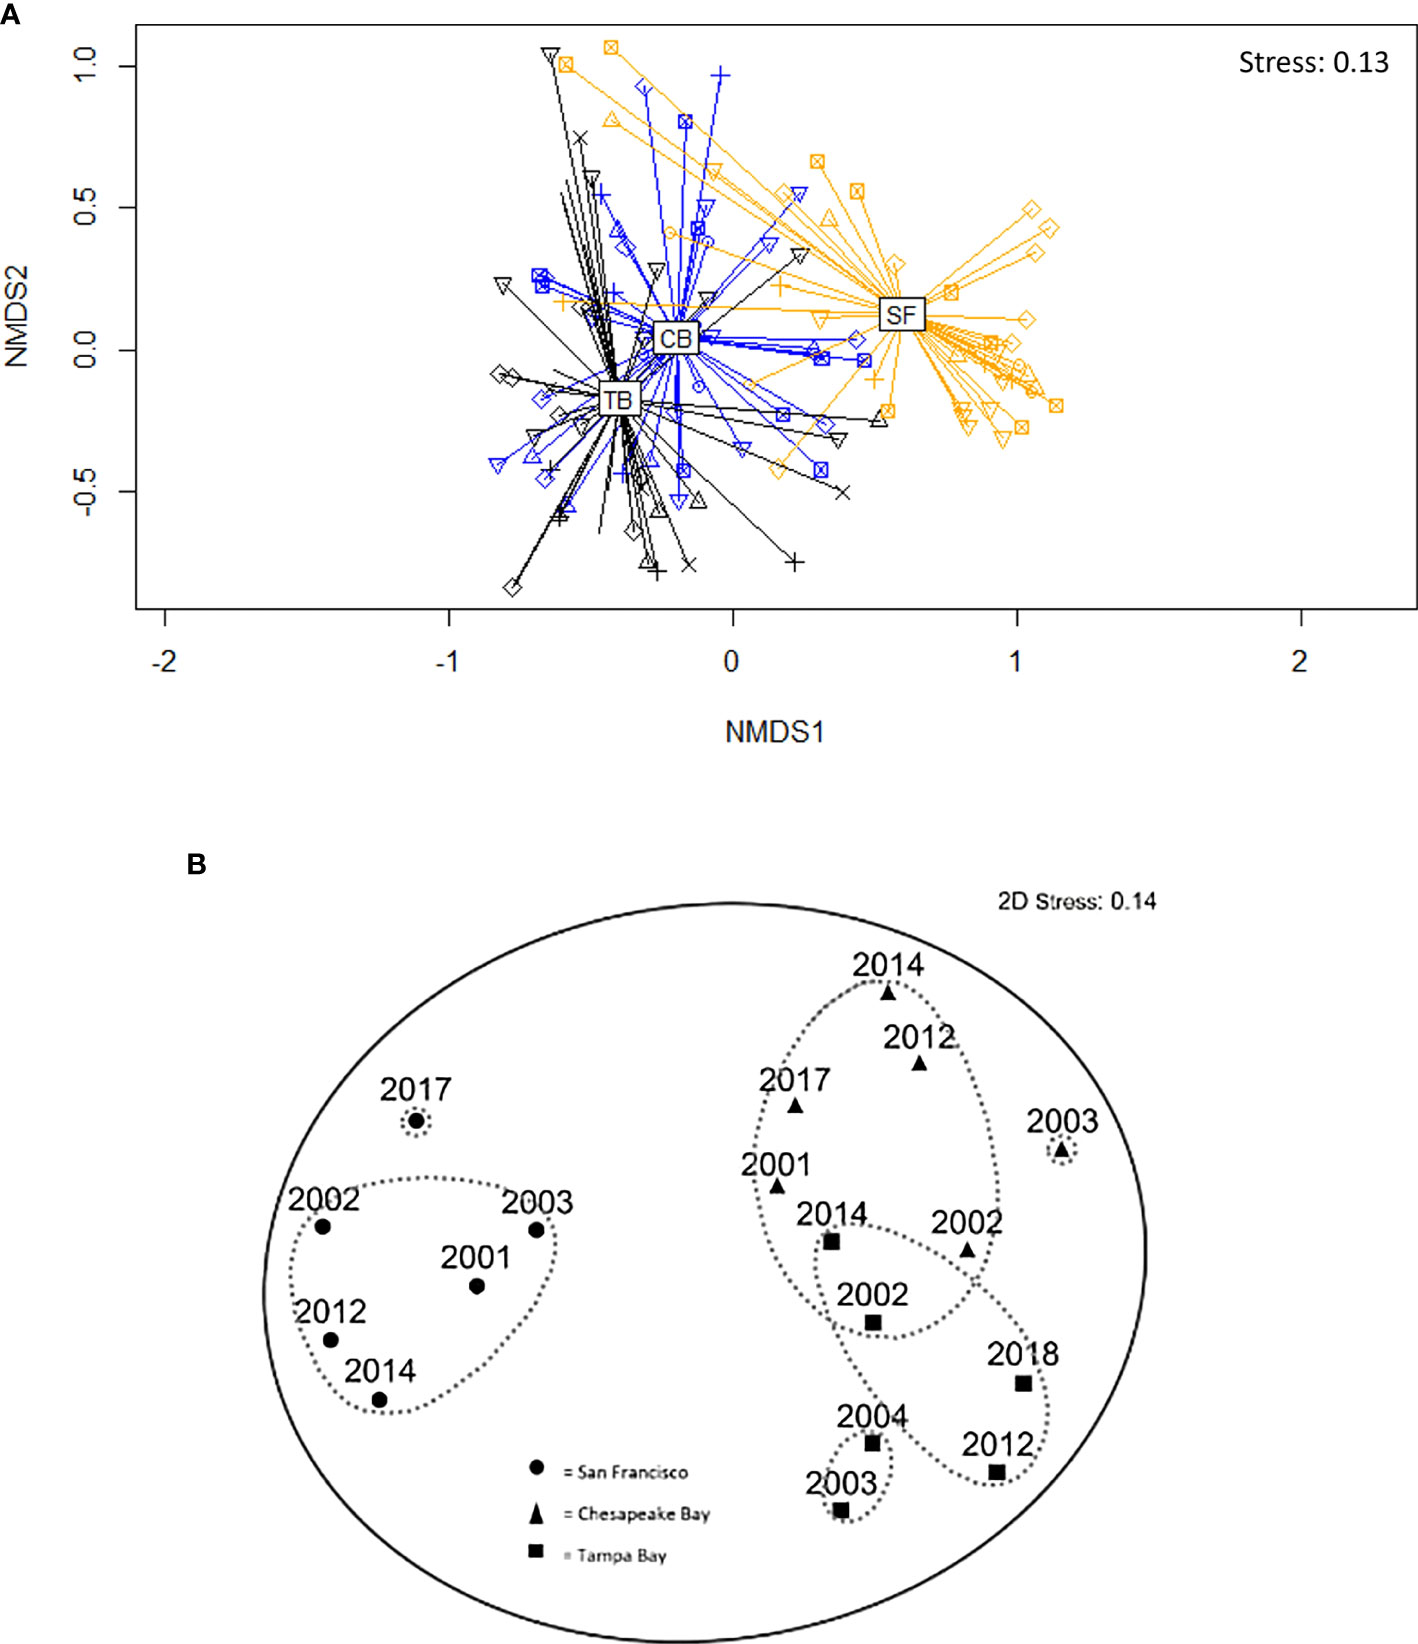
Figure 5 Nonmetric multidimensional (nMDS) ordinations of Bray–Curtis distance dissimilarity matrices of 3-month summer panels: (A) Chesapeake Bay (blue), San Francisco Bay (yellow), and Tampa Bay (black) with shapes representing different years of sampling effort and each point representing one site (using R). (B) Chesapeake Bay (triangles), San Francisco Bay (circles), and Tampa Bay (squares), with each point representing 1 year integrated across sites and contours indicating levels of similarity between bays (dashed-gray line, 80%; solid line gray, 60%) (using Primer).
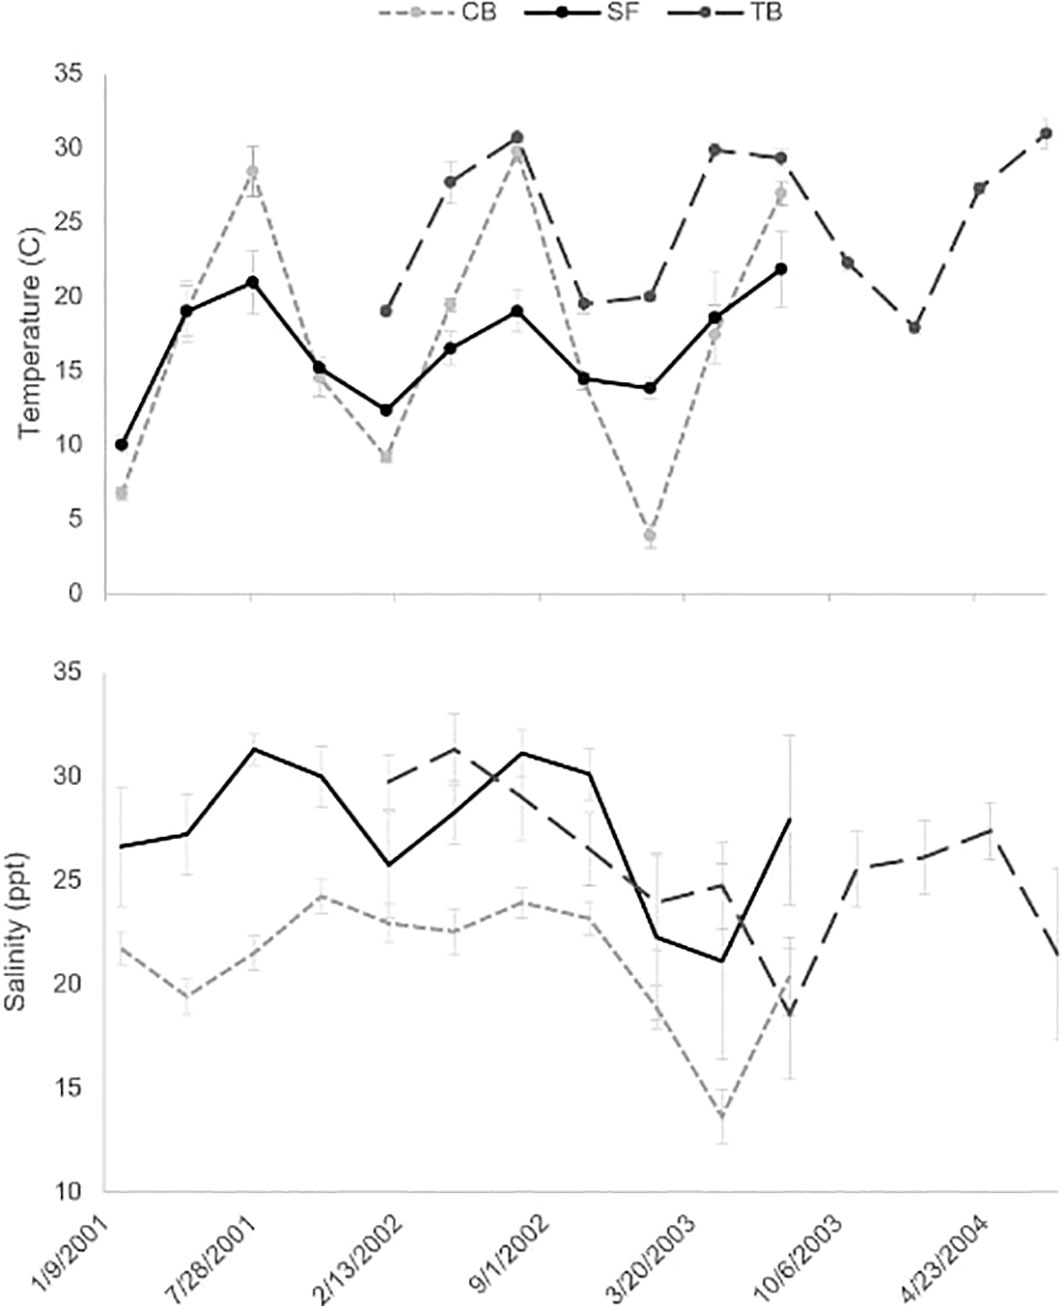
Figure 6 Average temperature (°C; top) and salinity (ppt; bottom) as measured during quarterly deployments (± SD) during period 1 for Chesapeake Bay ((CB) light gray circle with dashed line), San Francisco Bay ((SF) dark circle with line), and Tampa Bay ((TB) medium gray circle with dashed line). Measurements were taken at 0-, 1-, and 2-M depths at each site and then averaged across sites and depths for each bay.
PERMANOVA results indicated a significant difference in functional taxonomic groups by the bay (r2 = 0.28, p = 0.001); thus, pairwise PERMANOVAs were performed to determine how community composition differed between bays (Table 2). These indicated varying strength of bay-specific signatures when 3-month (summer only) panels over all years were compared, though each bay remained significantly different in composition to the other bays (p = 0.003 in all analyses). Community assemblage differences between San Francisco Bay and each of the two Atlantic coast bays were higher [vs. Chesapeake Bay (r2 = 0.24); vs. Tampa Bay (r2 = 0.30)] than between the two Atlantic coast bays (r2 = 0.11). Further examination of among-bay differences in functional group composition during 3-month soak times using similarity percentages (SIMPER) was in accord with the PERMANOVA result, showing that greater average dissimilarity between San Francisco Bay and each of the two East Coast bays than between the two East Coast bays (Table 2).
Each bay had a strong signature community that was evident over all the years sampled in this study (Figures 5A, 7). SIMPER analyses of 3-month panels showed that Cirripedia and Tunicata are responsible for much of the community composition differences (10% or more of the dissimilarity) among East and West Coast bays (Table 2) with Cirripedia dominating the East Coast communities and Tunicata notably dominant in San Francisco Bay. A higher cover of Bivalvia and Cirripedia distinguishes Tampa Bay from Chesapeake Bay (Table 2). A higher cover of polychaetes (calcareous and non-calcareous) distinguished Chesapeake Bay from Tampa Bay and San Francisco Bay, with higher abundances of both functional groups overall in Chesapeake Bay (Table 2; Figure 7). A larger proportion of bare space in San Francisco Bay contributes 10% of the community dissimilarity between San Francisco Bay and Tampa Bay, and nearly 9% between San Francisco Bay and Chesapeake Bay, while only representing 7% of the dissimilarity between Tampa Bay and Chesapeake Bay (Table 2).
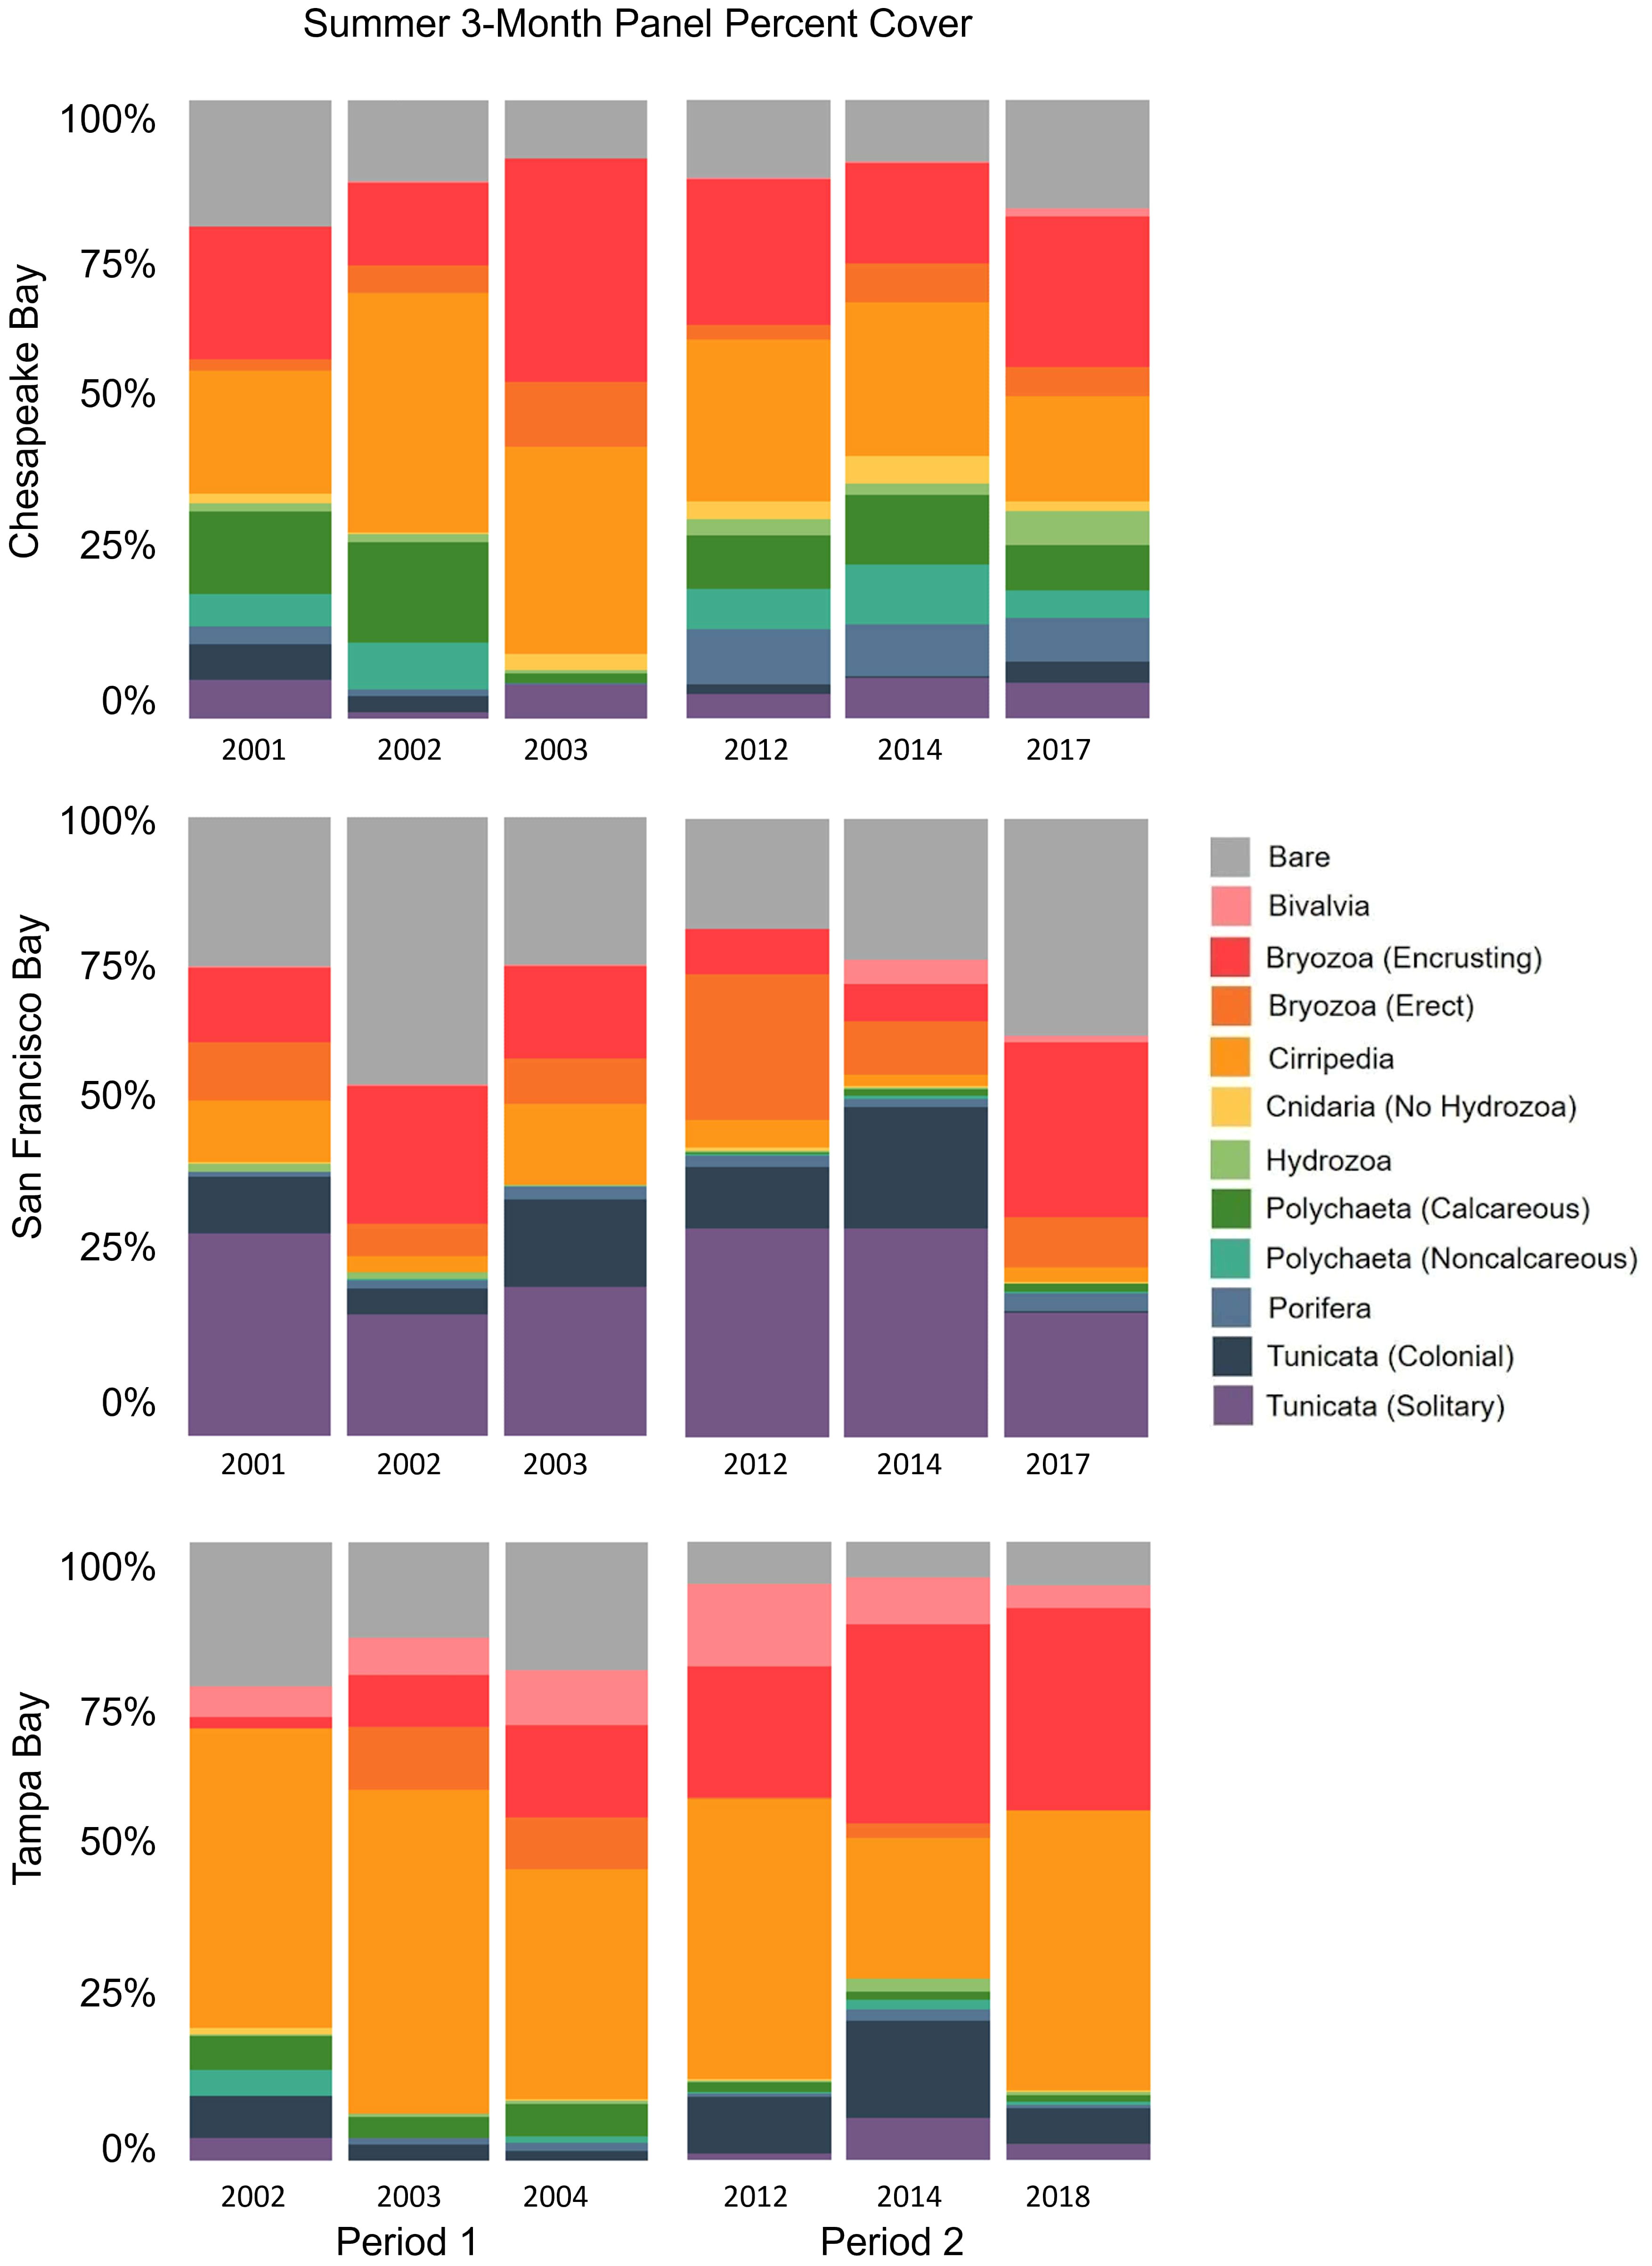
Figure 7 Total percent cover of major functional groups after 3-month summer deployment—comparing periods 1 and 2.
Secondary settlement (i.e., settlement directly on top of the organisms that formed the primary cover) varied significantly by bay as well (KW test, p < 0.001), with San Francisco Bay having the lowest average percent of secondary cover in every season (Figure 8). All bays were significantly different from one another in secondary settlement (Wilcoxon test, p < 0.001 for all).
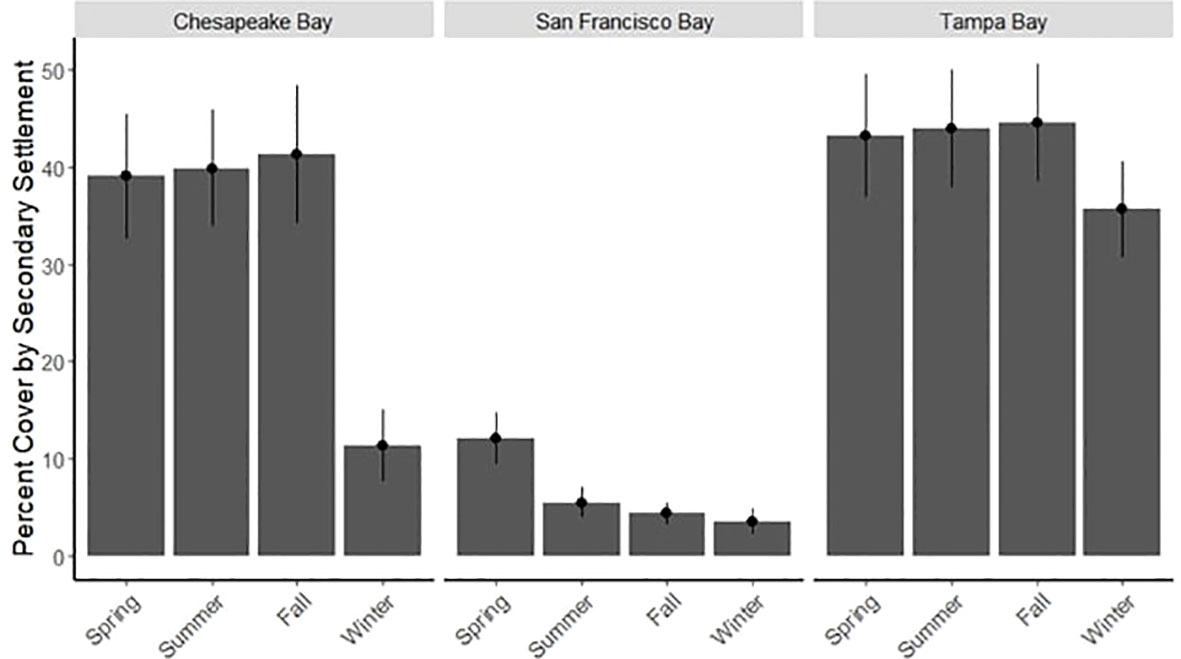
Figure 8 Average seasonal secondary percent cover by bay (± SE) for 3-month panels deployed during period 1 only.
Although there were notable differences among these three bays, especially at the 1- and 3-month soak times (Figure 4), invertebrate communities became more similar and collected more species as soak time increased, with different functional groups becoming dominant space occupiers depending on the bay (Figure 9). SIMPER comparisons of soak time performed on data from each individual bay showed that the greatest community differences existed between the 3- and 18- and -3 and 30-month panels regardless of the bay, with 46% or greater dissimilarity. Regardless of the bay, the community differences after 6 months (6 vs. 18, 6 vs. 30) were generally less, with the least difference in community composition between 18 and 30 months despite this being a 12-month period (Table 3).
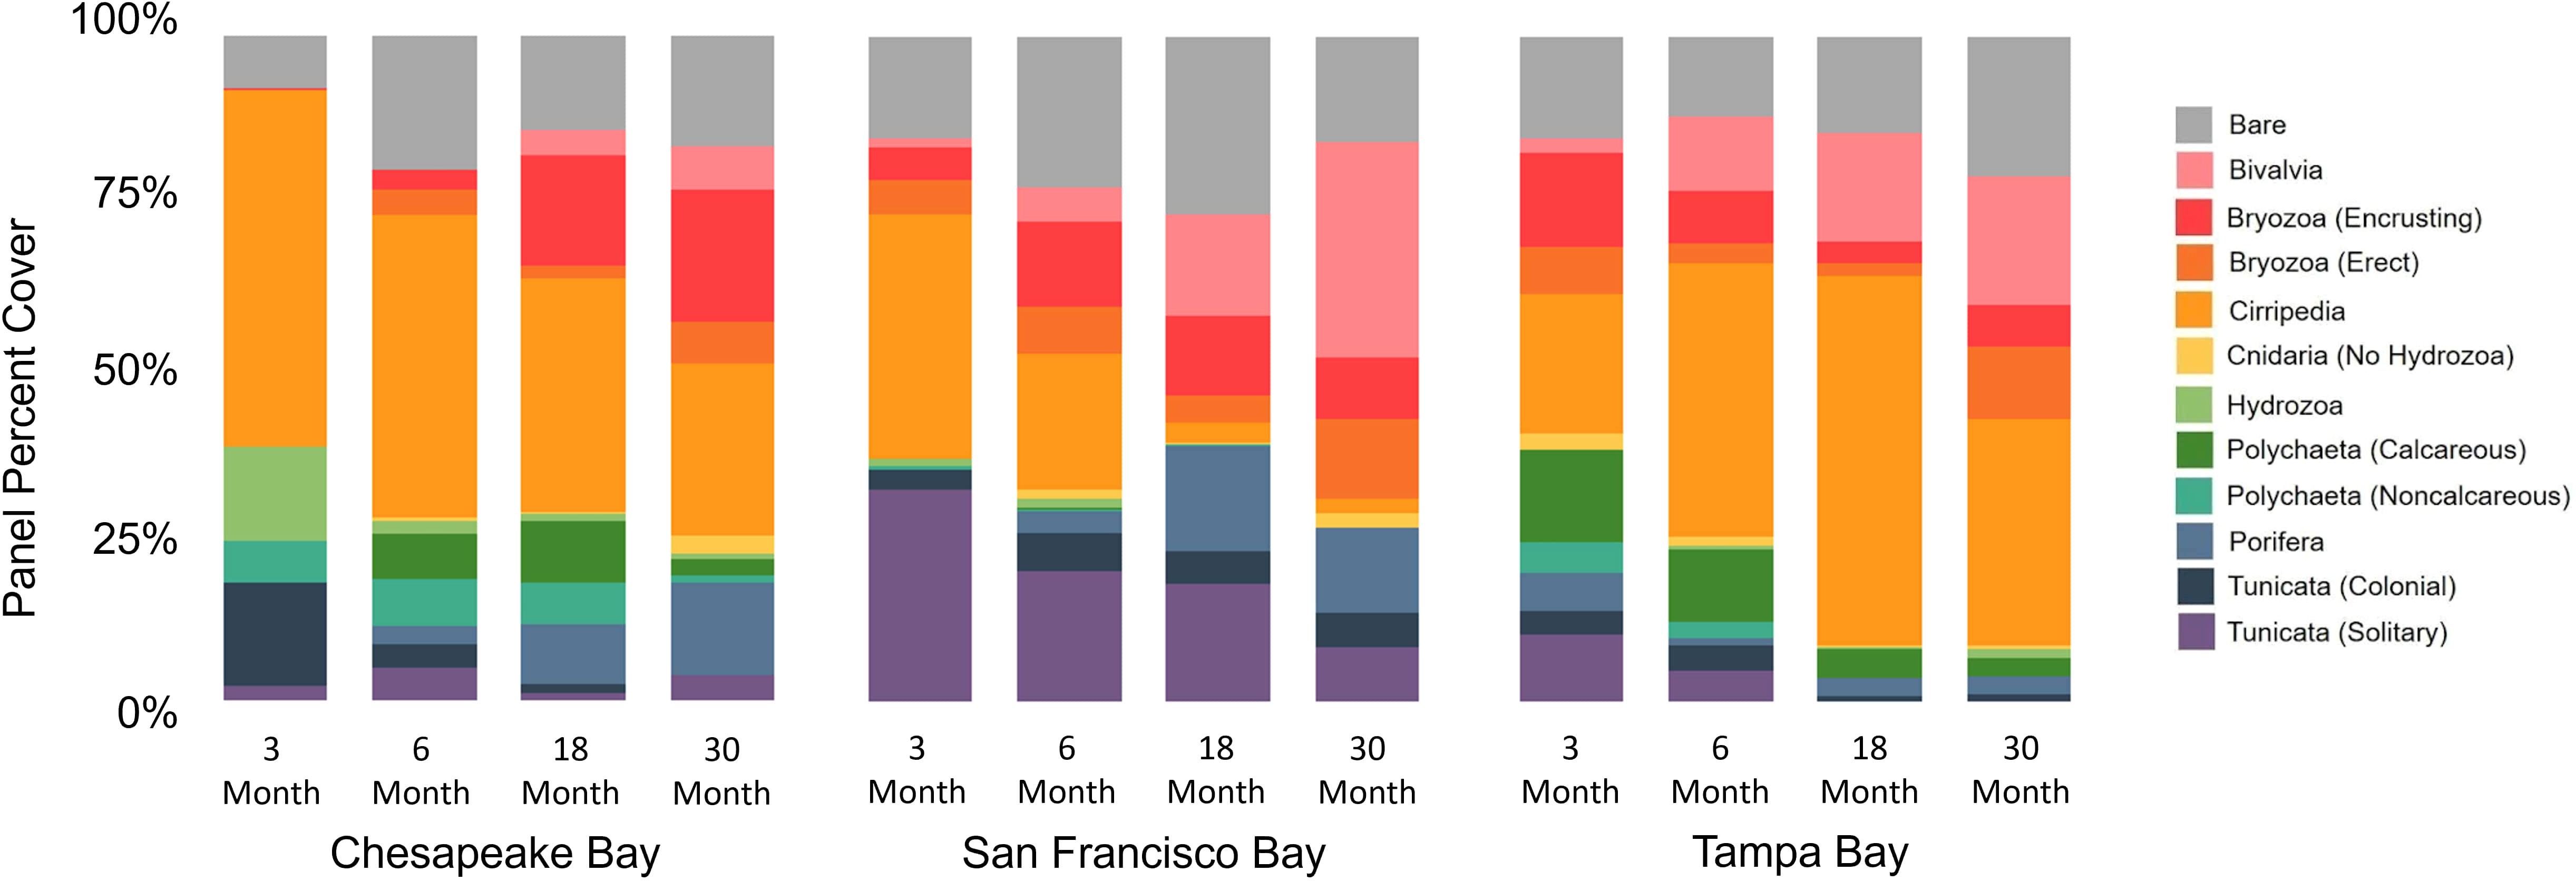
Figure 9 Successional average percent cover of major functional groups by increasing soak time across bays. Only panels deployed in period 1 and deployment 1 (see Table 1) are included.
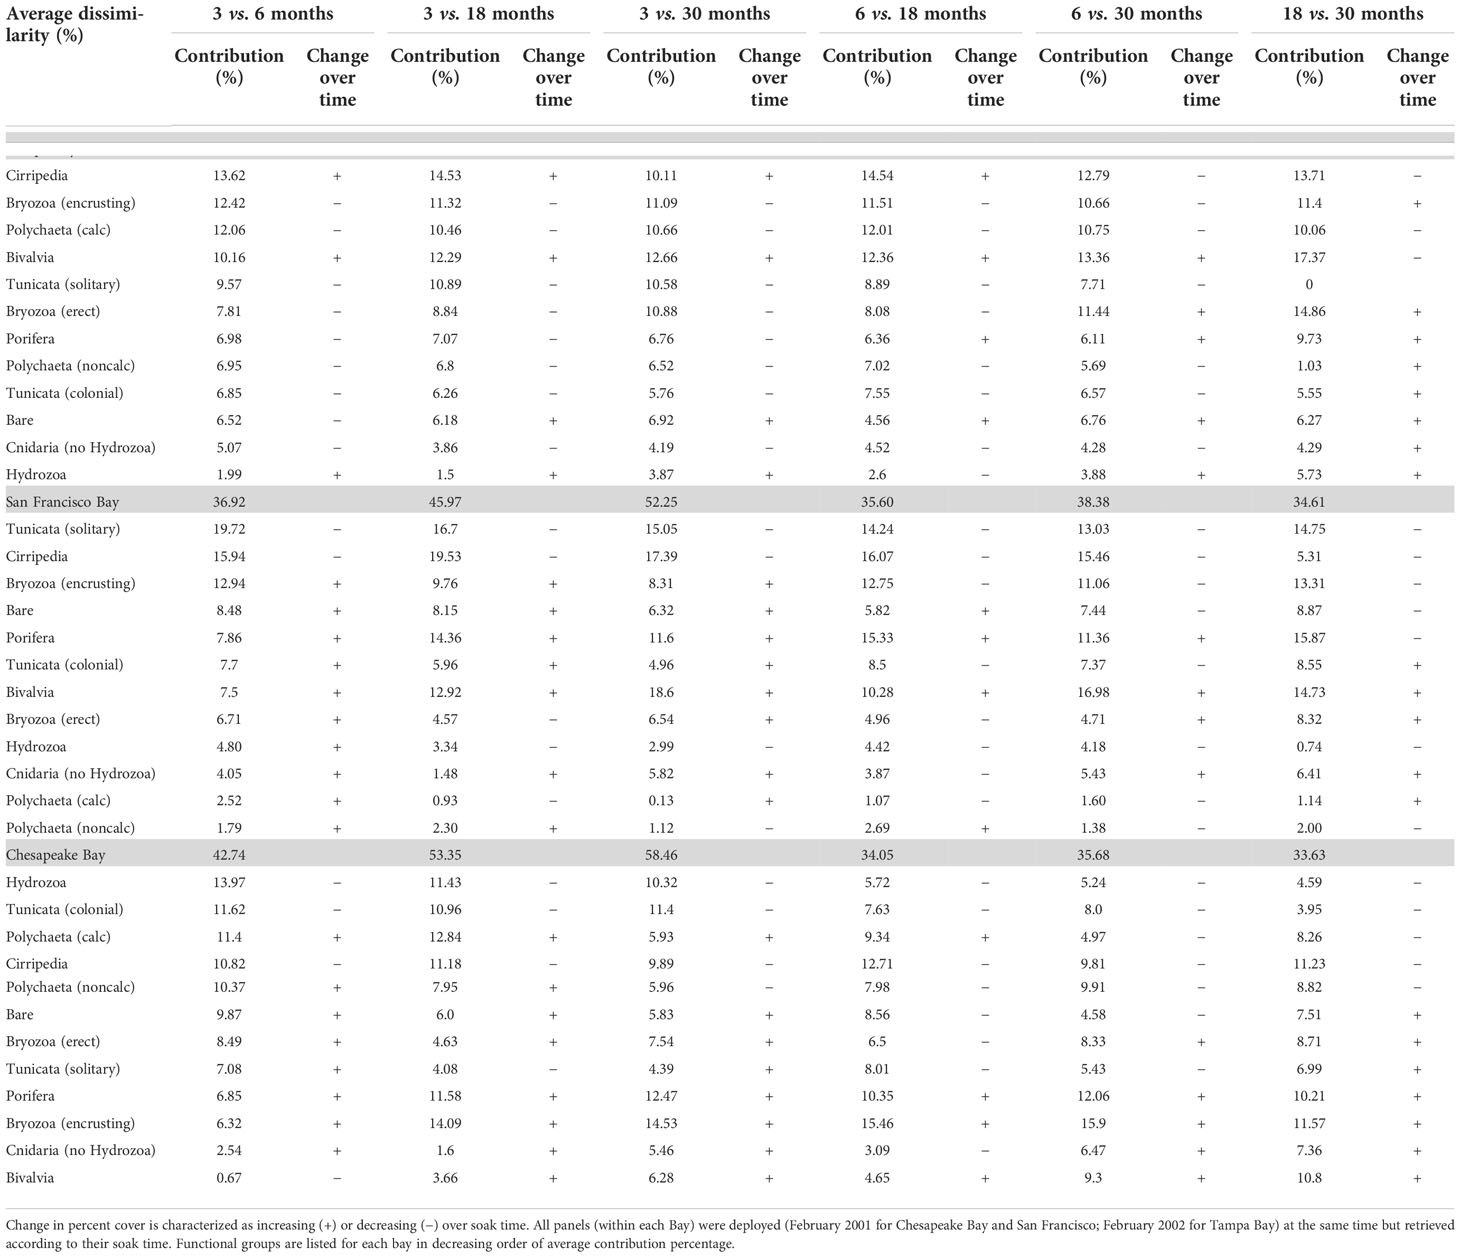
Table 3 Average SIMPER dissimilarity (%) of functional community composition by Bay-specific functional groups deployed for 3-, 6-, 18-, and 30-month residence times (period 1).
Analysis of the community composition over time shows that functional groups that settled early did not necessarily dominate space in the long term. Given that all the panels for the community succession analysis were deployed in the same period, the early recruits may have been favored to dominate the community, but this did not happen consistently across bays. Cirripedia space occupation increased with time in Tampa Bay, but it decreased in San Francisco Bay and Chesapeake Bay (Figure 9; Table 3). Encrusting Bryozoa were important space occupiers in all three bays, but more as early settlers in San Francisco Bay and as persistent long-term space occupiers in Chesapeake Bay. Bivalvia had higher cover with longer soak times in all three bays except for Tampa Bay, where it lost cover in the last 12 months of the deployment. Porifera had higher cover with longer soak times in Chesapeake Bay but lost cover in the last 12 months in San Francisco Bay. Solitary Tunicata were important space occupiers for all soak times in San Francisco Bay. This taxonomic group was not a significant or persistent space occupier in either Chesapeake Bay or Tampa Bay. Tunicata mostly lost cover as soak times increased in all bays, including San Francisco Bay (Table 3; Figure 9). Hydrozoa and colonial Tunicata were important early recruiters in Chesapeake Bay (Table 3; Figure 9). The calcareous Polychaeta distinguished Chesapeake Bay from San Francisco Bay and Tampa Bay at 3 months (Table 2), were important only as early recruiters in Tampa Bay, but conversely grew in cover in Chesapeake Bay for up to 18 months before losing cover in the last year (Table 3). Bare space fluctuated over time in all three bays (Figure 9; Table 3).
San Francisco Bay experienced more moderate water temperature fluctuations than either Tampa Bay or Chesapeake Bay, with temperatures ranging from approximately 10°C in February to only 20°C in August. Water temperatures in Chesapeake Bay varied the most, from 5°C in February to 30°C in August during the course of period 1 of this study. Tampa Bay was warmer on average, with a smaller annual water temperature range from 17°C in February to 30°C in August. Salinities did not differ dramatically between the three bays. In San Francisco Bay, salinities averaged across sites ranged from about 20 to 30 ppt. In Chesapeake Bay, salinities ranged between 20 and 25 ppt with unusually low salinities (15 ppt) measured in August 2003. Finally, salinities in Tampa Bay ranged between 25 and 30 ppt averaged across sites, with a dip in November 2003 to 20 ppt (Figure 6). During period 2, data indicate similar trends to those recorded during period 1; however, San Francisco Bay experienced an extended period of increased freshwater in early 2017, which likely accounts for the change in community composition that summer (Figure 5B; Schraga et al., 2020).
This broad-scale, temporal field study complements a larger literature synthesis of non-native species along all US coasts being conducted by the Smithsonian Marine Invasions Program (Fofonoff et al., 2018). The period 1 study ran for 30 months, exceeding recommendations in other studies for detecting trends in community development (Alden et al., 1997; Underwood and Chapman, 2006). This study finds similarities and differences across very broad spatial scales, including the relative dominance of certain functional groups. More importantly, this study clarifies the differences in community structure and roles of those functional groups through successive stages of community development and space occupation by geography. This study explored why San Francisco Bay may have more non-native species than other bays and discovered consistently more bare space in San Francisco Bay. Bare space provides an increased opportunity for settlement and has changed over the past 50 years, both due to increasing human shoreline development and changing space dynamics caused by the non-native Tunicata. However, exactly why bare space persists and whether it has allowed for the greater establishment of non-native species in San Francisco Bay is still speculative.
The higher rate of invasion success in San Francisco Bay (Ruiz et al., 2000) may be related to higher space availability (Marraffini and Geller, 2015; Reiter, 2020), although alternative explanations such as higher vector diversity and propagule supply have also been explored (Ruiz et al., 2011). In contrast to San Francisco Bay, recruitment in Tampa Bay was consistently higher throughout the year, rapidly filling up bare space (Figure 4). Given that almost all of the Tunicata species in San Francisco Bay are considered non-native (Figure 2), the sessile community structure may have undergone a series of dramatic shifts as new species arrived. Graham and Gay (1945) conducted a multiyear fouling survey of San Francisco Bay in which Tunicata was not even evident; however, their sampling approach differed from the one used in this study, and their panels were deployed in generally lower salinity areas of San Francisco bay where tunicates are less evident. Examining and repeating historical surveys is helpful for shedding light on how community composition may have changed as new species have arrived. In Beaufort, NC, a similar shift from a heterogeneous mix of species in the 1970s to one dominated by a solitary Tunicata today has also been documented (Theuerkauf et al., 2018). The reason for successful global invasions by various species of Tunicata likely reflects their broad tolerance of temperature and pollution, their ability to recruit opportunistically, reproduce, and grow rapidly, and their ability to colonize manmade substrates (Zhan et al., 2015). In addition, colonial Tunicata also outcompete solitary ones in wet years (Satheesh and Wesley, 2011; Chang et al., 2018).
Cirripedia, Tunicata, encrusting Bryozoa, Bivalvia, and Porifera comprise the dominant physically structuring fouling fauna in all the bays we studied, although their ability to persist as the communities developed varied in different bays, likely due to differing competition and predation dynamics. The relative dominance of largely non-native Tunicata versus Cirripedia in San Francisco as compared with Chesapeake Bay and Tampa Bay, which persisted through time (Figures 4, 9; Table 3), has not been documented previously, although both groups are recognized as dominant in many systems with the ability to influence settlement of other species (Yakovis et al., 2004; Cifuentes et al., 2007; Sams and Keough, 2012). The relative paucity of calcareous Polychaeta on the West versus East Coasts of the United States has been reported previously (Bastida-Zavala et al., 2017). Interestingly, the 3-month summer community assemblages were consistent within bays over more than 10 years (Figures 5A, B).
The lower cover of Cirripedia in San Francisco may be a reflection of the relative competitive superiority of Tunicata over Cirripedia in the abiotic and biotic conditions of this bay. Although some studies have shown that Cirripedia is effective at inhibiting recruitment of colonial (Young and Gotelli, 1988) and solitary Tunicata (Dean and Hurd, 1980), Cirripedia tend to settle earlier in the season than Tunicata in many systems (Cory, 1967; Otsuka and Dauer, 1982) and are frequently overgrown by other species as the season progresses. In some disturbance conditions, Cirripedia can maintain dominance and prevent other species from settling (Jewett et al., 2005). Cirripedia did still recruit onto panels in San Francisco, deployed from February to May; however, the cover of solitary Tunicata defined the San Francisco fouling community regardless of the community age and distinguished this community from those in Chesapeake Bay and Tampa Bay.
Ecosystem engineers are organisms that alter their physical space and, in some cases, cause change to the entire ecosystem (Crooks, 2002). In this study, the solitary and colonial Tunicata that now comprise much of the San Francisco epifaunal community are non-native and potential ecosystem engineers, which may depress species richness (Blum et al., 2007), as evidenced by the lower secondary cover there (Figure 8). In manipulative experimental studies, Tunicata have, in some cases, prevented the settlement of other species (Grosberg, 1981; Osman and Whitlatch, 1995), and in others have not (Bingham and Walters, 1989; Young, 1989; Bullard et al., 2004). It is possible that the most abundant Tunicata species in the San Francisco surveys, Ciona robusta Hoshino and Tokioka, 1967, and Ciona savignyi Herdman, 1882, successfully prevented secondary settlement (Blum et al., 2007; Dijkstra et al., 2007). Bullard et al. (2004) hypothesized that tunicates may emit deterrent compounds as juveniles that are not emitted as adults. In any event, the transition from a community historically dominated by Cirripedia and Polychaeta (Graham and Gay, 1945) to one dominated by non-native Tunicata is a drastic change in community composition and may have many more unknown impacts on the ecological balance Bay-wide (Blum et al., 2007).
These non-native Tunicata may be destabilizing the community through excessive biomass generation, which leads to slough-off. Slough-off of biomass creates an abrupt increase in bare space, which then favors additional settlement of non-native Tunicata, which prefer to settle on bare space (Reiter, 2020), as well as other opportunists recruiting at that moment. Styela plicata has been associated with increased bare space when it sloughs off on the east coast (Sutherland, 1978). The higher availability of bare space in San Francisco may be occasionally related to this phenomenon. More recent studies have indicated that the same non-native species might have different impacts in different geographic areas, making it difficult to generalize across systems (Robinson et al., 2017). An increase in sessile non-native species has been shown to lead to depressed sessile species richness but increased richness at higher trophic levels (Thomsen et al., 2014). The decrease in Tunicata cover as communities mature across all three bays (Figure 9) may reflect that (1) biodiverse communities have an inherent resistance to invasion (Stachowicz et al., 2002) and (2) the introduction of novel, manmade settlement platforms (docks, wind turbines, shoreline hardening) creates new opportunities for propagule settlement and reproduction of new species (Ruiz et al., 2009).
Each bay used in this study experiences distinct temperature, salinity, and oceanographic regimes (Tampa Bay = subtropical, Chesapeake Bay = continental temperate, and San Francisco = maritime temperate/Mediterranean climate), which may explain why the communities developed differently (Figure 7; Broitman et al., 2001; Beck et al., 2020; Schraga et al., 2020; NERRS, 2022). Temperature, salinity, and other differences in oceanographic features account for differences in species composition in other studies. Broitman et al. (2001) found abrupt changes in species composition along the coast of Chile, which were driven by the switch from a mussel-dominated intertidal community to macroalgae at 32° S, most likely driven by large oceanographic features that cause upwelling. Temperature clines also contribute to species ranges (Hutchins, 1947; Simpson et al., 2017), which determine where species can survive and reproduce. Temperature and salinity together may have an even stronger influence on biological communities (Tracy and Reyns, 2014; Cefali et al., 2016) and are increasingly being used to predict where species live and may move with climate change (Huang et al., 2011). In San Francisco Bay, Chang et al. (2018), using settling panel data, documented a strong correlation between salinity regimes and community composition, translating into dramatically different species assemblages. Wet years led to communities with a greater cover of colonial Tunicata, and dry years had a greater cover of solitary Tunicata. During period 1 of our study (2001–2004), all years were categorized, per the study by Chang et al., 2018 as either dry or moderate precipitation years. Period 2 only partly overlapped with the study by Chang et al., 2018 was characterized as a moderate, while 2013 was characterized as a dry year. The two wettest years, dominated by colonial Tunicata, in the study by Chang et al., 2018, fell outside this current analysis—2006 and 2011. In 2017, San Francisco Bay experienced an extremely wet winter (Schraga et al., 2020), which is also reflected in different species composition than the years before (Figures 5B, 6), including an increase in bare space and, interestingly in this study, a decrease in all Tunicata, including an almost complete loss of colonial Tunicata. The wet conditions facilitated an increase in encrusting Bryozoa (Figure 7), a result also in keeping with the Chang et al. findings (Figure 7). The increase in encrusting Bryozoa could be a reflection of reduced competition with Tunicata, which disappeared, rather than a wet/dry year response.
Additionally, the community that developed on the summer panels in Tampa Bay and Chesapeake Bay in 2003 differed (<80% similarity) from the composition of the panels in the same bays that developed in the other years (Figure 5B) and also happened to be when lower salinities were experienced in these two bays (Figure 6; Beck et al., 2020; NERRS, 2022). It appears that low-salinity events can restructure fouling communities, although it is unclear exactly how long these altered communities persist after salinities increase again. The community shifted in Tampa Bay in 2003 but by 2004 was returning in composition toward the original community, which had been reestablished by the period 2 surveys (Figure 5B). The Chesapeake Bay community also shifted but had shifted back by the time of the period 2 surveys (Figures 5B, 7). Given that climate change is predicted to change precipitation patterns across the United States with generally higher precipitation in the Chesapeake Bay region, declining precipitation in the Tampa Bay region, and increasing precipitation in the winter/spring but decreasing in the summer/fall in the San Francisco region (Hayhoe et al., 2018), we can expect the fouling community to fluctuate accordingly, perhaps creating opportunities for non-native species. McKnight et al. (2021) found non-natives outperform native species during warm, low-salinity periods.
Given the complexity of the data, we did not conduct pairwise statistical comparisons of the cover of each functional group across seasons, but we do present the information descriptively and graphically. Seasonal temperature changes in Chesapeake Bay and San Francisco Bay likely contribute to the differences in community development by season, with much lower average recruitment in the winter in San Francisco and in the winter/spring in Chesapeake, although with much variability in these patterns from year to year (Figure 4). This seasonality contrasts with the narrow temperature range and consistent recruitment year-round observed in Tampa Bay (Figures 4, 6). Season affects the fouling community composition in many systems (Osman, 1978). Recruitment of the same species differs by latitude, probably as a result of seasonal effects (Watson and Barnes, 2004). In Chesapeake Bay, certain functional groups, including Cirripedia and encrusting Bryozoa, recruit in the spring; calcareous and non-calcareous Polychaeta recruit in the fall/winter; and Hydrozoa recruit in the winter/spring (Figure 4). Solitary and colonial Tunicata have been documented by others to recruit seasonally, primarily in the summer (McDougall, 1943; Otsuka and Dauer, 1982). In this study, the recruitment period was documented beyond the summer. Tunicata recruited from March through October in San Francisco Bay, from April to November in Chesapeake Bay, and from March through July in Tampa Bay (Figure 4).
In Australia, Underwood and Chapman (2006) found that succession stabilized between 3 and 6 months, although they recognized that this same time frame may not apply to other bioregions. Mook (1981) found that, regardless of what settled first, subtidal communities developed toward a similar structure in Florida. In our study, the more mature communities in all three bays were distinguished by the increased cover of functional groups, which were barely evident in the younger communities, namely Porifera, Bivalvia, and encrusting Bryozoa. Porifera grew in cover over time in Chesapeake Bay and San Francisco, while Bivalvia grew in cover in Tampa Bay and San Francisco, and encrusting Bryozoa grew in cover in Chesapeake Bay (Figures 9; Table 3). Other succession studies in other North American coastal systems have documented Bivalvia dominating regardless of community maturity (max 6 months; Greene and Grizzle, 2007), so our ability to identify broadscale patterns of settlement that hold across systems is limited. In fact, this may be the first study to document the same functional groups (i.e., Cirripedia and encrusting Bryozoa) playing different succession roles in different systems.
The hard substrate fouling community is an excellent model system for studying community dynamics across broad temporal and spatial scales. Non-native Tunicata have become a dominant structural force in fouling community dynamics in San Francisco Bay, which may be related to or even sometimes cause an increase in bare space and a decrease in secondary cover, which distinguishes the San Francisco Bay fouling community from Chesapeake Bay and Tampa Bay. This paper does not address how specific species are influencing the system, although taxonomic data were collected and are being reviewed for long-term analyses of changing species composition. This study demonstrates that broad functional groups occupy different successional roles in different systems. Specifically, our study revealed the bay-specific succession sequence and showed that recruitment patterns did not measurably change even after 10 years. Low-salinity disturbance events, which will likely become more pronounced with climate change, restructured the fouling community, but as conditions reverted, so did the fouling community. Future fouling studies with repeated measures in these communities could provide exceptional opportunities to evaluate invasion dynamics as well as community stability and resilience in the face of temperature and precipitation change associated with climate change.
The raw data supporting the conclusions of this article will be made available by the authors, without undue reservation.
EJ led the author team, analysis and writing of the manuscript. KN, KL, BT, SA and GR were variably involved in original data collection, data analysis, writing, figure and table creation and editing. AC, JC, EW and TH were substantially involved in the original data collection and in editing the final manuscript. SC was substantially involved in the original data collection. All authors contributed to the article and approved the submitted version.
This research was supported by funding from the Department of Defense Legacy Program, CA Department of Fish and Wildlife Marine Invasive Species Program, National Sea Grant Program, Smithsonian Hunterdon Fund and the US Coast Guard.
We thank Stacey Havard and Brian Steves for collating and providing access to fouling plate survey data collected by the Smithsonian Marine Invasions Lab. We wish to thank a number of lab members and volunteers who helped with fouling plate surveys, including Ashley Arnwine, Audrey Colnar, Amanda Reynolds, Anna Krainer, AnneMarie Leyman, Abby Spangler, Amanda Spivak, Ben Daly, Basma Mohammad, Catherine DeRivera, Carmen Schloeder, Chaundra Schofield, Christina Simkanin, Christine Whitcraft, Chela Zabin, Dale Booth, Esther Collinetti, Elena Huynh, Gail Ashton, Gina S Kurka, George Smith, Irit Altman, Ian Dow, Isla Fitridge, Julia Blum, Joao Canning-Clode, Julio Lorda, Jenny Par, Kelly Lion, Kenan Matterson, Kim Philips, Kevin Turner, Lina Ceballos, Laura Gallant, L Hillman, L Page, Leela Rao, Maya Kapoor, Marcella Liljesthrom, Michelle Marraffini, Michele Repetto, Michelle Schenk, Matt Stadler, Mia Steinberg, Maria Thaker, Nancy Smith, Natasha Hitchcock, Phoebe Drinker, Sarah Mutter, Sarah Teck, Tiffany Pasco, and Whitney McClees.
The authors declare that the research was conducted in the absence of any commercial or financial relationships that could be construed as a potential conflict of interest.
All claims expressed in this article are solely those of the authors and do not necessarily represent those of their affiliated organizations, or those of the publisher, the editors and the reviewers. Any product that may be evaluated in this article, or claim that may be made by its manufacturer, is not guaranteed or endorsed by the publisher.
Alden R., Weisberg S., Ranasinghe J. (1997). Optimizing temporal sampling strategies for benthic environmental monitoring programs. Mar. pollut. Bull. 34, 913–922. doi: 10.1016/S0025-326X(97)00049-0
Altman S. (2011). Diversity, invasibility, and resource use in marine fouling communities of San Francisco Bay (MD, USA: University of Maryland PhD Dissertation). Available at: https://drum.lib.umd.edu/handle/1903/11617.
Arbizu P. M. (2017). Pairwise Adonis: Pairwise multilevel comparison using Adonis R package. Available at: https://github.com/pmartinezarbizu/pairwiseAdonis.
Bastida-Zavala J. R., McCann L. D., Keppel E., Ruiz G. M. (2017). The fouling serpulids (Polychaeta: Serpulidae) from united states coastal waters: An overview. Eur. J. Taxon. 344, 1–76. doi: 10.5852/ejt.2017.344
Beck M. W., Schrandt M. N., Wessel M., Sherwood E. T., Best B. D. (2020) Utility functions for processing data from TBEP. Available at: https://github.com/tbep-tech/tbeptools (Accessed February 2, 2022).
Bingham B. L., Walters L. J. (1989). Solitary ascidians as predators of invertebrate larvae: Evidence from gut analyses and plankton samples. J. Exp. Mar. Biol. Ecol. 131, 147–159. doi: 10.1016/0022-0981(89)90004-X
Blum J. C., Chang A. L., Liljesthröm M., Schenk M. E., Steinberg M. K., Ruiz G. M. (2007). The non-native solitary ascidian Ciona intestinalis (L.) depresses species richness. J. Exp. Mar. Biol. Ecol. 342 (1), 5–14. doi: 10.1016/j.jembe.2006.10.010
Bray J. R., Curtis J. T. (1957). An ordination of the upland forest communities of southern Wisconsin. Ecol. Monogr. 27 (4), 326–349. doi: 10.2307/1942268
Broitman B. R., Navarrete S. A., Smith F., Gaines S. D. (2001). Geographic variation of southeastern pacific intertidal communities. Mar. Ecol. Prog. Ser. 224, 21–34. doi: 10.3354/meps224021
Bullard S. G., Whitlatch R. B., Osman R. W. (2004). Checking the landing zone: Do invertebrate larvae avoid settling near superior spatial competitors? Mar. Ecol. Prog. Ser. 280, 239–247. doi: 10.3354/meps280239
Cefalì M. E., Cebrian E., Chappuis E., Pinedo S., Terradas M., Mariani S., et al. (2016). Life on the boundary: Environmental factors as drivers of habitat distribution in the littoral zone. Estuar. Coast. Shelf Sci. 172, 81–92. doi: 10.1016/j.ecss.2016.01.043
Chang A. L., Brown C. W., Crooks J. A., Ruiz G. M. (2018). Dry and wet periods drive rapid shifts in community assembly in an estuarine ecosystem. Global Change Biol. 24 (2), e627–e642. doi: 10.1111/gcb.13972
Cifuentes M., Kamlah C., Thiel M., Lenz M., Wahl M. (2007). Effects of temporal variability of disturbance on the succession in marine fouling communities in northern-central Chile. J. Exp. Mar. Biol. Ecol. 352 (2), 280–294. doi: 10.1016/j.jembe.2007.08.004
Clarke K.R., Warwick R.M. (2001) Change in marine communities: An approach to statistical analysis and interpretation. 2nd Edition, PRIMER-E, Ltd., (Plymouth: Plymouth Marine Laboratory)
Clarke K. R. (1993). Non-parametric multivariate analyses of changes in community structure. Aust. J. Ecol. 18, 117–143. doi: 10.1111/j.1442-9993.1993.tb00438.x
Clements F. E. (1916). Plant succession: Analysis of the development of vegetation. Carnegie Inst. Wash. Publ. Sci. 242, 1–512. doi: 10.5962/bhl.title.56234
Cory R. (1967). Epifauna of the patuxent river estuary. Chesapeake Sci. 8, 71–89. doi: 10.2307/1351152
Costello D. P., Davidson M. E., Eggers A., Fox M. H., Henley C. (1957). Methods for obtaining and handling marine eggs and embryos (Lancaster, PA: Lancaster Press).
Crooks J. (2002). Characterizing ecosystem-level consequences of biological invasions: role of ecosystem engineers. Oikos 97, 157–166. doi: 10.1034/j.1600-0706.2002.970201.x
Crooks J. A., Chang A. L., Ruiz G. M. (2011). Aquatic pollution increases the relative success of invasive species. Biol. Invasions 13, 165–176. doi: 10.1007/s10530-010-9799-3
Dean T. A., Hurd L. E. (1980). Development in an estuarine fouling community: The influence of early colonists on later arrivals. Oecologia 46, 295–301. doi: 10.1007/BF00346255
Dijkstra J., Sherman H., Harris L. G. (2007). The role of colonial ascidians in altering biodiversity in marine fouling communities. J. Exp. Mar. Biol. Ecol. 342 (1), 169–171. doi: 10.1016/j.jembe.2006.10.035
Fofonoff P. W., Ruiz G. M., Steves B., Simkanin C., Carlton J. T. (2018) National exotic marine and estuarine species information system. Available at: http://invasions.si.edu/nemesis (Accessed 2022-02-02).
Fukami T. (2015). Historical contingency in community assembly: Integrating niches, species pools, and priority effects. Annu. Rev. Ecol. Evol. Syst. 46 (1), 1–23. doi: 10.1146/annurev-ecolsys-110411-160340
Glasby T. M., Connell S. D., Holloway M. G., Hewitt C. L. (2007). Nonindigenous biota on artificial structures: could habitat creation facilitate biological invasions? Mar. Biol. 151, 887–895. doi: 10.1007/s00227-006-0552-5
Graham H., Gay H. (1945). Season of attachment and growth of sedentary marine organisms at Oakland, California. Ecology 26, 375–386. doi: 10.2307/1931659
Greene J. K., Grizzle R. E. (2007) Successional development of fouling communities on open ocean aquaculture fish cages in the western Gulf of Maine, USA Aquaculture 262 (2–4), 289–301. doi: 10.1016/j.aquaculture.2006.11.003
Grosberg R. K. (1981). Competitive ability influences habitat choice in marine invertebrates. Nature 290, 700–702. doi: 10.1038/290700a0
Hayhoe K., Wuebbles D. J., Easterling D. R., Fahey D. W., Doherty S., Kossin J., et al. (2018). Our changing climate. In Impacts, Risks, and Adaptation in the United States: Fourth National Climate Assessment, Volume II Eds. Reidmiller D. R., Avery C. W., Easterling D. R., Kunkel K. E., Lewis K. L. M., Maycock T. K., Stewart B. C. (Washington, DC, USA: U.S. Global Change Research Program), 72–144. doi: 10.7930/NCA4.2018.CH2
Huang Z., Brooke B. P., Harris P. T. (2011). A new approach to mapping marine benthic habitats using physical environmental data. Cont. Shelf Res. 31, 4–16. doi: 10.1016/j.csr.2010.03.012
Hutchins L. W. (1947). The bases for temperature zonation in geographical distribution. Ecol. Monogr. 17, 325–335. doi: 10.2307/1948663
Jewett E. B., Hines A. H., Ruiz G. M. (2005). Epifaunal disturbance by periodic low dissolved oxygen: Native versus invasive species response. Mar. Ecol. Prog. Ser. 304, 31–44. doi: 10.3354/meps304031
Karlson R. H., Osman R. W. (2012). Species composition and geographic distribution of invertebrates in fouling communities along the east coast of the USA: A regional perspective. Mar. Ecol. Prog. Ser. 458, 255–268. doi: 10.3354/meps09767
Marraffini M. L., Ashton G. V., Brown C. W., Chang A. L., Ruiz G. M. (2017). Settlement plates as monitoring devices for non-indigenous species in marine fouling communities. Manage. Biol. invasions 8 (4), 559–566. doi: 10.3391/mbi.2017.8.4.11
Marraffini M. L., Geller J. B. (2015). Species richness and interacting factors control invasibility of a marine community. Proc. R. Soc. B: Biol. Sci. 282 (1812), 20150439. doi: 10.1098/rspb.2015.0439
McDougall K. D. (1943). Sessile marine invertebrates of Beaufort, north Carolina. Ecol. Monogr. 13, 323–374. doi: 10.2307/1943225
McKnight E., Spake R., Bates A., Smale D. A., Rius M. (2021). Non-native species outperform natives in coastal marine ecosystems subjected to warming and freshening events. Global Ecol. Biogeogr. 30, 1698–1712. doi: 10.1111/geb.13318
Mook D. (1981). Effects of disturbance and initial settlement on fouling community structure. Ecology 62, 522–526. doi: 10.2307/1937715
Nandakumar K. (1996). Importance of timing of panel exposure on the competitive outcome and succession of sessile organisms. Mar. Ecol. Prog. Ser. 131, 191–203. doi: 10.3354/meps131191
Needles L. A., Wendt D. E. (2013). Big changes to a small bay: introduced species and long-term compositional shifts to the fouling community of morro bay (CA). Biol. Invasions 15 (6), 1231–1251. doi: 10.1007/s10530-012-0362-2
NERRS (2022). System-wide monitoring program (Baruch Institute, University of South Carolina: NOAA NERRS Centralized Data Management Office). Available at: http://www.nerrsdata.org.
Oksanen J., Blanchet F. G., Friendly M., Kindt R., Legendre P., McGlinn D., et al. (2020) Vegan: Community ecology package. Available at: https://CRAN.R-project.org/package=vegan.
Osman R. W. (1978). The influence of seasonality and stability on the species equilibrium. Ecology 59, 383–399. doi: 10.2307/1936381
Osman R. W. (2015). Regional variation in the colonization of experimental substrates by sessile marine invertebrates: Local vs regional control of diversity. J. Exp. Mar. Biol. Ecol. 473, 227–286. doi: 10.1016/j.jembe.2015.08.004
Osman R. W., Whitlatch R. B. (1995). The influence of resident adults on larval settlement: Experiments with four species of ascidians. J. Exp. Mar. Biol. Ecol. 190, 199–220. doi: 10.1016/0022-0981(95)00036-Q
Otsuka C. M., Dauer D. M. (1982). Fouling community dynamics in lynnhaven bay, Virginia. Estuaries 5, 10–22. doi: 10.2307/1352212
Qvarfordt S., Kautsky H., Malm T. (2006). Development of fouling communities on vertical structures in the Baltic Sea. Estuar. Coast. Shelf Sci. 67, 618–618. doi: 10.1016/j.ecss.2006.01.004
R Core Team (2020). R: A language and environment for statistical computing (Vienna: R Foundation for Statistical Computing). Available at: https://www.R-project.org/.
Reiter Y. T. (2020). Comparing competitive interactions and settlement success among native and non-indigenous species in marine hard bottom communities of colonial ascidians, from the bay of plenty, New Zealand (Thesis, master of science (Research) (MSc(Research) (Hamilton, New Zealand: The University of Waikato). Available at: https://hdl.handle.net/10289/13944.
Robinson T. B., Havenga B., van der Merwe M., Jackson S. (2017). Mind the gap – context dependency in invasive species impacts: A case study of the ascidian ciona robusta. NeoBiota 32, 127–141. doi: 10.3897/neobiota.32.9373
Ruiz G. M., Fofonoff P. W., Carlton J. T., Wonham M. J., Hines A. H. (2000). Invasion of coastal marine communities in North America: Apparent patterns, processes, and biases. Annu. Rev. Ecol. Syst. 31, 481–531. doi: 10.1146/annurev.ecolsys.31.1.481
Ruiz G. M., Fofonoff P. W., Steves B., Foss S. F., Shiba S. N. (2011). Marine invasion history and vector analysis of California: A hotspot for western north America. Diversity Distributions 17, 362–373. doi: 10.1111/j.1472-4642.2011.00742.x
Ruiz G. M., Freestone A. L., Fofonoff P. W., Simkanin C. (2009). Chapter 23 habitat distribution and heterogeneity in marine invasion dynamics: The importance of hard substrate and artificial structure. M. Wahl (ed.), marine hard bottom communities. Ecol. Stud. 206, 321. doi: 10.1007/978-3-540-92704-4_23
Ruiz G. M., Geller J. B. (2018). Spatial and temporal analysis of marine invasions in California, part II: Humboldt Bay, Marina Del Rey, Port Hueneme, and San Francisco Bay (Sacramento, CA: California Dept of Fish and Wildlife), 239.
Ruiz G. M., Geller J. B. (2021). Spatial and temporal analysis of marine invasions in California: Supplemental studies to evaluate detection through quantitative and molecular methodologies (Sacramento, CA: California Dept of Fish and Wildlife), 153.
Sams M. A., Keough M. J. (2012). Contrasting effects of variable species recruitment on marine sessile communities. Ecology 93 (5), 1153–1163. doi: 10.1890/11-1390.1
Satheesh S., Wesley S. G. (2011). Influence of submersion season on the development of test panel biofouling communities in a tropical coast. Estuar. Coast. Shelf Sci. 94 (2), 155–163. doi: 10.1016/j.ecss.2011.06.011
Schraga T. S., Nejad E. S., Martin C. A., Cloern J. E. (2020) USGS measurements of water quality in San Francisco bay (CA), beginning in 2016 (U.S. Geological Survey data release) (Accessed March 13, 2022).
Shea K., Chesson P. (2002). Community ecology theory as a framework for biological invasions. Trends Ecol. Evol. 17 (4), 170–176. doi: 10.1016/S0169-5347(02)02495-3
Simkanin C., Davidson I.C., Dower J.F., Jamieson G., Therriault T.W. (2012). Anthropogenic structures and the infiltration of natural benthos by invasive ascidians. Mar. Ecol. 33 (4), 499–511. doi: 10.1111/j.1439-0485.2012.00516.x
Simpson T. J., Smale D. A., McDonald J. I., Wernberg T. (2017). Large Scale variability in the structure of sessile invertebrate assemblages in artificial habitats reveals the importance of local-scale processes. J. Exp. Mar. Biol. Ecol. 494, 10–19. doi: 10.1016/j.jembe.2017.05.003
Stachowicz J. J., Fried H., Osman R. W., Whitlatch R. B. (2002). Biodiversity, invasion resistance, and marine ecosystem function. Ecology 83, 2575–2590. doi: 10.1890/0012-9658(2002)083[2575:BIRAME]2.0.CO;2
Sutherland J. P. (1974). Multiple stable points in natural communities. Am. Nat. 108, 493–507. doi: 10.1086/282961
Sutherland J. P. (1978). Functional roles of schizoporella and styela in the fouling community at Beaufort, NC. Ecology 59 (2), 257–264. doi: 10.2307/1936371
Theuerkauf K. W., Eggleston D. B., Theuerkauf S. J. (2018). An exotic species alters patterns of marine community development. Ecol. Monogr. 88 (1), 92–108. doi: 10.1002/ecm.1277
Thomsen M. S., Byers J. E., Schiel D. R., Bruno J. F., Olden J. D., Wernberg T., et al. (2014). Impacts of marine invaders on biodiversity depend on trophic position and functional similarity. Mar. Ecol. Prog. Ser. 495, 39–47. doi: 10.3354/meps10566
Tilman D., Kareiva P. (1997). Spatial ecology: The role of space in population dynamics and interspecific interactions (Princeton, New Jersey: Princeton University Press).
Tonkin J. D., Bogan M. T., Bonada N., Rios-Touma B., Lytle D. A. (2017). Seasonality and predictability shape temporal species diversity. Ecology 98, 1201–1216. doi: 10.1002/ecy.1761
Toonen R. J., Pawlik J. R. (2001). Settlement of the gregarious tube worm Hydroides dianthus (Polychaeta: Serpulidae). i. gregarious and nongregarious settlement. Mar. Ecol. Prog. Ser. 224, 103–114. doi: 10.3354/meps224103
Tracy B. M., Reyns N. B. (2014). Spatial and temporal patterns of native and invasive ascidian assemblages in a southern California embayment. Aquat. Invasions 9, 4. doi: 10.3391/ai.2014.9.4.03
Underwood A., Chapman M. (2006). Early development of subtidal macrofaunal assemblages: Relationships to period and timing of colonization. J. Exp. Mar. Biol. Ecol. 330, 221–233. doi: 10.1016/j.jembe.2005.12.029
Vellend M. (2016). The theory of ecological communities (MPB-57) (Princeton, New Jersey: Princeton University Press).
Watson D. I., Barnes D. K. A. (2004). Temporal and spatial components of variability in benthic recruitment, a 5-year temperate example. Mar. Biol. 145, 201–214. doi: 10.1007/s00227-003-1291-5
Yakovis E. L., Artemieva A. V., Fokin M. V. (2004). Spatial pattern indicates an influence of barnacle and ascidian aggregations on the surrounding benthic assemblage. J. Exp. Mar. Biol. Ecol. 309 (2), 155–172. doi: 10.1016/j.jembe.2004.03.015
Young C. M. (1989). Larval depletion by ascidians has little effect on settlement of epifauna. Mar. Biol. 102, 481–489. doi: 10.1007/BF00438349
Young C. M., Gotelli N. J. (1988). Larval predation by barnacles: Effects on patch colonization in a shallow subtidal community. Ecology 69, 624–634. doi: 10.2307/1941011
Keywords: benthic, community development, fouling, hard substrate, invasive, marine, nonnative, recruitment
Citation: Jewett EB, Lawson KN, Larson KJ, Tracy BM, Altman S, Chang AL, Cowan S, Crooks JA, Huber T, Wells EH and Ruiz GM (2022) Differences in fouling community composition and space occupation across broad spatial and temporal scales. Front. Mar. Sci. 9:933405. doi: 10.3389/fmars.2022.933405
Received: 30 April 2022; Accepted: 17 October 2022;
Published: 09 December 2022.
Edited by:
Bernardo Antonio Perez Da Gama, Fluminense Federal University, BrazilReviewed by:
Edson A. Vieira, Federal University of Rio Grande do Norte, BrazilCopyright © 2022 Jewett, Lawson, Larson, Tracy, Altman, Chang, Cowan, Crooks, Huber, Wells and Ruiz. This is an open-access article distributed under the terms of the Creative Commons Attribution License (CC BY). The use, distribution or reproduction in other forums is permitted, provided the original author(s) and the copyright owner(s) are credited and that the original publication in this journal is cited, in accordance with accepted academic practice. No use, distribution or reproduction is permitted which does not comply with these terms.
*Correspondence: Elizabeth B. Jewett, bGliYnkuamV3ZXR0QG5vYWEuZ292
Disclaimer: All claims expressed in this article are solely those of the authors and do not necessarily represent those of their affiliated organizations, or those of the publisher, the editors and the reviewers. Any product that may be evaluated in this article or claim that may be made by its manufacturer is not guaranteed or endorsed by the publisher.
Research integrity at Frontiers
Learn more about the work of our research integrity team to safeguard the quality of each article we publish.