 Pei-Chuan Chuang1*
 Chloe H. Anderson2
 Michael Kossack2
 Jenny Fabian3
 Chih-Chieh Su4
 Paul Vosteen1
 Matthias Zabel2
 Florian Scholz1
 Heide N. Schulz-Vogt3
 Stefan Sommer1
 Andrew W. Dale1
- 1GEOMAR Helmholtz Centre for Ocean Research Kiel, Kiel, Germany
- 2MARUM – Center for Marine Environmental Sciences, University of Bremen, Bremen, Germany
- 3Leibniz Institute for Baltic Sea Research Warnemünde, Rostock, Germany
- 4Institute of Oceanography, National Taiwan University, Taipei, Taiwan
Surface sediments of the coastal mud belt in the Benguela Upwelling System (BUS) off Namibia host extensive communities of chemotrophic large sulfur bacteria (LSB) of the family Beggiatoaceae such as Thiomargarita spp. and Candidatus Maribeggiatoa spp. In order to understand the role of these bacteria in N and P cycling, biogeochemical data from three sites in the mud belt were simulated with a biogeochemical model including LSB catabolic pathways. Organic carbon remineralization was dominated by the reduction of sulfate to hydrogen sulfide (5.0–7.7 mmol C m−2 d−1). At the two stations where LSB were observed, produced hydrogen sulfide was almost completely oxidized by LSB using nitrate as the electron acceptor. Modeled rates of nitrate reduction to N2 by LSB were over two times higher than nitrate reduction to ammonium. This points toward a potential negative feedback by LSB on primary production. Furthermore, loss of fixed N strongly enriched the benthic fluxes in P relative to N. Although the model included intracellular polyphosphate accumulation by LSB and subsequent breakdown to phosphate, a clear link between polyphosphate dynamics and hydroxyapatite precipitation and burial could not be clearly substantiated. This is partly due to simplifying assumptions in the model and analytical uncertainties in distinguishing between authigenic hydroxyapatite and allochthonous hydroxyapatite (e.g., fish bones), both of which are major components of particulate P in the BUS. Our modeling suggests a significant control of LSB on benthic N and P fluxes to the water column. Given the extensive coverage of LSB on the shelf (>30,000 km2), more accurate forecasts of nutrient cycling and primary production in the BUS necessitate a closer inspection of benthic P sources and sinks in the mud belt and a clearer understanding of the controls on the end product of nitrate reduction by LSB.
Introduction
The major nutrients nitrogen (N) and phosphorus (P) are required for the growth of all organisms, and their availability largely controls the productivity of marine ecosystems. On long kyr time scales, changes in the oceanic N and P inventories can have major impacts on the global carbon cycle (Gruber, 2008; Wallmann et al., 2016). Today, eastern boundary upwelling systems including the California, Humboldt, Canary, and Benguela current systems play a significant role in the marine C cycle, accounting for 10% to 20% of total marine primary production and global fish catches despite covering less than 1% of the ocean surface (Carr, 2001; Capone and Hutchins, 2013; Malone et al., 2017). Among the four major upwelling systems, the Benguela Upwelling System (BUS), located along the coasts of Angola, Namibia, and South Africa (14°S–34°S), has the highest primary production at 0.37 Gt C yr−1 (Carr, 2001).
In the northern part of the BUS, especially offshore Namibia between 20°S and 25°S, a perennial oxygen minimum zone (OMZ) in subsurface waters along the coast has been present for millennia (West et al., 2004; Hutchings et al., 2009). The lack of oxygen is driven by intense respiration of phytodetritus in the water column and sediments (Brüchert et al., 2006; Mohrholz et al., 2008). In austral summer, the dominant water mass is the poleward-propagating and warm South Atlantic Central Water (SACW) from the Angola Gyre, which is nutrient-rich and oxygen-poor (~20–70 µM; Mohrholz et al., 2008). In austral winter, cross-shelf circulation intensifies and brings equatorward subtropical Eastern SACW (ESACW) that is more oxygenated (~250–300 µM) and lower in nutrients. The combination of nutrient supply, high particle fluxes to the seafloor, and low O2 levels has resulted in an extensive mud belt on the Namibian shelf of over 700 km in length that is characterized by extraordinary particulate organic carbon (POC) contents exceeding 15% dry weight (Inthorn et al., 2006; Meisel et al., 2011) and high rates of benthic carbon respiration.
Respiration of carbon in the sedimentary mud belt is mainly carried out anaerobically by bacterial sulfate reduction, resulting in elevated concentrations of dissolved hydrogen sulfide (H2S) in sediment porewaters (Brüchert et al., 2003; Brüchert et al., 2006). The flux of H2S from the sediment to the bottom water is largely controlled by the activity of colorless large sulfur bacteria (LSB) of the family Beggiatoaceae such as chemotrophic Thiomargarita spp. and Candidatus Maribeggiatoa spp. that oxidize H2S to gain energy (Schulz et al., 1999; Brüchert et al., 2003). These bacteria are aerobic or microaerophilic and present throughout the mud belt, covering an area >30,000 km2 (Brüchert et al., 2006). If the efficiency of the microbial filter is inhibited, H2S can escape the sediment and produce plumes of elemental sulfur in the water column that are detectable by satellite imagery (Ohde and Dadou, 2018). These sulfidic events appear to correlate with the seasonal variability of the OMZ and generally occur in late austral summer (February–March) and early austral autumn (April–May) (Ohde and Dadou, 2018). Given its toxicity, sulfide accumulation in the water column can cause massive fish mortality (Brüchert et al., 2003; Brüchert et al., 2006; Ohde and Dadou, 2018). A firm understanding of the factors leading to benthic H2S emissions is therefore of prime importance.
LSB oxidize sulfide using nitrate () stored in their intracellular vacuoles, producing either ammonium () or N2 as the N end product (Otte et al., 1999; Winkel et al., 2016). These pathways are referred to as dissimilatory nitrate reduction to ammonium (DNRA) or dinitrogen (DNRN2). DNRA and DNRN2 are of environmental significance since the former recycles fixed N between and , whereas the latter leads to a net loss of fixed N as N2 gas. The environmental factors that determine the relative rates of these processes are generally unknown but may be related to the relative abundance of electron acceptors (Kraft et al., 2014). DNRA can have further significance for the overall N loss from the ecosystem. For instance, a significant fraction of consumed in the water column offshore Peru by anammox can be supplied by DNRA in the sediments (Kalvelage et al., 2013; Dale et al., 2016a). In the BUS water column, massive N loss is known to occur through anammox and denitrification, but the contribution of benthic to pelagic N loss is not well resolved (Kuypers et al., 2005; Nagel et al., 2013). A greater quantitative understanding of dissimilatory nitrate reduction is essential for closing nutrient budgets and for predicting benthic-pelagic feedback across the mud belt (Brüchert et al., 2003; Borchers et al., 2005; Dale et al., 2009).
In addition to their influence on benthic N cycling, LSB may be instrumental in controlling porewater concentrations and benthic P fluxes (Schulz and Schulz, 2005; Goldhammer et al., 2010; Brock and Schulz-Vogt, 2011; Goldhammer et al., 2011; Dale et al., 2013; Langer et al., 2018). LSB, in addition to other microorganisms, are thought to accumulate polyphosphate under oxic or hypoxic conditions (Schulz and Schulz, 2005; Brock and Schulz-Vogt, 2011). Polyphosphates are long chains of orthophosphate units linked by high energy phosphoanhydride bonds (Gächter and Meyer, 1993). Hydrolysis of polyphosphate under unfavorable anoxic or sulfidic conditions provides an energy source for the bacteria and releases to the porewater (Jones et al., 2016). This mechanism has been suggested to drive a sink for P via the precipitation of authigenic hydroxyapatite (Schulz and Schulz, 2005).
The importance of the BUS to the Namibian economy justifies a closer inspection and understanding of N and P sources and sinks. In this study, we examine this aspect from a benthic perspective with a particular focus on LSB. Due to the complexities of the coupled C, S, and nutrient cycles, we use a numerical model to assess how LSB influence nutrient turnover and sediment–water exchange fluxes. To date, only a limited number of studies have quantified the biogeochemical turnover rates of N and P in Namibian shelf and the linkages with LSB (Brüchert et al., 2003; Schulz and Schulz, 2005; Dale et al., 2009; Goldhammer et al., 2010; Neumann et al., 2016). In this study, new data from sediments of the Namibian mud belt are used to estimate the relative importance of DNRN2 versus DNRA and the impact on the N and P fluxes communicated to the water column.
Study site and methods
Study area
Data are presented from three stations in the northern BUS: within and at the edge of the mud belt at 23°S and within the mud belt at 25°S (Figure 1). Upwelling at 23°S is strong but only seasonally active, whereas at 25°S–27°S upwelling persists throughout the year (Mohrholz et al., 2008; Hutchings et al., 2009). The inner shelf mud belt covers a total area of 30,000 km2 (Brüchert et al., 2006). It is composed of organic- and diatom-rich mud with minimal dilution by terrigenous sediment (Calvert and Price, 1983; Borchers et al., 2005). Microbial sulfate reduction rates can be exceptional (>60 mmol m−2 d−1), with dissolved H2S levels occasionally exceeding 15 mM a few cm below the sediment surface (Brüchert et al., 2006). At St. 14, Ca. Maribeggiatoa spp. and Thiomargarita spp. were prevalent, whereas at St. 41, Thiomargarita spp. were dominant (Fabian et al., in prep). At St. 12, no conspicuous LSB were observed. Observations of the filamentous LSB Ca. Marithioploca spp. have also been reported (Gallardo et al., 1998; Flood et al., 2021), but are probably not widely distributed, and no specimens were observed at the sites studied here or detected based on 16S-RNA (data not shown). During the fieldwork, the water mass on the inner shelf was dominated by ESACW that prevented anoxic conditions in the bottom waters (Zabel et al., 2019). Bottom waters were nonetheless low in O2 (26–53 µM), with and concentrations of ~24 µM for and ~1 µM for , respectively (Supplementary Table 1).
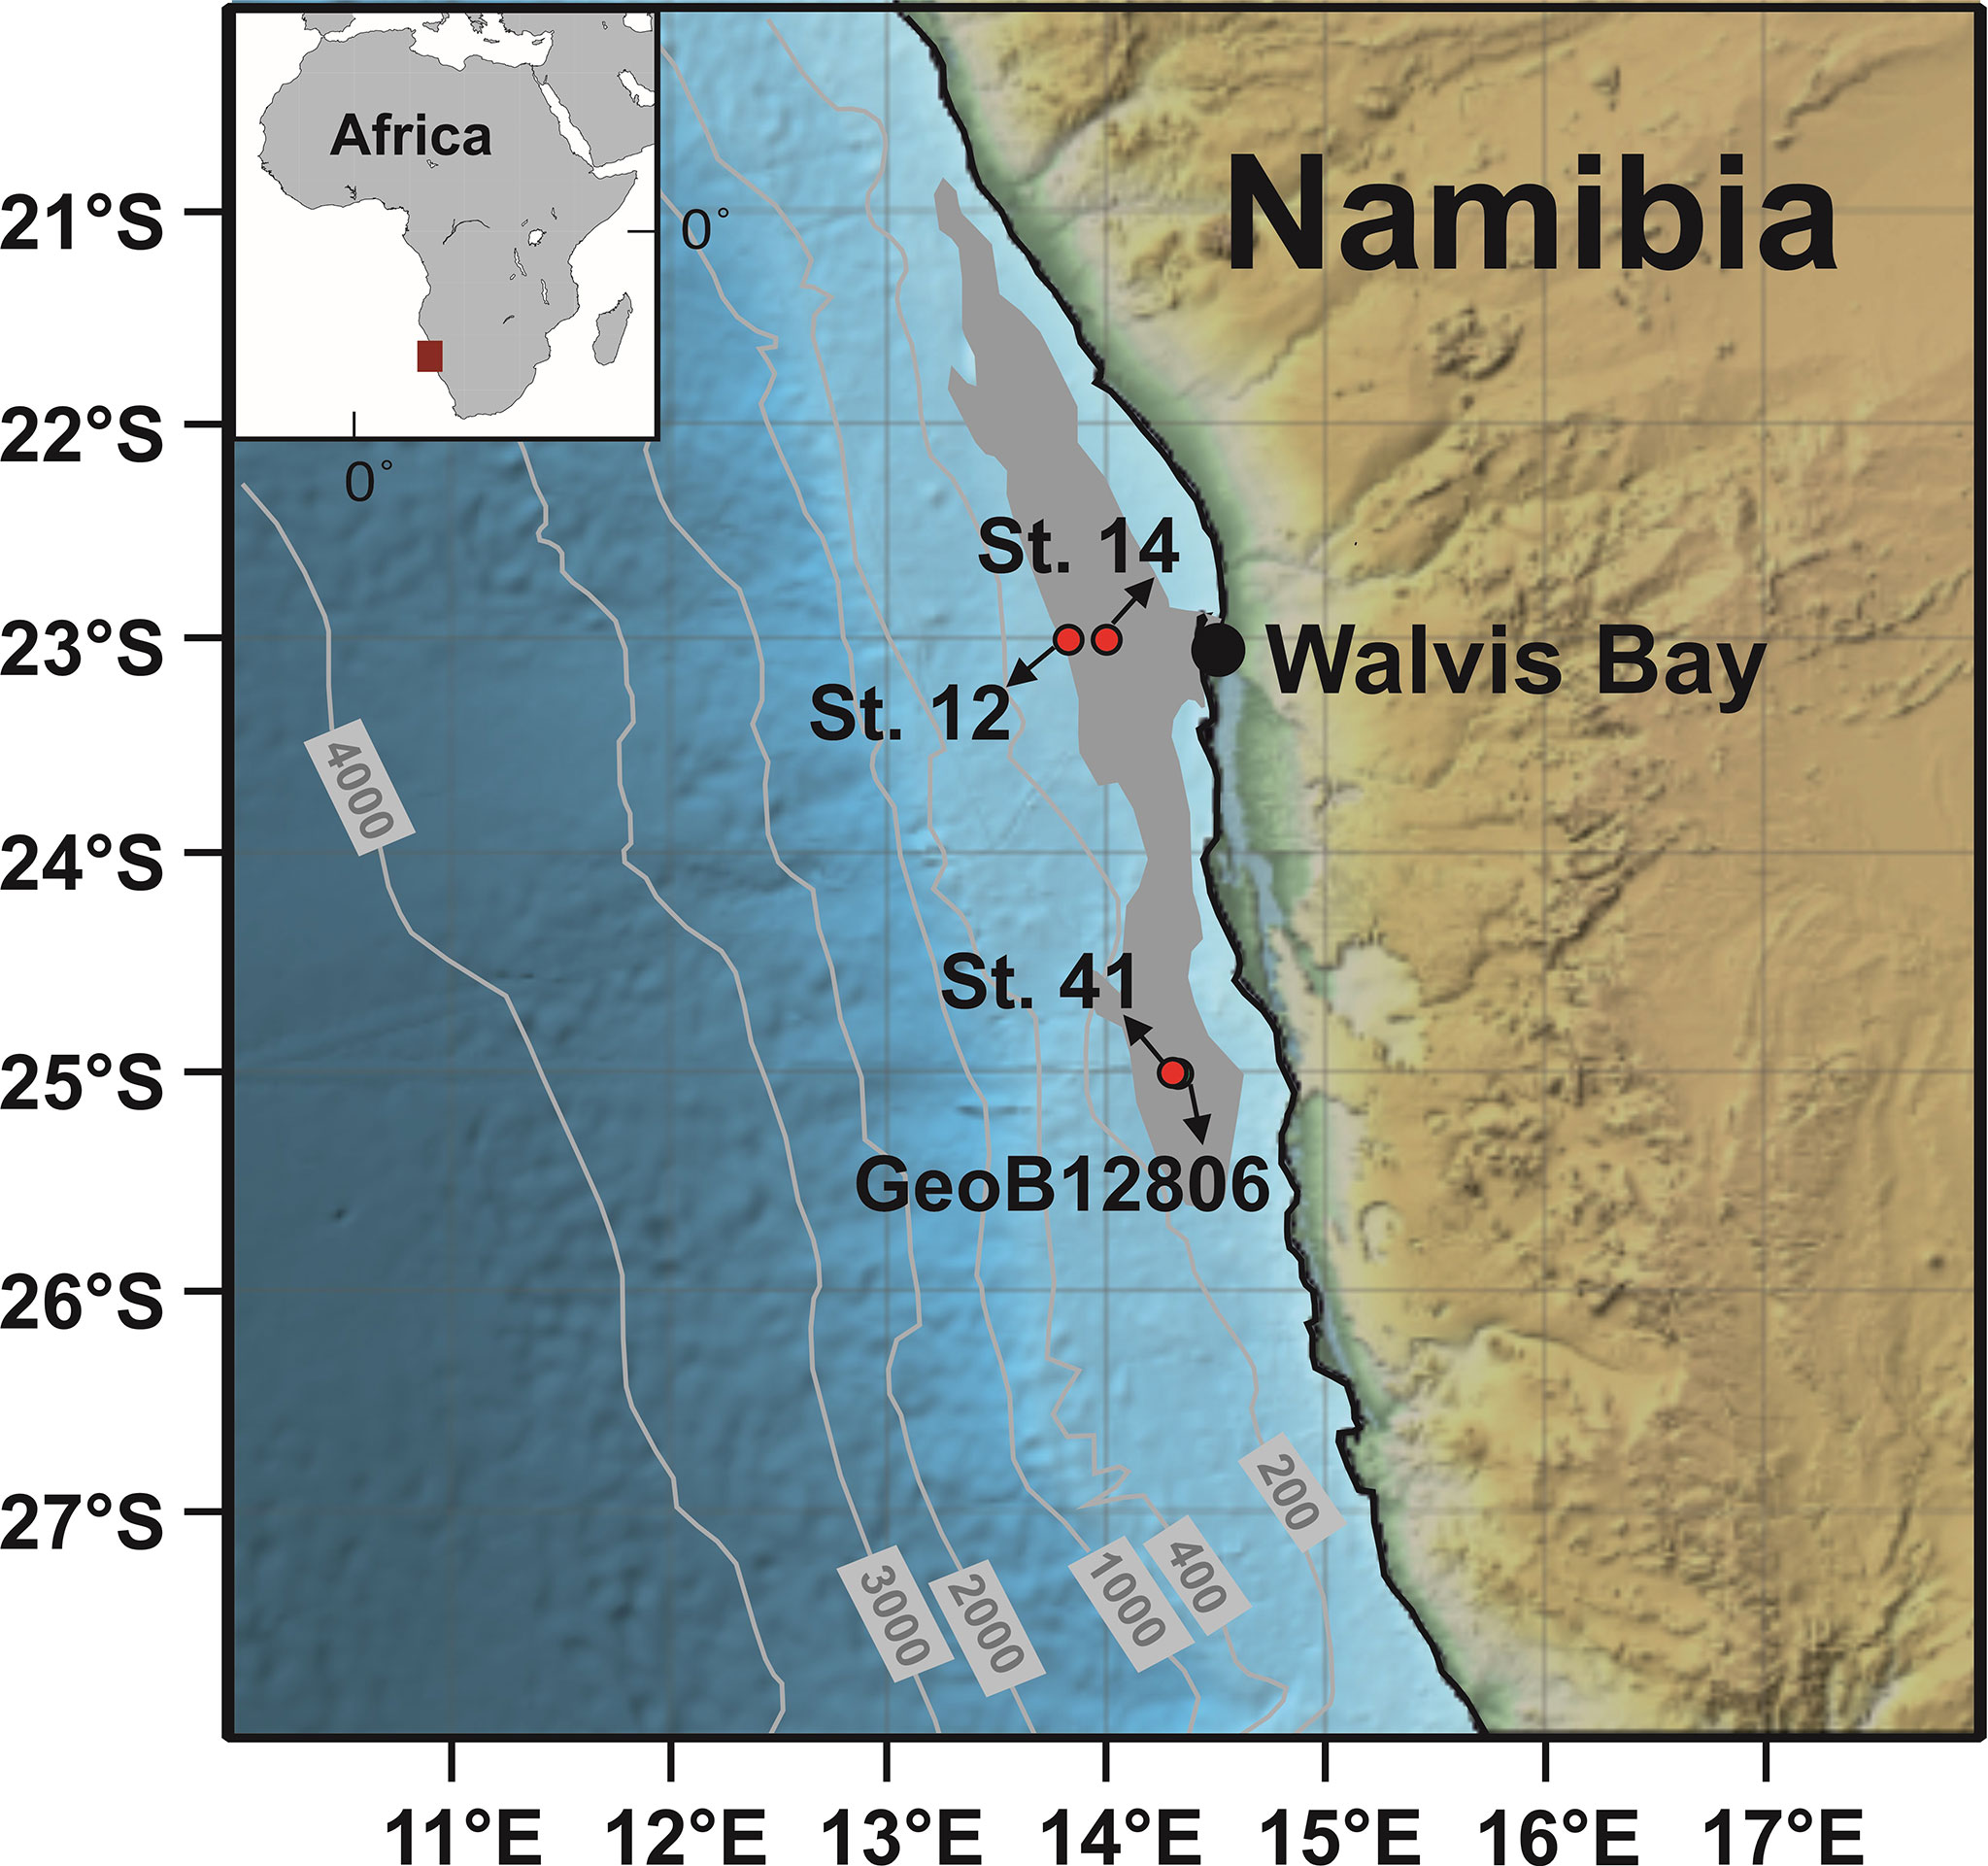
Figure 1 Sampling locations on the Namibian mud belt (bathymetry contours in m). The approximate extension of mud belt shown in gray is based on Inthorn et al. (2006) and Zabel et al. (2012) for surface sediments with total organic carbon (TOC) concentrations higher than 5 wt%. St. 12 (23°00′S; 13°52.0′E; water depth = 151 m) is located at the edge of the mud belt. St. 14 (23°00′S; 14°02.9′E; water depth = 138 m), St. 41 (25°00′S; 14°22.6′E; water depth = 140 m), and GeoB12806 (25°00.4′S; 14°23.5′E; water depth = 133 m) are located inside the mud belt.
Sampling and analytical methods
Sediment data presented in this study were collected from St. 12 (23°S), St. 14 (23°S), and St. 41 (25°S) (Figure 1). Although several other sites were sampled throughout the mud belt, the sediments at these three stations presented clear and contrasting geochemical trends that are suitable for modeling. Sediments were collected with a multiple-corer (MUC) and a gravity corer (GC) during R/V Meteor cruise 157 between 4 August and 16 September, 2019, which corresponds to the low productivity season (Zabel et al., 2019). Sampling and analytical methods are described in detail by Zabel et al. (2019). After core retrieval, all cores were transferred to a cool room on board (4°C). Gravity cores were 3–5 m long and were cut into 1m sections on the deck prior to subsampling. The MUC deployments recovered approximately 40 cm of sediment at each site.
MUC cores were subsampled into Falcon tubes in a glove bag under argon at a resolution of 1 to 4 cm. Porewater samples were collected by centrifugation and filtered (0.2 µm cellulose-acetate filters) inside the glove bag. Wet sediments were sampled into pre-weighed plastic cups for water content and porosity determinations at a resolution of 1 to 4 cm. Porewater samples from GCs were extracted using rhizon samplers (5 cm length, 0.2 μm porous polymer) at 15 to 40 cm intervals. Wet sediments for porosity were sampled at a resolution of 1 m.
Dissolved iron (Fe2+), phosphate ( ), and ammonium ( ) were analyzed immediately onboard. The remaining samples and porewater aliquots were refrigerated for analysis at the home laboratories following the cruise. Fe2+ was analyzed photometrically (Hach Lange DR 5000 photometer) at 565 nm following the method of Collins et al. (1959). Aliquots of 1 ml of acidified sample (20 μl of 1% ascorbic acid) were added to 50 μl of a ferrospectral reagent (Merck Chemicals) in disposable polystyrene cuvettes (Stookey, 1970) for analyses. Samples with high Fe2+ concentrations were diluted with oxygen-free artificial seawater. concentrations were determined photometrically via the molybdenum blue method using a Hach Lange DR 5000 photometer (Grasshoff et al., 1999). Highly sulfidic samples were spiked with 20 μl of 30% HCl and bubbled with argon for 1 minute to limit sulfide interference for analysis. was measured by flow injection using a polytetrafluoroethylene (PTFE) tape gas separator technique after Hall and Aller (1992). The precisions of the Fe2+, , and analyses were 1%, 7% and 6%, respectively.
Shore-based analyses at MARUM (Bremen, Germany) included sulfate (), hydrogen sulfide (H2S), and cations. was determined by ion chromatography (Metrohm 861 Advanced Compact IC, Metrohm A Supp 5 column, 0.8 ml min−1, conductivity detection after chemical suppression). Total dissolved H2S was measured photometrically using the methylene blue method in samples that were fixed on board with zinc acetate (ZnAc) (Cline, 1969). The analytical precision for and H2S analysis was 2%. Dissolved calcium (Ca2+) and magnesium (Mg2+) were determined in samples acidified by suprapure concentrated HNO3 (10 μl per ml of sample) by inductively coupled plasma optical emission spectroscopy (ICP-OES; axial plasma observation; Agilent 720) with a precision of 2%.
Porewater data from site GeoB12806 collected during R/V Meteor cruise M76/1 in April/May 2008 were used in addition to data from St. 41 to help constrain the model, as the locations of these two stations are nearly identical (Figure 1). Sampling and analytical methods were presented in Goldhammer et al. (2011) with the exception of total alkalinity. Total alkalinity was determined by titration of 1 ml of porewater with 0.01 or 0.05 M of HCl to pH 3.8 (Grasshoff et al., 1999).
A comparison of porewater data from the GCs and MUCs suggested a loss of surface sediments from the GCs during penetration of the core into the sediment of 20 cm (St. 12), 37 cm (St. 14), 34 cm (St. 41), and 27 cm (GeoB12806). The data presented here have been corrected accordingly.
Cells of Thiomargarita spp. were collected from a 1 ml sediment subsample upon visual identification using a stereomicroscope. To estimate the biovolume of all Thiomargarita spp. cells in the 1 ml sediment sample, the cells were first divided into different size classes. Then, the number of cells (c) and the average cell radius () were determined for each size class (a) to calculate the total biovolume of all cells per size class assuming a spherical cell structure (Eq. (1)). Finally, the total biovolume of all cells per 1 ml of sediment was determined as the sum of the biovolumes of all size classes (n):
The concentration of intracellularly stored nitrate was determined by nitrate analysis on an autoanalyzer from 200 collected cells after washing them three times in sterile filtered seawater and subjecting them to a cycle of shock freezing and thawing to break the cell walls. From these data, the stored within the large sulfur bacteria ( ) could be calculated.
Porosity was determined from the water loss after freeze-drying assuming a seawater density of 1.023 g cm−3 and a particle density of 2.5 g cm−3. The freeze-dried solid phase was analyzed for POC, total particulate nitrogen (TN), and total particulate sulfur (TS) using an element analyzer (Euro EA, HEKAtech). POC was determined after acidifying the sample with 0.25 N of HCl to remove carbonate. POC content refers to the dry weight percent (wt%) of C (detection limit<0.1 wt% and relative error of 3%). Total iron (TFe) concentration in the solid phase was determined by ICP-OES following digestion in nitric acid, hydrofluoric acid, and perchloric acid (Scholz et al., 2011). For quality control of the procedure, the certified reference material MESS-3 (Canadian Research Council) was digested and analyzed along with the sediment samples. The measured TFe in the reference material was always within the certified range.
A five-step sequential extraction scheme modified after Ruttenberg (1992); Schenau and De Lange (2000), and Küster-Heins et al. (2010) was used for the speciation of particulate P. Approximately 125 mg freeze-dried sediment sample was successively washed with 25 ml of 1) 2 M of NH4Cl (pH 7; 4 h; repeated 8 to 10 times), 2) CDB (citrate-dithionite-bicarbonate) buffer solution (pH 7.5; 8 h), 3) 1 M of sodium acetate buffer solution (pH 4; 6 h), 4) 1 M of HCl (24 h), and 5) 1 M of HCl (24 h) after ignition for 3 h at 550°C. The extracted P components include biogenic P in fish scales, bones, and teeth that are mainly composed of hydroxyapatite (PHydap) from step 1, iron-bound P (PFe) from step 2, authigenic apatite (PAuthigenic) from step 3 typically corresponding to carbonate fluorapatite, detrital P (PDetrital) from step 4, and organic P (Porg) from step 5. The sum of these fractions gives the total P content (Ptotal). The P concentration of the solutions was determined by ICP-OES with a precision of<5%. TS, TFe, and P phases are reported in µmol (g dry weight)−1 of S, Fe, and P, respectively.
Freeze-dried sediment samples were used for determining 210Pb activity. At St. 12, samples (>5 g) were measured for a total 210Pb by a low-background coaxial Ge(Li) detector via its gamma peak at 46.5 keV at Kiel University, Germany (e.g., Bohlen et al., 2011). As there were limited amounts of sediment available for St. 14 and St. 41, samples (0.5 to 3.5 g) were measured by using the well-type HPGe gamma spectrometry system (GWL-100230) at the Institute of Oceanography, National Taiwan University (Geilert et al., 2018). Excess 210Pb (210Pbxs) was calculated by subtracting 214Pb from the total 210Pb. The activities of radionuclides were decay-corrected to the sampling date. All radionuclide data were calculated on a salt-free dry-weight basis.
Mass accumulation and sedimentation rate
Mass accumulation rates (MAR in g cm−2 yr−1) were derived from the 210Pbxs data below the mixed layer. The mixed layer was estimated by visual inspection as the depth where a change in the 210Pbxs content was discernible (Figure 2). Below this depth, particles are transported downwards by burial and compaction (e.g., de Haas et al., 1997). The slope of the regression line of ln(210Pbxs) activity versus depth was used to determine MAR (Huh et al., 2009). Assuming steady-state sediment accumulation, the sedimentation rate (ωacc in cm yr−1), or burial velocity, was then calculated using the porosity (φ∞) of the compacted sediment (0.89 at St. 12, 0.95 at St. 14, and 0.93 at St. 41) and a dry sediment density (ds) of 2.5 g cm−3:
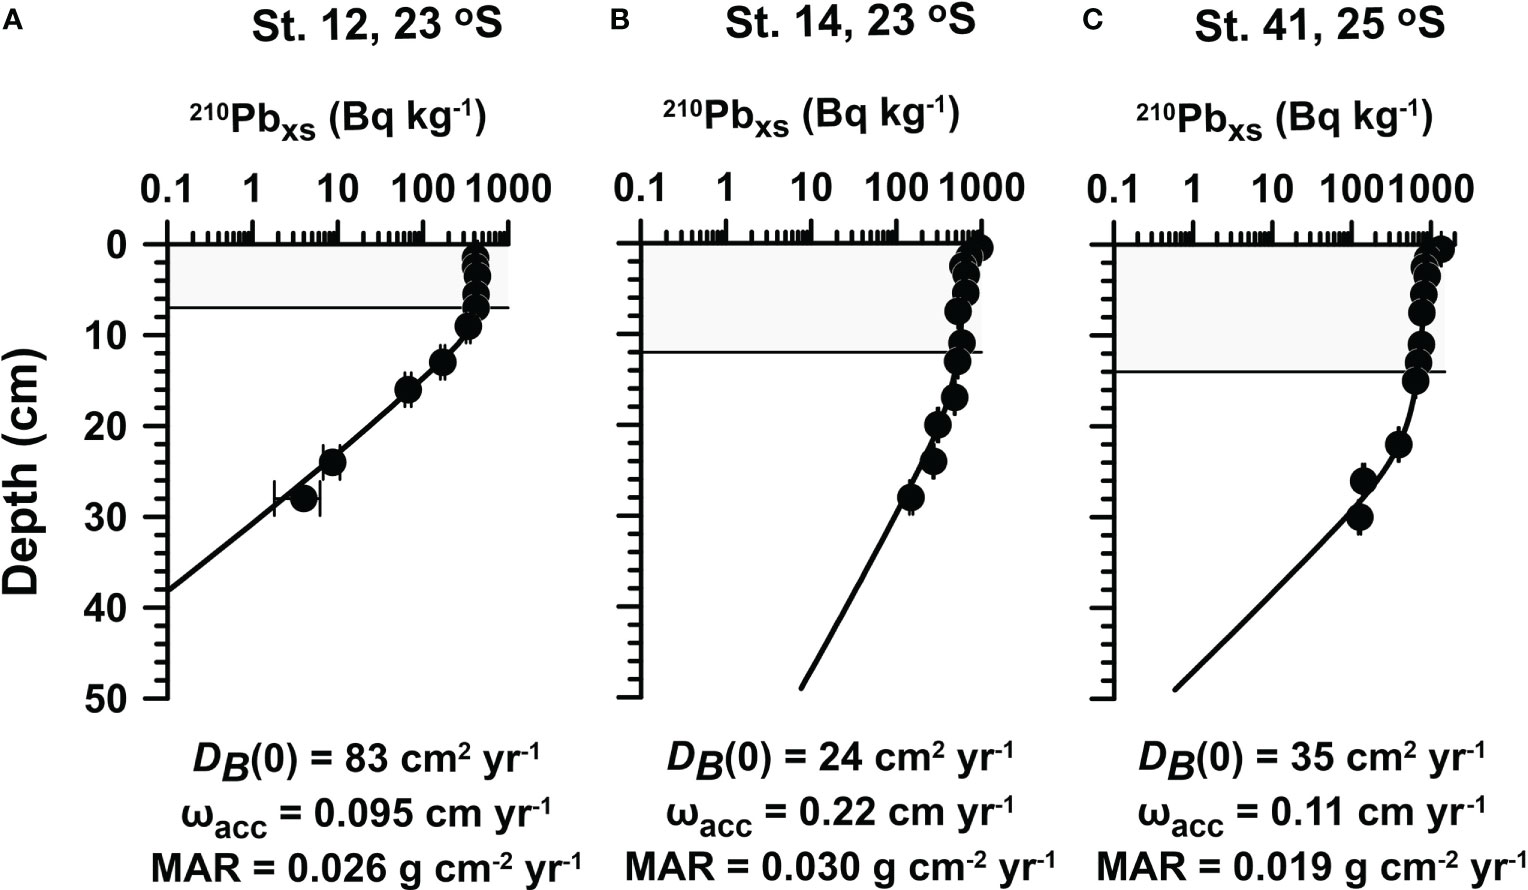
Figure 2 Measured (symbols) and modeled (curves) excess 210Pb (210Pbxs) at (A) St. 12, (B) St. 14, and (C) St. 41. Mass accumulation rates (MAR), sedimentation accumulation rates (ωacc), and bioturbation coefficients [DB(0)] were calculated as described in Sampling and analytical methods. The mixed layer depth is indicated by the gray shaded area.
φ∞ was determined from the porosity data in the same core where 210Pb was measured. We assumed that the derived ωacc values are valid over the depth of our main model simulation (100 cm, see below), which implies steady-state sediment accumulation over the time period during which the top meter was deposited (~1 kyr). Strictly, however, 210Pb-derived sedimentation rates are reliable over the lifetime of the radiotracer (~100 yr).
The 210Pbxs data were further used to determine sediment mixing rates either by animals (i.e., bioturbation) or by current-induced disturbance of the surface layer. The mixing coefficient, DB(0) (cm2 yr−1), was obtained by inverse modeling of the 210Pbxs data following Dale et al. (2021).
Reaction-transport model
To quantify the turnover of C, S, N, and P in the mud belt sediments, a steady-state, vertically resolved 1-D reaction-transport model (RTM) was applied to simulate the geochemical data. The model was based on previous studies of biogeochemical cycles in low-oxygen environments (Dale et al., 2009; Bohlen et al., 2011; Dale et al., 2016a; Dale et al., 2016b; Dale et al., 2019), yet now including two pathways of DNRA and a more comprehensive P cycle, as detailed below.
The RTM includes the biogeochemical network in Figure 3 and simulates the distributions of 15 dissolved species including O2, , , , H2S, CH4, , dissolved inorganic carbon (DIC), , TA (total alkalinity), Ca2+, Mg2+, Fe2+, H2, and stored within the large sulfur bacteria ( ). It further includes 16 solid species, consisting of four fractions of reactive POC, organic sulfur (Sorg), particulate organic nitrogen (Norg), two reactive iron (oxyhydr)oxide fractions (i.e., highly reactive (Fe(OH)3HR) and moderately reactive (Fe(OH)3MR)) and unreactive iron fraction (FeU), and pyrite (FeS2). Five particulate P fractions are considered: Porg, PFe, intracellular polyphosphate (Ppoly), fish bones deposited on the seafloor (PFish), and authigenic hydroxyapatite (PHAp). The operationally defined PAuthigenic fraction is not included since it is negligible in the cores studied (Supplementary Figure 1), which suggests that carbonate fluorapatite is of minor importance. On the Namibian margin, the dominant authigenic phase is hydroxyapatite (Schulz and Schulz, 2005). In the model, measured PHydap is compared to the sum of the simulated PFish and PHAp fractions since these two components cannot be clearly separated analytically. Solids are transported through the sediment column by accumulation (burial) and mixing by animals (bioturbation). Solutes are transported by molecular diffusion, (bio)irrigation, and bioturbation. A complete description of the model is given in the Supplementary Material and Supplementary Tables 2–6. It should be remembered that the steady-state model represents only a snapshot of the reaction rates and fluxes based on the measured geochemical data at the time of sampling. Based on previous non-steady-state modeling of OMZ sediments offshore Peru, we estimate that the seasonality in benthic fluxes varies within 20%–30% of the annual mean (Dale et al., 2017). This can be taken as a rough estimate of the accuracy of our model simulation results.
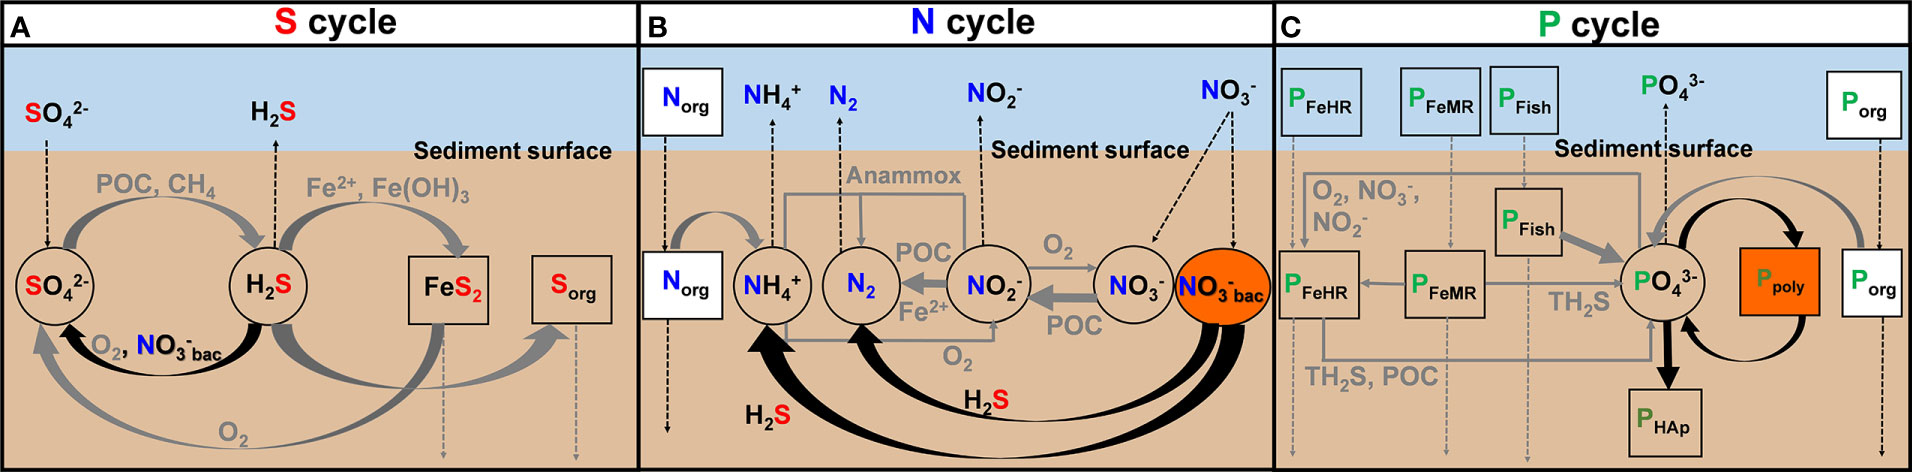
Figure 3 Schematic diagram of key biogeochemical processes of (A) S, (B) N, and (C) P cycles in Namibian mud belt sediments considered in the model, including pathways of biological () reduction by giant sulfur bacteria. The thick black arrows highlight the important reactions related to giant sulfur bacteria.
The primary redox reactions that describe POC remineralization (Supplementary Table 5, R1–R6) by various electron acceptors include aerobic respiration, and reduction, iron reduction, sulfate reduction, and methanogenesis. The total POC degradation rate (RPOC) is the sum of the degradation rates of the four POC fractions (POCi, i =1–4), each assigned with a different first-order reactivity constant (kPOCi, i = 1–4), i.e. a multi-G model (Jørgensen, 1978; Westrich and Berner, 1984). This number of fractions is arbitrary and is the minimum required to capture the evolving trends in the solid phase and solution chemistry at the study sites. POC degradation rates were constrained from the measured , , POC, and TA data and benthic flux data of O2, H2S, , and .
The model includes a range of secondary redox reactions (i.e. those not directly coupled to degradation of POC) including aerobic and anaerobic oxidation of , , H2S, and Fe2+, reductive dissolution of Fe oxides coupled to oxidation of hydrogen sulfide, FeS2 precipitation; and anaerobic oxidation of methane by (AOM). Hydroxyapatite is oversaturated in mud belt porewaters (Goldhammer et al., 2010), and its precipitation is modeled as a first-order kinetic process that is dependent on the porewater concentration (Supplementary Table 6; R23) and is constrained with the measured data (Figure 4). Porg and PFish are added to the sediment from the water column and undergo simple first-order dissolution. PFe arrives at the seafloor with iron (oxyhydr)oxides and is also formed authigenically during the precipitation of iron (oxyhydr)oxides (e.g., Slomp et al., 1996). PFe is considered for both highly reactive and moderately reactive fractions (PFeHR and PFeMR). The kinetic rate constants for these processes were either constrained from the data or taken from the literature (Supplementary Table 4).
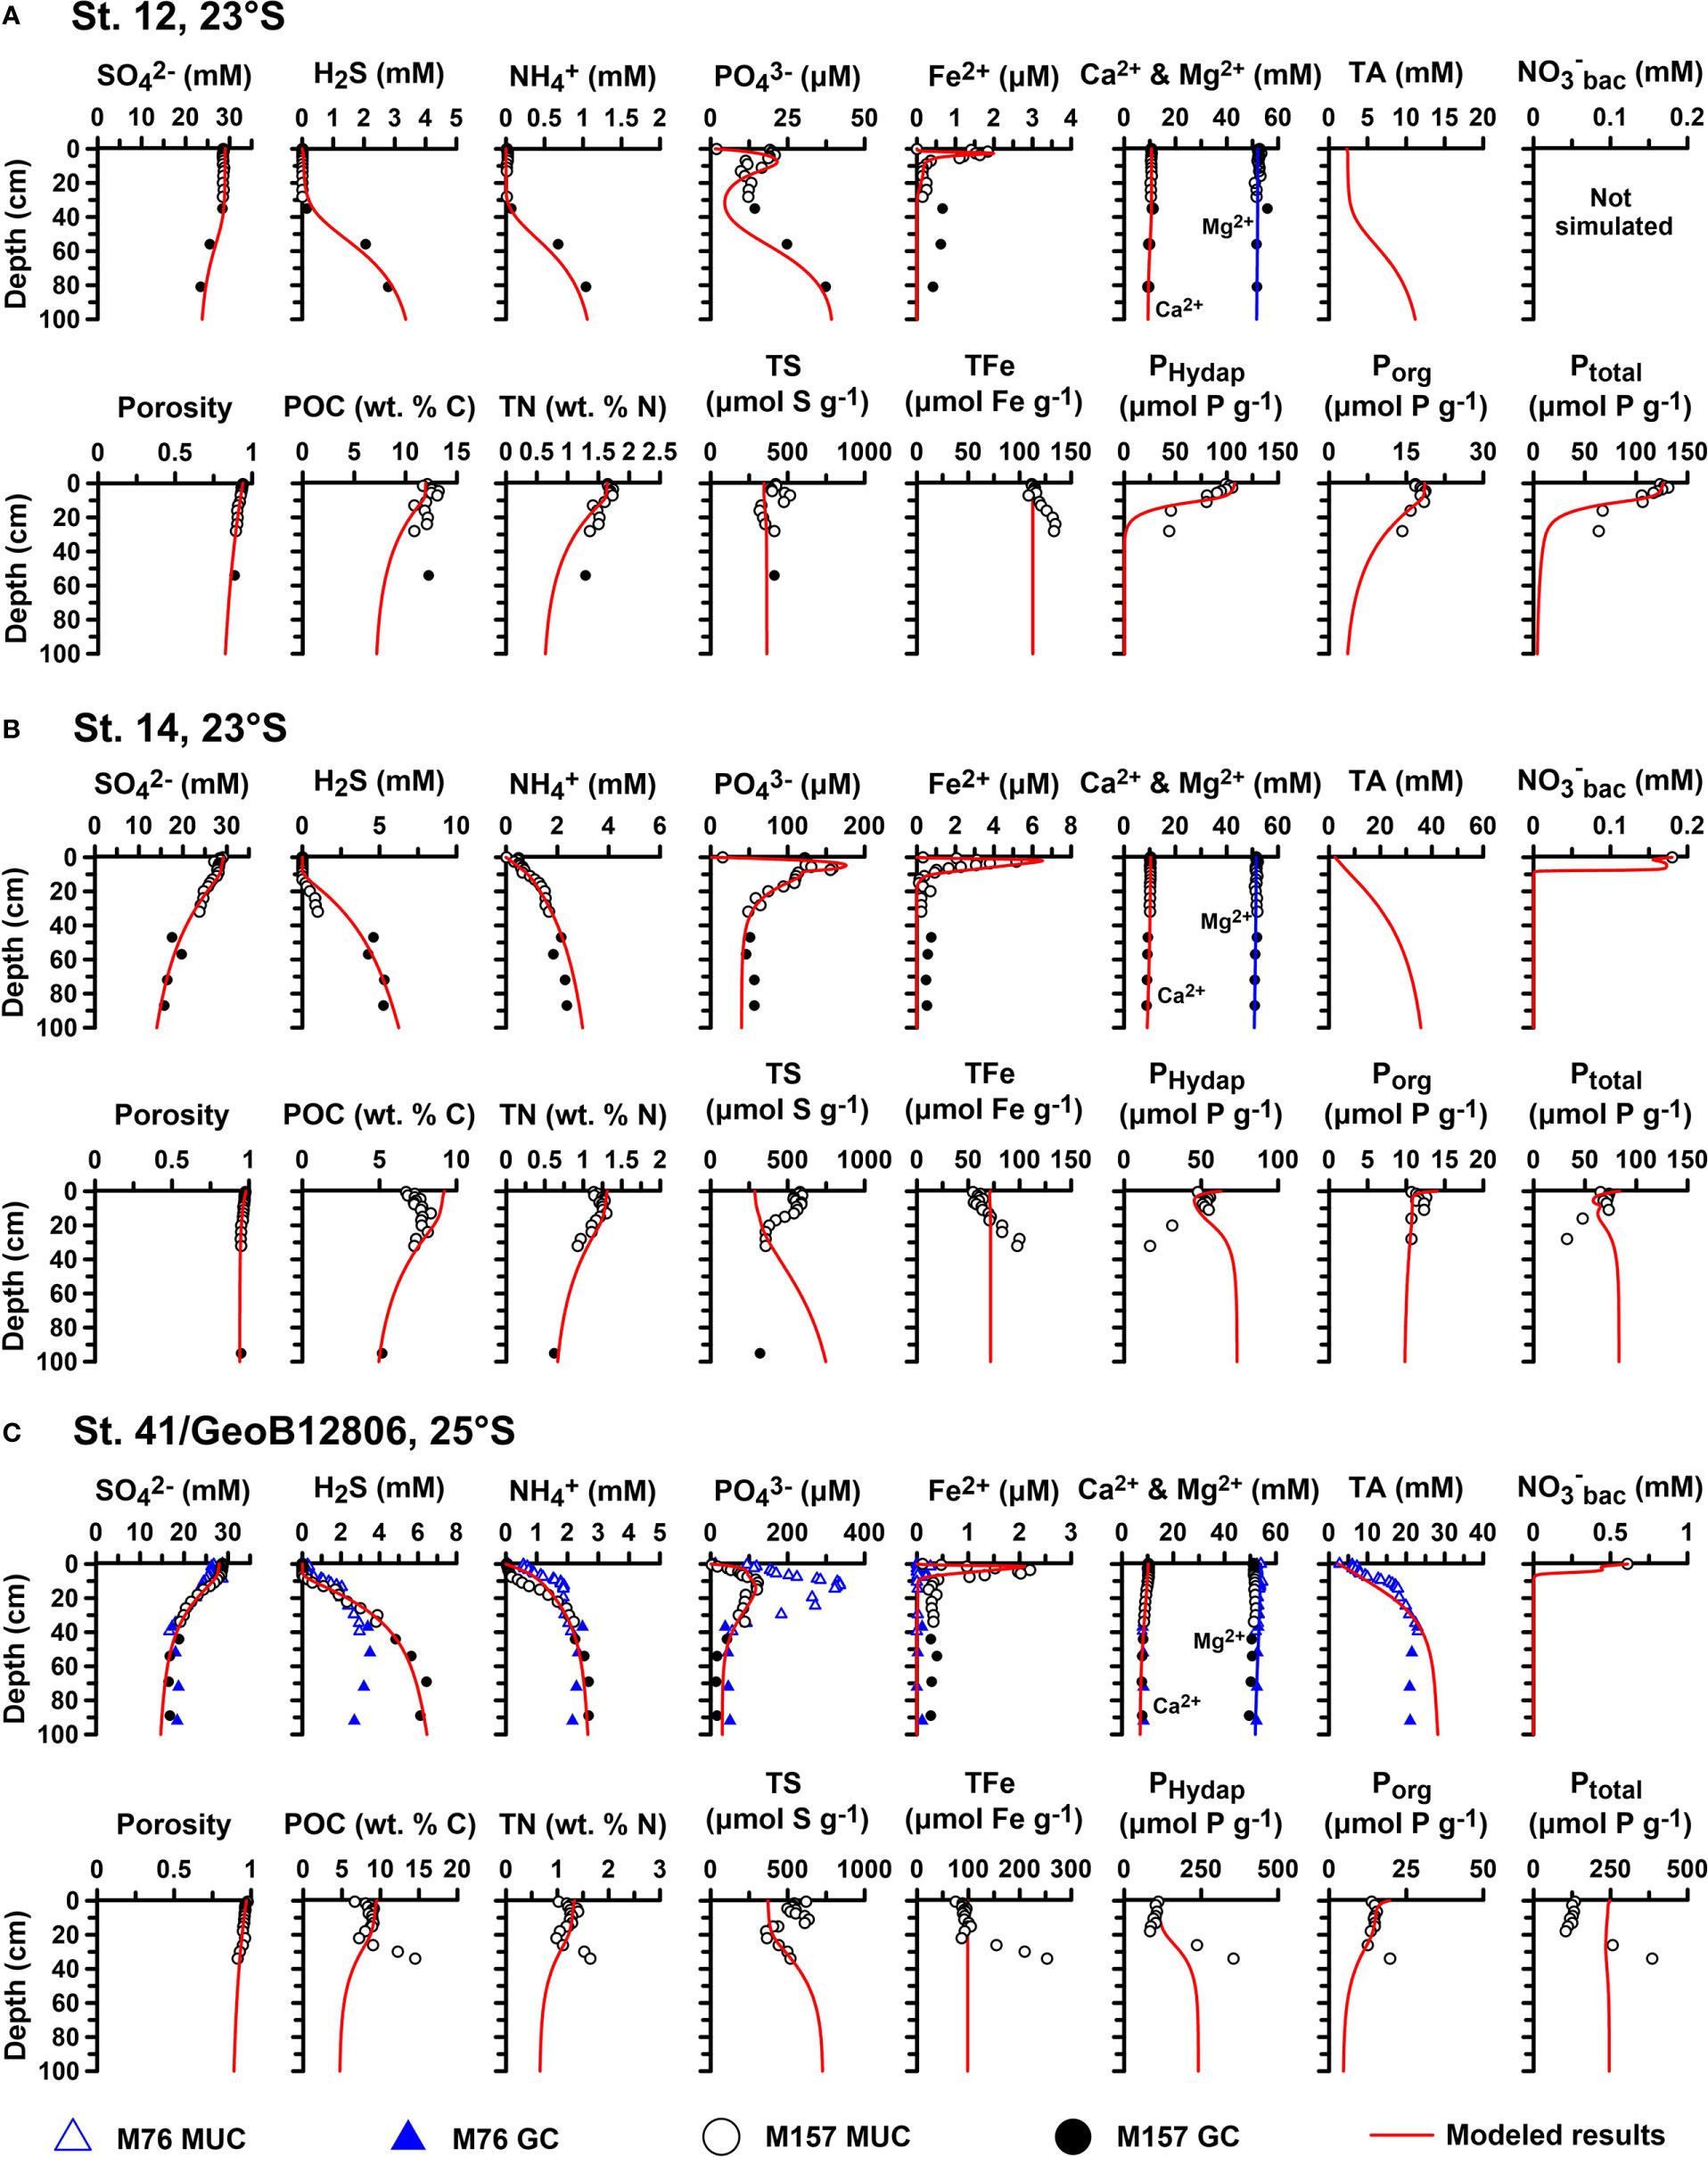
Figure 4 Modeled (curves) and measured (symbols) depth profiles of solutes, porosity, and solid species in the upper 100 cm at (A) St. 12, (B) St. 14, and (C) St. 41/GeoB12806. Sediments were collected with a multiple-corer (MUC) (open symbols) and a gravity corer (GC) (filled symbols) during R/V Meteor cruises 157 (circles) and 76 (triangles).
The key reactions associated with the LSB are H2S oxidation and the associated P recycling (Figure 3). The model does not differentiate between the different species of large sulfur bacteria since these microorganisms share similar biogeochemistry (Otte et al., 1999; Schulz and Jørgensen, 2001; Mußmann et al., 2007; Winkel et al., 2016). Two pathways of H2S oxidation coupled to nitrate reduction were considered (Winkel et al., 2016). The first is the DNRA:
and the second is DNRN2:
Fewer moles of H2S are required to reduce 1 mole of nitrate with N2 as the end product versus . DNRN2 also leads to a net loss of 0.25 alkalinity equivalents, whereas DNRA has no net alkalinity change. The rates of DNRA and DNRN2 were constrained by the porewater H2S depletion in the upper sediment layers, concentrations, and in surface sediments. The rate of uptake and storage as Ppoly in LSB was dependent on contents and ambient concentrations. Since it is unclear whether Ppoly is extracted from the leaching steps (Goldhammer et al., 2010), the modeled Ppoly pool was added to the sum of other modeled P species and compared to total extracted P fractions (Ptotal).
LSB require a continuous source of to sustain their metabolic activity. Some members of the Beggiatoaceae like Ca. Maribeggiatoa spp. are motile and can take up from the bottom water by extending their filaments through the sediment surface (Schulz and Jørgensen, 2001). However, the exact mechanism by which Thiomargarita spp. access is poorly understood. Since Thiomargarita spp. are probably non-motile, it has been argued that passive mixing of the sediment by strong bottom currents is required for them to replenish their intracellular reservoir (Schulz and Jørgensen, 2001). The rate of mixing of sediments required to simulate H2S depletion in surface sediments would be equivalent to ca. 3 cm2 d−1 over the upper 10 cm (Dale et al., 2009). This mixing intensity would result in homogenous 210Pbxs contents within the mixed layer, which is inconsistent with the observed more gradual decrease in 210Pbxs in the mixed layer (see Results). Consequently, without further information on how Thiomargarita spp. capture , was transported into the sediment assuming a non-local source term analogous to that described by Dale et al. (2009) (see Supplementary Table 2).
The total model length was 650 cm, although the focus here is on the upper 100 cm where reaction rates are the highest. By simulating a depth larger than the section of interest, we avoid artifacts caused by imposing lower boundary conditions for solutes at 100 cm. From 100 down to 650 cm, the model is only fit to the , H2S, , and POC data with the aim of providing a more robust assessment of the slowly degrading organic matter fractions in the top 100 cm (Dale et al., 2011). The kinetic rate constants for organic matter degradation become more uncertain with depth below 100 cm since sediment accumulation cannot be assumed to have been at a steady state over 650 cm. For this reason, we relegate model simulation plots below 100 cm to the Supplementary Material.
The model was solved using MATHEMATICA software and run to steady state. Upper boundary conditions for all species are listed in Supplementary Table 1 and comprise fixed concentrations for solutes and fluxes for solids. At 650 cm, a zero-gradient Neumann boundary was imposed for all species, except for H2S and at St. 12 where a non-zero gradient was configured from the measured concentration gradients.
Results
Sediment biogeochemistry
Sediment geochemical data in the top 100 cm at the four sites are shown in Figure 4, and , H2S, , and POC data within the upper 650 cm are shown in Supplementary Figure 2.
The upper sediments were characterized by a high-water content. Porosity decreased slightly from 0.98 to approximately 0.9 at St. 14 and St. 41 and from 0.93 to approximately 0.82 for St. 12 (Figure 4). 210Pbxs distributions indicated a surface mixed layer of 7 cm, 12 cm, and 14 cm at St. 12, St. 14, and St. 41, respectively (Figure 2). A rather high mixing coefficient was determined for St. 12 (83 cm2 yr−1), with lower values at St. 14 (24 cm2 yr−1) and St. 41 (35 cm2 yr−1). MAR ranged from 0.019 to 0.030 g cm−2 yr−1 across the sites. As expected from the respective locations, sedimentation rates were the highest at St. 14 (0.22 cm yr−1) compared to St. 41 (0.11 cm yr−1) and St. 12 (0.095 cm yr−1). These are in the same order as those determined at other sites on the Namibian shelf and slope (~0.1 cm yr−1, Dale et al., 2009; Emeis et al., 2009).
POC contents were within previously reported values for the mud belt (Figure 4), ranging from 5% to 15% (Inthorn et al., 2006). TN contents displayed similar trends as POC. Mean C/N ratios were 8.9, 7.5, and 8.4 at St. 12, St. 14, and St. 41, respectively (Supplementary Figure 1). TS contents varied between 317 and 636 µmol g−1. Total iron (TFe) increased with depth from 112 to 135 µmol g−1 at St. 12 and from 55 to 100 µmol g−1 at St. 14, whereas it decreased with depth from 158 to 132 µmol g−1 at St. 41/GeoB12806. Ptotal concentrations were lowest at St. 14 (< 70 µmol g−1) and highest at St. 41 (>300 µmol g−1) and showed either a general decrease (St. 12 and St. 14) or increase (St. 41) in the top 30 cm (Supplementary Figure 1). More than 68% (St. 12), 52% (St. 14), and 77% (St. 41) of P extracted from the solid phase were composed of PHydap. Porg was the next most abundant phase, with PAuthigenic, PFe, and PDetrital being of minor importance. Porg concentrations were fairly similar at all sites with little down-core variability (15–20 µmol g−1). Mean organic C:Porg ratios were 592, 537, and 507 at St. 12, St. 14, and St. 41, respectively. The mean ratios of C to total reactive P (Preactive = PHydap + PFe + PAuthigenic + Porg) were 102, 106 and 54. Overall, more than 95% of P was Preactive.
Thiomargarita spp. were present at St. 14 and St. 41 and at other stations in the mud belt but absent at St. 12 (Zabel et al., 2019). The total biovolume of Thiomargarita spp. at St. 14 (0.2 µl ml−1 of sediment) was lower than at St. 41 (2.5 µl ml−1 of sediment). The opposite is true regarding intracellular concentrations at these sites, which were 445 mmol L−1 of biovolume at St. 14 and 188 mmol L−1 of biovolume at St. 41. These values were converted to porewater equivalents using a porosity of 0.9. The average concentrations on a porewater basis at St. 14 and St. 41 were 0.10 and 0.52 mmol L−1 of porewater, respectively. For all sampling stations at 23°S and 25°S where Thiomargarita spp. were observed, the mean was 0.18 mmol L−1 of porewater and 0.61 mmol L−1 of porewater, respectively. These data are used in the model as boundary conditions for intracellular (Supplementary Table 1).
In general, concentrations decreased over the upper 100 cm due to microbial degradation of organic matter (Figure 4). At St. 12, concentrations in the top 30 cm were unusually constant and close to seawater values. and H2S concentrations at St. 12 showed a similar behavior to with very low concentrations in the top 30 cm. At St. 14, increased immediately below the sediment surface, whereas H2S remained at µM levels down to 15 cm, below which H2S increased to 5 mM at 40 cm. The two proximate sites St. 41 and GeoB12806 showed a mixed picture, with higher and H2S concentrations immediately detectable below the sediment surface at St. GeoB12806. At St. 41, and H2S concentrations were low in the upper 10 cm but then increased to similar levels as at St. GeoB12806. The gravity core data below 100 cm show that and H2S concentrations continued to increase at St. 14 and St. 41, whereas at St. 12, they both decreased steadily toward the bottom of the core (Supplementary Figure 2). High levels of total alkalinity in excess of 20 mM were measured at St. GeoB12806, presumably due to the anaerobic breakdown of organic matter by sulfate reduction.
Plots of versus were used to estimate the molar ratio of produced versus reduced, rN:S, at St. 14 and St. 41, assuming that sulfate reduction is the dominant carbon respiration pathway (Burdige, 2006; Burdige and Komada, 2013; Dale et al., 2021). The changes in porewater and concentrations were calculated relative to the bottom water concentrations (shown as the capital delta, Δ, in Figure 5). The left-hand side of the following equation is the slope of the linear regression of the data shown in Figure 5:
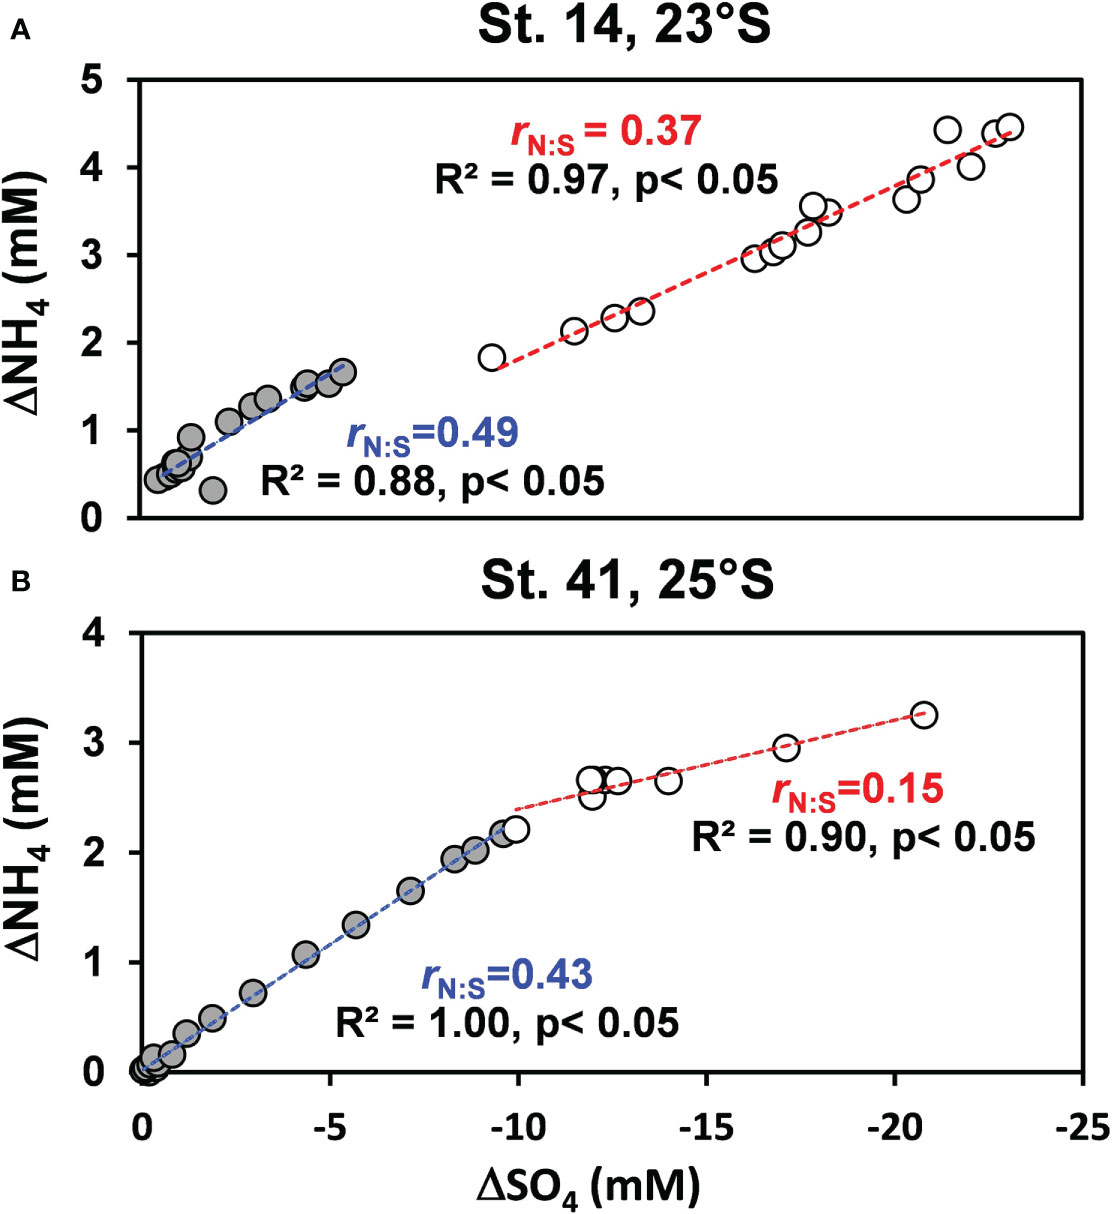
Figure 5 property–property plots for the changes in porewater and concentrations relative to the bottom water concentrations (shown as the capital delta, Δ) at (A) St. 14 and (B) St. 41. The slope of the correlation ( ) is used to calculate rN:S (Eq. (5)). The data for each regression were chosen by eye from the conceivable changes in slope. In panel (A), the filled circles represent data from 0.5 to 32 cm, and the open circles below 47 cm. In panel (B), the filled circles represent data from 0.5 to 34 cm, and the open circles below 44 cm.
where Di is the bulk molecular diffusion coefficient of solute i (Supplementary Table 3). For Redfield C/N stoichiometry of 16, and assuming that the organic carbon being oxidized has an oxidation state of zero, the expected slope between and is 0.3 (Dale et al., 2021). rN:S values in the mud belt were higher and decreased with sediment depth. At St. 14, rN:S decreased from 0.49 to 0.37, and at St. 41, rN:S decreased from 0.43 to 0.15.
Dissolved Fe2+ concentrations displayed a surface peak of up to 5 µM at all stations. The Fe2+ peak was more pronounced at St. GeoB12806 compared to St. 41. Below 10 cm, Fe2+ levels were <1 µM. The Fe2+ peaks were coincident with local maxima in concentrations, which reached the highest levels of ca. 340 µM at St. GeoB12806. Ca2+ and Mg2+ showed little change from bottom water values over depth at St. 12 and St. 14, indicating little or no net carbonate precipitation, whereas at St. 41, Ca2+ and Mg2+ decreased to 8.3 and 50.0 mM at 100 cm.
Diagenetic model simulations
Baseline model simulations showed a very good correspondence with the field data over the upper 100 cm (Figure 4) and over 650 cm for , H2S, , and POC (Supplementary Figure 2). This was mainly achieved by adjusting the rate constants for POC degradation and the boundary fluxes of POC at the seafloor. The unchanging concentrations of , H2S, and down to 35 cm at St. 12 (Figure 4A) could only be simulated assuming intense (bio)irrigation of porewater solutes, as discussed later. The model was able to reproduce the surface Fe2+ and peaks, and the measured particulate P fractions were reasonably well simulated (Figures 4B, C).
The total modeled flux of POC (i.e. the rain rate) to the seafloor required to achieve a good correspondence between porewater and solid phase data and the model was 17.5, 9.0, and 12.8 mmol m−2 d−1 at St. 12, St. 14, and St. 41/GeoB12806, respectively (Table 1). According to the model, the most reactive POC fraction was highly labile, with first-order degradation constants of 33, 30, and 12 yr−1 at St. 12, St. 14, and St. 41, respectively, corresponding to half-lives of 8, 8, and 21 days. This fraction is completely oxidized within the mixed layer. The less reactive fractions have half-lives (calculated from the rates constants) of 30–9,000 years and are degraded over greater depths. Depth-integrated rates of POC mineralization were 8.7, 6.1, and 9.1 mmol m−2 d−1 of C at St. 12, St. 14, and St. 41/GeoB12806 (Supplementary Table 7; Supplementary Figure 3). Sulfate reduction (R5, Supplementary Table 7; Supplementary Figure 3) was the major POC remineralization pathway and the major sink for sulfate (5.0–7.7 mmol C m−2 d−1). The other POC remineralization pathways were negligible by comparison (Supplementary Table 7).

Table 1 Organic carbon budget at the three sites in the northern BUS compared with published data.
The model predicted that the H2S produced by sulfate reduction at St. 14 and St. 41 was mainly consumed by DNRA and DNRN2 in the upper 10 cm (Supplementary Figure 4). Depth profiles of ∑DNRA + DNRN2 rates at St. 14 and St. 41 (Supplementary Figure 4) were almost identical to total H2S oxidation rates, demonstrating that these pathways were mainly responsible for H2S oxidation. The sum of these two rates (R15 + R16) was 1.9 and 3.4. mmol m−2 d−1 of H2S, respectively, (Supplementary Figure 3D). At St. 12, where no LSB were observed, the model predicted that a small fraction of H2S was oxidized aerobically, with the bulk of H2S inferred to be lost to the overlying water by (bio)irrigation (model data not shown). At St. 14 and St. 41, POC degradation and DNRA contributed equally to production (Supplementary Figure 3). At these stations, DNRN2 was twice as high as DNRA and thus the major nitrate reduction pathway.
Depth-integrated rates of biogenic PFish dissolution were similar at the three stations (R29; 0.33 –0.43 mmol P m−2 d−1; Supplementary Table 7; Supplementary Figure 3). Organic P dissolution rates were comparatively lower (0.031–0.19 mmol P m−2 d−1), and rates of iron-associated P turnover were negligible. Although PFish dissolution rates were similar across the sites, peak concentrations were <25 µM at St. 12, but 150 µM at St. 14 and >100 µM at St. 41 (Figure 4). The model is able to reproduce the peaks at St. 14 and at St. 41 as well as the particulate P contents when Ppoly accumulation and breakdown were included in the model. Ppoly turnover was apparently rapid (1.8 mmol P m−2 d−1 at St. 14). By contrast, PHAp precipitation rates ranged from <0.01 mmol P m−2 d−1 at St. 12 to 0.24 mmol P m−2 d−1 at St. 41.
, , and H2S modeled fluxes ranged from −0.3 to −1.6, −0.3 to −0.5, and −0.0013 to −2.97 mmol m−2 d−1 at St. 12, St. 14, and St. 41, respectively (Supplementary Table 8). By comparison, the fluxes of + (hereafter ) ranged from 0.86 to 5.18 mmol N m−2 d−1 (Supplementary Table 8), showing that the sediments were a net sink for . The modeled flux ratios of : were thus negative (approximately −1.1 to −2.1). Including the intracellular uptake of leads to even lower ratios of −2.2 to −18.5 (Supplementary Table 8). Modeled flux ratios of total dissolved inorganic N ( + + ): ranged from −1.1 to 4.6 and DIC: from 12 to 31 (Supplementary Table 8). These are much lower than the respective Redfield ratios of 16 and 106 and demonstrate strong enrichment of dissolved P from the sediment to the water column relative to N and C (Supplementary Table 8). The highest predicted benthic O2 flux was 2.5 mmol O2 m−2 d−1 at St. 12, and the lowest value was calculated for St. 14 (0.71 mmol O2 m−2 d−1). Modeled fluxes compare well with flux measurements made using benthic chambers during the same campaign and with ex situ diffusive fluxes (Figure 6). Clearly though, the variability in measured fluxes is high.
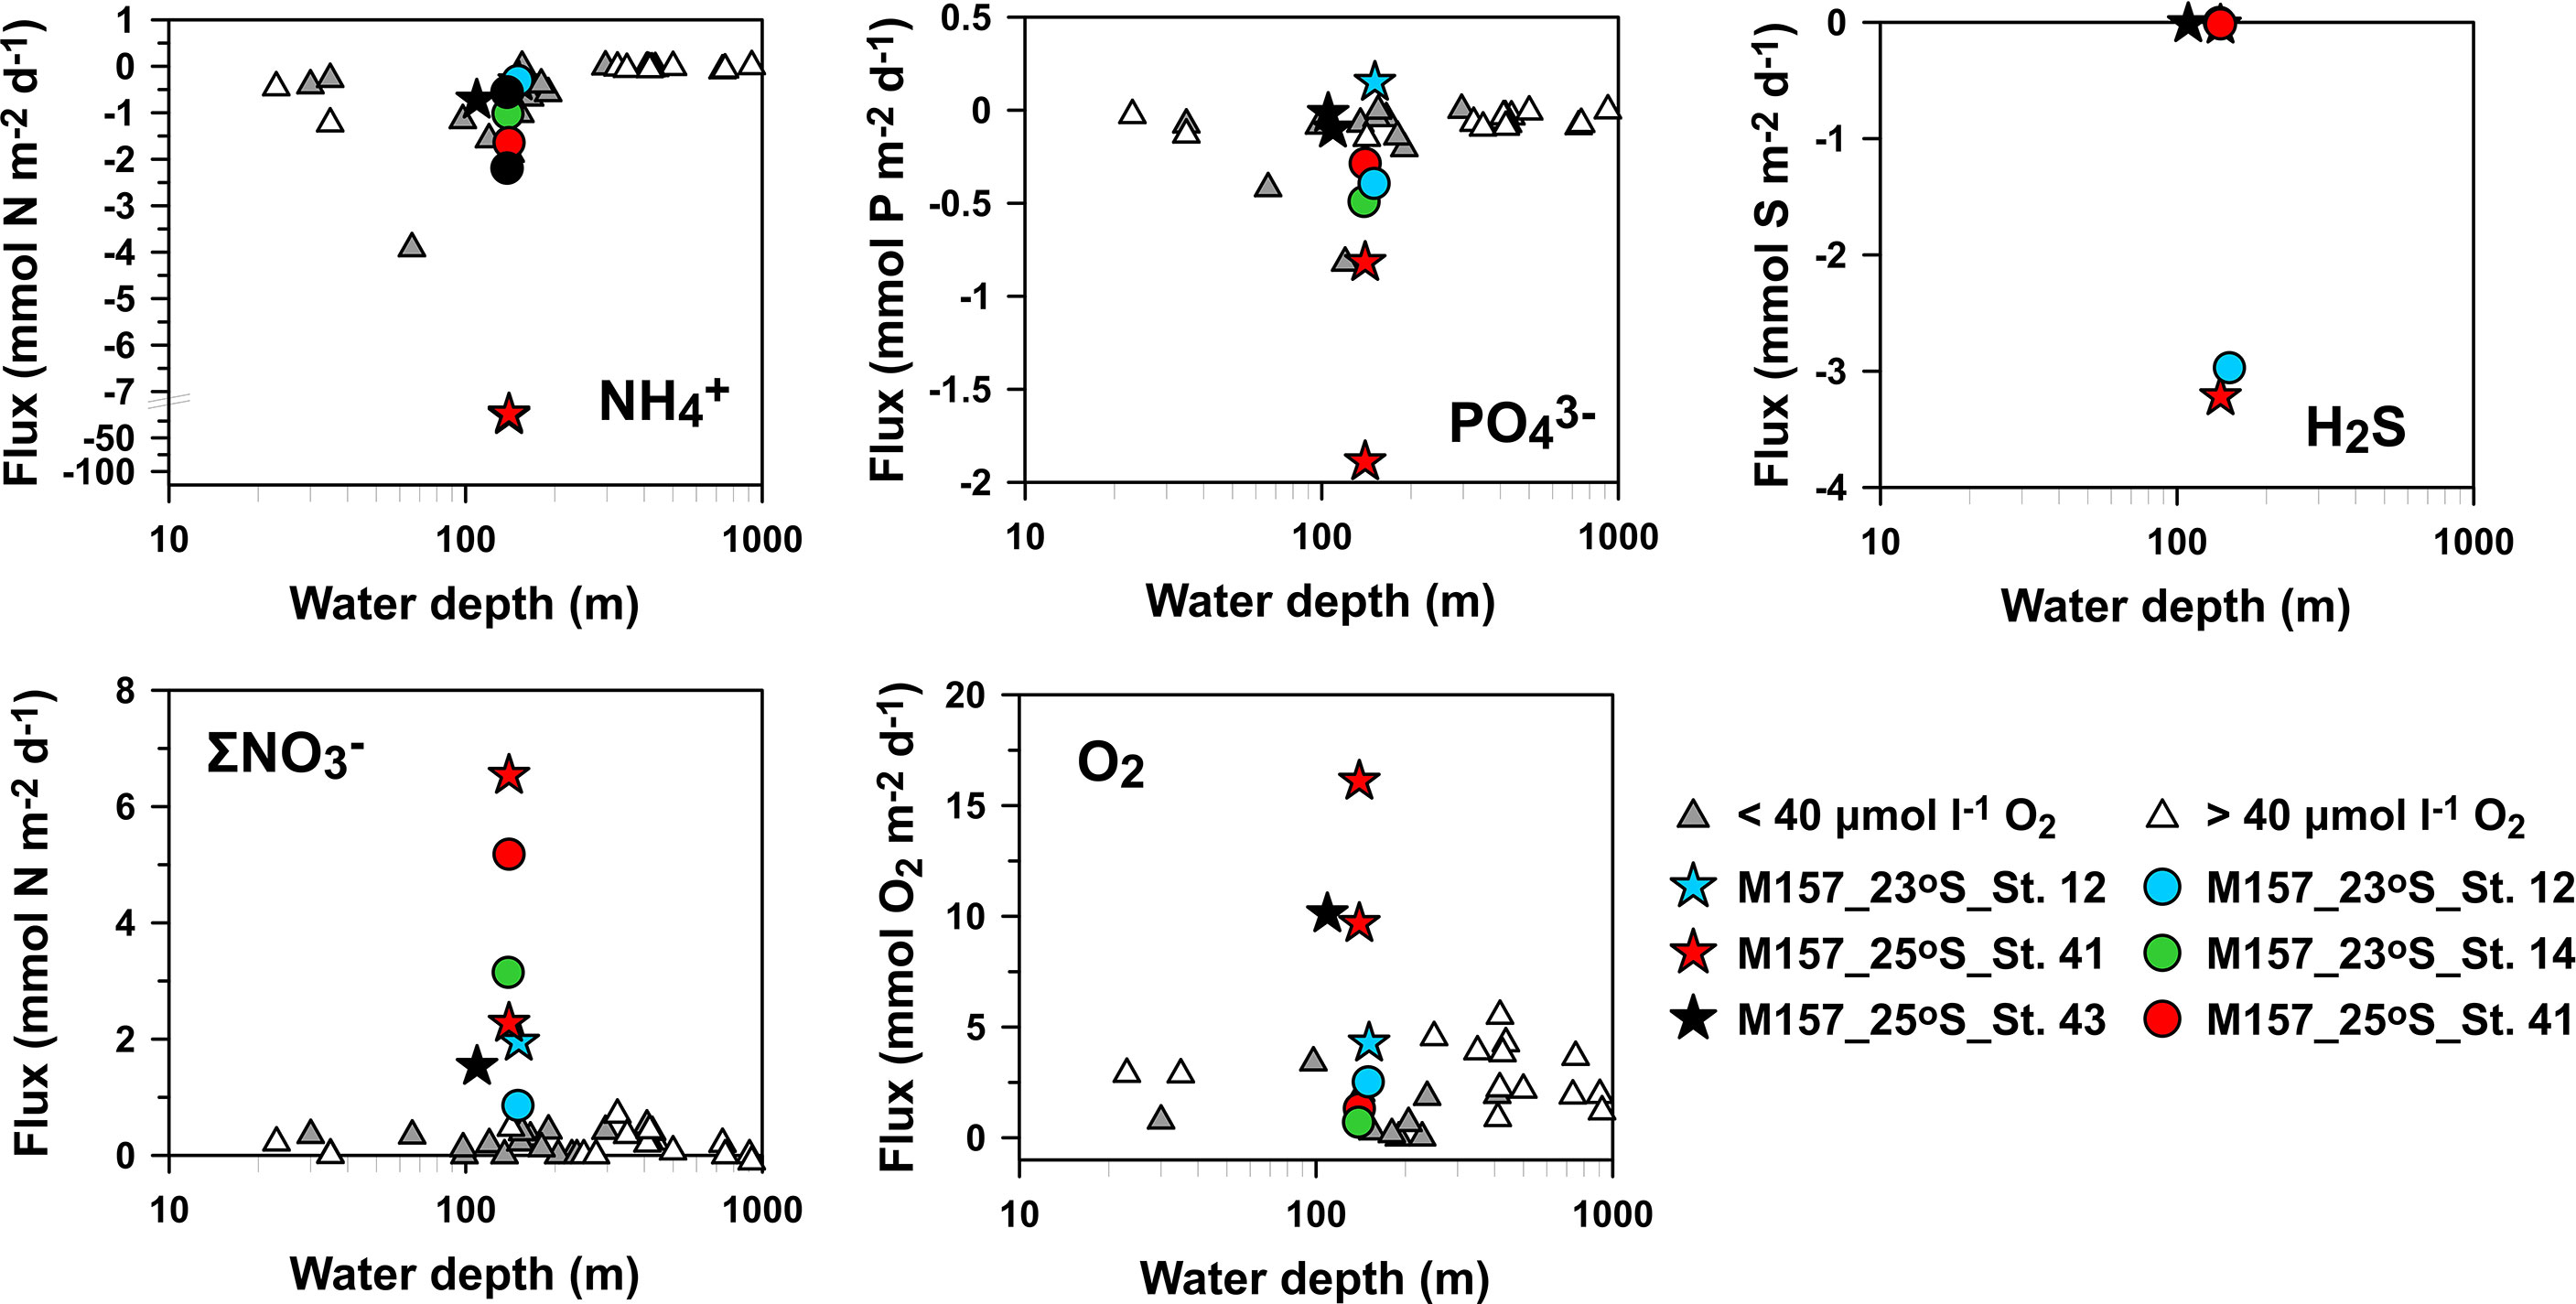
Figure 6 Comparison of modeled benthic fluxes (circles) with in situ benthic fluxes measured using benthic chambers during M157 (stars; Sommer et al., in prep). and ex situ diffusive fluxes (triangles; Neumann et al., 2016) versus water depth (logarithmic scale). Ranges of modeled benthic fluxes for St. 14 (green bars) and St. 41 (red bars) reflect a sensitivity analysis with and without sulfide oxidation by large sulfur bacteria (LSB). Note the axis break for . Positive fluxes are directed into the sediment and vice versa. Note that red and green circles overlap in the H2S plot.
Discussion
POC degradation and burial
High biological productivity has led to the formation of an extensive mud belt parallel to the coastline in the northern BUS that consists of organic-rich diatom ooze interspersed with fish debris and phosphorite deposits (Bremner, 1980; Emeis et al., 2004). Our model-derived POC rain rates (~9 to 18 mmol C m−2 d−1) compare well with previously reported values from sediment traps of 13.7 mmol C m−2 d−1 (Table 1). This is approximately 10% of primary production (137 mmol C m−2 d−1; Emeis et al., 2018). Consequently, POC accumulation rates in the sediment (~7 to 15 mmol C m−2 d−1; Table 1) are equivalent to 3%–7% of primary production, which can be interpreted as the overall preservation efficiency of newly synthesized POC (Table 1). This is similar to other reports from the Namibian and Peruvian shelf (Dale et al., 2015; Emeis et al., 2018), but far lower than the 40% estimated for the 100m isobath in the mud belt by Brüchert et al. (2003). This might be because POC rain rates and burial rates were not directly measured by these workers but inferred from other data. It should be noted that the mean measured sulfate reduction rates reported by Brüchert et al. (2003) for the 100 m isobath (20 mmol S m−2 d−1) require carbon rain rates of at least 40 mmol m−2 d−1 of POC according to the reaction stoichiometry, a factor of 2–4 higher than those at our sites. Although temporal variability cannot be dismissed, these discrepancies underscore the heterogeneity of benthic carbon turnover in the mud belt and, possibly, highly patchy preservation efficiencies of new production. Spatial heterogeneity of benthic carbon remineralization is further evident in the banded distribution of organic carbon across the mud belt and in the wide range of benthic solute fluxes (Bremner, 1983; Neumann et al., 2016; Sommer et al., in prep).
The carbon burial efficiency (CBE, %) with regard to the deposition of POC at the seafloor can be estimated as POC accumulation rate / rain rate × 100%. CBEs for our sites were calculated using the POC accumulation rates at 10 cm depth (for comparison with similar data from Peru, see Table 1) and the model-derived rain rate. This calculation assumes that the organic matter reaching the seafloor has been deposited vertically from the photic zone. The derived CBEs were rather similar: 84%, 78%, and 67% at St. 12, St. 14, and St. 41, respectively (Table 1). CBEs calculated from sediment trap data were lower at 50% (Emeis et al., 2018).
Amino acid degradation indices (DI; Dauwe et al., 1999) in surface sediments of nearby stations have been published (Nagel et al., 2016), where high DI values indicate good preservation of organic matter. Based on values at nearby sites, the DI is approximately 0.9 at St. 14, 0.7 at St. 41, and 0.4 at St. 12, suggesting that organic matter is more degraded at St. 12. Similar logic can be inferred from the lower C:N ratios in surface sediments at St. 14 and St. 41 (~7) compared to St. 12 (~9) (Supplementary Figure 1). Based on these results, the decrease in CBE from the mud belt sites to St. 12 might have been expected to be more pronounced.
Additional controlling factors for carbon preservation include oxygen availability and bioturbation. Exposure of organic particles to oxygen is understood to promote carbon degradation (Hedges and Keil, 1995; Hartnett et al., 1998). Bioturbation can further enhance the oxygen exposure time through continual sediment reworking. Faunal community analysis suggests that the macrofaunal biomass is higher at St. 12 at the western edge of the mud belt compared to St. 14 and other mud belt sites along 23°S (M. Zettler, pers. comm). This agrees with mixing rates inferred from 210Pbxs, which were the highest at St. 12 (Figure 2). Bottom water O2 levels at the edge of the mud belt also tend to be greater than sites closer to land (Nagel et al., 2016). These observations dovetail with the findings from the DI and C/N ratios, whereby the conditions at St. 12 ought to be conducive to a lower CBE compared to St. 14 and St. 41. We speculate that the CBE calculation at St. 12 is confounded by the lateral transport of organic particles in the bottom nepheloid layers (Inthorn et al., 2006; Mollenhauer et al., 2007). Offshore particle transport leads to an incremental deposition of older, reworked material, as described for deeper water on the margin (Inthorn et al., 2006) and for the Peruvian margin and the Californian basins (Berelson et al., 1996; Arthur et al., 1998; Dale et al., 2015). Since this material is inherently less reactive than material deposited vertically from the photic zone, POC accumulation rates will be skewed upwards, along with the calculated CBE (i.e. at the western-most St. 12).
The CBEs in the central mud-belt are markedly higher than 33% determined at similar water depths on the Peruvian inner shelf (Figure 7 and Table 1). DI values on the Peruvian shelf (~0.2 to 0.6) and total hydrolyzable amino acid contents are low compared to deeper waters in the permanently anoxic OMZ (Lomstein et al., 2009). This suggests that the organic matter on the Peruvian inner shelf is in a more advanced degradation compared to the central Namibian mud belt. The relatively low CBE on the Peruvian shelf is suspected to be caused by periodic oxygenation of bottom waters during the passage of coastal trapped waves that can raise O2 levels above 100 µM and increase the oxygen exposure time of organic particles on the seafloor (Gutiérrez et al., 2008; Dale et al., 2015). Oxygenation is further associated with a shift in the macrofaunal community from tube-dwelling, interface feeders to burrowing, deposit feeders, and a further increase in oxygen exposure time (Gutiérrez et al., 2008). In Namibia, such vigorous ventilation events are less frequent (Schmidt and Eggert, 2016; Pitcher et al., 2021), and organic matter preservation in the mud belt might instead be driven by the long-term redox state of the bottom waters. Nevertheless, due to the high porewater H2S levels in the mud belt, sulfurization of organic carbon very likely further increases carbon preservation (Wakeham et al., 1995; Brüchert et al., 2000), although its quantitative significance is largely unknown (Dale et al., 2009). At Peru, porewaters tend to be depleted in H2S in the upper 10 to 20 cm due to very efficient oxidation by gliding Marithioploca spp. (Dale et al., 2016a).
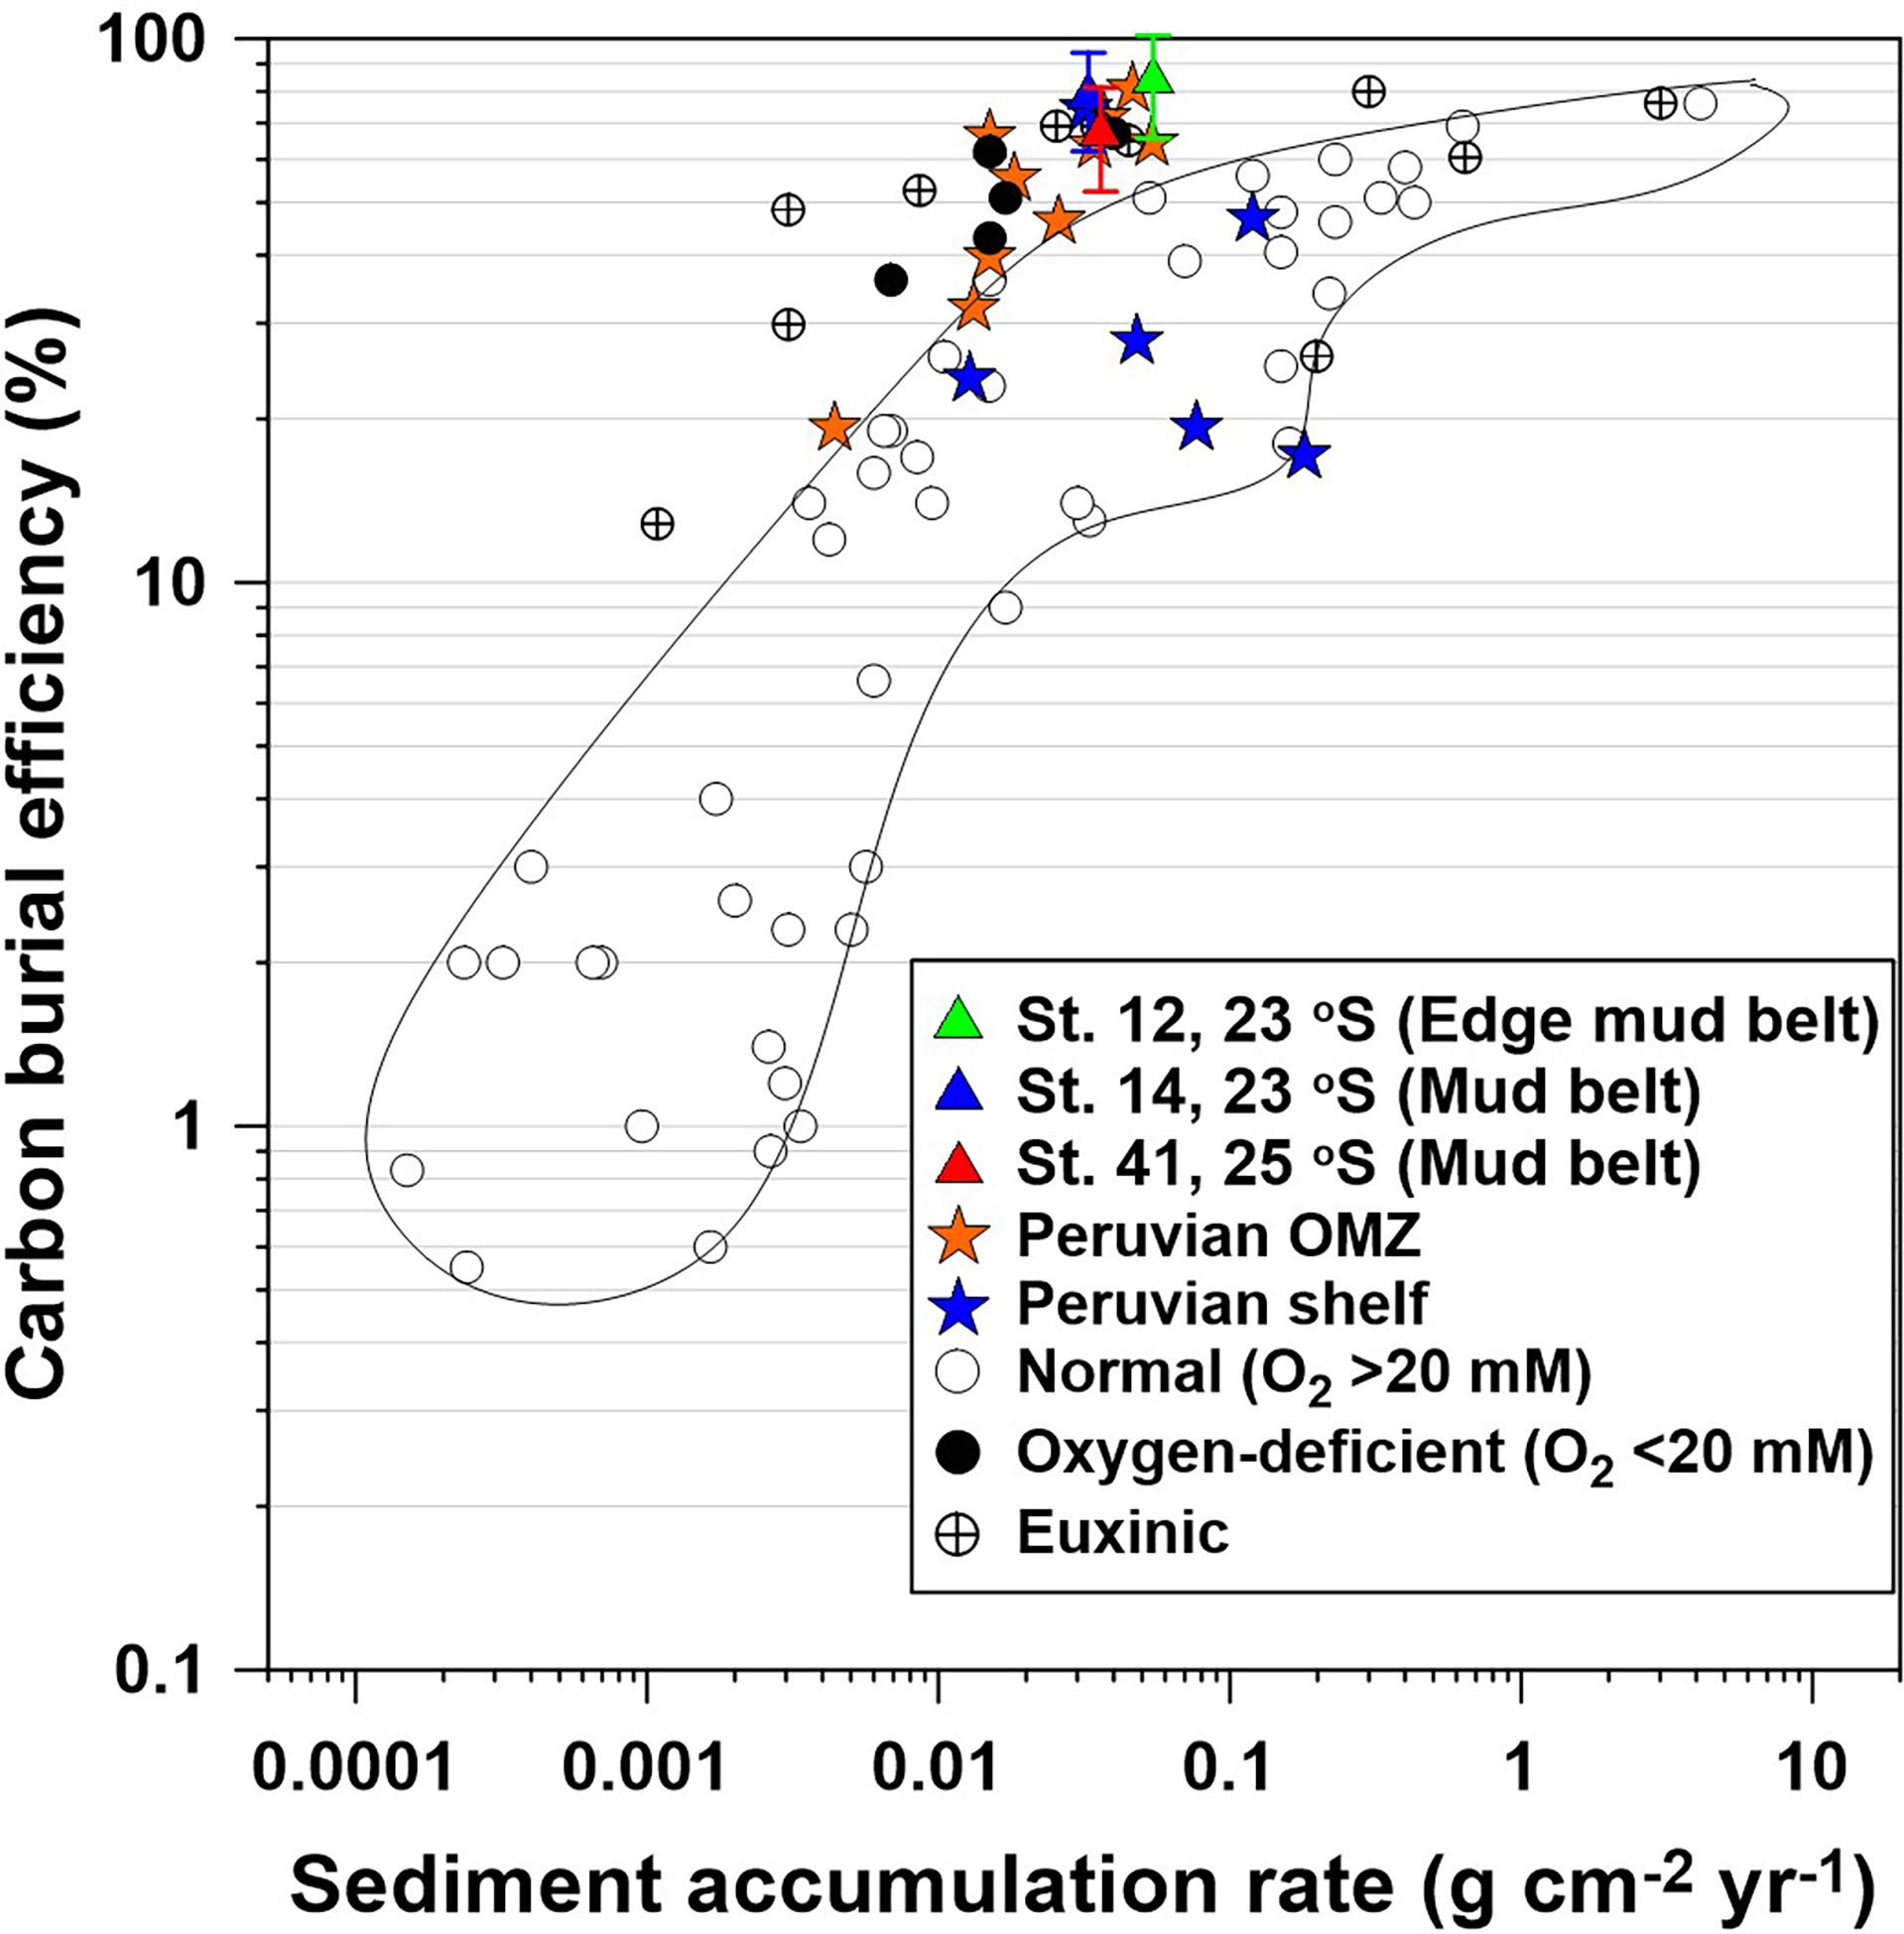
Figure 7 Carbon burial efficiency (CBE) versus sediment accumulation rate in contemporary ocean sediments. Blue and orange stars indicate CBE at 10 cm depth for the shelf sites of the Peruvian margin (from Dale et al., 2015). Open and filled circles represent sites from published studies with bottom water O2 >20 and<20 μM, respectively; the former is enclosed by the solid line. Euxinic settings are also indicated (see Dale et al. (2015) for data sources). Green, blue, and red triangles are data from this study for CBE calculated at 10 cm depth (see text). Error bars were calculated using standard error propagation rules assuming a 20% uncertainty in ωacc and particulate organic carbon (POC) content at 10 cm.
Coupled S and N cycling by LSB
Persistently low O2 levels in bottom waters on the Namibian shelf preclude aerobic respiration as the major POC degradation pathway in mud belt sediments. Instead, sulfate reduction is the major redox process for carbon mineralization (Brüchert et al., 2003). The sulfide produced by microbial sulfate reduction provides an energy source for LSB that thrive by oxidizing sulfide via dissimilatory nitrate reduction pathways (Schulz et al., 1999; Brüchert et al., 2003). These bacteria exert an important control on the distribution of H2S in the porewater and its flux to the water column. At St. 14 and St. 41 where LSB were observed, porewaters were depleted in H2S down to ca. 15 cm, which agrees with the depth distribution of LSB observed by Schulz et al. (1999). Benthic H2S fluxes were negligible at St. 14 and St. 41. Benthic H2S fluxes were also negligible in the mud belt at 23.5°S (St. 226680), even though sulfate reduction rates were fivefold higher (Table 2; Dale et al., 2009). Consequently, the H2S oxidation efficiency by LSB at these locations is close to 100%. However, the picture across the mud belt is much more variable. Using data from 25 to 125 m water depth on the Namibian margin, Brüchert et al. (2003) reported significant fluxes of H2S from the sediment (−1 to −32 mmol S m−2 d−1), with a mean H2S oxidation efficiency of only 16%. Sommer et al. (in prep.) also measured significant variability in benthic H2S fluxes in the mud belt.
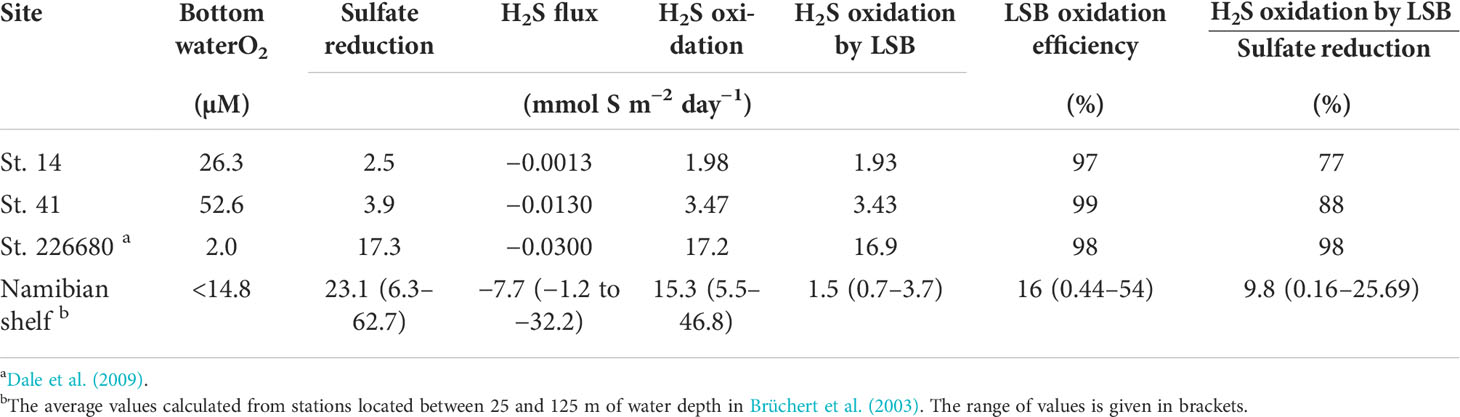
Table 2 Depth-integrated modeled rates of sulfate reduction, H2S oxidation, and the benthic H2S flux in sediments inhabited by LSB.
H2S fluxes tend to be correlated with the distribution of LSB (Brüchert et al., 2006). These workers noted that some Beggiatoaceae strains, e.g., Ca. Maribeggiatoa spp., are more efficient at detoxifying H2S compared to others, e.g., Thiomargarita spp., which are “leaky” with regard to benthic H2S emissions. Different physiological adaptations may partly explain this behavior. The H2S oxidation potential of Thiomargarita spp. depends on the amount of stored within their vacuoles that, in turn, is thought to rely on physical resuspension events for replenishment (Schulz and Jørgensen, 2001). Being both filamentous and motile, Ca. Maribeggiatoa spp. have an ecological advantage over Thiomargarita spp., since they can access the seawater pool directly by extending their filaments into the bottom water and by gliding vertically through the sediment. Therefore, Ca. Maribeggiatoa spp. are able to oxidize H2S to greater depths below the sediment surface (Schulz and Jørgensen, 2001). The impact of filamentous Marithioploca in the Peruvian OMZ is even more striking. They are able to maintain H2S-free porewater down to 30 cm or more despite similar rates of sulfate reduction as in the mud belt (Henrichs and Farrington, 1984; Fossing et al., 1995; Dale et al., 2016a). The dominant microbial community at any particular location could help to explain why sulfidic events in the Peruvian OMZ are rare compared to the northern BUS. It is thus essential that ecosystem models are able to incorporate the regional distribution of LSB communities into their predictions (Schmidt and Eggert, 2016).
Although Thiomargarita spp. were observed in our sediment samples, rates of DNRA and DNRN2 by LSB were not measured directly but estimated via curve fitting of modeled and measured porewater data. Sensitivity tests show that the predicted H2S oxidation rates by LSB are well constrained by the measured and H2S data (Supplementary Figure 5). increases markedly if the H2S concentrations are instead fit to the data by assuming that DNRA is the only S oxidation pathway by LSB, which justifies including DNRA in the model. Turning off DNRA and DNRN2 raises the concentrations of H2S over the whole sediment core but lowers the concentrations of . At the same time, the uptake decreases to 0.41 mmol m−2 d−1 and fluxes decrease to −0.56 and −0.84 mmol m−2 d−1 at St. 14 and St. 41, whereas H2S fluxes increase to −1.6 and −3.0 mmol m−2 d−1 (Table 3).
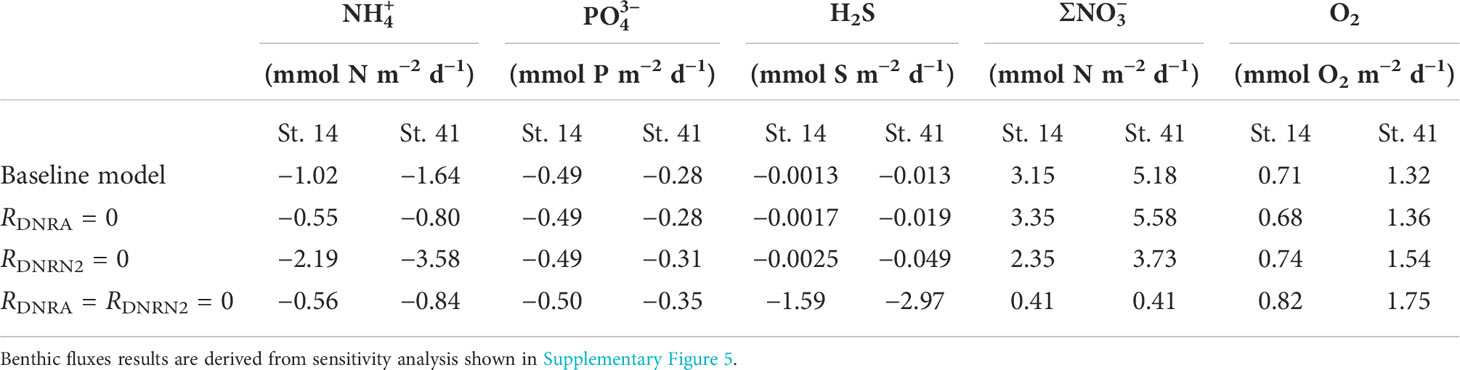
Table 3 Modeled benthic fluxes for St. 14 and St. 41 derived from sensitivity analysis with and without sulfide oxidation by LSB.
Further evidence of DNRA is provided by the measured rN:S ratios (Figure 5). These can be used to derive the C-to-N ratio of organic matter undergoing degradation, rC:N (Dale et al., 2021), and compared to measured ratios in the sediment cores. Assuming a POC oxidation state of zero, rC:N is equal to 2/rN:S, where the factor 2 denotes the moles of POC oxidized per mole of reduced during microbial sulfate reduction (Supplementary Table 5). This gives rC:N values of 4.1 and 4.7 for the upper sections of the sediment at St. 14 and St. 41, respectively (Figure 5). The measured C:N ratios in the upper sections (top ca. 30 cm) are far higher and range from ~7 to 11 (Supplementary Figure 1). The excess in the porewater can be attributed to DNRA (Dale et al., 2016a).
Unfortunately, we could not apply this approach to quantify DNRN2 due to the analytical challenges of measuring dissolved N2, in sediment porewaters (Prokopenko et al., 2011). Genomic investigations of several LSB species underline their ability to oxidize H2S through chemotrophic denitrification (Mußmann et al., 2007; Winkel et al., 2016). This includes species of the genera Thiomargarita spp. and Ca. Maribeggiatoa spp., which were most abundant in the investigated sediments (Fabian et al., data unpublished). So far, a genome of the Namibian species Thiomargarita namibiensis has not been published. Incubation experiments of isolated organisms tentatively suggest that they are able to switch between DNRA and DNRN2 (Schulz, 2006, Fabian et al., unpublished). Nevertheless, little is known about the conditions under which each metabolism becomes active in Thiomargarita cells (Sweerts et al., 1990; Otte et al., 1999).
Working with mats of filamentous LSB in the Guaymas Basin, Schutte et al. (2018) proposed that the availability of H2S and determines whether denitrification (DNRN2) or DNRA dominates within a single organism. In situations with a high supply of H2S relative to , microorganisms gain more energy per reduced by carrying out DNRA (Schutte et al., 2018). H2S can be oxidized more efficiently via DNRN2 if supply is plentiful, for example, close to the sediment–water interface (compare Eq. (3) and (4)). The ratios between DNRN2 and DNRA at St. 14 and St. 41 are on the same order of magnitude as determined for the microbial mats in the Guaymas Basin (~2–3). Although the sensitivity analysis confirms the need to include DNRN2 in the model to capture the trends in porewater data and benthic fluxes, more direct measurements of this process are needed to ascribe DNRN2 to Thiomargarita spp. in the mud belt and quantify the rate more accurately. It is important that this effort is made since turnover is dominated by DNRN2 at the sites studied here (see Supplementary Figure 3D, R16). Given that DNRN2 results in a loss of bioavailable inorganic N, changes in the relative proportion of DNRN2 versus DNRA could have broader implications for the N:P ratio of regenerated nutrients released from the seabed and the oxygen budget of the OMZ (see below).
Unexplained H2S depletion at St. 12
Our model predicts similar rates of sulfate reduction at St. 12 and St. 41 (Supplementary Figure 3B, R5). Given that the sediments of St. 12 were not colonized with LSB, the pore waters ought to be enriched with H2S to a similar degree as St. 41. Dissolved H2S concentrations at St. 12 were nearly negligible down to 35 cm depth. This lack of H2S accumulation in the sediment porewater, along with and concentrations that were close to bottom water values, is suggestive of a rapid exchange of porewater and seawater at this site. These trends were simulated using a pseudo-(bio)irrigation exchange process applied over the upper sediment layers. This has the effect of bringing into the sediment whilst simultaneously flushing H2S out as soon as it is produced by sulfate reduction, along with produced by ammonification. Similar trends have been reported elsewhere including the Namibian continental slope (Fossing et al., 2000). Bioirrigation by animals can be ruled out because burrowing and tube-dwelling animals at this site were not observed below ca. 5cm depth (Zettler, pers. comm.). Seawater infiltration through tubes and cracks created by methane gas bubbles rising through the soft surface sediments can create similar porewater patterns to those at St. 12 (Haeckel et al., 2007; Brüchert et al., 2009; Chuang et al., 2013). Although free gas is widespread in the mud belt and ebullition has been observed as acoustic backscattering (Emeis et al., 2004; Currie et al., 2018), there was no evidence in acoustic Parasound data for free gas directly beneath the coring site at St. 12. Non-steady-state deposition of a sediment layer due to mass wasting from shallower waters is an unlikely alternative explanation because the mud belt is rather flat. The 210Pbxs data also show a gradual decrease below the mixed layer (7 cm) rather than a homogeneous signal expected from turbidite deposition. For similar reasons, mixing of the upper 35 cm by bottom currents can be excluded. Although the model is able to simulate the field data at St. 12, the mechanistic explanation for the trends in H2S, , and concentrations remains open to interpretation.
Phosphorus cycling in the mud belt
Continental margins are major sites of phosphorus removal from the global ocean (Wallmann, 2010; Ruttenberg, 2014). In the mud belt, biogenic PFish and Porg are the most important P phases delivered to the sediments (Supplementary Figure 3), similar to the Peruvian OMZ (Suess, 1981; Lomnitz et al., 2016). Our model predicts that the dissolution of these components is important in the northern BUS sediments, in addition to Ppoly turnover. PFe has a negligible impact on levels (Supplementary Figure 3) due to low reactive iron content in the sediment (Brüchert et al., 2003; Dale et al., 2009). Thus, the coincident subsurface peaks in porewater and Fe2+ are not evidence for the control of levels by iron mineral dissolution. PFe plays a more significant role below the OMZ where bottom water O2 levels are higher and sediments are less reducing (Küster-Heins et al., 2010).
Preferential dissolution of Porg relative to POC results in low organic C:P remineralization ratios (Goldhammer et al., 2011) and high residual particulate organic C:P ratios exceeding 500 that are characteristic of anoxic sediments (Slomp and Van Cappellen, 2007). The burial efficiency of Porg is only 2%–13% (Supplementary Table 8), which is similar to <2%–11% for other anoxic settings (Dale et al., 2016b). However, since a fraction of P liberated from PFish and Porg is precipitated as hydroxyapatite, C:Preactive is much lower (54–106). This “sink-switching” enhances the permanent burial of P (Ruttenberg and Berner, 1993; Slomp et al., 1996). Nonetheless, the benthic fluxes remain highly P-enriched relative to both dissolved C and N. This behavior, in addition to nitrogen removal in the water column (Kuypers et al., 2005), contributes to the low observed N:P ratios (e.g., 4.6:1) in bottom waters (van der Plas et al., 2007).
Model sensitivity tests can illustrate this interplay more clearly (Figure 8). If is released exclusively from Porg remineralization, concentrations increase continuously with depth, and the observed subsurface peak is not simulated (solid blue lines) (Van Cappellen and Berner, 1988). Including hydroxyapatite precipitation brings down the overall concentrations but results in negligible PHydap content (blue dashed lines). The benthic flux in this case (−0.17 mmol m−2 d−1) is lower than the baseline model result of −0.28 mmol m−2 d−1. With PFish dissolution included, the peak and flux can be correctly simulated but at the cost of overestimating PHydap in the upper 20 cm where the peak is located (red curves). Further inclusion of Ppoly dynamics lowers PHydap to match the observations and increases the flux slightly (black curves). Indirect evidence in support of this finding is provided by observed fish bones and scales at St. GeoB12806 (Zabel et al., 2012) in addition to measured hydroxyapatite precipitation rates in mud belt sediments of 0.21–0.78 mmol P m−2 d−1 (Goldhammer et al., 2010) that agree with those in the example in Figure 8 (0.28 mmol P m−2 d−1 at St. 41).
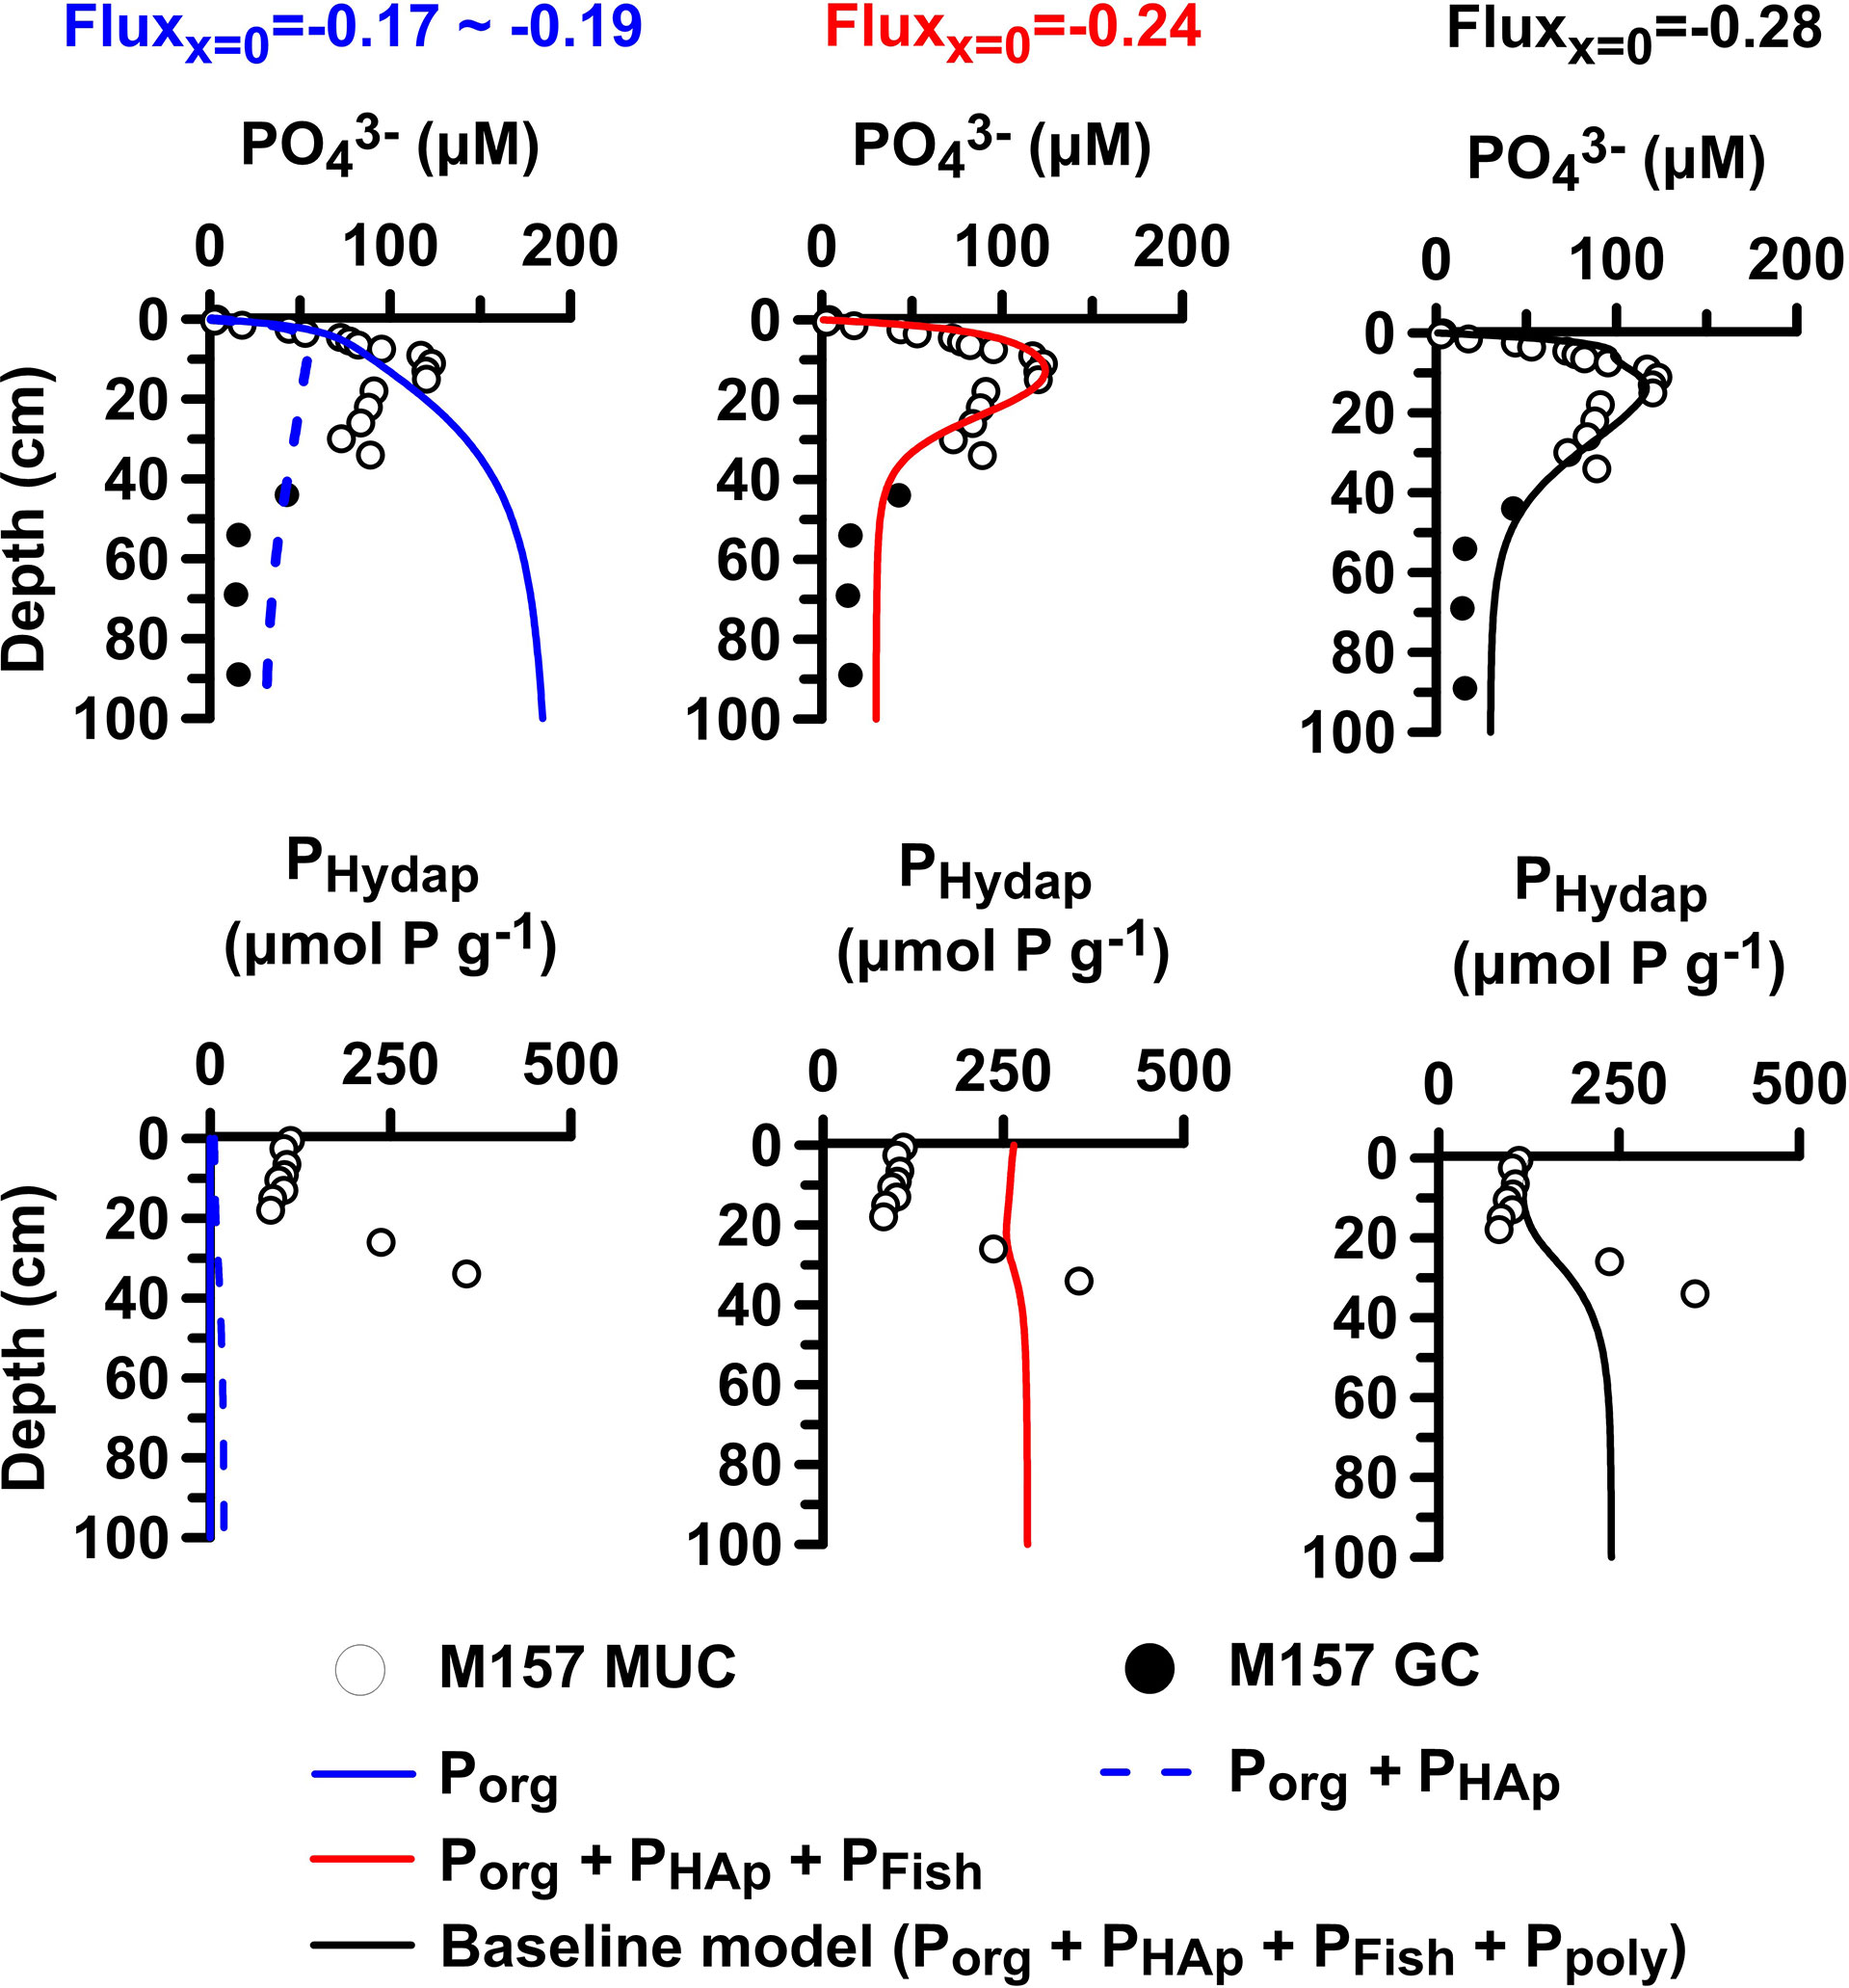
Figure 8 Model sensitivity analysis of porewater and PHydap at St. 41 for increasing model complexity (see text). Baseline model values are shown as black curves and measured data as symbols. PFe is included in the plots, but since it makes a negligible contribution to total P, the corresponding data are not shown explicitly. The changing benthic at each step is shown above each plot.
In the current model configuration, intracellular Ppoly accumulation and breakdown of LSB dwarf other P cycling pathways, although the net rate of Ppoly build-up and breakdown is small (Supplementary Figure 3). Modeled intracellular Ppoly accumulation rates (0.21–1.83 mmol P m−2 d−1, Supplementary Table 7) are similar to P uptake rates by LSB of 0.25–1.2 mmol P m−2 d−1 in the incubation experiments by Goldhammer et al. (2010). These might be minimum estimates because the presence of polyphosphate kinase 1 (ppk1) and exopolyphosphatase (ppx) in mud belt samples indicates the potential for a wide range of microorganisms to synthesize and hydrolyze Ppoly in addition to LSB (Zoss et al., 2019). It will remain difficult to pinpoint the significance of Ppoly until its abundance and turnover can be better quantified. Standard operationally-defined wet chemical extractions do not include Ppoly explicitly, and it is currently unclear whether it is wholly or partially recovered in these approaches (Goldhammer et al., 2010). Advanced analytical techniques such as 31P NMR and Raman spectroscopy are more promising since they are able to quantify Ppoly contents in biogenic material such as intracellular polyphosphate inclusions, dissolved organics, and sinking particles (Diaz et al., 2008; Fernando et al., 2019).
For these reasons, the linkage between microbial P uptake and Ppoly accumulation remains speculative, especially with regard to settings exposed to variable redox conditions and our understanding of the environmental tipping points for microbial P release (Langer et al., 2018). Sudden onset of anoxic conditions can trigger massive P release from LSB and induce the spontaneous precipitation of hydroxyapatite (Schulz and Schulz, 2005). The same dynamic was invoked to explain large enrichments in porewater following the onset of seasonal hypoxia in Eckernförde Bay (Dale et al., 2013). Supporting experimental evidence has been provided by Langer et al. (2018), who used 18O–H2O labeling experiments with the Beggiatoa sp. strain 35Flor to elucidate a metabolically active Ppoly pool under both oxic and anoxic conditions with higher Ppoly enrichments under oxic conditions. These workers, and others (Brock and Schulz-Vogt, 2011), further showed that high sulfide levels are an additional stress-inducing factor leading to a loss of intracellular P. This is clearly of particular relevance for the mud belt. The role of H2S on microbial P dynamics has not been considered in the model due to a lack of empirical data on the relevant H2S threshold concentrations for intracellular P breakdown.
Conclusions and future perspectives
Ocean deoxygenation has become a widespread phenomenon throughout the world, and global ocean deoxygenation has strong impact on ocean productivity, nutrient cycling, carbon cycling, and marine habitats (Breitburg et al., 2018). With the model developed in this study, we have been able to provide some clarity on potential feedback between the activity of LSB and the recycling fluxes of N and P from the sediment to the water column. The novel findings with regard to N and P cycling are two-fold: i) N turnover by DNRN2 is quantitatively more significant than the sum of DNRA and denitrification, and ii) the nutrient fluxes are strongly enriched in P relative to N, in part due to the activity of LSB. This points toward a potential negative feedback by LSB on primary production close to the coast. Given that Beggiatoaceae communities cover an area of the shelf > 30,000 km2 (Brüchert et al., 2006), this underscores the need to correctly account for benthic N turnover by LSB in regional models of the northern BUS. Our model predictions would profit from experimental studies quantifying rates of DNRN2 and DNRA by Beggiatoaceae strains commonly found in the BUS and the environmental conditions under which they might switch between these pathways.
The conceptual P cycle in the model is consistent with available empirical observations from the mud belt. However, the impact of LSB on hydroxyapatite precipitation and P burial could not be clearly substantiated. The model is tuned to simulate the data under a set of simplifying assumptions concerning the P cycle. The natural benthic P cycle is complex, and the model treats key P turnover pathways in a basic manner (e.g., Ppoly dynamics) or ignores them altogether (e.g., nucleation of apatite precursors). Unfortunately, there are little published data to significantly improve the conceptual P model from its current incarnation. Significant advances could be made with better analytical separation between authigenic hydroxyapatite and allochthonous hydroxyapatite (e.g., fish bones), both of which are major components of particulate P in OMZs. Additional and potentially large uncertainties are further associated with C, S, and nutrient cycling under seasonally changing bottom water redox regimes. Regional ecosystem models could be used to test plausible scenarios of how seasonal dynamics of LSB modify nutrient budgets in the water column.
Data availability statement
The data presented in this study is archived at the PANGAEA World Data Center:Porewater data: https://doi.pangaea.de/10.1594/PANGAEA.913247, https://doi.pangaea.de/10.1594/PANGAEA.913250, https://doi.pangaea.de/10.1594/PANGAEA.945658, https://doi.pangaea.de/10.1594/PANGAEA.945659. Sequential extraction of P components: https://doi.pangaea.de/10.1594/PANGAEA.945664, https://doi.pangaea.de/10.1594/PANGAEA.945660, https://doi.pangaea.de/10.1594/PANGAEA.945665. Sediment data are uploaded to PANGAEA World Data Center and can be found in the Supplementary Material.
Author contributions
P-CC and AWD designed the study, carried out the model simulations, and wrote the manuscript. All authors contributed to the review and editing of the manuscript. Geochemical data were provided by CHA, MK, JF, C-CS, PV, MZ, FS, HNS-V, and SS. All authors contributed to the article and approved the submitted version.
Funding
This study was funded through the project EVAR (03F0814) of the German Federal Ministry of Education and Research (BMBF) (https://www.ebus-climate-change.de/home).
Acknowledgments
We thank the captain, crew, and the scientific shipboard party of R/V Meteor cruise M157. A. Bleyer, B. Domeyer, and R. Surberg are acknowledged for biogeochemical analysis. We also thank the assistance of Feng-Hsin Hsu and Yao-Li Chang at the Institute of Oceanography, National Taiwan University, for 210Pb analyses. We acknowledge Silvana Pape for invaluable technical and analytical support for the SEDEX P sequential extraction and sediment geochemical analysis.
Conflict of interest
The authors declare that the research was conducted in the absence of any commercial or financial relationships that could be construed as a potential conflict of interest.
Publisher’s note
All claims expressed in this article are solely those of the authors and do not necessarily represent those of their affiliated organizations, or those of the publisher, the editors and the reviewers. Any product that may be evaluated in this article, or claim that may be made by its manufacturer, is not guaranteed or endorsed by the publisher.
Supplementary material
The Supplementary Material for this article can be found online at: https://www.frontiersin.org/articles/10.3389/fmars.2022.929913/full#supplementary-material
References
Arthur M. A., Dean W. E., Laarkamp K. (1998). Organic carbon accumulation and preservation in surface sediments on the Peru margin. Chem. Geol. 152, 273–286. doi: 10.1016/S0009-2541(98)00120-X
Berelson W. M., McManus J., Coale K. H., Johnson K. S., Kilgore T., Burdige D., et al. (1996). Biogenic matter diagenesis on the sea floor: A comparison between two continental margin transects. J. Mar. Res. 54, 731–762. doi: 10.1357/0022240963213673
Bohlen L., Dale A. W., Sommer S., Mosch T., Hensen C., Noffke A., et al. (2011). Benthic nitrogen cycling traversing the Peruvian oxygen minimum zone. Geochimica. Cosmochimica. Acta 75, 6094–6111. doi: 10.1016/j.gca.2011.08.010
Borchers S. L., Schnetger B., Böning P., Brumsack H.-J. (2005). Geochemical signatures of the Namibian diatom belt: Perennial upwelling and intermittent anoxia. Geochem. Geophys. Geosy. 6. doi: 10.1029/2004GC000886
Breitburg D., Levin L. A., Oschlies A., Grégoire M., Chavez F. P., Conley D. J., et al. (2018). Declining oxygen in the global ocean and coastal waters. Science 359, eaam7240. doi: 10.1126/science.aam7240
Bremner J. M. (1980). Physical parameters of the diatomaceous mud belt off south West Africa. Mar. Geol. 34, :M67–M76. doi: 10.1016/0025-3227(80)90064-X
Bremner J. M. (1983). “Biogenic sediments on the south West African (Namibian) continental margin,” in Coastal upwelling: Its sedimentary record, part b: Sedimentary records of ancient coastal upwelling. Eds. Thiede J., Suess E. (New York: Plenum Press), pp 73–pp104.
Brock J., Schulz-Vogt H. N. (2011). Sulfide induces phosphate release from polyphosphate in cultures of a marine beggiatoa strain. ISME J. 5, 497–506. doi: 10.1038/ismej.2010.135
Brüchert V., Currie B., Peard K. R. (2009). Hydrogen sulphide and methane emissions on the central Namibian shelf. Prog. Oceanogr. 83, 169–179. doi: 10.1016/j.pocean.2009.07.017
Brüchert V., Currie B., Peard K. R., Lass U., Endler R., Dübecke A., et al. (2006). An integrated assessment of shelf anoxia and water column hydrogen sulphide in the Benguela coastal upwelling system off Namibia. In Neretin L. N. (Ed.) Past and present water column anoxia (pp. 161–194). Dordrecht: Springer.
Brüchert V., Jørgensen B. B., Neumann K., Riechmann D., Schlösser M., Schulz H. (2003). Regulation of bacterial sulfate reduction and hydrogen sulfide fluxes in the central namibian coastal upwelling zone. Geochimica. Cosmochimica. Acta 67, 4505–4518. doi: 10.1016/S0016-7037(03)00275-8
Brüchert V., Pérez M.E., Lange C.B. (2000). Coupled primary production, benthic foraminiferal assemblage, and sulfur diagenesis in organic-rich sediments of the Benguela upwelling system. Marine Geology 163, 27–40. doi: 10.1016/S0025-3227(99)00099-7
Buitenhuis E. T., Hashioka T., Quéré C. L. (2013). Combined constraints on global ocean primary production using observations and models. Global Biogeochem. Cycles 27, 847–858. doi: 10.1002/gbc.20074
Burdige D. J. (2007). Preservation of organic matter in marine sediments: controls, mechanisms, and an imbalance in sediment organic carbon budgets? Chem. Rev. 107, 467–485. doi: 10.1021/cr050347q
Burdige D. J., Komada T. (2013). Using ammonium pore water profiles to assess stoichiometry of deep remineralization processes in methanogenic continental margin sediments. Geochem. Geophys. Geosy. 14, 1626–1643. doi: 10.1002/ggge.20117
Calvert S. E., Price N. B. (1983). “Geochemistry of Namibian shelf sediments,” in Coastal upwelling its sediment record: Part a: Responses of the sedimentary regime to present coastal upwelling. Eds. Suess E., Thiede J. (Boston, MA: Springer US), 337–375.
Capone D. G., Hutchins D. A. (2013). Microbial biogeochemistry of coastal upwelling regimes in a changing ocean. Nat. Geosci. 6, 711–717. doi: 10.1038/ngeo1916
Carr M.-E. (2001). Estimation of potential productivity in Eastern boundary currents using remote sensing. Deep Sea Res. Part II: Topical Stud. Oceanogr. 49, 59–80. doi: 10.1016/S0967-0645(01)00094-7
Chuang P.-C., Dale A. W., Wallmann K., Haeckel M., Yang T. F., Chen N.-C., et al. (2013). Relating sulfate and methane dynamics to geology: Accretionary prism offshore SW Taiwan. Geochem. Geophys. Geosy. 14, 2523–2545. doi: 10.1002/ggge.20168
Cline J. D. (1969). Spectrophotometric determination of hydrogen sulfide in natural waters. Limnol. Oceanogr. 14, 454–458. doi: 10.4319/lo.1969.14.3.0454
Collins P. F., Diehl H., Smith G. F. (1959). 2,4,6-tripyridyl-s-triazine as reagent for iron. determination of iron in limestone, silicates, and refractories. Anal. Chem. 31, 1862–1867. doi: 10.1021/ac60155a056
Currie B., Utne-Palm A. C., Salvanes A. G. V. (2018). Winning ways with hydrogen sulphide on the Namibian shelf. Front. Mar. Sci. 5. doi: 10.3389/fmars.2018.00341
Dale A. W., Bertics V. J., Treude T., Sommer S., Wallmann K. (2013). Modeling benthic–pelagic nutrient exchange processes and porewater distributions in a seasonally hypoxic sediment: evidence for massive phosphate release by beggiatoa? Biogeosciences 10, 629–651. doi: 10.5194/bg-10-629-2013
Dale A. W., Bourbonnais A., Altabet M., Wallmann K., Sommer S. (2019). Isotopic fingerprints of benthic nitrogen cycling in the Peruvian oxygen minimum zone. Geochimica. Cosmochimica. Acta 245, 406–425. doi: 10.1016/j.gca.2018.10.025
Dale A. W., Boyle R. A., Lenton T. M., Ingall E. D., Wallmann K. (2016b). A model for microbial phosphorus cycling in bioturbated marine sediments: Significance for phosphorus burial in the early Paleozoic. Geochimica. Cosmochimica. Acta 189, 251–268. doi: 10.1016/j.gca.2016.05.046
Dale A. W., Brüchert V., Alperin M., Regnier P. (2009). An integrated sulfur isotope model for Namibian shelf sediments. Geochimica. Cosmochimica. Acta 73, 1924–1944. doi: 10.1016/j.gca.2008.12.015
Dale A. W., Graco M., Wallmann K. (2017). Strong and Dynamic Benthic-Pelagic Coupling and Feedbacks in a Coastal Upwelling System (Peruvian Shelf). Front. Mar. Sci. 4, 29. doi: 10.3389/fmars.2017.00029
Dale A. W., Sommer S., Bohlen L., Treude T., Bertics V. J., Bange H. W., et al. (2011). Rates and regulation of nitrogen cycling in seasonally hypoxic sediments during winter (Boknis eck, SW Baltic sea): Sensitivity to environmental variables. Estuarine Coast. Shelf Sci. 95, 14–28. doi: 10.1016/j.ecss.2011.05.016
Dale A. W., Sommer S., Lichtschlag A., Koopmans D., Haeckel M., Kossel E., et al. (2021). Defining a biogeochemical baseline for sediments at carbon capture and storage (CCS) sites: An example from the north Sea (Goldeneye). Int. J. Greenhouse Gas Control 106, 103265. doi: 10.1016/j.ijggc.2021.103265
Dale A. W., Sommer S., Lomnitz U., Bourbonnais A., Wallmann K. (2016a). Biological nitrate transport in sediments on the Peruvian margin mitigates benthic sulfide emissions and drives pelagic n loss during stagnation events. Deep Sea Res. Part I: Oceanogr. Res. Pap. 112, 123–136. doi: 10.1016/j.dsr.2016.02.013
Dale A. W., Sommer S., Lomnitz U., Montes I., Treude T., Liebetrau V., et al. (2015). Organic carbon production, mineralisation and preservation on the Peruvian margin. Biogeosciences 12, 1537–1559. doi: 10.5194/bg-12-1537-2015
Dauwe B., Middelburg J. J., Herman P. M. J., Heip C. H. R. (1999). Linking diagenetic alteration of amino acids and bulk organic matter reactivity. Limnol. Oceanogr. 44, 1809–1814. doi: 10.4319/lo.1999.44.7.1809
de Haas H., Boer W., Van Weering T. C. E. (1997). Recent sedimentation and organic carbon burial in a shelf sea: the north Sea. Mar. Geol. 144, 131–146. doi: 10.1016/S0025-3227(97)00082-0
Diaz J., Ingall E., Benitez-Nelson C., Paterson D., de Jonge M. D., McNulty I., et al. (2008). Marine polyphosphate: A key player in geologic phosphorus sequestration. Science 320, 652–655. doi: 10.1126/science.1151751
Emeis K. C., Brüchert V., Currie B., Endler R., Ferdelman T., Kiessling A., et al. (2004). Shallow gas in shelf sediments of the Namibian coastal upwelling ecosystem. Cont. Shelf Res. 24, 627–642. doi: 10.1016/j.csr.2004.01.007
Emeis K., Eggert A., Flohr A., Lahajnar N., Nausch G., Neumann A., et al. (2018). Biogeochemical processes and turnover rates in the northern benguela upwelling system. J. Mar. Syst. 188, 63–80. doi: 10.1016/j.jmarsys.2017.10.001
Emeis K.-C., Struck U., Leipe T., Ferdelman T. G. (2009). Variability in upwelling intensity and nutrient regime in the coastal upwelling system offshore Namibia: results from sediment archives. Int. J. Earth Sci. 98, 309–326. doi: 10.1007/s00531-007-0236-5
Fernando E. Y., McIlroy S. J., Nierychlo M., Herbst F.-A., Petriglieri F., Schmid M. C., et al. (2019). Resolving the individual contribution of key microbial populations to enhanced biological phosphorus removal with raman–FISH. ISME J. 13, 1933–1946. doi: 10.1038/s41396-019-0399-7
Flood B. E., Louw D. C., van der Plas A. K., Bailey J. V. (2021). Giant sulfur bacteria (Beggiatoaceae) from sediments underlying the benguela upwelling system host diverse microbiomes. PloS One 16 (11), e0258124. doi: 10.1371/journal.pone.0258124
Fossing H., Ferdelman T. G., Berg P. (2000). Sulfate reduction and methane oxidation in continental margin sediments influenced by irrigation (South-East Atlantic off Namibia). Geochimica. Cosmochimica. Acta 64, 897–910. doi: 10.1016/S0016-7037(99)00349-X
Fossing H., Gallardo V. A., Jørgensen B. B., Hüttel M., Nielsen L. P., Schulz H., et al. (1995). Concentration and transport of nitrate by mat-forming sulphur bacterium thioploca. Nature 374, 713–715. doi: 10.1038/374713a0
Gächter R., Meyer J. S. (1993). The role of microorganisms in mobilization and fixation of phosphorus in sediments. Hydrobiologia 253, 103–121. doi: 10.1007/BF00050731
Gallardo V. A., Klingelhoeffer E., Arntz W., Graco M. (1998). First report of the bacterium thioploca in the benguela ecosystem off Namibia. J. Mar. Biol. Assoc. United Kingdom 78, 1–4. doi: 10.1017/S0025315400044945
Geilert S., Hensen C., Schmidt M., Liebetrau V., Scholz F., Doll M., et al. (2018). On the formation of hydrothermal vents and cold seeps in the guaymas basin, gulf of California. Biogeosciences 15, 5715–5731. doi: 10.5194/bg-15-5715-2018
Goldhammer T., Brüchert V., Ferdelman T. G., Zabel M. (2010). Microbial sequestration of phosphorus in anoxic upwelling sediments. Nat. Geosci. 3, 557. doi: 10.1038/ngeo913
Goldhammer T., Brunner B., Bernasconi S. M., Ferdelman T. G., Zabel M. (2011). Phosphate oxygen isotopes: Insights into sedimentary phosphorus cycling from the benguela upwelling system. Geochimica. Cosmochimica. Acta 75, 3741–3756. doi: 10.1016/j.gca.2011.04.006
Grasshoff K., Kremling K., Ehrhardt M. (Eds.) (1999). Methods of seawater analysis, 3rd edn (Weinheim, New York: Wiley-VCH).
Gruber N. (2008). “The marine nitrogen cycle: Overview and challenges,” in Nitrogen in the marine environment, 2nd Edn. Eds. Capone D. G., Bronk D. A., Mulholland M. R., Carpenter E. J. (San Diego: Academic Press), 1–50.
Gutiérrez D., Enríquez E., Purca S., Quipúzcoa L., Marquina R., Flores G., et al. (2008). Oxygenation episodes on the continental shelf of central Peru: Remote forcing and benthic ecosystem response. Prog. Oceanogr. 79, 177–189. doi: 10.1016/j.pocean.2008.10.025
Haeckel M., Boudreau B. P., Wallmann K. (2007). Bubble-induced porewater mixing: A 3-d model for deep porewater irrigation. Geochimica. Cosmochimica. Acta 71, 5135–5154. doi: 10.1016/j.gca.2007.08.011
Hall P. O. J., Aller R. C. (1992). Rapid, small-volume, flow injection analysis for ΣCO2 and NH4+ in marine and freshwaters. Limnol. oceanogr. 37, 1113–1119. doi: 10.4319/lo.1992.37.5.1113
Hartnett H. E., Keil R. G., Hedges J. I., Devol A. H. (1998). Influence of oxygen exposure time on organic carbon preservation in continental margin sediments. Nature 391, 572–575. doi: 10.1038/35351
Hedges J. I., Keil R. G. (1995). Sedimentary organic matter preservation: an assessment and speculative synthesis. Mar. Chem. 49, 81–115. doi: 10.1016/0304-4203(95)00008-F
Henrichs S. M., Farrington J. W. (1984). Peru Upwelling region sediments near 15 °S. 1. remineralization and accumulation of organic matter. Limnol. Oceanogr. 29, 1–19. doi: 10.4319/lo.1984.29.1.0001
Huh C.-A., Lin H.-L., Lin S., Huang Y.-W. (2009). Modern accumulation rates and a budget of sediment off the gaoping (Kaoping) river, SW Taiwan: A tidal and flood dominated depositional environment around a submarine canyon. J. Mar. Syst. 76, 405–416. doi: 10.1016/j.jmarsys.2007.07.009
Hutchings L., van der Lingen C. D., Shannon L. J., Crawford R. J. M., Verheye H. M. S., Bartholomae C. H., et al. (2009). The benguela current: An ecosystem of four components. Prog. Oceanogr. 83, 15–32. doi: 10.1016/j.pocean.2009.07.046
Inthorn M., Wagner T., Scheeder G., Zabel M. (2006). Lateral transport controls distribution, quality, and burial of organic matter along continental slopes in high-productivity areas. Geology 34, 205–208. doi: 10.1130/G22153.1
Jones D. S., Flood B. E., Bailey J. V. (2016). Metatranscriptomic insights into polyphosphate metabolism in marine sediments. ISME J. 10, 1015–1019. doi: 10.1038/ismej.2015.169
Jørgensen B. B. (1978). A comparison of methods for the quantification of bacterial sulfate reduction in coastal marine sediments II. Calculation from mathematical models. Geomicrobiol. J. 1, 29–47. doi: 10.1080/01490457809377722
Kalvelage T., Lavik G., Lam P., Contreras S., Arteaga L., Löscher C. R., et al. (2013). Nitrogen cycling driven by organic matter export in the south pacific oxygen minimum zone. Nat. Geosci. 6, 228–234. doi: 10.1038/ngeo1739
Kraft B., Tegetmeyer H. E., Sharma R., Klotz M. G., Ferdelman T. G., Hettich R. L., et al. (2014). The environmental controls that govern the end product of bacterial nitrate respiration. Science 345, 676. doi: 10.1126/science.1254070
Küster-Heins K., Steinmetz E., De Lange G. J., Zabel M. (2010). Phosphorus cycling in marine sediments from the continental margin off Namibia. Mar. Geol. 274, 95–106. doi: 10.1016/j.margeo.2010.03.008
Kuypers M. M. M., Lavik G., Woebken D., Schmid M., Fuchs B. M., Amann R., et al. (2005). Massive nitrogen loss from the benguela upwelling system through anaerobic ammonium oxidation. Proc. Natl. Acad. Sci. United States America 102, 6478–6483. doi: 10.1073/pnas.0502088102
Langer S., Vogts A., Schulz-Vogt H. N., Bowman G. R. (2018). Simultaneous visualization of enzymatic activity in the cytoplasm and at polyphosphate inclusions in beggiatoa sp. strain 35Flor incubated with 18O-labeled water. mSphere 3, e00489–e00418. doi: 10.1128/mSphere.00489-18
Lomnitz U., Sommer S., Dale A. W., Löscher C. R., Noffke A., Wallmann K., et al. (2016). Benthic phosphorus cycling in the Peruvian oxygen minimum zone. Biogeosciences 13, 1367–1386. doi: 10.5194/bg-13-1367-2016
Lomstein B. A., Niggemann J., Jørgensen B. B., Langerhuusa A. T. (2009). Accumulation of prokaryotic remains during organic matter diagenesis in surface sediments off Peru. Limnol. Oceanogr. 54, 1139–1151. doi: 10.4319/lo.2009.54.4.1139
Malone T., Azzaro di Rosamarina M., Bode A., Brown E., Duce R., Kamykowski D., et al. (2016). Primary production, cycling of nutrients, surface layer and plankton. in The First Global Integrated Marine Assessment: World Ocean Assessment I, ed Oceans and Law of the Sea, United Nations (Cambridge: Cambridge University Press), 119–148. doi: 10.1017/9781108186148.009.
Meisel S., Struck U., Emeis K.-C. (2011). Nutrient dynamics and oceanographic features in the central Namibian upwelling region as reflected in δ15N-signals of suspended matter and surface sediments. Fossil Rec. 14, 153–169. doi: 10.5194/fr-14-153-2011
Mohrholz V., Bartholomae C. H., van der Plas A. K., Lass H. U. (2008). The seasonal variability of the northern benguela undercurrent and its relation to the oxygen budget on the shelf. Cont. Shelf Res. 28, 424–441. doi: 10.1016/j.csr.2007.10.001
Mollenhauer G., Inthorn M., Vogt T., Zabel M., Sinninghe Damsté J. S., Eglinton T. I. (2007). Aging of marine organic matter during cross-shelf lateral transport in the benguela upwelling system revealed by compound-specific radiocarbon dating. Geochem. Geophys. Geosy. 8. doi: 10.1029/2007GC001603
Monteiro P. M. S. (2010). “The benguela current system,” in Carbon and nutreint fluxes in continental margins - a global synthesis. Eds. Liu K.-K., Atkinson L., Quinones R. A., Talaue-McManus L. (Springer).
Mußmann M., Hu F. Z., Richter M., De Beer D., Preisler A., Jørgensen B. B., et al. (2007). Insights into the genome of large sulfur bacteria revealed by analysis of single filaments. PloS Biol. 5, 1923–1937. doi: 10.1371/journal.pbio.0050230
Nagel B., Emeis K.-C., Flohr A., Rixen T., Schlarbaum T., Mohrholz V., et al. (2013). N-cycling and balancing of the n-deficit generated in the oxygen minimum zone over the Namibian shelf–an isotope-based approach. J. Geophys. Res.: Biogeosci. 118, 361–371. doi: 10.1002/jgrg.20040
Nagel B., Gaye B., Lahajnar N., Struck U., Emeis K.-C. (2016). Effects of current regimes and oxygenation on particulate matter preservation on the Namibian shelf: Insights from amino acid biogeochemistry. Mar. Chem. 186, 121–132. doi: 10.1016/j.marchem.2016.09.001
Neumann A., Lahajnar N., Emeis K.-C. (2016). Benthic remineralisation rates in shelf and slope sediments of the northern benguela upwelling margin. Cont. Shelf Res. 113, 47–61. doi: 10.1016/j.csr.2015.12.009
Ohde T., Dadou I. (2018). Seasonal and annual variability of coastal sulphur plumes in the northern benguela upwelling system. PloS One 13, e0192140–e0192140. doi: 10.1371/journal.pone.0192140
Otte S., Kuenen J. G., Nielsen L. P., Paerl H. W., Zopfi J., Schulz H. N., et al. (1999). Nitrogen, carbon, and sulfur metabolism in natural thioploca samples. Appl. Environ. Microbiol. 65, 3148–3157. doi: 10.1128/AEM.65.7.3148-3157.1999
Pitcher G. C., Aguirre-Velarde A., Breitburg D., Cardich J., Carstensen J., Conley D. J., et al. (2021). System controls of coastal and open ocean oxygen depletion. Prog. Oceanogr. 197, 102613. doi: 10.1016/j.pocean.2021.102613
Prokopenko M. G., Sigman D. M., Berelson W. M., Hammond D. E., Barnett B., Chong L., et al. (2011). Denitrification in anoxic sediments supported by biological nitrate transport. Geochim. Cosmochim. Acta 75, 7180–7199. doi: 10.1016/j.gca.2011.09.023
Ruttenberg K. C. (1992). Development of a sequential extraction method for different forms of phosphorus in marine sediments. Limnol. Oceanogr. 37, 1460–1482. doi: 10.4319/lo.1992.37.7.1460
Ruttenberg K. C (2014) “10.13 - the global phosphorus cycle,” in Treatise on geochemistry, 2nd ed. Eds. Holland H. D., Turekian K. K (Oxford: Elsevier), 499–558.
Ruttenberg K. C., Berner R. A. (1993). Authigenic apatite formation and burial in sediments from non-upwelling, continental margin environments. Geochimica. Cosmochimica. Acta 57, 991–1007. doi: 10.1016/0016-7037(93)90035-U
Schenau S. J., De Lange G. J. (2000). A novel chemical method to quantify fish debris in marine sediments. Limnol. Oceanogr. 45, 963–971. doi: 10.4319/lo.2000.45.4.0963
Schmidt M., Eggert A. (2016). Oxygen cycling in the northern benguela upwelling system: Modelling oxygen sources and sinks. Prog. Oceanogr. 149, 145–173. doi: 10.1016/j.pocean.2016.09.004
Scholz F., Hensen C., Noffke A., Rohde A., Liebetrau V., Wallmann K. (2011). Early diagenesis of redox-sensitive trace metals in the Peru upwelling area – response to ENSO-related oxygen fluctuations in the water column. Geochimica. Cosmochimica. Acta 75, 7257–7276. doi: 10.1016/j.gca.2011.08.007
Schulz H. N. (2006). The genus thiomargarita. in The Prokaryotes, eds Falkow M. D. S., Rosenberg E., Schleifer K.-H., Stackebrandt E. (New York, NY: Springer) 1156–1163.
Schulz H. N., Brinkhoff T., Ferdelman T. G., Mariné M. H., Teske A., Jørgensen B. B. (1999). Dense populations of a Large sulfur bacterium in Namibian shelf sediments. Science 284, 493–495. doi: 10.1126/science.284.5413.493
Schulz H. N., Jørgensen B. B. (2001). Big bacteria. Annu. Rev. Microbiol. 55, 105–137. doi: 10.1146/annurev.micro.55.1.105
Schulz H. N., Schulz H. D. (2005). Large Sulfur bacteria and the formation of phosphorite. Science 307, 416–418. doi: 10.1126/science.1103096
Schutte C. A., Teske A., MacGregor B. J., Salman-Carvalho V., Lavik G., Hach P., et al. (2018). Filamentous giant beggiatoaceae from guaymas basin are capable of both denitrification and dissimilatory nitrate reduction to ammonium (DNRA). Appl. Environ. Microbiol. 84, e2860–e2817. doi: 10.1128/AEM.02860-17
Slomp C. P., Van Cappellen P. (2007). The global marine phosphorus cycle: sensitivity to oceanic circulation. Biogeosciences 4, 155–171. doi: 10.5194/bg-4-155-2007
Slomp C. P., van der Gaast S. J., Van Raaphorst W. (1996). Phosphorus binding by poorly crystalline iron oxides in north Sea sediments. Mar. Chem. 52, 55–73. doi: 10.1016/0304-4203(95)00078-X
Sommer S., Chuang P.-C., Fabian J., Sabbaghzadeh B., Schulz-Vogt H. N., Zabel M., et al (in prep.) In situ benthic solute exchange in the mud-belt ecosystem off Namibia (Benguela upwelling system). Recent Dev. Oxygen Minimum Zones Biogeochem.
Stookey L. L. (1970) Ferrozine–a new spectrophotometric reagent for iron. Anal. Chem. 42, 779–781. doi: 10.1021/ac60289a016
Suess E. (1981) Phosphate regeneration from sediments of the Peru continental margin by dissolution of fish debris. Geochimica. Cosmochimica. Acta 45, 577–588. doi: 10.1016/0016-7037(81)90191-5
Sweerts J.-P.R.A., Beer D. D., Nielsen L. P., Verdouw H., den Heuvel J. C. V., Cohen Y., et al. (1990). Denitrification by sulphur oxidizing beggiatoa spp. mats Freshw. sediments. Nat. 344, 762–763. doi: 10.1038/344762a0
Van Cappellen P., Berner R. A. (1988). A mathematical model for the early diagenesis of phosphorus and fluorine in marine sediments; apatite precipitation. Am. J. Sci. 288, 289–333. doi: 10.2475/ajs.288.4.289
van der Plas A. K., Monteiro P. M. S., Pascall A. (2007). Cross-shelf biogeochemical characteristics of sediments in the central benguela and their relationship to overlying water column hypoxia. Afr. J. Mar. Sci. 29, 37–47. doi: 10.2989/AJMS.2007.29.1.3.68
Wakeham S. G., Sinninghe Damsté J. S., Kohnen M. E. L., De Leeuw J. W. (1995). Organic sulfur compounds formed during early diagenesis in black Sea sediments. Geochimica. Cosmochimica. Acta 59, 521–533. doi: 10.1016/0016-7037(94)00361-O
Wallmann K. (2010). Phosphorus imbalance in the global ocean? Global Biogeochem. Cycles 24. doi: 10.1029/2009GB003643
Wallmann K., Schneider B., Sarnthein M. (2016). Effects of eustatic sea-level change, ocean dynamics, and nutrient utilization on atmospheric pCO2 and seawater composition over the last 130 000 years: a model study. Clim. Past 12, 339–375. doi: 10.5194/cp-12-339-2016
West S., Jansen J. H. F., Stuut J. B. (2004). Surface water conditions in the northern benguela region (SE Atlantic) during the last 450 ky reconstructed from assemblages of planktonic foraminifera. Mar. Micropaleontol. 51, 321–344. doi: 10.1016/j.marmicro.2004.01.004
Westrich J. T., Berner R. A. (1984). The role of sedimentary organic matter in bacterial sulfate reduction: The G model tested1. Limnol. Oceanogr. 29, 236–249. doi: 10.4319/lo.1984.29.2.0236
Winkel M., Salman-Carvalho V., Woyke T., Richter M., Schulz-Vogt H. N., Flood B. E., et al. (2016). Single-cell sequencing of thiomargarita reveals genomic flexibility for adaptation to dynamic redox conditions. Front. Microbiol. 7. doi: 10.3389/fmicb.2016.00964
Zabel M., Boetius A., Emeis K. C. (2012). PROSA - process studies in the Eastern south Atlantic: Cruise no. M76, April 12 - august 24,2008, cape town (South Africa - Walvis bay (Namibia) (DFG-Senatskomm. f. Ozeanographie).
Zabel M., Mohrholz V., Schulz-Vogt H., Sommer S., Zettler M. (2019). The benguela system under climate change effects of variability in physical forcing on carbon and oxygen budgets, cruise no. M157, 04.08.2019 - 16.09.2019, mindelo (Cape Verde) - Walvis bay (Namibia).
Keywords: nutrient turnover, sediments, large sulfur bacteria, Benguela Upwelling System (BUS), hydrogen sulfide oxidation, DNRA, polyphosphate
Citation: Chuang P-C, Anderson CH, Kossack M, Fabian J, Su C-C, Vosteen P, Zabel M, Scholz F, Schulz-Vogt HN, Sommer S and Dale AW (2022) Nutrient turnover by large sulfur bacteria on the Namibian mud belt during the low productivity season. Front. Mar. Sci. 9:929913. doi: 10.3389/fmars.2022.929913
Received: 27 April 2022; Accepted: 15 September 2022;
Published: 16 November 2022.
Edited by:
Annie Bourbonnais, University of South Carolina, United StatesReviewed by:
Volker Brüchert, Stockholm University, SwedenGwénaëlle Chaillou, Université du Québec à Rimouski, Canada
Copyright © 2022 Chuang, Anderson, Kossack, Fabian, Su, Vosteen, Zabel, Scholz, Schulz-Vogt, Sommer and Dale. This is an open-access article distributed under the terms of the Creative Commons Attribution License (CC BY). The use, distribution or reproduction in other forums is permitted, provided the original author(s) and the copyright owner(s) are credited and that the original publication in this journal is cited, in accordance with accepted academic practice. No use, distribution or reproduction is permitted which does not comply with these terms.
*Correspondence: Pei-Chuan Chuang, cGNodWFuZ0BnZW9tYXIuZGU=