- 1School of Oceanography, Shanghai Jiao Tong University, Shanghai, China
- 2State Key Laboratory of Satellite Ocean Environment Dynamics, Second Institute of Oceanography, Ministry of Natural Resources, Hangzhou, China
- 3Southern Marine Science and Engineering Guangdong Laboratory (Zhuhai), Zhuhai, China
The oxygen minimum zone has a significant effect on primary production, marine biodiversity, food web structure, and marine biogeochemical cycle. The Arabian Sea oxygen minimum zone (ASOMZ) is one of the largest and most extreme oxygen minimum zones in the world, with a positional decoupling from the region of phytoplankton blooms. The core of the ASOMZ is located to the east of the high primary production region in the western Arabian Sea. In this study, a coupled physical–biogeochemical numerical model was used to quantify the impact of ocean circulation and settling of particulate organic matters (POMs) on the decoupling of the ASOMZ. Model results demonstrate that the increased (decreased) dissolved oxygen replenishment in the western (central) Arabian Sea is responsible for decoupling. The oxygen-rich intermediate water (200–1,000 m) from the southern Arabian Sea enters the Arabian Sea along the west coast and hardly reaches the central Arabian Sea, resulting in a significant oxygen replenishment in the western Arabian Sea high-productivity region (Gulf of Aden) but only a minor contribution in the central Arabian Sea. Besides that, the POMs that are remineralized to consume central Arabian Sea dissolved oxygen comprises not only local productivity in winter bloom but also the transport from the western Arabian Sea high-productivity region (Oman coast) in summer bloom. More dissolved oxygen replenishment in the western Arabian Sea, and higher dissolved oxygen consumption and fewer dissolved oxygen replenishment in the central Arabian Sea could contribute to the decoupling of the ASOMZ and phytoplankton productive zone.
1 Introduction
Oxygen levels in both open and coastal oceans have declined for the past 50 years (Diaz and Rosenberg, 2008; Stramma et al., 2008; Keeling et al., 2010; Ito et al., 2017; Schmidtko et al., 2017; Breitburg et al., 2018). Ocean deoxygenation, one of the most important changes occurring in the marine ecosystem (Zhang et al., 2010; Rabalais et al., 2014; Levin and Breitburg, 2015), can lead to the expansion of low-oxygen waters, which are known as oxygen minimum zones (OMZs; dissolved oxygen, DO< 60 mmol·m−3; Stramma et al., 2008; Breitburg et al., 2018; Bindoff et al., 2019). The major OMZs in the global oceans mainly occur in upwelling-dominated regions, poorly ventilated regions, and large river estuaries, such as the Gulf of California (Lluch-Cota et al., 2007), eastern Tropical North Pacific (Karstensen et al., 2008), eastern Tropical South Pacific (Ulloa et al., 2012; Tiano et al., 2014), Arabian Sea (Kamykowski and Zentara, 1990; McCreary et al., 2013; Lachkar et al., 2018), Bay of Bengal (Sarma, 2002; Al Azhar et al., 2017), Gulf of Mexico (Rabalais et al., 2002; Bianchi et al., 2010), and Changjiang River Estuary (Zhang et al., 2010; Zhou et al., 2017; Zhang et al., 2018). The expansion of OMZ causes not only a decrease in the oxygen level in the water column but also an increase in the rate of anammox and denitrification, which effectively removes nitrate from the water column (Gilly et al., 2013). Considering that upwelled nutrients are important for surface primary production, the variability in OMZ will constrain primary production, marine biodiversity, food web structure, and marine biogeochemical cycles (Rabalais et al., 2002; Naqvi et al., 2006; Vaquer-Sunyer and Duarte, 2008; Levin et al., 2009; Bianchi et al., 2012; Breitburg et al., 2018; Laffoley and Baxter, 2019).
The Arabian Sea OMZ (ASOMZ) is one of the largest and most extreme OMZs in the world, with suboxic areas (DO< 4 mmol·m−3) in the majority of its northern and northeastern intermediate water depths ranging from 200 to 1,000 m (Morrison et al., 1998). Over the Arabian Sea, monsoon winds alternately blow from the northeast and the southwest during winter and summer, respectively. Although the monsoon winds cause significant spatial and temporal variability in ocean dynamics and biological activity, the annual cycle of the ASOMZ is weak. The ASOMZ in the western Arabian Sea retreats slightly eastward during the summer monsoon and expands slightly westward during the winter monsoon. On the other hand, the ASOMZ in the eastern Arabian Sea expands slightly southward during the summer monsoon and retreats northward during the winter monsoon (Resplandy et al., 2012; Rixen et al., 2014; Shenoy et al., 2020).
The western Arabian Sea has high productivity due to upwelling in the summer monsoon and the northern Arabian Sea has high productivity due to strong mixing in the winter monsoon, while the eastern/central Arabian Sea has significantly lower productivity due to nutrient limitation (McCreary et al., 2009; Anju et al., 2020). The ASOMZ is distinguished by the fact that its core area (DO< 4 mmol·m−3) is located far from the upwelling-dominated high primary productivity region in the western Arabian Sea and is most developed in the eastern and central Arabian Sea (Naqvi, 1991). To explain the occurrence of the ASOMZ away from the high-productivity region, previous studies showed that advection of sea water and settling of particulate organic matters (POMs) might play dominant roles. The northward advection of oxygen-rich water (e.g., the Indian Ocean Central Water; ICW) from the southern boundary of the Arabian Sea replenishes the dissolved oxygen in the west (Sarma, 2002; Resplandy et al., 2012; Rixen et al., 2014). The settling of POM in the upwelling region was found to be associated with little remineralization in the upper ocean (Honjo et al., 1999; Naqvi et al., 2010). These POMs are small and slow-sinking enough to be transported northward and eastward before being remineralized (Wiggert and Murtugudde, 2007; Hood et al., 2009; McCreary et al., 2013; Acharya and Panigrahi, 2016). Other explanations include the lack of mesoscale mixing in the eastern Arabian Sea, which results in poorly ventilated subsurface waters (McCreary et al., 2013; Schmidt et al., 2020); Persian Gulf water (PGW) and Red Sea Water (RSW) ventilating the upper ASOMZ (e.g., Lachkar et al., 2019); the cross-shelf transport of organic matter from the eastern Arabian Sea shelf, which increases oxygen consumption in the eastern Arabian Sea (Sarma et al., 2020); iron limitation in the western Arabian Sea, which leads to an eastward shift in the utilization of upwelled nutrients and intensifies the OMZ (Moffett and Landry, 2020); and the regulation of westward Rossby waves (Kim et al., 2001; Shenoy et al., 2020).
The above studies have revealed the potential mechanisms affecting the location of the ASOMZ’s core area. However, the quantitative effects of sea water advection and settling of POM are still not well worked out due to limited in situ observation data and simplified physical–biogeochemical models (Acharya and Panigrahi, 2016). Another unknown is source regions of POM detected in the western and central Arabian Sea. This study therefore set up a control experiment and some sensitivity experiments to investigate the decoupling of the ASOMZ by analyzing the sea water advection and settling of POM through a coupled physical–biogeochemical numerical model. Besides that, the main pathway of water masses and its impact on the ASOMZ through Lagrangian particle tracking experiment are investigated. Another purpose of this study is to estimate the proportion of POM originating from different seasons and regions by using ideal POM sinking experiments, and to explore why there is a significant seasonal cycle of chlorophyll in the surface and a weaker ASOMZ variation in the intermediate layer.
Details of the coupled numerical model, experiment setting, and observation data are described in Section 2. Model validation, physical and biological factors affecting the ASOMZ, and variation of microbial hypoxic and suboxic zones in the ASOMZ are given in Section 3. We also discuss source regions of POM, and the decoupling of the ASOMZ mechanisms in Section 4. Finally, the conclusions are drawn in Section 5.
2 Methods and data
2.1 Numerical model
The physical–biogeochemical numerical model used here includes a circulation model component, the Regional Ocean Modeling System (Shchepetkin and McWilliams, 2003; Shchepetkin and McWilliams, 2005), coupled with a biogeochemical model, the carbon silicate, nitrogen ecosystem (CoSiNE) model (Chai et al., 2002), for the entire Indian Ocean. The model uses the non-local K-profile parameterization (KPP) scheme for vertical mixing (Large et al., 1994) and the Smagorinsky scheme (Smagorinsky, 1963) for horizontal mixing. The tracer advections with third-order upstream-bias and fourth-order centered difference schemes are applied in the horizontal and vertical directions, respectively. The model domain extends from 31°S to 32°N and from 30°E to 120°E, with a horizontal resolution of 1/12°. It has 40 non-uniform sigma layers that are refined near the surface. Ten tidal constituents (M2, S2, N2, K2, K1, O1, P1, Q1, MM, and MF) are considered in the equilibrium tide module (Liang et al., 2019) and imposed at the open boundaries using the data obtained from TPXO7.2 (Egbert and Erofeeva, 2002).
Temperature and salinity boundary and initial conditions are from the climatological monthly dataset of the Simple Ocean Data Assimilation (SODA; Carton and Giese, 2008), while nitrate, silicate, phosphate, and oxygen are from the World Ocean Atlas (WOA) 2018 (Garcia et al., 2019). The air–sea heat flux is calculated with a bulk formula (Ahsan and Blumberg, 1999) through the climatological monthly mean data from the European Center for Medium-Range Weather Forecasts (ECMWF) ERA-5 reanalysis products, including wind, air temperature, air pressure, solar shortwave radiation flux, solar longwave radiation flux, and relative humidity with a spatial resolution of 0.25° × 0.25°. Monthly mean discharges of major rivers in the Indian Ocean are considered, deriving from the Global Runoff Data Centre (GRDC, http://grdc.bafg.de) and Global River Discharge Database (https://sage.nelson.wisc.edu/riverdata/).
The CoSiNE model used in this study is based on a newly developed version (Ma et al., 2019). The CoSiNE model has been successfully applied in different regions (Liu and Chai, 2009; Xiu and Chai, 2011; Xiu and Chai, 2014; Ma et al., 2019; Zhang et al., 2021). It contains 16 state variables including four inorganic nutrients (nitrate [NO3], ammonium [NH4], silicate [Si(OH)4], and phosphate [PO4]), two phytoplankton groups (small phytoplankton [P1] and diatoms [P2]) and their corresponding chlorophyll components ([Chl1] and [Chl2]), two size classes of zooplankton (microzooplankton [Z1] and mesozooplankton [Z2]), three kinds of particles (small particulate organic nitrogen [SDet], large PON [LDet], and biogenic silica [bSi]), dissolved oxygen [DO], dissolved inorganic carbon [TCO2], and total alkalinity [TALK] (see schematic diagram in Ma et al., 2019). Detailed key control equations are presented in the Ma et al. (2019) Supplement.
The budget of the dissolved oxygen is diagnosed as follows,
where DO represents dissolved oxygen concentration (mmol·m−3), PP is oxygen produced from primary production, WCR stands for water column respiration by POM and excretion of zooplankton, Nitrif is oxygen consumption due to nitrification, and Fluxair-sea indicates gas exchange across the air–sea interface. Kh and Kv are the horizontal and vertical diffusivity, respectively. The first two terms on the right-hand side are advection and diffusion induced by oxygen changes, respectively.
2.2 Numerical experiment settings
To obtain a relatively steady sate, the model was first spun up for 15 years with the climatological forcing. For dissolved oxygen, the model drift decreased significantly at the end of the spin-up period (Figure S1). After that, another 5-year simulation with climatological forcing was conducted for control run after the spin-up (Table 1). The results from the last year of the 5-year integration were used for analysis if not specifically stated in the text. In addition, four basic numerical experiments were carried out (Table 1). The stronger branch of the ICW (DO = 50 mmol·m−3, WOA2018) enters the western Arabian Sea via the Somali Coastal Current (You, 1997; Schott and McCreary, 2001). The other branch of the ICW transports dissolved oxygen at a lower level (~30 mmol·m−3) into the eastern Arabian Sea along with the West Indian Coastal Current (Schmidt et al., 2020; Shenoy et al., 2020; Sudheesh et al., 2022). The dissolved oxygen on the section along 7°N was set to 15 mmol·m−3 (lower than a third of the observed value in the western Arabian Sea) throughout intermediate water layer (200–1,000 m) in Exp1. In Exp2, the model was forced with higher dissolved oxygen (100 mmol·m−3, roughly twice the observed value) water entering the Arabian Sea, with other conditions remaining unchanged from Exp1. In Exp3, the sinking velocity of POM was reduced by a factor of 2 on the original basis (Exp0), from 5.0 to 2.5 m·day−1. In Exp4, the sinking velocity of POM was increased by a factor of 2 on the original basis (Exp0), from 5.0 to 10.0 m·day−1.
Several other experiments were also conducted (Table 1). First, the online Lagrangian particle tracking experiment in the ROMS model was conducted for 12 years, with 31,305 particles uniformly released along the transect of 10°N in the Arabian Sea at an interval of 0.25° at depths ranging from 0 to 2,000 m. Specifically, the depths of particles release were at 0 m, 10 m, 30 m, and 50–150 m with an interval of 25 m, 150–250 m with an interval of 50 m, 300–1,000 m with an interval of 100 m, and 1,000–2,000 m with an interval of 250 m. Particles were released on the first day of June, July, and August during the summer monsoon in the first model year due to the Somali Coastal Current peaks in summer.
Second, idealized experiments were performed to trace the source of the POM. In each experiment, the POM was arranged in the surface layer in one of five high-productivity regions (within a 2° × 2° box; see Figure S2; Table 1), representing the Persian Gulf, central Arabian Sea, eastern continental shelf of the Arabian Sea, Gulf of Aden, and Oman coast, respectively. The idealized POM was essentially a passive tracer with specific sinking velocity, but no degradation or other removal processes. The POM was ideally set to a fixed value (here was 1,000 mmol·N·m−3) to represent an end number. The fraction of POM from various regions was used to track down the source. The POM was released in December and June, representing the high productivity during the winter and summer monsoons, respectively.
2.3 In situ observation and satellite data
The in situ observation data of sea surface temperature (SST), sea surface salinity (SSS), dissolved oxygen, and nitrate are from the I07N cruise supported by the Global Ocean Ship-Based Hydrographic Investigation Program (GO-SHIP) in April–June 2018. Although the cruise crosses the entire western Indian Ocean, only a portion of the stations in the Arabian Sea are selected (Figure 1). These data can be accessed from the Clivar and Carbon Hydrographic Data Office (CCHDO).
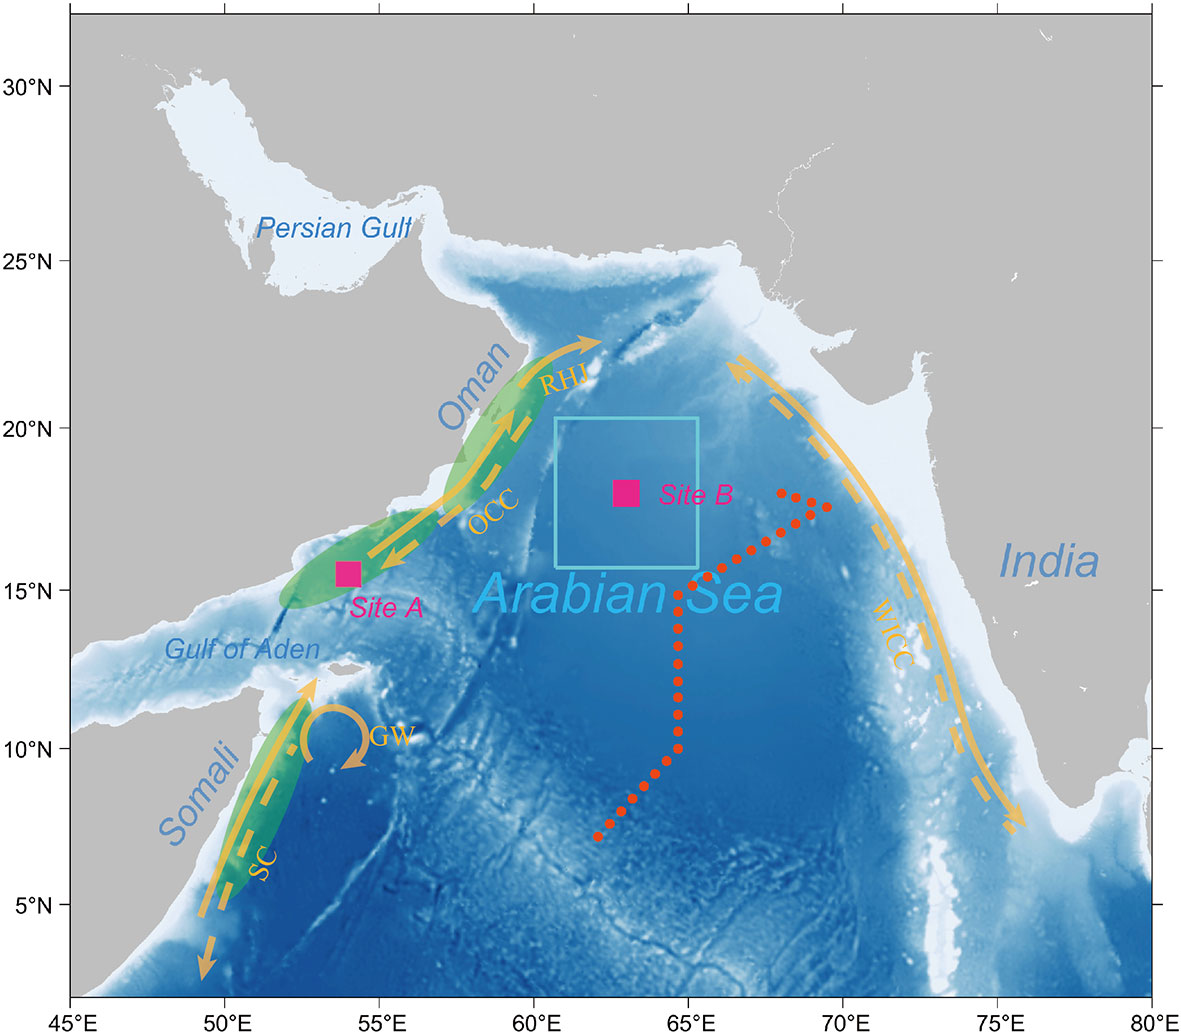
Figure 1 Map of the Arabian Sea and its adjacent seas. Coastal upwelling systems (green shading) and coastal circulations, after Schott and McCreary (2001). The solid (dashed) arrows represent the Somali Coastal Current (SC), the Great Whirl (GW), the Oman Coastal Current (OCC), Ras al Hadd Jet (RHJ), and the West Indian Coastal Current (WICC) in the winter (summer) monsoon state. Red dots represented the cruise track of the I07N cruise supported by the GO-SHIP in April–June 2018. Two squares represent the two sites (i.e., sites A and B) selected for analysis.
The sea surface climatological current is from the Drifter-Derived Climatology of Global Near-Surface Currents, with a resolution of 0.25° (Laurindo et al., 2017). Sea surface height (SSH) anomalies are from the SSALTO/DUACS multi-mission altimeter products from the Archiving, Validation and Interpretation of Satellite Oceanographic (AVISO) data with a horizontal resolution of 0.25°. Climatological monthly mean chlorophyll concentration data are from the Moderate Resolution Imaging Spectroradiometer (MODIS) with a horizontal resolution of 4 km. SST data are from the Optimum Interpolation Sea Surface Temperature (OISST) with a horizontal resolution of 0.25° from September 1981 to the present (Reynolds et al., 2007).
3 Results
3.1 Model validation
Available in situ and satellite-based observations are used to validate the performance of the model in the Arabian Sea, including key physical and biogeochemical properties in terms of seasonal variability. Sea surface currents, SSH anomalies, SST, and SSS are compared to evaluate the physical model. Comparison with surface drifter climatological current (Laurindo et al., 2017) shows that the model reproduces the main patterns of the surface circulations during the summer and winter monsoons (Figure S3). For example, the model successfully reproduces the counterclockwise circulation during the winter monsoon and the clockwise circulation during the summer monsoon, as shown in Schott and McCreary (2001). In particular, the model captures the strength and seasonal reversal of the Somali Coastal Current. Modeled temporal and spatial distributions of SSH anomalies during the summer and winter monsoons are consistent with AVISO data (Figure S4).
The main patterns of SST and SSS are also successfully captured by the model (Figures S5, S6). In particular, the model successfully reproduces the upwelling region off the coasts of Oman and Somalia, which are characterized by low SST during the summer monsoon. The north–south temperature gradient off the Persian Gulf during the winter monsoon is also presented in the model. The model, however, depicts temporal and spatial distributions of higher SSS in the northern and central Arabian Sea. Normalized Taylor diagrams (Taylor, 2001) are used in each season to assess model’s skills in salinity, nitrate, and oxygen relative to the WOA 2018 data, in temperature relative to the OISST data, and in chlorophyll relative to the MODIS data (Figure 2). Skill score (Murphy, 1988) of the simulated results are calculated to quantify the performance. SS is graded as excellent if it is greater than 0.65, very good when it is between 0.5 and 0.65, good when between 0.2 and 0.5, and poor if it is less than 0.2. Statistical analysis indicates that the simulated and observed SST have similar standard deviations; and the RMSE reaches 0.11°C, 0.12°C, 0.13°C, and 0.12°C during different seasons, respectively, and correlation coefficient (CC) reaches 0.99 in different seasons (Figure 2). All of the SSs fall in the excellent category (0.99, 0.98, 0.98, and 0.98). Similarly, SSS’s RMSE reaches 0.26, 0.25, 0.21, and 0.23 psu, respectively, and CC reaches ~0.97 in all seasons. The SS of SSS also falls in the excellent category (0.93, 0.94, 0.96, and 0.94). Consequently, these results indicate that the model adequately reproduces the features of temperature and salinity, paving the way for further analysis.
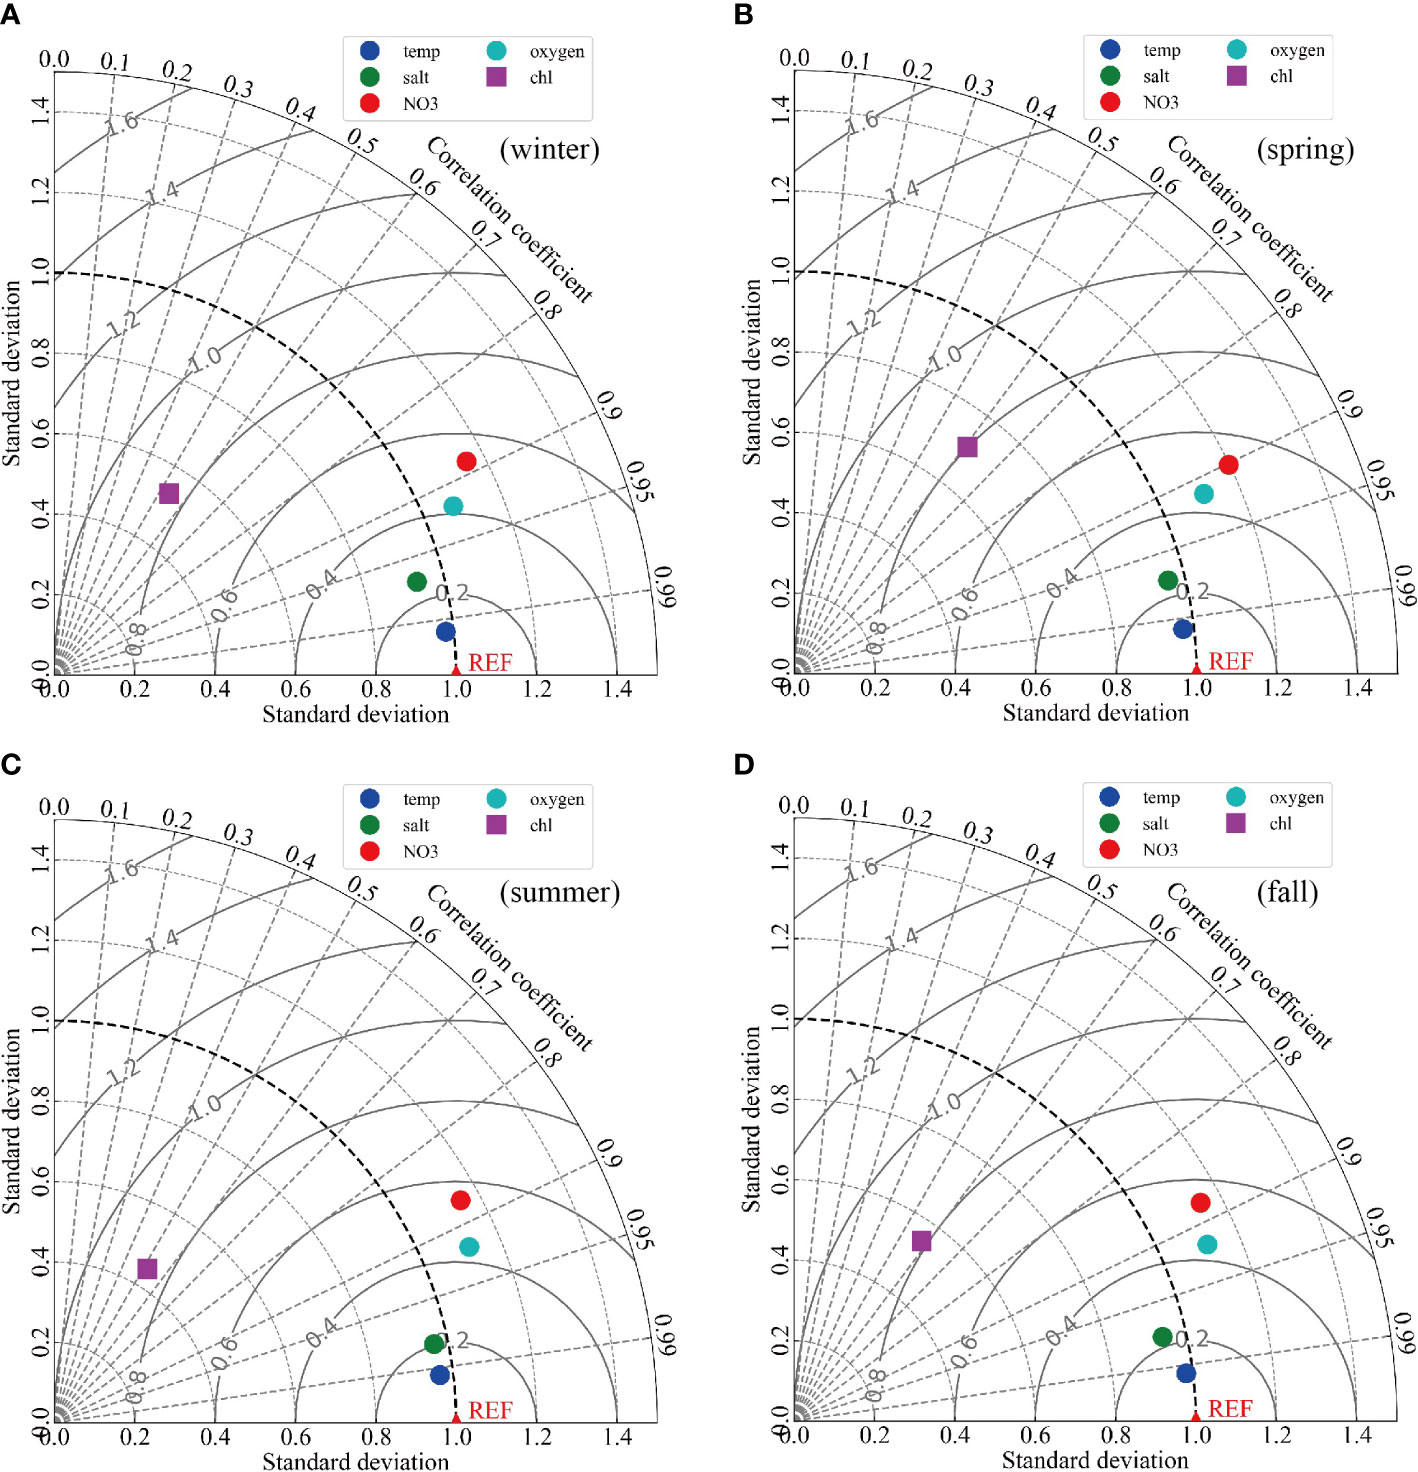
Figure 2 Normalized Taylor diagram for statistical comparison of observed and modeled variables of temperature (blue), salinity (green), nitrate (red), oxygen (cyan), and chlorophyll (purple) in winter (A), spring (B), summer (C), and fall (D). The observation data of temperature, salinity, nitrate, and oxygen are in the upper 800 m from the WOA 2018 dataset, and the chlorophyll data are from the MODIS.
The high chlorophyll concentrations in the northern and western Arabian Sea during the summer and winter monsoons are consistent with MODIS chlorophyll concentrations (Figure S7). The high chlorophyll concentrations off the Indian west coast during the summer and winter monsoons are also reproduced. However, chlorophyll concentrations off the Oman coast are obviously underestimated in the model during the winter monsoon. The reason for this could be that the sinking velocity of POM in the model is relatively faster, resulting in less remineralization and insufficient recycle of nitrogen to support phytoplankton growth (Anderson et al., 2007). The reason could also be that weak winter mixing reduces the nutrient supply to the surface layer. The model also underestimates the chlorophyll concentrations off the Somalia coast during the summer monsoon. It could be due to silicate limiting diatom growth (Anju et al., 2020). From the statistical results, RMSE reaches ~0.95 mg·m−3 in different seasons, and CC shows acceptable results (Figure 2). Overall, the fidelity of the modeled chlorophyll concentration in the Arabian Sea is acceptable, as it is similar to the results of the state-of-the-art models in the Indian Ocean and Arabian Sea (e.g., Resplandy et al., 2012; Lachkar et al., 2016; Lachkar et al., 2018; Lachkar et al., 2019; Lachkar et al., 2021).
The temporal and spatial distributions of nitrate during the summer and winter monsoons are successfully reproduced in the model, comparing with the WOA 2018 data (Figure S8). In particular, the high surface concentration off the Oman coast upwelling region in the summer monsoon is successfully simulated. The statistical results also indicate the model’s performance is acceptable with RMSE of ~0.75 mmol·m−3 and CC of ~0.88 in different seasons (Figure 2). Moreover, the dissolved oxygen concentrations are relative accurately simulated during the summer and winter monsoons (Figure S9). In particular, the model generally reproduces the location, size, and intensity of the ASOMZ. However, the location of the ASOMZ is relatively closer to the western side of the Arabian Sea compared to its location based on the WOA 2018 dataset. The east–west vertical distribution of dissolved oxygen reveals similar phenomena that the suboxic area (DO< 4 mmol·m−3) in the ASOMZ is larger than the observed. This could be due to the biases of chlorophyll concentration in the central Arabian Sea. Such biases may also arise from the underestimated eddy activity in the model, leading to underestimated OMZ ventilation as shown in Lachkar et al. (2016). The underestimated injection of ventilated oxygen-rich Persian Gulf waters into the northern Arabian Sea in the upper ASOMZ might also play a role (Lachkar et al., 2019). Although the model overestimated the intensity of the ASOMZ, the temporal and spatial distributions are still acceptable, both vertically and horizontally. Statistical analysis presents relatively good results with RMSE of ~0.49 mmol·m−3 and CC of ~0.92 in different seasons. Also, the SS of dissolved oxygen is in the excellent category at ~0.77 in different seasons. These results show that the model is capable of reproducing observed measurements in the region of interest in a statistical sense.
Simulated SST, SSS, nitrate, and dissolved oxygen are also compared to cruise observation data in 2018 (Figures 1, 3, S10, S11). Although the cruise covers 124 stations along the transection of the western Indian Ocean, only stations in the Arabian Sea (Stations 95–124) from 7° to 18°N are selected to evaluate the model performance. The scatter diagram associated with statistics analysis reveals that the model successfully captures the main physical and chemical characteristics in the Arabian Sea (Figure 3). The RMSE reaches 0.18 psu for salinity, 0.76°C for temperature, 6.22 mmol·m−3 for nitrate, and 21.55 mmol·m−3 for dissolved oxygen. Correspondingly, the CC shows good results with the values of 0.95, 1, 0.95, and 0.96, respectively, for the four variables. The SSs are all in the excellent category (0.89, 0.99, 0.84, and 0.93) during different seasons. The vertical distributions of temperature, salinity, nitrate, and dissolved oxygen successfully reproduce main physical and chemical patterns in the Arabian Sea. However, the vertical distribution of dissolved oxygen reveals that the modeled results are lower than the cruise results, with the area of suboxic province being smaller and the depth being shallower. It is attributed to the location of the ASOMZ in the model being further west than observed.
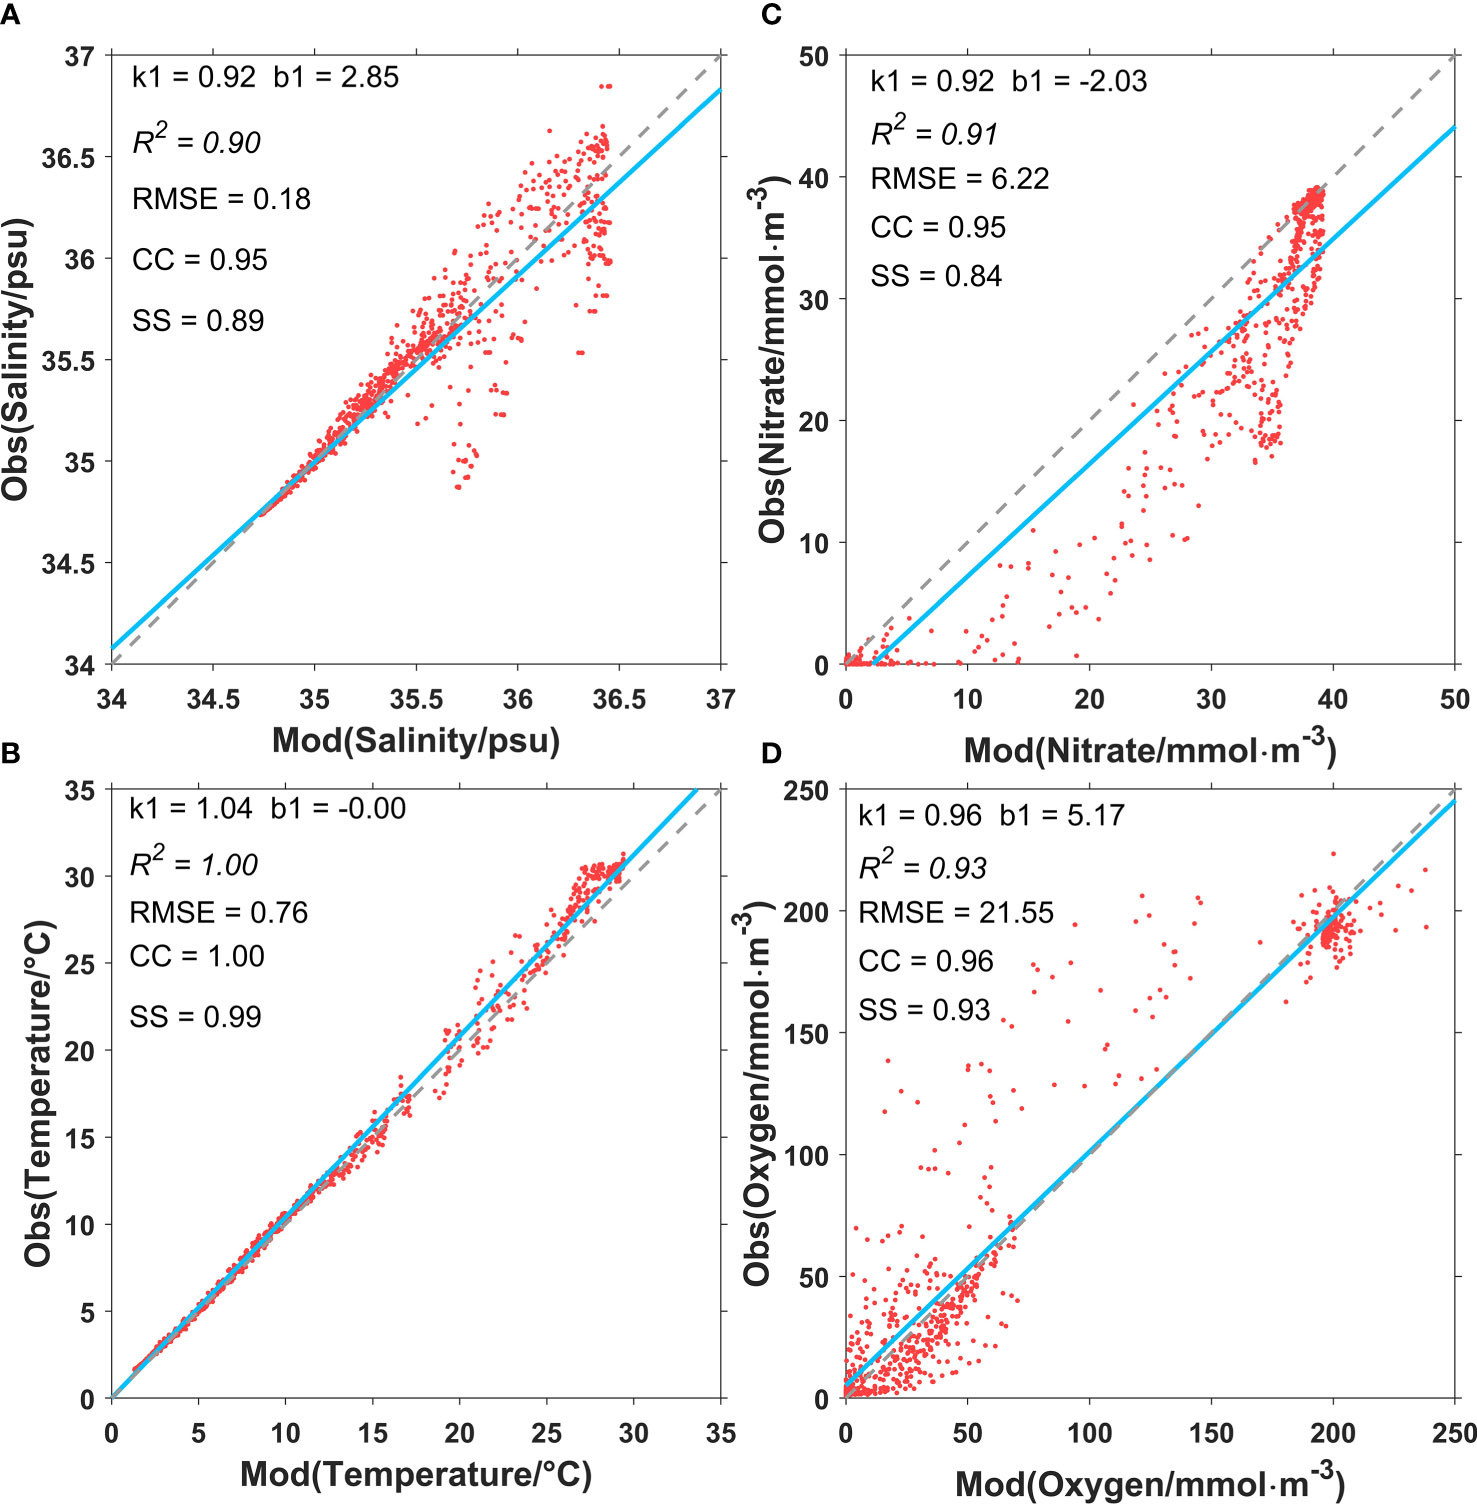
Figure 3 Model-data point-to-point comparison for salinity (A), temperature (B), nitrate (C), and dissolved oxygen (D) in the upper 1500 m. The observation data are the I07N cruise data in 2018. RMSE, root-mean-square error; CC, correlation coefficient; SS, skill score.
In conclusion, the model performs reasonably well in terms of large-scale features of the circulations, and seasonal variations in nitrate and chlorophyll, despite some biases. The location and structure of the observed ASOMZ are generally reproduced in the model.
3.2 Characteristics of the ASOMZ
The temporal and spatial distributions of dissolved oxygen in the Arabian Sea exhibit weak seasonal variation in both vertical and horizontal directions (Figures S9C, D), as concluded in Resplandy et al. (2012). The southern boundary of the ASOMZ (DO = 20 mmol·m−3) extends to ~8°N at the east and ~11°N at the west from the winter monsoon to summer monsoon. The suboxic area in the central Arabian Sea reaches ~59°E to the east during the winter monsoon and ~58°E during the summer monsoon. Similarly, a weak seasonal variation in the vertical distribution of dissolved oxygen can be seen in Figure S9.
A budget analysis of dissolved oxygen was performed for the entire Arabian Sea (areas north of 10°N) intermediate water (200–1,000 m), also known as the main layer of the ASOMZ (Figure 4). Considering that there is no phytoplankton production of oxygen and no air–sea exchange in the intermediate water (200–1,000 m), the terms PP and Fluxair-sea in Eq. 1 can be ignored. The ASOMZ mainly gains and loses dissolved oxygen via horizontal advection (Hadv) and oxygen consumption (WCR), respectively. Similar conclusions were derived by other authors (Resplandy et al., 2012). The Hadv accounts for about 71% of the total dissolved oxygen gain, while the WCR accounts for about 70% of the total loss. Moreover, the Hadv is about three times larger during the summer monsoon than during the winter monsoon, while the vertical diffusion term (Vdiff) acts as a local oxygen loss during the winter monsoon. Both oxygen consumption and nitrification (Nitrif), which function as local oxygen loss, are relatively stable throughout the year. The roles of horizontal advection and oxygen consumption on the ASOMZ region will be described in detail in the following sections.
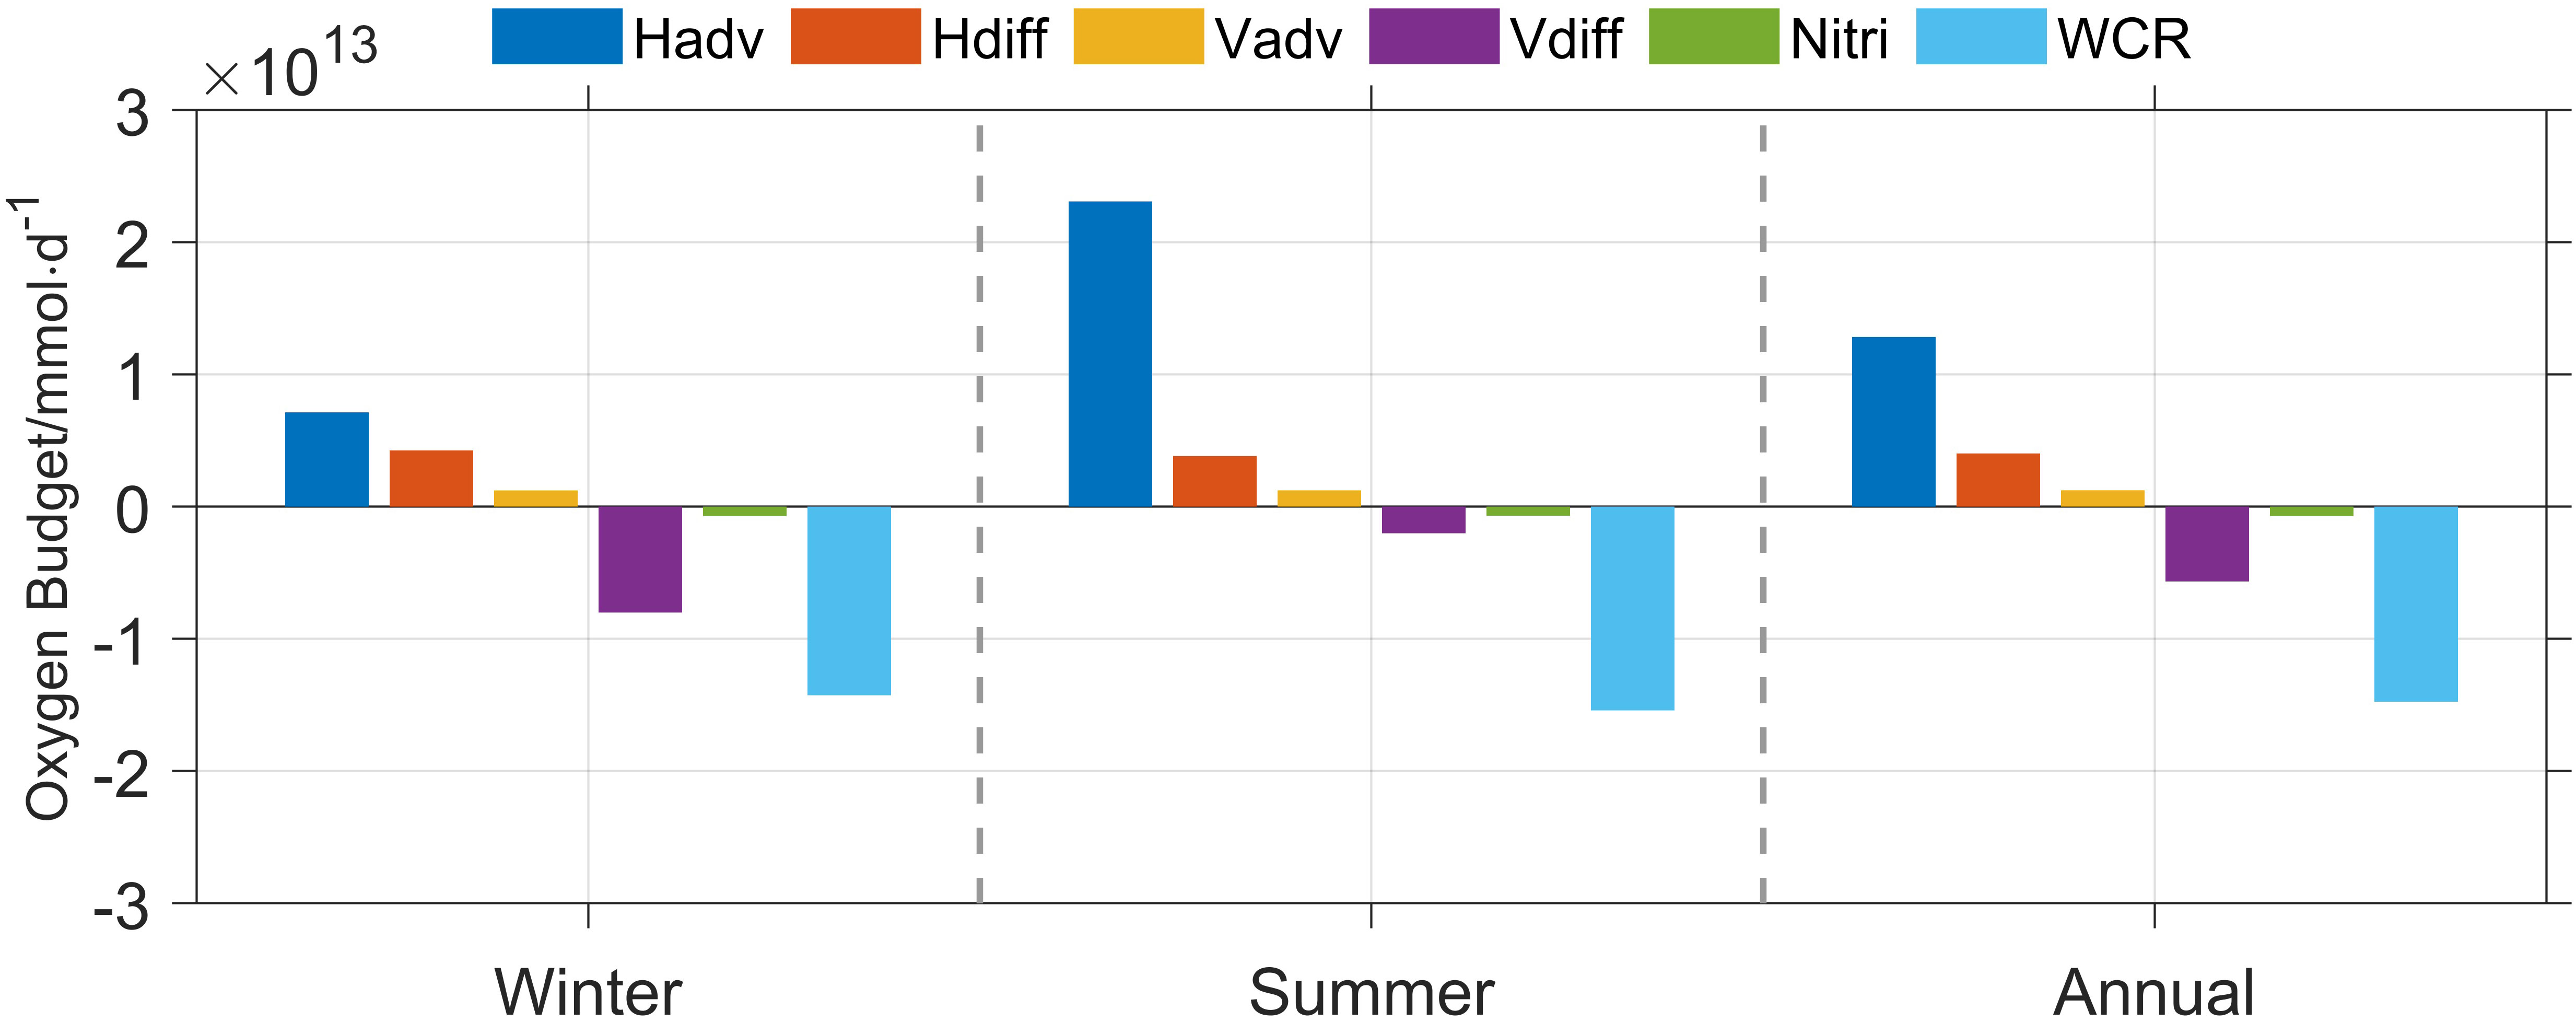
Figure 4 Modeled oxygen budget of dissolved oxygen concentration for intermediate water column (200–1,000 m) in the Arabian Sea Oxygen Minimum Zone. Abbreviations in the legend are for horizontal advection (Hadv), vertical advection (Vadv), horizontal diffusion (Hdiff), vertical diffusion (Vdiff), nitrification (Nitri), and water column respiration (WCR). Note that the positive value in the budget represents a net gain of dissolved oxygen while the negative value represents a net loss.
3.3 Physical factors affecting the ASOMZ
3.3.1 Transit time and pathway of oxygen-rich water
Previous studies suggested that the oxygen-rich water from the southern boundary of the Arabian Sea promotes the eastward migration of the ASOMZ (Resplandy et al., 2012; McCreary et al., 2013; Rixen et al., 2014). In view of this, a Lagrangian particle tracking experiment (details in Section 2.2) was conducted to identify the transit time and pathway of the oxygen-rich water mass from the southern boundary. The transit time of particles, defined here as the time when half of the particles in the same water layer reach the central Arabian Sea (cyan box in Figure 1), is shown in Figure 5. Given that the ASOMZ is mainly distributed in the intermediate depth (200–1,000 m) and ~6% of particles (approximately 50% of the total particles released in the intermediate layer) takes about 5 years to enter the central Arabian Sea, the integration time for the four basic numerical experiments is set to 5 years each.
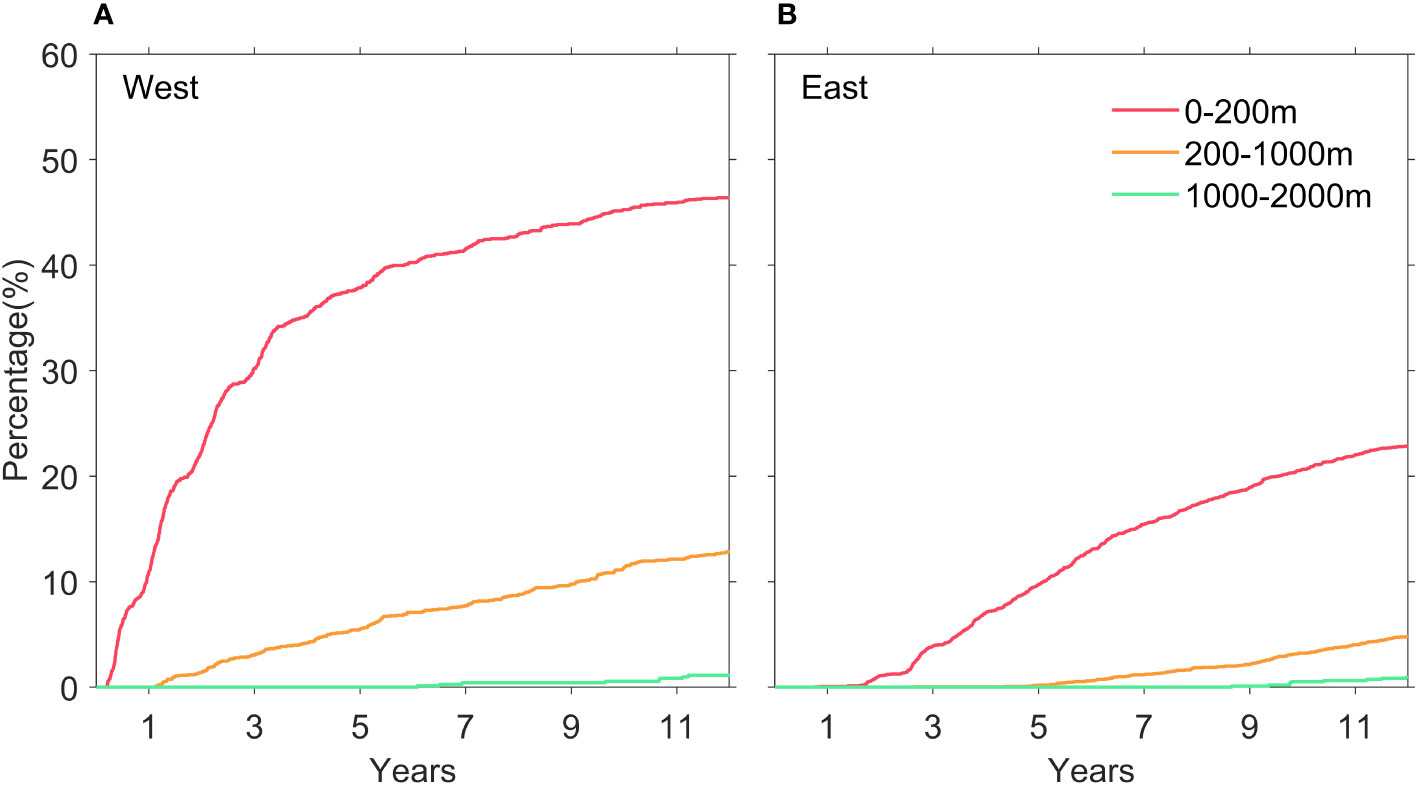
Figure 5 Transit time for particles to travel from different sources (A, west of southern boundary at 10°N in the Arabian Sea; B, east of southern boundary at 10°N in the Arabian Sea) to the central Arabian Sea. The percentage of transit time represents proportion of particles to the number of particles in the water layer where they are located. The transit time of particles, defined here as the time when half of the particles in the same water layer reach the central Arabian Sea.
The model results indicate that particles released on the west side (50°–55°E) of the southern boundary along 10°N tend to travel in the western Arabian Sea and are more likely to enter the box. The particles in the upper layer (0–200 m) are more easily impacted by wind-generated circulation due to the faster velocities. As a result, they enter the central Arabian Sea earlier than their counterparts released between 1,000 and 2,000 m where particles rarely enter the central box (Figure 6). The particles released on the east side (70°–76°E) tend to travel along the eastern Arabian Sea.
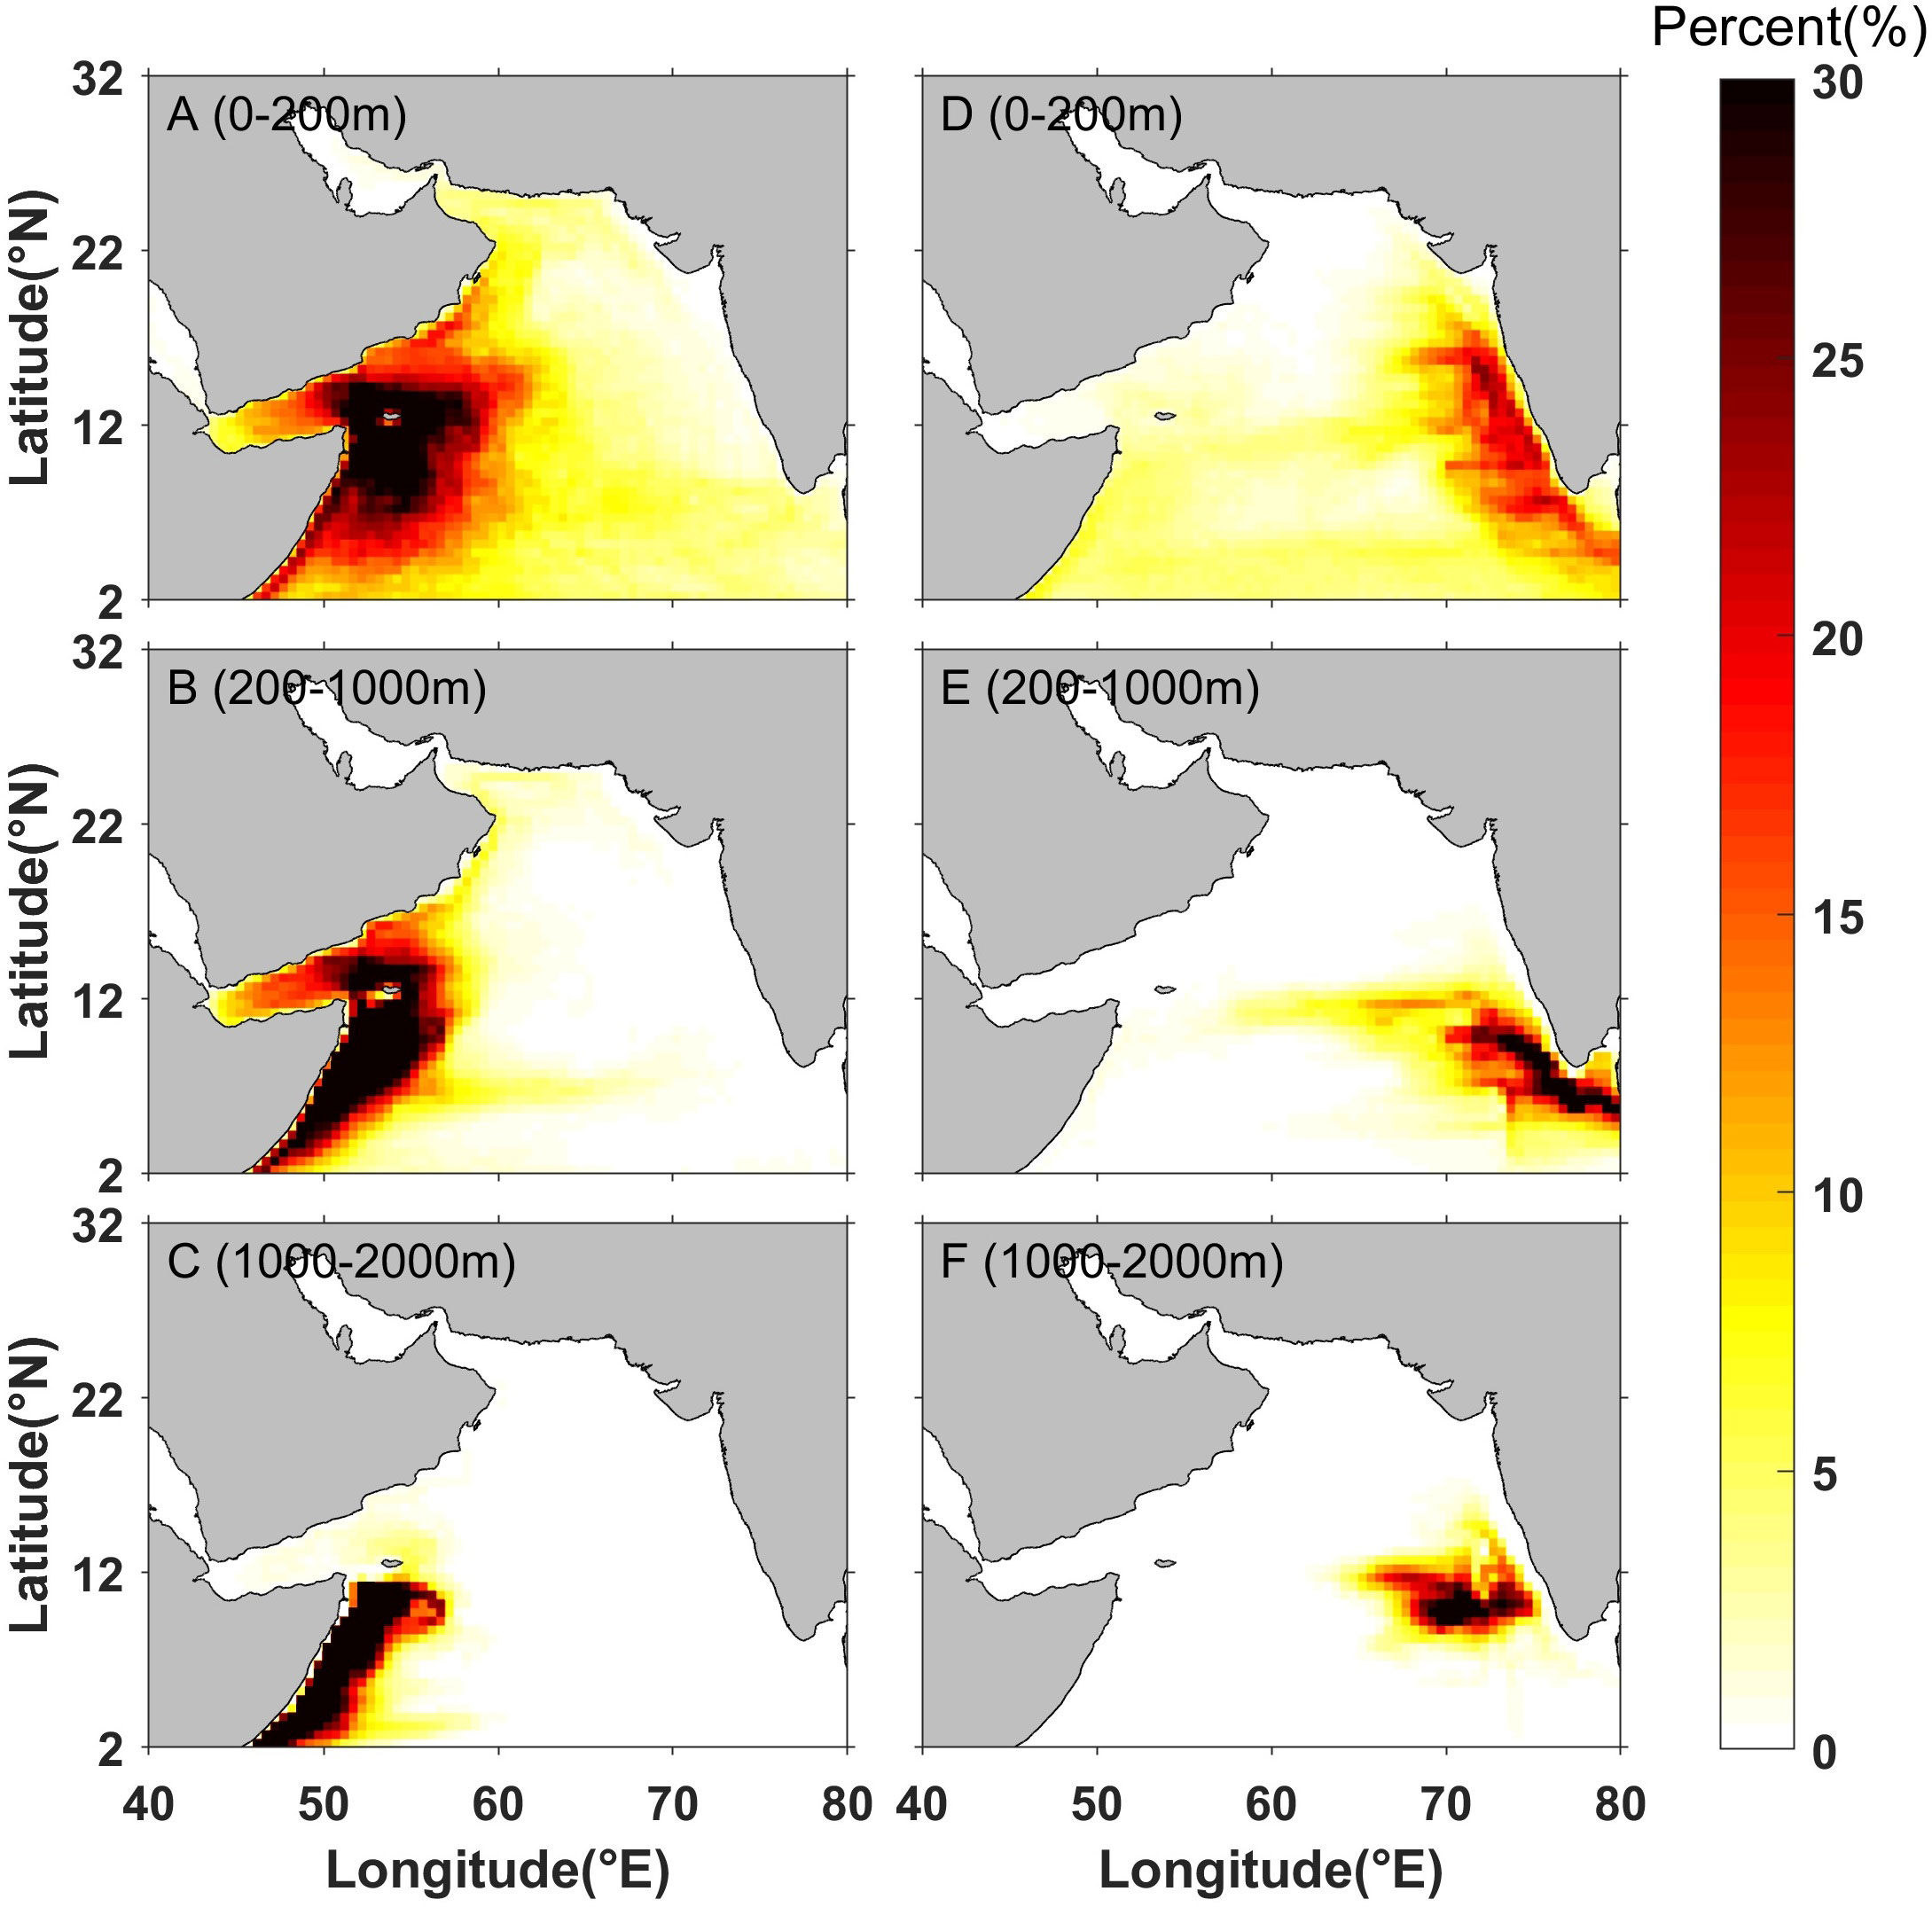
Figure 6 Transport pathways of particles 5 years after being released in different sources (A–C, released in the west of southern boundary at 10°N in the Arabian Sea; D–F, released in the east), and being released at different depths (A, D released at depths ranging from 0 to 200 m; B, E released at depths ranging from 200 to 1,000 m; C, F released at depths ranging from 1,000 to 2,000 m).
3.3.2 Effect of oxygen-rich water from the southern boundary
The Lagrangian particle tracking experiments indicate that the southern oxygen-rich water entering the Arabian Sea has a significant impact on dissolved oxygen concentration, consistent with previous studies (Resplandy et al., 2012; McCreary et al., 2013; Rixen et al., 2014; Acharya and Panigrahi, 2016). Two numerical experiments associated with southern oxygen-rich water were conducted to investigate the role of oxygen-rich water from the southern boundary of the Arabian Sea (described in detail in Section 2.2). Water mass entering the Arabian Sea was set to a low dissolved oxygen concentration (15 mmol·m−3) in Exp1 and to a high concentration (100 mmol·m−3) in Exp2.
Figure 7 depicts annual mean horizontal distributions of dissolved oxygen averaged between 200 and 1,000 m and vertical distributions along 17°N from three experiments (Exp0, Exp1, and Exp2). When water with lower dissolved oxygen concentration enter the Arabian Sea via the Somali Coastal Current (Exp1), the suboxic area expands significantly westward to around 58°E (compared to 59°E in Exp0). Note that the suboxic area is significantly reduced in Exp2, with the boundary contracts to about 60°E in the west and about 22°N in the north (compared to 25°N in Exp0) when high dissolved oxygen water flows in.
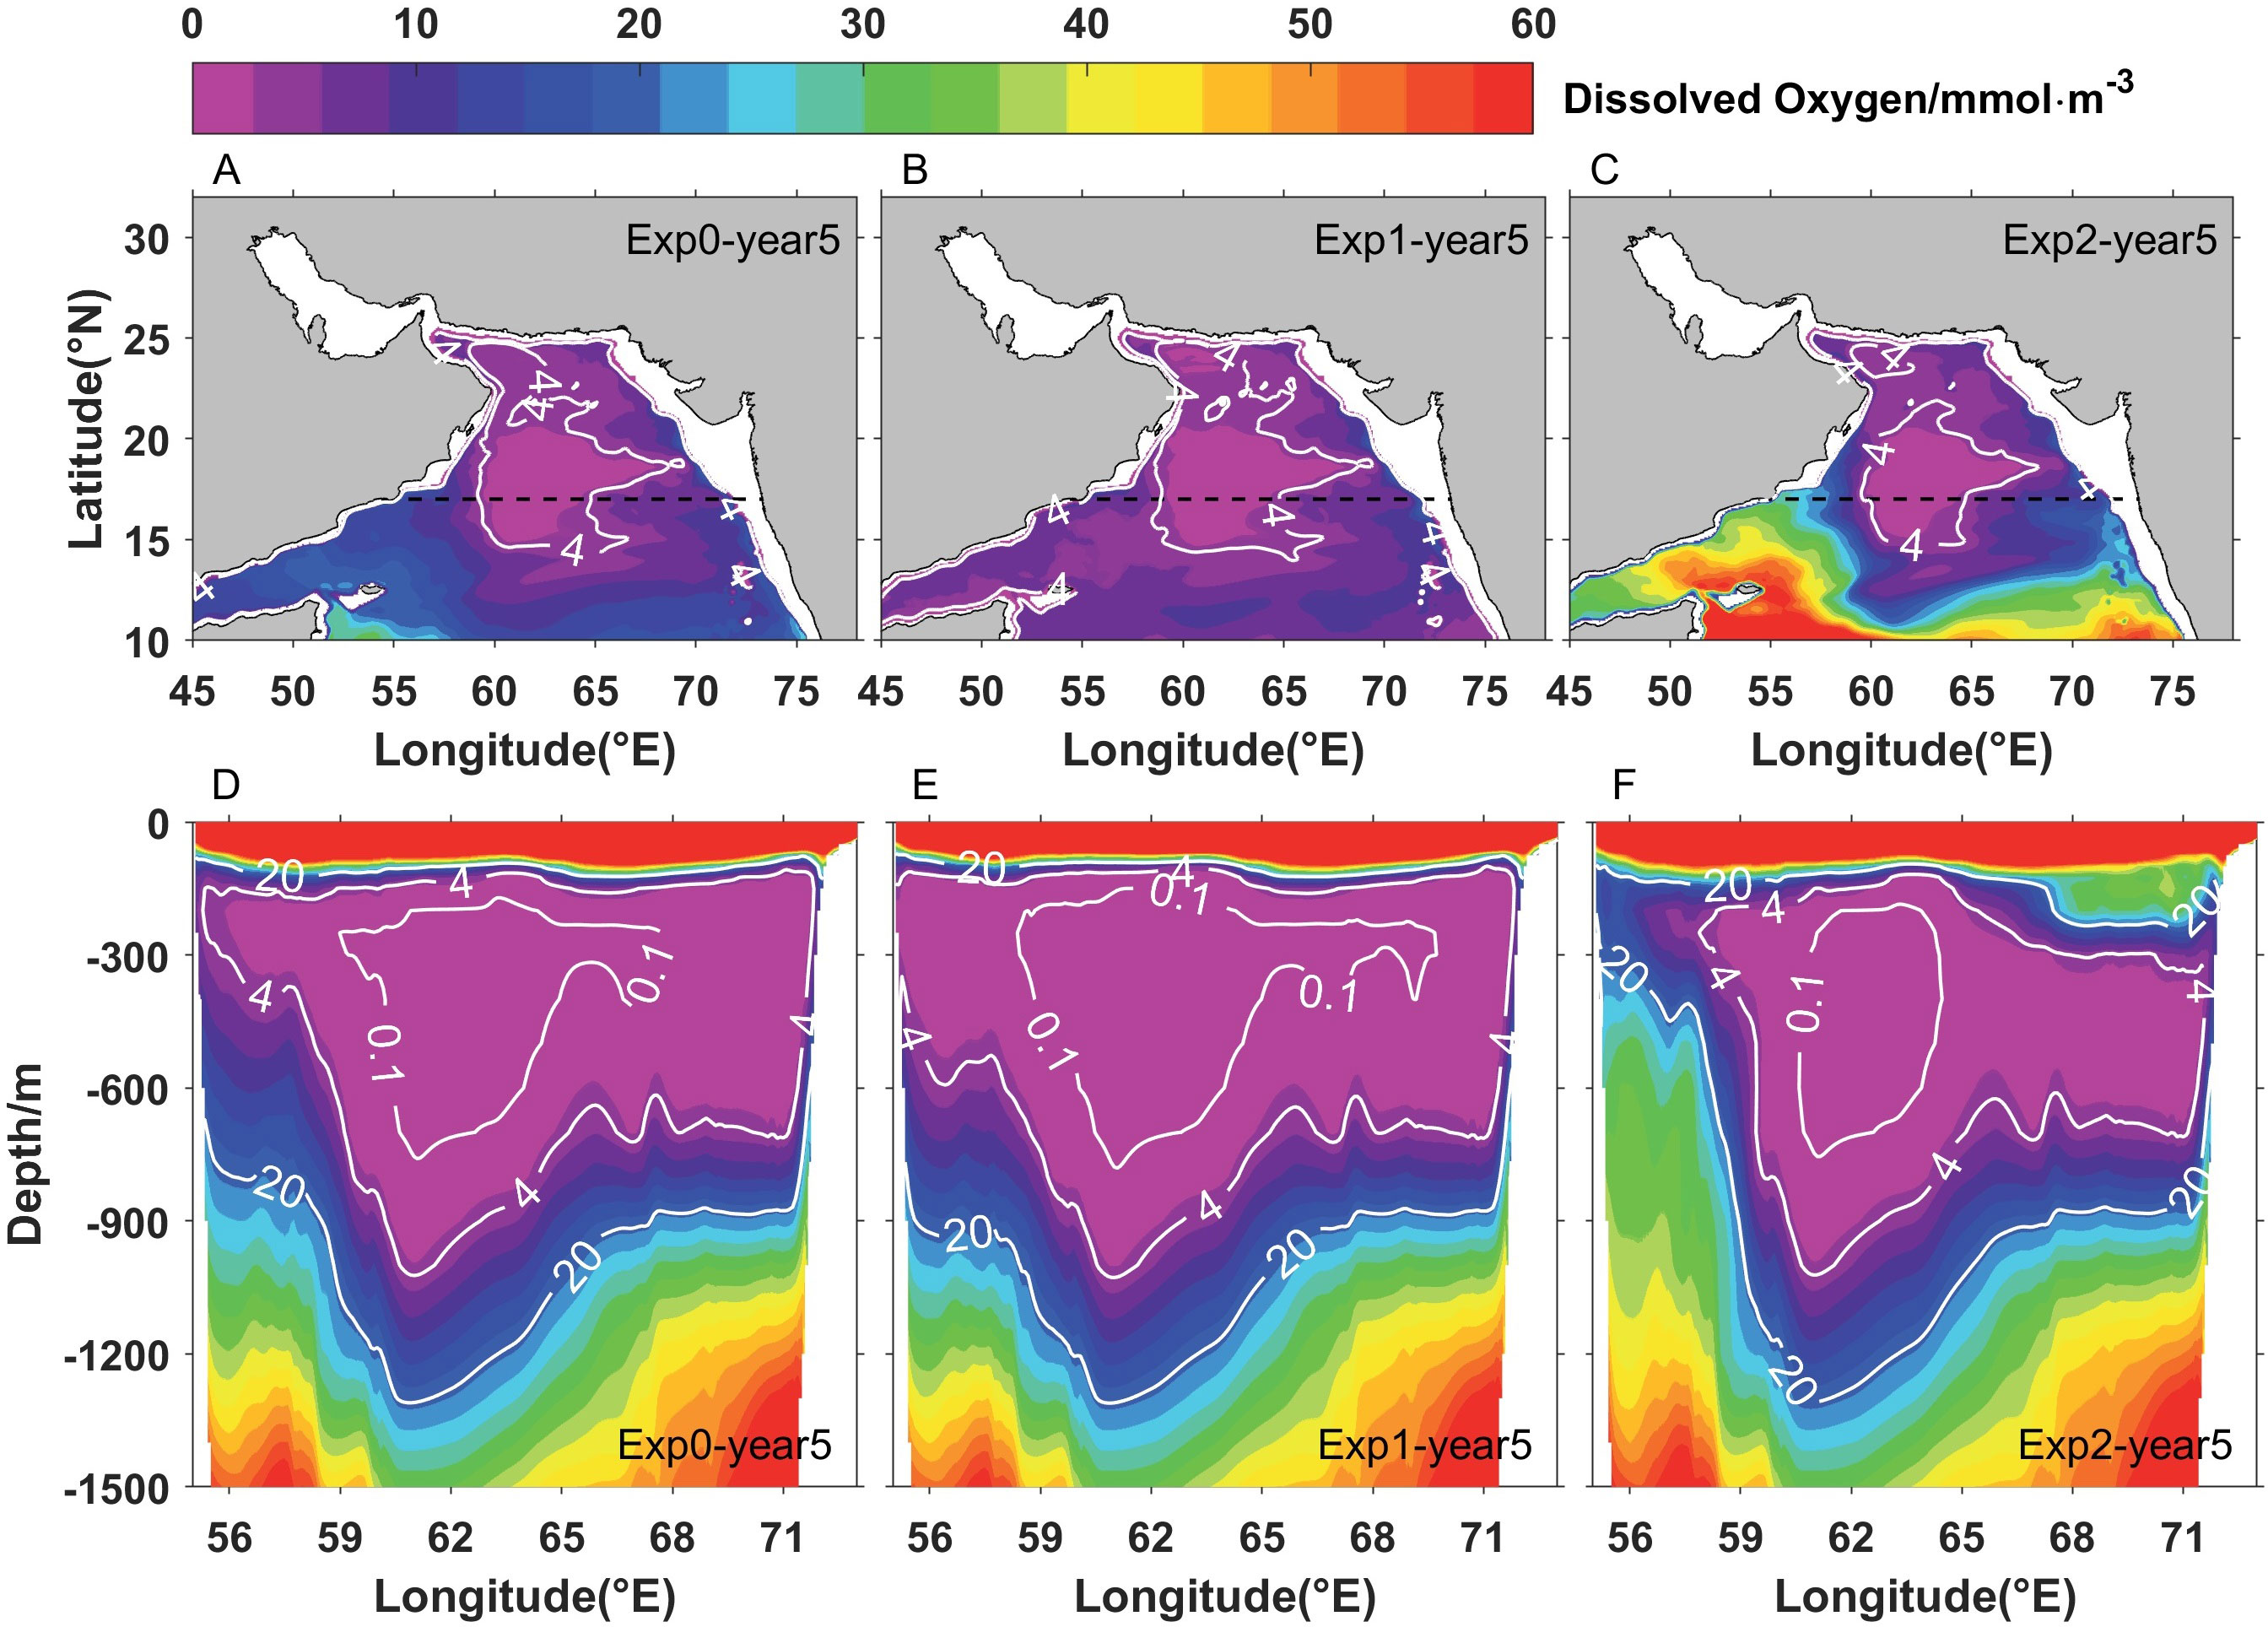
Figure 7 Annual mean horizontal distributions of dissolved oxygen (A–C) averaged between 200 and 1,000 m and vertical distributions of dissolved oxygen (D–F) in the upper 1,500 m at 17°N from three experiments (Exp0, Exp1, and Exp2) after 5 years of integration.
In particular, the inflow with low dissolved oxygen concentration causes a dramatic decrease in dissolved oxygen in the Gulf of Aden from ~14.4 to ~6.0 mmol·m−3. The vertical profile of dissolved oxygen shows that the volume of suboxic water in the Gulf of Aden increases significantly as the depth range is extended from 150–400 m to 150–600 m (Figure 7). In Exp2, the dissolved oxygen concentration in the Gulf of Aden dramatically increases from ~14.4 to ~39.2 mmol·m−3. The volume of suboxic water is also reduced significantly and the microbial hypoxic zone, defined by Rixen et al. (2020) as the layer with DO< 20 mmol·m−3 and anammox occurred, is uplifted from ~800 to ~400 m (Figure 7). The eastern Arabian Sea is also affected by the oxygen-rich water from the southern boundary, albeit less significantly than the western part. Only the water mass ranging from 150 to 300 m shows a significant increase in dissolved oxygen concentration from ~4 to ~35 mmol·m−3 (Figure 7F).
To better understand the impact of oxygen-rich water from the southern boundary of the Arabian Sea, two representative sites are selected (sites A and B in Figure 1) to represent the region with high primary production and high dissolved oxygen concentration in the Gulf of Aden and that with low dissolved oxygen concentration in the central Arabian Sea, respectively. The presence of the Somali Coastal Current influences the oxygen-rich water at site A near the Gulf of Aden. Figure 8 depicts current flux and associated dissolved oxygen flux averaged between 200 and 1,000 m in the Somali Coastal Current at 11.8°N on the western side of the Arabian Sea. The results indicate that the current is a net inflow into the Arabian Sea during the summer and peaked in August. Correspondingly, the dissolved oxygen flux also peaks in the same month with the value of ~8.5 × 10⁷ mmol·s−1 in Exp1, nearly one-fourth of that in Exp0 (~3.7 × 10⁸ mmol·s−1), and ~9.9 × 10⁸ mmol·s−1 in Exp2. It is noteworthy that the southern boundary of the western Arabian Sea shifts from gain to loss when the oxygen-rich water from the southern boundary becomes low oxygen water. The annual mean flux of dissolved oxygen changes from ~2.7 × 10⁷ mmol·s−1 in Exp0 to −1.1 × 10⁶ mmol·s−1 in Exp1. However, it increases about threefold from ~2.7 × 10⁷ mmol·s−1 in Exp0 to ~9.5 × 10⁷ mmol·s−1 in Exp2 with higher oxygen-rich water from the southern boundary entering the Arabian Sea. As a result, the dissolved oxygen concentration at site A increases significantly after the replenished flux reaches the site in August (Figure 9A), whereas it decreases significantly with lower oxygen water flowing in. The annual mean dissolved oxygen concentration at site A increases significantly from ~14.4 to ~39.2 mmol·m−3 with higher oxygen-rich water, while it decreases significantly to ~6.0 mmol·m−3 with lower oxygen-rich water.
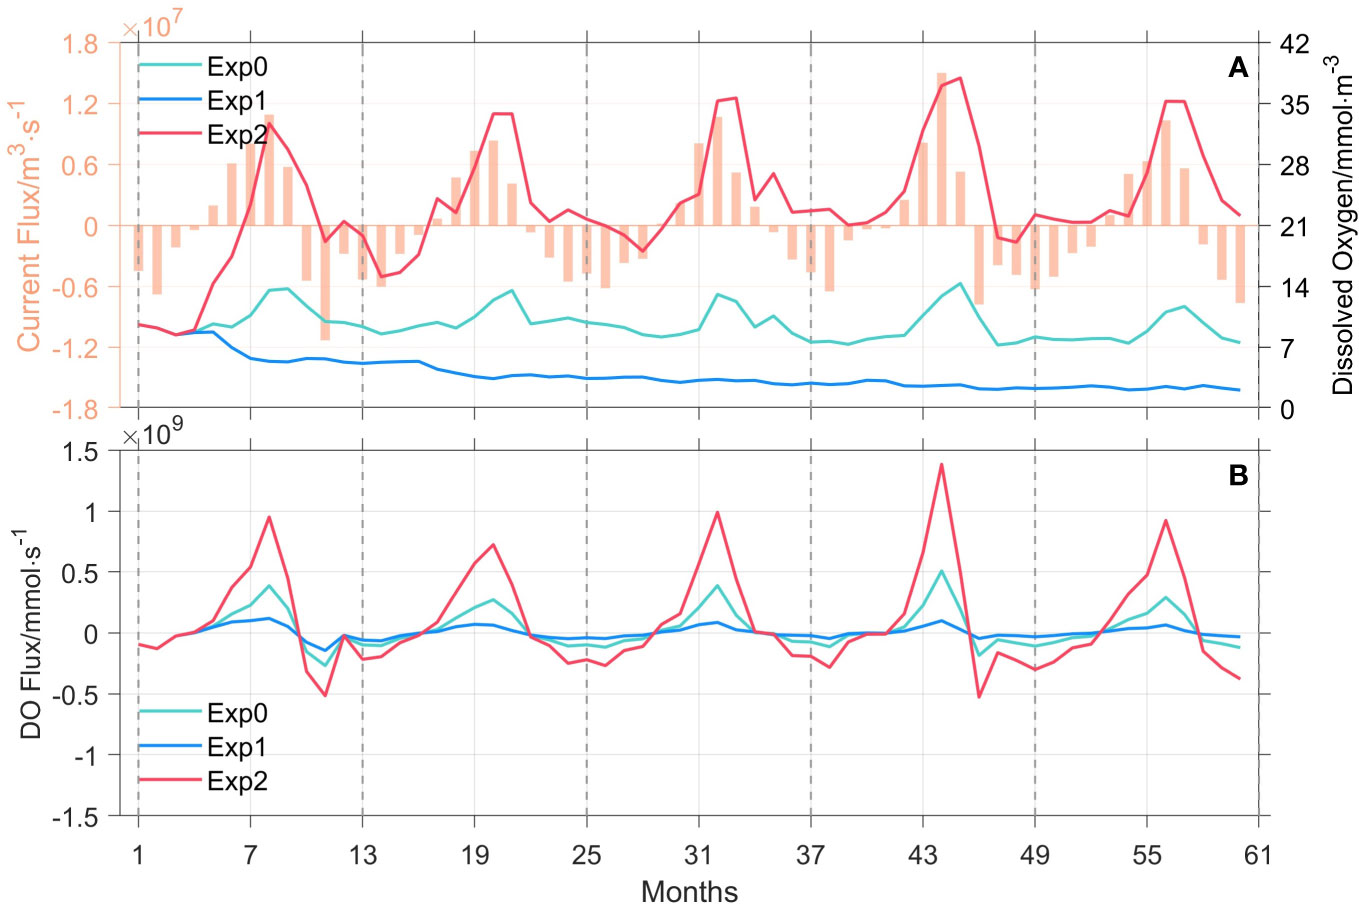
Figure 8 Current flux (A, orange bar, left y-axis) and dissolved oxygen concentration (A, line, right y-axis) near 11.8°N in the western side of the Arabian Sea (50°–55°E). Associated dissolved oxygen flux (B) averaged between 200 and 1,000 m near 11.8°N in the western side of the Arabian Sea from three experiments (Exp0, Exp1, and Exp2).
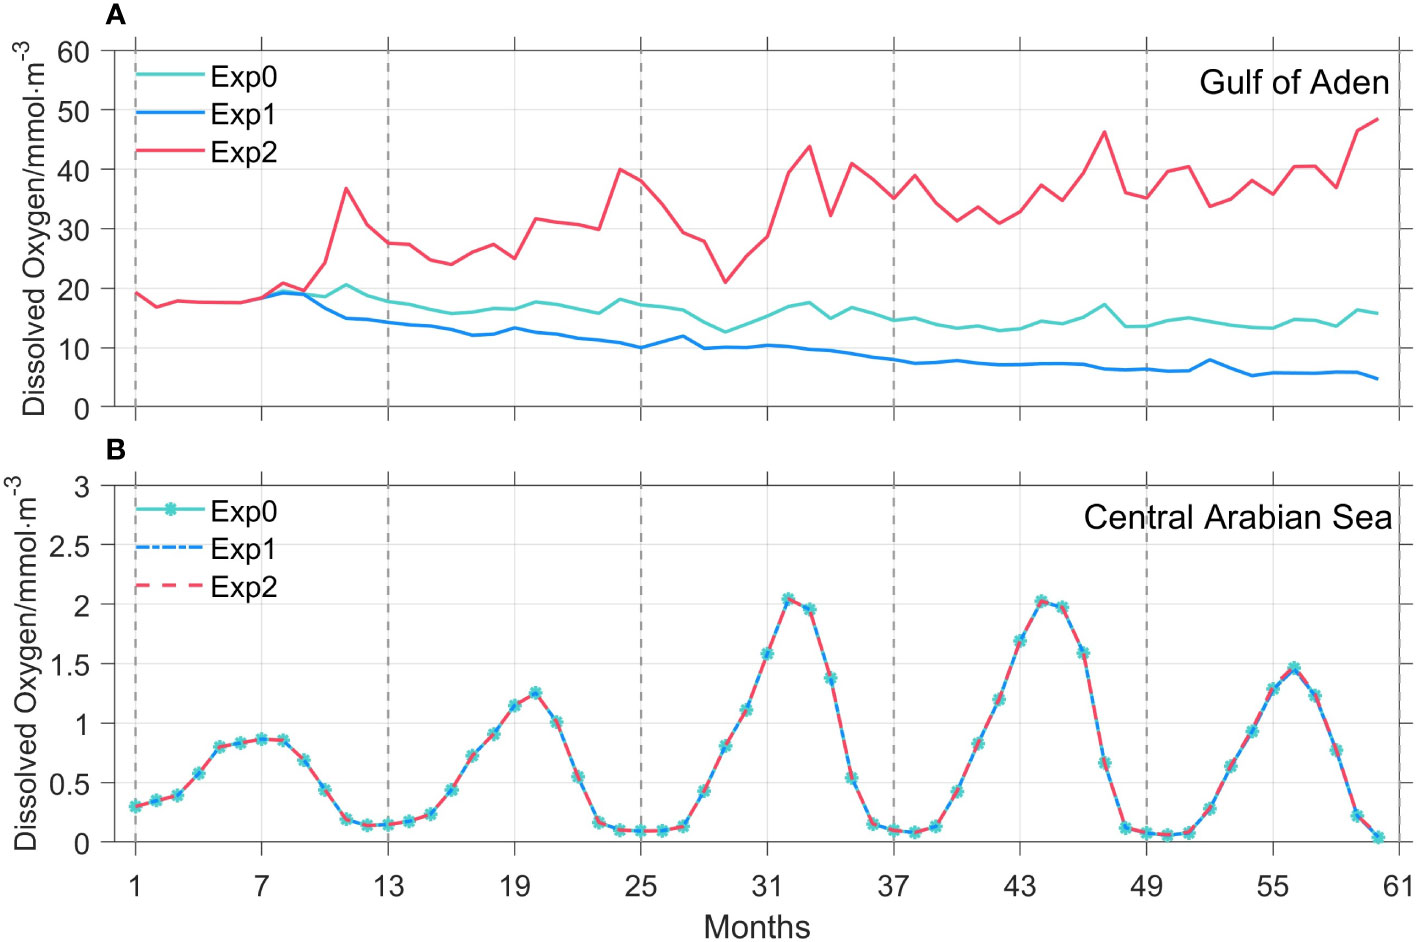
Figure 9 Time series of averaged dissolved oxygen concentration at site A (A; Gulf of Aden) and site B (B; central Arabian Sea) from three experiments (Exp0, Exp1, and Exp2).
Site B, located in the central Arabian Sea, is hardly affected by the oxygen-rich water from the southern boundary (Figure 9). Despite variation in the oxygen level of water from the southern boundary, the dissolved oxygen concentration in the central Arabian Sea remains nearly constant. Previous Lagrangian particle tracking experiments also demonstrates that it is difficult for the water masses below 200 m from the southern boundary to enter the central Arabian Sea, but it can reach the northern Arabian Sea along the coast (Figure 6; You, 1997; Schott and McCreary, 2001; Rixen et al., 2014). Therefore, it can be concluded that the dissolved oxygen carried by oxygen-rich water from the southern boundary of the Arabian Sea plays an important role in regulating dissolved oxygen concentration in the western Arabian Sea, but has little effect on the central Arabian Sea.
3.4 Biological factors affecting the ASOMZ
The oxygen budget analysis indicates that the horizontal advection term acts as the main oxygen gain, and the oxygen consumption term is the main oxygen loss. The role of horizontal advection is demonstrated in the previous section. In this section, we investigate the effect of oxygen consumption.
Previous studies showed that oxygen consumption in the OMZ is mainly consumed by the remineralization of POM (McCreary et al., 2013; Acharya and Panigrahi, 2016), while the sinking velocity is the vital important factor to affect the fraction of POM remineralized in this zone. Consequently, two numerical experiments associated with different sinking velocity were conducted (see Section 2.2).
Unlike the experiments in which oxygen-rich water from the southern boundary of the Arabian Sea has a significant impact only in the high primary productivity region (Gulf of Aden) in the western Arabian Sea, variation in sinking velocity of POM affects the entire ASOMZ. Figure 10 depicts the annual mean horizontal distributions of dissolved oxygen averaged between 200 and 1,000 m and vertical distributions in the upper 1,500 m at 17°N in the three experiments (Exp0, Exp3, and Exp4). When the sinking velocity is reduced by a factor of 2 (Exp3), the suboxic area of the Arabian Sea contracts to approximately 60°E in the west, ~20°N in the north, and ~15°N in the south. The dissolved oxygen concentration at site A (Gulf of Aden) increases from ~14.4 to ~20.0 mmol·m−3, while the concentration in site B (the central Arabian Sea) also increases from ~0.6 to ~1.2 mmol·m−3. The vertical profile of dissolved oxygen also shows that the suboxic volume retreats from ~55°E to ~57°E in the Gulf of Aden. In the central Arabian Sea, the suboxic zone reduces from ~1,000 to ~900 m and microbial hypoxic zone reduces from ~1,300 to ~1,200 m.
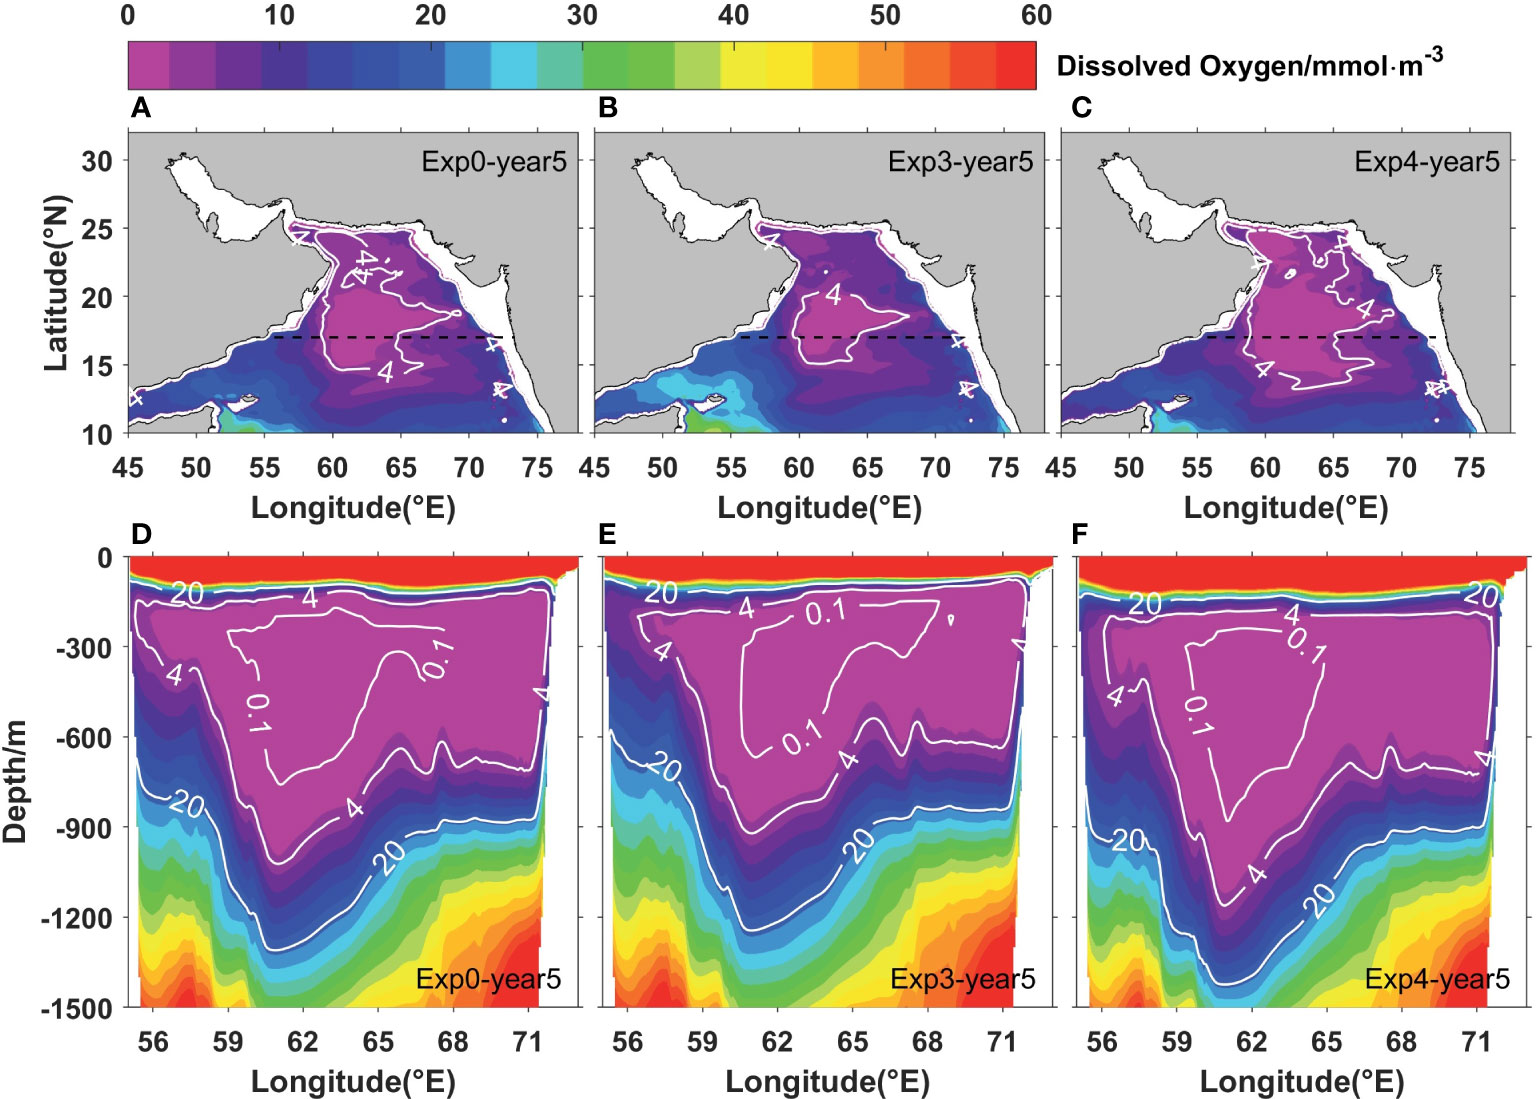
Figure 10 Annual mean horizontal distributions of dissolved oxygen (A–C) averaged between 200 and 1,000 m and vertical distributions of dissolved oxygen (D–F) in the upper 1,500 m at 17°N from three experiments (Exp0, Exp3, and Exp4) after 5 years of integration.
When the sinking velocity is increased by a factor of 2 (Exp4), the suboxic area extends westward to ~58°E, southward to ~13°N, and northeastward to the coast of Pakistan. The dissolved oxygen concentration at site A decreases from ~14.4 to ~10.8 mmol·m−3, and the concentration at site B also decreases from ~0.6 to ~0.5 mmol·m−3 (Figure 12). The vertical distribution of dissolved oxygen shows that the suboxic zone extends from ~1,000 to ~1,200 m and the microbial hypoxic zone extends from ~1,300 to ~1,400 m in the central Arabian Sea. The microbial hypoxic zone in the Gulf of Aden extends from 800 to 1,000 m, despite little change in the suboxic region.
POM consumed more dissolved oxygen at shallow depths when sinking velocity of POM decreased (Exp3), resulting in a shoaling of the ASOMZ (Mathew et al., 2021). On the contrary, the ASOMZ retracted vertically when sinking velocity increased (Exp4, Figures 10D-F). Depth variation of the upper boundary of the ASOMZ (DO = 60 mmol·m−3) in sites A and B also shows this feature (Figure 11). The depth of upper boundary of the ASOMZ in the central Arabian Sea decreases from 60 to 45 m in late summer when the sinking velocity of POM decreased, and the boundary increases from 60 to 90 m when sinking velocity of POM increased. The depth of upper boundary in the Gulf of Aden becomes a little shallow in Exp3 and deepens to ~60 m in Exp4. Besides that, it is interesting to note that the variation of the depth of the upper boundary of the ASOMZ has significant seasonal cycle (Sudheesh et al., 2022). The upper boundary of the ASOMZ in the central Arabian Sea reaches the shallowest depth (~60 m) in late summer due to more POM, which generates from the high primary production in the summer monsoon, and consumes a large amount of dissolved oxygen in the upper water column. Then, it gradually deepens to ~85 m during the winter monsoon.
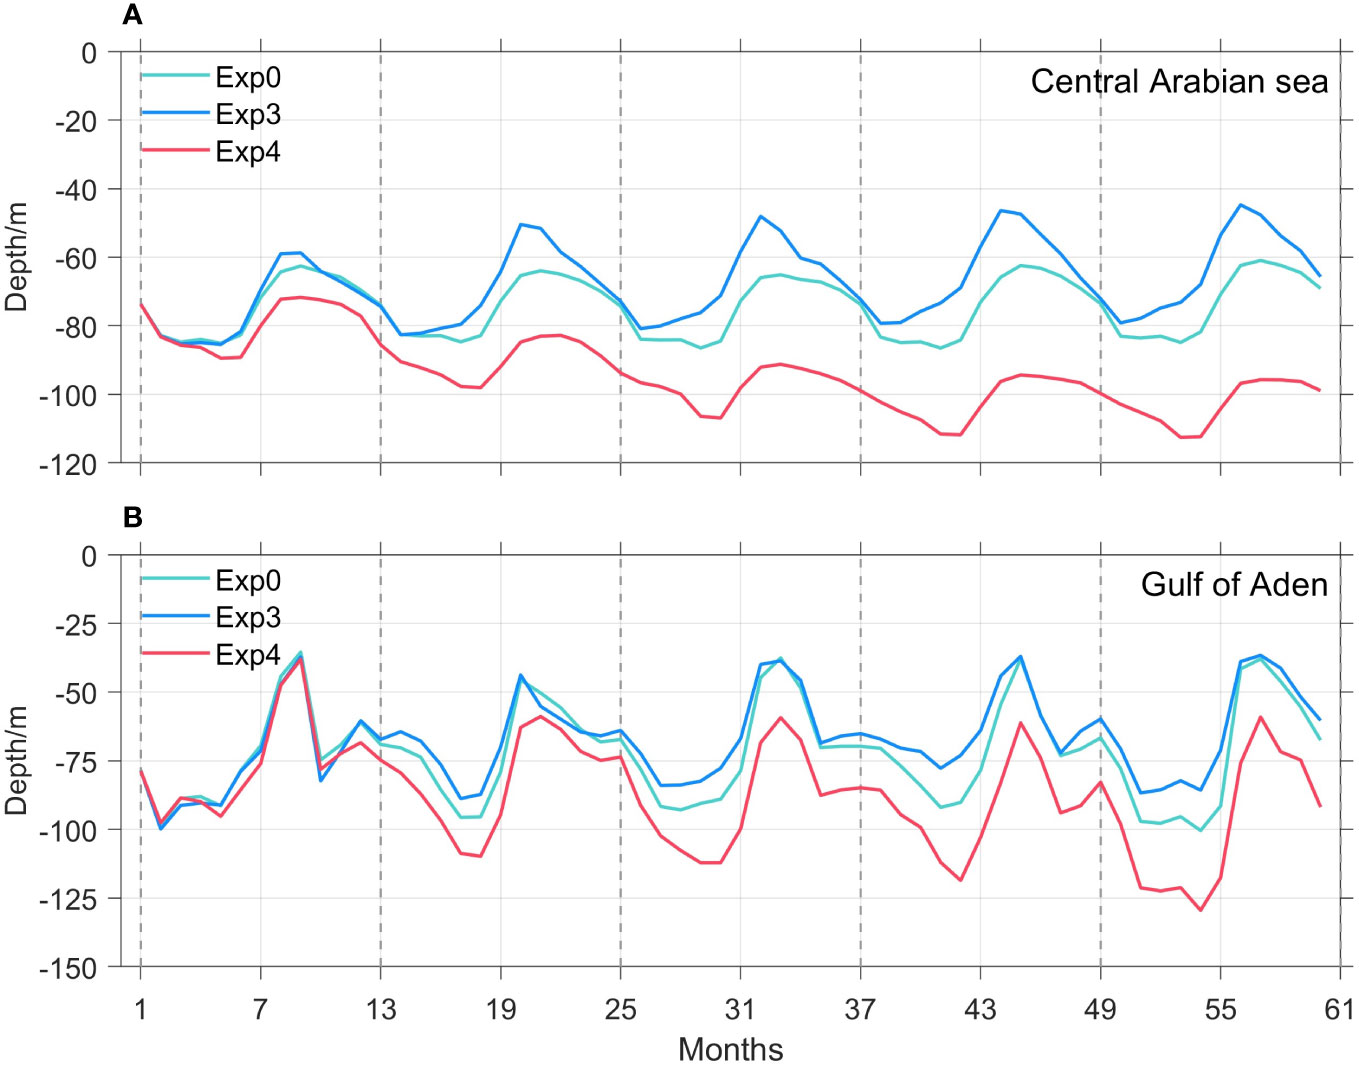
Figure 11 Time series of the upper boundary of the ASOMZ at site A (A; central Arabian Sea) and site B (B; Gulf of Aden) from three experiments (Exp0, Exp3, and Exp4).
3.5 Variation of the ASOMZ
Previous studies demonstrated that both horizontal advection and oxygen consumption affect the ASOMZ. Therefore, we used sensitivity experiments (Exp0–Exp4) to calculate changes in the area and volume of the ASOMZ (Figure 13). For the microbial hypoxic zone (averaged DO between 200 and 1,000 m< 20 mmol·m−3), its area expands to ~2.3 × 10¹² m2 as lower oxygen water enters the Arabian Sea, and then maintains it stably due to the whole Arabian Sea becomes a microbial hypoxic zone. Nevertheless, as more oxygen-rich water enters the Arabian Sea such that the annual mean dissolved oxygen flux rises approximately threefold, the microbial hypoxic area gradually drops to ~1.65 × 10¹² m2 after 5 years of integration, which is only ~72% of the control (Exp0). For the case of changes in oxygen consumption caused by variation of sinking velocity, when the sinking velocity is reduced to 2.5 m·day−1 and the POM flux at 200 m (FPOM200; Figure 12) decreases by ~45% from ~1.45 × 10⁴ mg·C·m-2·year−1 (Exp0) to ~7.95 × 10³ mg·C·m-2·year−1 (Exp3), the microbial hypoxic area gradually drops to ~2.11 × 10¹² m2, which is ~92% of the control (Exp0). When sinking velocity is increased to 10 m·day−1 and the FPOM200 increases by 18% (Exp4), the microbial hypoxic area gradually expands to ~2.3 × 10¹² m2 and remains stable. A similar feature is observed in the variation of OMZ volume. The microbial hypoxic volume increases to ~3.80 × 10¹⁵ m3 (Exp1) and ~3.62 × 10¹⁵ m3 (Exp4), or increases by ~10% and ~5% compared to Exp0, respectively. The microbial hypoxic volume drops to ~2.68 × 10¹⁵ m3 (Exp2) and ~3.11 × 10¹⁵ m3 (Exp3), or decreases by ~22% and ~9% compared to Exp0, respectively.
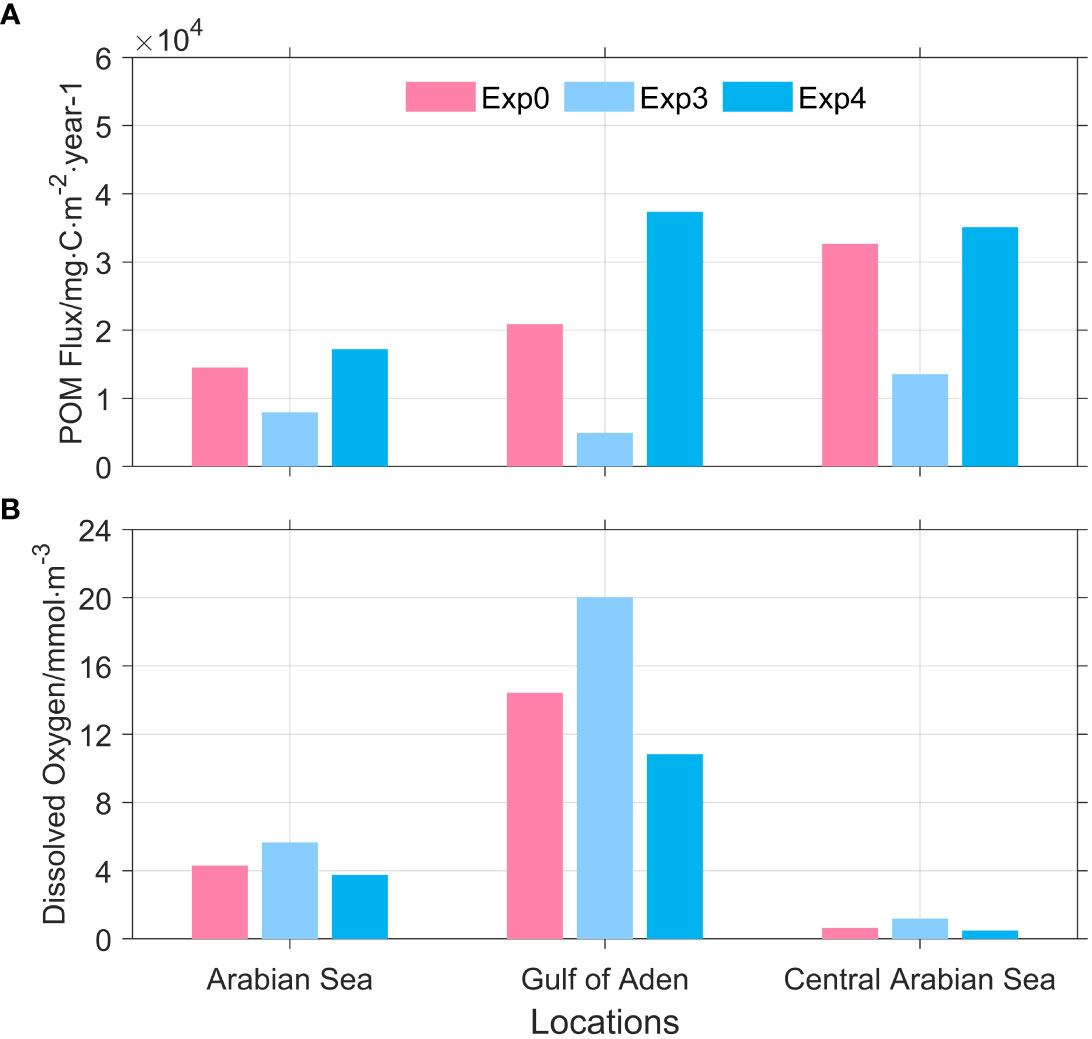
Figure 12 POM flux at 200 m (A), dissolved oxygen average concentration ranging from 200 to 1,000 m (B) in the Arabian Sea (left column), site A (middle column; Gulf of Aden) and site B (right column; central Arabian Sea) from three experiments (Exp0, Exp3, and Exp4).
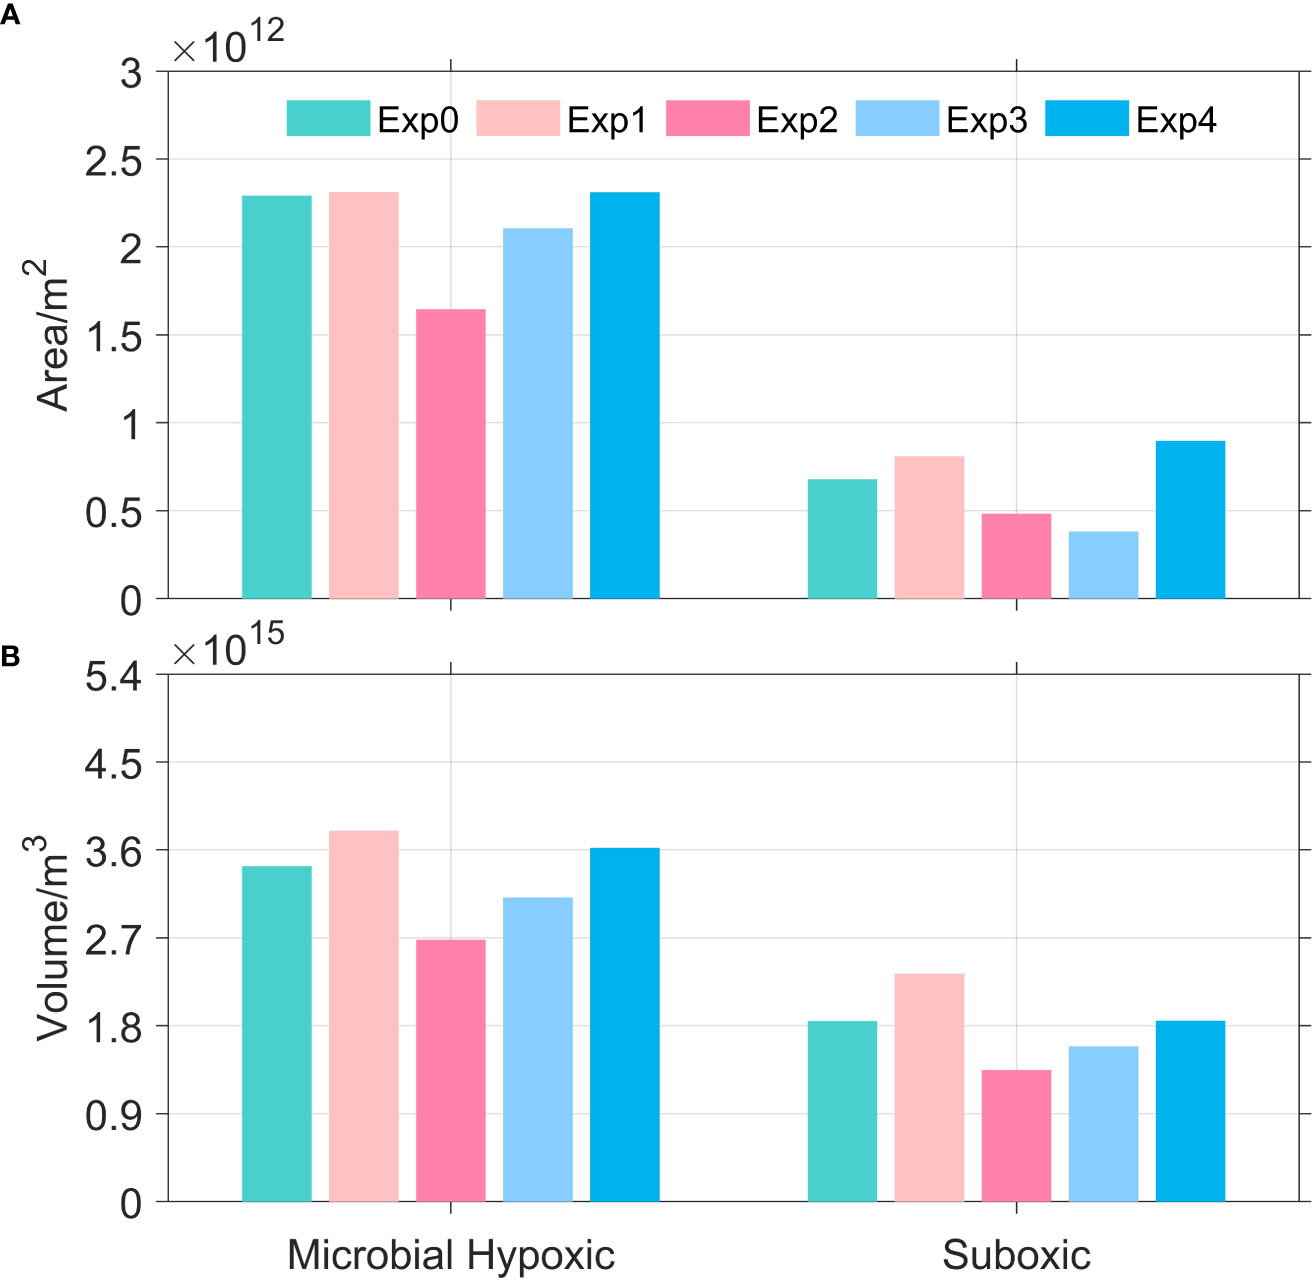
Figure 13 Changes in area (A) and volume (B) of microbial hypoxic zone (DO< 20 mmol·m−3; left column) and suboxic zone (DO< 4 mmol·m−3; right column) from five experiments (Exp0 to Exp4).
For the suboxic zone (DO< 4 mmol·m−3), a similar feature is more pronounced: the suboxic area (DO averaged between 200 and 1,000 m) gradually expands to ~8.09 × 10¹¹ m2 with lower oxygen water entering the Arabian Sea (Exp1), while it drops to ~4.83 × 10¹¹ m2 with higher oxygen-rich water entering the Arabian Sea (Exp2), or increases by ~19% and decreases by ~29% compared to Exp0, respectively. Meanwhile, the suboxic volume climbs to ~2.33 × 10¹⁵ m3 (Exp1) and falls to ~1.35 × 10¹⁵ m3 (Exp2), or increases by ~26% and decreases ~27% compared to Exp0, respectively. On the other hand, the variation of sinking velocity suggests that the suboxic area drops to ~3.82 × 10¹¹ m2 when sinking velocity decreases by a factor of 2 (Exp3), yet it expands to ~8.98 × 10¹¹ m2 when sinking velocity increases by a factor of 2 (Exp4), or decreases by ~44% and increases by ~32% compared to Exp0, respectively. Moreover, the suboxic volume decreases to ~1.59 × 10¹⁵ m3 in Exp3 compared to Exp0, or decreases by ~14%, and the suboxic volume remains virtually the same in Exp4 because the average dissolved oxygen concentration of the Arabian Sea at the intermediate depth is nearly 4 mmol·m−3.
4 Discussion
4.1 Source regions of POM
To better understand the effect of POM sinking on the formation of the ASOMZ, some idealized experiments to trace the source of the POM were performed (details in Section 2.2 and supplement; see Table 1). To further study the contribution of different source regions in the central Arabian Sea, the POM results were adjusted according to the concentration of chlorophyll in the source regions. The POM in the Gulf of Aden is primarily derived from local productivity, particularly the bloom in the summer, while ~15% of POM from the winter bloom off the Oman coast is detected in the Gulf of Aden (Figure 14). The summer bloom off the Oman coast contributed ~14% of summer POM in the central Arabian Sea, and all winter POM in the central Arabian Sea are from the local winter bloom productivity. On the other hand, although the surface primary production of the central Arabian Sea is low in the summer monsoon, POM from the western Arabian Sea high primary productivity region (Oman Coast) due to the offshore Ekman transport still consumes dissolved oxygen in the central Arabian Sea intermediate layer (Rixen et al., 2006). Combined oxygen consumption of POM from summer bloom and winter bloom could be one of the reasons for the significant seasonal cycle of chlorophyll in the surface layer and the weaker seasonal variation of ASOMZ distribution in the intermediate layer.
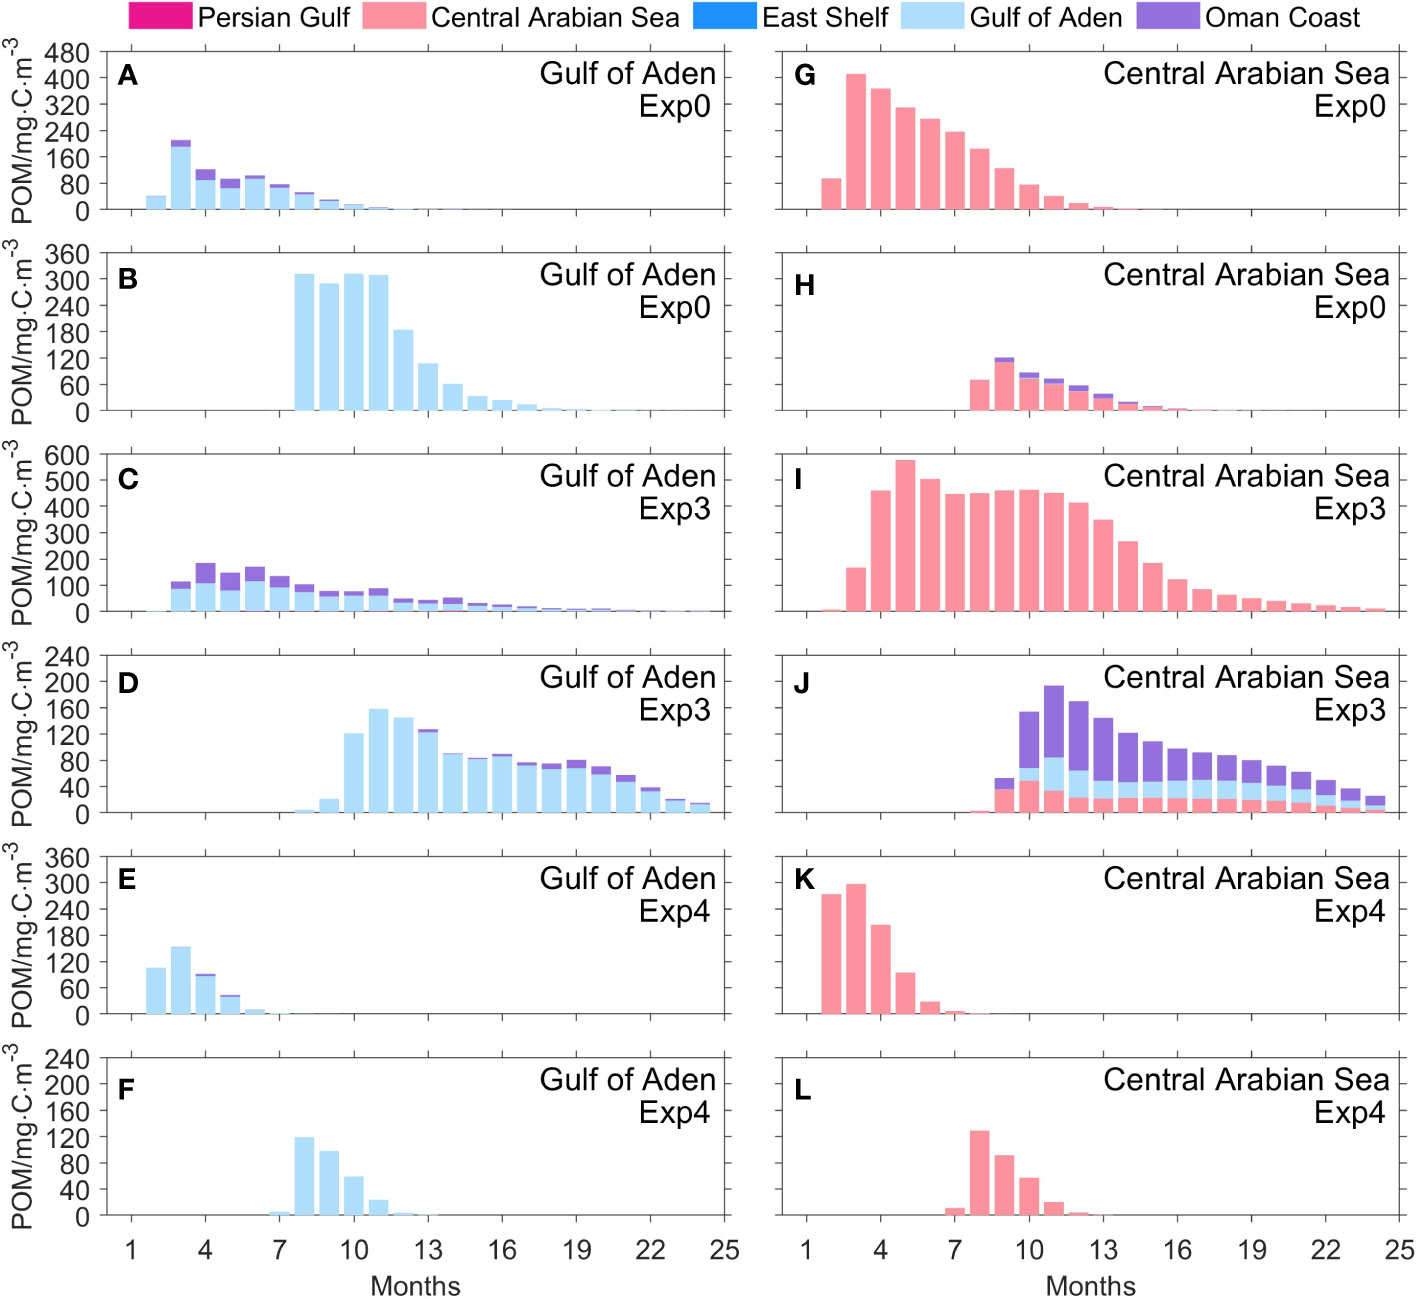
Figure 14 Variations and source regions of POM concentration at site A (A–F; Gulf of Aden) and site B (G–L; central Arabian Sea). POM was released from the five locations (Figure S2) with constant values in different released seasons (A, C, E, G, I, K, POM released in December; B, D, F, H, J, L, POM released in June). The POM model results were adjusted according to the concentration of chlorophyll in the source regions.
After the winter bloom, when the sinking velocity is decreased by a factor of 2 (Exp3), the POM in the Gulf of Aden is mainly derived from local productivity (~65%) and Oman coast (~34%), and the POM in the central Arabian Sea is entirely derived from local productivity. However, part of the POM detected in the Gulf of Aden come from the primary production off the Oman coast after 6 months of POM release under the influence of winter circulation. Meanwhile, majority of the POM (~53%) in the central Arabian Sea is from the summer bloom off the Oman coast due to Ekman transport, followed by POM originated from the Gulf of Aden and local productivity indigenous output. Furthermore, when the sinking velocity is doubled (Exp4), the POM is primarily sourced from local productivity, regardless of the summer or winter monsoon season and regardless of the location, in both the Gulf of Aden and the central Arabian Sea. These results of the change in sinking velocity represent the transport of POM of different sizes generated by various community compositions (Wiggert and Murtugudde, 2007; Hood et al., 2009; McCreary et al., 2013; Acharya and Panigrahi, 2016; Chowdhury et al., 2021). Huge species produce large POM with fast sinking velocity, while small species produce small POM with slow sinking velocity. However, it is worth noting that POM originating from other regions will be smaller than the estimated value mentioned above in reality due to remineralization, fragmentation, and other removal processes.
4.2 Mechanism of the ASOMZ’s decoupling
The Lagrangian particle experiments suggest that oxygen-rich water from the southern boundary of the Arabian Sea has a significant effect on regulating the dissolved oxygen concentration in the high primary productivity region (Gulf of Aden) on the western side of the Arabian Sea during the summer monsoon (Figure S7), especially in the intermediate water (200–1,000 m) where the ASOMZ is located (Figure S9). The POM detected in the Gulf of Aden is mainly derived from local primary productivity and indigenous output. It will be remineralized in the sinking process over the next few months, which continuously consumes dissolved oxygen in the Gulf of Aden (Figure 14). Meanwhile, during the summer monsoon, the oxygen-rich intermediate water is replenished to relieve dissolved oxygen depletion in high primary productivity regions, resulting in higher dissolved oxygen concentration on the western side of the Arabian Sea (Gulf of Aden) relative to the other regions (Figure 10). Otherwise, if the dissolved oxygen replenishment from the southern oxygen-rich intermediate water gradually decreased with global climate change, the dissolved oxygen concentration in the high primary productivity region would gradually decrease. In that case, the ASOMZ may move westward.
The Lagrangian particle experiments also suggest that it is difficult for the oxygen-rich water from the southern boundary of the Arabian Sea to enter the central Arabian Sea, and that the component that could enter the central Arabian Sea is the low oxygen water after passing through the high primary productivity regions (Figure 6). As a result, oxygen-rich water from the southern boundary of the Arabian Sea is not effective at replenishing dissolved oxygen in the central Arabian Sea. The dissolved oxygen concentration in the central Arabian Sea is more influenced by sinking POM and its remineralization process. The POM, affecting the central Arabian Sea, mainly originates from the high primary productivity regions on the western side of the Arabian Sea during the summer monsoon and its local production in the central Arabian Sea during the winter monsoon (Figure 14).
4.3 Limitations of this study
This study still has several limitations. For instance, the 15-year model spin-up may not be long enough to decrease the dissolved oxygen drift to exactly zero. As a result, it may lead to long-term accumulated errors that the simulated dissolved oxygen has an overall bias in the long-term integration. However, only the model results of the last year are used for analysis. Besides that, 15-year model spin-up is not particularly short due to technical difficulty. Hence, we expect the major conclusions of this study to stay unchanged under a longer spin-up time. Similarly, the 5-year simulation for sensitivity experiments, which is derived from the particles transit time, may not be long enough to fully address the ventilation of the ASOMZ. It may underestimate the dissolved oxygen concentration in the central Arabian Sea when analyzing sensitivity experiments. In the following study, longer spin-up may be needed for model drift stability and longer simulation time of the Lagrangian particle tracking experiment may be needed for more transit time of oxygen-rich water masses from the southern boundary of the Arabian Sea. Consequently, simulation time of sensitivity experiments may be extended for ventilation of the ASOMZ.
Besides that, several studies suggest that Persian Gulf water (PGW) and Red Sea Water (RSW) play a significant role in ventilating the ASOMZ (e.g., Lachkar et al., 2019). These oxygen-rich water masses can reach the western side of the Arabian Sea to replenish the dissolved oxygen depletion there (Schmidt et al., 2020). However, considering that the flow of PGW (~0.1 Sv) and RSW (~0.3 Sv) is much smaller than the Somali coastal current (~10 Sv, Schott et al., 1990; Schott and McCreary, 2001), they are not included in this study for this reason. Moreover, some new mechanisms have also not been considered in this study, for instance, the contribution of poorly ventilated waters to the ASOMZ due to the lack of mesoscale mixing (McCreary et al., 2013; Schmidt et al., 2020) and the effect of oxygen consumption by remineralization of organic matter originating from the eastern Arabian Sea shelf on ASOMZ (Sarma et al., 2020). In addition, increased primary productivity due to the eastward transport of excess upwelled nutrients induced by iron limitation in the western Arabian Sea thus intensifies the OMZ in the central/northern Arabian Sea (Moffett and Landry, 2020). Consequently, the lack of iron in the model may lead to higher primary productivity in the western Arabian Sea, and less nutrients are transported to the central/northern Arabian Sea, weakening the intensity of the ASOMZ there.
Notwithstanding these limitations, analysis of the inflow of oxygen-rich water and sinking velocity of POM in this study further deepens the understanding of the position decoupling of ASOMZ and phytoplankton productive zone.
5 Conclusions
In this study, we investigated the effects of the oxygen-rich water from the southern boundary of the Arabian Sea and the sinking velocity of POM on the decoupling of the ASOMZ, through a coupled physical–biogeochemical model. The oxygen budget analysis confirms that horizontal advection acts as the main (~71%) oxygen gain and oxygen consumption acts as the main (~70%) oxygen loss. The results of Lagrangian particle experiments suggest that the oxygen-rich intermediate water (200–1,000 m) from the southern boundary of the Arabian Sea enters the Arabian Sea along the west coast, but hardly enters the central Arabian Sea.
Sensitivity tests suggest that if annual mean dissolved oxygen flux increased by threefold, the dissolved oxygen concentration in the Gulf of Aden would increase by three times, and it would remain fairly steady in the central Arabian Sea. Unlike oxygen-rich water, variation in sinking velocity of POM affects the entire ASOMZ. Reduced sinking velocity of POM would alleviate the depletion of dissolved oxygen in the central Arabian Sea, and POM from the western Arabian Sea could have higher probability to reach the central Arabian Sea.
The oxygen-rich water from the southern boundary of the Arabian Sea effectively mitigates the dissolved oxygen consumption caused by remineralization of POM in the western Arabian Sea high primary productivity regions. However, not only the central Arabian Sea is less ventilated by the oxygen-rich water from the southern boundary of the Arabian Sea, but also the POMs are remineralized to consume local dissolved oxygen, which are from the high primary productivity regions (Oman Coast) on the west side and transported to the central Arabian Sea in summer bloom and are from local productivity in winter bloom. In other words, more dissolved oxygen replenishment occurs in the western Arabian Sea, and more dissolved oxygen consumption and fewer dissolved oxygen replenishment take place in the central Arabian Sea, which are responsible for the position decoupling of the ASOMZ and phytoplankton productive zone. This also explains why the ASOMZ variation is weaker than the significant seasonal cycle of surface chlorophyll in the Arabian Sea.
Data availability statement
Publicly available datasets were analyzed in this study. This data can be found here: In-situ Observation data used in this study is provided by the project “the I07N cruise supported by the Global Ocean Ship-Based Hydrographic Investigation Program (GO-SHIP)”, from the Clivar and Carbon Hydrographic Data Office (CCHDO; https://cchdo.ucsd.edu). The sea surface wind and heat flux data obtained from ECMWF are available at http://apps.ecmwf.int/datasets/. Initial and open ocean boundary conditions are provided by SODA at https://www.soda.umd.edu/. Tidal constituents are obtained from the TPXO7.2 (https://www.tpxo.net/). Monthly mean discharges of major rivers are derived from the Global Runoff Data Centre (GRDC, http://grdc.bafg.de) and Global River Discharge Database (https://sage.nelson.wisc.edu/riverdata/). WOA18 datasets are available online (https://www.ncei.noaa.gov/access/world-ocean-atlas-2018/). The sea-surface climatological current is from the Drifter-Derived Climatology of Global Near-Surface Currents (https://www.aoml.noaa.gov/phod/gdp/animations.php). Sea-surface height (SSH) anomalies are from the SSALTO/DUACS multimission altimeter products from the Archiving, Validation and Interpretation of Satellite Oceanographic data (AVISO; http://www.aviso.altimetry.fr). Mean chlorophyll concentration data are from the Moderate Resolution Imaging Spectroradiometer (MODIS; https://modis.gsfc.nasa.gov). SST data are from the Optimum Interpolation Sea Surface Temperature, (OISST; https://www.ncei.noaa.gov/products/optimum-interpolation-sst).
Author contributions
ZZ: investigation and writing. WM and FC: design of the study and review of the manuscript. All authors contributed to the article and approved the submitted version.
Funding
This study was jointly supported by the Southern Marine Science and Engineering Guangdong Laboratory (Zhuhai) (Grant No. SML2020SP008), the Strategic Priority Research Program, Chinese Academy of Sciences, China (Grant No. XDB42000000), the National Natural Science Foundation of China (Nos. 41876123, 42276063), and Global Change and Air–Sea Interaction Program Phase II [“Joint Advanced Marine and Ecological Studies in the Bay of Bengal and the eastern equatorial Indian Ocean (JAMES)”, Grant No. GASI-01-EIND-STwin].
Conflict of interest
The authors declare that the research was conducted in the absence of any commercial or financial relationships that could be construed as a potential conflict of interest.
Publisher’s note
All claims expressed in this article are solely those of the authors and do not necessarily represent those of their affiliated organizations, or those of the publisher, the editors and the reviewers. Any product that may be evaluated in this article, or claim that may be made by its manufacturer, is not guaranteed or endorsed by the publisher.
Supplementary material
The Supplementary Material for this article can be found online at: https://www.frontiersin.org/articles/10.3389/fmars.2022.927921/full#supplementary-material
References
Acharya S. S., Panigrahi M. K. (2016). Eastward Shift and maintenance of Arabian Sea oxygen minimum zone: Understanding the paradox. Deep Sea Res. Part I: Oceanogr. Res. Pap. 115, 240–252. doi: 10.1016/j.dsr.2016.07.004
Ahsan A. Q., Blumberg A. F. (1999). Three-dimensional hydrothermal model of Onondaga lake, new York. J. Hydraul. Eng. 125 (9), 912–923. doi: 10.1061/(ASCE)0733-9429(1999)125:9(912)
Al Azhar M., Lachkar Z., Levy M., Smith S. (2017). Oxygen minimum zone contrasts between the Arabian Sea and the bay of Bengal implied by differences in remineralization depth. Geophys. Res. Lett. 44 (21), 11,106–111,114. doi: 10.1002/2017GL075157
Anderson T. R., Ryabchenko V. A., Fasham M. J., Gorchakov V. A. (2007). Denitrification in the Arabian Sea: A 3D ecosystem modelling study. Deep Sea Res. Part I: Oceanogr. Res. Pap. 54 (12), 2082–2119. doi: 10.1016/j.dsr.2007.09.005
Anju M., Sreeush M. G., Valsala V., Smitha B. R., Hamza F., Bharathi G., et al. (2020). Understanding the role of nutrient limitation on plankton biomass over Arabian Sea via 1-d coupled biogeochemical model and bio-argo observations. J. Geophys. Res.: Oceans 125 (6), e2019JC015502. doi: 10.1029/2019JC015502
Bianchi T. S., DiMarco S. F., Cowan J. Jr., Hetland R. D., Chapman P., Day J., et al. (2010). The science of hypoxia in the northern gulf of Mexico: A review. Sci. Total Environ. 408 (7), 1471–1484. doi: 10.1016/j.scitotenv.2009.11.047
Bianchi D., Dunne J. P., Sarmiento J. L., Galbraith E. D. (2012). Data-based estimates of suboxia, denitrification, and N2O production in the ocean and their sensitivities to dissolved O2 (Global Biogeochemical Cycles). 26(2). doi: 10.1029/2011GB004209
Bindoff N. L., Cheung W. W., Kairo J. G., ArÃstegui J., Guinder V. A., Hallberg R. (2019). “Changing ocean, marine ecosystems, and dependent communities,” in Pörtner H.-O., Roberts D.C., Masson-Delmotte V., Zhai P., Tignor M., Poloczanska E., et al. (Eds.) IPCC special report on the ocean and cryosphere in a changing climate, Switzerland: Intergovernmental Panel on Climate Change 477–587.
Breitburg D., Levin L. A., Oschlies A., Grégoire M., Chavez F. P., Conley D. J. (2018). Declining oxygen in the global ocean and coastal waters. Science 359 (6371), eaam7240. doi: 10.1126/science.aam7240
Carton J. A., Giese B. S. (2008). A reanalysis of ocean climate using simple ocean data assimilation (SODA). Monthly weather Rev. 136 (8), 2999–3017. doi: 10.1175/2007MWR1978.1
Chai F., Dugdale R., Peng T.-H., Wilkerson F., Barber R. (2002). One-dimensional ecosystem model of the equatorial pacific upwelling system. part I: Model development and silicon and nitrogen cycle. Deep Sea Res. Part II: Topical Stud. Oceanogr. 49 (13-14), 2713–2745. doi: 10.1016/S0967-0645(02)00055-3
Chowdhury M., Biswas H., Mitra A., Silori S., Sharma D., Bandyopadhyay D. (2021). Southwest monsoon-driven changes in the phytoplankton community structure in the central Arabian Se–2018): After two decades of JGOFS. Prog. Oceanogr. 197, 102654. doi: 10.1016/j.pocean.2021.102654
Diaz R. J., Rosenberg R. (2008). Spreading dead zones and consequences for marine ecosystems. Science 321 (5891), 926–929. doi: 10.1126/science.1156401
Egbert G. D., Erofeeva S. Y. (2002). Efficient inverse modeling of barotropic ocean tides. J. Atmospheric Oceanic Technol. 19 (2), 183–204. doi: 10.1175/1520-0426(2002)019<0183:EIMOBO>2.0.CO;2
Garcia H., Weathers K., Paver C., Smolyar I., Boyer T., Locarnini M., et al. (2019). World ocean atlas 2018, volume 3: Dissolved oxygen, apparent oxygen utilization, and dissolved oxygen saturation. NOAA Atlas NESDIS 83, 38pp. Available at: https://archimer.ifremer.fr/doc/00651/76337/
Gilly W. F., Beman J. M., Litvin S. Y. (2013). Oceanographic and biological effects of shoaling of the oxygen minimum zone. Annu. Rev. Of Mar. Sci. 5 (1), 393–420. doi: 10.1146/annurev-marine-120710-100849
Honjo S., Dymond J., Prell W., Ittekkot V. (1999). Monsoon-controlled export fluxes to the interior of the Arabian Sea. Deep Sea Res. Part II: Topical Stud. Oceanography 46 (8-9), 1859–1902. doi: 10.1016/S0967-0645(99)00047-8
Hood R. R., Wiggert J. D., Naqvi S. W. A. (2009). Indian Ocean research: Opportunities and challenges. Geophysical Monograph Ser., 409–429. doi: 10.1029/2008GM000714
Ito T., Minobe S., Long M. C., Deutsch C., Shenoy D. M., Suresh I., et al. (2017). Upper ocean O2 trends: 1958-2015 variability of dissolved oxygen in the Arabian Sea oxygen minimum zone and its driving mechanisms. Geophys. Res. Lett. 44 (9), 4214–4223. doi: 10.1002/2017GL073613
Kamykowski D., Zentara S.-J. (1990). Hypoxia in the world ocean as recorded in the historical data set. Deep Sea Res. Part A. Oceanogr. Res. Pap. 37 (12), 1861–1874. doi: 10.1016/0198-0149(90)90082-7
Karstensen J., Stramma L., Visbeck M. (2008). Oxygen minimum zones in the eastern tropical Atlantic and pacific oceans. Prog. In Oceanogr. 77 (4), 331–350. doi: 10.1016/j.pocean.2007.05.009
Keeling R. F., Kortzinger A., Gruber N. (2010). Ocean deoxygenation in a warming world. Annu. Rev. Mar. Sci. 2, 199–229. doi: 10.1146/annurev.marine.010908.163855
Kim H. S., Flagg C. N., Howden S. D. (2001). Northern Arabian Sea variability from TOPEX/Poseidon altimetry data: An extension of the US JGOFS/ONR shipboard ADCP study. Deep Sea Res. Part II: Topical Stud. Oceanography 48 (6-7), 1069–1096. doi: 10.1016/S0967-0645(00)00131-4
Lachkar Z., Levy M., Smith S. (2018). Intensification and deepening of the Arabian Sea oxygen minimum zone in response to increase in Indian monsoon wind intensity. Biogeosciences 15 (1), 159–186. doi: 10.5194/bg-15-159-2018
Lachkar Z., Levy M., Smith K. S. (2019). Strong intensification of the Arabian Sea oxygen minimum zone in response to Arabian gulf warming. Geophys. Res. Lett. 46 (10), 5420–5429. doi: 10.1029/2018GL081631
Lachkar Z., Mehari M., Al Azhar M., Levy M., Smith S. (2021). Fast local warming is the main driver of recent deoxygenation in the northern Arabian Sea. Biogeosciences 18 (20), 5831–5849. doi: 10.5194/bg-18-5831-2021
Lachkar Z., Smith S., Levy M., Pauluis O. (2016). Eddies reduce denitrification and compress habitats in the Arabian Sea. Geophys. Res. Lett. 43 (17), 9148–9156. doi: 10.1002/2016GL069876
Laffoley D., Baxter J. M. (2019). Ocean deoxygenation: Everyone’s problem-causes, impacts, consequences and solutions (Switzerland: IUCN Gland).
Large W. G., McWilliams J. C., Doney S. C. (1994). Oceanic vertical mixing: A review and a model with a nonlocal boundary layer parameterization. Rev. geophys. 32 (4), 363–403. doi: 10.1029/94RG01872
Laurindo L. C., Mariano A. J., Lumpkin R. (2017). An improved near-surface velocity climatology for the global ocean from drifter observations. Deep Sea Res. Part I: Oceanogr. Res. Pap. 124, 73–92. doi: 10.1016/j.dsr.2017.04.009
Levin L. A., Breitburg D. L. (2015). Linking coasts and seas to address ocean deoxygenation. Nat. Climate Change 5 (5), 401–403. doi: 10.1038/nclimate2595
Levin L. A., Whitcraft C. R., Mendoza G. F., Gonzalez J. P., Cowie G. (2009). Oxygen and organic matter thresholds for benthic faunal activity on the Pakistan margin oxygen minimum zone (700¨C1100 m). Deep Sea Res. Part II: Topical Stud. Oceanogr. 56 (6-7), 449–471. doi: 10.1016/j.dsr2.2008.05.032
Liang L., Xue H., Shu Y. (2019). The Indonesian throughflow and the circulation in the banda Sea: A modeling study. J. Geophys. Res.: Oceans 124 (5), 3089–3106. doi: 10.1029/2018JC014926
Liu G., Chai F. (2009). Seasonal and interannual variability of primary and export production in the south China Sea: A three-dimensional physical—biogeochemical model study. ICES J. Mar. Sci. 66 (2), 420–431. doi: 10.1093/icesjms/fsn219
Lluch-Cota S. E., Aragon-Noriega E. A., Arreguin-Sanchez F., Aurioles-Gamboa D., Bautista-Romero J. J., Brusca R. C., et al. (2007). The gulf of California: review of ecosystem status and sustainability challenges. Prog. In Oceanogr. 73 (1), 1–26. doi: 10.1016/j.pocean.2007.01.013
Mathew T., Prakash S., Shenoy L., Chatterjee A., Bhaskar T. U., Wojtasiewicz B. (2021). Observed variability of monsoon blooms in the north-central Arabian Sea and its implication on oxygen concentration: A bio-argo study. Deep Sea Res. Part II: Topical Stud. Oceanogr. 184, 104935. doi: 10.1016/j.dsr2.2021.104935
Ma W., Xiu P., Chai F., Li H. (2019). Seasonal variability of the carbon export in the central south China Sea. Ocean Dynam. 69 (8), 955–966. doi: 10.1007/s10236-019-01286-y
McCreary J., Murtugudde R., Vialard J., Vinayachandran P., Wiggert J. D., Hood R. R. (2009). Biophysical processes in the Indian ocean. Indian Ocean biogeochem. proc. Ecol. variability 185, 9–32.
McCreary J. J.P., Yu Z., Hood R. R., Vinaychandran P., Furue R., Ishida A., et al. (2013). Dynamics of the Indian-ocean oxygen minimum zones. Prog. In Oceanogr. 112, 15–37. doi: 10.1016/j.pocean.2013.03.002
Moffett J. W., Landry M. R. (2020). Grazing control and iron limitation of primary production in the Arabian Sea: Implications for anticipated shifts in southwest monsoon intensity. Deep Sea Res. Part II: Topical Stud. Oceanogr. 179, 104687. doi: 10.1016/j.dsr2.2019.104687
Morrison J. M., Codispoti L., Gaurin S., Jones B., Manghnani V., Zheng Z. (1998). Seasonal variation of hydrographic and nutrient fields during the US JGOFS Arabian Sea process study. Deep Sea Res. Part II: Topical Stud. Oceanogr. 45 (10-11), 2053–2101. doi: 10.1016/S0967-0645(98)00063-0
Murphy A. H. (1988). Skill scores based on the mean square error and their relationships to the correlation coefficient. Monthly weather Rev. 116 (12), 2417–2424. doi: 10.1175/1520-0493(1988)116<2417:SSBOTM>2.0.CO;2
Naqvi S., Naik H., Pratihary A., D’souza W., Narvekar P., Jayakumar D. (2006). Coastal versus open-ocean denitrification in the Arabian Sea. Biogeosciences 3 (4), 621–633. doi: 10.5194/bg-3-621-2006
Naqvi W. A. (1991). Geographical extent of denitrification in the Arabian Sea in relation to some physical processes. Oceanologica Acta 14 (3), 281–290. Available at: https://archimer.ifremer.fr/doc/00101/21257/
Naqvi S. W. A., Moffett J. W., Gauns M. U., Narvekar P. V., Pratihary A. K., Naik H., et al. (2010). The Arabian Sea as a high-nutrient, low-chlorophyll region during the late Southwest Monsoon. Biogeosciences 7, 2091–2100. doi: 10.5194/bg-7-2091-2010
Rabalais N. N., Cai W.-J., Carstensen J., Conley D. J., Fry B., Hu X. (2014). Eutrophication-driven deoxygenation in the coastal ocean. Oceanography 27 (1), 172–183. doi: 10.5670/oceanog.2014.21
Rabalais N. N., Turner R. E., Wiseman W. J. Jr. (2002). Gulf of Mexico hypoxia, aka the dead zone. Annu. Rev. Ecol. Systematics 33 (1), 235–263. doi: 10.1146/annurev.ecolsys.33.010802.150513
Resplandy L., Levy M., Bopp L., Echevin V., Pous S., Sarma V., et al. (2012). Controlling factors of the oxygen balance in the Arabian sea’s OMZ. Biogeosciences 9 (12), 5095–5109. doi: 10.5194/bg-9-5095-2012
Reynolds R. W., Smith T. M., Liu C., Chelton D. B., Casey K. S., Schlax M. G. (2007). Daily high-resolution-blended analyses for sea surface temperature. J. Climate 20 (22), 5473–5496. doi: 10.1175/2007JCLI1824.1
Rixen T., Baum A., Gaye B., Nagel B. (2014). Seasonal and interannual variations in the nitrogen cycle in the Arabian Sea. Biogeosciences 11 (20), 5733–5747. doi: 10.5194/bg-11-5733-2014
Rixen T., Cowie G., Gaye B., Goes J., do Rosário Gomes H., Hood R. R. (2020). Reviews and syntheses: Present, past, and future of the oxygen minimum zone in the northern Indian ocean. Biogeosciences 17 (23), 6051–6080. doi: 10.5194/bg-17-6051-2020
Rixen T., Goyet C., Ittekkot V. (2006). Diatoms and their influence on the biologically mediated uptake of atmospheric CO2 in the Arabian Sea upwelling system. Biogeosciences 3 (1), 1–13. doi: 10.5194/bg-3-1-2006
Sarma V. (2002). An evaluation of physical and biogeochemical processes regulating perennial suboxic conditions in the water column of the Arabian Sea. Global Biogeochem. Cycles 16 (4), 29–21-29-11. doi: 10.1029/2001GB001461
Sarma V., Bhaskar T. U., Kumar J. P., Chakraborty K. (2020). Potential mechanisms responsible for occurrence of core oxygen minimum zone in the north-eastern Arabian Sea. Deep Sea Res. Part I: Oceanogr. Res. Pap. 165, 103393. doi: 10.1016/j.dsr.2020.103393
Schmidt H., Czeschel R., Visbeck M. (2020). Seasonal variability of the Arabian Sea intermediate circulation and its impact on seasonal changes of the upper oxygen minimum zone. Ocean Sci. 16 (6), 1459–1474. doi: 10.5194/os-16-1459-2020
Schmidtko S., Stramma L., Visbeck M. (2017). Decline in global oceanic oxygen content during the past five decades. Nature 542 (7641), 335–339. doi: 10.1038/nature21399
Schott F. A., McCreary J. J.P. (2001). The monsoon circulation of the Indian ocean. Prog. In Oceanogr. 51 (1), 1–123. doi: 10.1016/S0079-6611(01)00083-0
Schott F., Swallow J. C., Fieux M. (1990). The Somali Current at the equator: Annual cycle of currents and transports in the upper 1000 m and connection to neighbouring latitudes. Deep Sea Res. Part A. Oceanographic Res. Papers 37 (12), 1825–1848. doi: 10.1016/0198-0149(90)90080-F
Shenoy D. M., Suresh I., Uskaikar H., Kurian S., Vidya P. J., Shirodkar G., et al. (2020). Variability of dissolved oxygen in the Arabian Sea Oxygen Minimum Zone and its driving mechanisms. J. Marine Syst. 204, 103310. doi: 10.1016/j.jmarsys.2020.103310
Shchepetkin A. F., McWilliams J. C. (2003). A method for computing horizontal pressure gradient force in an oceanic model with a nonaligned vertical coordinate. J. Geophys. Res.: Oceans 108 (C3), 3090. doi: 10.1029/2001JC001047
Shchepetkin A. F., McWilliams J. C. (2005). The regional oceanic modeling system (ROMS): A split-explicit, free-surface, topography-following-coordinate oceanic model. Ocean Model. 9 (4), 347–404. doi: 10.1016/j.ocemod.2004.08.002
Smagorinsky J. (1963). General circulation experiments with the primitive equations: I. basic experiment Monthly weather Rev. 91 (3), 99–164. doi: 10.1175/1520-0493(1963)091<0099:GCEWTP>2.3.CO;2
Stramma L., Johnson G. C., Sprintall J., Mohrholz V. (2008). Expanding oxygen-minimum zones in the tropical oceans. Science 320 (5876), 655–658. doi: 10.1126/science.1153847
Sudheesh V., Gupta G. V. M., Reddy Y., Bepari K. F., Chari N. V. H. K., Sherin C. K. (2022). Oxygen minimum zone along the eastern Arabian Sea: Intra-annual variation and dynamics based on ship-borne studies. Prog. Oceanogr. 201, 102742. doi: 10.1016/j.pocean.2022.102742
Taylor K. E. (2001). Summarizing multiple aspects of model performance in a single diagram. J. Geophysical Research: Atmospheres 106 (D7), 7183–7192. doi: 10.1029/2000JD900719
Tiano L., Garcia-Robledo E., Dalsgaard T., Devol A. H., Ward B. B., Ulloa O. (2014). Oxygen distribution and aerobic respiration in the north and south eastern tropical pacific oxygen minimum zones. Deep Sea Res. Part I: Oceanogr. Res. Pap. 94, 173–183. doi: 10.1016/j.dsr.2014.10.001
Ulloa O., Canfield D. E., DeLong E. F., Letelier R. M., Stewart F. J. (2012). Microbial oceanography of anoxic oxygen minimum zones. Proc. Natl. Acad. Sci. 109 (40), 15996–16003. doi: 10.1073/pnas.1205009109
Vaquer-Sunyer R., Duarte C. M. (2008). Thresholds of hypoxia for marine biodiversity. Proc. Natl. Acad. Sci. 105 (40), 15452–15457. doi: 10.1073/pnas.0803833105
Wiggert J. D., Murtugudde R. G. (2007). The sensitivity of the southwest monsoon phytoplankton bloom to variations in aeolian iron deposition over the Arabian Sea. J. Geophysical Research: Oceans 112 (C5). doi: 10.1029/2006JC003514
Xiu P., Chai F. (2011). Modeled biogeochemical responses to mesoscale eddies in the south China Sea. J. Geophys. Res.: Oceans 116 (C10), C10006. doi: 10.1029/2010jc006800
Xiu P., Chai F. (2014). Connections between physical, optical and biogeochemical processes in the pacific ocean. Prog. In Oceanogr. 122, 30–53. doi: 10.1016/j.pocean.2013.11.008
You Y. (1997). Seasonal variations of thermocline circulation and ventilation in the Indian ocean. J. Geophys. Res.: Oceans 102 (C5), 10391–10422. doi: 10.1029/96JC03600
Zhang J., Gilbert D., Gooday A., Levin L., Naqvi S., Middelburg J. (2010). Natural and human-induced hypoxia and consequences for coastal areas: synthesis and future development. Biogeosciences 7 (5), 1443–1467. doi: 10.5194/bg-7-1443-2010
Zhang H.-R., Wang Y., Xiu P., Qi Y., Chai F. (2021). The roles of iron limitation in phytoplankton dynamics in the western and eastern subarctic pacific. Front. Mar. Sci., 8, 735826. doi: 10.3389/fmars.2021.735826
Zhang W., Wu H., Zhu Z. (2018). Transient hypoxia extent off changjiang river estuary due to mobile changjiang river plume. J. Geophys. Res.: Oceans 123 (12), 9196–9211. doi: 10.1029/2018JC014596
Keywords: Arabian Sea oxygen minimum zone, dissolved oxygen (DO), oxygen-rich intermediate water, sinking velocity, source regions of POM, decoupling
Citation: Zhang Z, Ma W and Chai F (2022) Role of ocean circulation and settling of particulate organic matter in the decoupling between the oxygen minimum zone and the phytoplankton productive zone in the Arabian Sea: A modeling study. Front. Mar. Sci. 9:927921. doi: 10.3389/fmars.2022.927921
Received: 25 April 2022; Accepted: 14 September 2022;
Published: 06 October 2022.
Edited by:
Sudheesh Valliyodan, Central University of Kerala, IndiaReviewed by:
Shiba Shankar Acharya, Presidency University, IndiaAnju Mallissery, University of Haifa, Israel
Copyright © 2022 Zhang, Ma and Chai. This is an open-access article distributed under the terms of the Creative Commons Attribution License (CC BY). The use, distribution or reproduction in other forums is permitted, provided the original author(s) and the copyright owner(s) are credited and that the original publication in this journal is cited, in accordance with accepted academic practice. No use, distribution or reproduction is permitted which does not comply with these terms.
*Correspondence: Fei Chai, ZmNoYWlAc2lvLm9yZy5jbg==; Wentao Ma, d3RtYUBzaW8ub3JnLmNu
 Zhiwei Zhang
 Wentao Ma
 Fei Chai1,2*