
94% of researchers rate our articles as excellent or good
Learn more about the work of our research integrity team to safeguard the quality of each article we publish.
Find out more
ORIGINAL RESEARCH article
Front. Mar. Sci., 21 September 2022
Sec. Coastal Ocean Processes
Volume 9 - 2022 | https://doi.org/10.3389/fmars.2022.925123
This article is part of the Research TopicOceanographic Processes Linking Nearshore, Continental Shelf, and Shelf BreakView all 34 articles
 Lachlan R. Phillips1*
 Neil Malan2
 Moninya Roughan2†
 Robert Harcourt1*
 Ian Jonsen1
 Martin Cox3
 Andrew S. Brierley4
 David Slip1,5
 Adam Wilkins6
 Gemma Carroll7
Coastal pelagic ecosystems are highly variable in space and time, with environmental conditions and the distribution of biomass being driven by complex processes operating at multiple scales. The emergent properties of these processes and their interactive effects result in complex and dynamic environmental mosaics referred to as “seascapes”. Mechanisms that link large-scale oceanographic processes and ecological variability in coastal environments remain poorly understood, despite their importance for predicting how ecosystems will respond to climate change. Here we assessed seascape variability along the path of the rapidly intensifying East Australian Current (EAC) Southern Extension in southeast Australia, a hotspot of ocean warming and ecosystem tropicalisation. Using satellite and in situ measures of temperature, salinity and current velocity coupled with contemporaneous measurements of pelagic biomass distribution from nine boat-based active acoustic surveys in five consecutive years, we investigated relationships between the physical environment and the distribution of pelagic biomass (zooplankton and fish) at multiple timescales. Survey periods were characterised by high variability in oceanographic conditions, with variation in coastal conditions influenced by meso-to-large scale processes occurring offshore, including the position and strength of eddies. Intra-annual variability was often of a similar or greater magnitude to inter-annual variability, suggesting highly dynamic conditions with important variation occurring at scales of days to weeks. Two seascape categories were identified being characterised by (A) warmer, less saline water and (B) cooler, more saline water, with the former indicating greater influence of the EAC on coastal processes. Warmer waters were also associated with fewer, deeper and less dense biological aggregations. As the EAC continues to warm and penetrate further south, it is likely that this will have substantial effects on biological activity in coastal pelagic ecosystems, including a potential reduction in the accessibility of prey aggregations to surface-feeding predators and to fisheries. These results highlight the import role of offshore oceanographic processes in driving coastal seascape variability and biological activity in a region undergoing rapid oceanic warming and ecological change.
Marine environments are characterised by their ephemeral and heterogeneous nature driven by a combination of physical, chemical and biological processes at multiple spatial and temporal scales (Kavanaugh et al., 2014; Pittman, 2017). The emergent properties of these processes and their interactive effects result in complex and dynamic environmental mosaics referred to as “seascapes” (Kavanaugh et al., 2016). Seascape ecology provides a useful conceptual framework to understand variability in biological and physical processes in a dynamic and advective ocean (Kavanaugh et al., 2016), and to identify the interactions and correlations between these processes at different spatial and temporal scales (Marquet et al., 1993; Dickey, 2003). Quantifying the relationships between these processes and their scale-dependent variability is key to understanding how seascapes may respond to the numerous stressors associated with global change (Pittman, 2017).
Variability in biophysical factors and their relationships are structured hierarchically. Physical ocean structures follow a power-law cascade as energy is dissipated from gyre circulation to fine-scale turbulence (Stommel, 1963). These ocean structures can be classed as geostrophically dynamic, operating at large scales and being driven by the earth’s rotational energy (e.g. gyres, western boundary currents and mesoscale eddies), or ageostrophic, operating at finer scales and reflecting all other forms of motion and instabilities (e.g. turbulent motion and submesoscale frontal dynamics) (Lévy et al., 2012). The environmental and biological composition of seascapes at a given point in time is therefore the product of variability in both geostrophic and ageostrophic factors over multiple spatiotemporal scales. For example, planktic species and their forage fish predators tend to be hierarchically distributed in space and time with dense aggregations of individuals clustered and nested within patches of lower density (Fauchald, 1999; Carroll et al., 2017). These ecological patterns can be influenced over long time periods by basin level/decadal scale systems that influence ecosystem productivity such as the El Niño - Southern Oscillation (ENSO) (Hallegraeff, 2010), but also over short time periods and fine spatial scales through cross-shelf processes (Baird et al., 2011).
Consideration of both geostrophic and ageostrophic dynamics is important when studying highly variable seascapes such as western boundary current systems. Western boundary currents are strong, dynamic currents that form along the western margins of the world’s major ocean basins (Hogg and Johns, 1995; Imawaki et al., 2013). Primarily generated by wind-driven anticyclonic subtropical gyres, these geostrophic currents are a major driver of poleward heat and climate regulation through the transport of warm subtropical waters from low to high latitudes (Yu and Weller, 2007). Over the last several decades, western boundary currents have extended further poleward (Yang et al., 2020; Zhang et al., 2020; Li et al., 2021; Li et al., 2022a; Li et al., 2022b) or broadened (Beal and Elipot, 2016) due to an increase in global oceanic kinetic energy (Hu et al., 2020). These changes are driving major environmental and ecological shifts in coastal ecosystems (Suthers et al., 2011; Phillips et al., 2020). These shifts can occur over the short term (days to weeks) through eddy dynamics (Roughan et al., 2017), hydrographic fronts (Schaeffer et al., 2017), interactions with local factors such as bathymetry (Oke and Middleton, 2000; Schaeffer et al., 2014) and coastal processes (Roughan et al., 2022), as well as at seasonal (Archer et al., 2017), interannual and multi-decadal time scales (Ridgway, 2007; Phillips et al., 2020). As a consequence, shifts in environmental variability are non-uniform by latitude (Malan et al., 2021) with differences in local ageostrophic factors making it difficult to predict the ecological impacts for individual coastal systems.
The East Australian Current (EAC) is a poleward-flowing western boundary current that transports subtropical water from the Coral Sea along Australia’s east coast (Boland and Church, 1981; Godfrey and Golding, 1981; Hamon, 1965; Ridgway and Godfrey, 1994). The current separates from the coast between 31 and 33°S to form the eastward-flowing EAC eastern extension and a poleward propagating eddy field called the EAC southern extension (Cetina-Heredia et al., 2014; Oke et al., 2019). The southern extension has intensified and shifted southward over the last eight decades with strong lines of evidence demonstrating the current is penetrating further poleward (Ridgway, 2007; Johnson et al., 2011; Li et al., 2021; Li et al., 2022a; Li et al., 2022b). Temperature increases are non-uniform along the latitudinal extent of the EAC with regions poleward of 32°S warming more than twice as fast as those equatorial of 32°S (Malan et al., 2021) as the southern outflow of the EAC southern extension becomes more turbulent and eddying (Li et al., 2021; Malan et al., 2021). This intensification has resulted in the EAC extension producing rates of ocean warming that are 3–4 times the global average, making southeast Australia one of the fastest-warming regions in the southern hemisphere (Wu et al., 2012; Li et al., 2022b).
The impacts of the intensification of the EAC southern extension on coastal systems are already evident and include prolonged marine heatwaves (Oliver et al., 2017; Schaeffer et al., 2017; Huang et al., 2021), modification of nutrient loading regimes (Harris et al., 1987; Harris et al., 1991) migration of typically subtropical species poleward (Edyvane, 2003; Pittock, 2003; Thresher et al., 2003; Vergés et al., 2014; Niella et al., 2021) and shifts in species assemblages, the distributions of pelagic fish and planktic species, and trophic interactions (Carroll et al., 2016; Carroll et al., 2017; Hobday et al., 2011; Johnson et al., 2011; Kelly et al., 2016; Larsson et al., 2018; Thompson et al., 2009) that are projected to continue in coming decades (Cetina-Heredia et al., 2015). While many ecological patterns have been investigated in the context of EAC variability via correlations with temperature and current velocity, there has been little work investigating how EAC variability (or western boundary current variability more broadly) influences seascape characteristics over multiple spatiotemporal scales simultaneously, including how relationships between geostrophic and ageostrophic processes link offshore and coastal dynamics, and impact biological activity.
Studies linking coastal biological activity to offshore processes often use indirect proxies of biological activity such as chlorophyll a concentration or sea-surface temperature (Gremillet et al., 2008; Block et al., 2011), however, inferring spatial and temporal variability in upper trophic-level biology from such data can produce variable results (Suryan et al., 2012). Boat-based acoustic surveys enable direct sampling of the distribution of schooling species (e.g. pelagic fishes and krill) at spatiotemporal resolutions relevant to coastal ecosystems (Bertrand, 2003; Koslow, 2009). Acoustic sampling has advantages over other sampling methods such as trawl surveys, as it provides information on the vertical distribution of prey (Cox et al., 2013; Receveur et al., 2020) and provides simultaneous qualitative and quantitative data on multiple components of an ecosystem (Bertrand, 2003).
Using ocean temperature and current velocity time-series data from Australia’s Integrated Marine Observing System (IMOS) moorings, CTD profiles and measurements of acoustic density distribution (using active acoustics) from nine boat-based surveys conducted in five consecutive years (2015 to 2019), we investigate here the relationship between physical oceanography, the distribution of pelagic species and their inter-survey variability in one of the fastest-warming coastal regions in the southern hemisphere (Malan et al., 2021). Our aim is to better resolve interactions between the EAC, coastal shelf waters, and biological activity, a crucial step toward making robust predictions of climate change impacts on coastal ecosystems.
Our study was conducted in Batemans Marine Park in Southeastern New South Wales Australia (36.3°S 150.2°E) which supports a highly variable coastal shelf ecosystem directly in the path of the East Australian Current (EAC) southern extension (Figure 1). The study area was approximately 16 km (onshore-offshore) x 27 km (along the coast) in size (approximately 430 km2). To explore effects of EAC variability on coastal processes, we coupled oceanographic observations from satellites and fixed moorings with finer-scale observations made from boat-based surveys during the austral spring over five consecutive years (2015 - 2019). This is the time period that coincides with an increase in southward EAC flow in this region, and phenological changes in biological productivity from phytoplankton blooms (Everett et al., 2014) and triggers the breeding season for seabirds and marine mammals (Quiring et al., 2021)
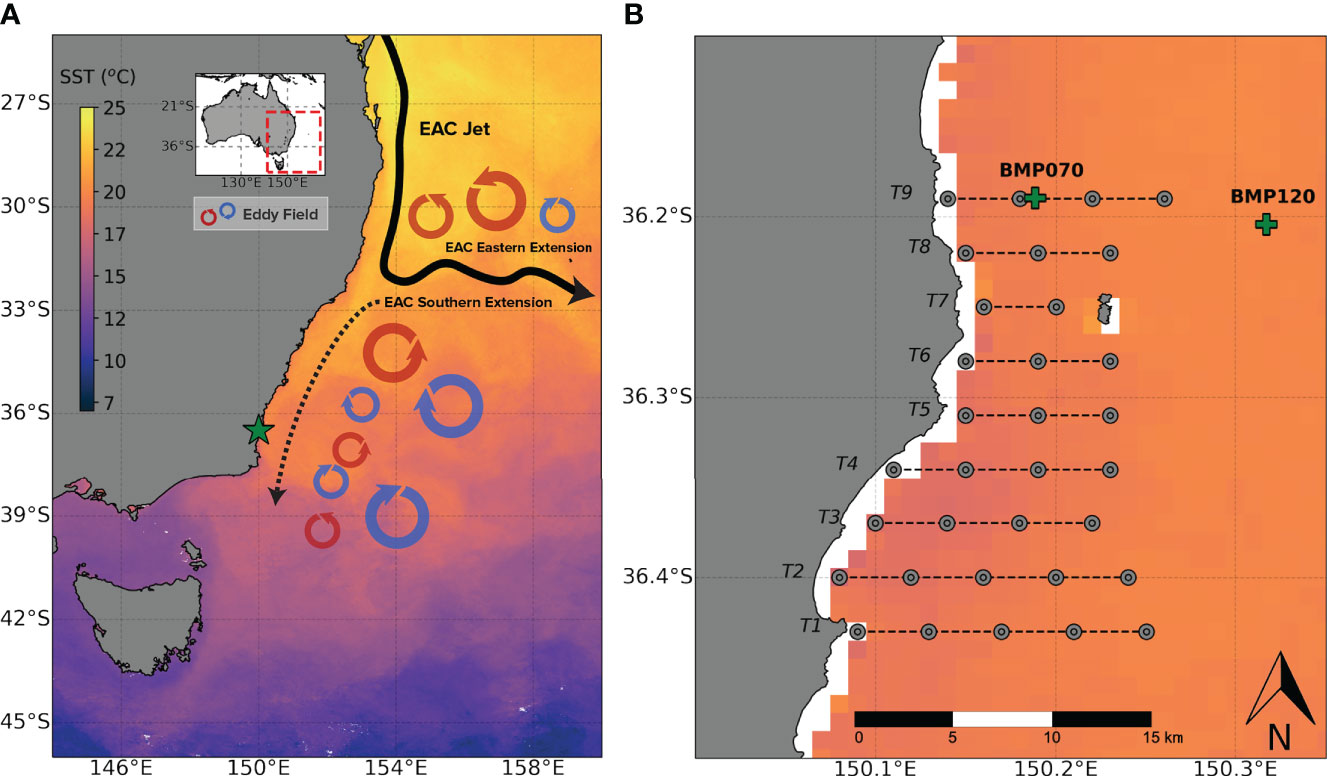
Figure 1 (A) A simplified schematic adapted from Phillips et al. (2020) of the East Australian Current (EAC) showing the primary mesoscale features (main flow and eddy fields) and the study location (green star) and; (B) A map of the study location in the Batemans Marine Park showing the positions of the acoustic transects (black dotted lines), the CTD profiling stations (grey points) and the position of the two moorings (BMP070 and BMP120) (green crosses). Both panels are overlaid over a 10 day composite of sea surface temperature (IMOS MODIS SST) beginning October 10th, 2015.
To assess oceanographic processes such as the location of eddies that might influence coastal processes during each survey period, gridded (0.02° x 0.02°) products of satellite-derived sea surface temperature (AVHRR L3S SST - daily resolution – product identifier: 8bd3fe33-fd98-4307-ad23-424ad9a2907b) and gridded sea level anomaly (GSLA – product identifier: 3162c844-d45c-491c-b326-6ae37e4079f9) data were used to produce maps of the meso scale oceanographic context during survey periods. Sea surface temperature (SST) anomaly was calculated by subtracting the SST Atlas of Australian Regional Sea Daily climatology fit from the gridded sea-surface temperature data (product identifier: 79c8eea2-4e86-4553-8237-4728e27abe10). Satellite data and the daily climatology fits were obtained through the IMOS Australia Ocean Data Network (AODN) portal (https://portal.aodn.org.au).
Meridional (north/south)2010. 00815.xocity time series at a 5-minute temporal resolution was obtained from two IMOS moorings located immediately north of Batemans Marine Park in 70 and 120 m of water, named BMP070 and BMP120 respectively (Figure 1B). doi: 10.1016/j.dsr2re temperature and velocity at 5 minute intervals every 8m through the water column since 2015 and 2011 respectively. For more information see Roughan et al. (2015). Daily velocity means were extracted at each mooring over 10 days to coincide with the timing of each boat-based survey (see below). Mooring data was obtained through the AODN portal (https://portal.aodn.org.au)
Boat-based surveys were undertaken during daylight hours from a 6 m rigid-hulled inflatable vessel, R/V Pelagica, travelling at 4-6 knots along 7-9 cross-shelf transects spaced 3.5 km apart and ranging in length from 7 to 14 km (Figure 1). Along each transect, sampling stations were positioned 2.75 km apart (33 stations in total) at which a depth profile of temperature and salinity was collected using a calibrated CastAway Conductivity Temperature Depth (CTD) logger (SonTek, San Diego, USA). In 2015, seven transects were sampled (T1-T7) and an additional two transects were added to the northern survey area (T8, T9) in 2016 - 2019, making a total survey extent of 31.5 km north to south along the continental shelf (Table 1). Transect T9 was not sampled during survey 2018 S2 due to adverse weather conditions. The relationships between CTD temperature and salinity were assessed using generalised linear models.
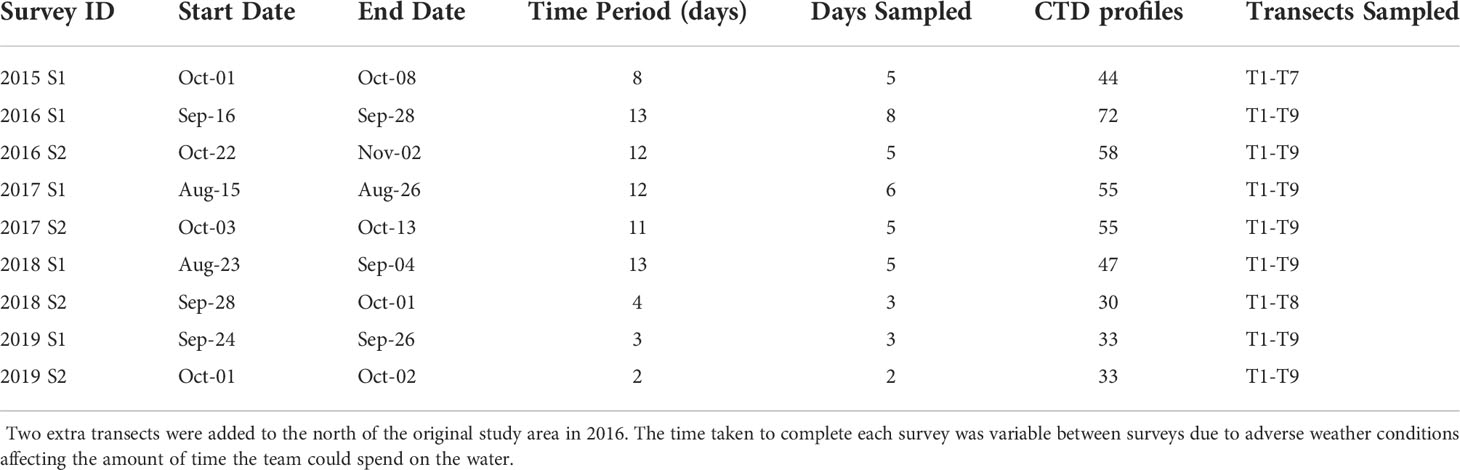
Table 1 Metadata and timing for each of the boat-based surveys.
An EK80 (Simrad, Horten, Norway) scientific echosounder operating a 70 kHz transducer in continuous wave mode (3-dB beamwidth 18°, transmit power 280 W, pulse duration 1.024 ms, 2 Hz pulse repetition rate) was used to measure water column acoustic backscattering intensity, which is approximately proportional to biomass density and can be used to map distribution of zooplankton and fish (Maclennan, 2002). The transducer was mounted on a pole connected to the vessel via a retractable arm (transducer depth = 0.75 m). Echosounder calibrations were performed each survey year according to the procedure of Demer et al. (2015).
Acoustic data were processed using Echoview v11 (Echoview, Hobart, Australia) to extract acoustic density information. Seabed returns and surface noise were removed from the acoustic data prior to aggregation detection. Aggregations were isolated from the acoustic record by applying the SHAPES edge detection algorithm (Barange, 1994; Coetzee, 2000) implemented in the ‘Schools Detection’ module of Echoview (Echoview Software Pty Ltd, Hobart, Australia) to a 3 x 3 identity matrix convolution of the acoustic data. The minimum detection threshold was -65 dB re 1 m-1, and school detection algorithm parameters were as given in Carroll et al. (2017) (Table S2). Mean volume backscattering strength, (Sv; see Maclennan (2002) for definition) was calculated using a -80 dB re 1 m-1 minimum data threshold.
Although comprehensive trawl surveys were not conducted in association with acoustic measurements to obtain estimates of species composition, aggregations were presumed to be primarily a mix of krill (euphausiids) and forage fish based on direct observations and hook-and-line fishing samples (L. Phillips unpubl. data.). Assessing broad patterns of biological activity associated with seascape dynamics was the primary goal of this study, however future detailed studies might assess variation in biological responses at the taxonomic level.
To assess differences in biological and environmental interactions between surveys, three summary metrics were calculated from the acoustic aggregation data (Table 2) along transects for the area 1.875 km (half the distance between stations) west and east of each CTD station. Metrics included mean aggregation depth (mean depth of aggregation centre), aggregation coverage (% of sampled area occupied by acoustic aggregations) and aggregation internal density (mean Sv within aggregation boundaries). Functional relationships between temperature and the aggregation were assessed using generalised linear models.
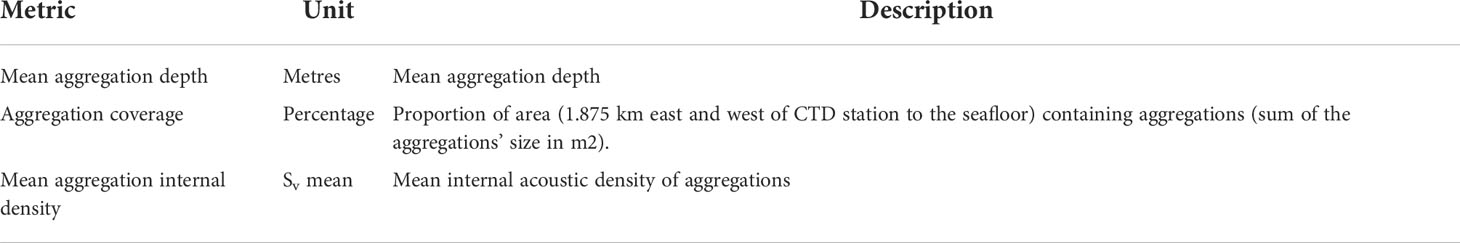
Table 2 Summary of metrics calculated from the acoustic aggregation data measured along transects.
CTD and acoustic aggregation data were separated into different seascape classifications by applying K-means clustering (Hartigan and Wong, 1979) following dimensionality reduction using a principal component analysis (Mardia et al., 1979). The principal component analysis was applied to the variables CTD mean temperature, CTD mean salinity, mean aggregation depth, aggregation coverage and mean aggregation internal density. Data was zeroed, centred and scaled to have unit variance. K-means clustering was then applied to the rotated principal components with the optimal number of clusters estimated using average silhouette width. The suitability of the principal component analysis for determining seascape classifications was then validated by performing a principal component analysis on a training set consisting 80% of the dataset (304 casts) and predicting the principle components on a testing set of the remaining 20% of the dataset (82 casts). Multinomial logistic regression models (Wood et al., 2016) were then constructed from the training set principle components to classify the seascape clusters and the individual surveys. The multinomial logistic regression models were then assessed on the testing set to determine the classification success. The functional relationships between temperature and the aggregation characteristics for each of the seascape cluster categories were assessed using generalised linear models.
During each of the nine boat-based surveys over five Austral springs, the regional circulation was dominated by the presence of a mesoscale, anticyclonic (warm-core) eddy (Figure 2). However, the latitude and distance from the coast of these eddies differed between surveys resulting in different oceanographic characteristics within the study area during each survey period. During 2015 survey 1 (S1) a large anticyclonic eddy was present closer to the coast and approximately 1° further south than during all other surveys (eddy centred at 36.75° S in 2015 S1 vs approximately 35-36° S during other surveys). This eddy placement allowed for a continuous southward flow of warm water along the coast that caused the East Australian Current (EAC) southern extension to remain over the shelf prohibiting north-flowing incursions of cool, upwelled water that occurred in other periods resulting in anomalously warm water along the coast (Figure 2A).
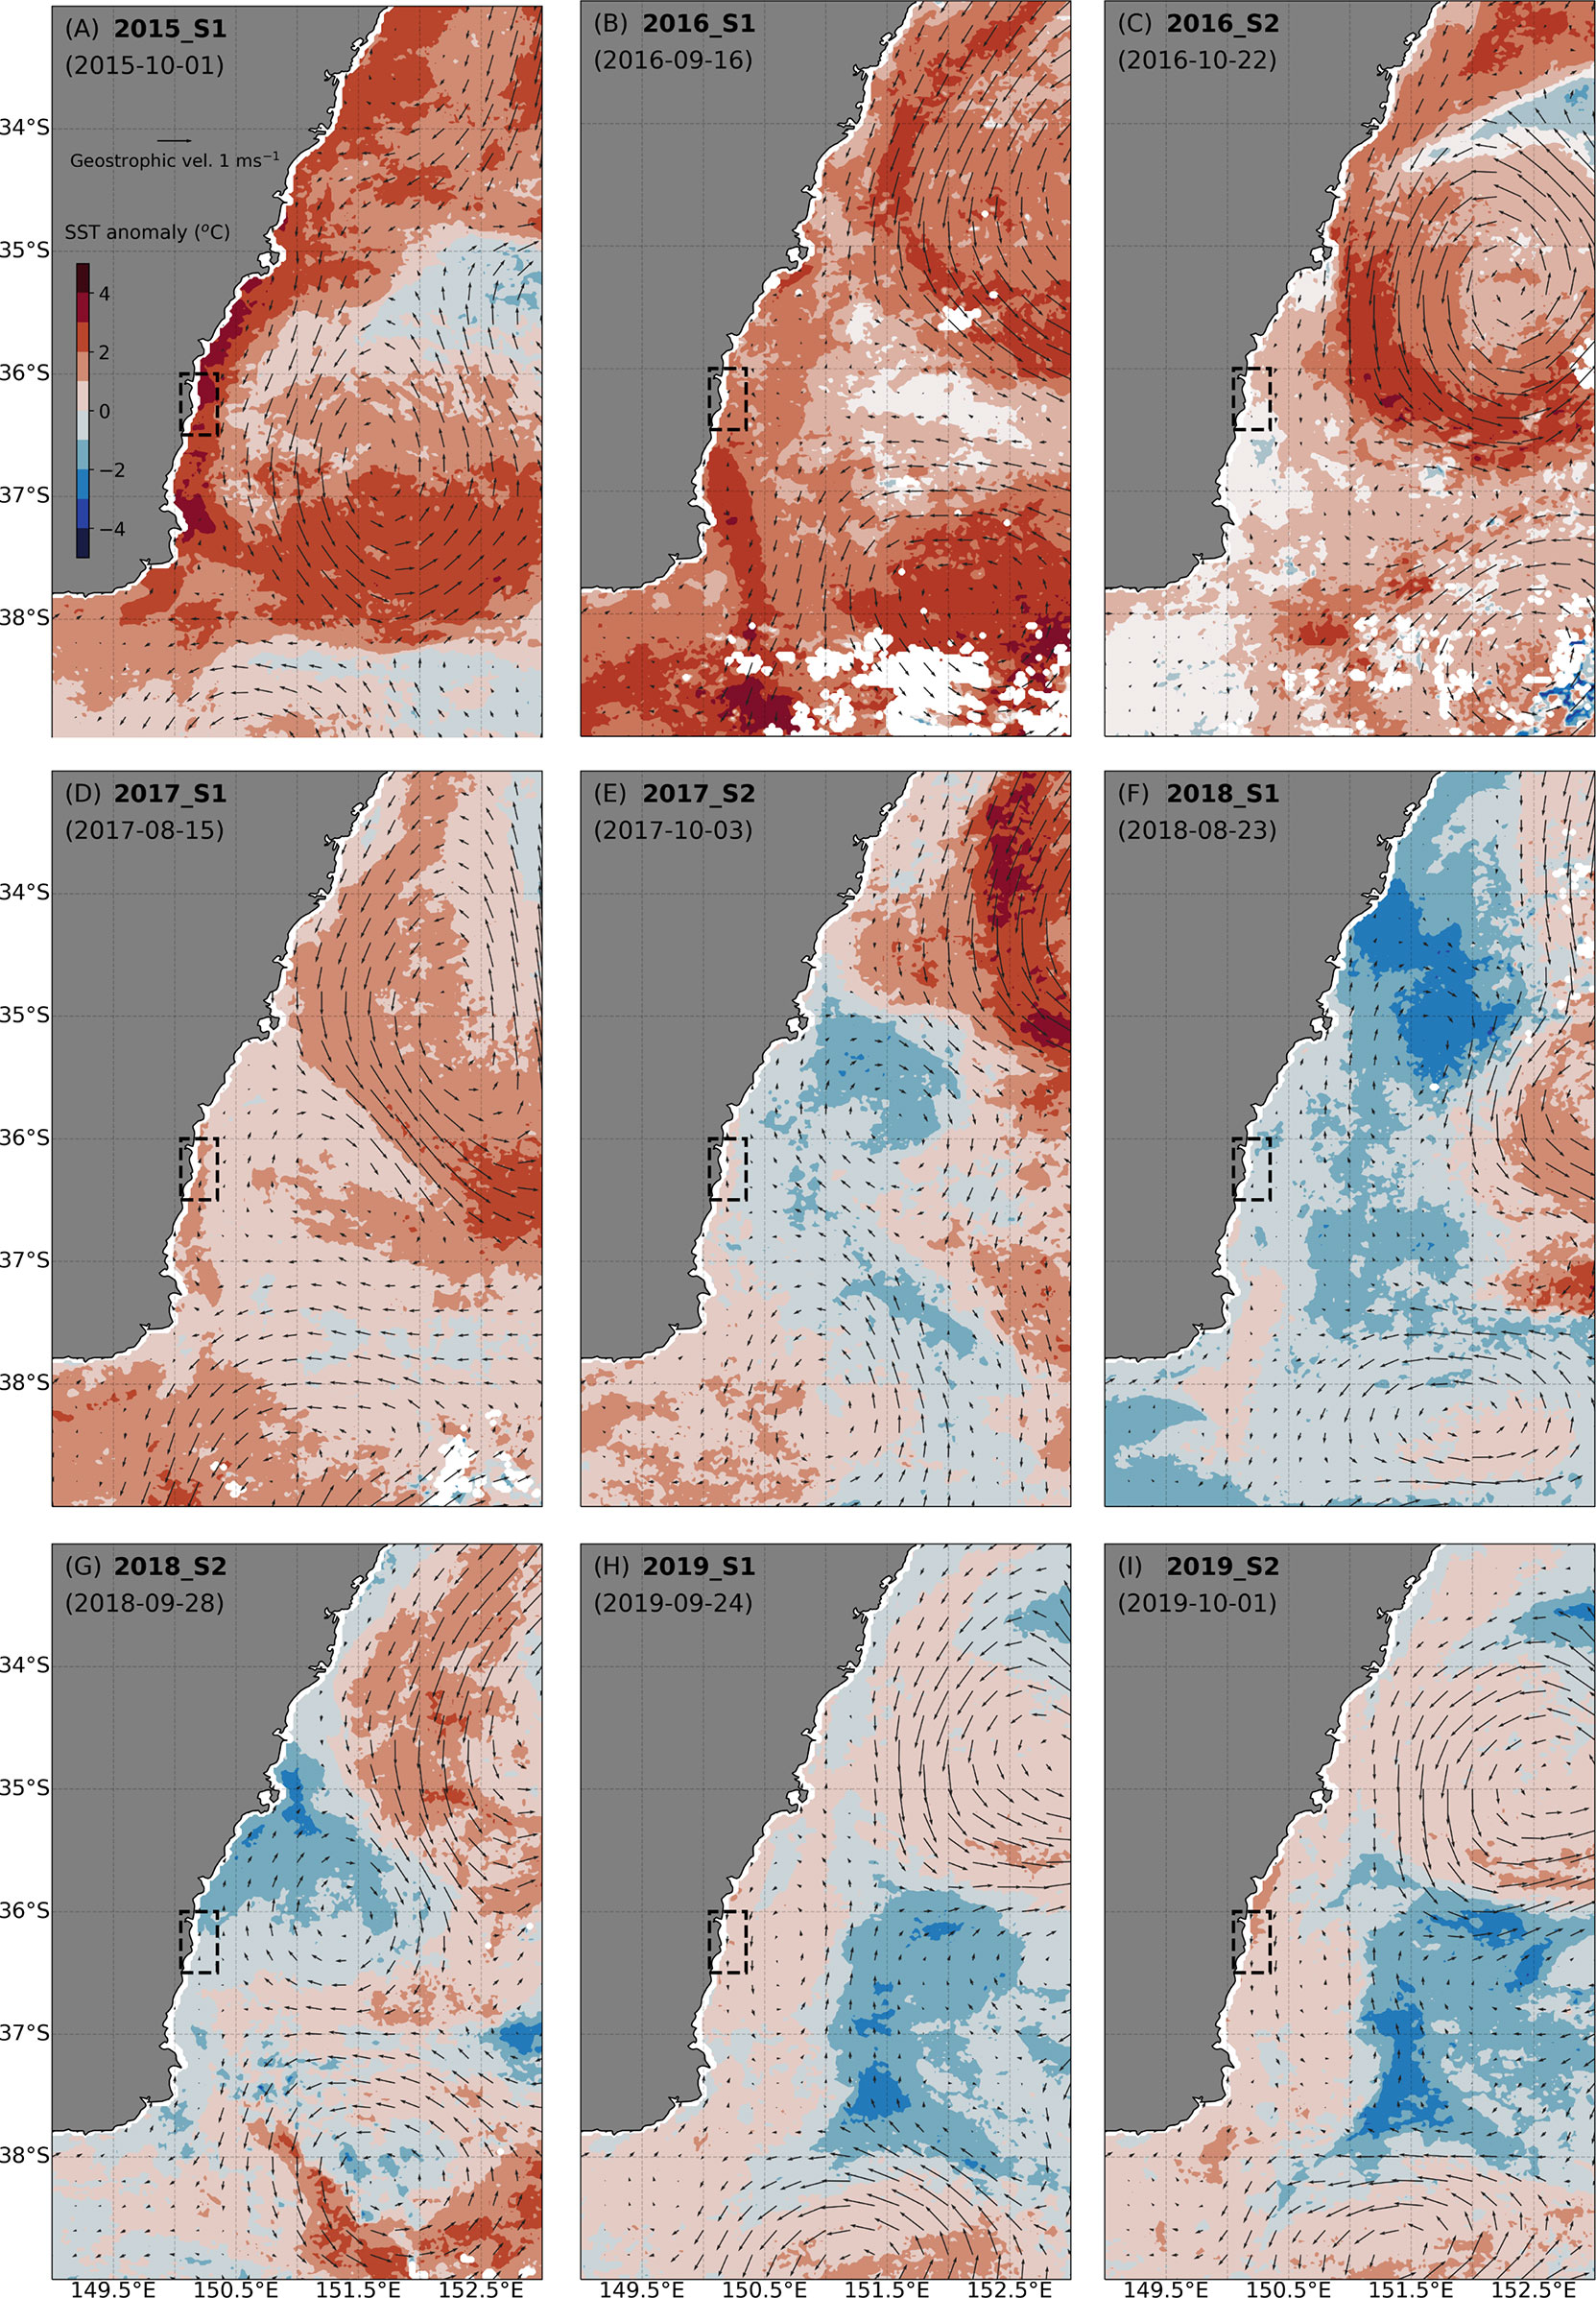
Figure 2 10-day composite of daily sea-surface temperature anomaly (colour) and altimetry-derived surface geostrophic velocities (vectors) for each of the survey periods (A–I). The survey area is shown as a black rectangle. The displayed date is the first day of the 10-day composite.
In 2016 S1 and 2016 S2 large anticyclonic eddies were also present but centred at more northern latitudes northward of 36° S resulting in a reduced flow of the EAC southern extension into the coastal study area (Figures 2B, C). The large anticyclonic eddies in 2017 S1 and 2017 S2 were similar in size and latitude to 2016 but had less influence on the study area due to the presence of smaller, more southerly cyclonic cold-core eddies blocking the mesoscale flow along the coast. The main EAC flow was therefore pushed offshore and the study area experienced northward flow of cooler waters along the coast. This also occurred in 2018 S1 with the anticyclonic eddy and therefore the flow of the EAC southern extension being further offshore (Figure 2F). However, during survey 2018 S2 approximately one month later (Figure 2G), the eddy configuration changed and a cyclonic eddy formed at latitudes sufficiently southward to create a mesoscale flow that advected some EAC water northwestward onto the shelf interacting with the cooler shelf waters that were observed in the previous survey period.
Surveys 2019 S1 and 2019 S2 were conducted only one week apart so exhibited similar regional circulation. For both surveys in 2019, the primary mesoscale flow in the study area was southward (Figures 2H, I). Unlike other years with a strong southward current, the anticyclonic eddy causing this flow in the study area did not form a clear continuous current with the larger anticyclonic eddy in the northeast resulting in the main EAC flow being further offshore.
Measurements of meridional (north/south) current velocity obtained from the moorings were relatively consistent at the 70 m isobath (BMP070) but varied considerably both within and between surveys at the 120 m isobath (BMP120) (Figure 3). For surveys 2015 S1 and 2019 S2, southward velocity was anomalously strong at 120 m with mean velocities of -0.37 ± 0.13 and -0.32 ± 0.21 ms-1 respectively (negative values indicate southward flow). Meridional velocity at 120 m was highly variable for 2019 S1 with a mean of -0.18 ± 0.33 ms-1. There was no strong directional current flow at 120 m during surveys 2017 S1 (0.00 ± 0.24 ms-1) or 2017 S2 (0.02 ± 0.16 ms-1). A reduction in strength of southward velocity was observed in 2018 at 120 m with current speeds reduced by approximately half between surveys 2018 S1 (-0.19 ± 0.25 ms-1) and 2018 S2 (-0.10 ± 0.12 ms-1). No velocity was recorded for surveys in 2016 due to instrument failure.
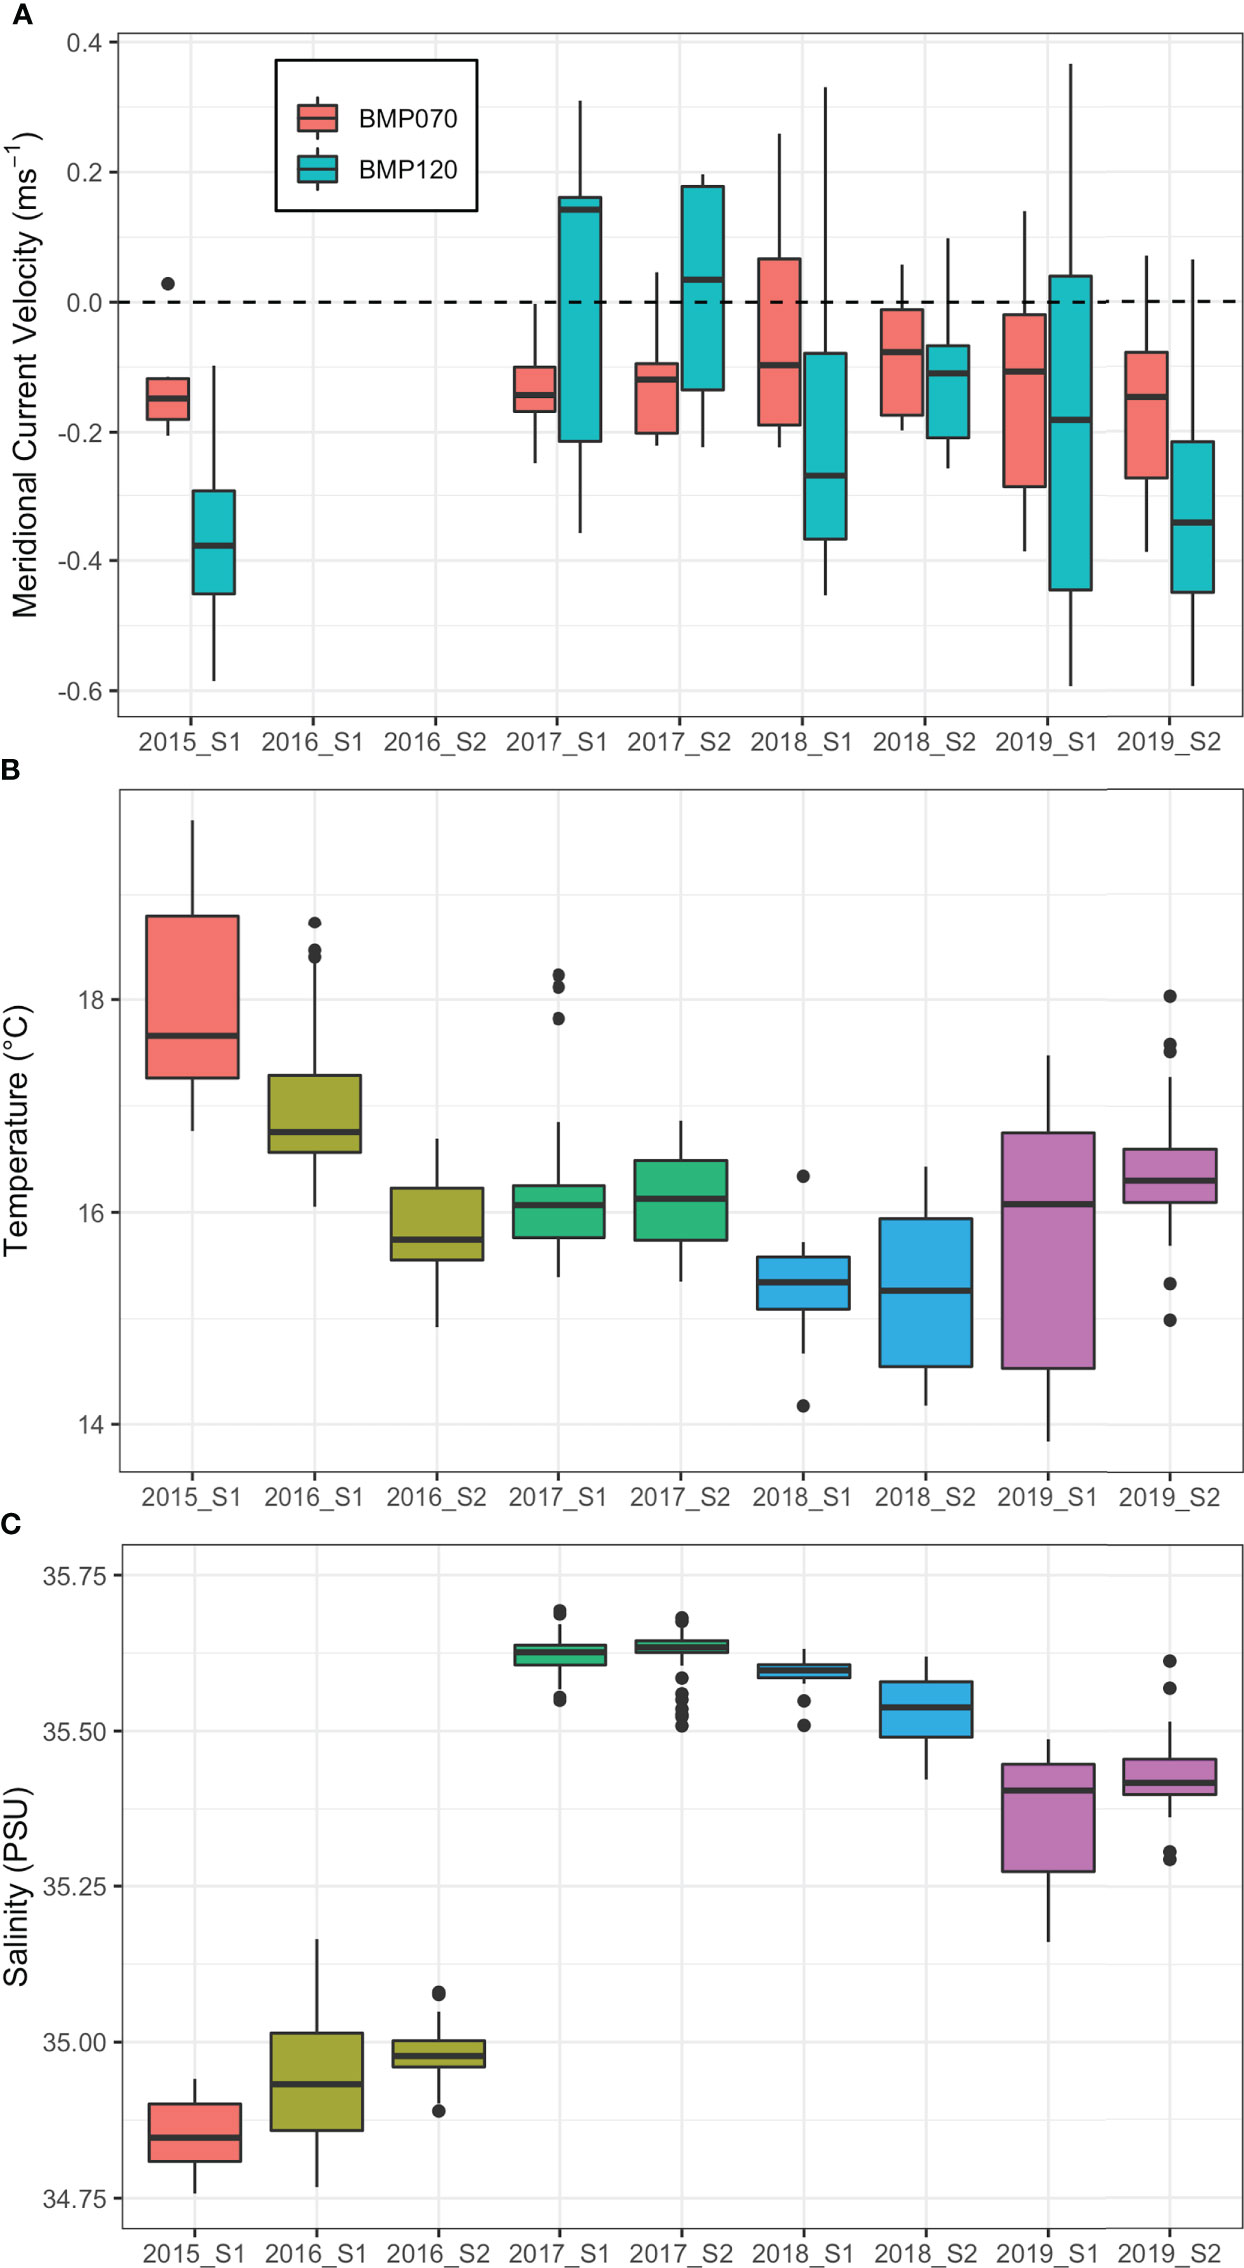
Figure 3 (A) Box plots of the daily mean meridional (north/south) current velocity measured over each of the survey periods from the moorings BMP070 (70 m isobath) and BMP120 (120 m isobath). Due to an equipment failure, no data was recorded for surveys 2016 S1 and 2016 S2. (B) Boxplots of mean temperature and (C) salinity for each of the CTD casts during each survey. As multiple surveys were conducted in a given calendar year, surveys have been coloured by year to highlight interannual patterns.
There were notable differences in temperature and salinity as measured by boat-based CTD profiles between surveys. Water temperature in 2015 S1 was warmer than all other surveys with a mean temperature of 17.96 ± 0.92°C which was 1.8°C higher than the mean across all surveys (Figure 3). The coolest surveys were 2018 S1 and 2018 S2 with temperatures of 15.32 ± 0.40°C and 15.29 ± 0.72°C respectively, approximately 0.86°C cooler than average. 2019 S1 was also cool but also highly variable with water temperatures of 15.77 ± 1.19°C. Salinity during survey 2015 S1 was the lowest recorded with a mean of 34.84 ± 0.06 PSU. 2016 S1 and 2016 S2 also had low salinity relative to other surveys with means of 34.94 ± 0.10 and 34.98 ± 0.04 PSU respectively. All other surveys exhibited higher saline concentrations ranging from 35.36 ± 0.10 PSU (2019 S1) to 35.63 ± 0.04 PSU (2017 S2). Surveys with higher saline concentrations were typically cooler (2017 S1 to 2019 S2) but the inverse was not always true (2016 S2) (Figure 3).
In most surveys there was an inshore-offshore temperature gradient within the study area (Figure 4) which was also observed in the CTD data when temperature was compared with distance from the coast (GLMs: p < 0.05), with the exception of 2016 S2, and 2018 S1 and S2 (GLMs: p > 0.05). Between surveys, there was a negative relationship between temperature and salinity (slope = -1.14, sd = 0.15, p < 0.001). However, on intra-survey time scales (days to weeks), there was a positive correlation between temperature and salinity for all surveys (Figure 5).
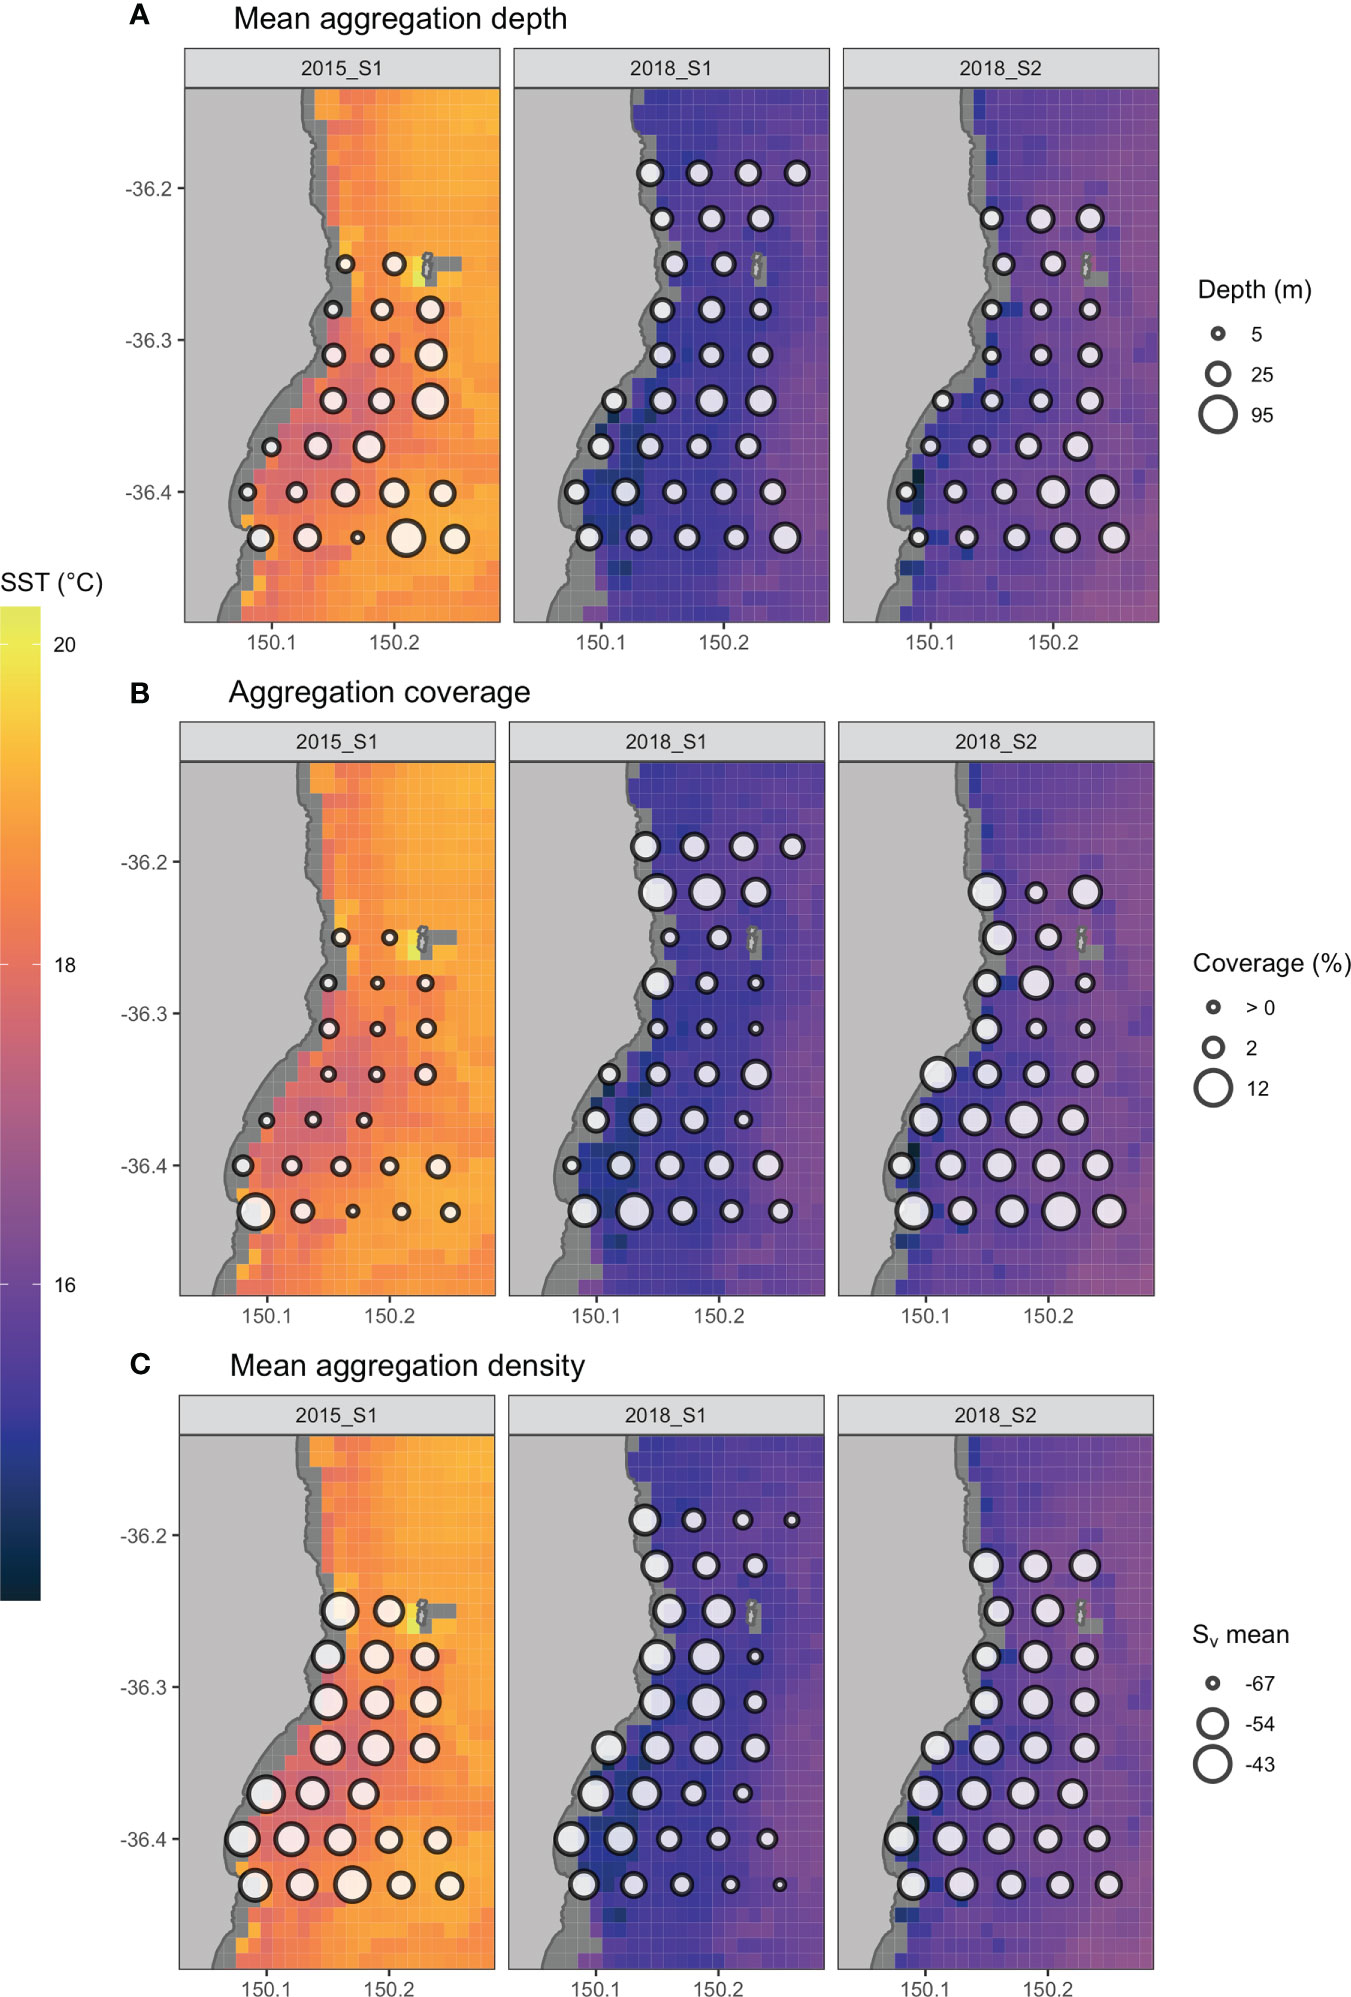
Figure 4 Spatial distribution of acoustically derived biological aggregation metrics calculated for the area surrounding transect stations overlaid over sea surface temperature (IMOS MODIS SST) for surveys 2015 S1, 2018 S1 and 2018 S2 with point size representing (A) the mean depth of aggregations, (B) the percentage area around the station containing biological aggregations and (C) the mean aggregation density. An equivalent figure for all surveys is included in the supplementary material.
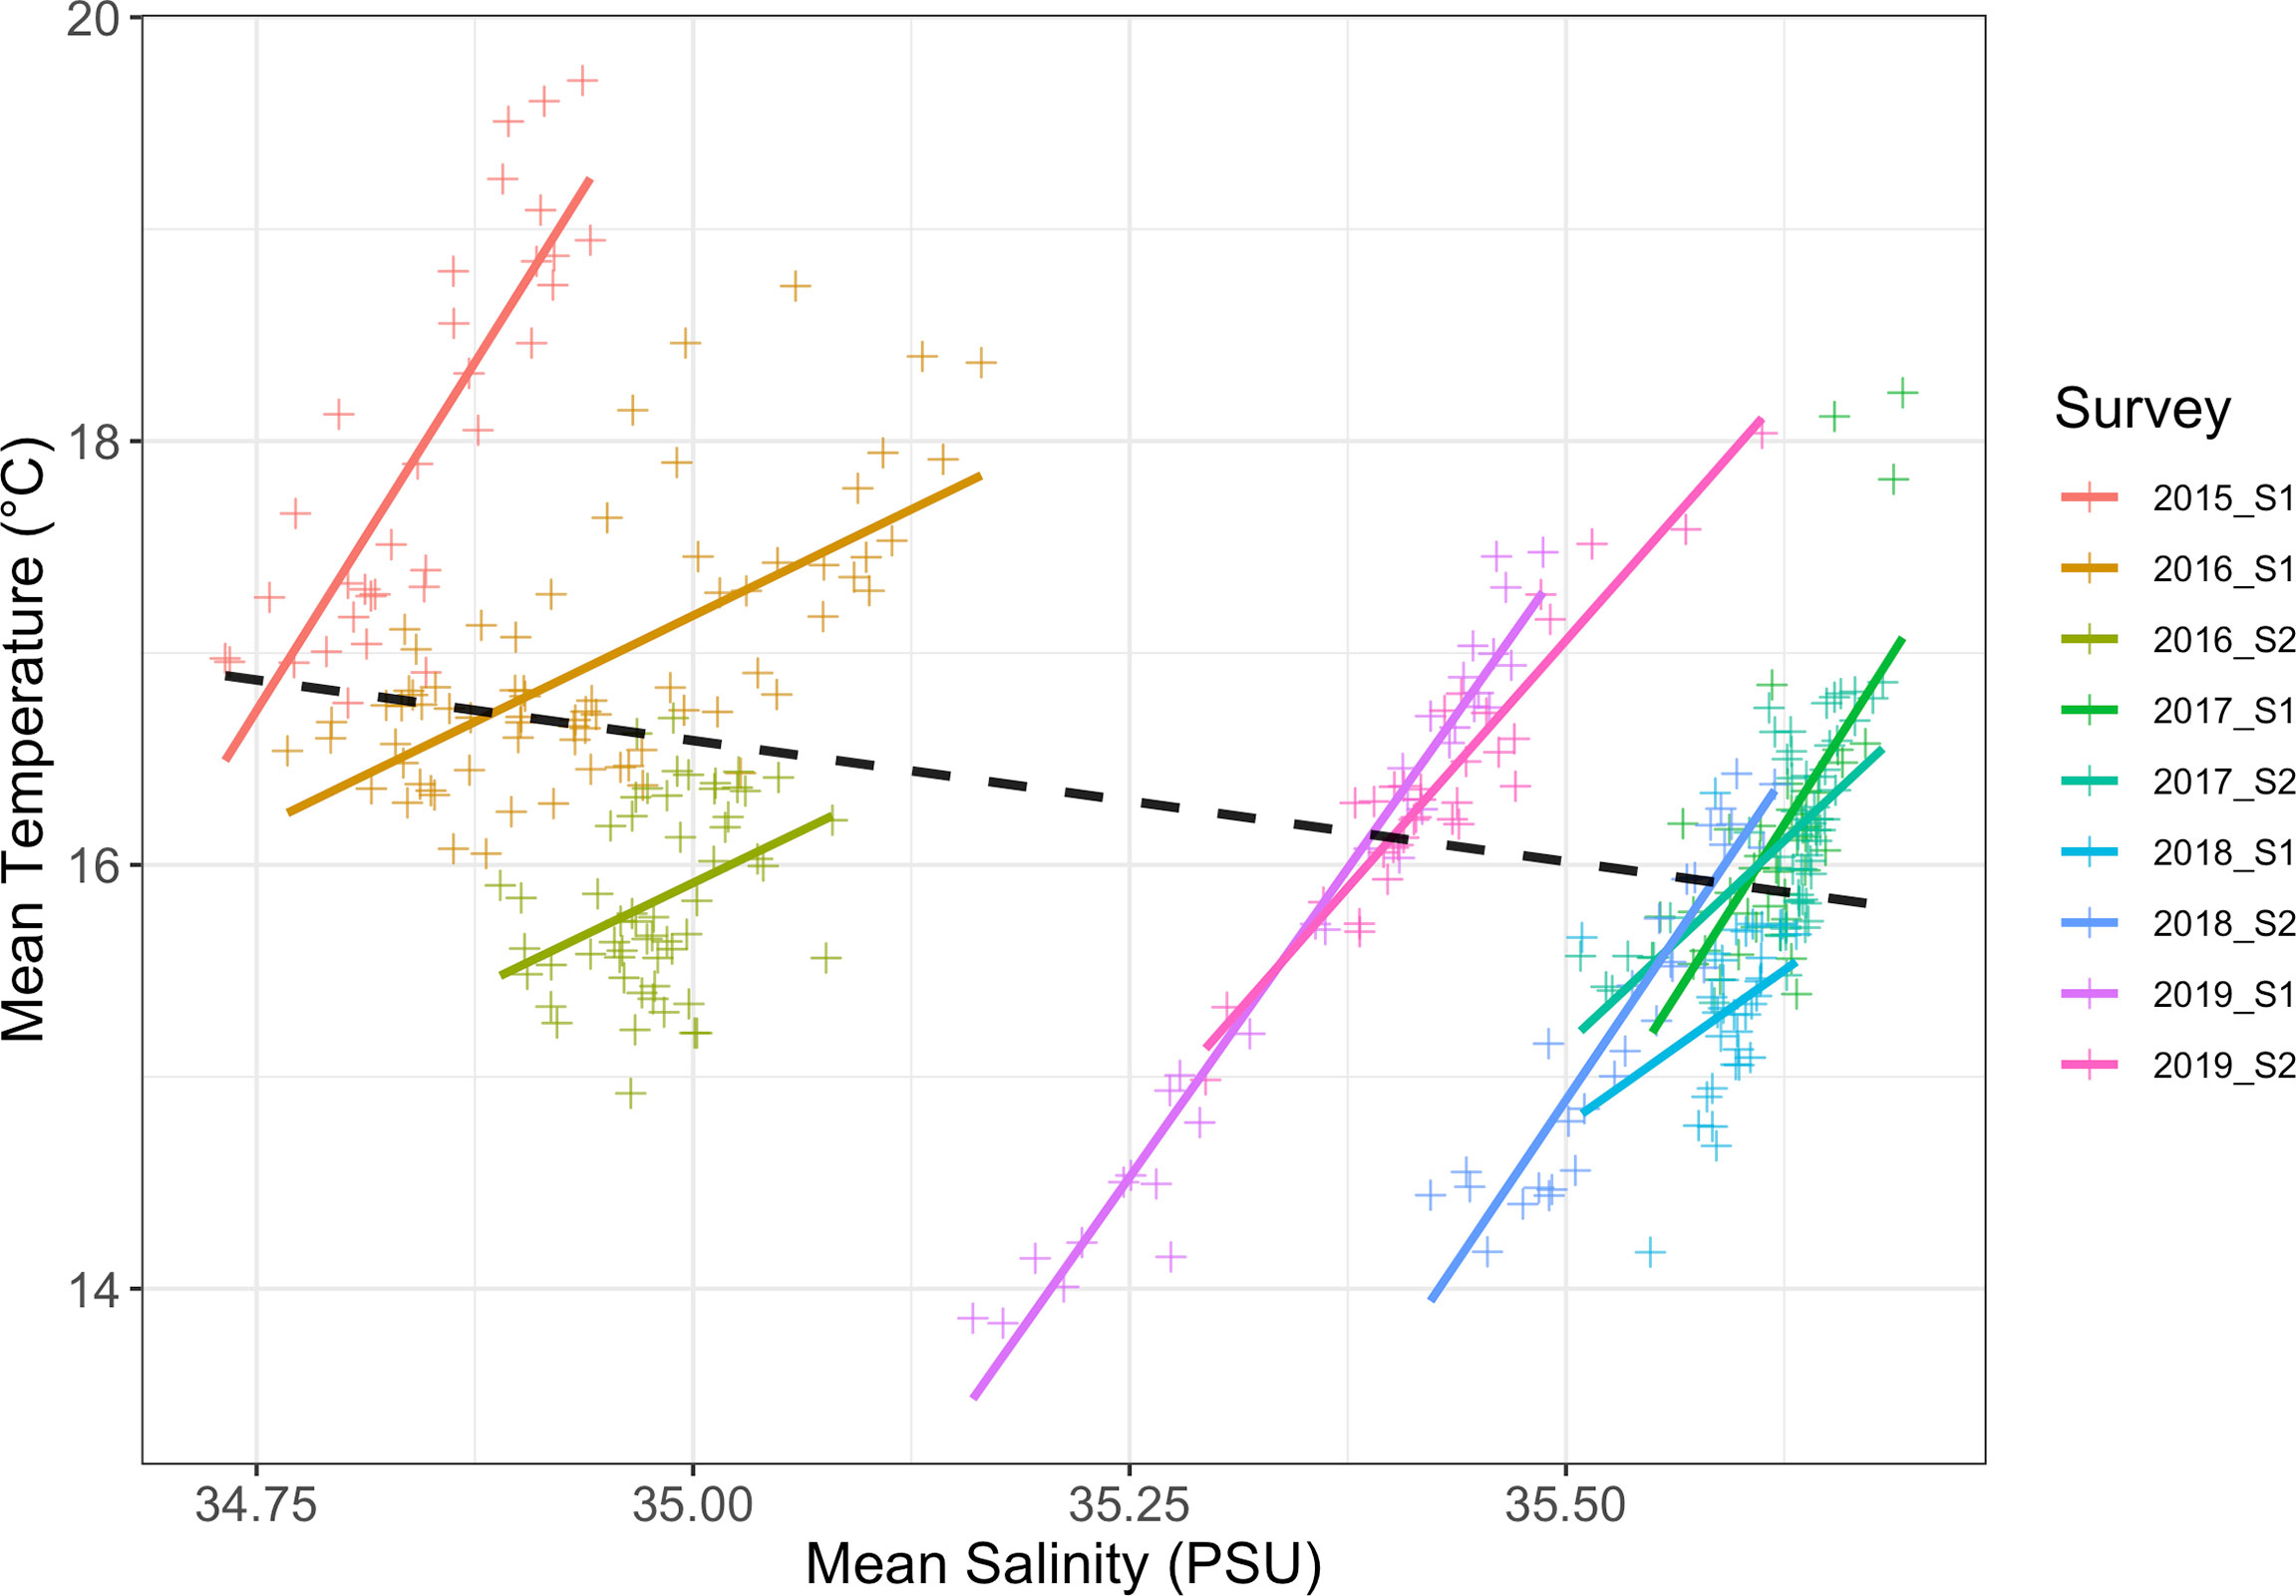
Figure 5 Mean temperature (°C) and mean salinity (PSU) scatter plots from all of the CTD casts coloured by survey with the generalised linear model regression lines shown. The black dashed line shows the generalised linear model regression line for the entire dataset.
The K-means clustering of the CTD/aggregation data’s five principal components separated the data into two seascape categories (cluster A and B) that were cleanly divided between surveys (Figure 6). Cluster A consisted of data from surveys 2015 S1, 2016 S1 and 2016 S2 with a single outlier in 2016 S2 being classified grouped with cluster B. All other CTD casts and aggregation characteristic surveys (2017, 2018 and 2019) were classified as cluster B. cluster A was characterised by warmer and less saline water and had lower aggregation coverage and higher internal aggregate density in comparison to cluster B. Validation of the PCA/K-means clustering analyses using multinomial logistic regression applied to the testing dataset resulted in all data being classified into the correct cluster and 70.51% the data into the correct survey.
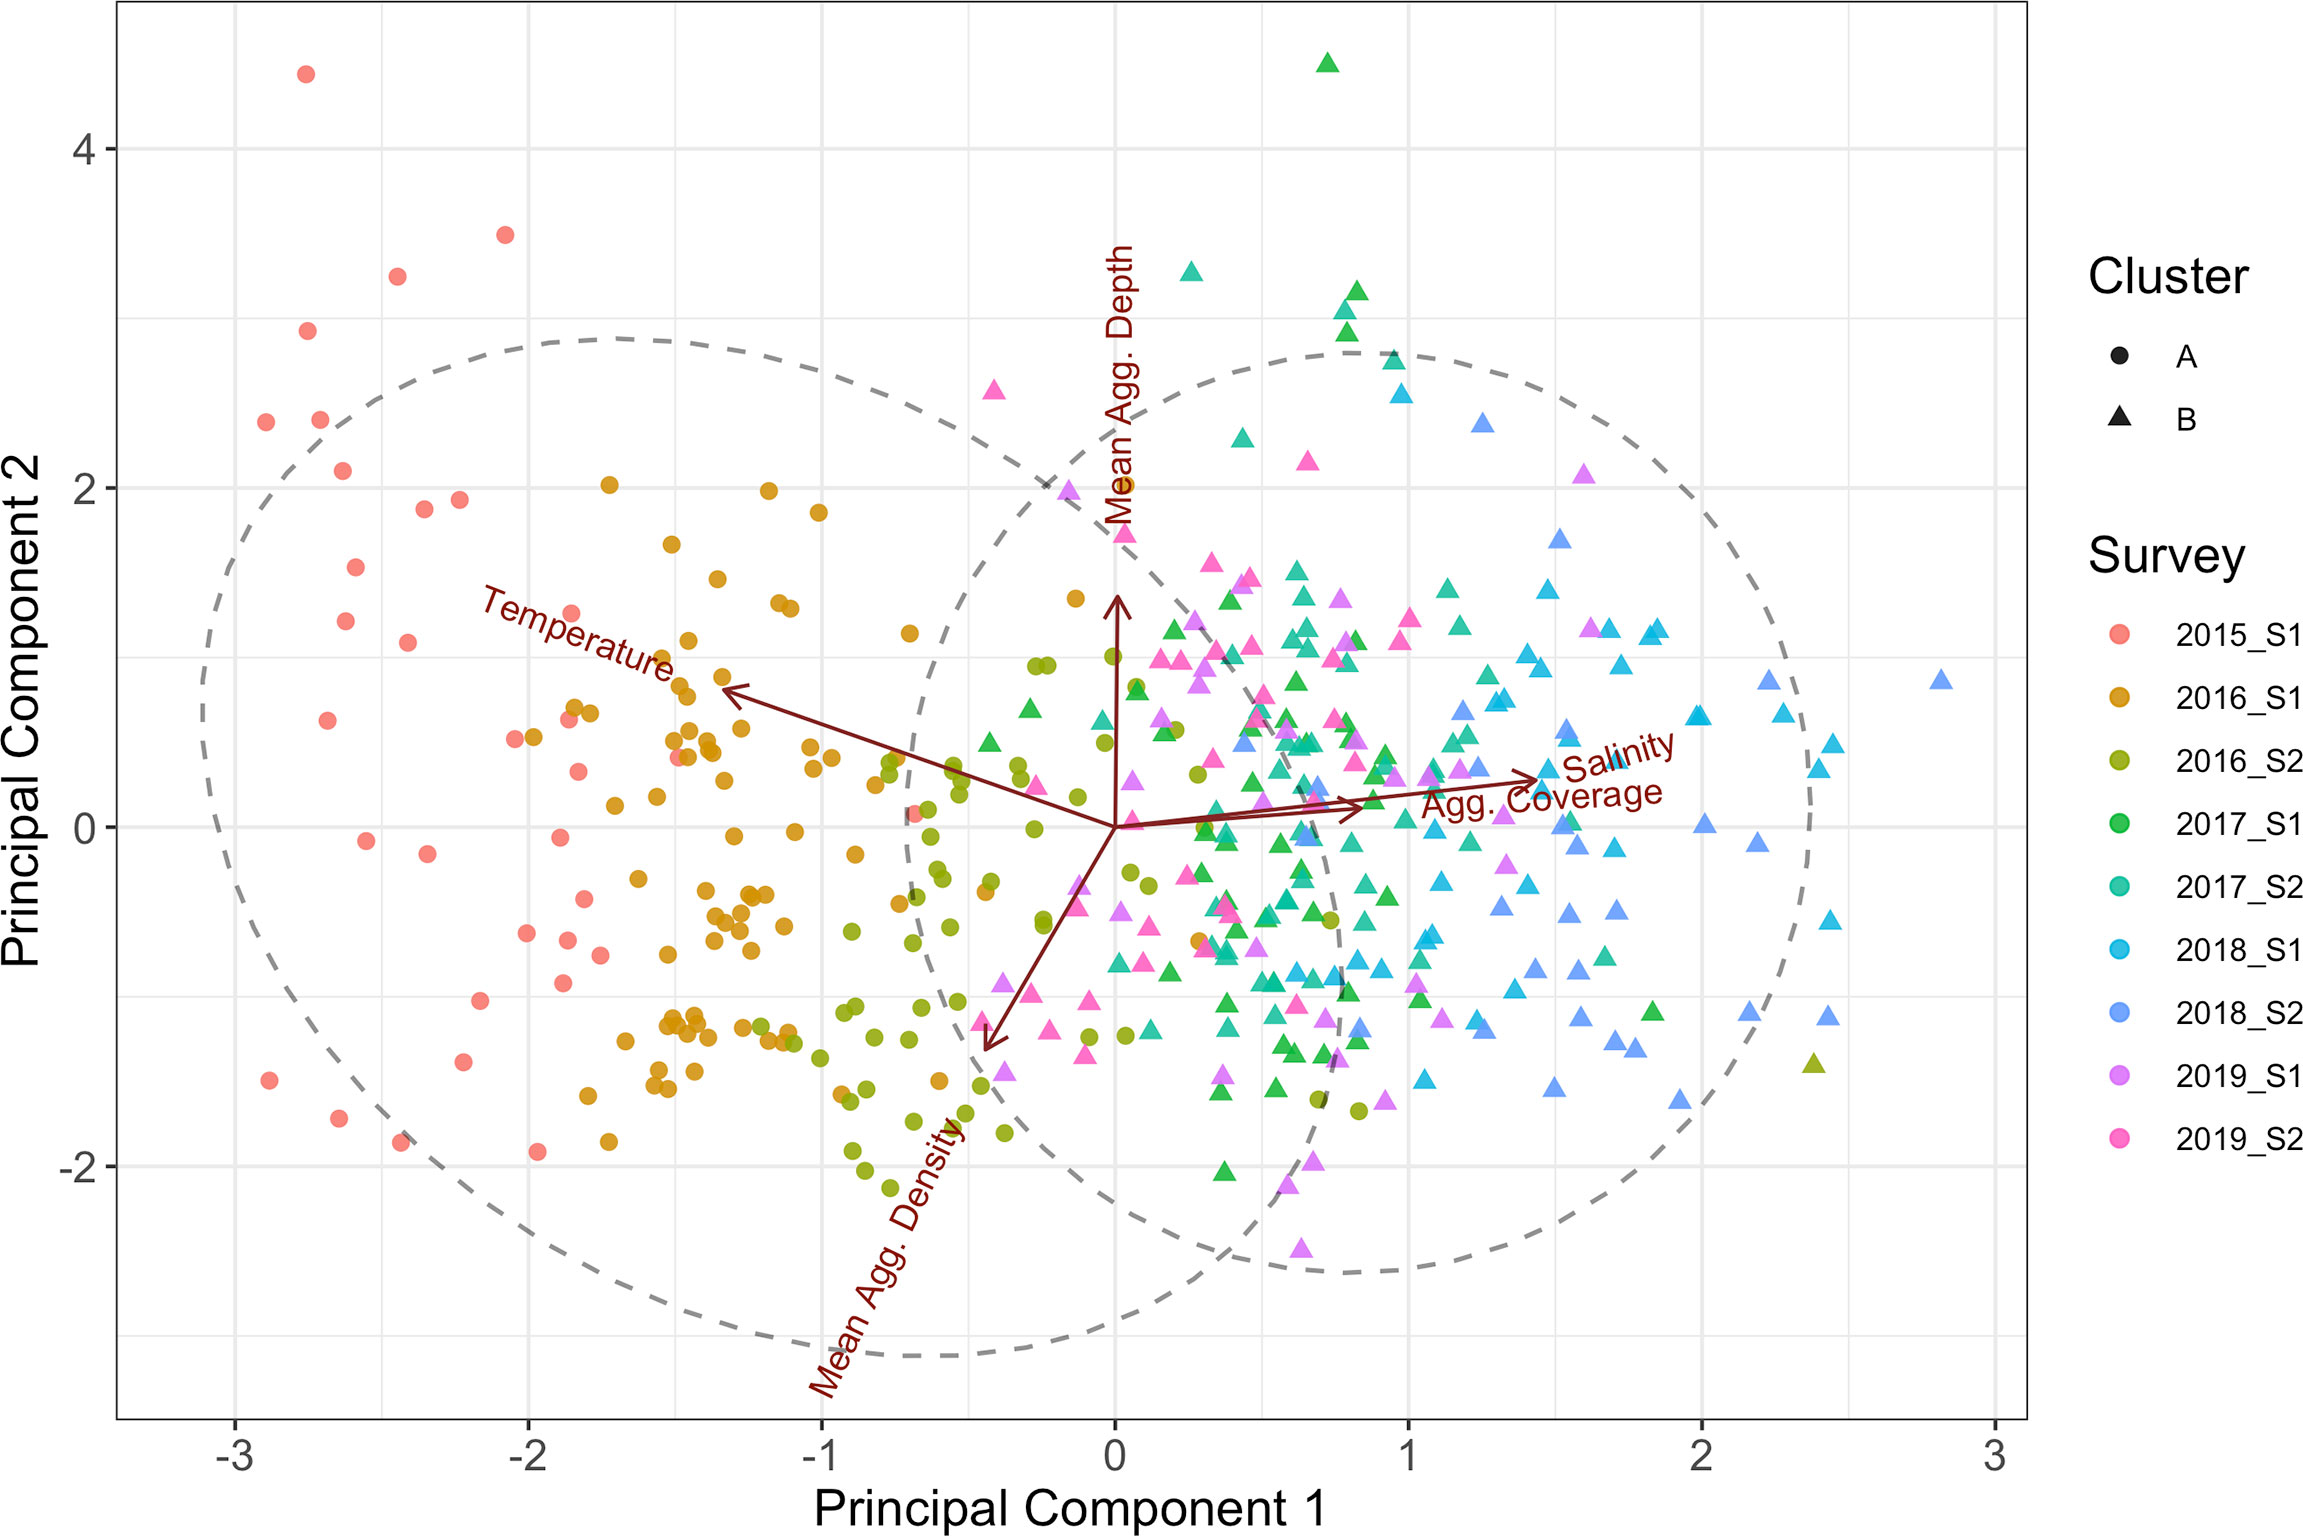
Figure 6 Results of the K-means clustering applied to the principal component analysis of the CTD and acoustic aggregation data plotted against the 1st and 2nd principal components. Clusters are differentiated as circles and triangles and colured by survey ID. The dashed lines represent the 95% normal-probability contour of each cluster.
The relationships between water temperature from the CTD casts and acoustic aggregation characteristics were compared between the two seascape categories using generalised linear models (Figure 7). Overall the relationship between temperature and mean aggregation depth was positive (slope = 1.15, sd = 0.06, p = 0.005) with no observable difference in relationship between the two seascape categories (slope = 1.03, sd = 0.07, p = 0.665). The relationship between temperature and aggregation coverage was negative (slope = -0.12, sd = 0.04, p = 0.005) and the relationship was stronger within seascape cluster A than for cluster B (slope = 0.13, sd = 0.06, p = 0.038). There was also a negative relationship between temperature and mean internal aggregation density (slope = -1.93, sd = 0.41, p < 0.001) and with the relationship being stronger for cluster A (slope = 1.33, sd = 0.60, p = 0.026).
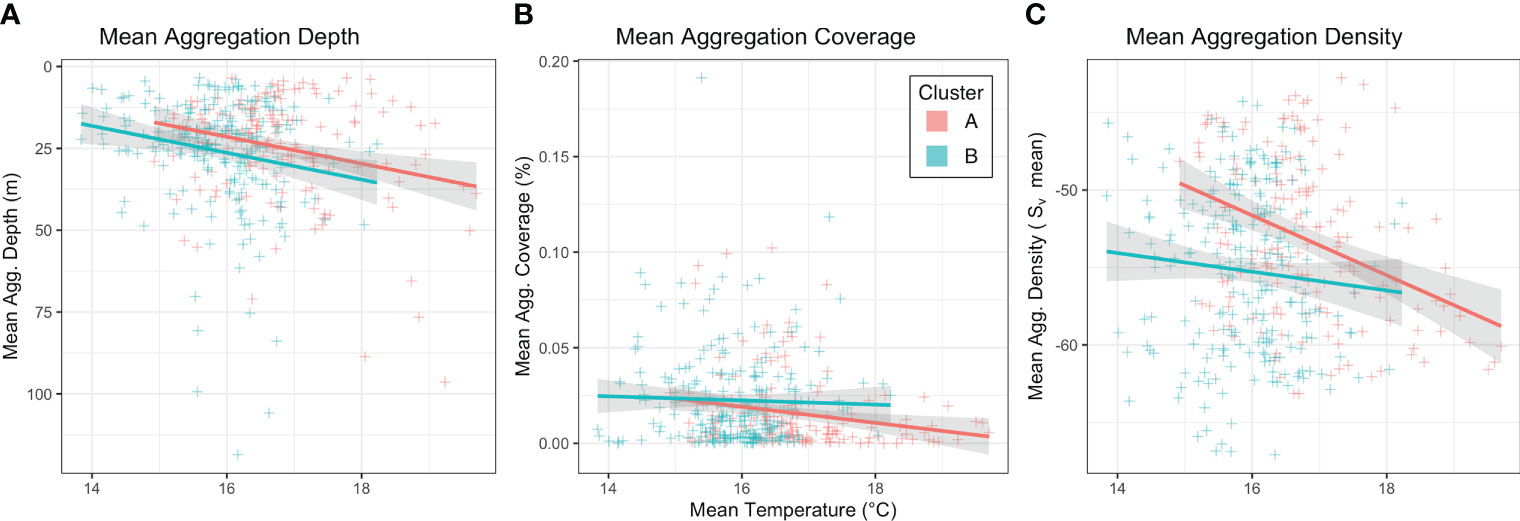
Figure 7 Scatter plots of CTD mean temperature (°C) plotted against the acoustic aggregation characteristics metrics being (A) mean aggregation depth (mean depth of aggregation centre), (B) aggregation coverage (% of sampled area occupied by acoustic aggregations), and (C) aggregation internal density (mean Sv within aggregation boundaries). The slope of the generalised linear models are shown with colour representing the two seascape classifications.
Marine systems can be highly dynamic and complex, with emergent properties arising from the interactions of processes at multiple spatiotemporal scales. Here we use the conceptual framework of seascape ecology to combine multiple datasets of different spatial and temporal scales and so investigate variability in a rapidly changing coastal ecosystem in southeastern Australia (Suthers et al., 2011; Malan et al., 2021). Over the course of nine surveys in the austral spring across 5 years, we identified multiple oceanographic processes operating across diverse spatiotemporal scales within the East Australian Current (EAC) southern extension (Figure 8). Two seascape categories with distinct differences observed in environmental and biological factors were identified from the principal component and K-means clustering analyses. Seascape A (2015/16) was characterised by warmer and less saline EAC water and had lower aggregation coverage and lower internal aggregate density. Seascape B (2017 - 2019) which was characterised by cooler and more saline water from the Bass Strait and/or Tasman Sea and had higher aggregation coverage and higher internal aggregate density. Further, we identified how the relationships between ecological, environmental and oceanographic variability can have different characteristics depending on the scale of observation.
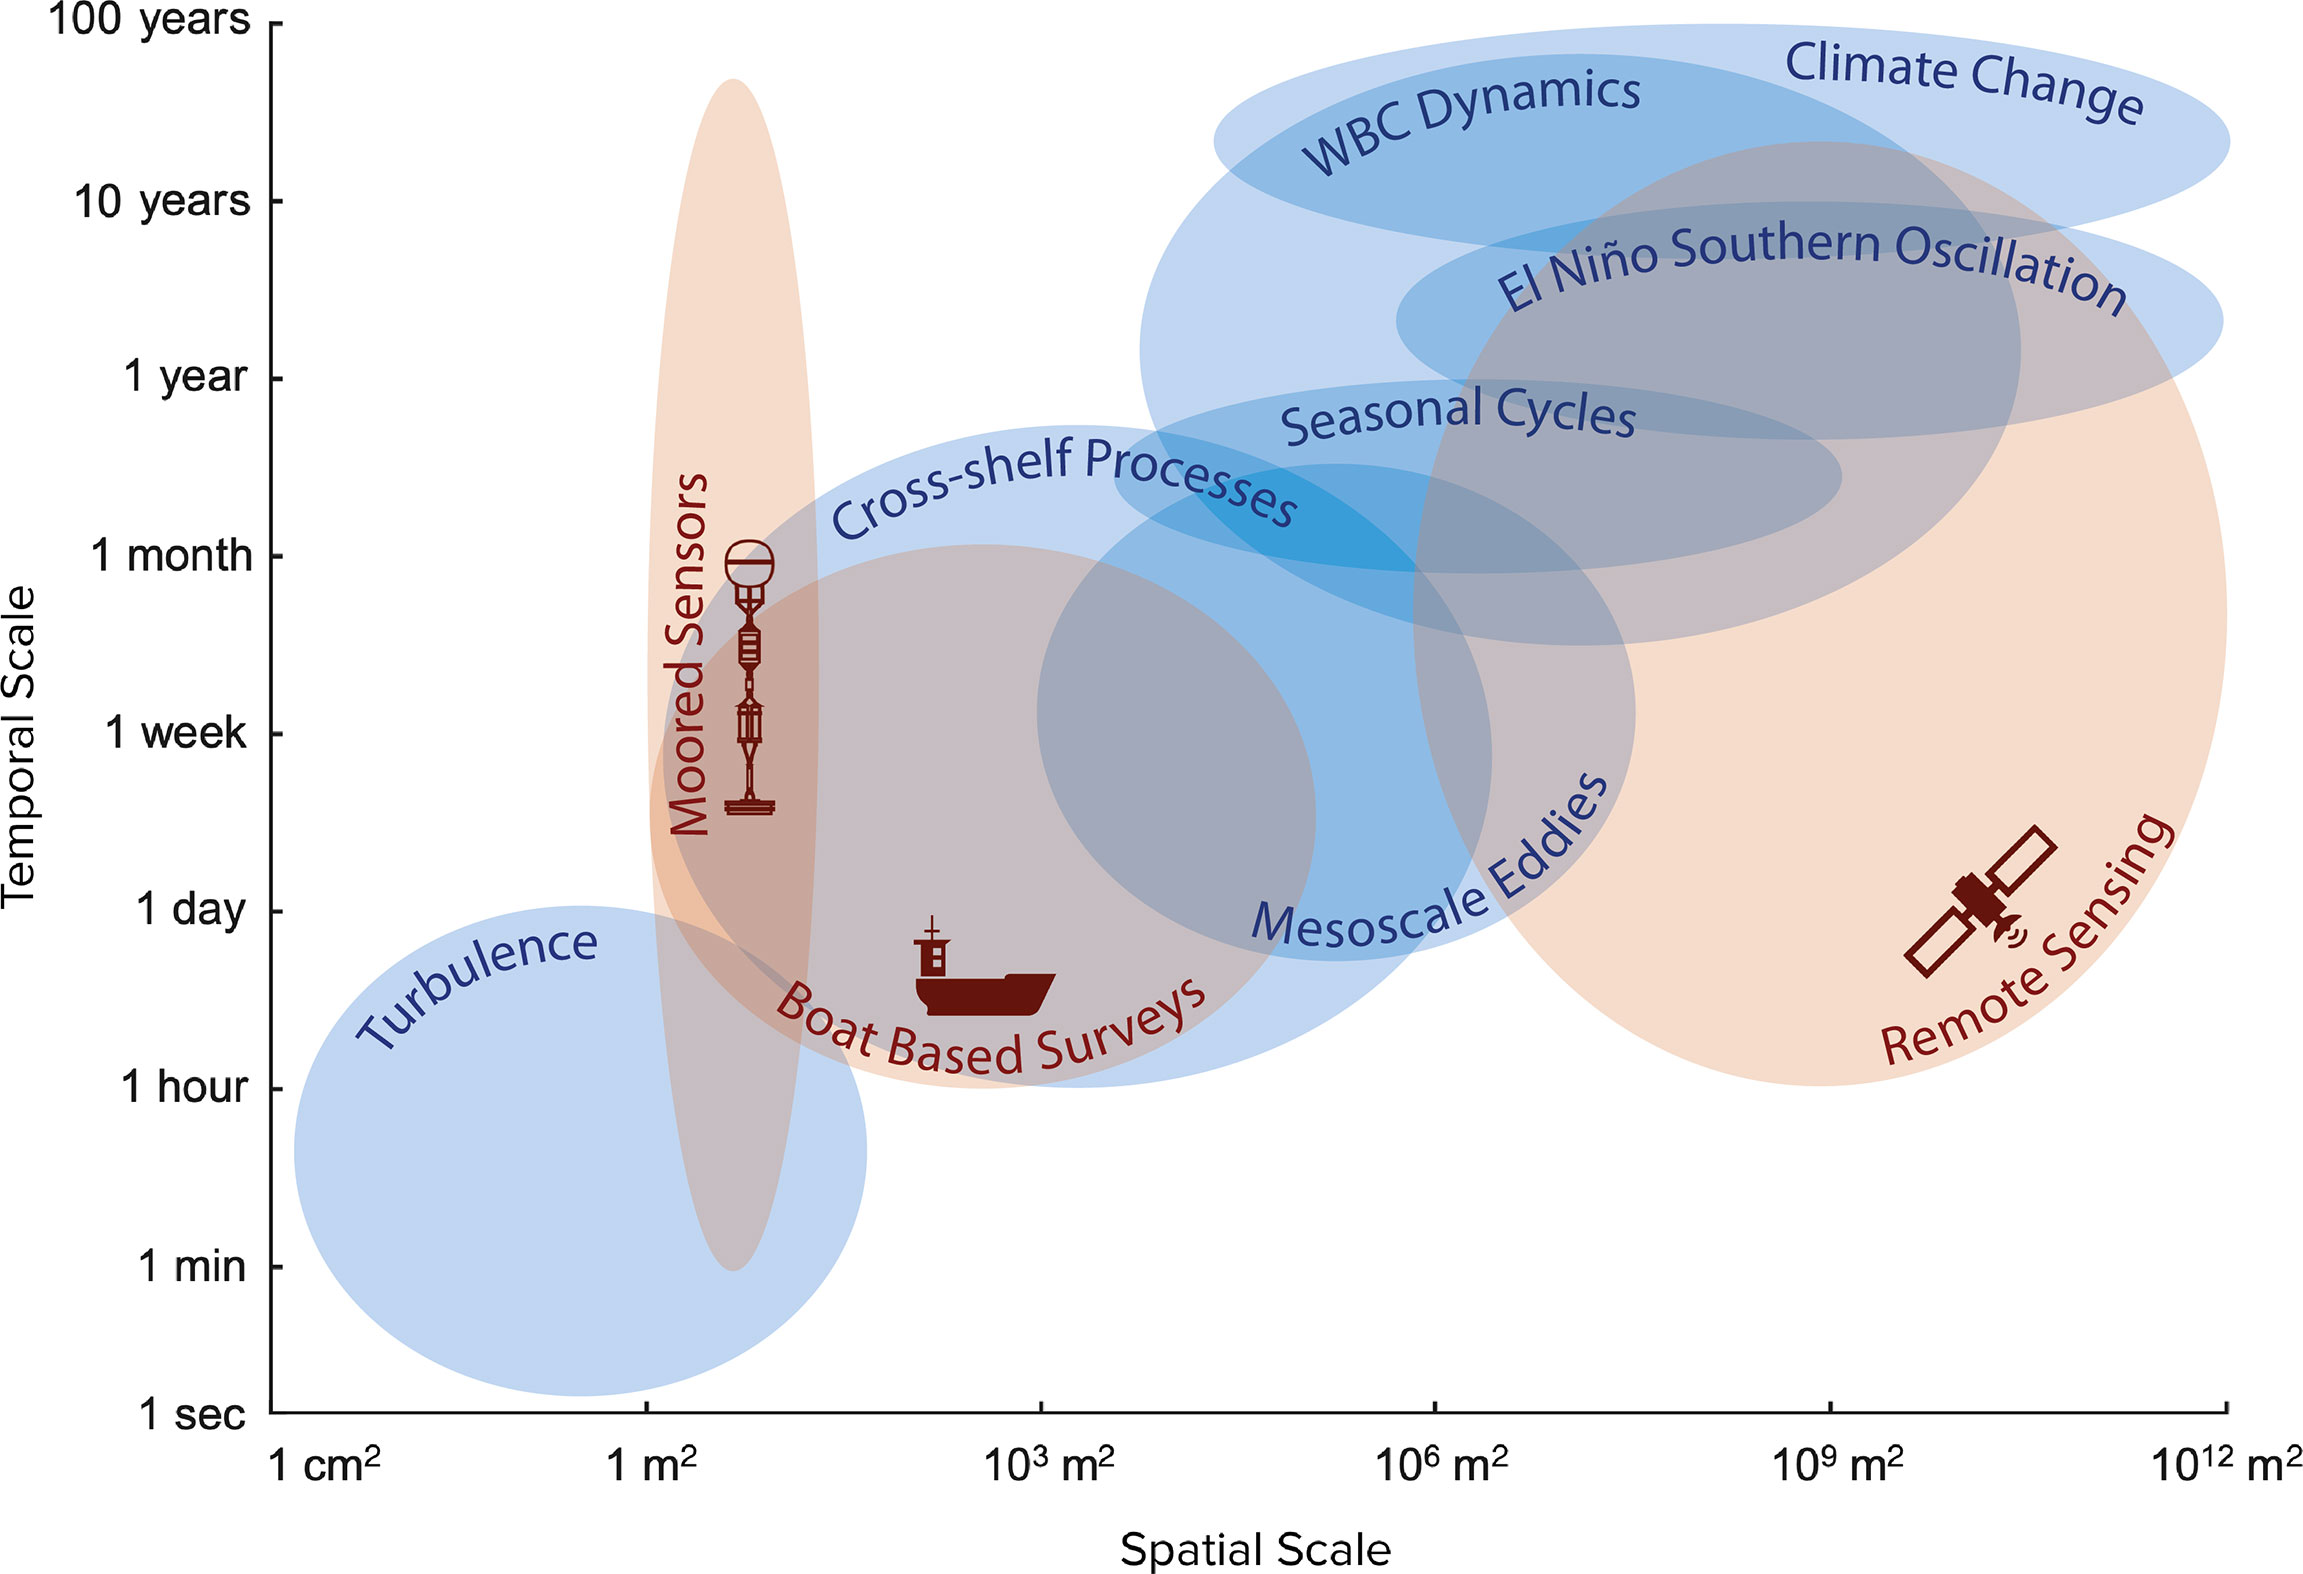
Figure 8 Adaptation of a Stommel diagram showing the spatiotemporal scales of variability relevant for Western Boundary currents such as the East Australian Current system (blue) and the observational platforms used in this study (red).
There were differences in offshore oceanographic processes between each of the surveys including differences in the position of large eddies and mesoscale current strength and direction. During each survey, the broad oceanographic context was consistently dominated by the presence of a large anticyclonic eddy formed from warm, EAC water that varied in size, intensity and position. The position and intensity of this eddy appeared to have a considerable influence on the coastal study area, shaping the volume of EAC water transported onto the shelf, and modifying the mesoscale current flows that determined which water types were transported into the area. For example, in 2015 S1 the position of the meso-scale eddy was located the furthest south (centred at 36.75° S) when compared to the other surveys thereby creating a continuous flow that allowed warm EAC water from more equatorward latitudes to dominate the study area. This was also evident from the IMOS mooring which recorded significant southward flow at the 120 m isobath. Surveys 2016 S1 and 2016 S2were also characterised by a particularly large anticyclonic eddy, but these eddies were located at more equatorward latitudes (centred at 34.5 and 35.25° S respectively) resulting in less pronounced southward flow. Surveys 2019 S1 and 2019 S2 also had setups that resulted in primarily southward flow but to a lesser degree than other years.
By contrast, survey 2018 S1 was characterised by a much less intense anticyclonic eddy which was also located further offshore. As a consequence, there was much less influence from warm equatorial EAC water and geostrophic flow from satellite altimetry was primarily northward with cooler waters originating from the southbeing transported northward along the coast into the study area. This cooler southern watermass could have originated in the Bass Strait (Luick et al., 1994) or to the southeast, brought into the coast by cyclonic eddies. However, although the meridional velocity recorded at the IMOS moorings were highly variable, they were primarily southward during this same period, highlighting a mismatch between large scale and finescale processes in the study area. During survey 2018 S2 which was conducted approximately one month later, the position and intensity of these eddies changed considerably with the emergence of a smaller cyclonic eddy arising at ≈ 36° S. The presence of this eddy created a pathway for warm EAC water located off the shelf to be advected onto the shelf and into the study area from the south. Surveys 2017 S1 and 2017 S2 were also characterised by cyclonic eddies resulting in equatorward flow which was also detected at the IMOS moorings.
The differences in mesoscale circulation resulted in different environmental conditions between surveys within the study area. Temperature and salinity profiles from CTD sampling along transects revealed two primary environmental regimes with surveys typically being either warm with relatively lower salinity or cool with higher salinity. These categorisations were supported by the seascape classifications with each being represented by seascape A and B respectively. The study area is frequently subjected to influxes of cool, salty water that is transported up the coast either from the Bass Strait (Luick et al., 1994), or through cyclonic eddies bringing Tasman Sea water to the coast. This current acts in opposition to the EAC, and in the absence of eddy placement that blocks the northward flow of this current, can provide coastal ecosystems with a supply of relatively cool, productive water. Furthermore, the surveys which exhibited higher salinity and cooler water (seascape B) were years with reduced southward geostrophic flow. Conversely, the years that had lower salinity and generally warmer temperatures (seascape A) were years where southward geostrophic flow was particularly strong due to the positioning of meso-scale eddies. Consequently the seascape variability observed on inter-survey time frames (months to years) may be due to the varying influence of northern (EAC) or southern (Tasman Sea/Bass Strait) watermasses driven by the positioning of the mesoscale eddies which can enhance or block the flow of cooler water northward along the coast.
The relationship between temperature and salinity as measured by the CTD profiles was dependent on timescale. On inter-survey timeframes (months to years) there was a negative relationship between temperature and salinity, however on intra-survey timescales (days to weeks) this relationship was positive. The change in this relationship at different temporal scales suggests that different oceanographic processes are driving this environmental variability. For example, the negative relationship between temperature and salinity at inter-survey temporal scales is likely due to the previously mentioned interplay of EAC and Tasman Sea (or Bass Strait) waters creating warm-fresh or cool-salty conditions over each survey period. However, the positive relationships between temperature and salinity at shorter temporal scales is indicative of the presence of distinctive water types of relatively fresh cool water and more saline warmer water at finer scales within the study area.
Within the EAC southern extension, ocean heat content and marine heatwave events are largely driven by mesoscale eddies (Elzahaby et al., 2021; Li et al., 2022a). As the frequency and intensity of marine heatwaves are projected to increase (Oliver et al., 2019), the environmental characteristics of seascape A (EAC dominated) (2015 S1, 2016 S1 and 2016 S2) are likely to be increasingly common in the future. During the Austral spring of 2015 the coastal shelf region of NSW experienced a marine heatwave event (Huang et al., 2021) which was the precursor to the 2015/16 Tasman Sea heat wave (Oliver et al., 2017). This event is likely the cause of the unprecedented water temperatures observed in our study area during survey 2015 S1 which was up to 4 degrees warmer than SSTAARS climatology.
There were differences in the distribution, structure and abundance of biological aggregations between the two seascape categories corresponding to differences in mesoscale circulation and environmental characteristics within the study area. Warmer temperatures typically resulted in more sparse aggregation coverage which were also deeper and had lower internal density. As warmer years were associated with increased EAC influence, this suggests that in our study area the projected increase in EAC advections onto the shelf (Bull et al., 2020) may produce conditions that are less suitable for the formation of biological aggregations. These patterns between anomalously high ocean temperatures and the abundance of pelagic fishes have been observed in other western boundary current systems. For example, in the Sea of Japan which is influenced by the highly variable Kuroshio Current sardine catches have been observed to be lowest during periods of higher water temperatures (Yasuda et al., 1999).
There were differences in functional relationships between environment and acoustic aggregation characteristics between the two seascape categories. In particular the negative relationship between temperature and aggregation internal density was stronger for seascape A (EAC dominated) than seascape B (Bass Strait/Tasman Sea). This pattern was also present in the relationship between temperature and aggregation coverage but to a much lesser extent. This suggests that the behaviour of the biological aggregates may be influenced differently by the two seascape environments and may be indicative of a thermal preference for biological aggregates that occurs under the warmer and less saline environmental conditions of seascape A. This difference may be explained by the timing of key biological events such as the major phytoplankton bloom that occurs each spring at these latitudes south of the EAC separation zone. This bloom event is driven by a seasonal encroachment of the EAC into the region which causes an increase in water temperature, greater dissolved nitrate and silicate, and a shallowing of the mixed-layer depth (Everett et al., 2014). Although our surveys were conducted during the Austral spring when this bloom is known to occur (Hallegraeff and Jeffery, 1993) the continued intensification of the EAC southern extension has modified the seasonal cycle of EAC influence in the region with the spring EAC encroachment occurring up to a month earlier (Phillips et al., 2020) and this can change the timing of these significant biological events. Consequently, it is possible our surveys occurred during different biological stages of this bloom period which may explain the different functional response observed between the two seascape categories.
In marine systems environmental conditions can change substantially over very short time periods (Barreau et al., 2021). This was particularly evident in 2018 when the sudden advection of EAC water onto the shelf caused a stark change in oceanographic conditions within the span of one month. This sudden advection of warm water from the offshore anticyclonic eddy resulted in a cold water coastal upwelling event visible in the CTD cross-sections (Figure 9). EAC advections onto the shelf can result in a long-shelf currents that drive Ekman transport in the bottom boundary layer causing local upwelling events (Roughan and Middleton, 2002; Roughan and Middleton, 2004) and can result in localised nutrient enrichment (Oke and Middleton, 2001). This change in environmental conditions was accompanied by increased offshore aggregation density and with aggregations inshore moving to shallower depths. This suggests that these conditions may be favourable to swarming and schooling species such as plankton and pelagic fishes resulting in more shallow biological aggregations in inshore regions.
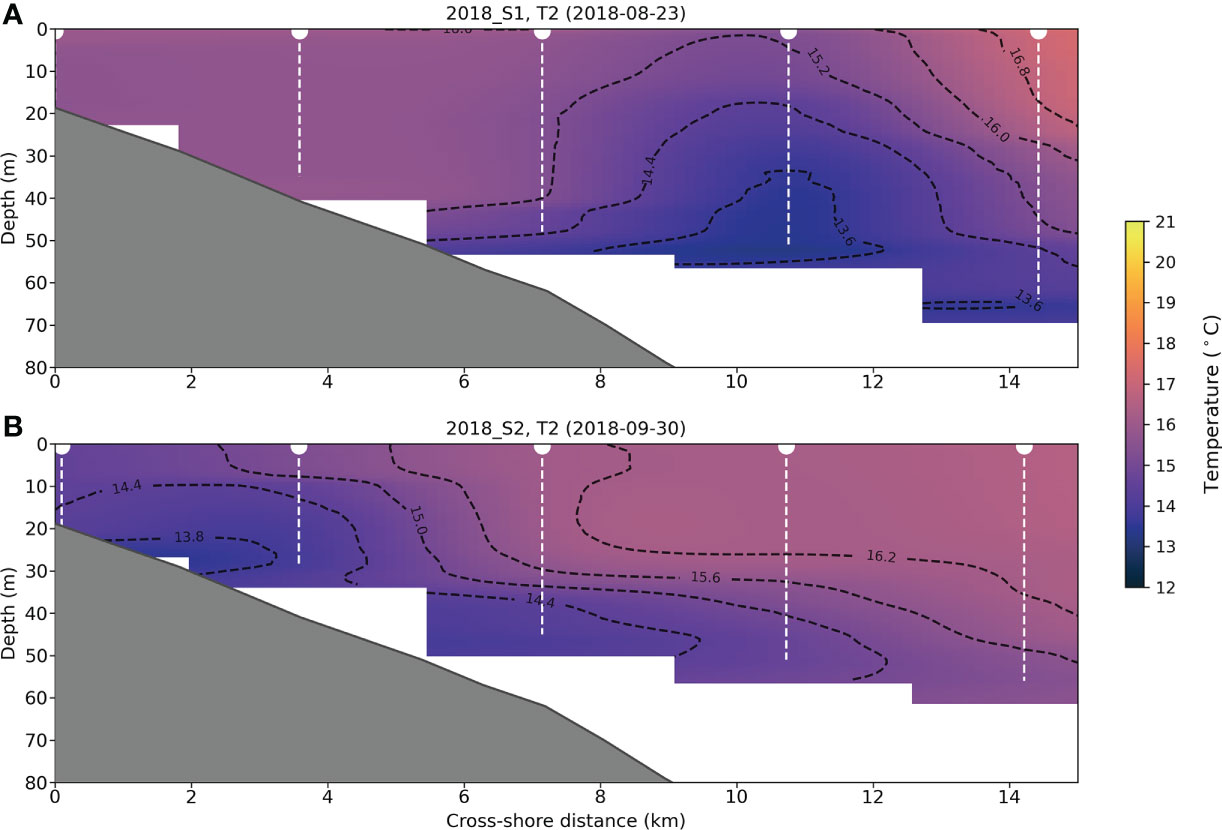
Figure 9 Comparisons of interpolated CTD cross sections of transect 2 showing water temperature (colour), the CTD profile depths (white dotted lines) and the sea floor as determined from acoustic sampling (grey area) for (A) survey 2018 S1 and (B) 2018 S2. Interpolation of temperature from CTD casts was performed using radial basis function interpolation.
As eddy kinetic energy continues to increase in the EAC southern extension (Li et al., 2021; Li et al., 2022a; Li et al., 2022b) mesoscale eddies that advect warm EAC water onto the shelf are expected to become more common, larger and more intense (Li et al., 2021). Consequently, the extreme oceanic conditions observed during survey 2015 S1 may be broadly representative of conditions that will become more common for this region resulting in warmer and less biological productive environmental conditions observed in EAC dominated Seascape category A. While over shorter time frames the encroachment of EAC water onto the shelf can sometimes result in productive cold water upwellings that produce increased biological activity (Roughan and Middleton, 2002; Roughan and Middleton, 2004) at depth, the complete dominance of the region by EAC water in 2015 was associated with a reduction in the coverage of biological aggregations that were both deeper and had lower internal density. The more southward position of the dominant anticyclonic eddy in 2015 created a blocking action which resulted in the complete absence of the cooler northward flow. This suggests that this northward flow of cooler, salty water may become rarer or completely absent in the future as the period of EAC regional dominance continues to encroach further into the Austral winter (Phillips et al., 2020).
The relationship between warmer water and sparser, less dense and deeper aggregations may have significant implications for foraging predators such as seabirds. Montague Island, located in the study area, is home to numerous seabird breeding colonies including little penguins (Eudyptula minor), greater crested terns (Thalasseus bergii) and silver gulls (Chroicocephalus novaehollandiae). Previous studies in the region have shown that foraging outcomes are influenced by the distribution and structure of the prey field with sparser and deeper aggregations reducing predators’ ability to locate suitable prey (Carroll et al., 2017; Phillips et al., 2022 in review). The presence of higher sea surface temperatures driven by the increased poleward penetration of the EAC southern extension have been associated with reduced foraging success in little penguins (Carroll et al., 2016) and changes to the diet composition of greater crested terns (Quiring et al., 2021). Furthermore, the ongoing intensification of the EAC southern extension may continue to place additional pressures on ecological systems. Consequently, it appears likely that the continued dominance of the EAC in southern NSW waters and reduced northward flow will have substantial effects on biological activity in coastal pelagic ecosystems in southeast Australia, including a potential reduction in the accessibility of prey aggregations to surface-feeding predators and fisheries.
The rapid change in environmental conditions observed in 2018 and the associated changes to biological distribution and structure at a sub-seasonal timescale, highlights the highly variable nature of coastal systems in the EAC southern extension. This is primarily driven by the sporadic nature of the southward propagating eddies of the region with anticyclonic mesoscale eddies advecting EAC water from further offshore onto the coastal shelf (Li et al., 2022a). This sub-seasonal scale of variability is important to understand as both a normal component of EAC extension dynamics, as well as an additional stressor in the context of an intensifying EAC southern extension. As the EAC southern extension continues to penetrate further southward, advections of warm water onto the shelf are likely to become more common (Li et al., 2021; Malan et al., 2021). This is likely to result in increased ocean heat content in the region (Li et al., 2021; Li et al., 2022a) and an increase in the probability of marine heat waves (Elzahaby et al., 2021; Oliver et al., 2021) suggesting that the environmental and biological conditions experienced for the EAC dominated seascape A may become the norm in this region.
That these oceanographic processes were associated with notable changes in both environmental and biological characteristics has significant implications for the ecological processes within our study area and more broadly. For example, rapid changes in environmental conditions and biological activity may coincide with crucial life history events of breeding predators, such as little penguins (Eudyptula minor) and crested terns (Thalasseus bergii), which time their breeding behaviour to coincide with the period of greatest prey availability (Gales and Green, 1990; Carroll et al., 2016; Quiring et al., 2021). The migration phenology of ecologically and commercially important coastal pelagic fish species may also be impacted by rapid changes in EAC shelf incursions (Brodie et al., 2015; Champion et al., 2021) and the southward shift of the EAC will further facilitate the range expansion of tropical species into temperate regions (Vergés et al., 2014).
In this study, we assessed seascape variability within Batemans Bay Marine Park in southeast Australia – a highly variable coastal shelf ecosystem in the path of the rapidly intensifying East Australian Current (EAC) Southern Extension. We used satellite and in situ measures of temperature, salinity and current velocity coupled with contemporaneous measurements of pelagic biomass distribution from boat-based active acoustic surveys to investigate relationships between the physical environment and the distribution of pelagic biomass (zooplankton and fish) at multiple timescales. We identified two seascape categories characterised by warmer, less saline water and cooler, more saline water, with the former indicating greater influence of the EAC on coastal processes. Warmer waters were also associated with fewer, deeper and less dense biological aggregations. As the EAC southern extension continues to penetrate further southward (Li et al., 2021) the environmental and biological conditions experienced during the EAC dominated seascape may become increasingly commonplace for the region.
While there is much uncertainty in how changes in western boundary current dynamics will impact coastal ecosystems, understanding relationships between coastal and offshore processes and biological responses in the ecosystem will help resolve the key mechanisms and outcomes of change at multiple spatiotemporal scales. Our study demonstrates the important role of offshore oceanographic processes in determining coastal seascape variability and the impacts on biological activity within a region experiencing rapid oceanic warming and ecological change.
The datasets presented in this study can be found in online repositories. The names of the repository/repositories and accession number(s) can be found below: https://doi.org/10.5281/zenodo.6471632.
Study design: LP, NM, MR, IJ, RH, MC, AW, and GC. Data collection and processing: LP, NM, MR, IJ, RH, MC, AB, DS AW and GC. Analysis: LP, NM, MR, IJ, RH, MC, AB, and GC. The paper was written by LP with input from all authors. All authors contributed to the article and approved the submitted version.
This study was funded by Australian Research Council Linkage Grants (LP110200603 awarded to RH, DS and Iain Field, and LP160100162 awarded to IJ, Martina Doublin, MC, GC, DS, Iain Suthers and RH) with contributions from the Taronga Conservation Society Australia, NSW National Parks and the Australian Antarctic Division.
Thanks to Sven Gastauer, Matteo Bernasconi, Ben Pitcher, Pierre Vignal, Sven Gastauer and Vanessa Morris for help with data collection. The authors declare that the research was conducted in the absence of any commercial or financial relationships that could be construed as a potential conflict of interest. Data was sourced from Australia’s Integrated Marine Observing System (IMOS) – IMOS is enabled by the National Collaborative Research Infrastructure Strategy (NCRIS). It is operated by a consortium of institutions as an unincorporated joint venture, with the University of Tasmania as Lead Agent.
The authors declare that the research was conducted in the absence of any commercial or financial relationships that could be construed as a potential conflict of interest.
All claims expressed in this article are solely those of the authors and do not necessarily represent those of their affiliated organizations, or those of the publisher, the editors and the reviewers. Any product that may be evaluated in this article, or claim that may be made by its manufacturer, is not guaranteed or endorsed by the publisher.
The Supplementary Material for this article can be found online at: https://www.frontiersin.org/articles/10.3389/fmars.2022.925123/full#supplementary-material
Supplementary Figure 1 | Spatial distribution of acoustically derived biological aggregation metrics calculated for the area surrounding transect stations overlaid over sea surface temperature (IMOS MODIS SST) for all surveys with point size representing: (A) the mean depth of aggregations; (B) the percentage area around the station containing biological aggregations; and (C) the mean aggregation density.
Archer M. R., Roughan M., Keating S. R., Schaeffer A. (2017). On the variability of the East Australian current: Jet structure, meandering, and influence on shelf circulation. J. Geophysical Research: Oceans 122 (11), 8464–8481. doi: 10.1002/2017JC013097
Baird M. E., Suthers I. M., Griffin D. A., Hollings B., Pattiaratchi C., Everett J. D., et al. (2011). The effect of surface flooding on the physical–biogeochemical dynamics of a warm-core eddy off southeast Australia. Deep Sea Res. Part II: Topical Stud. Oceanography 58 (5), 592–605. doi: 10.1016/j.dsr2.2010.10.002
Barange M. (1994). Acoustic identification, classification and structure of biological patchiness on the edge of the agulhas bank and its relation to frontal features. South Afr. J. Mar. Sci. 14 (1), e0254269. doi: 10.2989/025776194784286969
Barreau E., Kato A., Charadia A., Ropert-Coudert Y. (2021). The consequences of chaos: Foraging activity of a marine predator remains impacted several days after the end of a storm. PLoS One 16 (7), 333–347. doi: 10.1371/journal.pone.0254269
Beal L. M., Elipot S. (2016). Broadening not strengthening of the agulhas current since the early 1990s. Nature 540 (7634), 570–573. doi: 10.1038/nature19853
Bertrand A. (2003). Acoustics for ecosystem research: lessons and perspectives from a scientific programme focusing on tuna-environment relationships. Aquat. Living Resour. 16 (3), 197–203. doi: 10.1016/s0990-7440(03)00018-4
Block B. A., Jonsen I. D., Jorgensen S. J., Winship A. J., Shaffer S. A., Bograd S. J., et al. (2011). Tracking apex marine predator movements in a dynamic ocean. Nature 475 (7354), 86–90. doi: 10.1038/nature10082
Boland F. M., Church J. A. (1981). The East Australian current 1978. Deep Sea Res. Part A. Oceanographic Res. Papers 28 (9), 937–957. doi: 10.1016/0198-0149(81)90011-x
Brodie S., Hobday A. J., Smith J. A., Everett J. D., Taylor M. D., Gray C. A., et al. (2015). Modelling the oceanic habitats of two pelagic species using recreational fisheries data. Fisheries Oceanography 24 (5), 463–477. doi: 10.1111/fog.12122
Bull C. Y. S., Kiss A. E., Gupt A. S., Jourdain N. C., Argüeso D., Luca A. D., et al. (2020). Regional versus remote atmosphere-ocean drivers of the rapid projected intensification of the East Australian current. J. Geophysical Research: Oceans 125 (7), e2019JC015889. doi: 10.1029/2019JC015889
Carroll G., Cox M., Harcourt R., Pitcher B. J., Slip D., Jonsen I. (2017). Hierarchical influences of prey distribution on patterns of prey capture by a marine predator. Funct. Ecol. 31 (9), 1750–1760. doi: 10.1111/1365-2435.12873
Carroll G., Everett J. D., Harcourt R., Slip D., Jonsen I. (2016). High sea surface temperatures driven by a strengthening current reduce foraging success by penguins.. Scientific Reports 6, 22236. doi: 10.1038/srep22236
Cetina-Heredia P., Roughan M., Sebille E., Feng M., Coleman M. A. (2015). Strengthened currents override the effect of warming on lobster larval dispersal and survival. Global Change Biol. 21 (12), 4377–4386. doi: 10.1111/gcb.13063
Cetina-Heredia P., Roughan M., van Sebille E., Coleman M. A. (2014). Long-term trends in the East Australian current separation latitude and eddy driven transport. J. Geophysical Research: Oceans 119 (7), 4351–4366. doi: 10.1002/2014JC010071
Champion C., Brodie S., Coleman M. A. (2021). Climate-driven range shifts are rapid yet variable among recreationally important coastal-pelagic fishes. Front. Mar. Sci., 8. doi: 10.3389/fmars.2021.622299
Coetzee J. (2000). Use of a shoal analysis and patch estimation system (SHAPES) to characterise sardine schools. Aquat. Living Resour. 13 (1), 1–10. doi: 10.1016/s0990-7440(00)00139-x
Cox M. J., Letessier T. B., Brierley A. S. (2013). Zooplankton and micronekton biovolume at the mid-Atlantic ridge and Charlie–Gibbs fracture zone estimated by multi-frequency acoustic survey. Deep Sea Res. Part II: Topical Stud. Oceanography 98, 269–278. doi: 10.1016/j.dsr2.2013.07.020
Demer D. A., Berger L., Bernasconi M., Bethke E., Boswell K., Chu D., et al. (2015). Calibration of acoustic instruments. doi: 10.25607/OBP-185.
Dickey T. D. (2003). Emerging ocean observations for interdisciplinary data assimilation systems. J. Mar. Syst. 40–41, 5–48. doi: 10.1016/s0924-7963(03)00011-3
Edyvane K. S. (2003). Conservation, monitoring and recovery of threatened giant kelp (Macrocustis pyrifera) forests in Tasmania - report to environment Australia (Marine species protection program) (Hobart: Department of Primary Industries, Water and Environment).
Elzahaby Y., Schaeffer A., Roughan M., Delaux S. (2021). Oceanic circulation drives the deepest and longest marine heatwaves in the East Australian current system. Geophysical Res. Lett. 48 (17), e2021GL094785. doi: 10.1029/2021gl094785
Everett J. D., Baird M. E., Roughan M., Suthers I. M., Doblin M. A. (2014). Relative impact of seasonal and oceanographic drivers on surface chlorophyll a along a Western boundary current. Progress in oceanography. Progress in Oceanography 120, 340–351. doi: 10.1016/j.pocean.2013.10.016
Fauchald P. (1999). Foraging in a hierarchical patch system. Am. Nat. 153 (6), 603–613. doi: 10.1086/303203
Gales R., Green B. (1990). The annual energetics cycle of little penguins (Eudyptula minor). Ecology 71 (6), 2297–2312. doi: 10.2307/1938641
Godfrey J. S., Golding T. J. (1981). The sverdrup relation in the Indian ocean, and the effect of pacific-Indian ocean throughflow on Indian ocean circulation and on the East Australian current. J. Phys. Oceanography 11 (6), 771–779. doi: 10.1175/1520-0485(1981)011<0771:tsriti>2.0.co;2
Gremillet D., Lewis S., Drapeau L., van der Lingen C. D., Hugget J. A., Coetzee J. C., et al. (2008). Spatial match-mismatch in the benguela upwelling zone: should we expect chlorophyll and sea-surface temperature to predict marine predator distributions? J. Appl. Ecol. 45 (2), 610–621. doi: 10.1111/j.1365-2664.2007.01447.x
Hallegraeff G. M. (2010). Ocean climate change, phytoplankton community responses, and harmful algal bslooms: A formidable predicitve challlenge. J. Phycology 46 (2), 220–235. doi: 10.1111/j.1529-8817.2010.00815.x
Hallegraeff G. M., Jeffery S. W. (1993). Annually recurrent diatom blooms in spring along the new south Wales coast of Australia. Aust. J. Mar. Freshw. Res. 44 (2), 325–334. doi: 10.1071/MF9930325
Hamon B. V. (1965). The East Australian current 1960\textendash1964. Deep Sea Res. Oceanographic Abstracts 12 (6), 899–921. doi: 10.1016/0011-7471(65)90813-2
Harris G. P., Griffiths F. B., Clementson L. A., Lyne V., Van. der.Doe H. (1991). Seasonal and interannual variability in physical processes, nutrient cycling and the structure of the food chain in Tasmanian shelf waters. J. Plankton Res. 13 (supp1), 109–131. doi: 10.1093/oxfordjournals.plankt.a042363
Harris G., Nilsson C., Clementson L., Thomas D. (1987). The water masses of the east coast of Tasmania: Seasonal and interannual variability and the influence on phytoplankton biomass and productivity. Mar. Freshw. Res. 38 (5), 569–590. doi: 10.1071/MF9870569
Hartigan J. A., Wong M. A. (1979). Algorithm AS 136: A K-means clustering algorithm. Appl. Stat 28 (1), 100–108. doi: 10.2307/2346830
Hobday A. J., Young J. W., Moeseneder C., Dambacher J. M. (2011). Defining dynamic pelagic habitats in oceanic waters off eastern Australia. Deep Sea Res. Part II: Topical Stud. Oceanography 58 (5), 734–745. doi: 10.1016/j.dsr2.2010.10.006
Hogg N. G., Johns W. E. (1995). Western Boundary currents. Rev. Geophysics 33 (S2), 1311–1334. doi: 10.1029/95rg00491
Huang Z., Feng M., Beggs H., Wijffels S., Cahill M., Griffin C. (2021). High-resolution marine heatwave mapping in Australasian waters using himawari-8 SST and SSTAARS data. Remote Sens. Environ. 267 (12), 112742. doi: 10.1016/j.rse.2021.112742
Hu S., Sprintall J., Guan C., McPhaden M. J., Wang F., Hu D., et al. (2020). Deep-reaching acceleration of global mean ocean circulation over the past two decades. Am. Assoc. Advancement Sci. 6 (6), eaax7727. doi: 10.1126/sciadv.aax7727
Imawaki S., Bower A. S., Beal L., Qiu B. (2013). “Chapter 13 - Western boundary currents,” in (Eπιμ.) Ocean circulation and climate. Eds. Siedler G., Griffies S. M., Gould J., Church J. A. The Boulevard, Langford Lane, Kidlington, Oxford OX5 1GB, UK Radarweg 29, PO Box 211, 1000 AE Amsterdam, The Netherlands, (σσ. 305–338). doi: 10.1016/B978-0-12-391851-2.00013-1
Johnson C. R., Banks S. C., Barrett N. S., Cazassus F., Dunstan P. K., Edgar G. J., et al. (2011). Climate change cascades: Shifts in oceanography, species’ ranges and subtidal marine community dynamics in eastern Tasmania. J. Exp. Mar. Biol. Ecol. 400 (1), 17–32. doi: 10.1016/j.jembe.2011.02.032
Kavanaugh M. T., Hales B., Saraceno M., Spitz Y. H., White A. E., Letelier R. M. (2014). Hierarchical and dynamic seascapes: A quantitative framework for scaling pelagic biogeochemistry and ecology. Prog. Oceanography 120, 291–304. doi: 10.1016/j.pocean.2013.10.013
Kavanaugh M. T., Oliver M. J., Chavez F. P., Letelier R. M., Muller-Karger F. E., Doney S. C. (2016). Seascapes as a new vernacular for pelagic ocean monitoring, management and conservation. ICES J. Mar. Sci. 73 (7), 1839–1850. doi: 10.1093/icesjms/fsw086
Kelly P., Clementson L., Davies C., Corney S., Swadling K. (2016). Zooplankton responses to increasing sea surface temperatures in the southeastern Australia global marine hotspot. Estuar. Coast. Shelf Sci. 180, 242–257. doi: 10.1016/j.ecss.2016.07.019
Koslow J. A. (2009). The role of acoustics in ecosystem-based fishery management. ICES J. Mar. Sci. 66 (6), 966–973. doi: 10.1093/icesjms/fsp082
Larsson M. E., Laczka O. F., Suthers I. M., Ajani P. A., Doblin M. A. (2018). Hitchhiking in the East Australian current: rafting as a dispersal mechanism for harmful epibenthic dinoflagellates. Mar. Ecol. Prog. Ser. 596, 49–60. doi: 10.3354/meps12579
Lévy M., Ferrari R., Franks P. J. S., Martin A. P., Rivière P. (2012). Bringing physics to life at the submesoscale. Geophysical Res. Lett. 39 (14), L14602. doi: 10.1029/2012gl052756
Li J., Roughan M., Kerry C. (2021). Dynamics of interannual eddy kinetic energy modulations in a Western boundary current. Geophysical Res. Lett. 48 (19), e2021GL094115. doi: 10.1029/2021gl094115
Li J., Roughan M., Kerry C. (2022a). Variability and drivers of ocean temperature extremes in a warming Western boundary current. J. Climate 35 (3), 1097–1111. doi: 10.1175/JCLI-D-21-0622.1
Li J., Roughan M., Kerry C. (2022b). Drivers of ocean warming in the western boundary currents of the southern hemisphere. Nat. Clim. Change press. 12. doi: 10.1038/s41558-022-01473-8
Luick J. L., Ka¨se R., Tomczak M. (1994). On the formation and spreading of the bass strait cascade. Continental Shelf Res. 14 (4), 385–399. doi: 10.1016/0278-4343(94)90025-6
Maclennan D. (2002). A consistent approach to definitions and symbols in fisheries acoustics. ICES J. Mar. Sci. 59 (2), 365–369. doi: 10.1006/jmsc.2001.1158
Malan N., Roughan M., Kerry C. (2021). The rate of coastal temperature rise adjacent to a warming Western boundary current is nonuniform with latitude. Geophysical Res. Lett. 48 (3), e2020GL090751. doi: 10.1029/2020gl090751
Mardia K. V., Kent J. T., Bibby J. M. (1979). Multivariate analysis, London (84 Theobald's Road, London, United Kingdom: Academic Press).
Marquet P. A., Fortin M.-J., Pineda J., Wallin D. O., Clark J., Wu Y., et al. (1993). Ecological and evolutionary consequences of patchiness: A marine-terrestrial perspective. Στo Lecture Notes Biomathematics 96, σσ. 277–304. doi: 10.1007/978-3-642-50155-5_19
Niella Y., Smoothey A. F., Taylor M. D., Peddemors V. M., Harcourt R. (2021). Environmental drivers of fine-scale predator and prey spatial dynamics in Sydney harbour, Australia, and adjacent coastal waters. Estuaries Coasts. 45, 1465–1479. doi: 10.1007/s12237-021-01020-2
Oke P. R., Middleton J. H. (2000). Topographically induced upwelling off Eastern Australia. J. Phys. Oceanography 30 (3), 512–531. doi: 10.1175/1520-0485(2000)030<0512:TIUOEA>2.0.CO;2
Oke P. R., Middleton J. H. (2001). Nutrient enrichment off port stephens: the role of the East Australian current. Continental Shelf Res. 21 (6), 587–606. doi: 10.1016/S0278-4343(00)00127-8
Oke P. R., Roughan M., Cetina-Heredia P., Pilo G. S., Ridgway K. R., Rykova T. (2019). Revisiting the circulation of the East Australian current: Its path, separation, and eddy field. Prog. Oceanography 176, 102139. doi: 10.1016/j.pocean.2019.102139
Oliver E. C. J., Benthuysen J. A., Bindoff N. L., Hobday A. J., Holbrook N. J., Mundy C. N., et al. (2017). The unprecedented 2015/16 Tasman Sea marine heatwave. Nat. Commun., 8. doi: 10.1038/ncomms16101
Oliver E. C. J., Benthuysen J. A., Darmaraki S., Donat M. G., Hobday A. J., Holbrook N. J., et al. (2021). Marine heatwaves. Annu. Rev. Mar. Sci. 13 (1), 313–342. doi: 10.1146/annurev-marine-032720-095144
Oliver E. C. J., Burrows T. M., Donat G. M., Gupta A. S., Alexander L. V., Perkins-Kirkpatrick S. E., et al. (2019). Projected marine heatwaves in the 21st century and the potential for ecological impact. Front. Mar. Sci., 6. doi: 10.3389/fmars.2019.00734
Phillips L. R., Carroll G., Jonsen I., Harcourt R., Brierley A. S., Wilkins A., et al. (2022). Variability in prey field structure drives inter-annual differences in prey encounter by a marine predator, the little penguin. R. Soc. Open Sci. 9, 220028. doi: 10.1098/rsos.220028
Phillips L., Carroll G., Jonsen I., Harcourt R., Roughan M. (2020). A water mass classification approach to tracking variability in the East Australian current. Front. Mar. Sci. 7. doi: 10.3389/fmars.2020.00365
Pittman S. J. (2017). Seascape ecology (111 River Street Hoboken, NJ 07030 United States: John Wiley & Sons Ltd).
Pittock B. (2003). “Climate change,” in An Australian guide to the science and potential impacts (B. pittock, Eπιμ.). (Australian greenhouse office, GPO box 621, Canberra ACT 2601: Australian greenhouse office).
Quiring K., Carroll G., Champion C., Heymann E. W., Harcourt R. (2021). The diet of greater crested terns off southeast Australia varies with breeding stage and sea surface temperature. Mar. Biol. 168 (9). doi: 10.1007/s00227-021-03947-3
Receveur A., Menkes C., Allain V., Lebourges-Dhaussy A., Nerini D., Mangeas M., et al. (2020). Seasonal and spatial variability in the vertical distribution of pelagic forage fauna in the southwest pacific. Deep Sea Res. Part II: Topical Stud. Oceanography 175, 104655. doi: 10.1016/j.dsr2.2019.104655
Ridgway K. R. (2007). Long-term trend and decadal variability of the southward penetration of the East Australian current. Geophysical Res. Lett. 34 (13), 345–365. doi: 10.1029/2007GL030393
Ridgway K. R., Godfrey J. S. (1994). Mass and heat budgets in the East Australian current: A direct approach. J. Geophysical Res. 99 (C2), 3231. doi: 10.1029/93jc02255
Roughan M., Cetina-Heredia P., Ribbat N., Suthers I. M. (2022). Shelf transport pathways adjacent to the East Australian current reveal sources of productivity for coastal reefs. Front. Mar. Sci., 8. doi: 10.3389/fmars.2021.789687
Roughan M., Keating S. R., Schaeffer A., Heredia P. C., Rocha C., Griffin D., et al. (2017). A tale of two eddies: The biophysical characteristics of two contrasting cyclonic eddies in the East Australian current system. J. Geophysical Research: Oceans 122 (3), 2494–2518. doi: 10.1002/2016JC012241
Roughan M., Schaeffer A., Suthers I. M. (2015). “Chapter 6-Sustained Ocean observing along the coast of southeastern Australia: NSW-IMOS 2007-2014,” in Coastal Ocean Observing Systems, eds Liu Y., Kerkering H., Weisberg R. H. (Boston, MA: Academic Press), 76–98.
Roughan M., Middleton J. H. (2002). A comparison of observed upwelling mechanisms off the east coast of Australia. Continental Shelf Res. 22 (17), 2551–2572. doi: 10.1016/s0278-4343(02)00101-2
Roughan M., Middleton J. H. (2004). On the East Australian current: Variability, encroachment, and upwelling. J. Geophysical Research: Oceans 109 (C7), 532–545. doi: 10.1029/2003JC001833
Schaeffer A., Gramoulle A., Roughan M., Mantovanelli A. (2017). Characterizing frontal eddies along the East Australian current from HF radar observations. J. Geophysical Research: Oceans 122 (5), 3964–3980. doi: 10.1002/2016JC012171
Schaeffer A., Roughan M., Wood J. E. (2014). Observed bottom boundary layer transport and uplift on the continental shelf adjacent to a western boundary current. J. Geophysical Research: Oceans 119 (8), 4922–4939. doi: 10.1002/2013JC009735
Stommel H. (1963). Varieties of oceanographic experience. Science 139 (3555), 572–576. doi: 10.1126/science.139.3555.572
Suryan R., Santora J., Sydeman W. (2012). New approach for using remotely sensed chlorophyll a to identify seabird hotspots. Mar. Ecol. Prog. Ser. 451, 213–225. doi: 10.3354/meps09597
Suthers I. M., Young J. W., Baird M. E., Roughan M., Everett J. D., Brassington G. B., et al. (2011). The strengthening East Australian current, its eddies and biological effects — an introduction and overview. Deep Sea Res. Part II: Topical Stud. Oceanography 58 (5), 538–546. doi: 10.1016/j.dsr2.2010.09.029
Thompson P. A., Baird M. E., Ingleton T., Doblin M. A. (2009). Long-term changes in temperate Australian coastal waters: implications for phytoplankton. Mar. Ecol. Prog. Ser. 394, 1–19. doi: 10.3354/meps08297
Thresher R., Proctor C., Ruiz G., Gurney R., MacKinnon C., Walton W., et al. (2003). Invasion dynamics of the European shore crab, carcinus maenas, in Australia. Mar. Biol. 142 (5), 867–876. doi: 10.1007/s00227-003-1011-1
Vergés A., Steinberg P. D., Hay M. E., Poore A. G. B., Campbell A. H., Ballesteros E., et al. (2014). The tropicalization of temperate marine ecosystems: climate-mediated changes in herbivory and community phase shifts. Proc. R. Soc. B: Biol. Sci. 281 (1789), 20140846. doi: 10.1098/rspb.2014.0846
Wood S. N., Pya N., Saefken B. (2016). Smoothing parameter and model selection for general smooth models. J. Am. Stat. Assoc. 111 (516), 1548–1575. doi: 10.1080/01621459.2016.1180986
Wu L., Cai W., Zhang L., Nakamura H., Timmermann A., Joyce T., et al. (2012). Enhanced warming over the global subtropical western boundary currents. Nat. Climate Change 2 (3), 161–166. doi: 10.1038/nclimate1353
Yang H., Lohmann G., Krebs-Kanzow U., Ionita M., Shi X., Sidorenko D., et al. (2020). Poleward shift of the major ocean gyres detected in a warming climate. Geophysical Research Letters 47 (5), e2019GL085868. doi: 10.1029/2019gl085868
Yasuda I., Sugisaki H., Watanabe Y., Minobe S., Oozeki Y. (1999). Interdecadal variations in Japanese sardine and ocean/climate. Fisheries Oceanography 8 (1), 18–24. doi: 10.1046/j.1365-2419.1999.00089.x
Yu L., Weller R. A. (2007). Objectively analyzed Air\textendashSea heat fluxes for the global ice-free oceans, (1981\textendash2005). Bull. Am. Meteorological Soc. 88 (4), 527–540. doi: 10.1175/bams-88-4-527
Keywords: seascape, East Australian Current Extension, climate change, coastal processes, marine ecosystems, spatiotemporal variability, active acoustics
Citation: Phillips LR, Malan N, Roughan M, Harcourt R, Jonsen I, Cox M, Brierley AS, Slip D, Wilkins A and Carroll G (2022) Coastal seascape variability in the intensifying East Australian Current Southern Extension. Front. Mar. Sci. 9:925123. doi: 10.3389/fmars.2022.925123
Received: 21 April 2022; Accepted: 01 September 2022;
Published: 21 September 2022.
Edited by:
Tim Rixen, Leibniz Centre for Tropical Marine Research (LG), GermanyReviewed by:
Zhi Huang, Geoscience Australia, AustraliaCopyright © 2022 Phillips, Malan, Roughan, Harcourt, Jonsen, Cox, Brierley, Slip, Wilkins and Carroll. This is an open-access article distributed under the terms of the Creative Commons Attribution License (CC BY). The use, distribution or reproduction in other forums is permitted, provided the original author(s) and the copyright owner(s) are credited and that the original publication in this journal is cited, in accordance with accepted academic practice. No use, distribution or reproduction is permitted which does not comply with these terms.
*Correspondence: Lachlan R. Phillips, bGFjaGxhbi5waGlsbGlwc0BoZHIubXEuZWR1LmF1; Robert Harcourt, cm9iZXJ0LmhhcmNvdXJ0QG1xLmVkdS5hdQ==
†ORCID: Moninya Roughan, https://orcid.org/0000-0003-3825-7533
Disclaimer: All claims expressed in this article are solely those of the authors and do not necessarily represent those of their affiliated organizations, or those of the publisher, the editors and the reviewers. Any product that may be evaluated in this article or claim that may be made by its manufacturer is not guaranteed or endorsed by the publisher.
Research integrity at Frontiers
Learn more about the work of our research integrity team to safeguard the quality of each article we publish.