 Deuk Jae Hwang
 Robert Frouin
 Jing Tan
 Jae-Hyun Ahn
 Jong-Kuk Choi
 Jeong-Eon Moon1
- 1Korea Ocean Satellite Center, Korea Institute of Ocean Science & Technology, Busan, South Korea
- 2Ocean Science, University of Science and Technology, Daejeon, South Korea
- 3Climate Atmospheric Science and Physical Oceanography (CASPO), Scripps Institution of Oceanography, University of California (UC), San Diego, CA, United States
Photosynthetically available radiation (PAR) reaching the ocean surface controls phytoplankton growth, primary productivity, and evolution within marine ecosystems. Therefore, accurate daily PAR estimates are important for a broad range of marine biology and biogeochemistry applications. In this study, hourly data from Geostationary Ocean Color Imager (GOCI), the world’s first geostationary ocean color sensor, was employed to estimate daily mean PAR at the ocean surface around the Korean Peninsula using a budget model based on plane-parallel theory. In situ PAR data collected from two ocean research stations (Socheong-cho and Ieodo) were used to evaluate the accuracy of the GOCI PAR estimates. First, the instantaneous in situ measurements were checked for calibration and exposure errors against Second Simulation of the Satellite Signal in the Solar Spectrum (6S) radiative transfer calculations under the clearest sky conditions and adjusted to eliminate biases. After adjustment, the root-means-square error (RMSE) between 6S and in situ PAR data was reduced from 6.08 (4.81%) and 3.82 (3.93%) mol/m2/day to 2.85 (2.26%) and 1.74 (1.21%) mol/m2/day at the Socheong-cho and Ieodo stations, respectively, and the coefficient of determination R2 was 0.99. Then, the GOCI daily mean PAR estimated by the initial algorithm were corrected using the 2015 adjusted in situ daily PAR measurements collected under clear-sky conditions. The daily mean PAR values derived from GOCI data in all conditions were improved after the correction, with RMSE reduced from 4.58 (8.30%) to 2.57 (4.65%) mol/m2/day and R2 = 0.97. The comparison statistics were similar for 2015 and 2016 combined, with RMSE of 2.52 (4.38%) and mean bias error (MBE) of –0.40 (–0.70%), indicating that the correction was also effective in cloudy conditions. On the other hand, daily PAR estimates from Moderate Resolution Imaging Spectroradiometer (MODIS) and Advanced Himawari Imager (AHI) yielded larger RMSE of 6.24 (10.40%) mol/m2/day and MBE of –2.49 (–4.15%) mol/m2/day (MODIS) and RMSE of 3.71 (6.51%) mol/m2/day and MBE of –2.65 (–4.65%) mol/m2/day (AHI) against in situ measurements. The GOCI-based daily PAR model developed in this study is reliable and suitable for investigating the marine environment around the Korean Peninsula.
Introduction
Primary production (PP) plays a key role in energy circulation in marine environments, particularly in regulating marine ecosystem food webs (Lindeman, 1942; Siegel et al., 2014). The main source for PP is the photosynthetically available radiation (PAR), which is the solar flux within the spectral range of 400–700 nm (Kirk, 2010). PAR is among the most important factors influencing phytoplankton growth, allowing the synthesis of organic matter from inorganic matter via photosynthesis. It is the main variable of PP estimation models such as the Carnegie Ames Stanford Approach and Vertical General Production Model, where the PAR and PP tend to be linearly correlated (Potter and Randerson, 1993; Behrenfeld and Falkowski, 1997).
PAR also influences the diurnal vertical migration of phytoplankton. On a daily basis, dinoflagellates containing photosynthetic pigments, including harmful algal species, can move within the euphotic zone to reach optimal conditions for survival based on variation in available solar flux and temperature (Donkor and Häder, 1991; Gerber and Häder, 1993; Richter et al., 2007). In particular, Margalefidinium (previously Cochlodinium) polykrikoides, a dinoflagellate species that causes harmful algal blooms (HABs) around the Korean Peninsula in summer and early autumn, migrates upward to the ocean surface during the day and sink to depths below 10 m at night, indicating that PAR affects phytoplankton habitat use (Kim et al., 2010; Oh et al., 2010). PAR can also trigger HABs (Kim et al., 2016a).
Therefore, accurate PAR calculations are required to monitor marine ecosystems. PAR is traditionally estimated using laboratory experiments or radiative transfer models (Smith and Baker, 1986; Baker and Frouin, 1987; Campbell and Aarup, 1989). Such studies have focused on the development of PAR models and calculating changes in ocean PAR with water depth; however, analyzing two-dimensional (2D) changes in PAR at the ocean surface remains challenging. To overcome the spatiotemporal limits of traditional PAR models, direct estimates based on satellite remote sensing have become increasingly common. Frouin and Pinker (1995) developed a general PAR algorithm based on cloud/surface albedo using global satellite data from the International Satellite Cloud Climatology Project and they estimated global monthly PAR at the study. However, the model was insufficiently validated with in situ measurement data due to differences in resolution between the observation datasets. Bouvet et al. (2002) developed an algorithm to estimate monthly average global PAR under clear- and cloudy-sky conditions using satellite observation data and the outcomes of models analyzing inputs such as water vapor and aerosol optical thickness, which were derived from the Sea-viewing Wide Field-of-view Sensor (SeaWiFS), and Total Ozone Mapping Spectrometer (TOMS). Arnone et al. (1998) used radiance data from the Coastal Zone Color Scanner (CZCS), an ocean color sensor, to estimate monthly PAR in the Arabian Sea. These studies show a high determination coefficient, R2, with in situ information on the light field influencing biological growth and PP (R2>0.95). However, their data had insufficient spatiotemporal resolution for small-scale analysis, as required for investigating basin-scale or daily changes at the ocean surface. An algorithm based on plane-parallel theory to calculate daily PAR using SeaWiFS data was developed by Frouin et al. (2003). Carder et al. (2003) calculated atmospheric transmittance and instantaneous PAR using Moderate Resolution Imaging Spectroradiometer (MODIS) data. Frouin and Murakami (2007) estimated global daily oceanic PAR using the Global Imager (GLI) and compared their results with those derived using SeaWiFS. In situ measurement data and PAR models have been used to evaluate daily sea-surface PAR values obtained from sun-synchronous orbit sensors such as MODIS and SeaWiFS (Laliberté et al., 2016; Somayajula et al., 2018). These PAR models had R2 values of about 0.90 against observation data but more than 20% relative root-mean-square difference (rRMSD) and bias at daily PAR level. Due to their sun-synchronous orbits, these satellite sensors have limited revisit times; therefore, daily PAR estimates are extrapolated from only one or two images captured instantaneously during each day, which may increase estimate uncertainties due to diurnal changes such as cloud motion and sea fog (Frouin and McPherson, 2012).
By contrast, satellite sensors with a geostationary orbit may be able to produce more accurate estimates of daily PAR, because they collect many images of the same area in a single day and therefore have higher temporal resolution (Choi et al., 2012a; Ryu et al., 2012). The first geostationary ocean color satellite sensor, Geostationary Ocean Color Imager (GOCI), is operated by the Korea Institute of Ocean Science and Technology (KIOST) and produces ocean surface environment data such as the concentration of total suspended sediments, absorption coefficient of colored dissolved organic matter, and chlorophyll-a content (Wang et al., 2013). Suspended sediment dynamics, HAB growth, and current movement around the Korean Peninsula have been evaluated using GOCI (Choi et al., 2014a; Choi et al., 2014b; Yang et al., 2014). Daily PAR data have not yet been generated as an official GOCI product, although a few studies have attempted to develop methods for calculating daily PAR from GOCI data. Frouin and McPherson (2012) developed a daily PAR model for GOCI based on their algorithm for MODIS and SeaWiFS data but did not validate their results using in situ measurement data. Kim et al. (2016b) used the Frouin and McPherson (2012) algorithm and partially verified GOCI-derived daily PAR estimates through comparison with a limited set of in situ measurement data. In this study, we estimated GOCI-derived daily PAR at the ocean surface using a similar algorithm and compared it with in situ observations measured at two locations, in the mid-western and southern Korean Peninsula, and with data obtained by MODIS and Advanced Himawari Imager (AHI) sensors. Although GOCI collects images hourly, daily PAR observations are more effective than hourly PAR observations for estimating daily PP when combined with satellite-based sea surface temperature (SST) data on a daily basis, hence our focus on a daily PAR.
Materials and methods
The daily PAR model used in this study was modified from the model developed by Frouin and McPherson (2012). The models structure is the same in Frouin and McPherson (2012); Kim et al. (2016b), and in this study. In the previous studies, climatology was used to calculate atmospheric functions (clear sky atmospheric transmittances and reflectance). Here, reanalysis data was used instead. This is the main difference with the previous PAR model. Adjustment of in situ measurements was also made, and a clear sky correction was carried out. In addtion, the observation period of the in situ data was much longer than in Kim et al. (2016b) and included PAR seasonal variations.
Algorithm Description
The model is based on plane-parallel theory and assumes that the effects of clouds and other atmospheric constituents could be decoupled. The model considers two layers above the ocean surface, an upper clear atmosphere layer and a lower cloud/surface layer. Solar flux undergoes several processes before reaching the ocean surface. First, the original solar irradiance, E0, enters the atmosphere at the solar zenith angle θs. Next, the penetrating solar irradiance, E0 cos(θs), is attenuated by gaseous absorption (essentially due to ozone) and scattering by the clear atmosphere. As the remaining flux passes through the cloud layer and surface, it is further reduced by the albedo of the cloud/surface system (A). Finally, the solar flux arriving at the ocean surface is estimated from the flux that penetrates the surface by excluding the fraction reflected by the ocean surface, AS. This approach was validated by Dedieu et al. (1987) and Frouin and Chertock (1992) and does not require the identification of each pixel as either clear or cloudy. Thus, PAR at the ocean surface (E) is estimated as follows:
where Td and Tg are the clear-sky diffuse transmittance and gaseous transmittance, respectively, such that Td is due to scattering by molecules and aerosols, and Tg is due to absorption by ozone, and Sa is the spherical albedo of the clear atmosphere (model upper layer).
Radiance data, viewing geometry, and coordinate information for each pixel that is necessary to calculate solar geometry are required to calculate PAR using GOCI data. The pixel radiance of each band was calculated from GOCI L1B images. Viewing angles (zenith, azimuth) and coordinate information were extracted from GOCI L2P images. L2P images were generated from L1B images using the GOCI Data Processing System, version 1.3.Atmospheric conditions such as aerosol properties were obtained from Modern-Era Retrospective analysis for Research and Applications version 2 (MERRA-2) hourly data interpolated to the GOCI spatial grid. Atmospheric functions were used to calculate gaseous and aerosol transmittance.
GOCI has six bands within a wavelength range of 400–700 nm. To calculate daily PAR for each pixel, GOCI bidirectional radiance images from each band were first transformed into a GOCI reflectance image. Cloud/surface system reflectance (ρ) obtained after correcting the GOCI reflectance for gaseous absorption and atmospheric scattering was generated from the reflectance of each band. Then, A was calculated as follows:
where ocean surface albedo (As) is a function of the solar zenith angle and optical thickness at 500 nm (Jin et al., 2004) and F is a cloud bidirectional correction factor independent of wavelength that is applied to ρ–As to isolate the effect of clouds on A. Other variables generated from GOCI hourly data over a period of 1 day were averaged over bands 1–6. PAR calculated from hourly GOCI images was integrated from sunrise to sunset and normalized by the length of the day (24 h) to obtain daily mean PAR via the simple trapezoidal rule. For more details, see Frouin and McPherson (2012).
Daily PAR values were not calculated from GOCI data from November to January, when solar zenith angles were > 75°. To estimate the reflectance of the clear atmosphere, the PAR model in this study employed the quasi-single scattering approximation and neglected Earth sphericity. This makes the correction of the effects of the clear atmosphere above the cloud/surface layer inaccurate at large solar zenith angles.
In situ measurements
In situ PAR measurements were collected at two ocean research stations (Socheong-cho and Ieodo) managed by KIOST and the Korea Hydrographic and Oceanographic Agency (Figure 1). Socheong-cho station (37°25’23”N, 124°44’17”E) is in the mid-eastern Yellow Sea near Gyeonggi Bay and has a semi-enclosed macro-tidal environment (Figures 1A, B). Due to bottom sediment resuspension and the large influx of suspended sediments from the Han River estuary, Gyeonggi Bay has a turbid environment and huge sand ridges (Choi et al., 2012b; Lee et al., 2013; Jahan and Choi, 2014), which result in turbid waters around Socheong-cho station. Frouin and McPherson (2012) indicated that extremely turbid waters, such as those in the Changjiang coastal region, may be interpreted as a thin cloud in estimating ocean surface PAR from space. However, water at Socheong-cho station has lower turbidity than Changjiang coastal waters and the influence of turbid water to PAR calculation was low, too. Ieodo station (32°7’22.63”N, 125°10’56.81”E) is located southeast of Jeju Island in the East China Sea (Figures 1A, C). In contrast to the western region of the East China Sea, the eastern region near Ieodo station has clear water (Beardsley et al., 1985; Milliman et al., 1985).
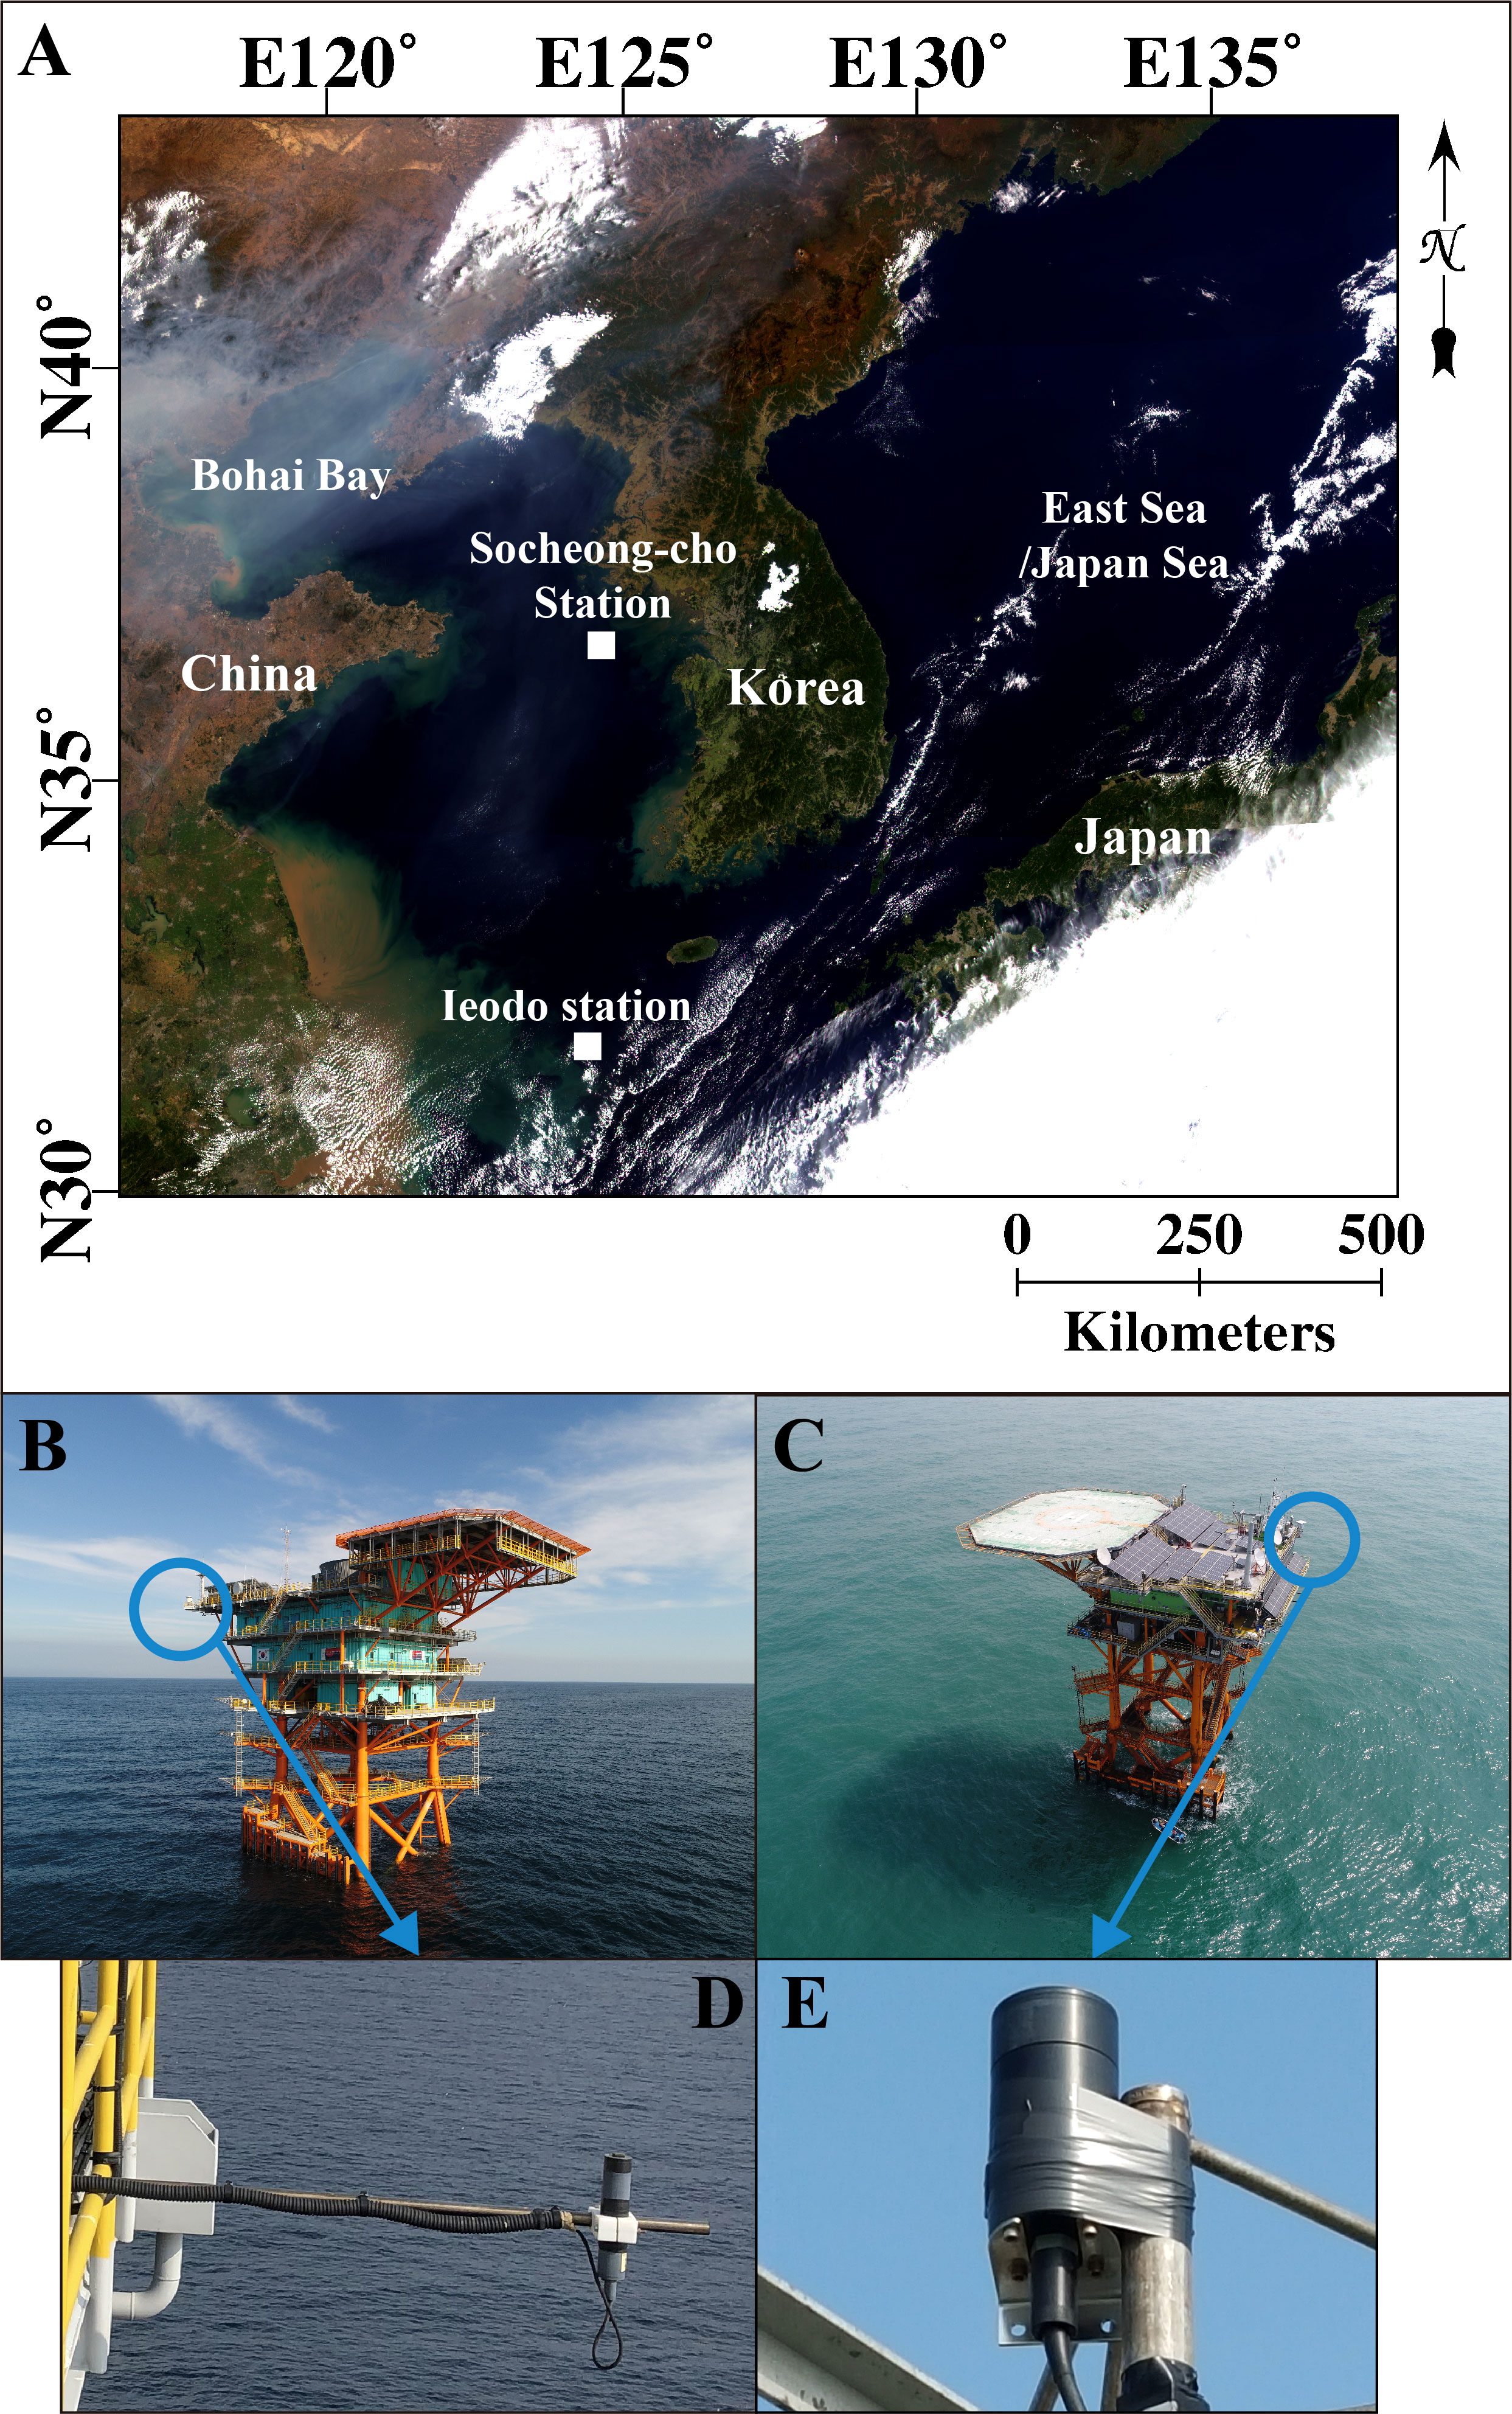
Figure 1 (A) Geostationary Ocean Color Imager (GOCI) image of the area around the Korean Peninsula (UTC 01:16:39, October 4, 2013). (B) Socheong-cho station (37°25’23.28”N, 124°44’16.94”E). (C) Ieodo station. Photosynthetically available radiation (PAR) sensors installed at (D) Socheong-cho and (E) Ieodo (32°7’22.63”N, 125°10’56.81”E) stations.
ECO-PAR sensors (WET Labs, Philomath, Oregon, USA) were installed on the upper deck of each station using an arm unit (Figures 1D, E); the sensors recorded PAR three times per second every minute for 24 h. PAR data were recorded digitally and converted into photon energy flux (µmol/m2/s) as follows:
where the factory-calibrated coefficients a0 and a1 were 4280 and 2923 at Socheong-cho, and 4098 and 2938 at Ieodo, respectively. The Unit of PAR data was changed from µmol/m2/s to mol/m2/day. The PAR measurement process is summarized in detail in Table 1. At Socheong-cho, PAR data were recorded during January–June 2015 and October 2015–April 2016. At Ieodo, data were recorded during June 2015–December 2016, excluding September–October 2015 due to telecommunication problems caused by typhoons.
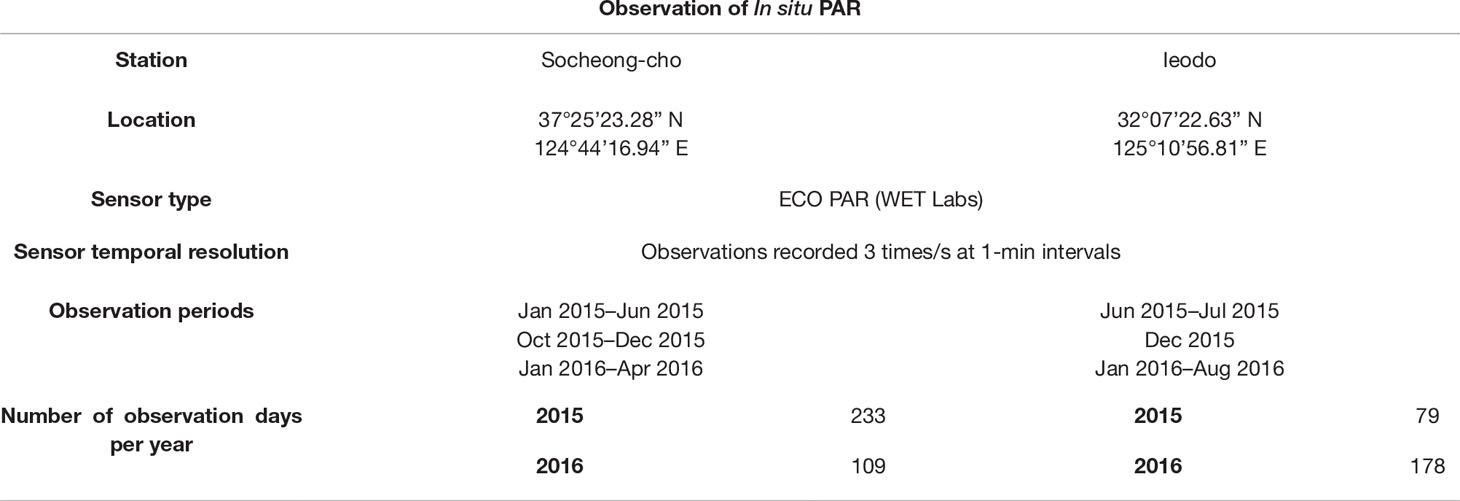
Table 1 Metadata for in situ daily PAR observations.
Before daily integration of in situ instantaneous PAR (iPAR), we compared in situ iPAR with 6S modeled iPAR to evaluate the reliability of in situ iPAR and correct eventual biases in the sensor measurements that may be due to calibration and exposure errors (e.g., due to nearby structures). 6S modeled data were previously compared with in situ data and exhibited a very high accuracy (R2 = 0.99, about 2% error) in clear sky conditions (Kotchenova et al., 2006). The model calculated iPAR for relatively clearest sky conditions (i.e., aerosol optical thickness of 0.15 at 865 nm) and low solar zenith angles (<60°) to minimize aerosol effects, based on data from two selected days at Ieodo station and 12 selected days at Socheong-cho station. In these calculations, MODIS data and associated ancillary parameters were used for aerosol properties, chlorophyll-a concentration, wind speed, and ozone and water vapor contents, which were assumed to be constant during the day.
Time series of daily PAR data measured at both stations during 2015 and 2016 are shown in Figure 2. Seasonal variation was prominent, with large short-term variation due to frequent atmospheric perturbations. In 2015, daily PAR increased until August and then decreased to < 20 mol/m2/day from mid-October to early February at both stations. When the cloudiness was thick, daily PAR calculated from in situ measurements approached only about 3 mol/m2/day. Statistics from in situ daily PAR measurements are shown in Table 2. Autumn had the lowest mean daily PAR value while summer showed the highest value. Standard deviation was the highest in spring, meaning that heavy cloudy days appeared frequently during this season.
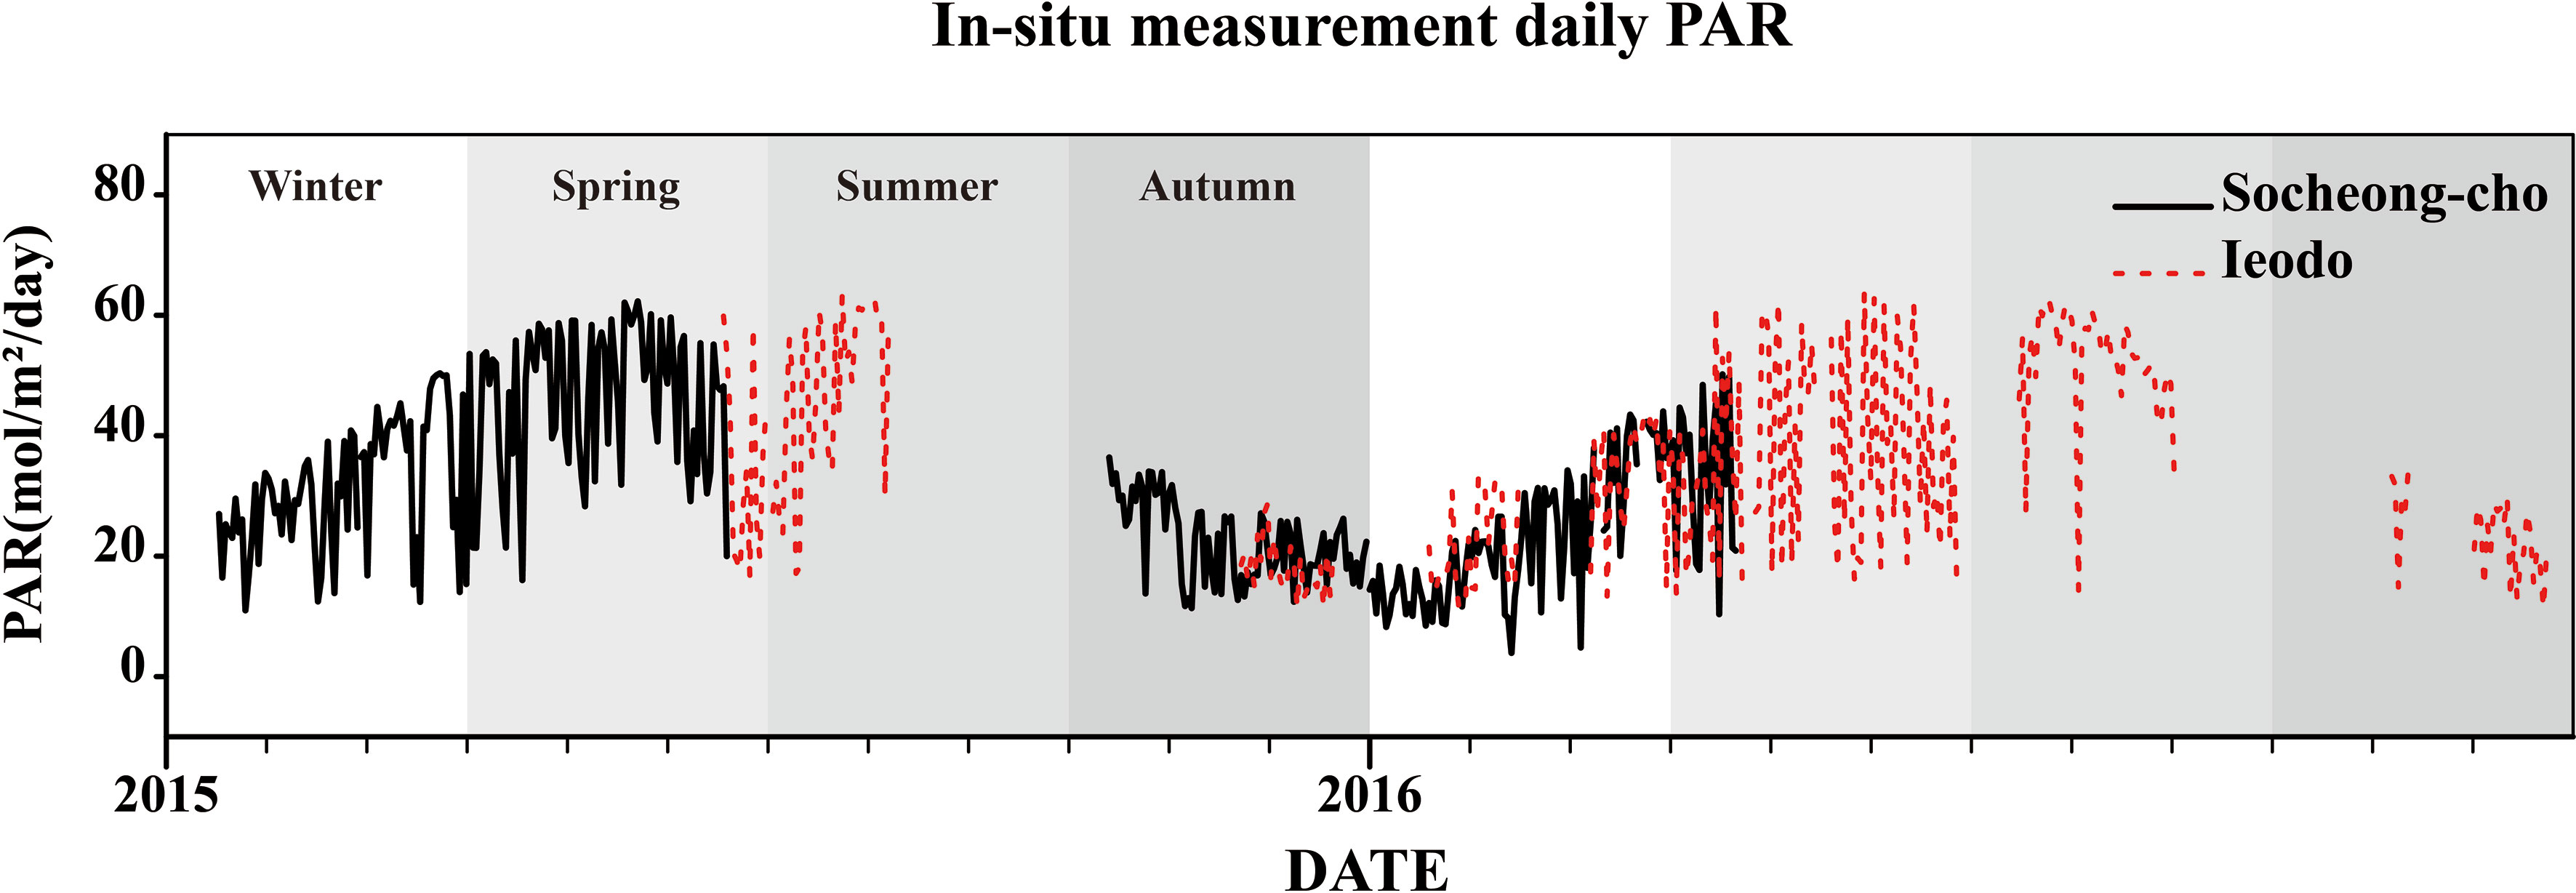
Figure 2 Daily PAR measured in situ at Socheong-cho and Ieodo stations in 2015 and 2016.
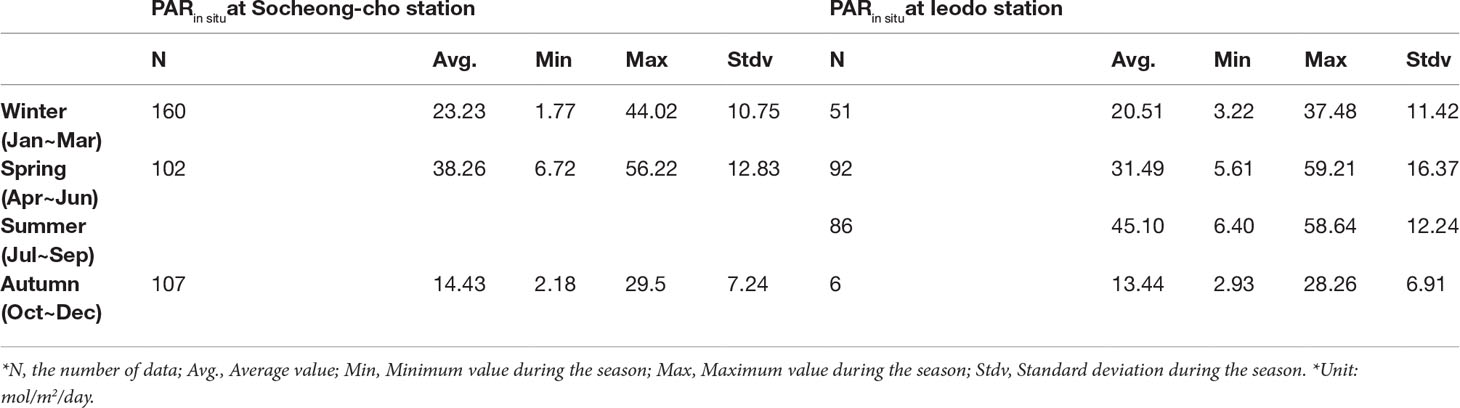
Table 2 Seasonal statistics from in situ measurement daily PAR.
Satellite data
The GOCI observation area is 2500 km × 2500 km, with center coordinates of 36°N, 130°E. GOCI covers Korea, Japan, the eastern coast of China, and parts of the northern coast of Taiwan. Images are received eight times per day at hourly intervals from 00:15 GMT to 07:45 GMT and have a 500 m spatial resolution. GOCI has six visible bands centered at 412, 443, 490, 555, 660, and 680 nm (Ryu et al., 2012), from which daily PAR data are computed.
MODIS is a sensor in sun-synchronous orbit onboard the Terra and Aqua platforms. Thus, the daily PAR product for the Korean peninsula is estimated twice per day. To compare these data with those obtained using other sensors, we merged PAR images obtained by both sensors. Daily PAR data were collected from MODIS L3 daily PAR images that are available on the National Aeronautics and Space Administration (NASA) Ocean Biology Processing Group (OBPG) ocean color website. MODIS daily PAR data were calculated according to Frouin et al. (2003) from data acquired in spectral bands that do not saturate over clouds. The spatial resolution of the MODIS daily mean PAR data is 4.6 km at the equator (equal-angle grid). MODIS daily PAR estimates were validated by Frouin et al. (2012) using data measured in situ, yielding determination coefficients (R2) of 0.88 and 0.86 and root-means-square errors (RMSE) of 6.28 and 6.77 mol/m2/day for the Terra and Aqua sensors, respectively.
Himawari-8/9 are geostationary satellites developed to observe the meteorological environment around Japan using Advanced Himawari Imager (AHI) sensors with a temporal resolution of ~2.5 min and spatial resolution of 0.5–2 km depending on the spectral bands. Himawari-8/9 have a total of 16 spectral bands; the three visible bands (1, blue; 2, green; 3, red) are used to generate PAR data. Bands 1 and 2 have 1 km spatial resolution, whereas band 3 has 0.5 km resolution (Bessho et al., 2016). AHI L3 daily PAR images produced by a modified version of the Frouin et al. (2003) algorithm are provided by the Meteorological Satellite Center of the Japan Meteorological Agency with 5 km spatial resolution. AHI daily PAR data have been validated using data measured in situ (Damiani et al., 2018; Yu et al., 2019), with an R2 value of 0.92 and RMSE of 8.0 mol/m2/day.
Validation metrics
Performance was quantified using RMSE, mean bias error (MBE), and R2 values. Absolute error and relative error (%) between estimated GOCI daily PAR and in situ measurement data were calculated as follows:
These statistical variables were used to compare in situ iPAR with 6S model-based instantaneous PAR (6S iPAR) and to evaluate the performance of GOCI daily PAR. “Reference” refers to 6S iPAR and in situ daily PAR (after correction, see below), and “Estimate” refers to uncorrected in situ iPAR and GOCI daily PAR.
For clear sky correction of GOCI daily PAR, a total of 51 data points obtained during non-cloudy weather were selected from both stations, Socheong-cho and Ieodo, in 2015. Then, whole annual data from each station were used to evaluate GOCI daily PAR in 2015 and 2016, including clear sky condition data. The total number of daily PAR data points were 205 and 206 in 2015 and 2016, respectively.
Results
Evaluation against in situ measurements
After comparison between in situ iPAR and 6S modeled PAR, in situ iPAR was lower than that from 6S, and was therefore adjusted through nonlinear regression, where the regression equation had an ax2 + bx structure, with a different coefficient for each station; a and b are constants and x is the in situ PAR value (Tan et al., 2020). The 6S iPAR simulations agreed well with in situ iPAR from Socheong-cho and Ieodo stations before and after adjustment (R2 = 0.99), but the accuracy of in situ iPAR increased markedly after adjustment in terms of RMSE and MBE (Figure 3).
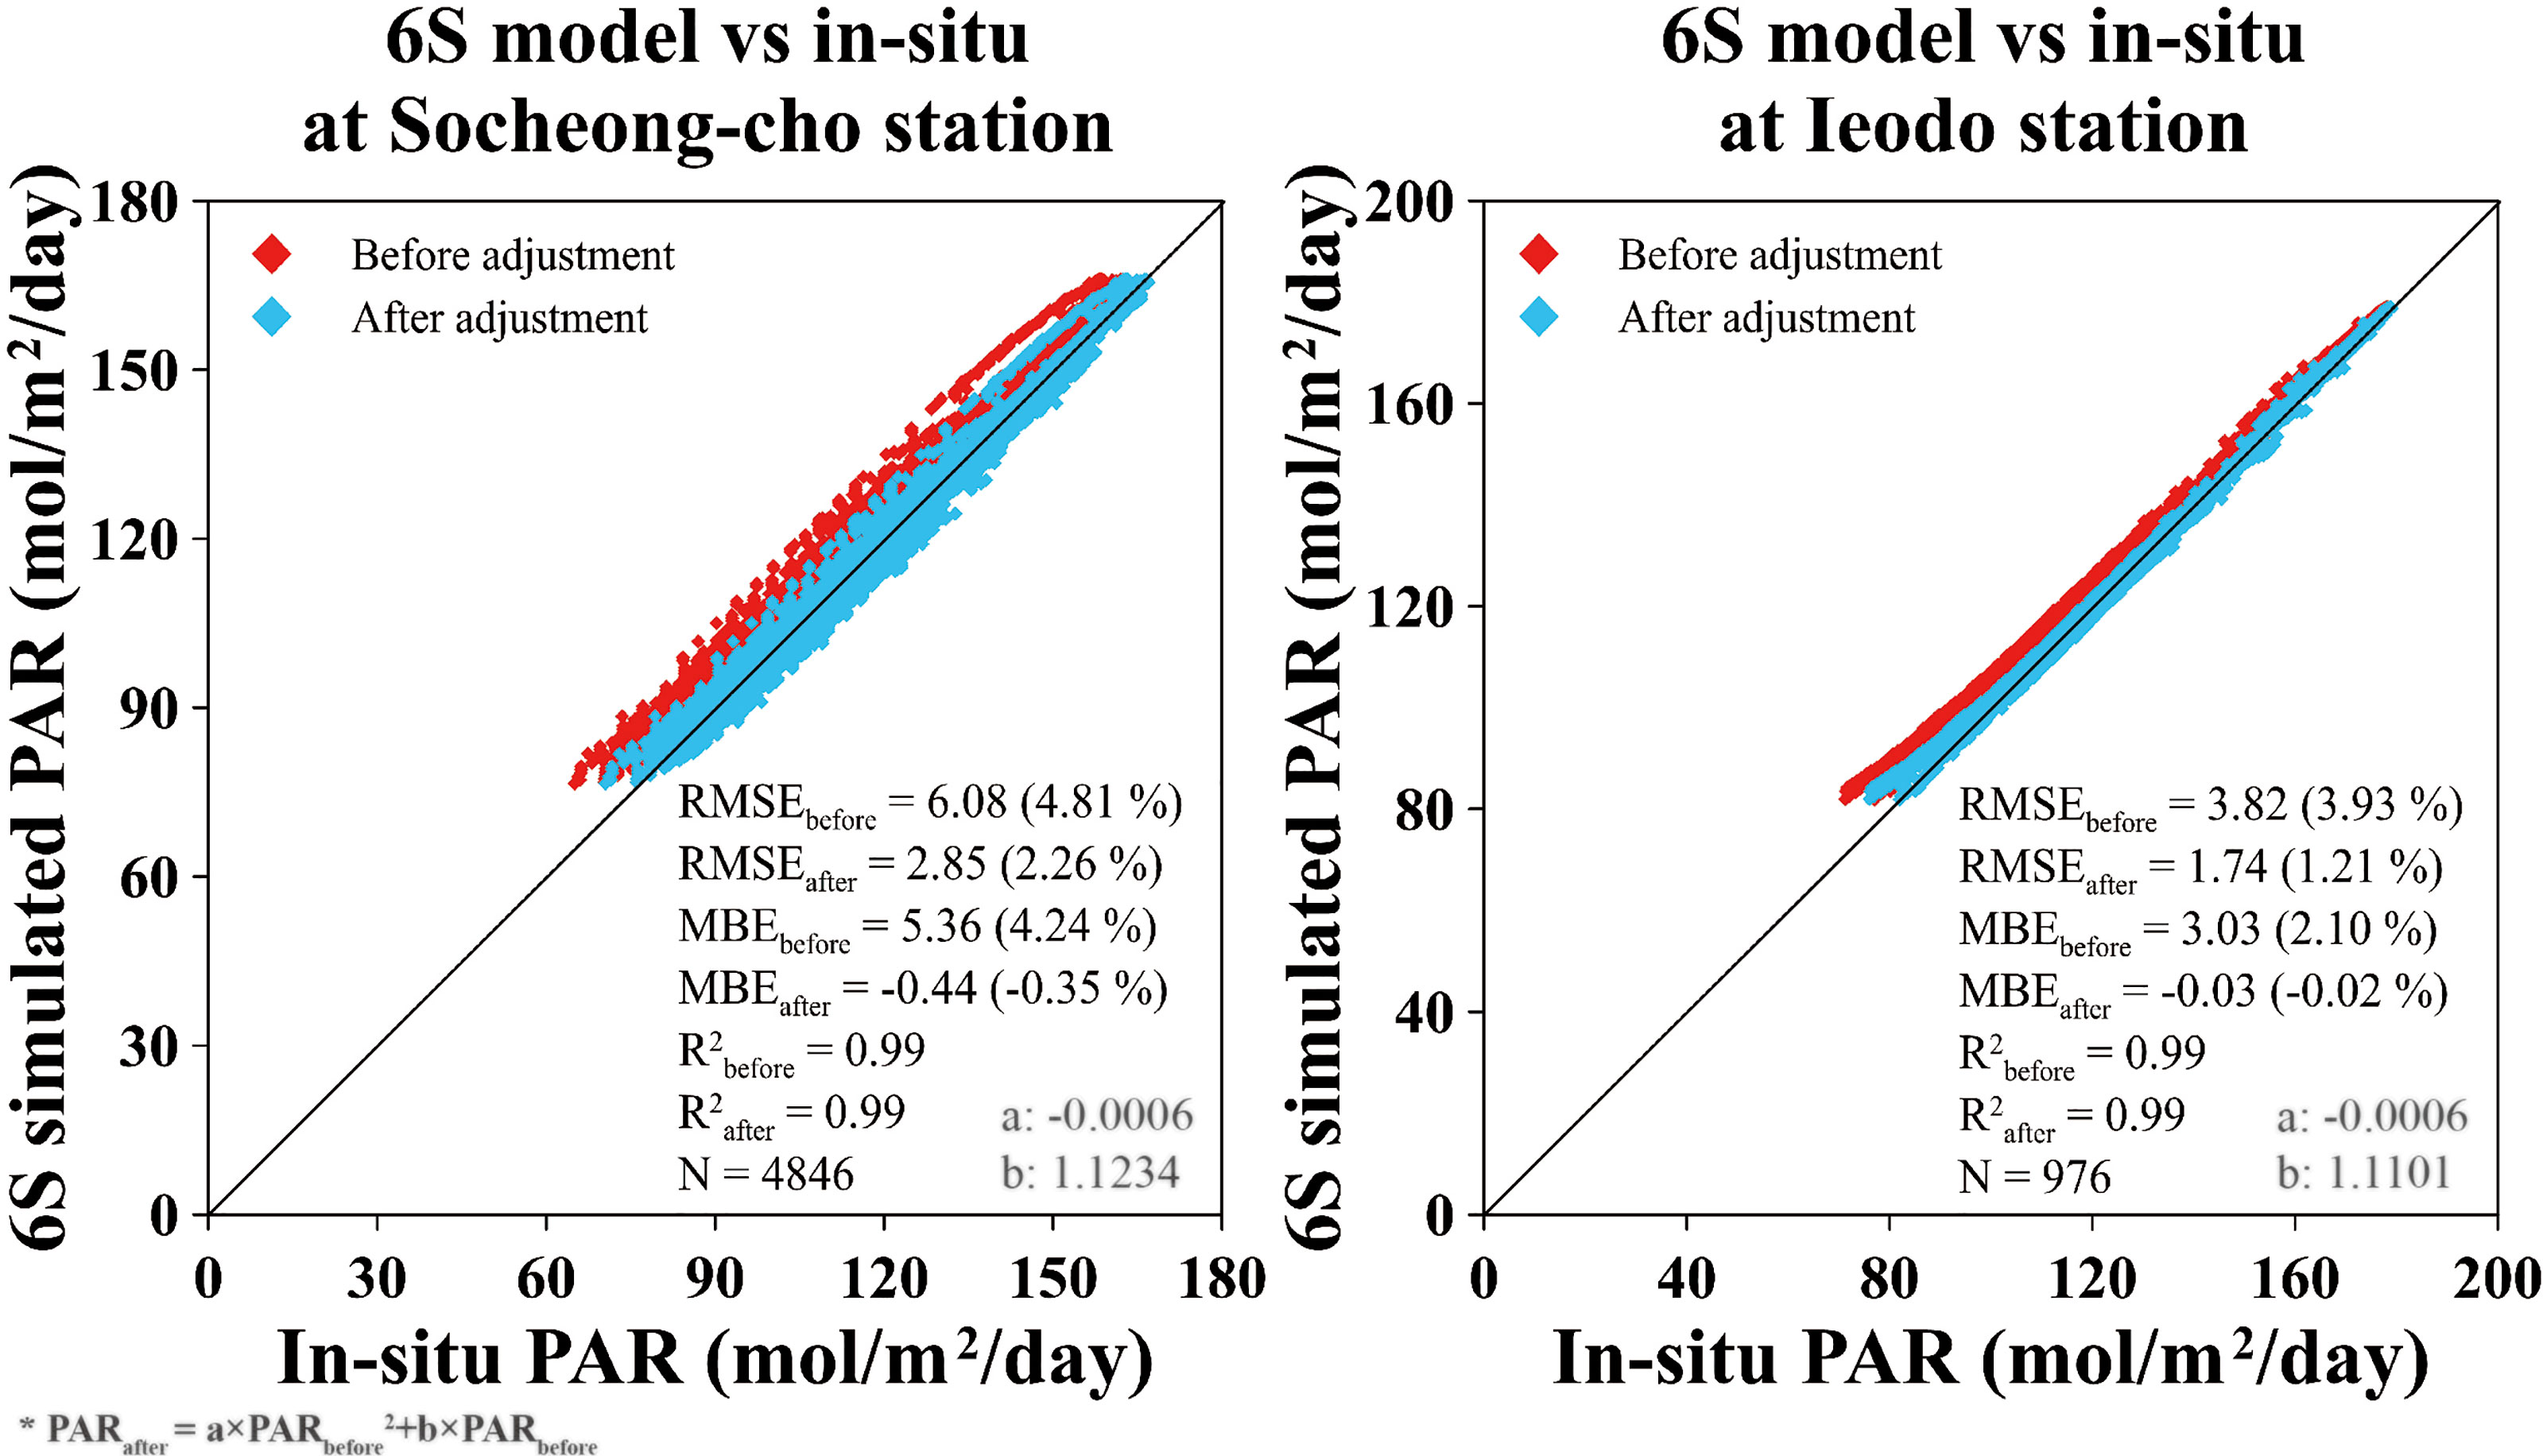
Figure 3 Comparison of in situ instantaneous PAR (in situ iPAR) and 6S model-based instantaneous PAR (6S iPAR). To minimize aerosol effects, we used only data obtained under clear skies and at low solar zenith angles (<60°).
Corrected in situ iPAR was integrated into daily PAR (PARin situ) and compared to GOCI daily PAR (PARGOCI). We expected PARGOCI to agree with PARin situ under clear sky conditions because PARGOCI should be unaffected by clouds and minimally affected by aerosols, but the PARGOCI values under those conditions were significantly higher than the in situ values. Clouds tend to decrease PAR values calculated from satellite images by increasing the albedo of the atmosphere. This PAR reduction depends on the fractional cloud coverage within GOCI pixels and the cloud optical thickness, which are highly variable. Under clear-sky conditions, PAR is affected by aerosols; however, this is a smaller effect compared to that related to solar zenith angle, which is the main factor controlling PAR variability. Differences between actual and model aerosol properties can introduce uncertainties, but these uncertainties would be minimal on average. A clear-sky correction was therefore performed to correct the bias between GOCI estimates and in situ measurements. This was accomplished using 28 and 23 clear-sky days in 2015 at Socheong-cho and Ieodo, respectively (Figure 4A). The GOCI daily PAR data were adjusted to in situ daily PAR through nonlinear regression, using the following equation:
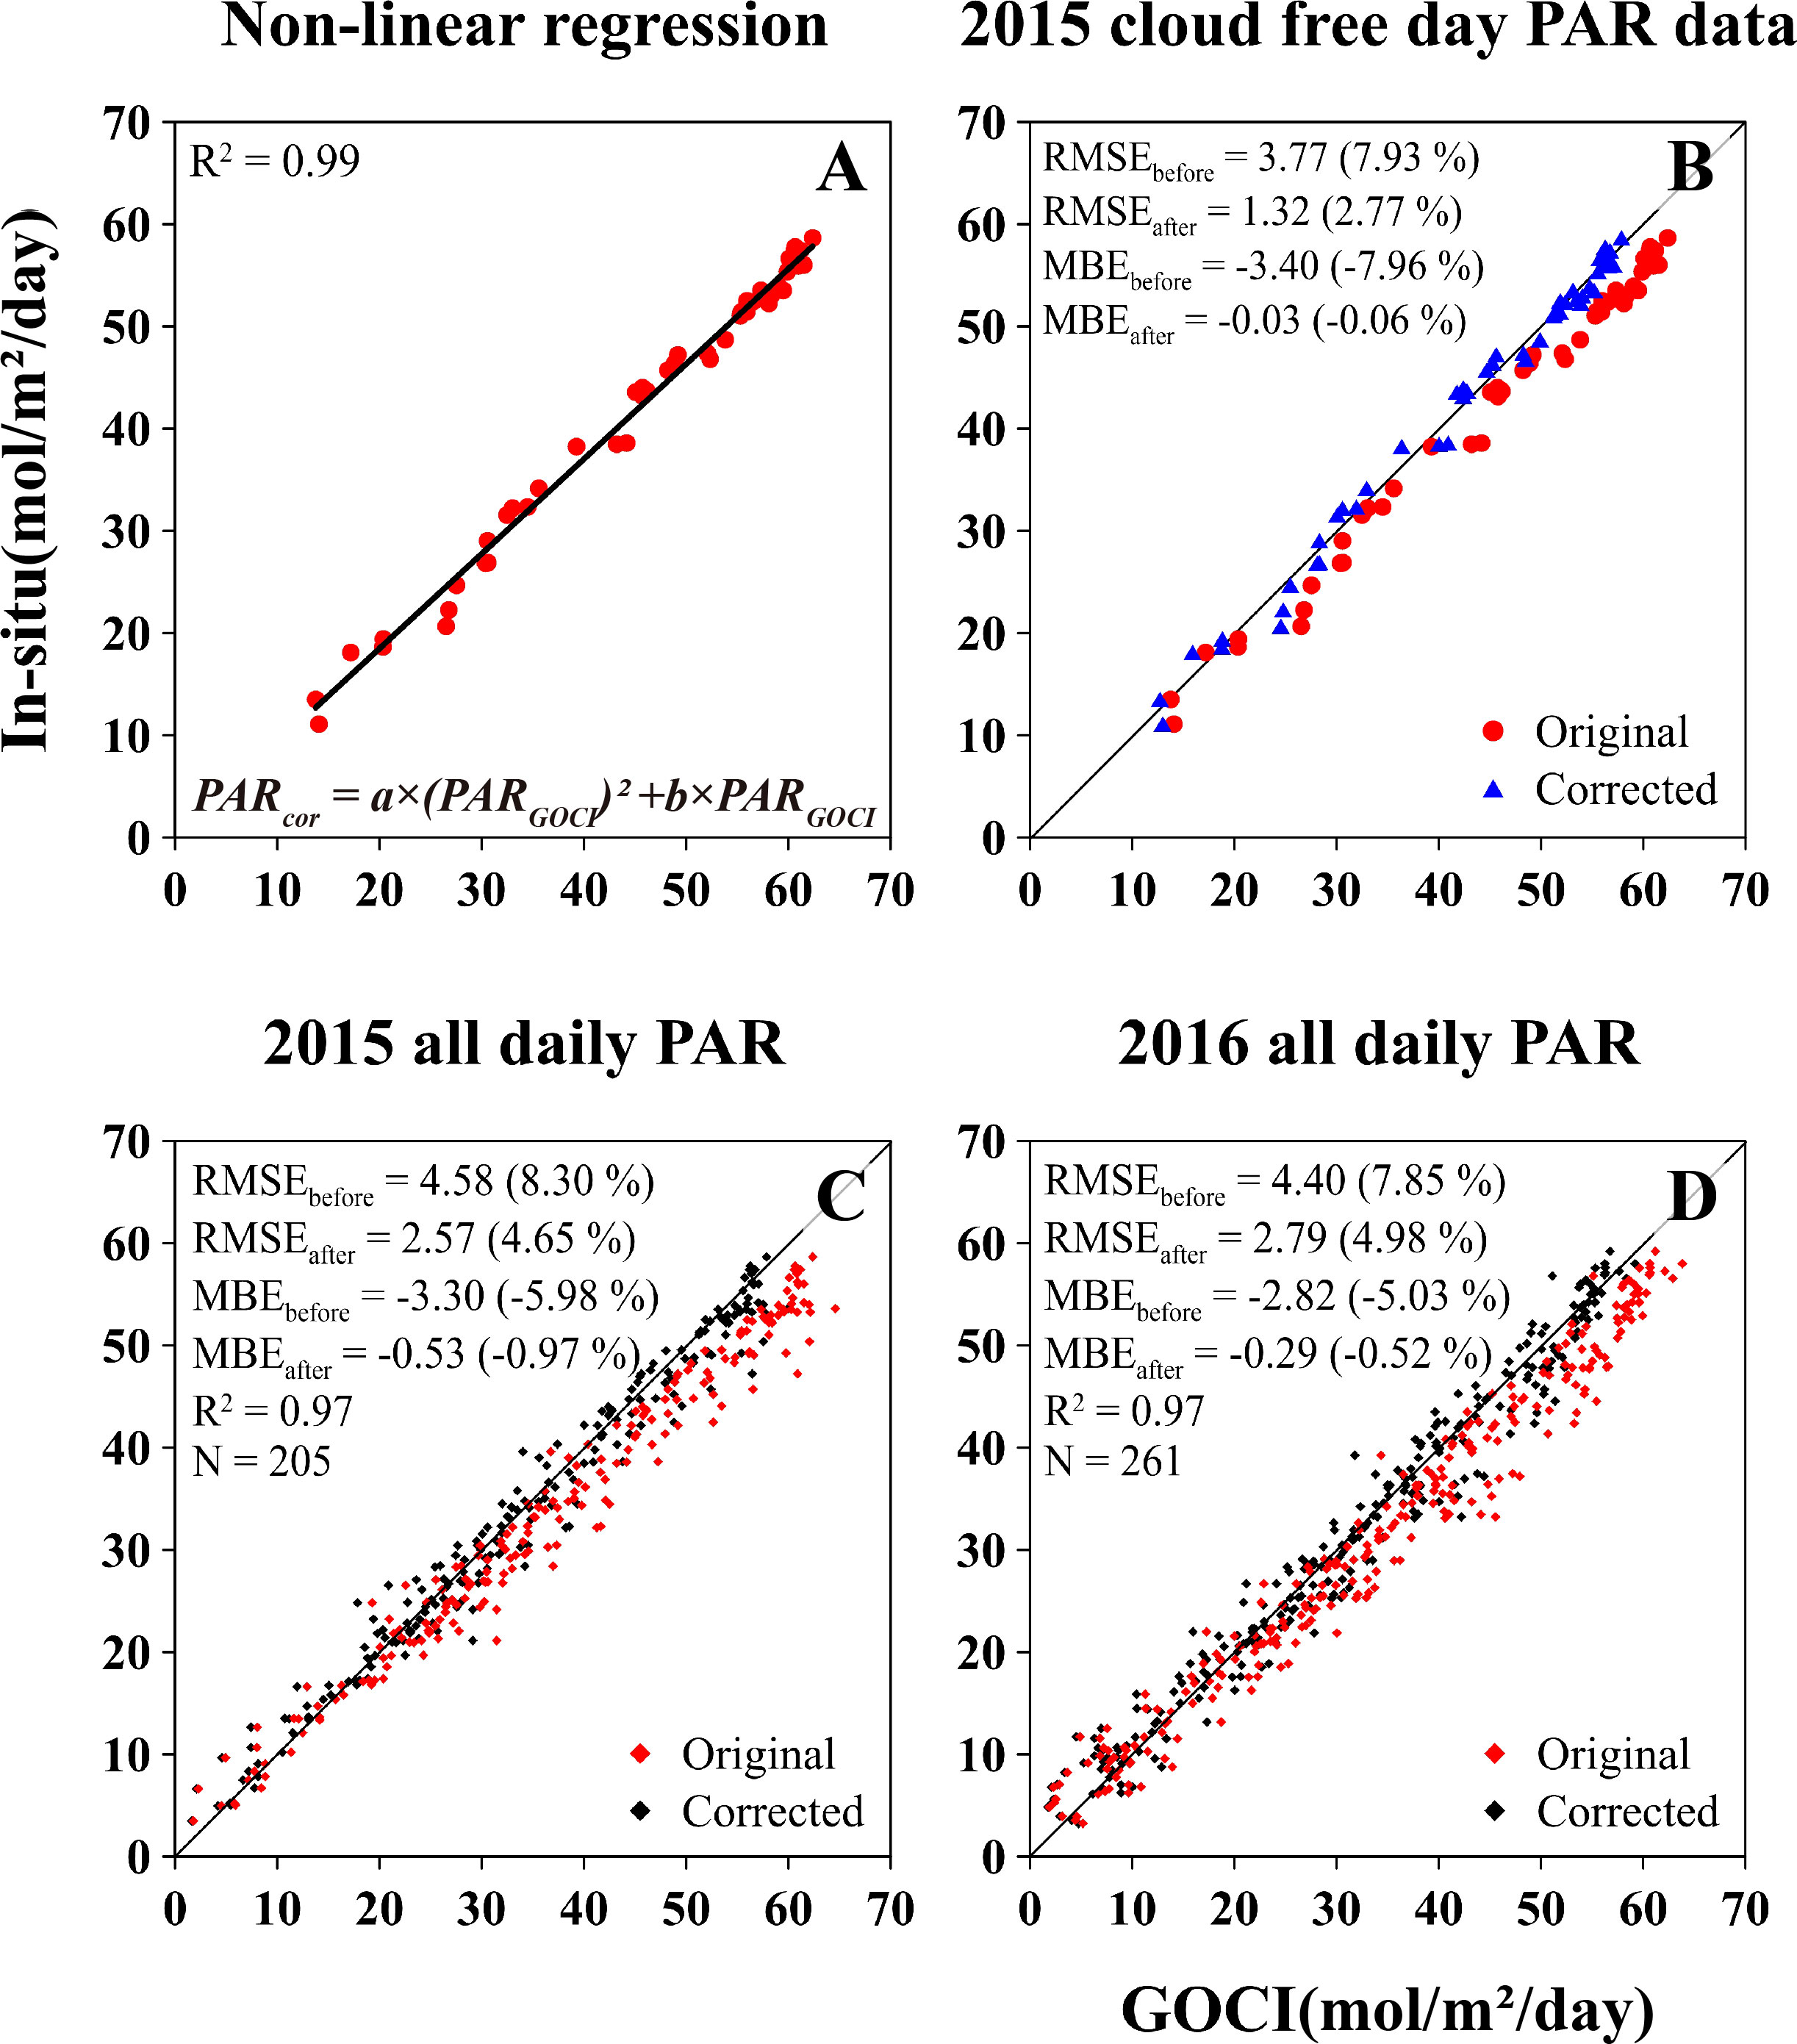
Figure 4 Nonlinear data correction was conducted using data collected under cloud-free conditions. Daily PAR at each station in 2015 was calculated using data from cloud-free pixels. (A) Linear regression of clear-sky data for 2015, where a and b in the equation are 7.0 × 10⁻⁵ and 0.9233, respectively. (B) Comparison of original GOCI PAR values and those corrected using clear-sky data for 2015. (C) Comparison of all-day PAR values calculated using original and corrected GOCI data for 2015. (D) Comparison of PAR data for 2016.
The correlation between PARin situand PARGOCI values was evaluated before and after clear-sky correction (Figure 4B). RMSE was improved from 3.77 (7.93%) to 1.32 (2.77%) mol/m2/day and MBE from –3.40 (–7.96%) to –0.03 (–0.06%) mol/m2/day.
The correlation between PARin situand PARGOCI was then evaluated before and after correction for all days in 2015 (Figure 4C). Following the correction, the R2 value was 0.97, and the RMSE was reduced from 4.58 (8.30%) to 2.57 (4.65%) mol/m2/day. Original PAR values > 20 mol/m2/day generally decreased following the correction, whereas original PAR values < 20 mol/m2/day decreased within a very small range (<1 mol/m2/day; Figure 5C). The corrected daily PAR, PARcor was also evaluated using PARin situat Socheong-cho and Ieodo stations in 2016 (Figure 5D), yielding a high R2 (0.97) and improved RMSE and MBE, from 4.40 (7.85%) to 2.79 (4.96%) mol/m2/day and from –2.82 (–5.03%) to –0.29 (–0.52%) mol/m2/day, respectively. These results indicated that the clear sky correction was also effective in cloudy conditions, supporting the reliability of the GOCI daily PAR algorithm in this study.
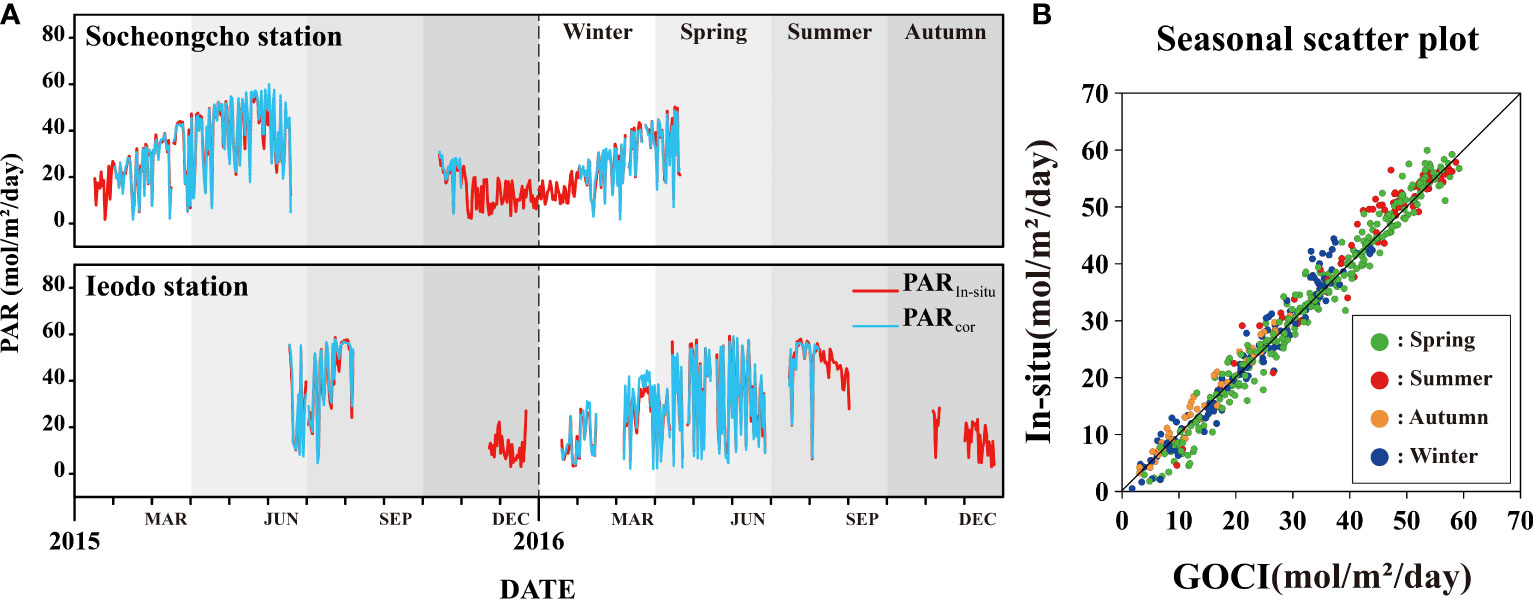
Figure 5 Corrected GOCI daily PAR and seasonal scatter plot. (A) Time series of corrected GOCI daily PAR and in situ daily PAR in 2015 and 2016. Blue and red lines indicate corrected GOCI daily PAR (PARcor) and in situ daily PAR (PARin-situ), respectively. (B) Seasonal scatter plot of corrected GOCI daily PAR and in situ daily PAR.
Figure 5A displays a time series of PARcor and PARin situvalues at both stations for the days in 2015 and 2016 when in situ data were successfully recorded at both stations (Figure 5A). PARin situ ranged from 0 to 60 mol/m2/day; however, PARin situwas < 5 mol/m2/day on very cloudy or rainy days. At both stations, PARcor estimates agreed well with PARin situdata, with underestimation on some days when PARin situwas < 20 mol/m2/day. During spring, PARcor was overestimated on somedays at Socheong-cho. At Ieodo, PARcor estimates generally agreed well with the 2015 PARin situdata. However, we detected overestimation on some days in late March 2016 (~5 mol/m2/day), when there were heavy clouds in most regions around Ieodo station, i.e., higher PARcor estimates than in situ measurements. On other days, PARcor and PARin situshowed differences of< 5%. Differences between PARcor and PARin situwere evenly distributed throughout the observation period, as indicated in the seasonal scatter plot of PARcor and PARin situdisplayed in Figure 5B. Spring and summer had similar maximum and minimum values. Autumn had only few data, but it had the lowest maximum value. Seasonal statistics from PARcor are shown in Table 3. R2 values exceeded 0.95 during the whole season. Autumn had the lowest accuracy due to the small number of data, only 24 days. RMSE and MBE were similar during other seasons, about 5% and -2%, respectively. Standard deviation showed the highest values in spring (Table 2). The average PAR value was also highest in summer. However, the maximum value was observed in spring because summer solstice is included in spring.
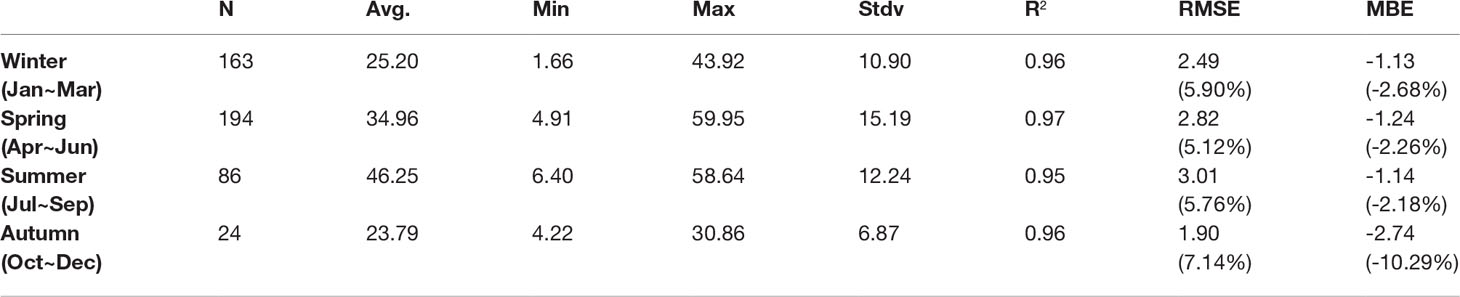
Table 3 Seasonal statistics from corrected GOCI daily PAR.
Examples of GOCI daily PAR imagery
Figure 6A shows a GOCI RGB composite image (bands 6, 4, and 2) acquired at 12:16 local time on August 13, 2013 (UTC 03:16). Heavy clouds were observed over the northern East Sea, where daily PAR reached values as low as ~10 mol/m2/day based on PARcor values (Figure 6B). Small cloud patches over the East China Sea in the GOCI RGB composite image were also well-represented in the GOCI daily PAR image. Cloudy areas over Bohai Bay and eastern Japan, where solar radiation was partially reflected by clouds, were present in the GOCI daily PAR image, with PAR estimates ranging from 25 to 50 mol/m2/day. These small cloud patches were passed over the area and some instantaneous images had smaller cloud patches than those in the RGB image. As mentioned in the previous section, sensors in sun-synchronous orbit generally make daily PAR imagery with one or two images. The treatment could make daily PAR image have a low accuracy, because diurnal variability of clouds is poorly described. On the other hand, GOCI hourly PAR images reflected the movements of cloud well. Large HABs were observed in the East Sea near the coast under clear-sky conditions (Choi et al., 2014b; Noh et al., 2018), where daily PAR values were > 50 mol/m2/day.

Figure 6 Composite true color red–green–blue (RGB) images of GOCI and GOCI daily PAR. (A) GOCI RGB composite image from UTC 03 Aug 13, 2013. (B) Daily PAR image from Aug 13, 2013. (C) GOCI RGB composite image from UTC 03 May 24, 2015. (D) Daily PAR image from May 24, 2015.
In a GOCI RGB composite image acquired at 12:16 local time on May 24, 2015, the Yellow Sea and East Sea showed clear-sky conditions (Figure 6C), which were well represented in the PARcor image, with estimated PAR of > 60 mol/m2/day (Figure 6D). The southern part of the RGB composite image was covered with thick clouds (Figure 7D), thus, nearly all of the incident solar flux was reflected back to space or absorbed into the atmosphere, which led to PAR estimates near zero in this area.
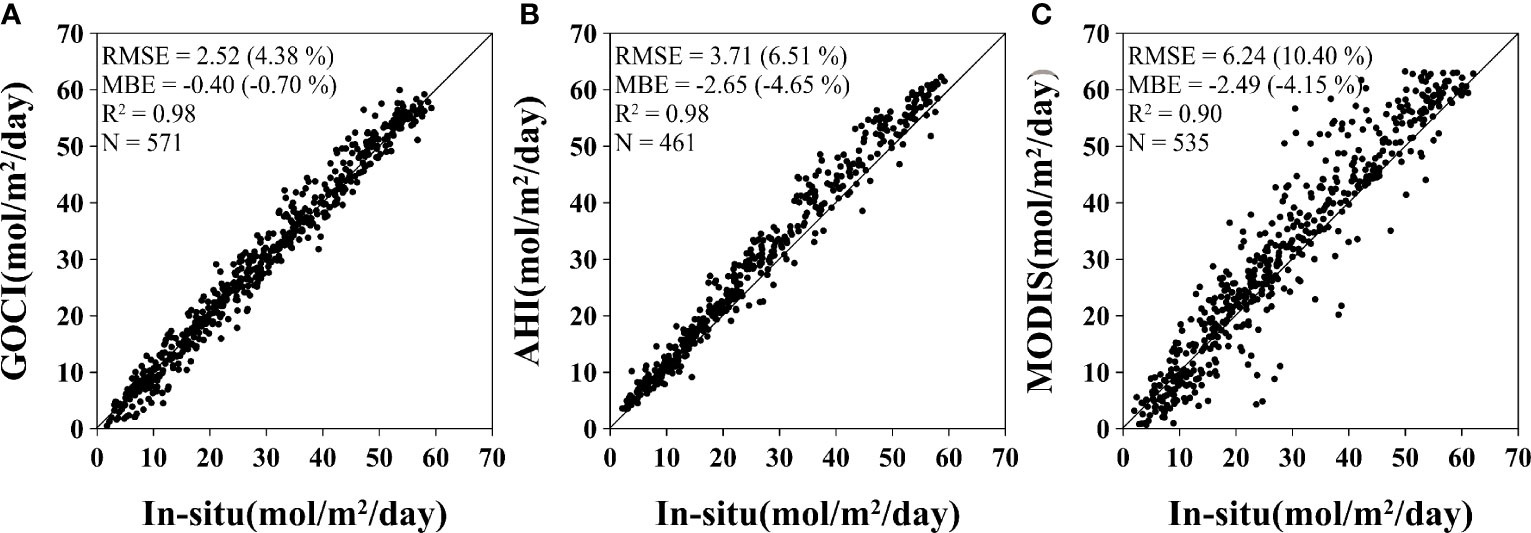
Figure 7 Comparison of in situ daily PAR among three sensors. Scatter plots of in situ measured data and (A) GOCI, (B) AHI, and (C) MODIS data.
Comparison with other sensors
To compare the performance of GOCI daily PAR data with that obtained from other sensors, we also calculated the R2, RMSE, and MBE of daily PAR products from MODIS and AHI for 2015 and 2016. A total of 535 data points for the two stations were obtained from MODIS during the observation period, and a subset of 461 data points was available from AHI, which began to collect observations on July 4, 2015. The R2 values were 0.98, 0.98, and 0.90 for the GOCI, AHI, and MODIS sensors, respectively (Figure 7). MODIS also showed the lowest accuracy in terms of relative RMSE (10.40%) and MBE (–4.15%). Although GOCI and AHI daily PAR values showed similar accuracy in terms of R2, the AHI daily PAR had higher RMSE and MBE values than GOCI, generally overestimating the data. The MODIS daily PAR had a higher variance than the in situ data and showed lower accuracy than the other sensors, likely due to the poor temporal resolution of MODIS and therefore inadequate treatment of daily variability (e.g., such as cloud motion) in the calculation of daily PAR. Thus, GOCI appeared to have an advantage over other satellite sensors in sun-synchronous orbits in terms of estimating daily PAR at the ocean surface around the Korean Peninsula. We note, however, that the GOCI PAR estimates, unlike the MODIS and AHI PAR estimates, were adjusted on clear sky in situ data.
We also compared daily PAR images from the three sensors for March 17, 2017. Figure 8 shows normalized daily PAR and difference maps for the three sensors. Normalization of each image was carried out with min/max value of the image to compare correlation among three sensors. PAR values from each sensor were divided by difference between maximum and minimum value of each daily PAR image. Heavy cloud patches were observed around Bohai Bay and smaller cloud patches roamed the eastern East Sea (Figure 8G). The distribution of GOCI normalized PAR in Bohai Bay differed from that of other sensors (compare Figures 8A–C). The difference map between normalized PAR from GOCI and the other sensors showed high negative bias at Bohai Bay (<–0.3; Figures 8D, E). This may be because MERRA-2 data was used to characterize aerosol properties in the GOCI algorithm, unlike in the MODIS and AHI code which use aerosol climatology, allowing the algorithm to capture the effects of an apparent large dust event from China, as evidenced in the RGB image. AHI and MODIS showed large bias in cloudy areas, particularly in the East Sea and south of Japan. Histograms of the AHI and MODIS normalized daily PAR showed similar distributions, but with different peaks (Figure 8H). The GOCI histogram is different from those of other sensors in terms of the distribution range and peak. Although all sensors showed similar peaks, the lowest GOCI peak was shifted toward lower values, i.e., GOCI daily PAR was lower than that of the other sensors in areas temporarily covered by cloud patches. The different treatment of aerosols in the GOCI PAR algorithm may have contributed to this shift.
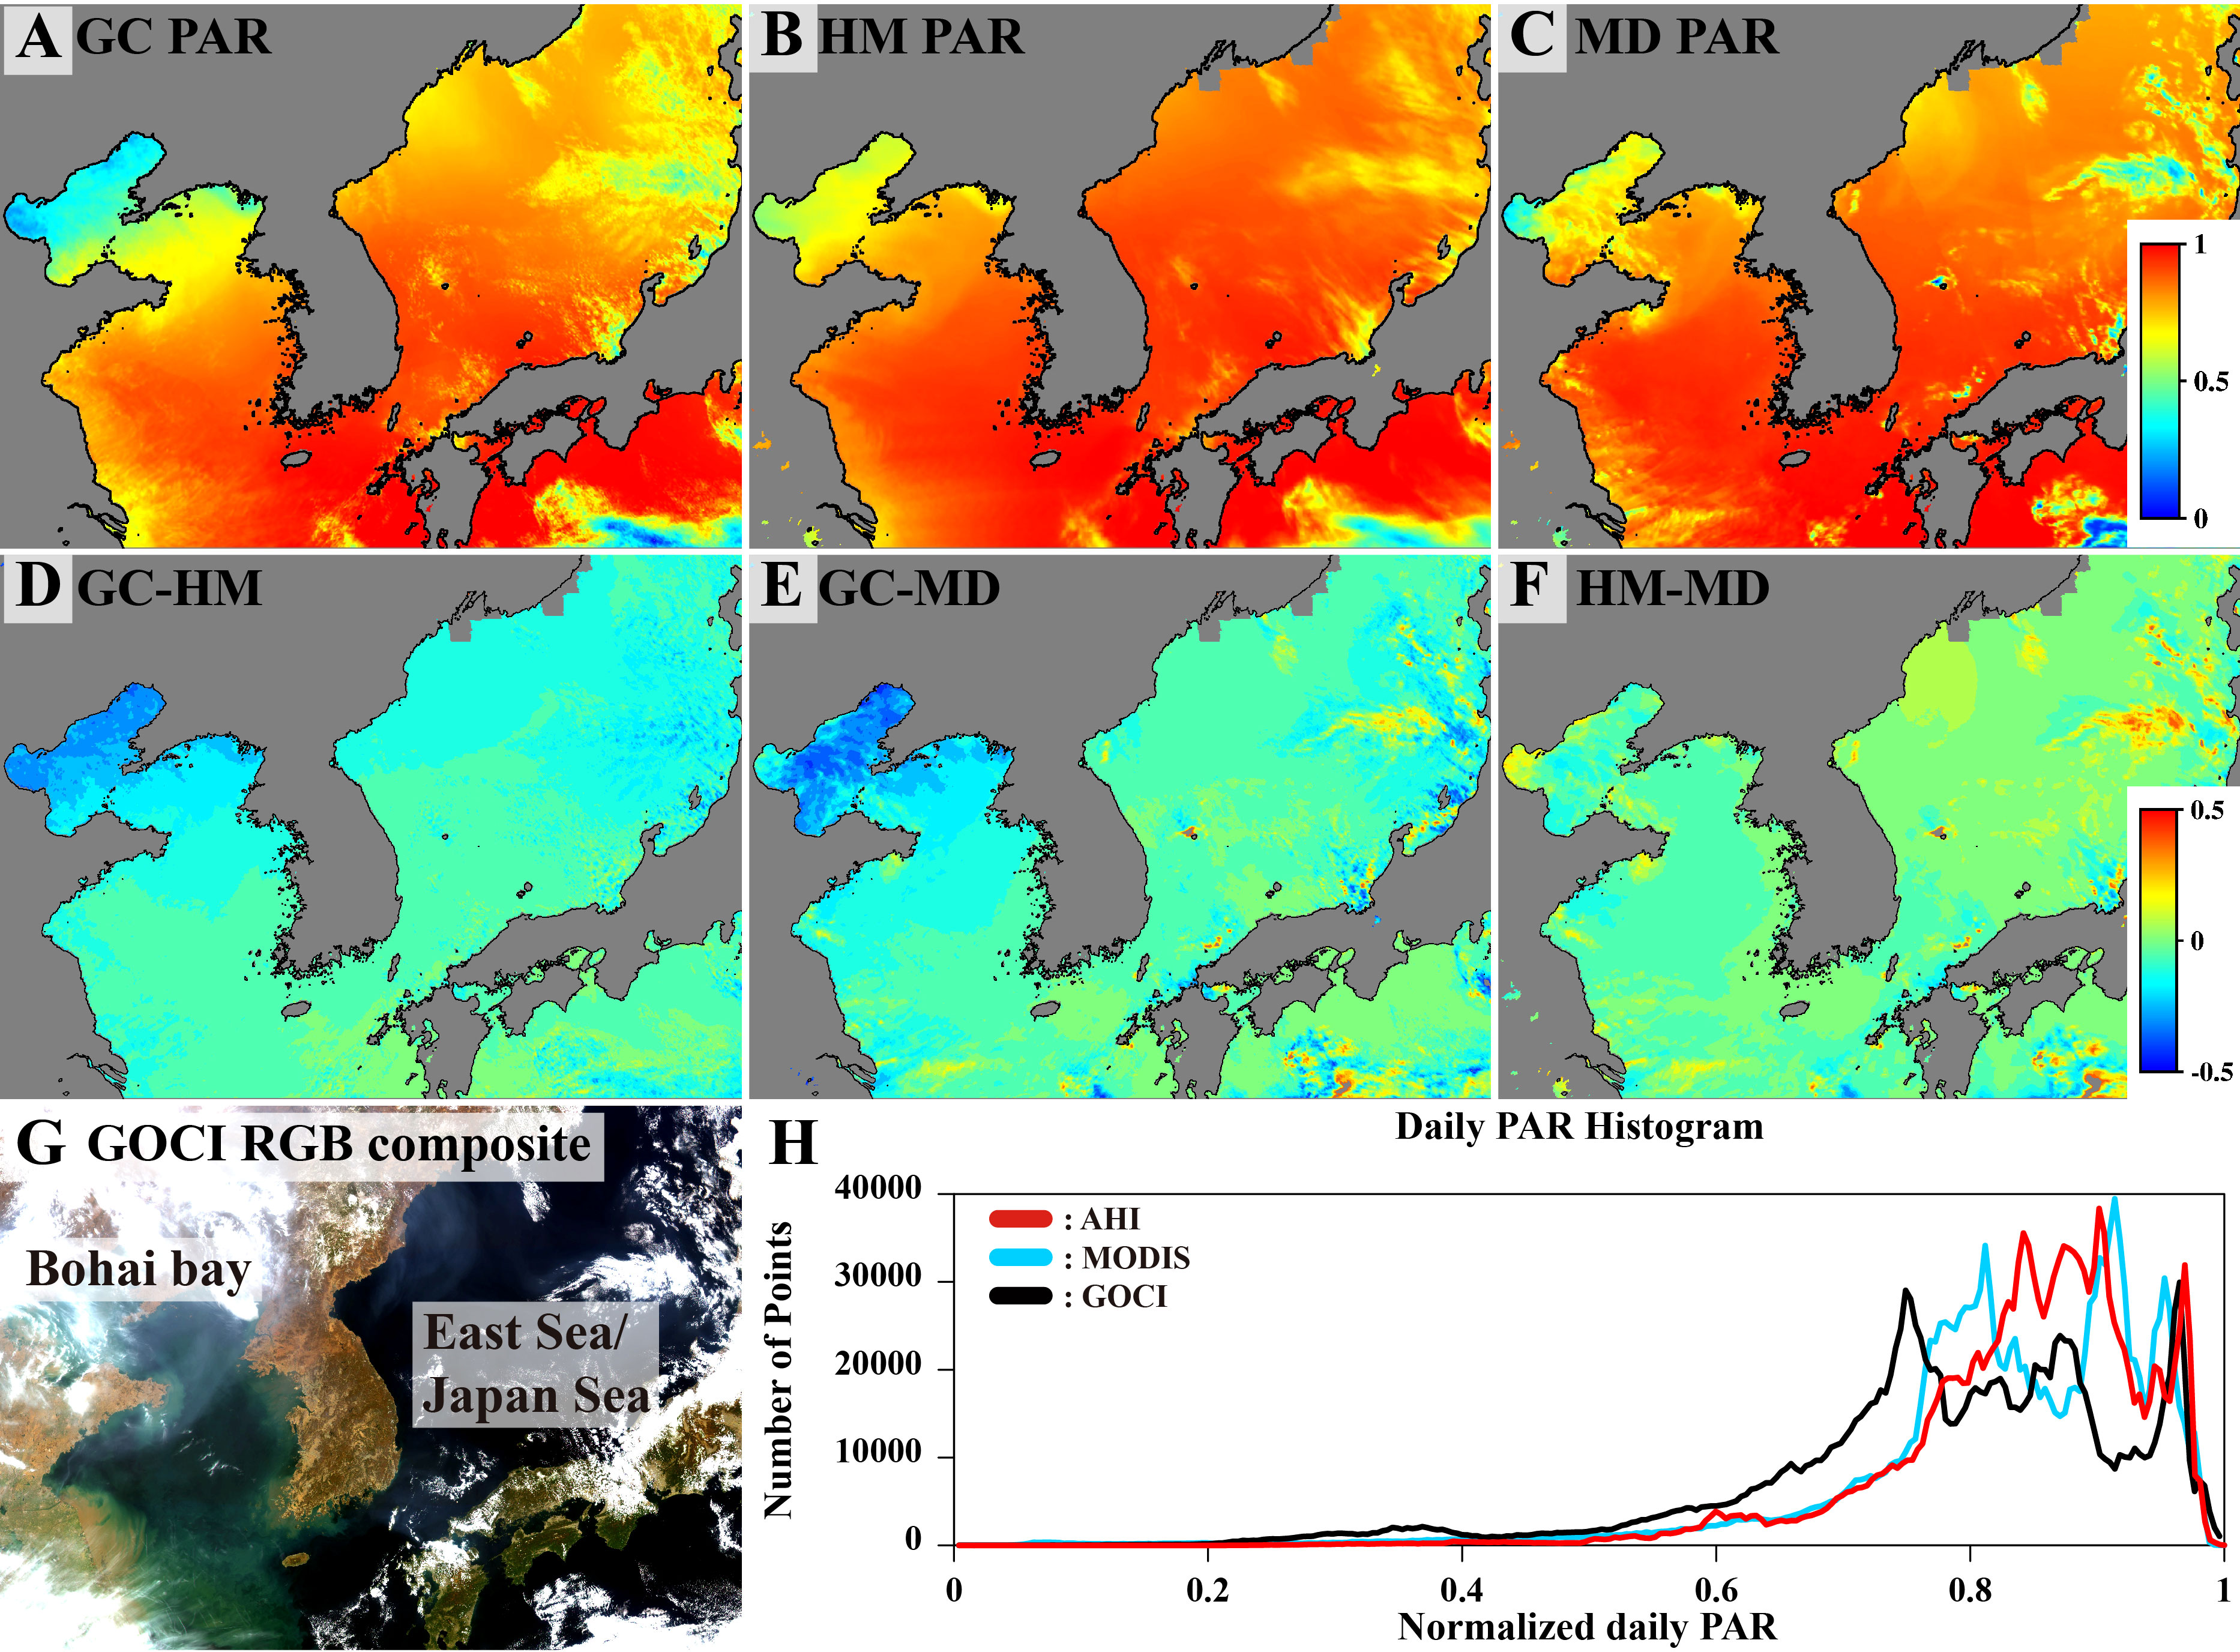
Figure 8 Comparison of daily PAR images captured on March 17, 2017 among three sensors. (A–C) Normalized daily PAR from GOCI (GC), AHI (HM), and MODIS (MD). (D–E) Difference map among the three sensors. (G) RGB composite image of GOCI data captured at UTC 03 March 17, 2017. (H) Histogram of daily PAR image data from the three sensors on March 17, 2017.
GOCI iPAR images captured on 17 March 2017 are displayed in Figure 9. During the day, PAR values distributed from 0 to 150 mol/m2/day. Image captured at UTC 03 and 04 showed the largest PAR value distributions. Diurnal change of PAR and cloud movement are revealed. Heavy cloud layers were passed from East China Sea to southern area of Japan during the observation period. This cloud layer had been thin at late time, after UTC 02, and PAR values were increased. Also, Bohai Bay showed continuous cloud motion. At UTC 05, when MODIS aqua captured the image at GOCI region and made daily PAR image, GOCI iPAR showed similar distribution to MODIS daily PAR (Figure 8C), while different distributions of PAR was shown at other times. This diurnal atmospheric variability illustrates the advantage of using hourly GOCI observations to estimate daily PAR.
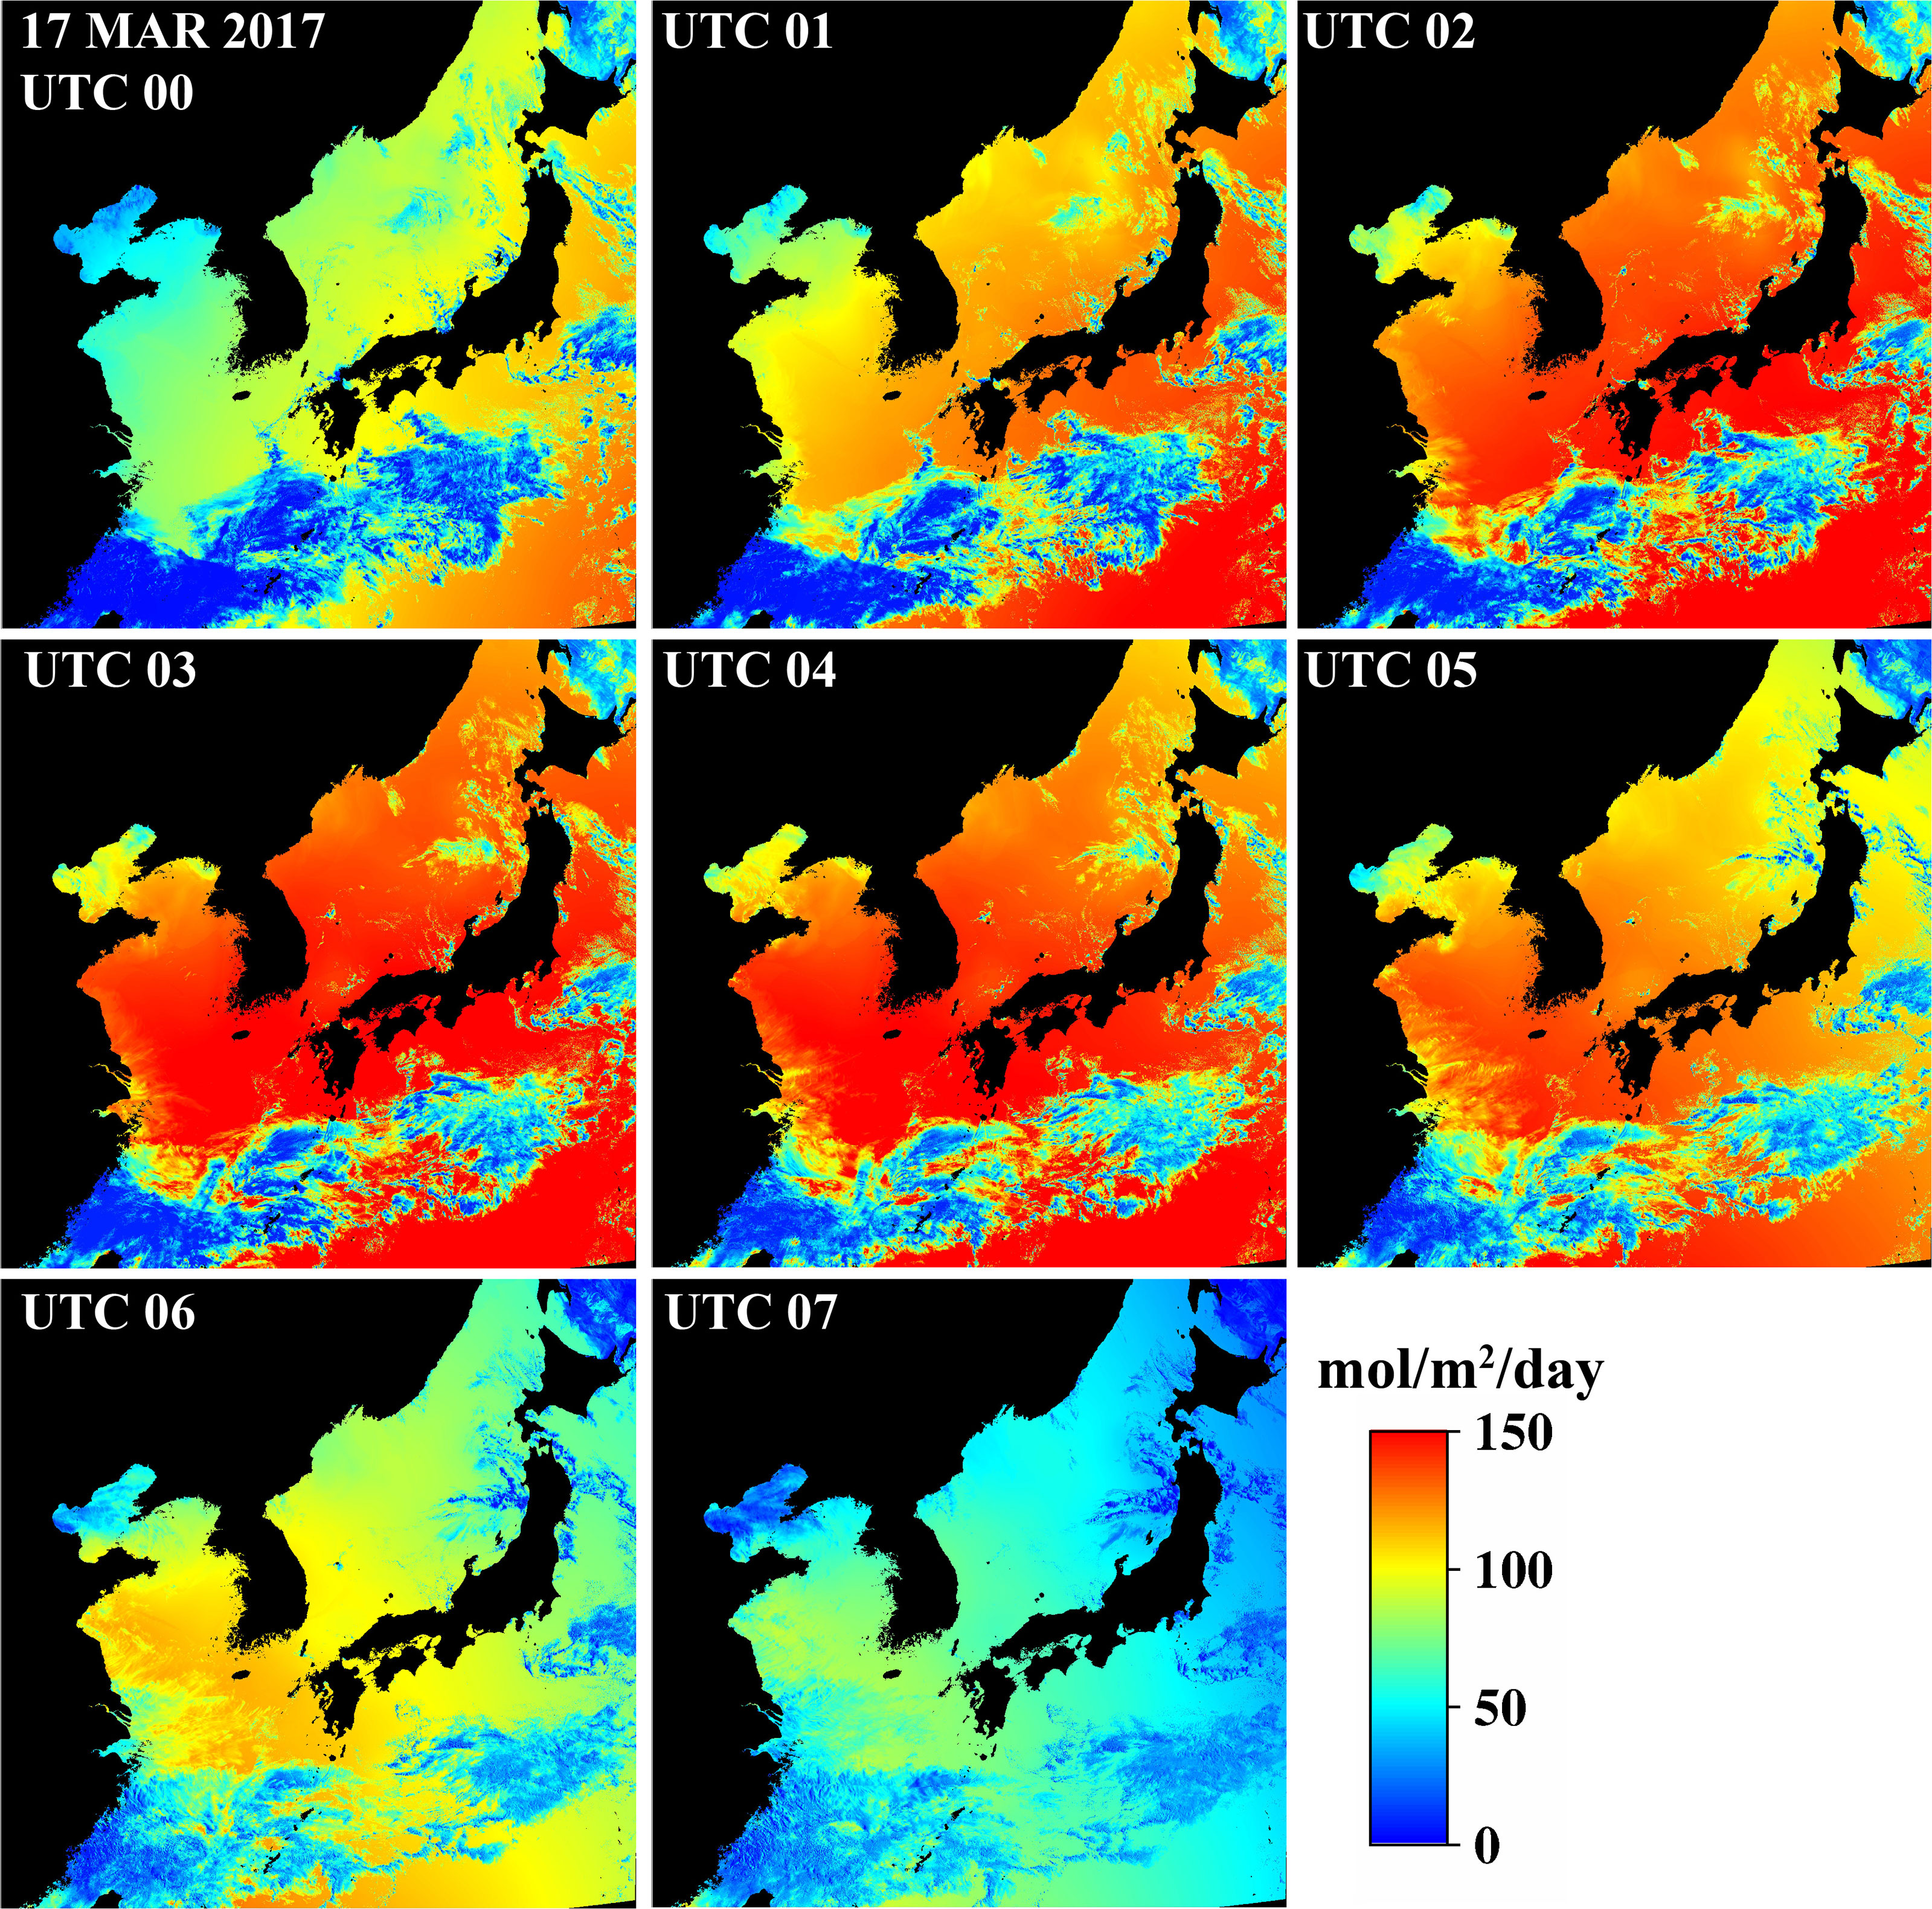
Figure 9 Time series images of GOCI iPAR captured on March 17, 2017. Captured times are marked in the top left of each image. The unit of iPAR is mol/m2/ day.
Discussion and conclusions
GOCI data were used to estimate daily PAR according to a budget model based on plane-parallel theory combined with in situ PAR collected at Socheong-cho and Ieodo ocean research stations near the Korean Peninsula, located in turbid and clear waters, respectively. A bias was detected in the instantaneous in situ dataset through comparisons with 6S-modeled instantaneous PAR during clear sky conditions and corrected. Errors in satellite-derived PAR estimates generated from the original PAR model (based on agreement with in situ data) were corrected successfully using data collected on cloud-free days. Corrected GOCI daily PAR, which accounted for diurnal atmospheric variability, showed good agreement (R2 = 0.97) with PARin situobtained in 2015 and 2016 around the Korean Peninsula. The GOCI daily PAR algorithm used in this study exhibited good reliability in comparisons with in situ data and daily PAR products from MODIS and AHI. PAR and PP are highly correlated. In cloud-cominated or highly turbid areas, especially, PAR contributes to PP more efficiently (Bélanger et al., 2013; Cloern et al., 2014). Thus, the use of GOCI daily PAR derived by the algorithm should be very useful for estimating PP around the Korean Peninsula, along with other daily based satellite-derived products such as sea surface temperature.
In situ measurements are generally used as ground truth in comparisons with modeled data. However, we used 6S modeled data as the reference in this study to correct the in-situ data for biases. PAR sensors are installed on the roof of the ocean research station, and there are several other sensors, such as an atmospheric sensor and wind gauge, nearby that may have affected the observations. Atmospheric transmittance due to aerosols is close to 1 in very clear sky with low solar zenith angle, the conditions of the 6S simulations, due to strong forward scattering of aerosols (Gordon, 2021), i.e., errors due to aerosols are expected to be small.
A clear-sky correction was applied to the GOCI daily PAR estimates. Because such correction was not applied to AHI and MODIS products, one cannot conclude with confidence that the GOCI estimates are in better agreement with in situ measurements. The comparisons between sensors show, however, a smaller scatter with the sensors in geostationary orbit. In a further study, to increase confidence in the in situ measurements, PAR sensors will be moved to a more ideal location such as top of the station, strict thresholds will be sed to select the best conditions, and AERONET-OC aerosol data will be used in the procedure to check in situ measurements.
As shown in Figure 5, pixels with solar zenith angle > 75° were excluded from satellite-based daily PAR estimate calculations to reduce algorithm uncertainties. At large solar zenith angles, the albedo of the atmosphere increases and the irradiance reaching the surface decreases (Bird and Riordan, 1986; Jin et al., 2004; Liu et al., 2009), which makes it difficult to maintain the same level of accuracy as for small zenith angles. Under these conditions, Earth sphericity effects become critical, and the plane-parallel formalism is no longer adequate. In addition, the quasi-single scattering approximation used to correct the GOCI radiance for scattering by the clear atmosphere (to determine the albedo of the cloud/surface system) becomes inaccurate. These effects can lead to masking large areas in the GOCI daily PAR imagery during some periods of the year.
As a follow-up, we tested the reliability of GOCI-derived PAR estimates at Socheong-cho and Ieodo stations when observations with the solar zenith angle > 75° were included in the algorithm, by comparing estimates with in situ measurements collected before February and after November in 2015 at both stations. There was good agreement (R2 = 0.97) between PARcor and PARin situvalues, with a low RMSE of 2.27 mol/m2/day, particularly in winter, when differences between PARcor and PARin situwere almost zero, i.e., lower than 3 mol/m2/day. Because Socheong-cho and Ieodo stations are located at mid to low latitudes, the daily PAR estimates at those stations were not significantly influenced by uncertainties due to solar geometry. Therefore, the PARcor model developed in this study can also be used in areas where the solar zenith angle is larger than 75° in operational processing within the GOCI coverage. However, additional evaluation is needed for areas at latitudes > 40°. The good performance when including high solar zenith angles can be explained by the fact that eight GOCI images were integrated to estimate daily PAR, and most of these images were acquired at solar zenith angles < 75°, i.e., the relative impact of uncertainties associated with the GOCI pixels at large solar zenith angles on calculated daily mean PAR is minimal since surface irradiance is small.
Daily PAR, including pixels with large solar zenith angles, was generated from images captured on October 2, 2015, and March 10, 2016 (Figure 10). The solar zenith angle is typically not large in October and March; however, these angles were not used in large areas near sunrise and sunset (Figures 10A, C). After including pixels with large solar zenith angles, the daily PAR values were well estimated (gray masked areas, Figures 10B, D). Low PAR values observed in cloudy areas were well distributed at high latitudes, with no noisy pixels or abnormal PAR values. In the PAR image for March 17, 2017, the GOCI daily PAR values were strongly correlated with those from other sensors in areas with large solar zenith angles (Figures 8D, E). It is likely that GOCI daily PAR would have been similar if calculated including pixels with high solar zenith angles. In a future study, we will include such pixels to estimate GOCI daily PAR and validate the results.
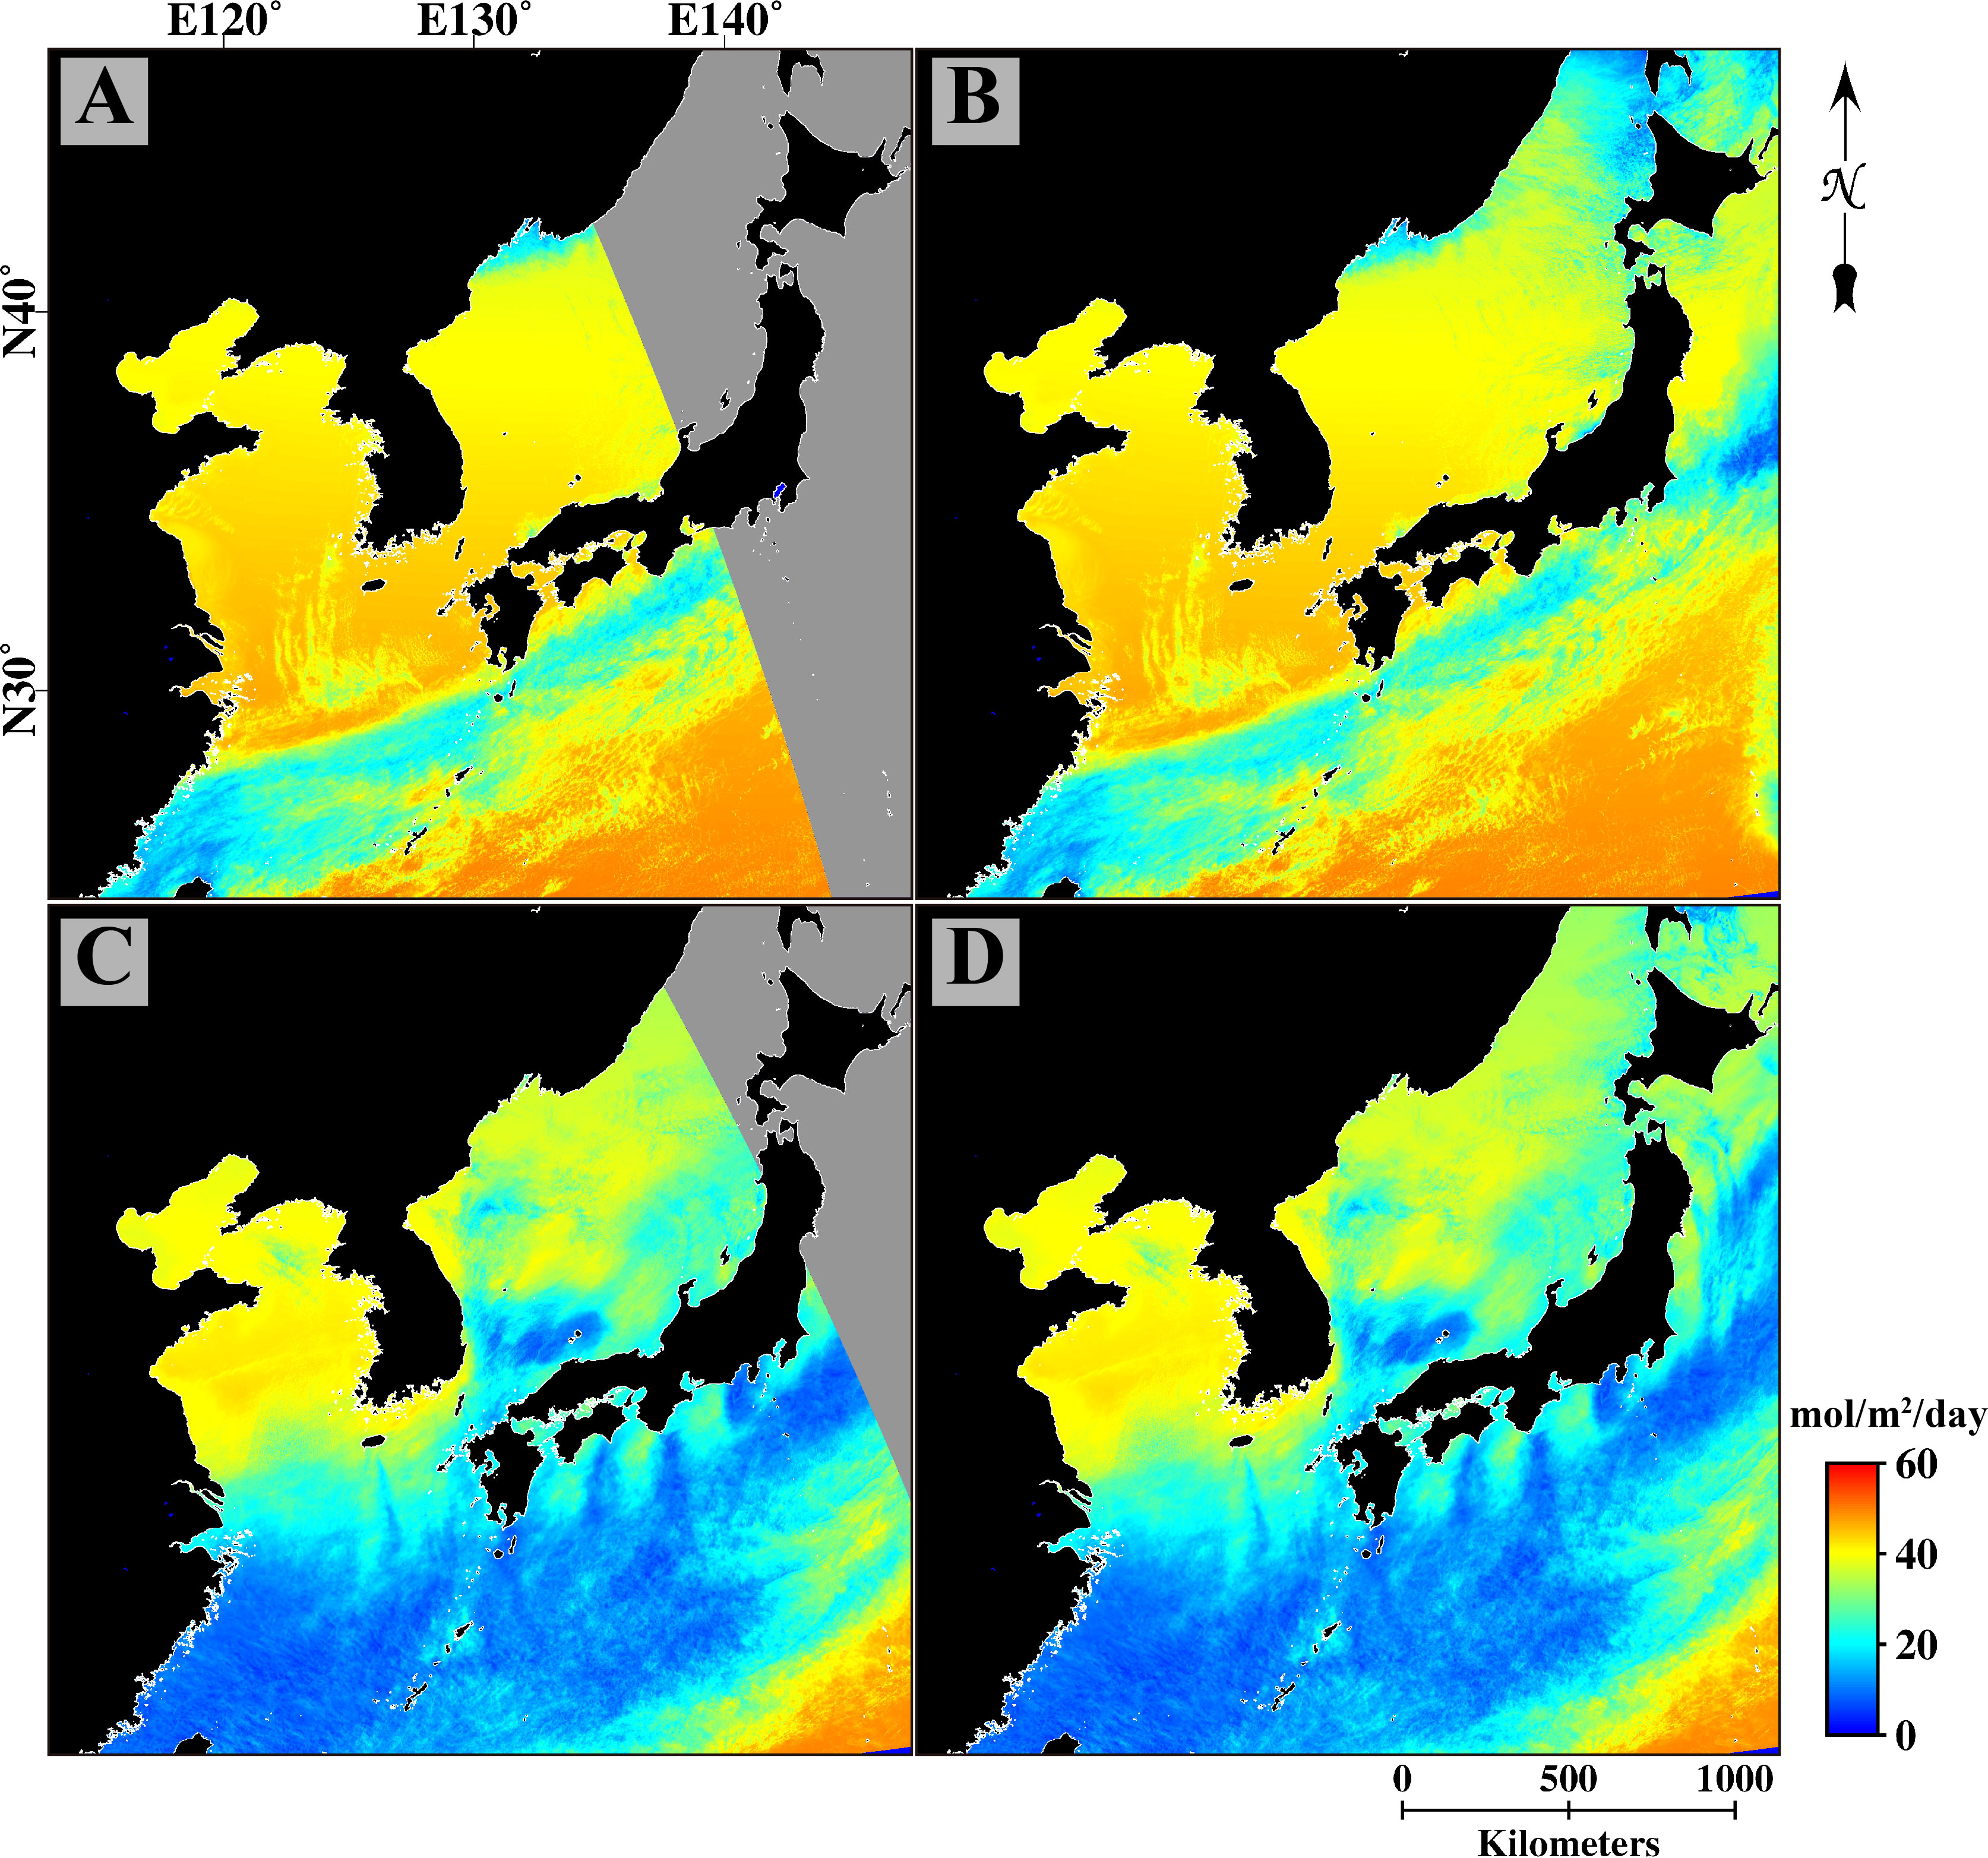
Figure 10 Missing data at large solar zenith angles (>75°). Daily PAR images (A) excluding and (B) including pixels with large solar zenith angles acquired on October 2, 2015. Daily PAR images (C) excluding and (D) including pixels with large solar zenith angles acquired on March 10, 2016. Gray areas in (A) and (C) were not calculated due to the large solar zenith angles.
Based on our findings, GOCI-derived daily PAR images can be widely applied to estimate PP. This approach will provide information about the likelihood of HABs in Korean waters, and address a wide range of biological, chemical, and physical issues in the region. Notably, there are only two stations suitable for evaluating GOCI daily PAR off the Korean Peninsula. However, long-term observations at these stations could be an alternative to obtaining simultaneous observations at multiple stations under various atmospheric conditions and geometric angles. The algorithm should be further improved to obtain more accurate estimates, to avoid adjustment against in situ measurements and make it applicable more generally, and the results should be evaluated more extensively against not only in situ data, but also other satellite estimates and reanalysis data. An extension to GOCI-II, the GOCI follow-on launched on February 18, 2020, is envisaged.
Data availability statement
The raw data supporting the conclusions of this article will be made available by the authors, without undue reservation.
Author contributions
Conceptualization: DH, J-KC, J-HR, and RF; methodology: JT, RF, and DH; data curation: DH, JT, J-EM, and J-HA; writing—original draft preparation: DH; supervision: J-KC; funding acquisition: J-KC. All authors contributed to the article and approved the submitted version.
Funding
This research was supported by “Estimation and application of ocean color satellite based photosynthetically available radiation” of the National Research Foundation of Korea (NRFK) and “Biochemical cycling and marine environmental change studies” of the Korea Institute of Ocean Science and Technology (KIOST). RF received funding from the National Aeronautics and Space Administration under various grants.
Conflict of interest
The authors declare that the research was conducted in the absence of any commercial or financial relationships that could be construed as a potential conflict of interest.
Publisher’s note
All claims expressed in this article are solely those of the authors and do not necessarily represent those of their affiliated organizations, or those of the publisher, the editors and the reviewers. Any product that may be evaluated in this article, or claim that may be made by its manufacturer, is not guaranteed or endorsed by the publisher.
References
Arnone R. A., Ladner S., La Violette P. E., Brock J. C., Rochford P. A. (1998). Seasonal and interannual variability of surface photosynthetically available radiation in the Arabian Sea. J. Geophys. Res. 103, 7735–7748. doi: 10.1029/97jc03204
Baker K. S., Frouin R. (1987). Relation between photosynthetically available radiation and total insolation at the ocean surface under clear skies. Limnol. Oceanogr. 32, 1370–1377. doi: 10.4319/lo.1987.32.6.1370
Beardsley R., Limeburner R., Yu H., Cannon G. A. (1985). Discharge of the changjiang (Yangtze river) into the East China Sea. Cont. Shelf Res. 4, 57–76. doi: 10.1016/0278-4343(85)90022-6
Behrenfeld M. J., Falkowski P. G. (1997). Photosynthetic rates derived from satellite-based chlorophyll concentration. Limnol. Oceanogr. 42, 1–20. doi: 10.4319/lo.1997.42.1.0001
Bélanger S., Babin M., Tremblay J.-É. (2013). Increasing cloudiness in Arctic damps the increase in phytoplankton primary production due to sea ice receding. Biogeosciences 10, 4087–4101. doi: 10.5194/bg-10-4087-2013
Bessho K., Date K., Hayashi M., Ikeda A., Imai T., Inoue H., et al. (2016). An introduction to himawari-8/9 — japan’s new-generation geostationary meteorological satellites. J. Meteorol. Soc Japan 94, 151–183. doi: 10.2151/jmsj.2016-009
Bird R. E., Riordan C. (1986). Simple solar spectral model for direct and diffuse irradiance on horizontal and tilted planes at the earth’s surface for cloudless atmospheres. J. Clim. Appl. Meteorol. 25, 87–97. doi: 10.1175/1520-0450(1986)025<0087:SSSMFD>2.0.CO;2
Bouvet M., Hoepffner N., Dowell M. D. (2002). Parameterization of a spectral solar irradiance model for the global ocean using multiple satellite sensors. J. Geophys. Res. Ocean. 107, 8-1-8–8-118. doi: 10.1029/2001JC001126
Campbell J. W., Aarup T. (1989). Photosynthetically available radiation at high latitudes. Limnol. Oceanogr. 34, 1490–1499. doi: 10.4319/lo.1989.34.8.1490
Carder K. L., Chen F. R., Hawes S. K. (2003) Instataneous photosynthetically available radiation and absorbed radiation by phytoplankton. Available at: http://oceancolor.gsfc.nasa.gov/DOCS/atbd_mod20.pdf.
Choi J., Kwon Y.-K., Chung G.-S. (2012b). Late quaternary stratigraphy and depositional environment of tidal sand ridge deposits in gyeonggi bay, West coast of Korea. J. Korean Earth Sci. Soc. 33, 1–10. doi: 10.5467/JKESS.2012.33.1.1
Choi J. K., Min J. E., Noh J. H., Han T. H., Yoon S., Park Y. J., et al. (2014b). Harmful algal bloom (HAB) in the East Sea identified by the geostationary ocean color imager (GOCI). Harmful Algae 39, 295–302. doi: 10.1016/j.hal.2014.08.010
Choi J. K., Park Y. J., Ahn J. H., Lim H. S., Eom J., Ryu J.-H. (2012a). GOCI, the world’s first geostationary ocean color observation satellite, for the monitoring of temporal variability in coastal water turbidity. J. Geophys. Res. Ocean. 117, 1–10. doi: 10.1029/2012JC008046
Choi J.-K., Park Y. J., Lee B. R., Eom J., Moon J.-E., Ryu J.-H. (2014a). Application of the geostationary ocean color imager (GOCI) to mapping the temporal dynamics of coastal water turbidity. Remote Sens. Environ. 146, 24–35. doi: 10.1016/j.rse.2013.05.032
Cloern J. E., Foster S. Q., Kleckner A. E. (2014). Phytoplankton primary production in the world’s estuarine-coastal ecosystems. Biogeosciences 11, 2477–2501. doi: 10.5194/bg-11-2477-2014
Damiani A., Irie H., Horio T., Takamura T., Khatri P., Takenaka H. (2018). Evaluation of himawari-8 surface downwelling solar radiation by ground-based measurements. Atmos. Meas. Tech. 11, 2501–2521. doi: 10.5194/amt-11-2501-2018
Dedieu G., Deschamps P. Y., Kerr Y. H. (1987). Satellite estimation of solar irradiance at the surface of the earth and of surface albedo using a physical model applied to meteosat data. J. Clim. Appl. Meteorol. 26, 79–87. doi: 10.1175/1520-0450(1987)026<0079:SEOSIA>2.0.CO;2
Donkor V., Häder D.-P. (1991). Effects of solar and ultraviolet radiation on motility, photomovement and pigmentation in filamentous, gliding cyanobacteria. FEMS Microbiol. Lett. 86, 159–168. doi: 10.1111/j.1574-6968.1991.tb04805.x
Frouin R., Chertock B. (1992). A technique for global monitoring of net solar irradiance at the ocean surface. Part I: Model. J. Appl. Meteorol. 31, 1056–1066. doi: 10.1175/1520-0450(1992)031<1056:ATFGMO>2.0.CO;2
Frouin R., Franz B. A., Werdell P. J. (2003) The SeaWiFS PAR product. algorithm updat. fourth SeaWiFS data reprocess. Available at: http://finalfrontier.ucsd.edu/Projects/NF-POGO/Frouin03.pdf%5Cnhttp://oceancolor.gsfc.nasa.gov/DOCS/seawifs_par_wfigs.pdf.
Frouin R., McPherson J. (2012). Estimating photosynthetically available radiation at the ocean surface from GOCI data. Ocean Sci. J. 47, 313–321. doi: 10.1007/s12601-012-0030-6
Frouin R., McPherson J., Ueyoshi K., Franz B. A. (2012). A time series of photosynthetically available radiation at the ocean surface from SeaWiFS and MODIS data. In Eds. Frouin R. J., Ebuchi N., Pan D., Saino T., 852519. In Proc in Remote Sensing of the Marine Environment II Vol 8525. Kyoto, Japan: SPIE Asia Pacific Remote Sensimg. pp 95–107 doi: 10.1117/12.981264
Frouin R., Murakami H. (2007). Estimating photosynthetically available radiation at the ocean surface from ADEOS-II global imager data. J. Oceanogr. 63, 493–503. doi: 10.1007/s10872-007-0044-3
Frouin R., Pinker R. T. (1995). Estimating photosynthetically active radiation (Par) At the earths surface from satellite-observations. Remote Sens. Environ. 51, 98–107. doi: 10.1016/0034-4257(94)00068-x
Gerber S., Häder D. P. (1993). Effects of solar irradiation on motility and pigmentation of three species of phytoplankton. Environ. Exp. Bot. 33, 515–521. doi: 10.1016/0098-8472(93)90025-B
Gordon H. R. (2021). Evolution of ocean color atmospheric correction: 1970–2005. Remote Sens. 13, 5051. doi: 10.3390/rs13245051
Jahan R., Choi J. K. (2014). Climate regime shift and phytoplankton phenology in a macrotidal estuary: Long-term surveys in gyeonggi bay, Korea. Estuaries Coasts 37, 1169–1187. doi: 10.1007/s12237-013-9760-7
Jin Z., Charlock T. P., Smith W. L., Rutledge K. (2004). A parameterization of ocean surface albedo. Geophys. Res. Lett. 31, 1–4. doi: 10.1029/2004GL021180
Kim Y. S., Jeong C. S., Seong G. T., Han I. S., Lee Y. S. (2010). Diurnal vertical migration of cochlodinium polykrikoides during the red tide in Korean coastal sea waters. J. Environ. Biol. 31, 687–693. Available at: http://www.jeb.co.in/index.php?page=issue_toc&issue=201009_sep10.
Kim D. W., Jo Y. H., Choi J. K., Choi J. G., Bi H. (2016a). Physical processes leading to the development of an anomalously large cochlodinium polykrikoides bloom in the East sea/Japan sea. Harmful Algae 55, 250–258. doi: 10.1016/j.hal.2016.03.019
Kim J., Yang H., Choi J.-K., Moon J.-E., Frouin R. (2016b). Estimating photosynthetically available radiation from geostationary ocean color imager (GOCI) data. Korean J. Remote Sens. 32, 253–262. doi: 10.7780/kjrs.2016.32.3.5
Kirk J. T. O. (2010). Light and photosynthesis in aquatic ecosystems (Cambridge: Cambridge University Press). doi: 10.1017/CBO9781139168212
Kotchenova S. Y., Vermote E. F., Matarrese R., Klemm F. J. Jr. (2006). Validation of a vector version of the 6S radiative transfer code for atmospheric correction of satellite data part I: Path radiance. Appl. Optics 45 (26), 6762. doi: 10.1364/AO.45.006762
Laliberté J., Bélanger S., Frouin R. (2016). Evaluation of satellite-based algorithms to estimate photosynthetically available radiation (PAR) reaching the ocean surface at high northern latitudes. Remote Sens. Environ. 184, 199–211. doi: 10.1016/j.rse.2016.06.014
Lee H. J., Park J. Y., Lee S. H., Lee J. M., Kim T. K. (2013). Suspended sediment transport in a rock-bound, macrotidal estuary: Han estuary, Eastern yellow Sea. J. Coast. Res. 287, 358–371. doi: 10.2112/JCOASTRES-D-12-00066.1
Lindeman R. L. (1942). The trophic-dynamic aspect of ecology. Ecology 23, 399–417. doi: 10.2307/1930126
Liu J., Schaaf C., Strahler A., Jiao Z., Shuai Y., Zhang Q., et al. (2009). Validation of moderate resolution imaging spectroradiometer (MODIS) albedo retrieval algorithm: Dependence of albedo on solar zenith angle. J. Geophys. Res. Atmos. 114, 1–11. doi: 10.1029/2008JD009969
Milliman J. D., Beardsley R. C., Zuo-sheng Y., Limeburner R. (1985). Modern huanghe-derived muds on the outer shelf of the East China Sea: identification and potential transport mechanisms. Cont. Shelf Res. 4, 175–188. doi: 10.1016/0278-4343(85)90028-7
Noh J. H., Kim W., Son S. H., Ahn J.-H., Park Y.-J. (2018). Remote quantification of cochlodinium polykrikoides blooms occurring in the East Sea using geostationary ocean color imager (GOCI). Harmful Algae 73, 129–137. doi: 10.1016/j.hal.2018.02.006
Oh S.-J., Kim C.-H., Kwon H.-K., Yang H.-S. (2010). Effects of water temperature, salinity and irradiance on the growth of harmful dinoflagellate cochlodinium polykrikoides margelef isolated from south Sea of Korea in 2008. Korean J. Fish. Aquat. Sci. 43, 715–722. doi: 10.5657/kfas.2010.43.6.715
Potter C. S. C., Randerson J. (1993). Terrestrial ecosystem production: a process model based on global satellite and surface data. Global Biogeochem. Cycles 7, 811–841. doi: 10.1029/93GB02725
Richter P. R., Häder D.-P., Gonçalves R. J., Marcoval M. A., Villafañe V. E., Helbling E. W. (2007). Vertical migration and motility responses in three marine phytoplankton species exposed to solar radiation. Photochem. Photobiol. 83, 810–817. doi: 10.1111/j.1751-1097.2007.00076.x
Ryu J. H., Han H. J., Cho S., Park Y. J., Ahn Y. H. (2012). Overview of geostationary ocean color imager (GOCI) and GOCI data processing system (GDPS). Ocean Sci. J. 47, 223–233. doi: 10.1007/s12601-012-0024-4
Siegel D. A., Buesseler K. O., Doney S. C., Sailley S. F., Behrenfeld M. J., Boyd P. W. (2014). Global assessment of ocean carbon export by combining satellite observations and food-web models. Global Biogeochem. Cycles 28, 181–196. doi: 10.1002/2013GB004743
Smith R. C., Baker K. S. (1986). Analysis of ocean optical data II. In Ed. Blizard M. A. In Proc 1986 Technical Symposium Southeast. Vol 637 Orlando, United States: SPIE Technical Symposium Southeast. pp. 95–107.doi: 10.1117/12.964220 doi: 10.1117/12.964220
Somayajula S. A., Devred E., Bélanger S., Antoine D., Vellucci V., Babin M. (2018). Evaluation of sea-surface photosynthetically available radiation algorithms under various sky conditions and solar elevations. Appl. Opt. 57, 3088. doi: 10.1364/ao.57.003088
Tan J., Frouin R., Jolivet D., Compiegne M., Ramon D. (2020). Evaluation of the NASA OBPG MERIS ocean surface PAR product in clear sky conditions. Opt. Express 28, 33157–33175. doi: 10.1364/oe.396066
Wang M., Ahn J.-H., Jiang L., Shi W., Son S., Park Y.-J., et al. (2013). Ocean color products from the Korean geostationary ocean color imager (GOCI). Opt. Express 21, 3835–3849. doi: 10.1364/OE.21.003835
Yang H., Choi J.-K., Park Y.-J., Han H.-J., Ryu J.-H. (2014). Application of the geostationary ocean color imager (GOCI) to estimates of ocean surface currents. J. Geophys. Res. Ocean. 119, 3988–4000. doi: 10.1002/2014JC009981
Yu Y., Shi J., Wang T., Letu H., Yuan P., Zhou W., et al. (2019). Evaluation of the himawari-8 shortwave downward radiation (SWDR) product and its comparison with the CERES-SYN, MERRA-2, and ERA-interim datasets. IEEE J. Sel. Top. Appl. Earth Obs. Remote Sens. 12, 519–532. doi: 10.1109/JSTARS.2018.2851965
Keywords: Keywords GOCI, PAR, Korean Peninsula, plane parallel atmosphere, clear sky correction
Citation: Hwang DJ, Frouin R, Tan J, Ahn J-H, Choi J-K, Moon J-E and Ryu J-H (2022) Algorithm to estimate daily PAR at the ocean surface from GOCI data: description and evaluation. Front. Mar. Sci. 9:924967. doi: 10.3389/fmars.2022.924967
Received: 21 April 2022; Accepted: 27 June 2022;
Published: 27 July 2022.
Edited by:
Atsushi Matsuoka, University of New Hampshire, United StatesReviewed by:
Marco Bellacicco, National Research Council (CNR), ItalyXiaogang Xing, Ministry of Natural Resources, China
Copyright © 2022 Hwang, Frouin, Tan, Ahn, Choi, Moon and Ryu. This is an open-access article distributed under the terms of the Creative Commons Attribution License (CC BY). The use, distribution or reproduction in other forums is permitted, provided the original author(s) and the copyright owner(s) are credited and that the original publication in this journal is cited, in accordance with accepted academic practice. No use, distribution or reproduction is permitted which does not comply with these terms.
*Correspondence: Jong-Kuk Choi, amtjaG9pQGtpb3N0LmFjLmty