 Zoé Mériguet1*
 Anna Oddone2David Le Guen2
 Thibaut Pollina2Romain Bazile2Clémentine Moulin2,3,4Romain Troublé3,4Manu Prakash5Colomban de Vargas2,3,6*
 Fabien Lombard1,2,3*
- 1Laboratoire d’Océanographie de Villefranche, UMR 7093, Sorbonne Université, CNRS, Villefranche sur mer, France
- 2Plankton Planet Non Governmental Organization (NGO), Station Biologique de Roscoff & Atelier PontonZ Morlaix, Roscoff, France
- 3Research Federation for the study of Global Ocean Systems Ecology and Evolution, FR2022/Tara GOSEE, Paris, France
- 4Tara Ocean Foundation, Paris, France
- 5Department of Bioengineering, Stanford University, California, Stanford, CA, United States
- 6Station Biologique de Roscoff, UMR 7144, Sorbonne Université, CNRS, ECOMAP, Roscoff, France
World ocean plankton quantitative biodiversity data are still severely limited due to the high cost and logistical constraints associated to oceanographic vessels and collection/analytic devices. Here, we report the first use of an affordable and open-source plankton collection and imaging kit designed for citizen biological oceanography, composed of a high-speed surface plankton net, the Coryphaena, together with a portable in-flux automated imaging device, the PlanktoScope. We deployed this kit in December 2020 along a latitudinal transect across the Atlantic Ocean on board the schooner Tara, during the first Leg of her ‘Mission Microbiomes’. The citizen-science instruments were benchmarked and compared at sea to state-of-the-art protocols applied in previous Tara expeditions, i.e. on-board water pumping and filtration system and the FlowCam to respectively sample and image total micro-plankton. Results show that the Coryphaena can collect pristine micro-plankton at speed up to 11 knots, generating quantitative imaging data comparable to those obtained from total, on-board filtered water, and that the PlanktoScope and FlowCam provide comparable data. Overall, the new citizen tools provided a complete picture of surface micro-plankton composition, biogeography and biogeochemistry, opening the way toward a global, cooperative, and frugal plankton observatory network at planetary scale.
1 Introduction
The oceans are home to a large diversity of planktonic organisms. The sensitivity of these organisms to their environment makes them exceptional sentinels of environmental changes, such as temperature rise (Beaugrand, 2005), or variation in currentology (Borkman and Smayda, 2009). Due to the non-linear response of plankton to environmental changes, plankton reaction to subtle environmental variations can be amplified, making plankton a potentially better indicator of environmental change than the environmental variables themselves (Taylor et al., 2002). Response of plankton to environmental changes is also rapid, due to the relatively short life cycle of phytoplankton (order of days) when compared with terrestrial plants (order of years to decades). For these reasons, plankton are often referred to as essential oceanic variables (EOV) and essential climate variables (ECV; Global Ocean Observing System; Global Climate Observing System; Bax et al., 2019). Sub-surface (<5m depth) planktonic communities are particularly sensitive to climate change (Bopp et al., 2013), while also being critical actors of biogeochemical cycles (Falkowski et al., 2008). Indeed, these communities face different environmental constraints than plankton thriving in deeper layers, notably in tropical oceans where water column stratification (thermocline/pycnocline) generates a barrier to nutrients upflow from the deep sea, and will increase in our warming world (IPCC 2022). Consequently, sub-surface plankton are more dependent on land or atmospheric inputs (e.g. aerosols, diazotrophy), and serve as a gateway to various nutrient inputs essential to the structuring of epipelagic planktonic ecosystems. Ocean surface layers are also a place of increased environmental stress for plankton such as waves, winds, and solar radiations. Therefore, the processes controlling the abundance and diversity of surface plankton may be significantly different from those observed for biota living in deeper layers (Ibarbalz et al., 2019).
Monitoring (sub)surface plankton in a global change context would require repeated, systematic, large-scale and high-resolution observations, a task that is hardly achievable with oceanographic vessels, which are too expensive to be used for this purpose (the operational cost of an ocean research vessel reaches typically >US$30,000 per day, excluding the cost of scientists, engineers, and the research itself; Lauro et al., 2014). On the other hand, thousands of sailing boats and larger vessels are permanently crossing the oceans, and could be used to this end. Brewin et al. (2017) demonstrated the potential for increased oceanographic data by exploiting these other vessels. A first example of this approach is the Continuous Plankton Recorder, which has generated a successful network of observations through cargo boats over the last 81 years (Batten et al., 2019). A complementary approach consists in engaging citizen sailors in the collection of planetary plankton, such as the ones engaged in the Indian Ocean (Lauro et al., 2014) or more globally at planetary scale in the ‘Plankton Planet’ initiative (de Vargas et al., 2020). Citizen science strategies require frugal, affordable, and scientifically-sound instruments, sufficiently agile and robust to be used by non-scientists.
We achieved a proof-of-principle for citizen oceanography in 2015/16, collaborating with 20 citizen sailors who performed plankton biomass sampling at more than 250 sites spanning the planetary oceans. The dried plankton samples were simply mailed by the sailors to a single laboratory, generating the first global-scale, high-quality DNA metabarcoding overview of plankton (>20µm) populations for a fraction of the putative cost associated to similar spatio-temporal sampling realized by a standard oceanographic vessel (de Vargas et al., 2020). The results of this first experiment were very promising but highlighted two main limitations. Firstly, sailors were asked to slow their boats down to less than two knots in order to deploy classical plankton nets without breaking the mesh. This requests uncomfortable sailing operations impacting the cruising speed, and it was identified as the primary limiting factor for denser sampling. Secondly, sailors expressed frustration for not being able to observe plankton while realizing the biomass-concentration protocol. Indeed, plankton imaging, which provides critical and complementary, quantitative and morphological information (Lombard et al., 2019), was not implemented due to prohibitive costs and complexity of existing instruments. To address these issues and promote large scale collection and monitoring of plankton in the 20-200µm range by sailors, we developed two new frugal tools for citizen oceanography: the ‘Coryphaena’, a high-speed net to collect plankton at cruising speeds, and the ‘PlanktoScope’, a frugal, microfluidic, quantitative imaging microscope (Pollina et al., 2020).
In this study, we tested the efficiency of both the Coryphaena and the PlanktoScope against established standards. Along a transect from Lorient (France) to Punta Arenas (Chile) carried out by the schooner Tara in December 2020, we compared the Coryphaena net to the Decknet system (DN; Gorsky et al., 2010), a suspended, on-board net that filters surface seawater collected by a high flow pump, and the PlanktoScope to the FlowCam (Sieracki et al., 1998), a standard flow-imaging system used in plankton research. The abundance, taxonomic and morphological diversity data from surface micro-plankton (20-200µm; analysis were performed in the 50-150μm size range) communities were used to assess the efficiency of each combination of instruments, and demonstrate the power of our new frugal tools for global-scale plankton ecology.
2 Materials and Methods
2.1 Sampling Methods
During the trans-Atlantic journey of the schooner Tara from Lorient (15/12/2020; France) to Punta Arenas (04/02/2021; Chile), 35 sampling stations were carried out daily (Figure 2). On board, two nets allowing sub-surface plankton sampling were deployed: the Coryphaena high speed net deployable up to 11 knots, and the Decknet (DN), suspended on the boat’s deck and coupled to a high-flow pumping system, validated and used during various previous Tara campaigns (Pesant et al., 2015; Gorsky et al., 2019). The DN filters the entire amount of water pumped on board by using a water inlet called the ‘Dolphin’ (Gorsky et al., 2019). The seawater is pre-filtered through a 2mm metal screen and subsequently concentrated through the DN suspended on the deck (Figure 1C). The volume of water concentrated in the DN was measured using a flow meter, ranging from 0.5 to 8 m3 (see Supplementary Table II), depending on local plankton density. The newly designed Coryphaena (Figure 1A), inspired from the Small Plankton Sampler (Glover 1953; Wiebe and Benfield, 2003), aims at collecting plankton >50µm at cruising speed (i.e. 1 to 11 knots; see Supplementary Table II). The Coryphaena has a mouth opening of 4 cm, a length of 80 cm, and a lead weight of 750 grams. Preliminary tests had shown that the Coryphaena is stable underwater at speeds below 11 knots while collecting seemingly pristine plankton. Higher speeds make it lift out of the water. The design of the Coryphaena is based on the use of (i) a 3D printed head that provides good aerodynamics while reducing the flow water into the net, in order to preserve both the net and plankton at high speed collection, (ii) a 50µm mesh supported externally by a 200µm mesh providing greater strength (Figure 1B), and (iii) an impermeable outside skirt increasing the filtration through the mesh by Venturi effect. Due to its small dimension, the placement of a flowmeter in the net was not possible. We therefore calculated the volume filtered, as its theoretical maximum in the absence of backflow, using the initial and final deployment coordinates and the net mouth opening. Wherever possible, two samples (on board DN and in situ Coryphaena) were acquired at the same station simultaneously. For practical comparison purposes, it was initially decided to use a DN with a 50µm mesh in contrast to previous Tara campaigns (Gorsky et al., 2019). However, as shown by results from the first 10 stations, this configuration led to over-efficient filtration damaging fragile organisms by abrasion on the drained silk. DN results from stations 1 to 10 were thus disregarded. A 20µm DN was thus used for the subsequent stations 11 to 35 while only considering organisms >40µm in the imaging results. A complete replacement of the Coryphaena net was carried out at station 21 following its destruction by, presumably, a swordfish.
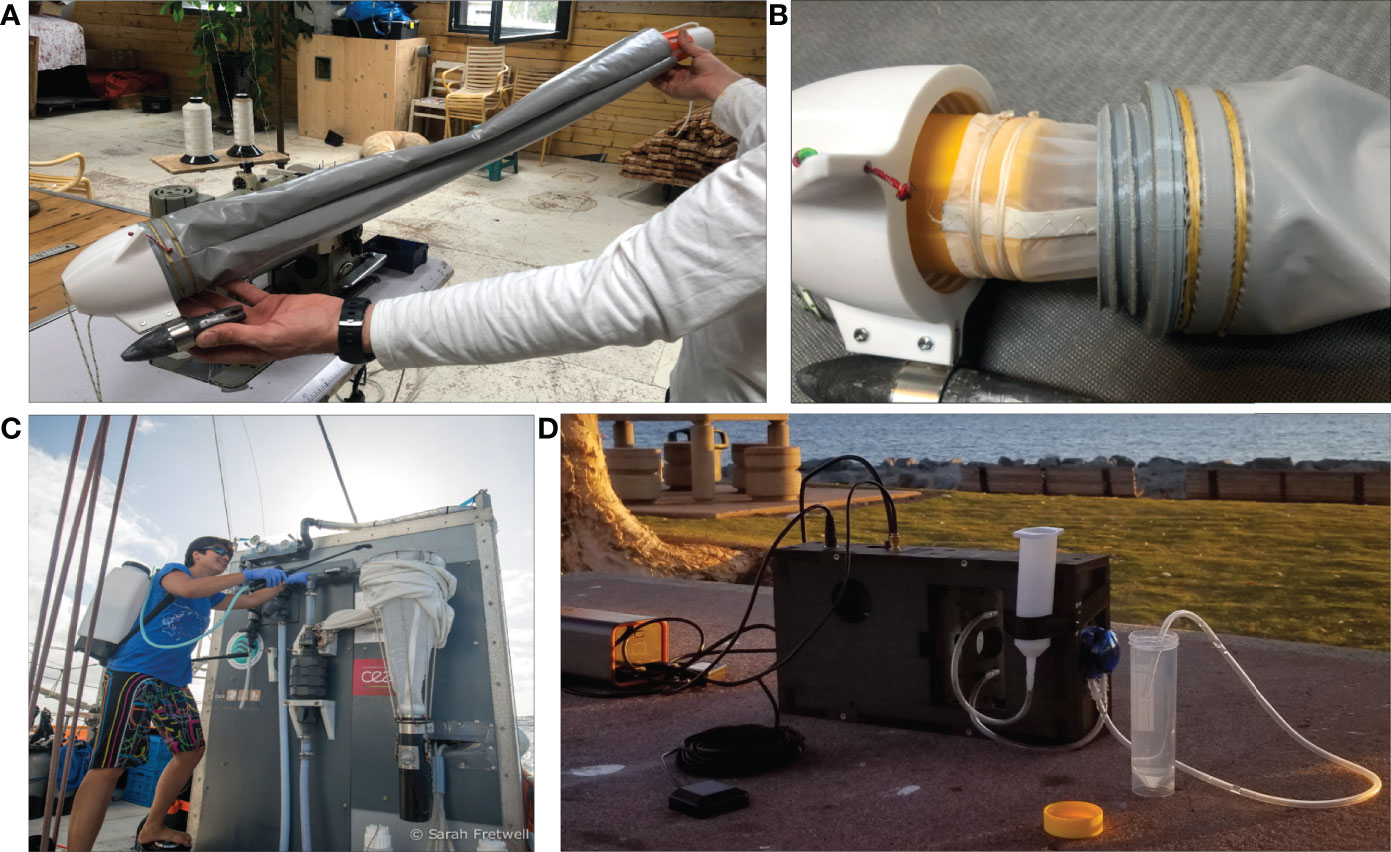
Figure 1 (A) The ‘Coryphaena’ high speed net, able to collect plankton >50µm at speed up to 11 knots. (B) The 50µm mesh in the Coryphaena is supported and protected externally by a 200µm mesh allowing for greater strength, as well as an impermeable skirt (gray) improving the flow of water into the net by Venturi effect. (C) The Decknet (DN) pumping and filtration system installed on board Tara. (D) The PlanktoScope allowing quantitative imaging of micro-plankton.
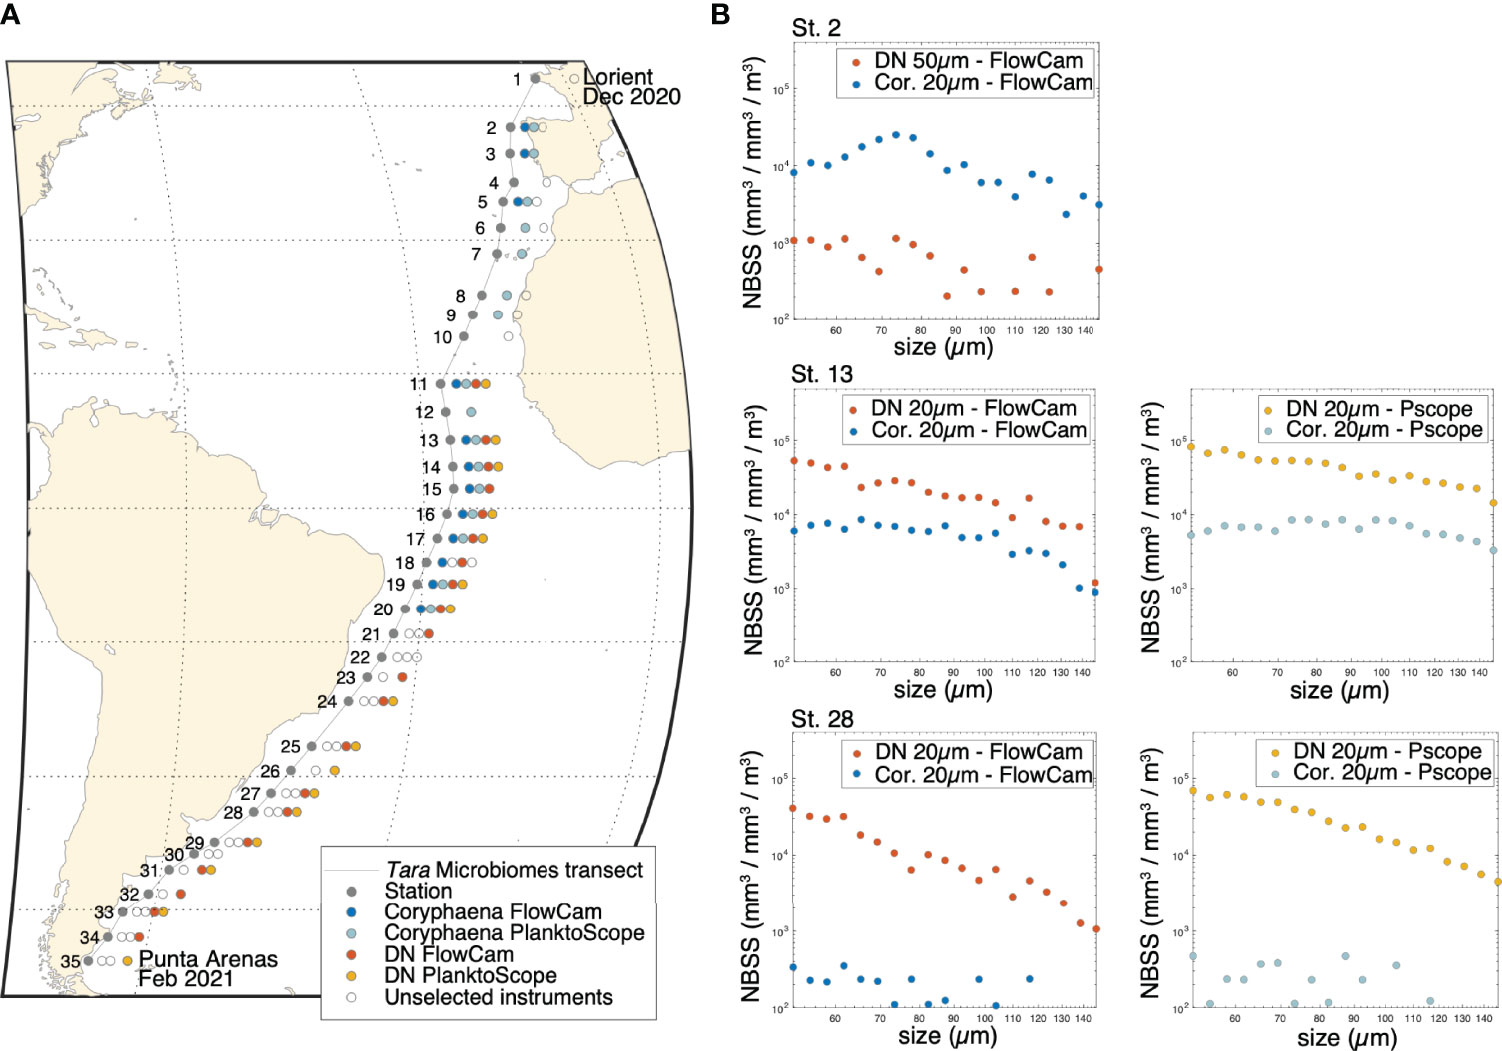
Figure 2 (A) Map of the Tara Mission Microbiomes Atlantic transect. The colored dot (see legend) indicates instruments’ configuration deployed at each of the 35 daily stations (gray dots). (B) Examples of Normalized Biovolume Size Spectra (NBSS) displaying the number of live organisms per size class (in mm3 mm-3 m-3) sampled by each net (DN - Decknet; Cor. - Coryphaena), at stations 2, 13 and 28. The comparison of the number of live organisms sampled between the two nets is shown for both FlowCam and PlanktoScope (Pscope) analyses at stations 13 and 28.
2.2 Image Acquisition
After collection, plankton from both Coryphaena and DN samples were filtered through a 200µm mesh to remove larger organisms which may clog the fluidic system of both the FlowCam and the PlanktoScope. The PlanktoScope (Figure 1D) is a cost-effective microscope (<800€ of hardware parts) allowing quantitative imaging of microplankton (in the 20-200μm size range). Full description and prior quality test are available in a companion article (Pollina et al., this issue). Initial tests generated data of a quality comparable to that produced by the FlowCam, an automated commercial microscope taking digital image of microscopic particles flowing through a capillary imaging chamber (Sieracki et al., 1998). The reliability of medium/high throughput imaging instruments for quantitative analysis of marine plankton is evidenced by a growing number of studies in the scientific community using these methods (Irisson et al., 2022). Notably FlowCam data have been compared and validated against microscopy analyses as regard to organismal size (Sieracki et al., 1998; Buskey and Hyatt, 2006; Ide et al., 2007; Álvarez et al., 2014; Le Bourg et al., 2015) and biovolume (Hrycik et al., 2019).
The four configurations, (1) Coryphaena - FlowCam, (2) Coryphaena - PlanktoScope, (3) DN - FlowCam and (4) DN - PlanktoScope, were tested in parallel whenever possible (Figure 2A). Images generated by the FlowCam were processed using the ZooProcess software (Gorsky et al., 2010), and images generated by the PlanktoScope were processed using a custom-made equivalent script in Matlab, a prototype of the segmentation script currently encoded into the PlanktoScope computer (see https://github.com/PlanktoScope/PlanktoScope). This allows similar extraction of the segmented objects as vignettes, together with a series of morphometric measurements that are then imported into the EcoTaxa web platform (http://ecotaxa.obs-vlfr.fr) for taxonomic classification. The taxonomic categories predicted by image recognition algorithms were validated or corrected by a trained taxonomist. Overall, 398, 466 vignettes (88, 465 for DN – FlowCam, 66, 243 for Coryphaena – FlowCam, 132, 322 for DN – PlanktoScope, 111, 436 for Coryphaena – PlanktoScope) were classified into 179 taxa (list Supplementary Table I; 34% of taxonomic categories correspond to the genus level, 23% to the species levels and the 43% to the other levels such as class, order or phylum). Examples of images from the PlanktoScope and FlowCam can be explored and compared in the supplementary material (Supplementary Figure 2) as well as on the EcoTaxa web platform (see project link in Data Availability Statement).
2.3 Environmental Data
On board Tara, surface seawater was continuously pumped through a hull inlet located 1.5m below the waterline and distributed to various instruments such as a ThermoSalinoGraph (TSG; SeaBird Electronics SBE45/SBE38) and a multispectral spectrophotometer (ACS; WETLabs), as performed during the Tara Pacific expedition (Gorsky et al., 2019). The ACS measures hyperspectral attenuation and absorption (resolution ~4nm) in the visible and near infrared, allowing notably to derive estimates of chlorophyll-a concentrations. The TSG measures surface temperature and conductivity at a sampling rate of 0.1 Hz. Additional environmental data were extracted from satellite data and/or the copernicus-mercator model (https://marine.copernicus.eu/fr). Satellite data were extracted via NASA ocean color (8-day average 4km/pixel) and 12 pixels (50km) around the sampling position and at the date of sampling were averaged to provide a single mean. The environmental data for the mercator model are extracted from marine Copernicus (GLOBAL_ANALYSIS_FORECAST_PHY_001_024-TDS and GLOBAL_ANALYSIS_FORECAST_BIO_001_028-TDS). A single, homogeneous environmental database was created from these multiple sources; missing TSG and ACS data were replaced by satellite data first, then by mercator model data. This database contains: sea surface temperature (SST; °C), salinity (psu), chlorophyll a (Chl; mg.m-3), O2 (mmg.m-3), NO3 (mmg.m-3), PO4 (mmg.m-3), Si (mmg.m-3), Fe (mmol.m-3), particulate inorganic carbon (PIC; mol.m-3) and pH, and is available with the associated sources of each environmental value (Supplementary Table IV).
2.4 Numerical and Statistical Analysis
For each database, we calculated organismal abundance (ind.m-3) and biovolume (mm3.m-3) for each taxa and functional group living versus non-living (see Supplementary Table I), taking into account the volumes of water filtered by the plankton collecting devices. Major and minor axes of the best ellipsoidal approximation are used to estimate the biovolume (mm3.m-3) of each object following Vandromme (Vandromme et al., 2012). Size is expressed as equivalent spherical diameter (ESD, μm). The individual biovolumes of the organisms are arranged in Normalized Biomass Size Spectra (NBSS) as described by Platt (1978) along an harmonic range of biovolume such as minimal and maximal biovolume of each class are linked such as:
The NBSS is obtained by dividing the total biovolume of each size class by its biovolume interval:
The NBSS (mm3.mm-3.m-3) is directly proportional to the number of organisms per size class. Biovolume analyses were only performed in the 50-150μm size range due to underestimation of the number of living organisms <50μm induced by undersampling of nets and/or difficulty in taxonomic identification, and mis-representation of organisms >150μm which were too rare beyond this size (Tranter and Smith, 1968; Pollina et al., 2020). First, we performed a quality control of the instruments to detect putative misfunctioning along the Tara transect, using NBSS which can reveal over or under sampling of one net and/or one imaging instrument compared to another. NBSS were also used to establish whether difference of sampling between the two nets affected all size classes similarly. We then used the various observations collected by the different combination of instruments to produce a homogeneous – intercalibrated global overview of plankton at the scale of the Atlantic Ocean. For this, we determined a correction coefficient using NBSS of living organisms in the 50 to 150μm size range. Using the DN-20μm - FlowCam dataset as a reference, we produced a correction coefficient (cross-size classes average correction coefficient) for each station, and further averaged across stations (after checking that no significant effect was visible across stations). After correcting for this sampling efficiency, we further inspected if some residual effect was visible on the species composition. For this a principal component analysis (PCA) was performed on a database that separates the 4 instrumental configurations adjusted with these coefficients. This PCA was performed both using abundance (log+1 transformed) or composition (Hellinger transformed) data. For these analyses, imaging data were clustered both taxonomically (179 taxa identified) and functionally (9 functional groups).
Finally, we used the various correction factors to produce a single cross-calibrated database providing microplankton average abundance and biovolume between the 4 instrumental configurations per station. This synthetic database was used to analyze the global structure of micro-plankton populations at the scale of the Atlantic Ocean. Diversity was calculated with the Shannon index (H) taking into account the 179 taxa identified. Hierarchical clustering analyses (using descriptive complete link method, and Hellinger distance) were performed using the 9 functional groups. Environmental data were integrated into the PCA to assess their impact on taxonomic composition at each station. Spearman correlation tests were performed between different variables (alpha risk set at 0.05%).
A morphological analysis partly based on plankton colors was performed on the vignettes from samples collected with the two nets and imaged with the PlanktoScope (the FlowCam model used generates black and white images). As this analysis focuses on the morphological properties of the objects and not their quantity, the difference in sampling between the 2 nets does not induce biases. Only vignettes corresponding to living organisms were considered, while detritus and optical artifacts were discarded. Following previous methodology (Trudnowska et al., 2021; Vilgrain et al., 2021), the data from 15 morphometric measurements were normalized by a non-linear Yeo-Johnson transformation prior to a PCA analysis. Station averages of the morphological values of the PCA axes were then calculated allowing the extraction of morphological metrics at the station scale.
3 Results
3.1 Quality Control and Comparison of the Instruments
3.1.1 Instruments’ Quality Control
While Tara was cruising southward through the Atlantic Ocean, we used the Normalized Biomass Size Spectra (NBSS, roughly equivalent to organismal abundances per size class) produced by the different plankton collection tools, i.e. the Coryphaena and the Decknet, to check and compare their efficiency (Figure 2). We first observed a severe under-sampling of the DN-50μm as compared to the Coryphaena-20μm from stations 1 to 10. The Coryphaena samples were on average 10.21 ( ± 7.42) more abundant than the DN-50μm samples, regardless of the imaging instrument, Figure 2A). Starting from station 11 (Figure 2A), we therefore replaced the DN-50μm with a DN-20μm. Between stations 11 and 20, the NBSS from both the DN-20μm and the Coryphaena displayed about the same order of magnitudes of abundances (e.g. station 13, Figure 2B, see also next section: Coryphaena and PlanktoScope characterization). Between station 20 and 21 the initial Coryphaena was lost, and the new Coryphaena used from station 21 displayed strong under sampling with Coryphaena/DN sampling coefficients averaging 0.35 ( ± 0.76) between stations 21 to 31, regardless of the imaging instrument (e.g. station 28, Figure 2B). The Coryphaena data were thus not used after station 21. We then compared the results obtained with the PlanktoScope versus the FlowCam. Samples imaged with the PlanktoScope displayed slightly higher abundances of living organisms than those imaged with the FlowCam (e.g. station 13, Figure 2B, and see next section). Data generated from both imaging instruments were used. All values of NBSS spectra per station (station 1 to 35) can be found in Supplementary Table III.
3.1.2 Coryphaena and PlanktoScope Characterization
We compared the 4 quality-controlled and filtered databases from the 4 configurations to determine a cross-size classes average correction coefficient between the instruments based on the NBSS biovolumes of living organisms from 50 to 150μm. The correction coefficient between the two nets is equal to 0.35 (standard deviation of 0.34) meaning that the Coryphaena under-samples live organisms by about one third compared to the DN. The correction coefficient between the two imaging devices is 1.86 (standard deviation of 1.17), indicating that more live organisms (+86%, ± 17%) were observed in the PlanktoScope compared to the FlowCam. The correction factors were applied to the different datasets, and a PCA was used to reveal putative residual effects of the sampling method. The first 3 axes of the PCA were considered and color-coded in RGB to visually inspect coherence between the plankton collection and imaging devices (Figure 3A). Per station, the symbols share a similar color (Figure 3B) therefore exhibiting similar plankton taxo-functional composition regardless of instrumental configuration (Figures 3A, B). No significant effect of the different modes of sampling/imaging is observed, the variance resulting mainly from geographical difference in taxo-functional composition. Similar PCA analyses based on the 179 identified taxa (dot color corresponds to instrumental configuration; Figure 3C) revealed a difference between the two nets, with the Coryphaena samples enriched in robust plankton (e.g. Neoceratium spp. or Rhabdonella spp.) as opposed to fragile ones (e.g. diatoms like Hemiaulus or Eucampia spp.). However, these differences are only visible in the second axis of the PCA (13% variance explained), suggesting that this bias is essentially concentrated on specific taxa. Even at the scale of 179 taxa, we observed a good agreement between the two imaging instruments (good overlap between PlanktoScope and FlowCam points on Figure 3C).
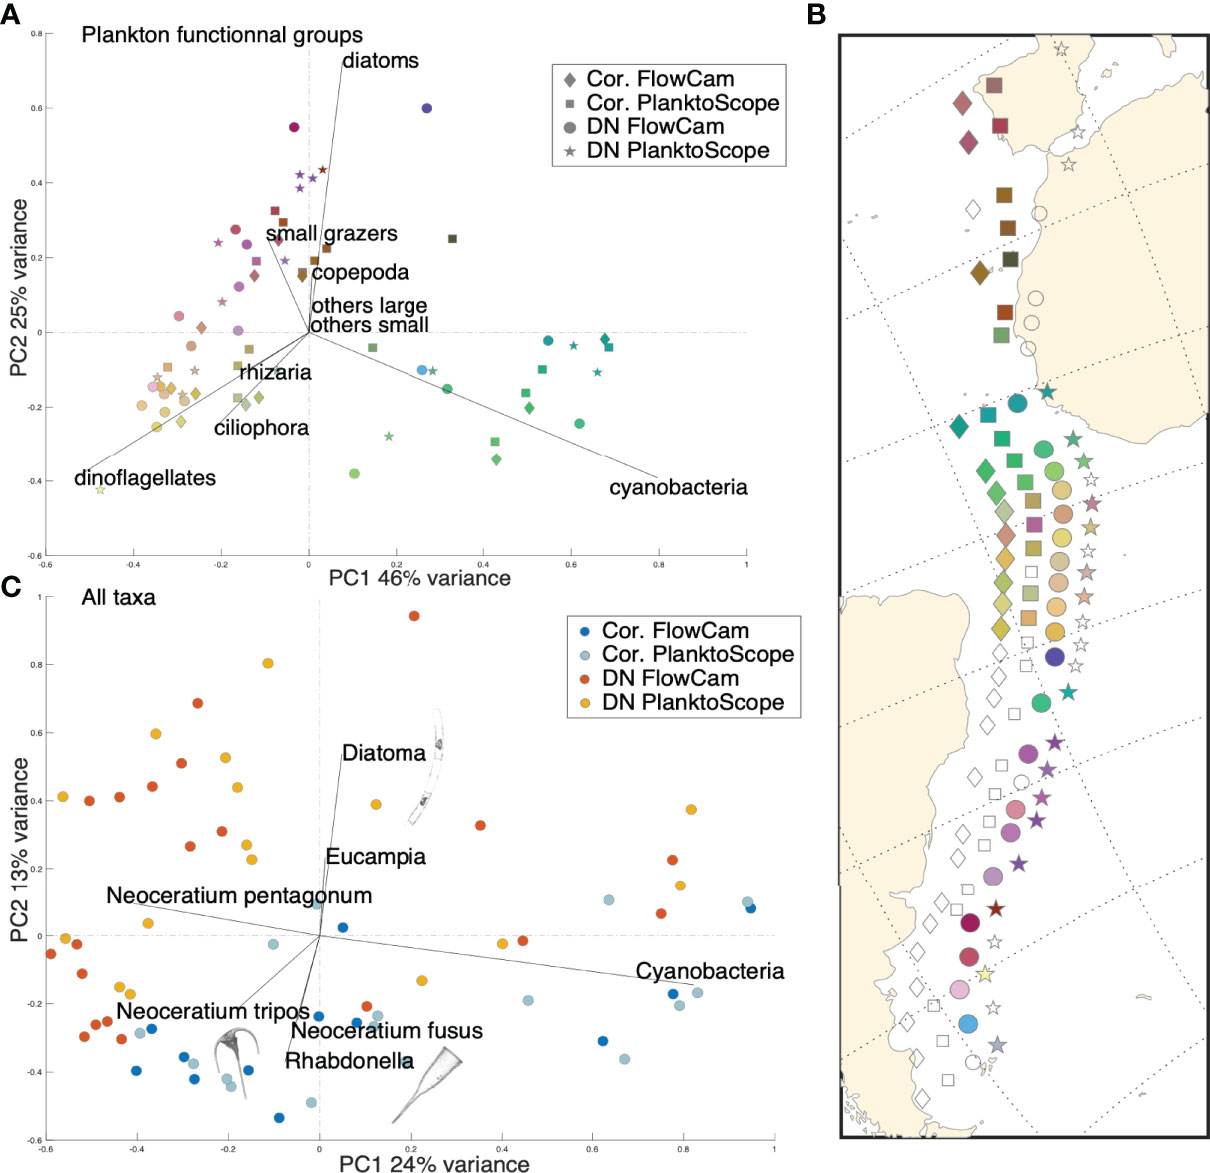
Figure 3 (A) PCA performed on microplankton functional composition (Hellinger transformed data, 9 taxo-functional groups). The 4 instrumental configurations (sampling-imaging devices couples) are represented by the 4 different shapes. Colors are derived from the position of the points on the first 3 axes of the PCA. (B) Geographic projection of each point along the Tara Atlantic transect (exact position of the stations: diamond shape Cor. FlowCam). The empty shapes represent the instrumental configurations deployed but not selected in our analysis (see Figure 2 and section: Instrument’s Quality Control). (C) PCA performed on microplankton taxonomic composition (Hellinger transformed data; 179 taxa). The 4 instrumental configurations are represented by the 4 different colors. Only taxa with a contribution greater than 0.23 to the PCA axes are shown for ease of reading. Plankton images taken as examples are from FlowCam; the image close to ‘Diatoma’ corresponds to a diatom of the genus Hemiaulus, the image close to ‘Rhabdonella’ corresponds to a ciliate of the genus Rhabdonella and the image close to ‘Neoceratium tripos’ corresponds to a dinoflagellate of the species Neoceratium tripos.
3.2 Surface Microplankton Communities in Relation to Environmental Characteristics
By combining the different datasets with the correction factors, we obtained a single homogenized dataset for micro-plankton along the Tara Mission Microbiomes Atlantic transect minimizing biases due the heterogeneous sampling and imaging. Microplankton absolute abundance values vary from a minimum of ca. 2K ind.m-3 at station 9 to a 200 times higher maximum of ca. 4Mio ind.m-3 at station 23, of which 3.5 Mio ind.m-3 (or 3500 cells/L) are diatoms of the genus Hemiaulus (Figure 4B). The Shannon H indices range from 3.32 (station 19) to 0.54 (station 23) along the Tara track (Figure 4C) and display a significant inverse correlation (p = 0.0008<0.05; R2 = -0.59) to absolute abundance. We performed a clustering analysis (descriptive complete link method, Hellinger distance) based on the relative abundances of the 9 plankton taxo-functional groups. Eight clusters of stations emerged based mainly on differences in their diatoms, cyanobacteria, and dinoflagellates composition (Figure 5A). These clusters correlate to specific environmental (Figure 5A) and biogeographic (Figures 4, 5B) features. The oligotrophic zone (stations 9 to 14) is characterized by microplankton communities dominated by cyanobacteria and associated to high sea surface temperatures (SST) and iron (Fe) concentrations. Conversely, coastal and temperate zones plankton are dominated by diatoms associated with high NO3 concentrations (stations 2 to 8, 16, 23, 25 to 32 and 35). PO4-rich areas deprived of iron (stations 15, 17 to 21 and 33) are associated with microplankton communities rich in dinoflagellates.
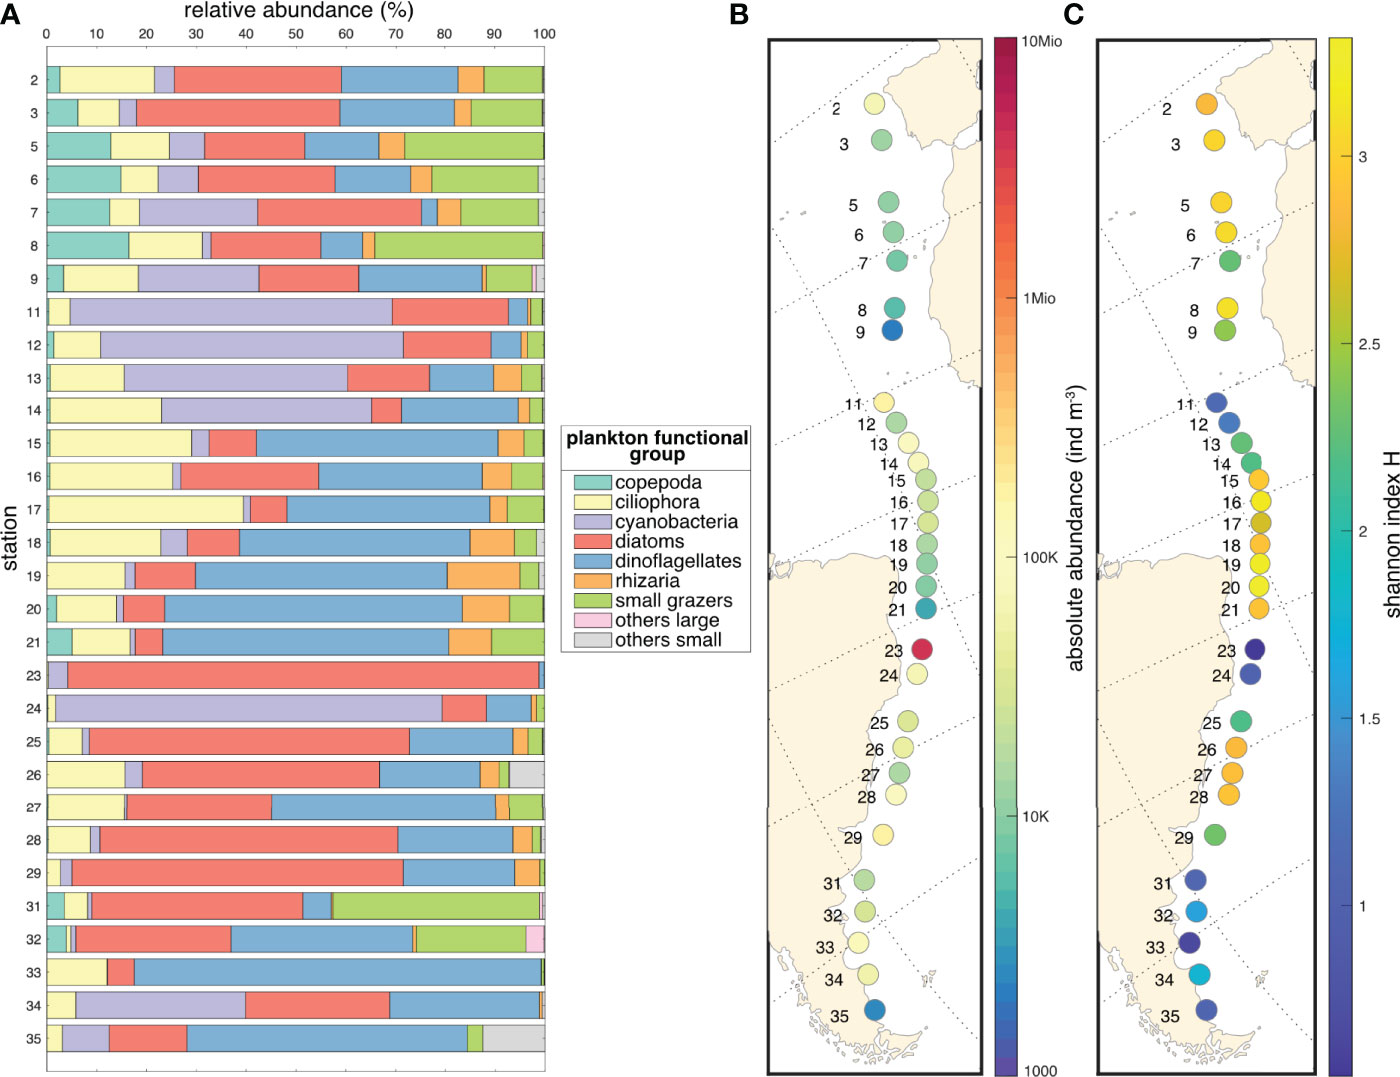
Figure 4 (A) Relative abundance of the nine microplanktonic taxo-functional groups per station. (B) Absolute microplankton abundance values in individuals m-3 along the Tara Mission Microbiomes Atlantic transect. (C) Microplankton diversity (Shannon index H) at each station. H-index values are determined from the 179 taxa.
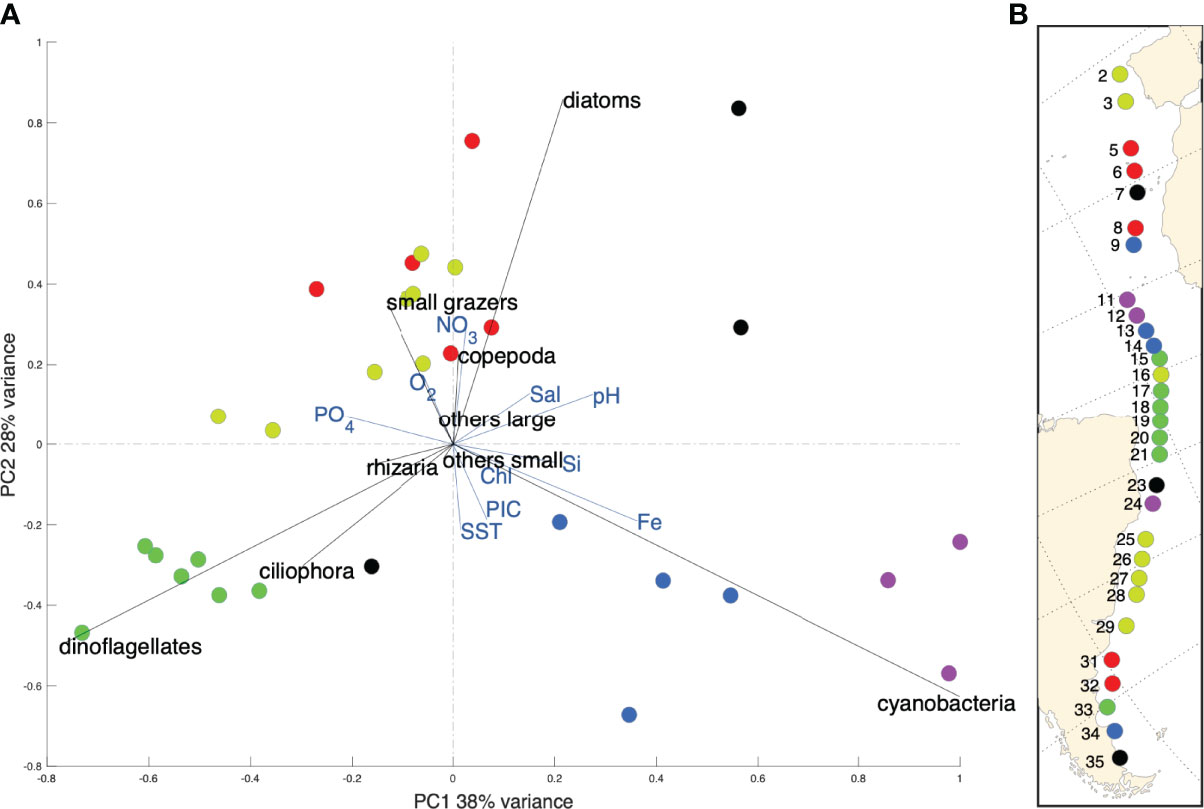
Figure 5 (A) PCA performed on the taxonomic composition at the functional scale (9 taxo-functional groups, Hellinger transformed data) and including key environmental variables. The colors correspond to the 8 characteristic clusters determined via an independent hierarchical analysis based on Euclidean distance. (B) The taxo-functional clusters are projected on the Mission Microbiomes Atlantic transect with corresponding station numbers.
3.3 Morphological Analysis of Surface Microplankton
The PCA analysis performed on 15 morphological variables (Figure 6A) defined a typical morphometric space on the first axis (40% of variance explained) with small round organisms on one end, and larger, elongated organisms on the other end (positive values; Figure 6B). The second PCA axis (23% of variance explained) corresponds to a color space, with green and red colored organisms for positive values and transparent, lightly blue-colored organisms for negative values. At the station level across the Tara Mission Microbiomes Atlantic transect (Figure 6B), a trend in the size and shape of organisms (axis 1; Figure 6B) is observed. Microplankton communities are dominated by relatively large, elongated organisms at the beginning of the transect (stations 1 to 12), and communities characterized by increasingly small and round organisms south of the equator in the more coastal stations 16 to 35. Stations 11 and 12 displaying very low diversity in the North Atlantic showed clear morphological signals corresponding to communities dominated by Trichodesmium cyanobacteria (>60% that are large, elongated and poorly colored cells; see Figure 4A).
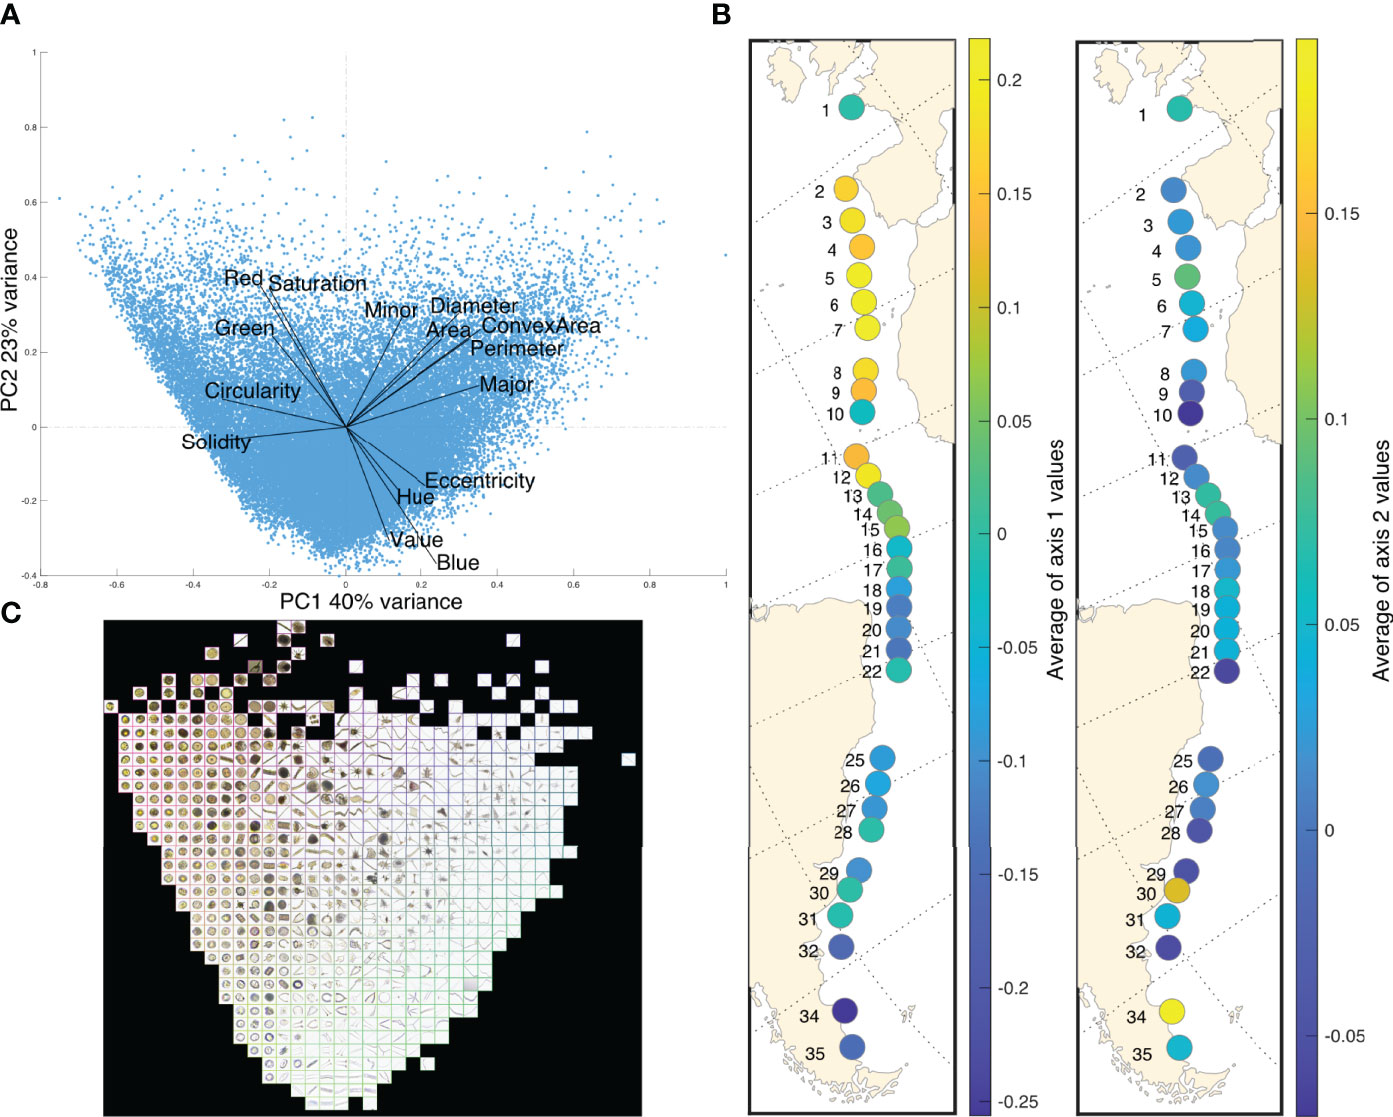
Figure 6 (A) PCA performed on morphological variables characterizing the size, shape and color of microplankton (Euclidean distance). (B) Morphological characteristics of microplankton along the Tara Mission Microbiomes Atlantic transect, represented by morphometric (left side, PCA axis 1 values, average per station) and color (right side, PCA axis 2 values, average per station) features. (C) Representation of the PCA space by characteristic PlanktoScope vignettes.
4 Discussion
4.1 Characterization of our New Citizen Plankton Sampling and Imaging Gears
The concurrent deployment of validated and novel plankton sampling devices allowed quality check of our new frugal tools. Comparison of the two nets (DN and Coryphaena) first revealed a significant under-sampling of the DN-50µm, hypothetically explained by a too large mesh size (Heron, 1968) and the resulting abrasion of planktonic organisms flowing onto the dry silk leading to strong degradation. On the other hand, the silk of the DN-20µm stays immersed in water due to the slower filtration process, leading to better plankton preservation and good-quality samples that could be used as standard for further comparison with the Coryphaena. Such comparison allowed us to identify significant under-sampling of the second Coryphaena, when it was replaced due to the loss of the original net. The new Coryphaena net probably had a manufacturing defect such as hole(s) in the collector mesh; future versions will need to integrate solutions to quality-check the material before deployment in the field.
4.1.1 Coryphaena
The Coryphaena net was deployed while Tara was cruising at speeds between 4 and 11 knots. A reduction of the flow due to filtration resistance through the mesh (Tranter and Smith, 1968) is thus expected, in opposition to the DN where all the water collected is filtered through the system (Gorsky et al., 2019). Consistently, the Coryphaena sampled less than the DN-20µm net (correction factor=0.35). Comparatively, replicate water collections using the same type of net display 17% variability on average on plankton biomass, and between 20% and 50% variability between two different nets types (Skjoldal et al., 2013). The variability between the 2 plankton collection gears observed herein (~35%) can therefore be considered as relatively low, and thus validates the sampling efficiency of the Coryphaena. Such discrepancies between sampling gears have been shown in many past studies (e.g., Herdman, 1921; Barnes and Marshall, 1951; Anraku, 1956 and Wiebe and Wiebe, 1968), and are typically due to net avoidance, mesh extrusion, escapement, and especially to non-random distribution of plankton (local plankton patchiness; Robinson et al., 2021). Indeed, unlike laboratory experiments where all variables are isolated and controlled, field trials to validate technologies such as the Coryphaena and DN, induce variability dependent on local conditions. Part of the variability observed between instruments could therefore result from plankton heterogeneity in the ocean (Robinson et al., 2021). Notably, although performed in the same area, the Coryphaena sampling took on average 25 min (maximum 55 min), while the DN needed between 1-2 hours to filter ca. equivalent volumes of surface sea-waters (0.5 to 4 cubic meters; see Supplementary Table II). However, the correction factors between the two nets (0.35) allowed us to adjust their quantitative biases toward a global, surface plankton analysis. The Coryphaena adjusted data display minor differences as compared to the DN data, with notable under-sampling of certain taxa. This slight difference is likely due to the relatively high sampling speed that generates increasing pressure across the mesh (Keen, 2013) and damage some organisms. This explains our results showing higher sampling of fragile taxa, such as Diatoma and Eucampia, by the DN when compared to the Coryphaena (Figure 3C). This adds up to putative ‘mesh selection’ effect (Heron, 1968; Vannucci, 1968) related to the elongated shapes of certain fragile plankton (see the FlowCam image of the taxa Diatoma on Figure 3C), i.e. these can get stuck in the 50µm-mesh of the Coryphaena net and/or be more prone to escape through the mesh and thus not be analyzed by quantitative imaging.
4.1.2 PlanktoScope
The PlanktoScope and the FlowCam were previously compared on a single plankton sample collected offshore the Mediterranean marine laboratory of Villefranche/Mer (Pollina et al., this issue) showing a higher abundances of living organisms data collected by the PlanktoScope for equivalent volume of water analyzed (correction factor=2.24). Here, we carried out an extensive characterization of the PlanktoScope performances over an Atlantic transect on board Tara. This comparison reinforces the higher abundances of living organisms data collected by the PlanktoScope with respect to the FlowCam (correction factor=1.86). This difference could be explained by the FlowCam operating protocol involving a better homogenization of the sample in the syringe injecting plankton into the system. Indeed, low plankton mixing favors sedimentation at the bottom of the admission syringe of the PlanktoScope, putatively driving larger and biased concentrations into the system. Tests confirming such sedimentation bias within the PlanktoScope have been performed lately, allowing adjustments of the hardware and protocol to avoid this shortcoming in future PlanktoScope deployments.
4.2 Accurate and Underway, Citizen-Tools Based Assessment of Microplankton at Basin-Scale
4.2.1 Microplankton Taxonomic Composition Across the Atlantic Ocean
Overall, our study has allowed consistent description of surface micro-plankton taxonomic composition in direct relation to environmental constraints and biogeography. The correlations we found between taxo-functional groups and environmental features (Figures 4, 5) are consistent with the plankton-environment associations summarized in Margalef’s revisited mandala (Glibert, 2016), and highlight the central role of various nutrient limitations in the structure of surface microplankton composition and their abundance as described by Moore et al. (2013). These consistencies thus show the power of our new frugal tools to assess plankton ecology on a global scale.
In our dataset diatoms correlate with high NO3 concentrations and are found in eutrophic and cold areas (Figure 5), which is consistent with the physiological appetence of diatoms to nitrate absorption and storage (Glibert et al., 2016). Trichodesmium cyanobacteria negatively correlated with macronutrients (NO3 and PO4) and dominated warm oligotrophic zones, which is consistent with their diazotrophy allowing them to fix dissolved N2. Since ca. 99% of ocean nitrogen is in the form of dissolved N2 (Gruber and Galloway, 2008), diazotrophic cyanobacteria have a major ecological advantage in oligotrophic areas, however they require 2.5 to 100 times more iron than non-diazotrophic organisms (Zehr, 2011), which explains their positive association with iron in our results (Figure 5). The geographic distribution of Trichodesmium cyanobacteria in our study (stations 9 to 14; Figures 4A, 5) is otherwise broadly consistent with that observed across 8 Atlantic Meridional Transect (AMT) cruises (Tyrrell, 2003), demonstrating predominance in the region between 0 and ~15°N, with an average filament concentration in the surface layer of 300 ± 101 filaments l-1 and a maximum of >600 filaments l-1. The observed correlation between PO4 and dinoflagellates is also found in Margalef’s revisited mandala (Glibert, 2016). However, (bio)chemicals factors such as nutrients limitations are incomplete predictors of plankton community structure (Lima-Mendez et al., 2015). Plankton symbiotic relationships must be considered, especially in the oligotrophic water masses at tropical and subtropical latitudes where mutualistic species interactions are prevalent (Massana, 2015). Of note, our absolute abundance data point to a bloom of the colonial diatom Hemiaulus hauckii at station 23 (Figure 4), an area where such bloom was previously reported (Carpenter et al., 1999). This diatom bloom occurs in NO3-poor waters, which is explained by the presence of the endosymbiontic diazotrophic cyanobacterium Richelia in Hemiaulus cells, providing to the diatom host the nitrogen needed to thrive in these otherwise oligotrophic waters (Villareal, 1992; Carpenter et al., 1999). Images from the PlanktoScope allow direct confirmation of this biotic interaction in the sampled populations (Supplementary Figure 1). Station 24, characterized by an even stronger nitrate limitation but with higher iron concentrations, was dominated by cyanobacteria (Figures 4, 5). We thus detected a shift from diazotrophic symbiotic diatoms to diazotrophic cyanobacteria, likely due to different levels of nitrogen versus iron limitation between two consecutive stations separated by 372 km.
4.2.2 Exploring the Morphometric and Color Spaces of Surface Atlantic Microplankton
The relatively large image dataset collected here (370 175 images) by the Coryphaena/PlanktoScope frugal kit allows exploration of the morphological traits of surface-water microplankton across large environmental and geographic scales, independently of the tedious semi-automated taxonomic annotation of all vignette individually. Our results (Figure 6) show only a very weak morphological signal (mean PCA value close to 0; Figures 6C, D). This high variability highlights the extreme diversity of plankton morphological characteristics (size, shape, and color) previously described in the literature (e.g. recently, Ibarbalz et al., 2019; Ryabov et al., 2021). Only a few stations with low Shannon diversity (but high dominance of a single taxon, e.g. station 11 an 12; Figures 5, 6) display distinct morphological components that match the morphological traits of the dominant organism. The majority of the variance (first axis 40% of variance; Figure 6) is explained by a typical morphological space opposing different shapes and sizes. This morphometric space is echoed in a study by Ryabov et al. (2021) where cell elongation and cell volume together explained up to 92% of the total variance. Indeed, it is known that environmental conditions, such as nutrients, light or temperature, affect the shape and size distributions of plankton (Naselli-Flores et al., 2007; Stanca et al., 2013; Ryabov et al., 2021) confirming that both size and shape are crucial determinants of fitness. Given that our study focused on surface plankton, we would expect a predominance of round shapes while elongated shapes are mostly found in deep waters as they would optimize chloroplast aggregation along the cell surface and increase light harvesting (O’Farrell et al., 2007). However, a predominance of round shapes is not clearly visible in our results, and is highly counteracted by the large presence of Trichodesmium filaments. The fact that including color information gathers 26% variance in our dataset (Figure 6), further shows that coloration is an important plankton trait (Martini et al., 2021) that previous morphologic studies conducted only on shape and size have deeply ignored because of technological constraints. The onset of a new generation of instruments with color capabilities, like the PlanktoScope, will allow us to tackle such unexplored plankton traits.
These morphological methods are very promising for large datasets, and will prove valuable for the work we propose in the context of large-scale citizen science observations. For in-depth analyses of plankton morphological traits, beyond the addition of color information, improvements can still be made, such as analyses on more precise taxonomic groups like in Ryabov et al. (2021) which showed distinct and different diversities within each taxonomic group or a clustering method on PCA coordinates in order to distinguish distinct morphotypes as done by Ibarbalz et al. (2019) on plankton or by Trudnowska et al. (2021) on marine snow.
5 Conclusion
This study demonstrates that frugal and affordable tools for biological oceanography can match the quality of validated scientific instruments. The PlanktoScope, a simple imaging system, yielded results comparable to that of the Flowcam, a state-of-the-art scientific instrument. The Coryphaena, a 3D-printed net allowing collection of micro-plankton at speeds up to 11 knots, recovered plankton communities matching the ones sampled by a validated concentration system. Improvements can certainly be made to these instruments, notably to increase their robustness; however, these represent great perspectives for cooperative plankton studies over unique spatio-temporal scales by citizen sailors. Furthermore, we have also shown how our new frugal tools enabled low-cost collection of consistent plankton data at basin scale allowing taxonomic and morphological assessment and analysis of surface plankton over a 6 months time frame from plankton sampling to statistical analysis of the data. Our results are in agreement with previous observations, showing that the taxonomic and morphological compositions of surface plankton are essentially controlled by different nutrient limitations selecting specific phytoplanktonic functional groups and symbiotic associations. Overall, this shows that long-term collaborative plankton monitoring at planetary scale is not anymore a dream, and such endeavor would provide the ‘essential oceanic and climatic variable’ (Bax et al., 2019) critically needed to model oceanic ecosystems facing global changes.
Data Avaibility Statement
The datasets analyzed for this study can be found in the EcoTaxa web platform:
https://ecotaxa.obs-vlfr.fr/prj/3891
https://ecotaxa.obs-vlfr.fr/prj/3892
https://ecotaxa.obs-vlfr.fr/prj/4343
https://ecotaxa.obs-vlfr.fr/prj/4356
Author Contributions
ZM: taxonomic annotation, data analysis, wrote the manuscript AO: designed the study, sample acquisition, constructive comments, revised the manuscript. DG: designed the study, sample acquisition, constructive comments. TP: designed the study, data analysis, constructive comments. RB: designed the study, data analysis, constructive comments. CM: designed study, logistical support. RT: designed study, logistical support. MP: designed study, constructive comments. CV: designed the study, constructive comments, revised and edited the manuscript. FL: designed the study, constructive comments, revised and edited the manuscript, supervised the study. All authors contributed to the article and approved the submitted version.
Funding
This study used EU Copernicus Marine Service Information and Mercator Ocean products. This project has received funding from the European Union’s Horizon 2020 research and innovation programme “Atlantic Ecosystems Assessment, Forecasting and Sustainability” (AtlantECO) under grant agreement No 862923 (ZM, FL, AO and CV), the CNRS MITI OOSP grant (AO), the ‘Plankton Arts’ grant from the Fondation d’Entreprise Total (TP, MP, CdV), and the COMPLEx team (ZM fellowship).
Conflict of Interest
The authors declare that the research was conducted in the absence of any commercial or financial relationships that could be construed as a potential conflict of interest.
Publisher’s Note
All claims expressed in this article are solely those of the authors and do not necessarily represent those of their affiliated organizations, or those of the publisher, the editors and the reviewers. Any product that may be evaluated in this article, or claim that may be made by its manufacturer, is not guaranteed or endorsed by the publisher.
Acknowledgments
We would like to thank the ‘Plankton Planet’ team (https://planktonplanet.org) who has developed the Coryphaena and PlanktoScope over the last few years, and in particular Niels Haentjens, Guillaume Bourdin, and Emmanuel Boss for the installation of the inline biophysics sensors on board Tara. We thank the CNRS, CEA, CMM, Sorbonne Université, Institut Universitaire de France (IUF), as well as the Tara Ocean Foundation team and its partners: agnès b., BIC, Capgemini Engineering, Fondation Groupe EDF, Compagnie Nationale du Rhône, L’Oréal, Biotherm, Région Bretagne, Lorient Agglomeration, Billerudkorsnas, Havas Paris, Fondation Rothschild, Office Français de la Biodiversité, AmerisourceBergen, Philgood Foundation, UNESCO-IOC, Etienne Bourgois. This article is contribution number 2 of Tara Mission Microbiomes and number 4 of Plankton Planet.
Supplementary Material
The Supplementary Material for this article can be found online at: https://www.frontiersin.org/articles/10.3389/fmars.2022.916025/full#supplementary-material
References
Álvarez E., Moyano M., López-Urrutia Á., Nogueira E., Scharek R. (2014). Routine Determination of Plankton Community Composition and Size Structure: A Comparison Between FlowCAM and Light Microscopy. J. Plank. Res. 36, 170–184. doi: 10.1093/plankt/fbt069
Anraku M. (1956). Some Experiments on the Variability of Horizontal Plankton Hauls and on the Horizontal Distribution of Plankton in a Limited Area. North Sea Research Report of the Department of Aquaculture, Hokkaido University 7 (1), 1–16.
Barnes H. T., Marshall S. M. (1951). On the Variability of Replicate Plankton Samples and Some Applications of ‘Contagious’ Series to the Statistical Distribution of Catches Over Restricted Periods. J. Mar. Biol. Assoc. Unite. Kingdom. 30 (2), 233–263. doi: 10.1017/S002531540001273X
Batten S. D., Abu-Alhaija R., Chiba S., Edwards M., Graham G., Jyothibabu R., et al. (2019). A Global Plankton Diversity Monitoring Program. Front. Mar. Sci. 6. doi: 10.3389/fmars.2019.00321
Bax N. J., Miloslavich P., Muller-Karger F. E., Allain V., Appeltans W., Batten S. D., et al. (2019). A Response to Scientific and Societal Needs for Marine Biological Observations. Front. Mar. Sci. 6. doi: 10.3389/fmars.2019.00395
Beaugrand G. (2005). Monitoring Pelagic Ecosystems Using Plankton Indicators. ICES. J. Mar. Sci. 62, 333–338. doi: 10.1016/j.icesjms.2005.01.002
Bopp L., Resplandy L., Orr J. C., Doney S. C., Dunne J. P., Gehlen M., et al. (2013). Multiple Stressors of Ocean Ecosystems in the 21st Century: Projections With CMIP5 Models. Biogeosciences 10, 6225–6245. doi: 10.5194/bg-10-6225-2013
Borkman D. G., Smayda T. J. (2009). Gulf Stream Position and Winter NAO as Drivers of Long-Term Variations in the Bloom Phenology of the Diatom Skeletonema Costatum “Species-Complex” in Narragansett Bay, RI, USA. J. Plank. Res. 31, 1407–1425. doi: 10.1093/plankt/fbp072
Brewin R. J. W., Hyder K., Andersson A. J., Billson O., Bresnahan P. J., Brewin T. G., et al. (2017). Expanding Aquatic Observations Through Recreation. Front. Mar. Sci. 4. doi: 10.3389/fmars.2017.00351
Buskey and Hyatt, 2006: Buskey E. J., Hyatt C. J. (2006). Use of the FlowCAM for semi-automated recognition and enumeration of red tide cells (Karenia brevis) in natural plankton samples. Harmful Algae 5, 685–692. doi: 10.1016/j.hal.2006.02.003
Carpenter E., Montoya J., Burns J., Mulholland M., Subramaniam A., Capone D. (1999). Extensive Bloom of a N2-Fixing Diatom/Cyanobacterial Association in the Tropical Atlantic Ocean. Mar. Ecol. Prog. Ser. 185, 273–283. doi: 10.3354/meps185273
de Vargas C., Pollina T., Romac S., Le Bescot N., Henry N., Berger C., et al. (2020). Plankton Planet : ‘Seatizen’ Oceanography to Assess Open Ocean Life at the Planetary Scale. Ecology. bioRxiv 08 (31), 263442. doi: 10.1101/2020.08.31.263442
Falkowski P. G., Fenchel T., Delong E. F. (2008). The Microbial Engines That Drive Earth’s Biogeochemical Cycles. Science 320, 1034–1039. doi: 10.1126/science.1153213
Glibert P. M. (2016). Margalef Revisited: A New Phytoplankton Mandala Incorporating Twelve Dimensions, Including Nutritional Physiology. Harm. Algae. 55, 25–30. doi: 10.1016/j.hal.2016.01.008
Glibert P. M., Wilkerson F. P., Dugdale R. C., Raven J. A., Dupont C. L., Leavitt P. R., et al. (2016). Pluses and Minuses of Ammonium and Nitrate Uptake and Assimilation by Phytoplankton and Implications for Productivity and Community Composition, With Emphasis on Nitrogen-Enriched Conditions: Pluses and Minuses of NH4+ and NO3–. Limnol. Oceanogr. 61, 165–197. doi: 10.1002/lno.10203
Glover, 1953: Glover R. S. (1953). The Hardy plankton indicator and sampler: a description of the various models in use. Bulletin of Marine. Ecology, 4, 7–20.
Gorsky G., Bourdin G., Lombard F., Pedrotti M. L., Audrain S., Bin N., et al. (2019). Expanding Tara Oceans Protocols for Underway, Ecosystemic Sampling of the Ocean-Atmosphere Interface During Tara Pacific Expedition, (2016–2018). Front. Mar. Sci. 6. doi: 10.3389/fmars.2019.00750
Gorsky G., Ohman M. D., Picheral M., Gasparini S., Stemmann L., Romagnan J.-B., et al. (2010). Digital Zooplankton Image Analysis Using the ZooScan Integrated System. J. Plank. Res. 32, 285–303. doi: 10.1093/plankt/fbp124
Gruber N., Galloway J. N. (2008). An Earth-System Perspective of the Global Nitrogen Cycle. Nature 451, 293–296. doi: 10.1038/nature06592
Herdman W. A. (1921). Variation in Successive Vertical Plankton Hauls at Port Erin. In. Proc. Trans. Liverpool. Biol. Soc. 35, 161–174. doi:10.1017/S002531540001273X
Heron A. C., (1968). “Plankton gauze" in Zooplankton Sampling, ed. The United Nations Educational, Scientific and Cultural Organization (UNESCO), ISBN 92-3101194-4, 19-27.
Hrycik A. R., Shambaugh A., Stockwell J. D. (2019). Comparison of FlowCAM and Microscope Biovolume Measurements for a Diverse Freshwater Phytoplankton Community. J. Plank. Res. 41, 849–864. doi: 10.1093/plankt/fbz056
Ibarbalz F. M., Henry N., Brandão M. C., Martini S., Busseni G., Byrne H., et al. (2019). Global Trends in Marine Plankton Diversity Across Kingdoms of Life. Cell 179, 1084–1097.e21. doi: 10.1016/j.cell.2019.10.008
Ide K., Takahashi K., Kuwata A., Nakamachi M., Saito H. (2007). A Rapid Analysis of Copepod Feeding Using FlowCAM. J. Plank. Res. 30, 275–281. doi: 10.1093/plankt/fbm108
Irisson J.-O., Ayata S.-D., Lindsay D. J., Karp-Boss L., Stemmann L. (2022). Machine Learning for the Study of Plankton and Marine Snow From Images. Annu. Rev. Mar. Sci. 14, 277–301. doi: 10.1146/annurev-marine-041921-013023
IPCC2022: Climate Change 2022: Impacts, Adaptation, and Vulnerability. Contribution of Working Group II to the Sixth Assessment Report of the Intergovernmental Panel on Climate Change [Pörtner H.-O., Roberts D.C., Tignor M., Poloczanska E.S., Mintenbeck K., Alegría A., Craig M., Langsdorf S., Löschke S., Möller V., Okem A., Rama B. (eds.)].Cambridge University Press: In Press.
Lauro F. M., Senstius S. J., Cullen J., Neches R., Jensen R. M., Brown M. V., et al. (2014). The Common Oceanographer: Crowdsourcing the Collection of Oceanographic Data. PloS Biol. 12, e1001947. doi: 10.1371/journal.pbio.1001947
Le Bourg B., Cornet-Barthaux V., Pagano M., Blanchot J. (2015). FlowCAM as a Tool for Studying Small (80–1000 µm) Metazooplankton Communities. J. Plank. Res. 37, 666–670. doi: 10.1093/plankt/fbv025
Lima-Mendez G., Faust K., Henry N., Decelle J., Colin S., Carcillo F., et al. (2015). Determinants of Community Structure in the Global Plankton Interactome. Science 348, 1262073. doi: 10.1126/science.1262073
Lombard F., Boss E., Waite A. M., Vogt M., Uitz J., Stemmann L., et al. (2019). Globally Consistent Quantitative Observations of Planktonic Ecosystems. Front. Mar. Sci. 6. doi: 10.3389/fmars.2019.00196
Martini S., Larras F., Boyé A., Faure E., Aberle N., Archambault P., et al. (2021). Functional Trait-Based Approaches as a Common Framework for Aquatic Ecologists. Limnol. Oceanogr. 66, 965–994. doi: 10.1002/lno.11655
Massana R., Ohtsuka S., Suzaki T., Horiguchi T., Suzuki N., Not F. (2015). “Protistan Diversity in Environmental Molecular Surveys,” in Marine Protists. Eds. (Tokyo: Springer Japan), 3–21. doi: 10.1007/978-4-431-55130-0_1
Moore C. M., Mills M. M., Arrigo K. R., Berman-Frank I., Bopp L., Boyd P. W., et al. (2013). Processes and Patterns of Oceanic Nutrient Limitation. Nat. Geosci. 6, 701–710. doi: 10.1038/ngeo1765
Naselli-Flores L., Padisák J., Albay M. (2007). Shape and Size in Phytoplankton Ecology: Do They Matter? Hydrobiologia 578, 157–161. doi: 10.1007/s10750-006-2815-z
O’Farrell I., de Tezanos Pinto P., Izaguirre I. (2007). Phytoplankton Morphological Response to the Underwater Light Conditions in a Vegetated Wetland. Hydrobiologia 578, 65–77. doi: 10.1007/s10750-006-0434-3
Pesant S., Not F., Picheral M., Kandels-Lewis S., Le Bescot N., Gorsky G., et al. (2015). Open Science Resources for the Discovery and Analysis of Tara Oceans Data. Sci. Data 2, 150023. doi: 10.1038/sdata.2015.23
Platt T., Steele J. H. (1978). “Spectral Analysis of Spatial Structure in Phytoplankton Populations,” in Spatial Pattern in Plankton Communities. Ed. (Boston: MA: Springer US), 73–84. doi: 10.1007/978-1-4899-2195-6_4
Pollina T., Larson A. G., Lombard F., Li H., Colin S., de Vargas C., et al. (2020). PlanktonScope: Affordable Modular Imaging Platform for Citizen Oceanography. Bioengineering. 4 (23), 056978. doi: 10.1101/2020.04.23.056978
Robinson K. L., Sponaugle S., Luo J. Y., Gleiber M. R., Cowen R. K. (2021). Big or Small, Patchy All: Resolution of Marine Plankton Patch Structure at Micro- to Submesoscales for 36 Taxa. Sci. Adv. 7, eabk2904. doi: 10.1126/sciadv.abk2904
Ryabov A., Kerimoglu O., Litchman E., Olenina I., Roselli L., Basset A., et al. (2021). Shape Matters: The Relationship Between Cell Geometry and Diversity in Phytoplankton. Ecol. Lett. 24, 847–861. doi: 10.1111/ele.13680
Sieracki C., Sieracki M., Yentsch C. (1998). An Imaging-in-Flow System for Automated Analysis of Marine Microplankton. Mar. Ecol. Prog. Ser. 168, 285–296. doi: 10.3354/meps168285
Skjoldal H. R., Wiebe P. H., Postel L., Knutsen T., Kaartvedt S., Sameoto D. D. (2013). Intercomparison of Zooplankton (Net) Sampling Systems: Results From the ICES/GLOBEC Sea-Going Workshop. Prog. Oceanog. 108, 1–42. doi: 10.1016/j.pocean.2012.10.006
Stanca E., Cellamare M., Basset A. (2013). Geometric Shape as a Trait to Study Phytoplankton Distributions in Aquatic Ecosystems. Hydrobiologia 701, 99–116. doi: 10.1007/s10750-012-1262-2
Taylor A. H., Allen J. I., Clark P. A. (2002). Extraction of a Weak Climatic Signal by an Ecosystem. Nature 416, 629–632. doi: 10.1038/416629a
Tranter D.J., Smith P.E., The United Nations Educational, Scientific and Cultural Organization (UNESCO), ISBNTranter and Smith, 1968: (1968). “Filtration performance” in Zooplankton Sampling, ed. 92-3101194-4, 27-57
Trudnowska E., Lacour L., Ardyna M., Rogge A., Irisson J. O., Waite A. M., et al. (2021). Marine Snow Morphology Illuminates the Evolution of Phytoplankton Blooms and Determines Their Subsequent Vertical Export. Nat. Commun. 12, 2816. doi: 10.1038/s41467-021-22994-4
Tyrrell T. (2003). Large-Scale Latitudinal Distribution of Trichodesmium Spp. In the Atlantic Ocean. J. Plank. Res. 25, 405–416. doi: 10.1093/plankt/25.4.405
Vandromme P., Stemmann L., Garcìa-Comas C., Berline L., Sun X., Gorsky G. (2012). Assessing Biases in Computing Size Spectra of Automatically Classified Zooplankton From Imaging Systems: A Case Study With the ZooScan Integrated System. Methods Oceanog. 1–2, 3–21. doi: 10.1016/j.mio.2012.06.001
Vannucci M. (1968). “Loss of organisms through the meshes” in Zooplankton Sampling, ed. The United Nations Educational, Scientific and Cultural Organization (UNESCO), ISBN 92-3101194-4,19-27
Vilgrain L., Maps F., Picheral M., Babin M., Aubry C., Irisson J., et al. (2021). Trait-Based Approach Using in Situ Copepod Images Reveals Contrasting Ecological Patterns Across an Arctic Ice Melt Zone. Limnol. Oceanogr. 66, 1155–1167. doi: 10.1002/lno.11672
Villareal T. A., Carpenter E. J., Capone D. G., Rueter J. G. (1992). “Marine Nitrogen-Fixing Diatom-Cyanobacteria Symbioses,” in Marine Pelagic Cyanobacteria: Trichodesmium and Other Diazotrophs. Eds. (Dordrecht: Springer Netherlands), 163–175. doi: 10.1007/978-94-015-7977-3_10
Wiebe P. H., Benfield M. C. (2003). From the Hensen Net Toward Four-Dimensional Biological Oceanography. Prog. Oceanog. 56, 7–136. doi: 10.1016/S0079-6611(02)00140-4. doi: 10.4319/lo.1968.13.2.0315
Wiebe P. H., Wiebe P. H. (1968). Plankton Patchiness: Effects on Repeated Net Tows 1. Limnol. Oceanog. 13 (2), 315–321. doi: 10.4319/lo.1968.13.2.0315
Keywords: citizen sciences, microplankton, Tara Mission microbiomes, Coryphaena net, PlanktoScope, global ecology
Citation: Mériguet Z, Oddone A, Le Guen D, Pollina T, Bazile R, Moulin C, Troublé R, Prakash M, de Vargas C and Lombard F (2022) Basin-Scale Underway Quantitative Survey of Surface Microplankton Using Affordable Collection and Imaging Tools Deployed From Tara. Front. Mar. Sci. 9:916025. doi: 10.3389/fmars.2022.916025
Received: 08 April 2022; Accepted: 02 June 2022;
Published: 05 July 2022.
Edited by:
Griet Neukermans, Ghent University, BelgiumReviewed by:
Bob Brewin, University of Exeter, United KingdomHiroyuki Yamamoto, Japan Agency for Marine-Earth Science and Technology (JAMSTEC) Japan
Enrique Nogueira, Spanish Institute of Oceanography (IEO), Spain
Copyright © 2022 Mériguet, Oddone, Le Guen, Pollina, Bazile, Moulin, Troublé, Prakash, de Vargas and Lombard. This is an open-access article distributed under the terms of the Creative Commons Attribution License (CC BY). The use, distribution or reproduction in other forums is permitted, provided the original author(s) and the copyright owner(s) are credited and that the original publication in this journal is cited, in accordance with accepted academic practice. No use, distribution or reproduction is permitted which does not comply with these terms.
*Correspondence: Zoé Mériguet, em9lLm1lcmlndWV0QGdtYWlsLmNvbQ==; Colomban de Vargas, dmFyZ2FzQHNiLXJvc2NvZmYuZnI=; Fabien Lombard, bG9tYmFyZEBvYnMtdmxmci5mcg==