 Caiyun Huan
 Dongzhe Lu
 Shengxiao Zhao1,2
 Wenhua Wang
 Xin Li
- 1 Key Laboratory of Far-shore Wind Power Technology of Zhejiang Province, Hangzhou, China
- 2 Renewable Energy Engineering Institute, PowerChina Huadong Engineering Corporation Limited, Hangzhou, China
- 3 State Key Laboratory of Coastal and Offshore Engineering, Dalian University of Technology, Dalian, China
- 4 Institute of Earthquake Engineering, Faculty of Infrastructure Engineering, Dalian University of Technology, Dalian, China
The jacket substructure is generalized for offshore wind farms in the southeastern offshore regions of China. The dynamic characteristics and coupling mechanisms of jacket offshore wind turbines (OWTs) have been extensively investigated using numerical simulation tools. However, limited dynamic model tests have been designed and performed for such types of OWTs. Therefore, the coupling mechanisms of jacket OWTs that are determined using numerical methods require further validation based on experimental tests. Accordingly, an integrated scaled jacket OWT physical test model is designed in this study. It consists of a scaled rotor nacelle assembly (RNA) and support structure model. For the scaled RNA model, a redesigned blade model is adopted to ensure the similarity of the aerodynamic thrust loads without modifying the scaled test winds. Auxiliary scaled drivetrain and blade pitch control system models are designed to simulate the operational states of a practical OWT. The scaled model of the OWT support structure is fabricated on the basis of the joint hydro-structural elastic similarities. A sensor arrangement involving a three-component load cell and acceleration sensors is used to record the OWT thrust loads and model motions, respectively. Then, dynamic model tests under typical scaled wind fields are implemented. Furthermore, the coupling mechanisms of the OWT model under various test winds are investigated using the wavelet packet method, and the influences of inflow winds, operational states, and mechanical strategies are introduced.
1 Introduction
Wind energy has recently become one of the most promising renewable energies. Moreover, offshore wind energy systems compared with onshore wind energy frameworks have attracted considerable attention, owing to their superior wind conditions and lower consumption of land resources (Shi et al., 2013; Wang et al., 2022). According to the Global Wind Energy Council, the capacities of constructed offshore wind farms in China exceeded 10 GW in 2021 and accounted for 80% of the newly increased capacities worldwide. The majority of offshore wind farms in China are located at a water depth of 10–40 m; accordingly, the monopile and jacket substructures are generalized. An example of the foregoing is the Zhuanghe offshore wind farm located in the northeastern offshore regions in China. As a typical non-linear coupling system, the dynamic characteristics and coupling mechanisms of monopile and jacket offshore wind turbines (OWTs) under complex environmental loads have been extensively studied by researchers. The developed coupled simulation tools can be categorized as follows.
According to structural dynamics, finite element, and hydrodynamic theories, additional substructure dynamic and hydrodynamic moduli are introduced to a simulation tool, i.e., FAST, which is originally developed to capture the structural motions of land-based wind turbines (WTs) (Jonkman, 2005). The aero-servo-hydro-elastic coupled numerical model for OWTs was established in the newly released FAST v8 (Jonkman and Jonkman, 2016) and OpenFAST (Jonkman and Sprague, 2021) software. By introducing an auxiliary finite element software that can simulate soil– structure interactions (SSIs), Abhinav and Saha (2017) and Plodpradit et al. (2019) investigated the effects of SSI on the coupled responses of an OWT using FAST v7 and FAST v8. More significant effects have been demonstrated on an operational OWT considering wind speeds from the rated to cut-out range. Xi et al. (2021) and Carswell et al. (2022) investigated the influence of SSI on the cumulative fatigue damage of a monopile OWT using the updated FAST v7 software with an additional SSI module. The results proved that the reduction in structural fatigue life can reach 30% for a parked OWT considering SSI compared with that under fixed boundary conditions. Ren et al. (2022) analyzed the dynamic analysis of a multi-column tension leg platform (TLP) floating OWT with broken tendons in FAST v7 software and examine the system performance under the accidental limit states described in the design code DNV-RP-0286. Zhao et al. (2021) conducted a fully coupled analysis of a novel semi-submersible floating OWT in OpenFAST (Jonkman and Sprague, 2021) and particularly observed the influence of threefold blade passing frequency on mooring line tension responses.Meanwhile, slightly different from the established multibody dynamics model of rotor nacelle assembly (RNA) in FAST, the linear beam model was employed to simulate the RNA flexibilities in a coupled numerical analysis in Bladed (Bossanyi, 2011), Horizontal axis wind turbine simulation code 2nd generation (HAWC2) (Larsen and Hansen, 2007), and SIMA (DNV, 2018). The influences of different fault conditions and related shutdown procedures on the OWT dynamic responses were studied by Etemaddar et al. (2016) based on the established coupled numerical model in HAWC2. Sørum et al. (2017) and Putri et al. (2020) established an aero-servo-hydro-elastic coupled numerical model of monopile and spar OWTs in SIMA to study the dynamic characteristics and coupling mechanisms of typical bottom-fixed and floating OWTs under different limit sea states. In addition to the foregoing popularized coupled simulation tools, other coupled analysis methods for floating OWTs based on computational fluid dynamics theories have been recommended. These methods include those proposed by Kim and Sclavounos (2001) and Li et al. (2016). Cheng et al. (2019) investigated the dynamic responses of a semi-submersible floating OWT using the proposed coupled analysis method (Li et al., 2016) and discussed the interactions between hydrodynamic and floating platform motions.Moreover, experimental tests of typical OWTs were performed to investigate their structural dynamics under typical sea states. The key problem in the OWT model tests is ensuring the similarity between aerodynamic and hydrodynamic considerations. To solve this problem, the following categorized representative methods are adopted in the tests in addition to the alternative real-time hybrid test method (Bachynski et al., 2016; Thys et al., 2019). The most prominent characteristic of these methods is the use of a numerical model of the prototype RNA instead of the real scaled physical model employed in subsequent studies to ensure that the Reynolds numbers are similar. (1) In the equivalent circular disc model, only the aerodynamic thrust loads are ensured to be scaled, and the gyroscopic effects of the rotor system are ignored, similar to the study of Wang et al. (2017). Using a scaled equivalent circular disc-tower-substructure physical model designed based on joint hydro-structural elastic similarities, the dynamic responses of a pentapod OWT under earthquake, wind, wave, and current loads were investigated. Wan et al. (2015) investigated the performance of a spar torus combination in a parked state using a simplified drag disc model consisting of a spar-floating OWT and a torus-shaped heaving-body wave energy converter. (2) The principal feature of the scaled RNA model based on hydrodynamic similarity is that the prototype rotor blade airfoils are directly applied to the scaled RNA model. Thus, the test wind speed has to be increased to ensure thrust load similarities; the overestimated wind loads are measured on the scaled tower model (Martin, 2011). The coupling mechanisms of a parked TLP floating OWT under extreme sea states were tested by Ren et al. (2012). To ensure the precision of the scaled thrust loads, the test winds of the scaled RNA model were calibrated using the Froude number similarity. To predict the OC3-Hywind platform seakeeping performance, Ahn and Shin considered the Froude number similarity in their study (Ahn and Shin, 2019). The limitations of the geometry scaled RNA model were also investigated, leading to the suggestion that the model should be calibrated on the basis of the low–Reynolds number test wind fields to ensure the modeling accuracy of OWT coupling mechanisms under combined wind and wave test cases. (3) A performance-scaled RNA model was applied to simplified test wind fields to alleviate the Reynolds number scaling effects at specified inflow winds. Du et al. (2016) implemented basin tests on a semi-submersible floating OWT using a performance-scaled RNA model to investigate the dynamic characteristics and validate the coupled numerical model of a floating OWT.The determination of aero and hydrodynamic similarities is a key issue for OWT model tests. According to the introduced studies, the latter one represented by Froude number similarity is priorly reserved in the water basin experiments, and the strictly aerodynamic similarity is substituted by the scaling of essential aerodynamic parameters, e.g., the thrust loads and rotor speeds. Hence, the appropriate design of scaled RNA model shall significantly influence the accuracy of OWT model tests, and limited studies are performed for the ultra-large OWTs. To improve the designed method of scaled RNA model and investigate the dynamic characteristics of ultra-large OWTs under typical environmental conditions, the integrated test method consisting of performance scaled RNA model and scaled support structure model using joint hydro-structural elastic similarities for an ultra-large jacket OWT is studied. Moreover, the fabrication of blade and support structure model, the design of scaled drivetrain and pitch control systems to ensure the accurate scaling of aerodynamic loads and operational parameters is another key issue in the presented test method. The paper is organized as follows. The derivation of essential similarities for the scaled OWT model design is presented in Section 2. Moreover, the redesigned scaled RNA model based on released aerodynamic similarities and scaled support structure model using joint hydro-structural elastic similarities are introduced in detail. The sensor arrangement and test facilities are also described in this section. The wavelet packet method applied in the processing of the test data is introduced in Section 3. In Section 4, the calibration of test wind files and scaled RNA model is discussed. Moreover, the discovered coupling mechanisms of the scaled OWT model under various test wind fields based on decomposed measured data using the wavelet packet method are systematically illustrated. On the basis of the observed experimental phenomena, the conclusions regarding the coupling mechanisms of OWT under different inflow winds and operational states are summarized in Section 5.
2 Dynamic Model Design Method of Jacket OWT
2.1 Joint Hydro-Structural Elastic Similarities for OWT Model Tests
For the dynamic model tests of bottom fixed OWTs, in addition to the structural elastic similarity in Eq. (1), the aero and hydro similarities should also be ensured. For the former one, it means that the viscous and inertia forces should be appropriately scaled, and the Reynolds number is priorly applied to ensure such similarities, as the definition in Eq. (2). Meanwhile, the hydrodynamic inertia and gravity loads dominated the motions of offshore structures under the wave excitations, so the related Froude number similarity in Eq. (3) is generalized selected in the physical model tests of offshore structures under wave loads. As the definitions in Eqs. (2) and (3), owing to the remarkable discrepancies in the velocity scale ratios between the Reynolds and Froude number similarities, these two similarities cannot be synchronously and strictly satisfied in the OWT model experiments. Considering that the primary purpose of the present OWT model experiments is to study the structural dynamic characteristics of an OWT under wind and wave loads and to refer to the published dynamic model tests of offshore structures, the Froude number similarity represents the scaling of hydrodynamic inertia and gravity loads is applied in the design of scaled OWT model, and the strict requirements of Reynolds number similarity are released. The consistent loads scaling method is also observed in the dynamic model tests of typical floating OWTs, such as the studies of Browning et al. (2014) and Tomasicchio et al. (2018); the spar floating OWT is scaled on the basis of the Froude number similarity to ensure the similarities of hydrodynamic loads; then, the scaled test winds are modified to improve the modeling accuracy of aerodynamic thrust loads on the rotor blades. Moreover, using the Froude number similarity, the dynamic model tests of a TLP floating OWT under winds and waves are carried out by Song and Lim (2019).
To alleviate the small scaling effects in the design of OWT test model, the structural elastic similarity is updated as Eq. (5) for the structure motions dominated by the bending modes in the scaled model design (Lin et al., 2000), by introducing the sectional bending stiffness similarity represented by the inertia radius scale ratio λr. According to the related published OWT model tests studies and the primary concern of the present study, the Froude number similarity in Eq. (3) is applied to scale the hydrodynamic inertia and gravity forces stimulated by waves. Note that the acceleration scale ratio λg should be equal with 1.0 in the tests, and then the relations between the time and length scale ratios can be obtained on the basis of the Froude number similarity, as expressed in Eq. (4). Meanwhile, the density scale ratio is also assumed as 1.0 to simplify the derivations. Sequentially, the joint hydro-structural elastic similarities are proposed by substituting Eq. (4) into Eq. (5), and it can be rewritten as Eq. (6). On the basis of the above derivations, the joint hydro-structural elastic similarities are proposed for the OWT scaled model design. Then, the scale ratios of essential model parameters are calculated according to the proposed hydro-structural elastic similarities, as listed in Table 1.
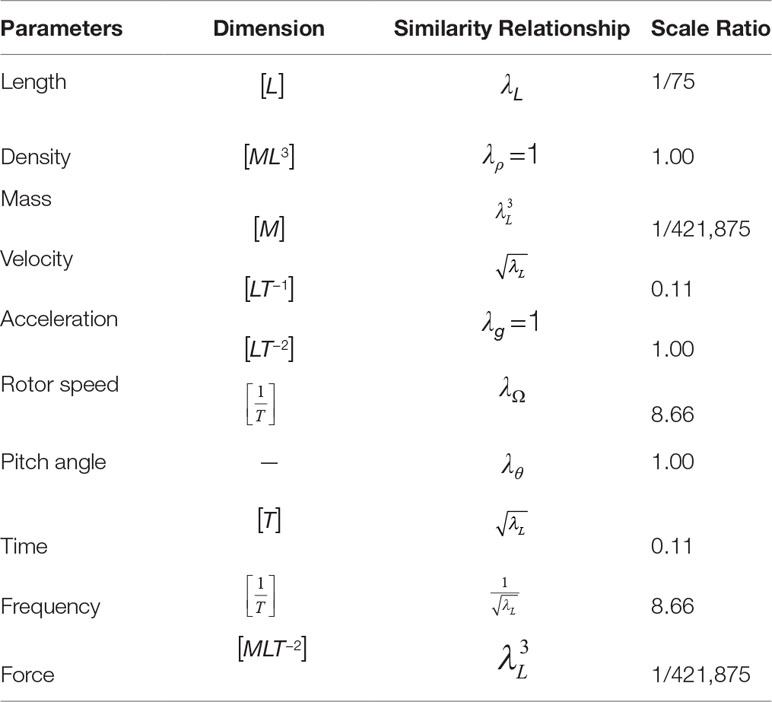
Table 1 Scale ratios of essential model parameters.
where λρ, λA, λu, and λI are the structural material density, section area, deformation, and section inertia moment scale ratios, respectively; λL and λv are the length and velocity scale ratios; λt, λE, and λr are the time, elastic modulus, and inertia radius scale ratios, respectively.
2.2 Prototype OWT and Environmental Conditions
The OWT prototype jacket is illustrated in Figure 1. The figure indicates that the original OWT consists of an upwind WT system and jacket substructure. The WT system is identical to the DTU 10-MW baseline WT designed by the Technical University of Denmark (Bak et al., 2013). However, certain specifications of the DTU tower are modified (e.g., the tower height is modified to 85.48 m) and applied to the jacket OWT based on the real environmental conditions measured in the southeastern offshore regions of China. The other fundamental parameters of the WT system and tower are listed in Table 2. Furthermore, the jacket substructure was designed according to recorded marine conditions. To ensure the steady operation of the WT system and structural safety at a water depth of 40.00 m, mud braces and four levels of X-braces were designed along the four-legged jackets. The top and bottom widths of the jacket are 12.00 and 15.00 m, respectively, and the substructure height is 70.15 m. Further details on the geometries of the support system are shown in Figure 1.
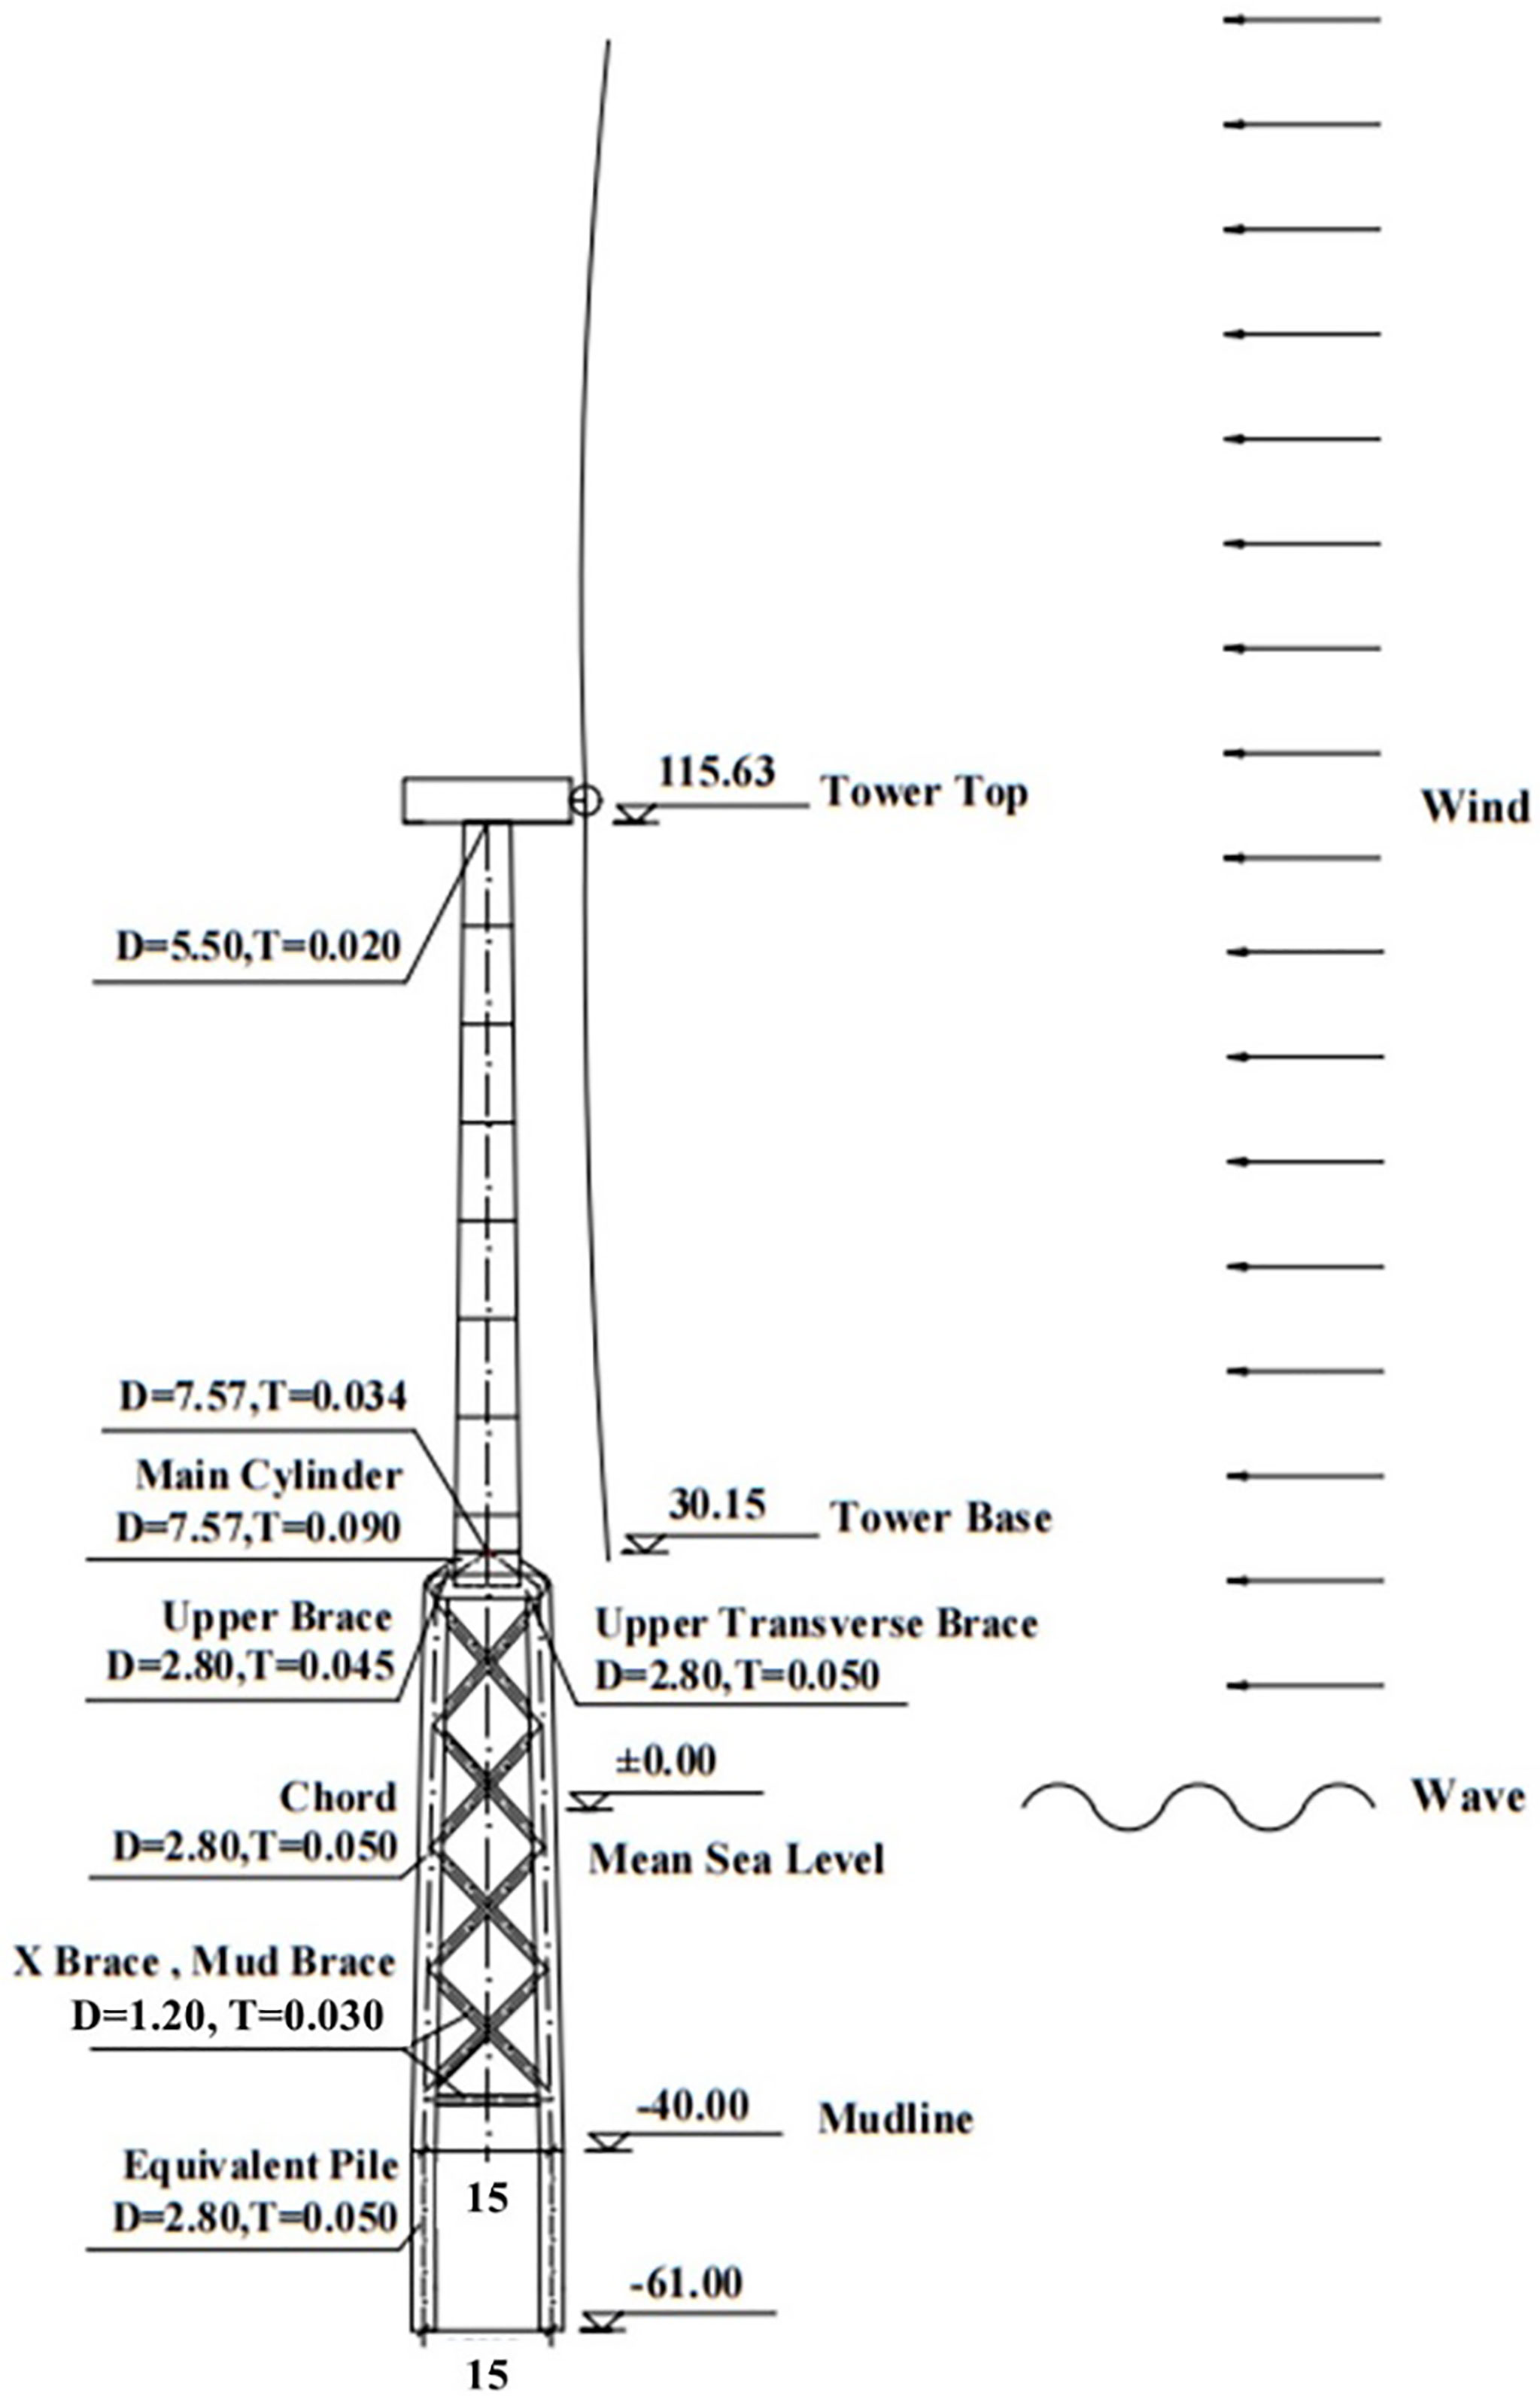
Figure 1 Essential parameters of prototype jacket OWT (unit: meters).
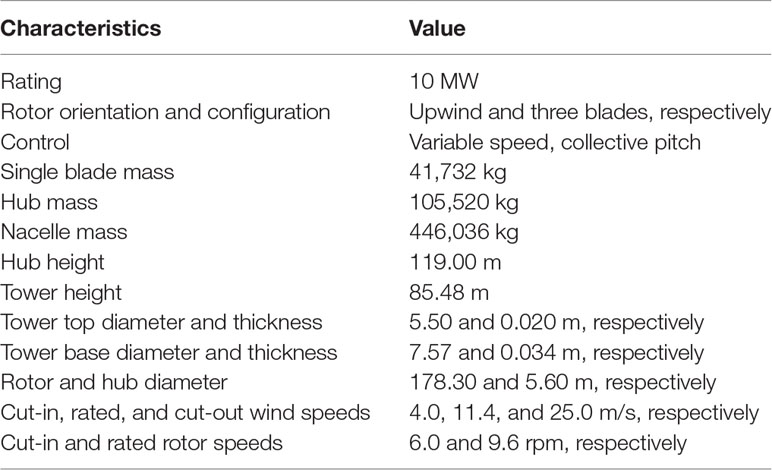
Table 2 Basic parameters of prototype OWT.
2.3 Performance-Scaled Test Model Design
2.3.1 Definition of Fundamental Scale Ratios
Although Reynolds number similarity requirement is relaxed in the study, a large velocity scale ratio is recommended to eliminate the discrepancy in Reynolds numbers between the prototype and model experiment wind fields. Accordingly, the selected length scale ratio, λL, must be as large as possible, as listed in Table 1. However, the length scale ratio is limited by the basin dimensions. By considering the geometric dimensions, environmental conditions, and laboratory equipment capacities, the length scale ratio, λL, is 1/75.
2.3.2 Scaled Rotor Blade Model
Because the length scale ratio and prototype WT in this research are consistent with the European Union LIFES50+ project, the scaled model design of the blade in the LIFES50+ project is applied. Instead of the original airfoil of the prototype DTU 10-MW WT, SD7032 was selected as airfoil for the scaled blade model design (Lifes50+, 2021). For the connection between the blade and hub models, a circular section is adopted at the blade root. A schematic of the blade scaled model is shown in Figure 2A. The figure shows that the chord length is redesigned to ensure the aerodynamic similarities between the prototype and scaled rotor blades. As shown in Figure 2B, the maximum chord length of the blade model is 0.115 m. High-strength low-density carbon fiber is employed to manufacture the blade model; the mass of the blade model is strictly limited to 200 g. Further, to ensure the surface smoothness and production accuracy of the blade model, a steel mold is used in the manufacturing process. The steel mold and manufactured scaled blades are shown in Figures 2C, D, respectively.
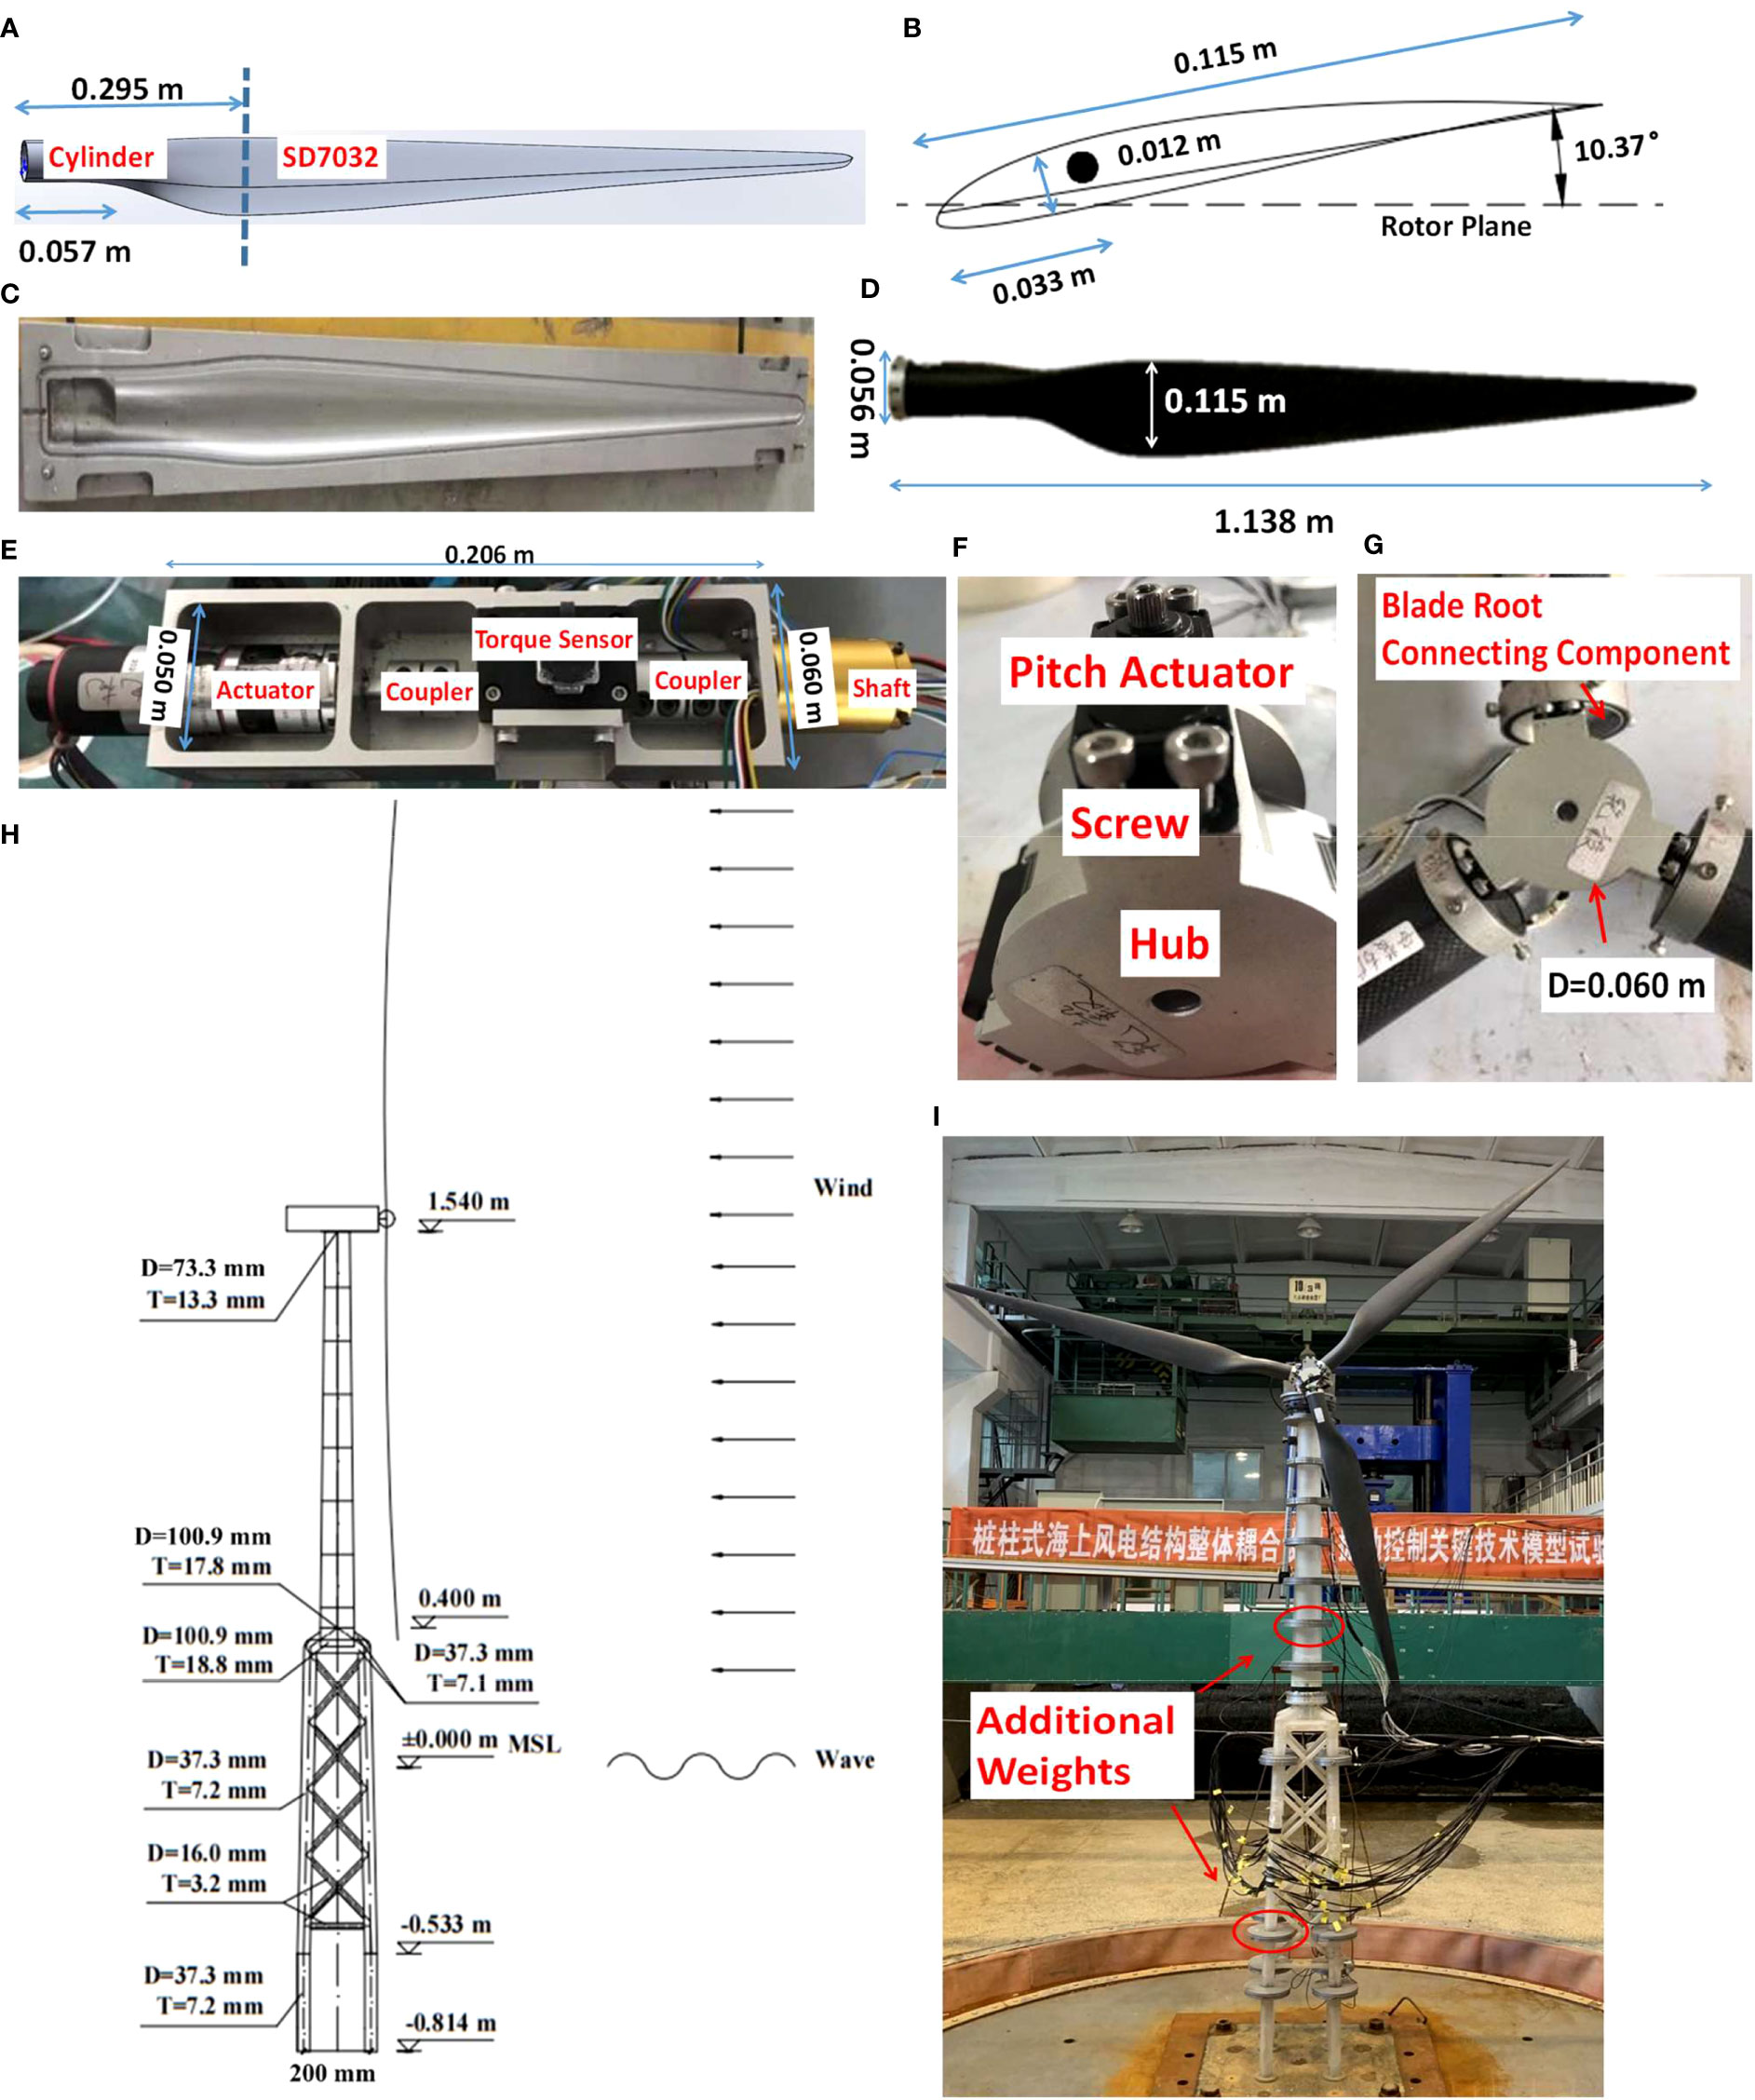
Figure 2 Design of performance-scaled test model. (A) Schematic of scaled blade model. (B) Schematic of blade model cross-section at maximum chord length. (C) Steel model. (D) Carbon fiber blade model. (E) Arrangement of drivetrain system. (F) Blade pitch system. (G) Scaled hub model. (H) Parameters of support structure model. (I) Additional weights.
2.3.3 Drivetrain and Pitch Control System Model
The drivetrain system of the WT scaled model was designed according to blade model parameters and joint hydro-structural elastic similarities; it consists of an actuator and a shaft. A torque sensor is installed along the drivetrain system to record the torsion in the shaft. On the basis of the speed of the DUT 10-MW WT and fundamental similarities in Table 1, the rated speed of the actuator is 84.13 rpm. The measuring range of the torque sensor was 0.10 N·m with a resolution of 0.01 N·m. The aforementioned components are connected using couplers (e.g., couplers between the actuator and torque sensor). The drivetrain system arrangement is shown in Figure 2E. Sequentially, the scaled model of the nacelle is manufactured on the basis of the drivetrain system arrangement, nacelle dimensions of the DTU 10-MW WT, and length scale ratio. The basic dimensions of the nacelle model are illustrated in Figure 2E. To securely fasten the drivetrain system and other facilities as well as to satisfy mass limitations, aluminum was employed to produce the scaled nacelle.
Concurrently, the blade pitch system is designed to implement the pitch control strategy. As shown in Figure 2F, three pitch actuators are employed to regulate the blade pitch angles under different test cases. The connecting components between the blades and pitch actuators are tightened using screws, as shown in the figure. On the basis of the pitch actuator dimensions and related structural parameters of the prototype WT, a scaled model of the hub is produced, as shown in Figure 2G. The diameter of the hub model is 0.06 m. The nacelle model and hub material are the same to ensure the stability of the scaled model of the RNA and satisfy the mass limitations.The scaled theoretical mass of the prototype RNA should be 1,604 g based on the defined mass scaled ratio of 1:753 in Table 1. Owing to the selected small scale ratio, it requires that the material should be as light as possible. To balance the strength and mass limitations in the design of RNA model, the strength and fabrication accuracy requirements are priorly satisfied, and then, the mass limitation is applied in the selection of fabrication material. According to the component mass listed in Table 3, the mass of the assembled RNA model is determined as 2,860 g to ensure the safety of the RNA model and to model and record the various operation states in the tests.
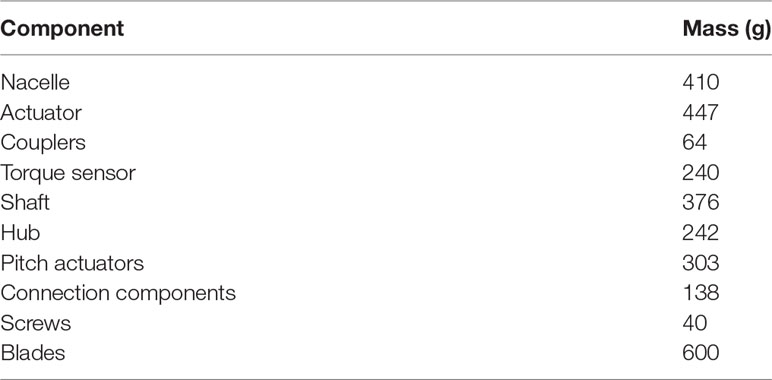
Table 3 Mass of major components of scaled RNA model.
2.3.4 Scaled Support Structure Model
Because of its high strength, material stability, and convenience for machining, PMMA has been used in producing the scaled model of the support system. The material of the OWT support structure prototype is steel with an elastic modulus of 206 GPa, and the elastic modulus of PMMA is 3.85 GPa. Accordingly, the elastic modulus scale ratio, λE, is 1/53.5. Subsequently, on the basis of the selected length and elastic modulus scale ratios, the scaled ratios of the remaining parameters can be calculated, as listed in the fourth column of Table 1. The principal dimensions of the support system are scaled according to λL; these include tower height, jacket member length, and outer diameter. Therefore, the scaled heights of the tower and jacket substructure models are 1.140 and 1.214 m, respectively.
Because the members of the prototype support system are typical highly slender structures, the discrepancies between the structural heights and section thicknesses are significant. For example, the prototype tower height is 85.48 m, whereas the maximum tower section thickness is only 0.034 m. The foregoing discrepancies limit the length scale ratio λL in the support system model cross-sectional design because the machining tolerance of the 1/75 scaled section thickness cannot satisfy the requirements. To alleviate the small scaling effects in the design of member sectional thickness of the support structure, the strict length scale ratio is substituted by the inertial radius scale ratio based on the similarity of sectional bending stiffness. According to the joint hydro-structural elastic similarities in Eq. (6) and the selected length and elastic modulus scale ratios, the calculated inertial radius scale ratio λr is 1/88.8. The member section thickness of the support system can then be selected using Eq. (7). The designed geometries of the tower and jacket substructure model are shown in Figure 2H.
Note that in the derivations of the joint hydro-structural elastic similarities and essential parameter similarities listed in Table 1, the density scale ratio, λρ, is assumed to be 1.0. The densities of the prototype OWT support structure and the related scaled model are 8,500 kg/m3 and 1,198 kg/m3, so the additional weights are needed to satisfy such assumption, and the excess mass of RNA model is subtracted in the determination of additional weight arrangement on the support structural model. On the basis of the assumption that the density scale ratio is 1.0, the distributed additional weights along the support structural model are shown in Figure 2I. As depicted in the figure, the additional weights are uniformly distributed along the tower model, and the additional mass placed at the tower top has deducted the excess mass of the RNA model. The additional weights on the jacket are arranged away from the splash zone to eliminate the unnecessary influence of additional weights on hydrodynamics.
where D is the outer diameter, t is the sectional thickness of the section, and r is the related inertial radius.
2.3.5 Scaled Test Cases and Environmental Conditions
In view of the experimental method used to study the dynamic characteristics and coupling mechanisms of the jacket OWT, typical loading conditions are selected according to the measured environmental conditions and offshore standard DNV GL-ST-0437 (DNV GL, 2016). The hydro-elastic similarities listed in Table 1 are used to scale the recorded environmental conditions, and the prototype and scaled environmental parameters are summarized in Table 4. As listed in the table, three typical test cases (nos. 1–3) involving the wind speed, from cut-in to cut-out, are selected to study the coupling mechanisms of an operational OWT model. The blade pitch-to-feather control strategy is applied to test case no. 4 to investigate the influence of mechanical control strategies on the OWT model responses.
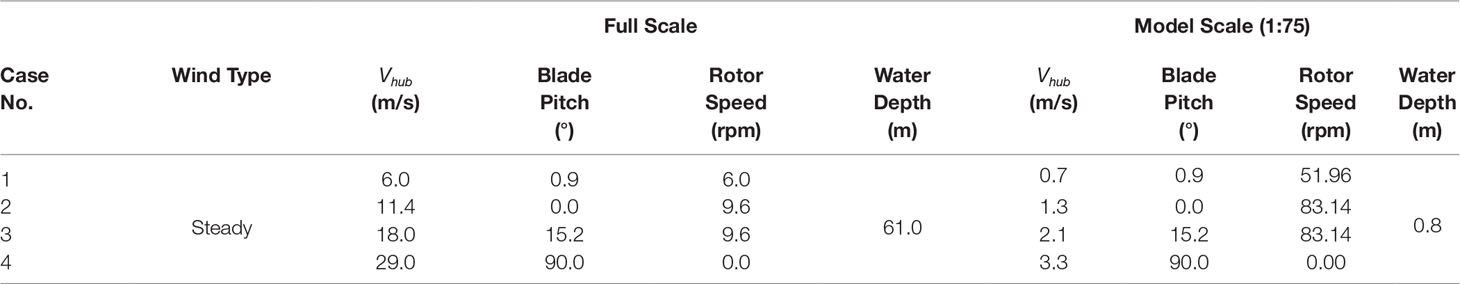
Table 4 Selected typical test cases.
2.4 Sensor Arrangement and Test Equipment
In the tests, in addition to the pre-mounted torque sensor in the drivetrain system of the RNA model, as shown in Figure 2E, the following sensor types are selected to record the input environmental conditions and OWT model motions. A schematic of the dynamic model tests of the jacket OWT model subjected to wind load is shown in Figure 3A. The figure shows that the wave generator and wind generation system are located on the left side of the experimental basin, and the wave absorber equipment is arranged on the opposite side. To ensure the quality of the generated experimental wind field, the distance between the scaled OWT model and wind generation system is set to approximately 4.255 m. Figure 3 introduce the arrangement of sensors mounted on the model in the tests, and the numbers and basic parameters of the selected sensors are summarized in Table 5.
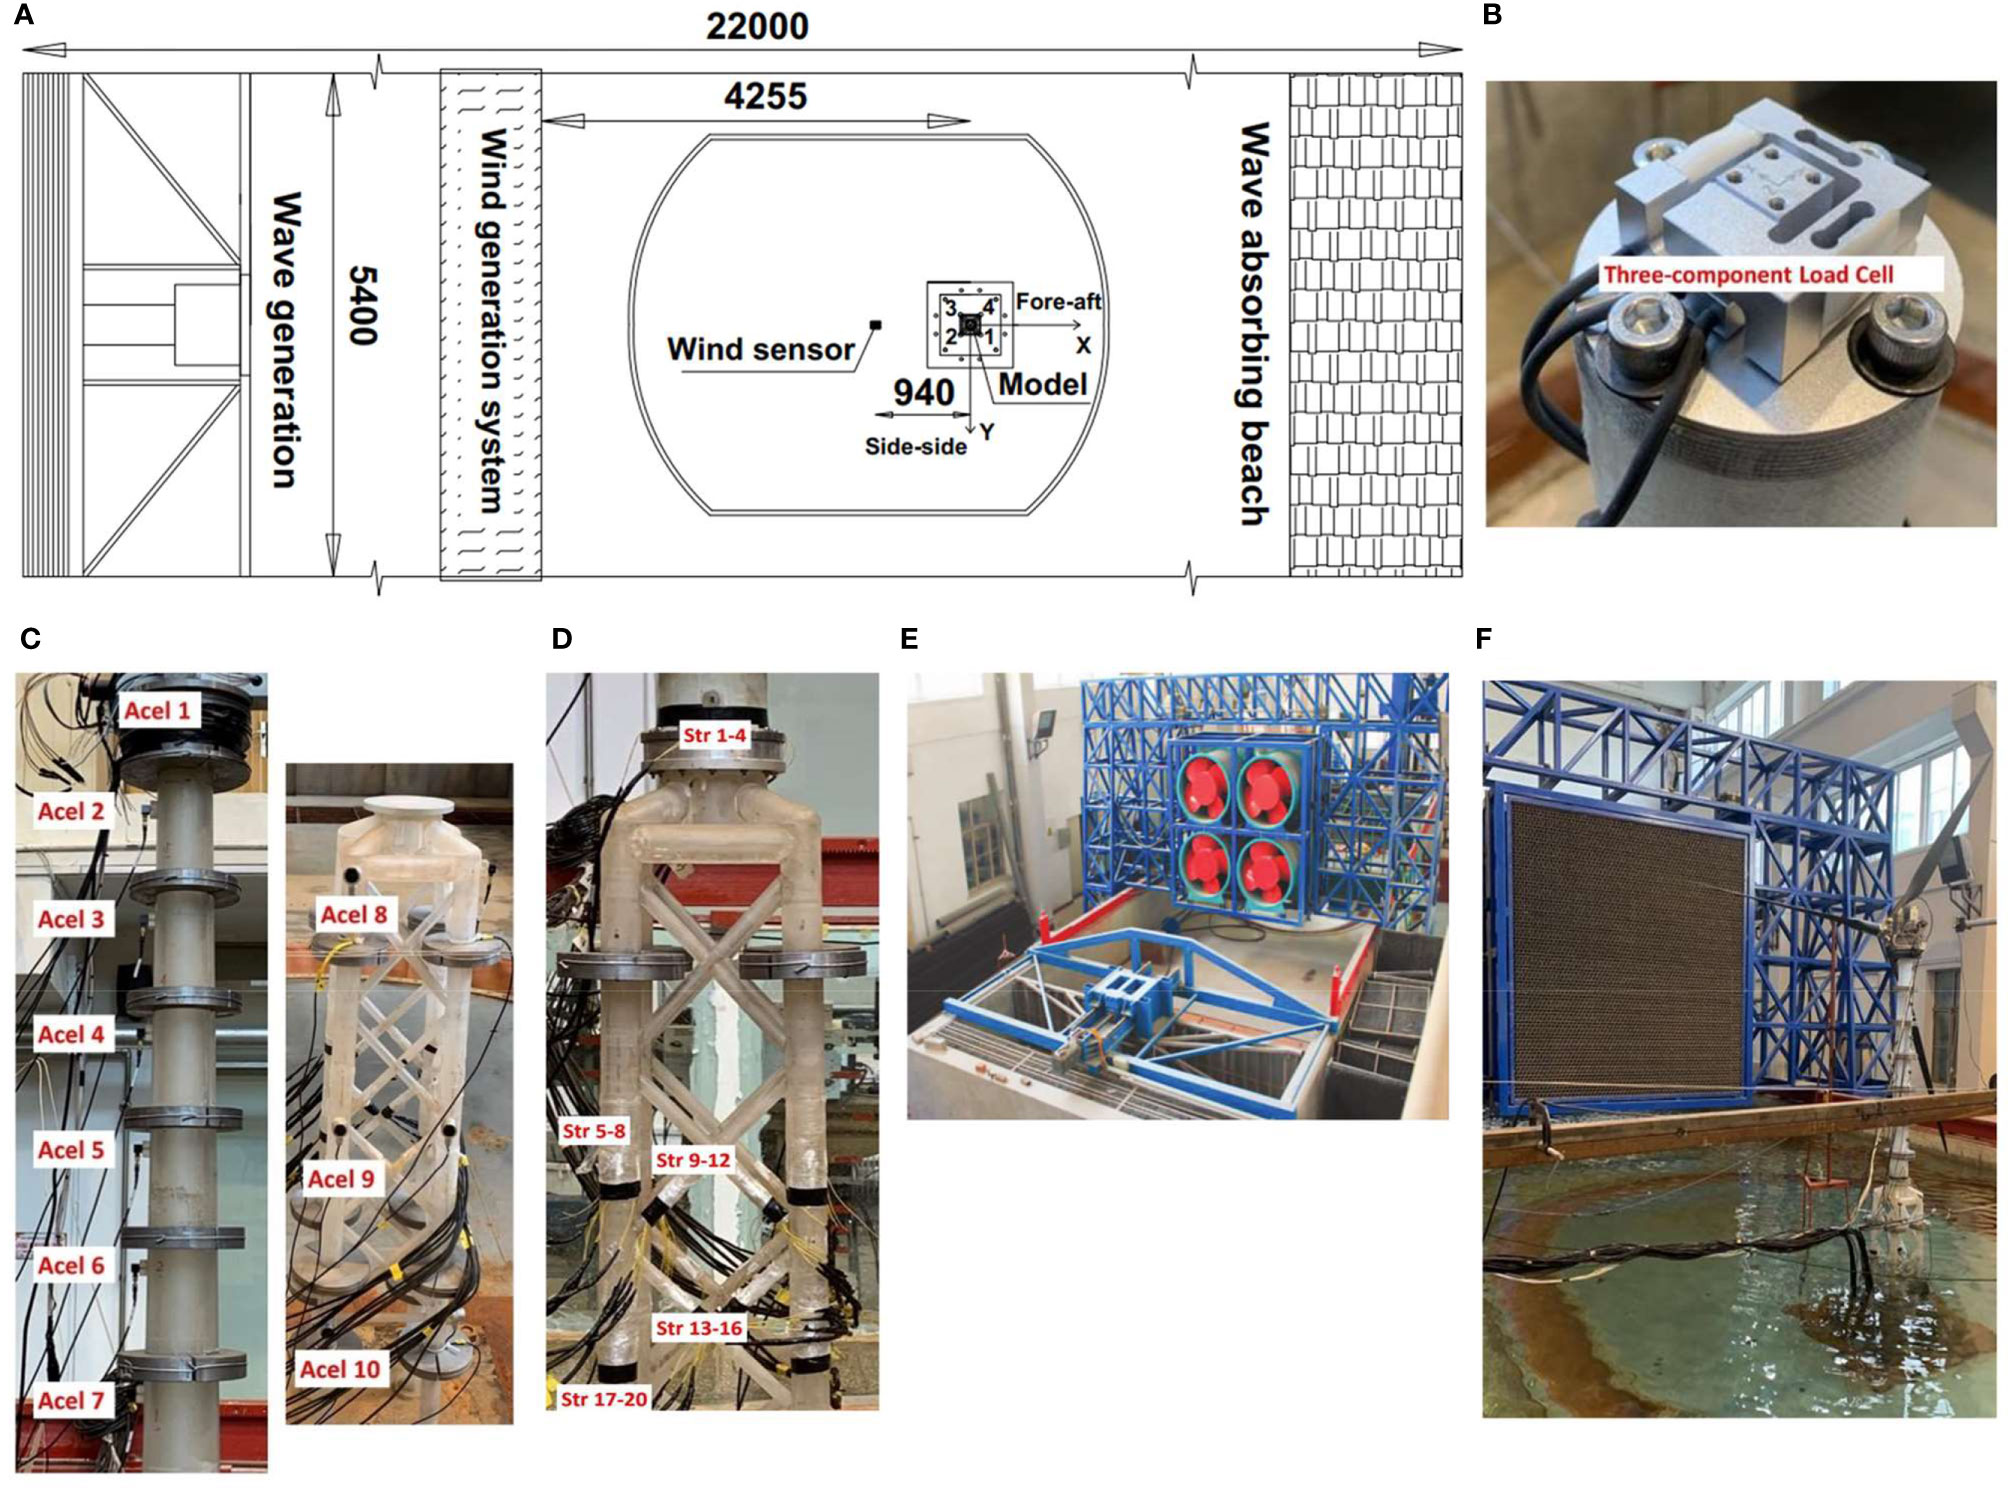
Figure 3 Primary sensor arrangement and test equipment in tests. (A) Schematic of model experimental basin (unit: millimeters). (B) Installed three-component load cell at tower top. (C) Acceleration sensor arrangement along support system. (D) Strain gauge arrangement. (E) Dynamic model tests of jacket OWT subjected to winds and waves. (F) Joint wave and wind load simulation system.
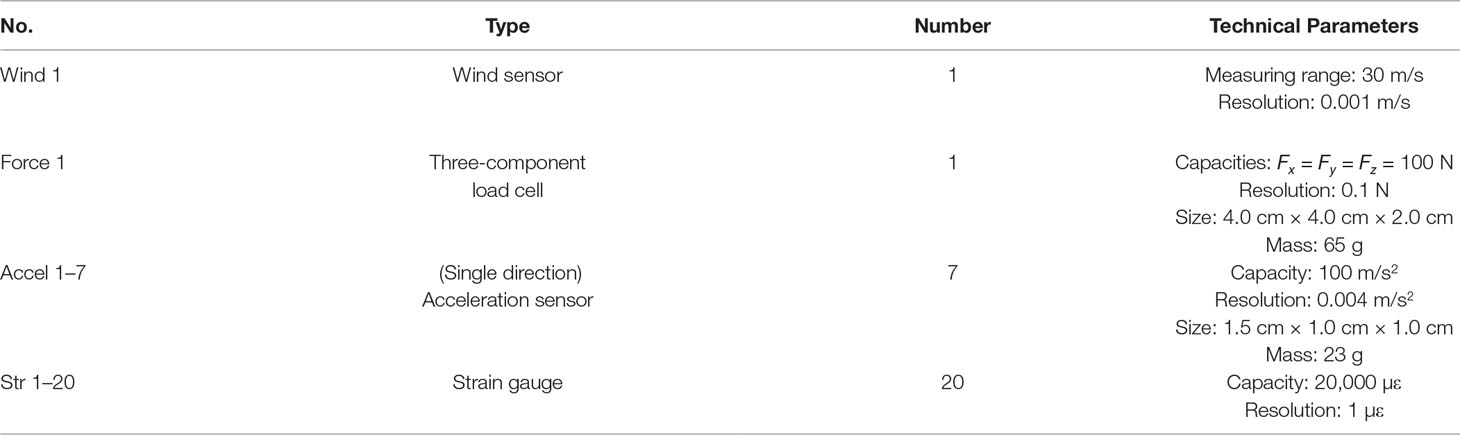
Table 5 Sensor arrangement in OWT dynamic tests.
A joint wind and wave simulation system developed by the State Key Laboratory of Coastal and Offshore Engineering of Dalian University of Technology is employed to generate the scaled wind and wave conditions in the tests. The joint wind and wave simulation system consist of a wind generation system and wave generator, as shown in Figure 3E. The usable area of the wind generation system is 2.54 m × 2.54 m, and the maximum generated wind speed is 15 m/s. The dimensions of the wave basin are 22.0 m × 5.4 m × 1.2 m, and the maximum water depth is 1.0 m. The maximum generated wave height is 0.33 m, and the allowable range of the wave period is 0.5–4 s. The layout of the dynamic model tests for the jacket OWT is shown in Figure 3F.
3 Wavelet Packet Analysis Theory
Wavelet packet analysis is a more refined decomposition method than wavelet analysis and has been widely used for signal processing (Guo et al., 2020). The low-frequency and high-frequency components can be decomposed simultaneously using the designated low-pass and high-pass filters, respectively, based on specified wavelet basis functions. Two sub-frequency bands (FBs) consisting of low and high frequencies are obtained after each decomposition. The number of decomposed FBs is observed to be 2j at the jth decomposed layer, as shown in Figure 4. The wavelet packet analysis method can adaptively modify the corresponding FBs to match the signal spectrum according to the signal characteristics and analysis requirements. Accordingly, the wavelet packet analysis method is applied to analyze the recorded responses of the scaled OWT model in the specific FBs. Moreover, the energy distributions of the OWT model responses under different test winds are estimated. Subsequently, the coupling mechanisms of the OWT under wind loads are discussed. The feature extraction method can also be used to identify the operating states of OWTs to improve their fault-monitoring efficiency.
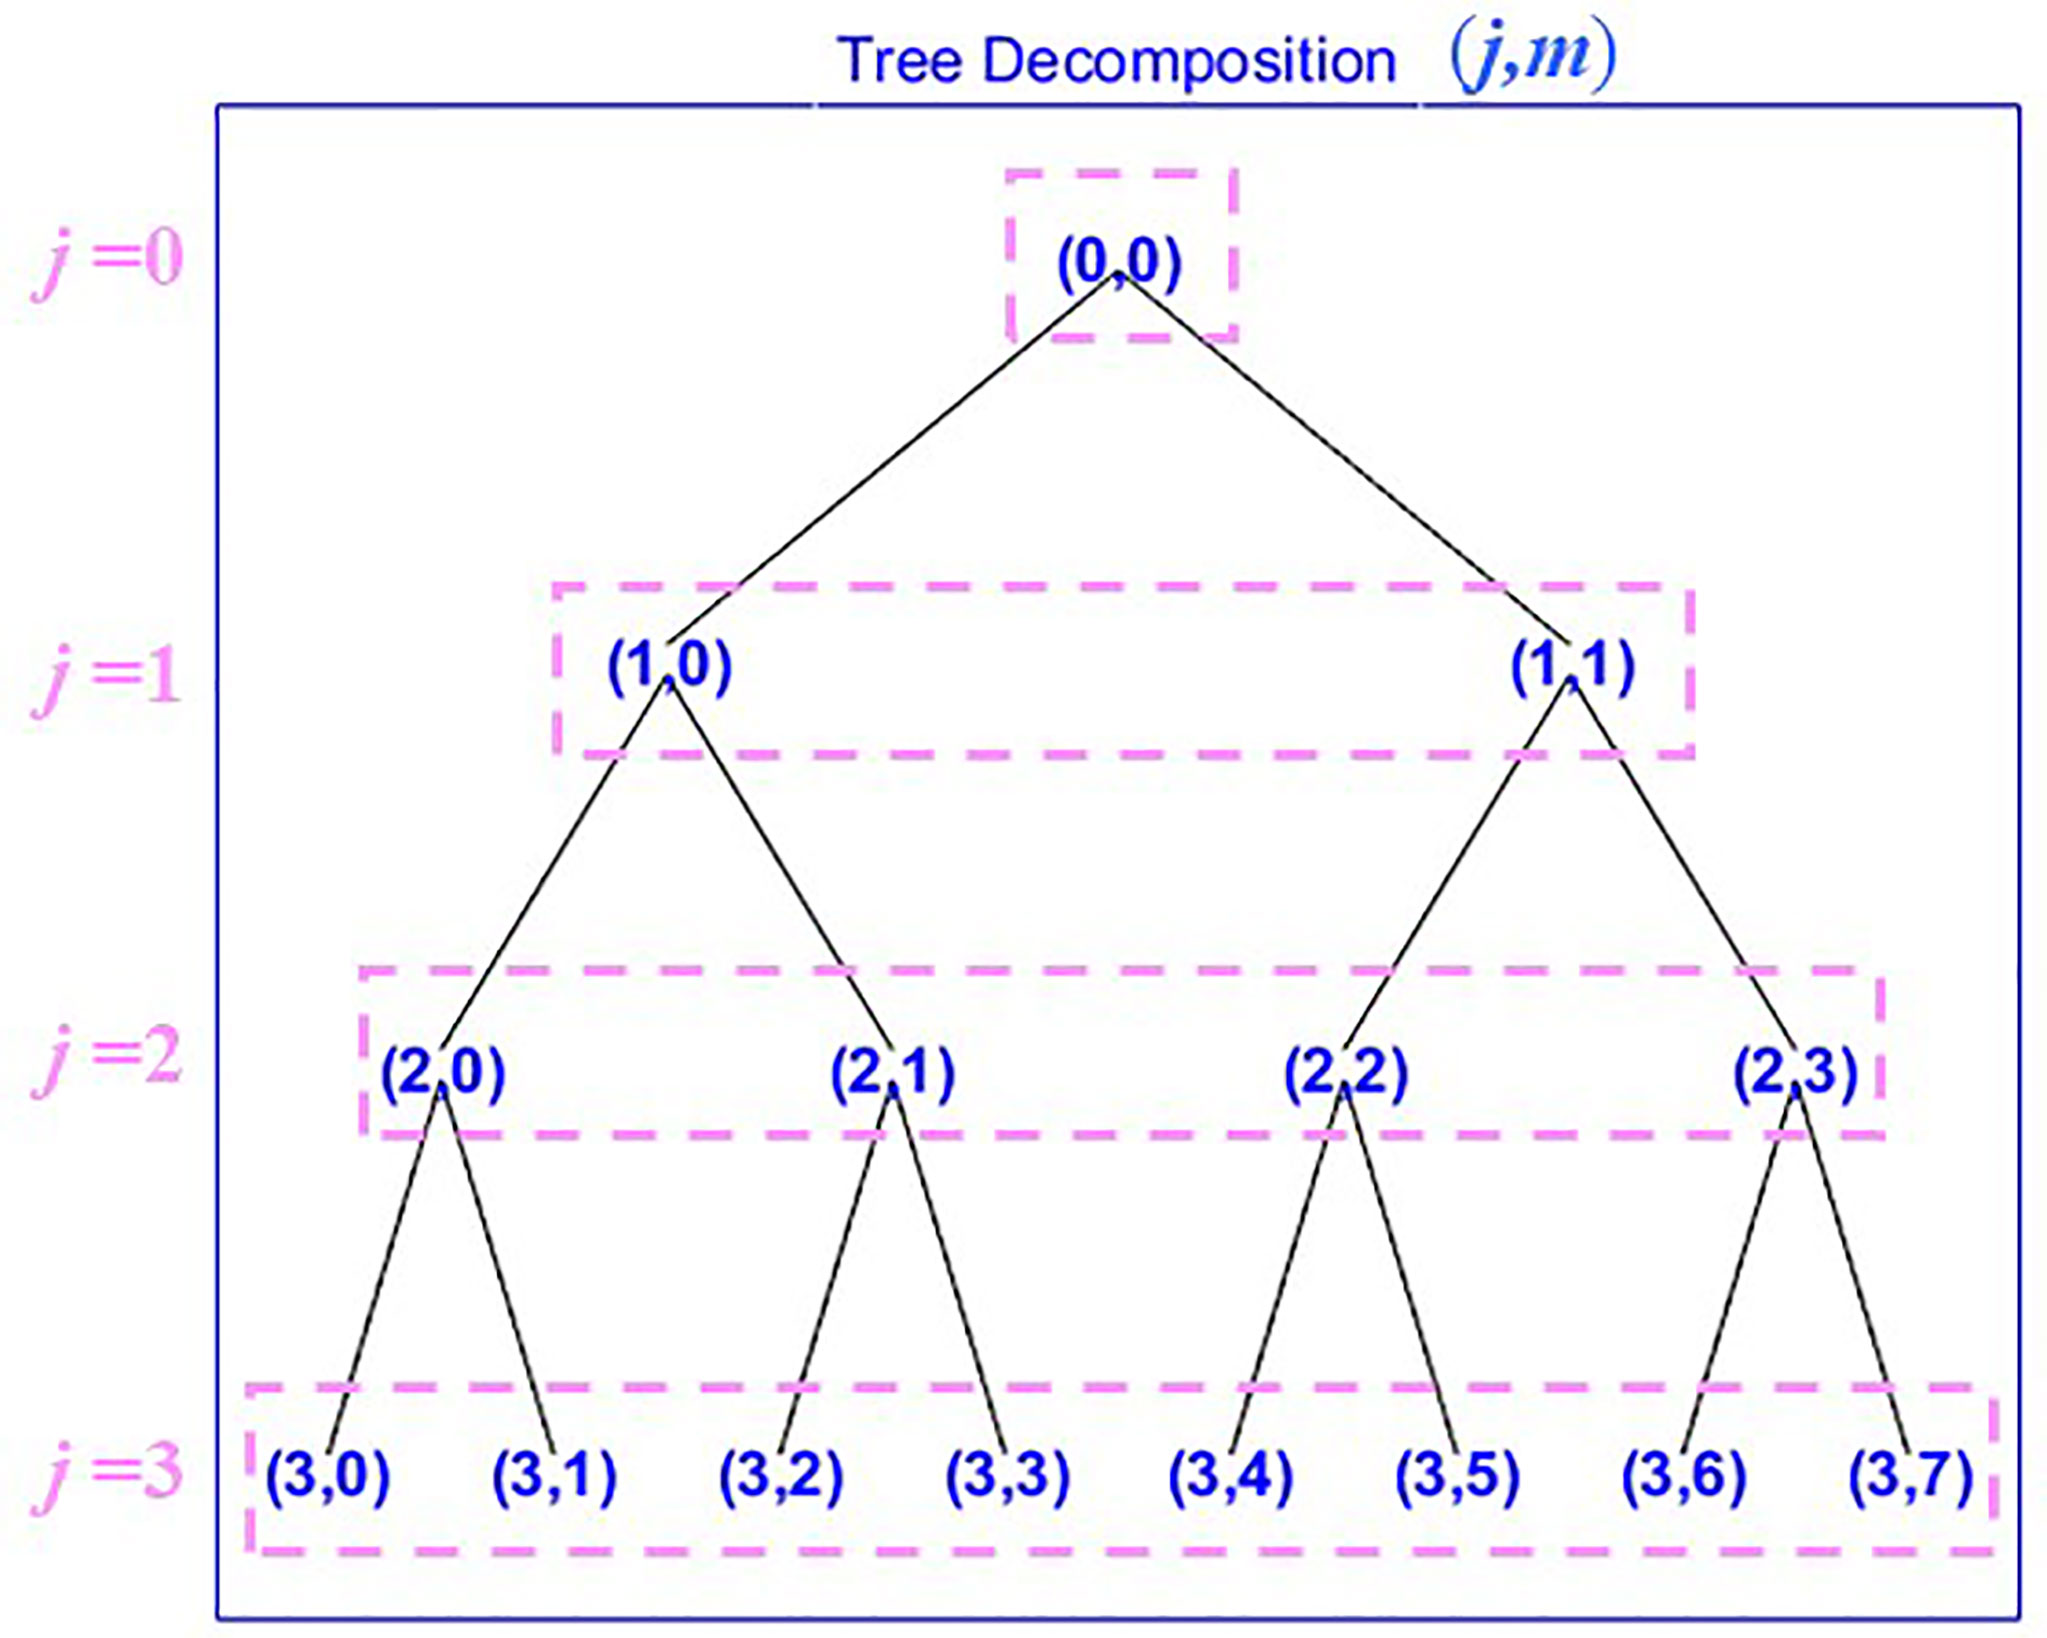
Figure 4 Schematic of decomposed three-layer wavelet packet tree.
According to wavelet packet decomposition theories (Li et al., 2022), the initial structural response signal is decomposed by the j-layer wavelet basis functions as given by Eqs. (8) and (9). The signal histories corresponding to the FBs can be reconstructed using Eq. (10):
where x*i,j+1,2m and x*i,j+1,2m+1 are the ith decomposed low-frequency and high-frequency components of the mth FB in the jth layer, respectively; h(k) and g(k) are the low-pass and high-pass filter coefficients, respectively; i is the serial number of discrete data in the original input signal; j is the number of decomposed layers; and m is the FB serial number in the jth layer.
According to the decomposed data in each FB, the energy (Sj,m) of x*j,m can be calculated as follows:
where N is the number of discrete sampling points in the initial signal.
As defined in Eq. (11), the summary of Sj,m constitutes the energy spectrum of the original input signal. The normalized energy distribution ratio, Pj,m, is defined in Eq. (12) to quantify the influence of decomposed FBs:
4 Results and Discussions
4.1 Test Wind Field Calibration
In the tests, different calibration sites are selected to measure the generated test wind field, as shown in Figure 5A. The eight designated sites, P1–P8, are uniformly distributed along the basin centerline in the inflow direction. As shown in the figure, four additional sites, P9–P12 (at an interval of 600 mm), are selected in line with P6 in the lateral direction.
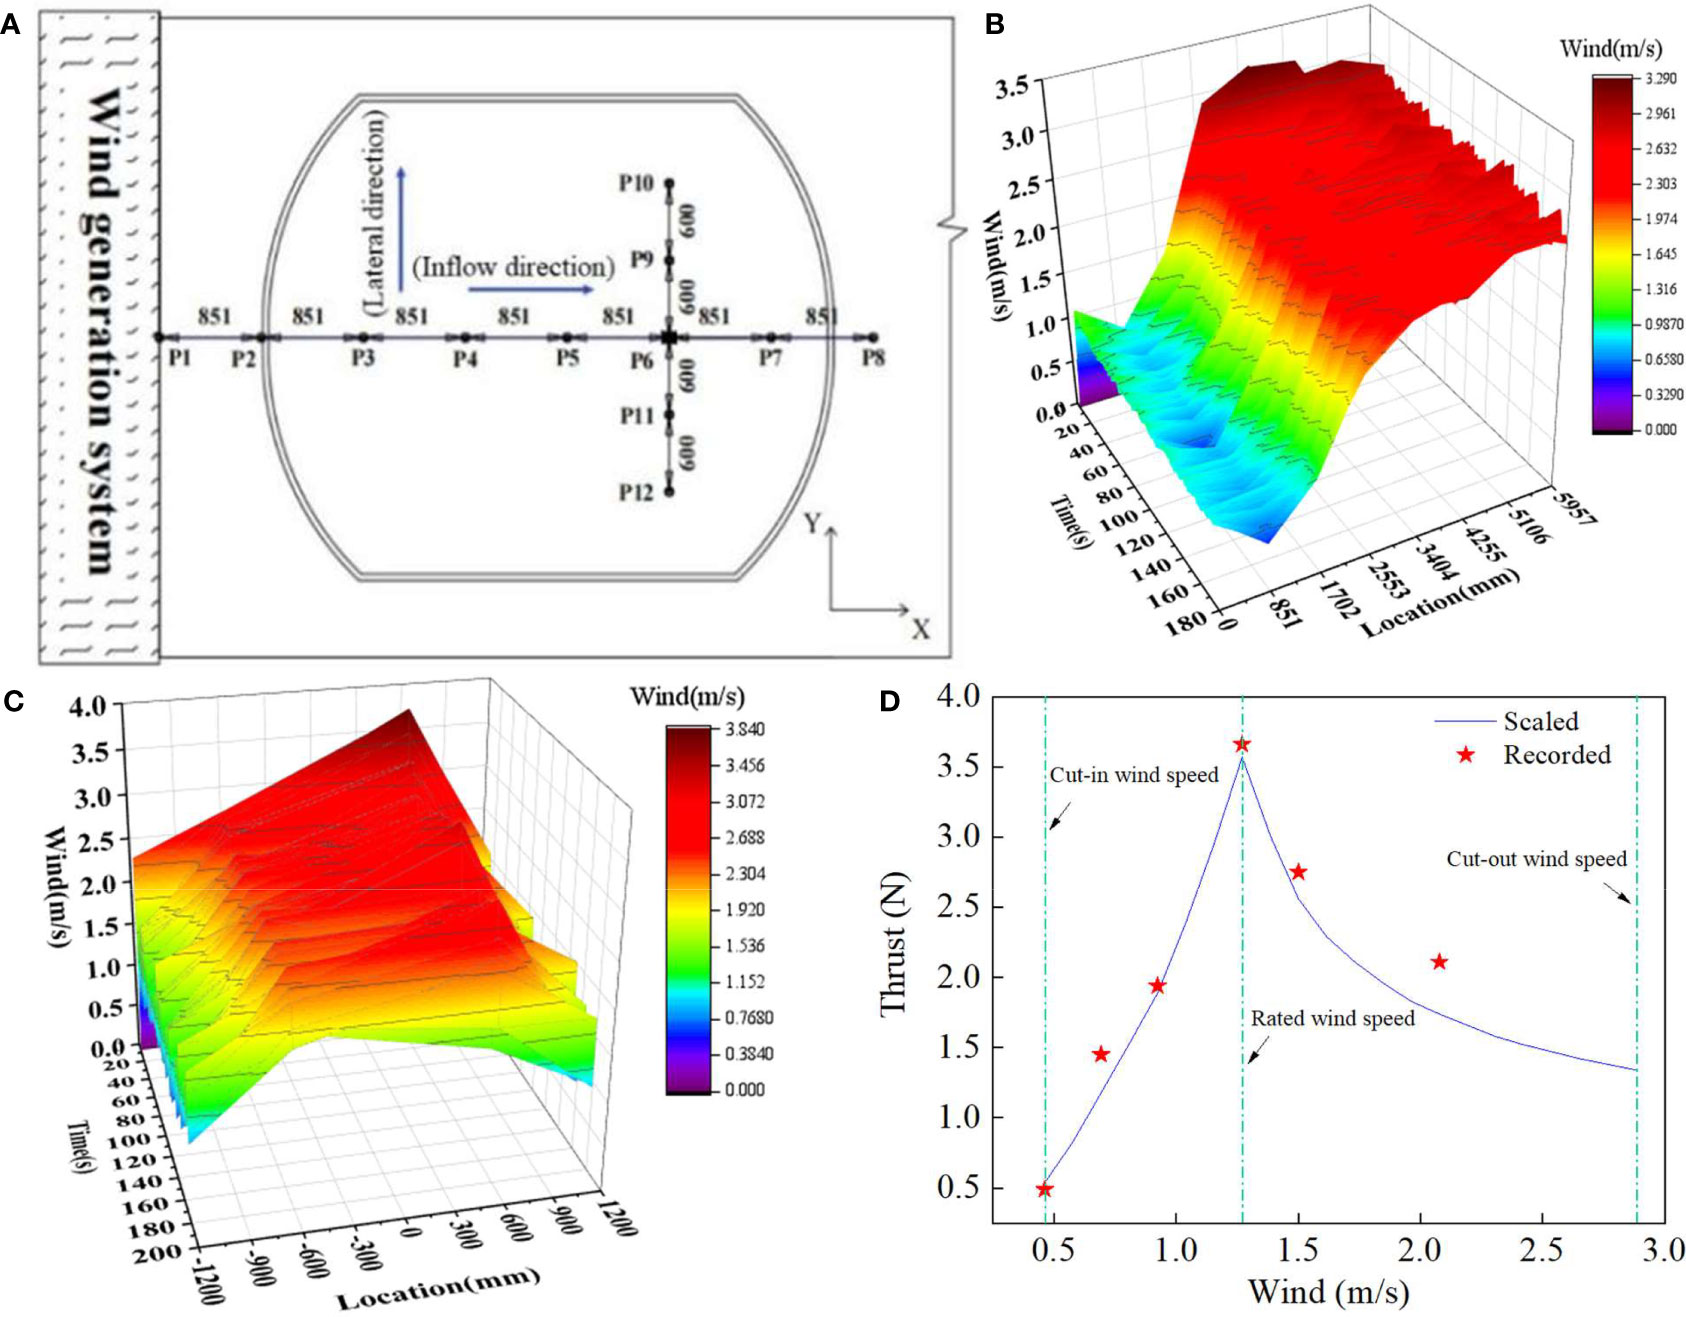
Figure 5 Selected wind field calibration sites and recorded wind speed using wind generation system at sites. (A) Selected wind field calibration sites (unit: millimeters). (B) Calibrated test wind–thrust curve of scaled RNA model at site P6. (C) Recorded histories of wind speed at sites P1–P8. (D) Recorded histories of wind speed at sites P9–P12.
According to the selected test cases listed in Table 4, a test wind speed of 2.1 m/s is designated as the calibration wind speed. The recorded calibration wind speeds at the different sites are shown in Figures 5B, C. The sampling duration is 180 s at an interval of 1.0 s. Figure 5B shows the non-uniformity of the generated test wind field and an increasing trend in the generated wind field as the calibration sites gradually move away from the wind generation system. The statistics of the recorded wind histories at sites P1–P8 are summarized in Table 6. The measured mean wind speeds at sites P4 and P5 are more consistent with the calibrated wind speed than those at the remaining sites; few fluctuations are observed at sites P6 and P7. The measurement sites P4–P7 are seemed to be the potential feasible locations compared with the theoretical value. Considering the accuracy and steady of the output test wind field, site P6 is preliminarily selected as the installation location of the scaled OWT model.
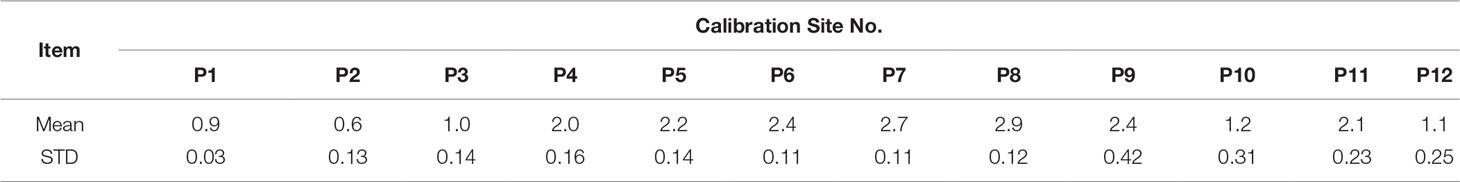
Table 6 Statistics of recorded wind speed histories at different sites.
Further, the approximately steady output wind field in the vicinity of site P6 is calibrated. It covers the rotor diameter of the scaled OWT model based on the recorded histories in Figure 5C and the related statistics summarized in Table 6 at sites P9–P12. The recorded mean values at sites P9 and P11 are agree well with the recorded data at site P6 and the theoretical value, so the accuracy of the test wind filed at site P6 can be guaranteed. Moreover, the decreasing of the test wind at points P10 and P12 and the increased fluctuations in the lateral direction should be pointed out, which shall impair the steady of the test wind fields.
On the other hand, the inflow wind-thrust curve of the dynamic model at specified test winds is measured at site P6 and compared with the scaled theoretical values, as shown in Figure 5D. The calibrated thrust loads at site P6 under the selected test winds agree well with the scaled theoretical values, especially for the test winds below the rated wind speed. Therefore, the accuracy of the calibrated test wind field can be further validated. As illustrated in the previous paragraphs, the decreasing of the test wind and the increased fluctuations in the lateral direction shall impair the steady of test wind 2.1 m/s to some extent.
4.2 Free Decay Test
In addition to the scaled physical test model, a fully coupled numerical analysis model of the prototype jacket OWT is established in FAST v8, which is an aero-servo-hydro-elastic coupled simulation tool for OWTs (Jonkman and Jonkman, 2016). As indicated in Figure 6A, the first two flapwise and first edgewise modes are employed to simulate the blade flexibilities based on multibody dynamics theories. The first two bending modes in the fore-aft and side-to-side directions are reserved in modeling the tower. The finite-element model of the jacket substructure is established using a two-dimensional linear beam element. Moreover, an additional interface node is designated at the transition piece between the tower and substructure in the coupled numerical model to consider the interactions between the RNA and support structure.
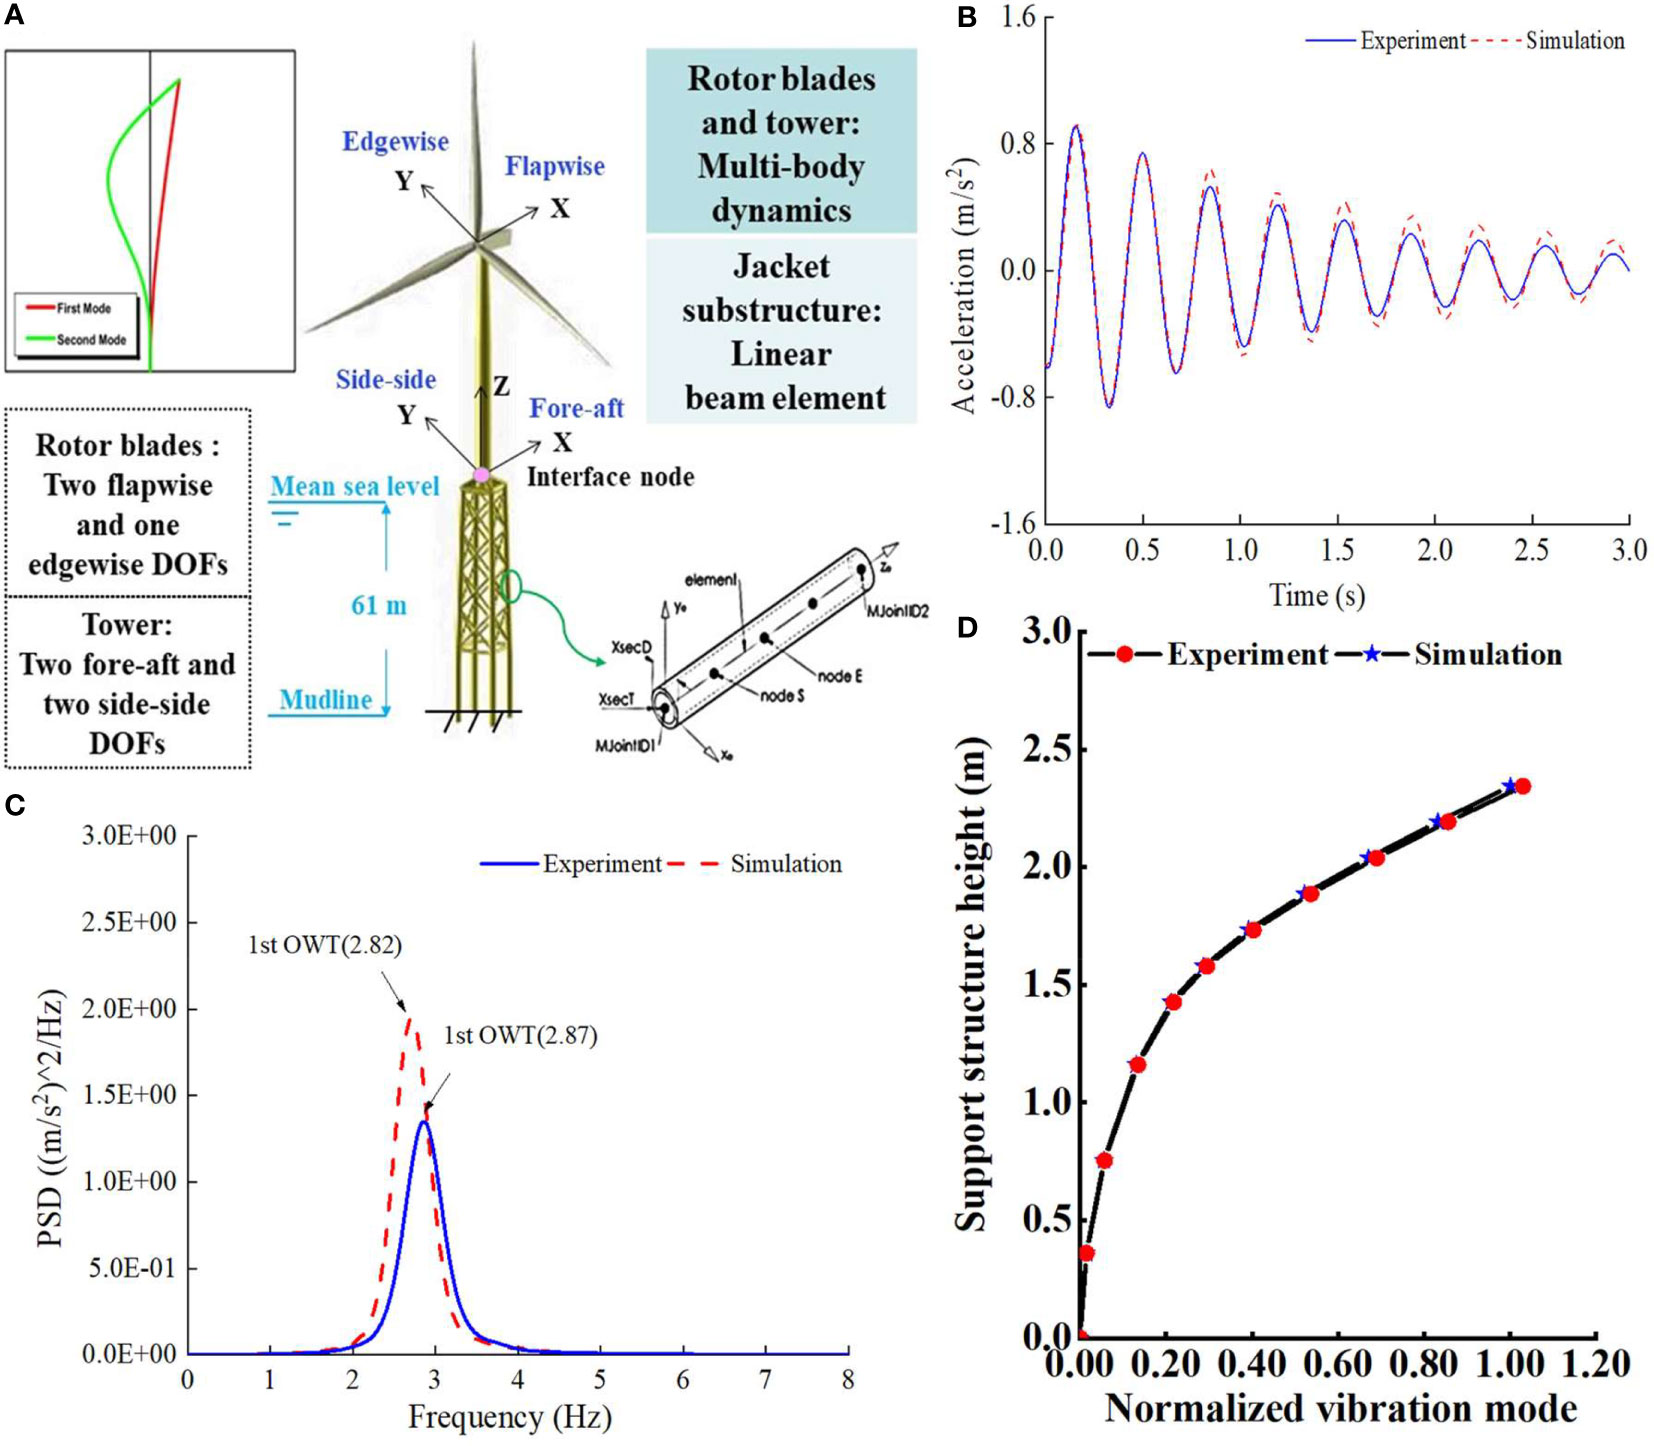
Figure 6 Schematic of established coupled numerical model of prototype jacket OWT in FAST v8 and free decay tests of OWT under parked state. (A) Schematic of established coupled numerical model of prototype jacket OWT in FAST v8. (B) Free decay histories of tower top accelerations. (C) PSDs of free decay tower top accelerations. (D) Normalized vibration modes of prototype and model OWT.
First, free decay tests are conducted to identify the fundamental frequency of the OWT test model and validate the production precision. An initial perturbation is applied to the tower top of the scaled test model and coupled numerical model under parked state in still water. According to the acceleration scale ratio λg is equal with 1.0, the comparisons between the recorded and analyzed free decayed tower top acceleration are carried out in the time and frequency domains, as shown in Figures 6B, C. The recorded free decayed histories of tower top acceleration are agree well with the numerical results, then the fundamental frequency of the physical test model is estimated. As depicted in Figure 6C, the identified first frequency of the test model is 2.87 Hz, and the corresponding scaled theoretical value is 2.82 Hz, so the fundamental frequency of the jacket OWT is appropriately scaled in the tests. Meanwhile, the discrepancies in the fundamental frequency amplitudes in the figure shall be owing to the differences in the damping between the prototype OWT and test model material.
On the basis of the recorded free decayed histories of accelerations along the support structure of test model, the model first mode shape is estimated and the normalized one is shown in Figure 6D. According to the comparisons in the figure, the first mode is appropriately modeled in the tests using the proposed joint hydro-structural elastic similarities, in addition to the structural fundamental frequency. Therefore, the applicability of the joint hydro-structural elastic similarities in the design of OWT test model is proved.
4.3 Dynamic Responses of OWT Model Under Different Test Winds
On the basis of the selected test cases listed in Table 4, dynamic tests of the scaled OWT model under various inflow winds are performed. According to the operational states in the tests, the frequency components in the range of 0–4.5 Hz are the primary concern; they include the fundamental frequency of the OWT model and RNA model rotational frequency. In the tests, the sampling duration is 330 s, and the sampling frequency is set to 500 Hz. On the basis of the Nyquist theorem (Zayed, 2021), the sampling rate must be more than twice the maximum frequency component of the measured signal to avoid aliasing. Accordingly, the maximum frequency of the measured signal that can be identified in the tests is 250 Hz. The selected sampling frequency is observed to be sufficient to satisfy the sampling requirements.
In subsequent data processing, the wavelet packet method introduced in Section 3 is applied to analyze the measured thrust loads and OWT model motions. According to the measured threefold blade passing frequencies and the fundamental frequency of the scaled OWT model, the minimum discrepancies between the concerned frequencies are 0.27 Hz. Therefore, the bandwidth of the decomposed FBs in the last layer cannot exceed 0.25 Hz to distinguish the frequency components of interest. This implies that the decomposed FBs must exceed 210 if the original recorded data are directly applied; therefore, the cost of time is expensive and time use is inefficient. To ensure the precision and efficiency of data processing, low-pass filtering and downsampling procedures are performed to reduce the sampling rate of the original data to 9 Hz without frequency aliasing. Then, the maximum identified frequency of the filtered data is reduced to 4.5 Hz. According to the wavelet packet theory, after only five times of decomposition, the bandwidth of decomposed 25 FBs can reach 0.14 Hz, which can precisely identify the frequency components of interest. The efficiency of processing the original data can be significantly improved by pre-filtering the signal.
Moreover, the wavelet basis functions are essential for the precision of processing. Thus, the Meyer function (Mahrous and Ward, 2016) is selected in the analysis, owing to its advantages in terms of biorthogonality and symmetry. On the basis of the decomposed signals in the time and frequency domains, the influence of the specified frequencies on the motions of the OWT model under different inflow winds and operational states can be quantified using Eq. (12).
4.3.1 Measured Thrust Loads Under Different Inflow Winds
The measured mean thrust loads under different test wind fields are listed in Table 7. An increasing trend is observed in the range 0.7–1.3 m/s. Because of the activated blade pitch control strategy under a test wind speed of 2.1 m/s, the mean thrust load decreases to 2.11 N. The blade pitch angle is designated as 90° under a test wind speed of 3.3 m/s to simulate a parked OWT; thus, the minimum thrust load is observed under this test case. The influence of inflow winds, blade pitch control strategy, and operational states on the thrust loads is proved. To further clarify this influence, the wavelet packet method is applied to analyze the recorded thrust loads. As introduced in the previous section, the original thrusts are preferentially downsampled without frequency aliasing (Ifeachor and Jervis, 2004); then, decompositions using the designated Meyer basis functions are implemented. The filtered and decomposed thrust loads under the selected test cases are shown in Figures 7A–D, and the quantified influence of the specified frequencies on the response is depicted in Figure 8.
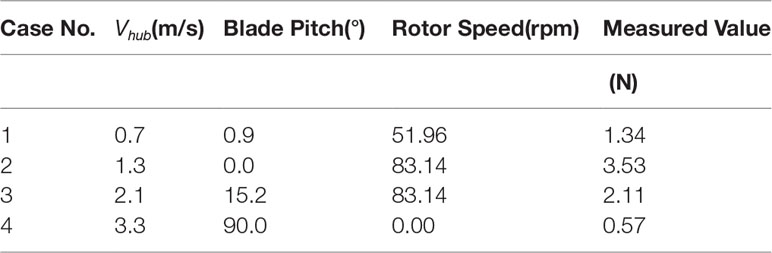
Table 7 Measured average thrust loads under different test winds.
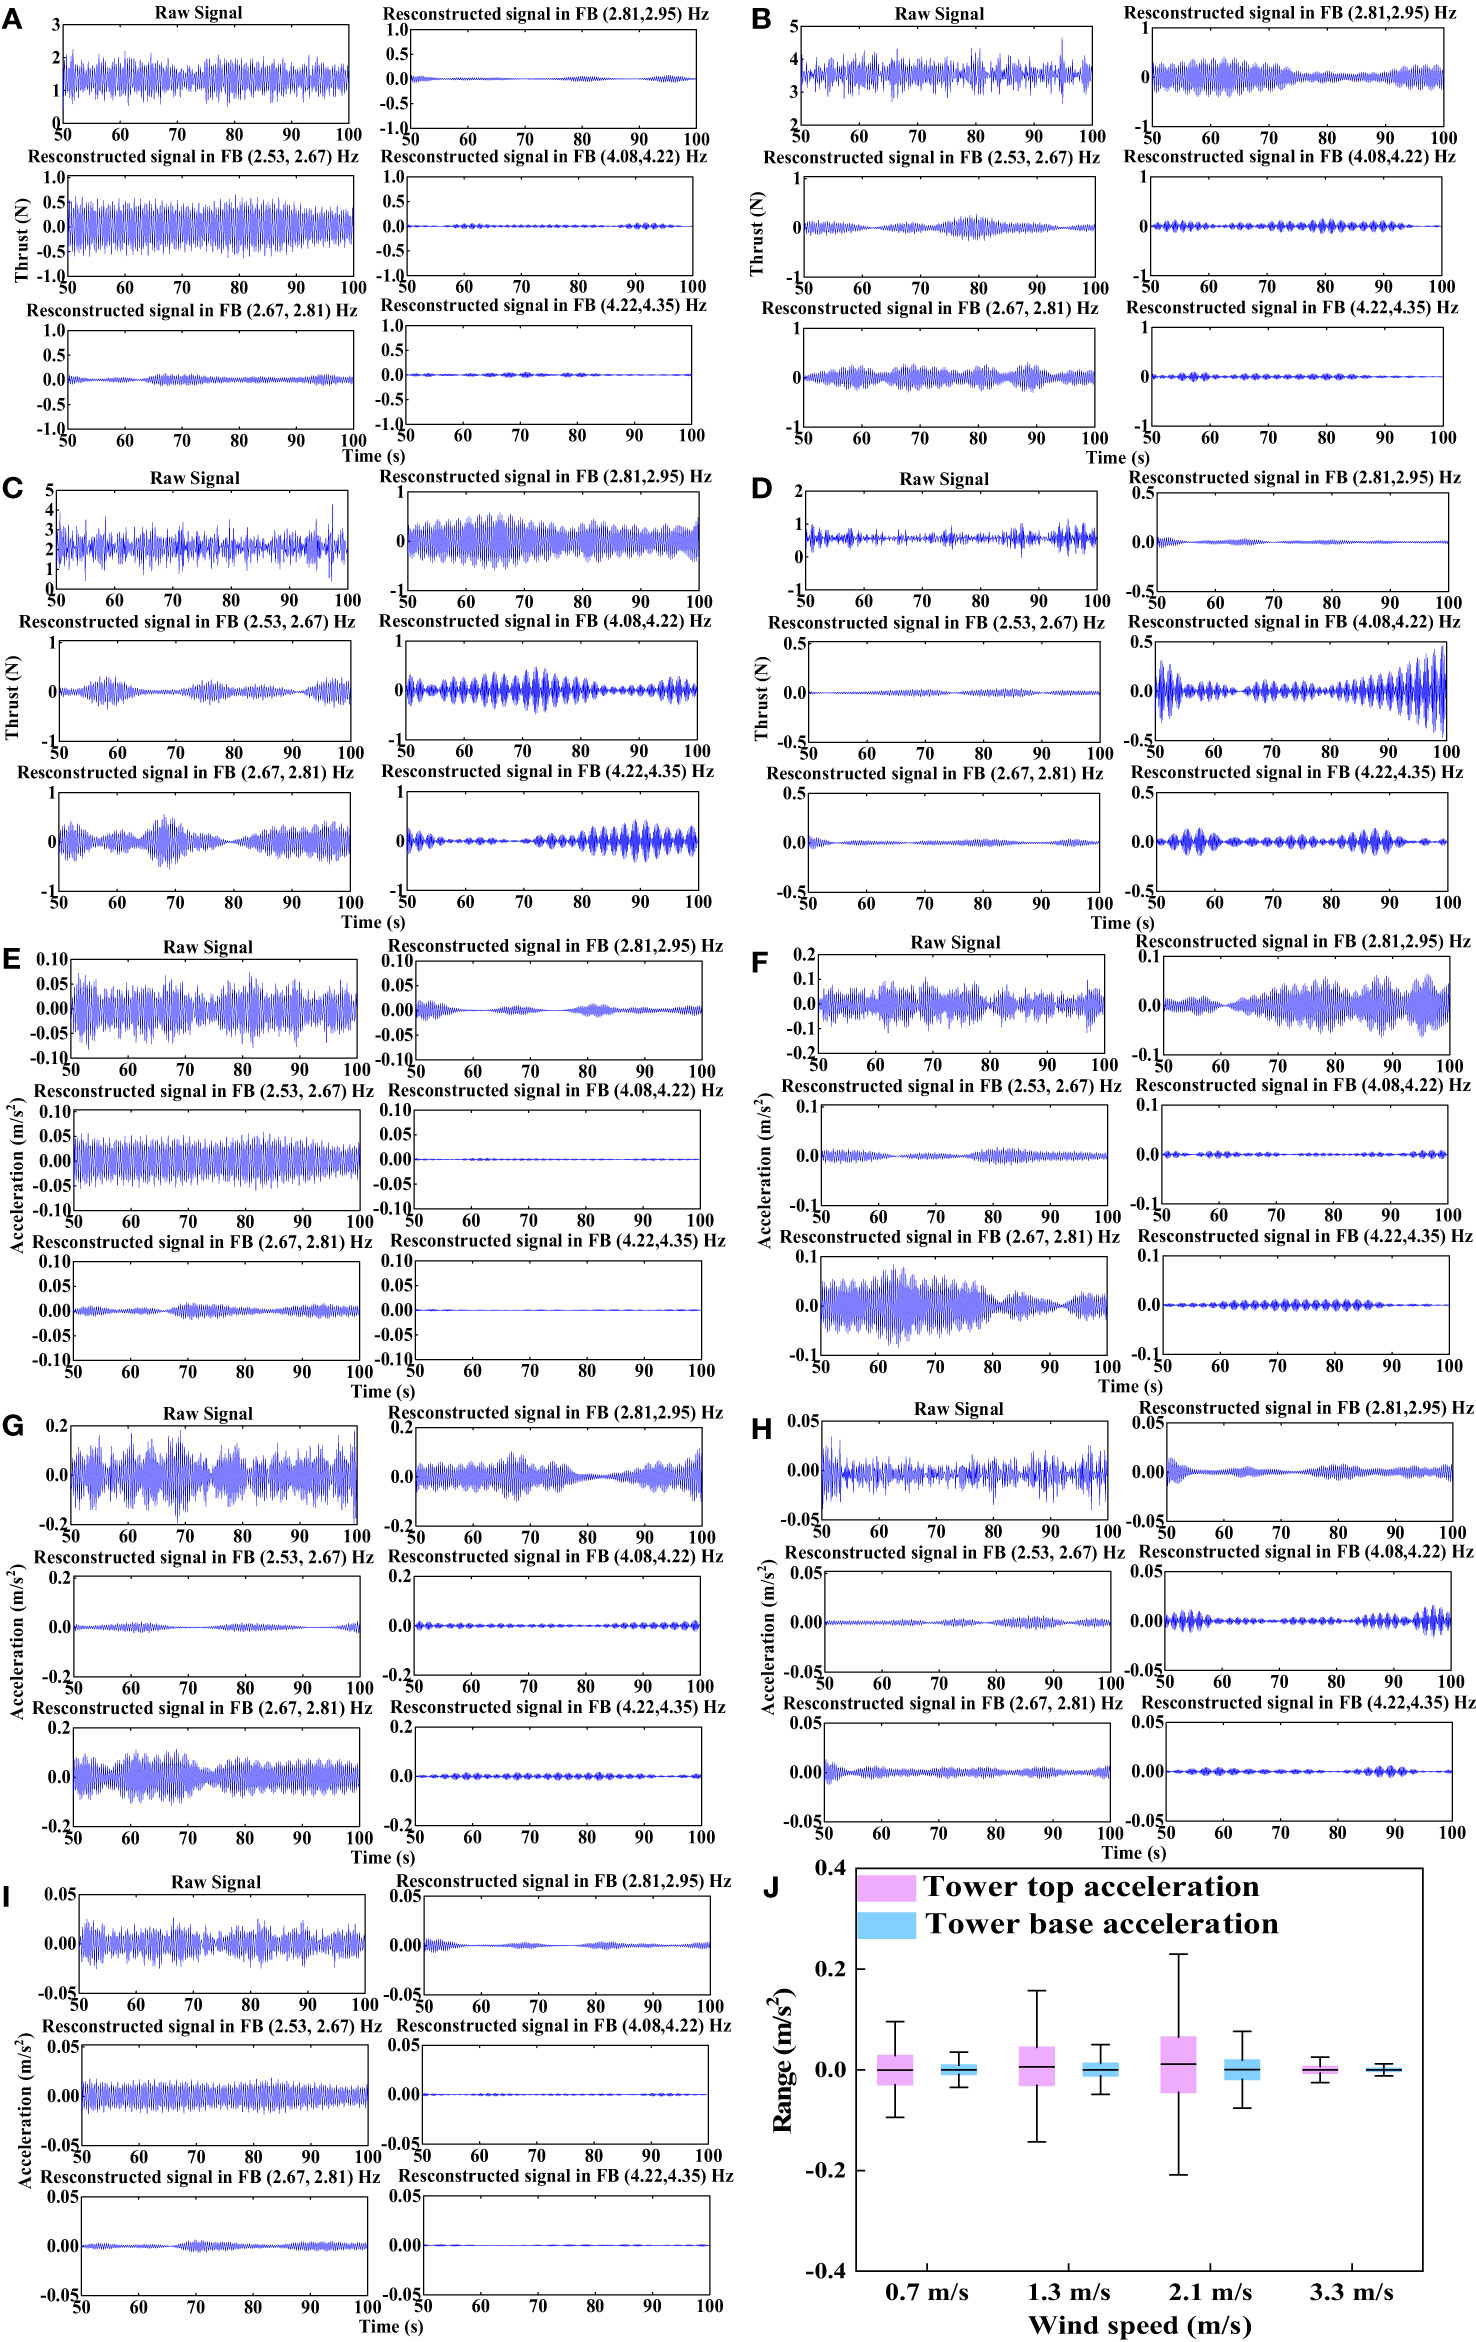
Figure 7 Dynamic responses of OWT model under different test winds. (A) Filtered and decomposed thrust loads, LC1, Vhub= 0.7 m/s. (B) Filtered and decomposed thrust loads, LC2, Vhub= 1.3 m/s. (C) Filtered and decomposed thrust loads, LC3, Vhub= 2.1 m/s. (D) Filtered and decomposed thrust loads, LC4, Vhub= 3.3 m/s. (E) Filtered and decomposed tower top accelerations, LC1, Vhub= 0.7 m/s. (F) Filtered and decomposed tower top accelerations, LC2, Vhub= 1.3 m/s. (G) Filtered and decomposed tower top accelerations, LC3, Vhub= 2.1 m/s. (H) Filtered and decomposed tower top accelerations, LC4, Vhub= 3.3 m/s. (I) Filtered and decomposed tower base accelerations, LC1, Vhub= 0.7 m/s. (J) Statistics of measured tower top and base accelerations under different test winds.
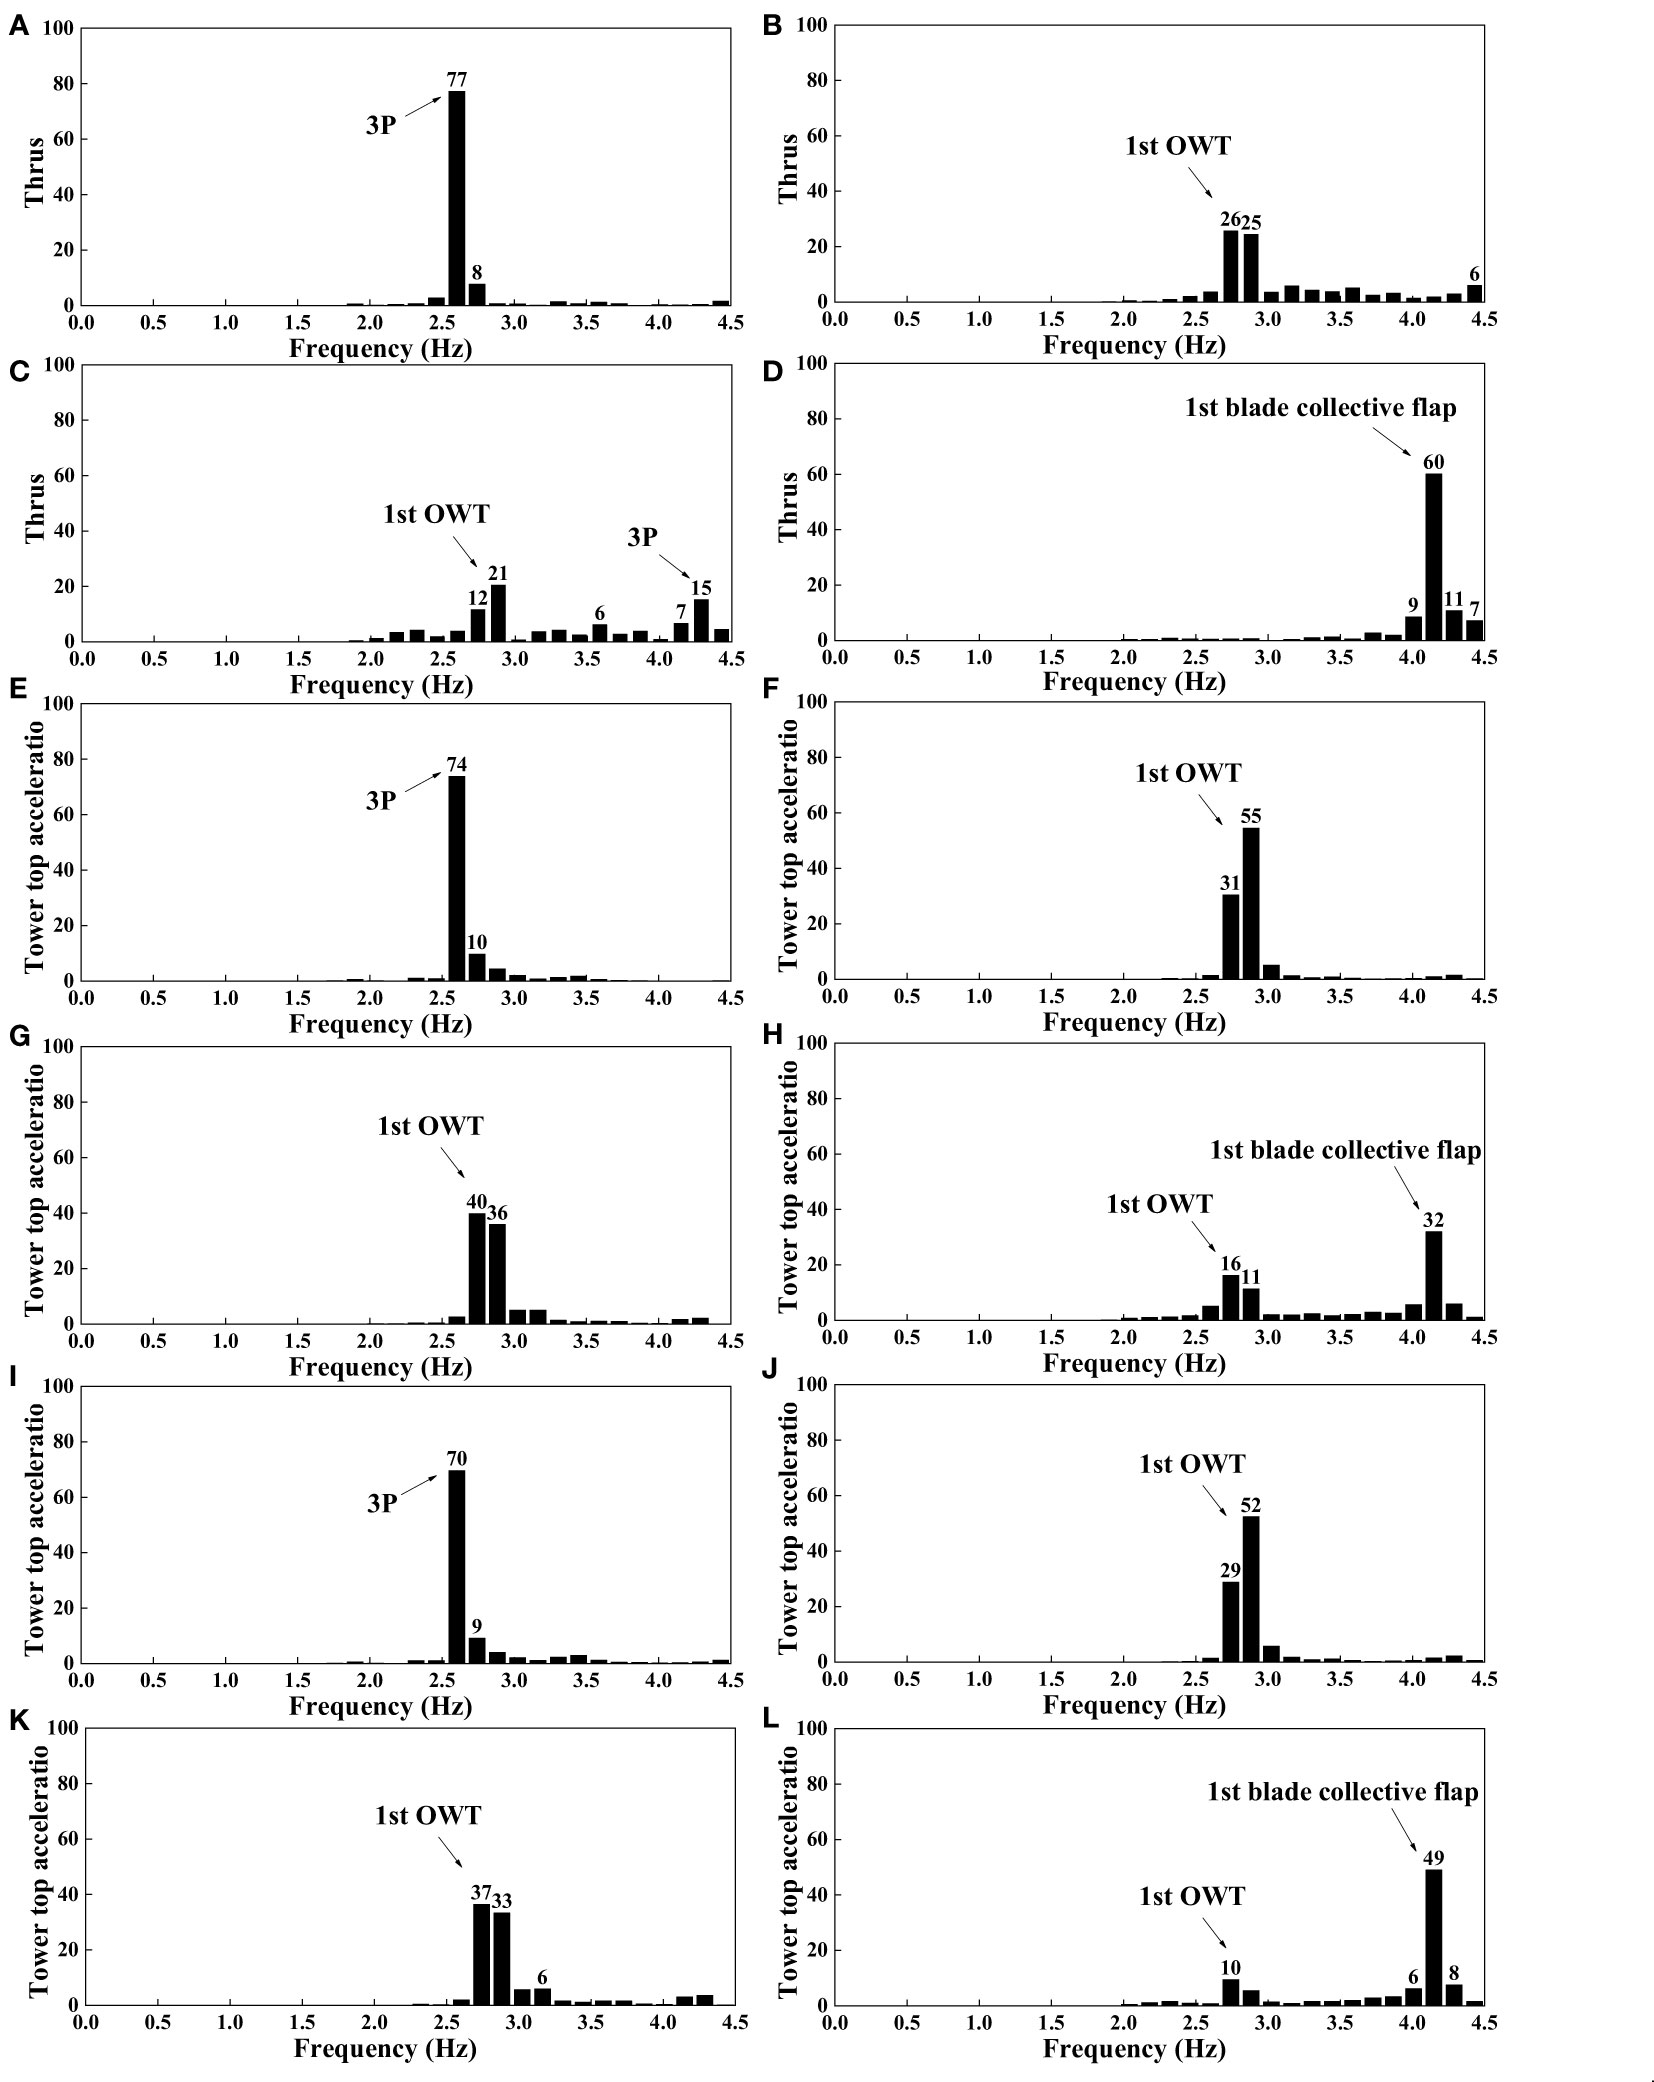
Figure 8 Energy distributions of decomposed thrust loads, tower top and base accelerations. (A) Energy distributions of decomposed thrust loads, LC1, Vhub = 0.7 m/s. (B) Energy distributions of decomposed thrust loads, LC2, Vhub= 1.3 m/s. (C) Energy distributions of decomposed thrust loads, LC3, Vhub = 2.1 m/s. (D) Energy distributions of decomposed thrust loads, LC4, Vhub= 3.3 m/s. (E) Energy distributions of decomposed tower top accelerations, LC1, Vhub= 0.7 m/s. (F) Energy distributions of decomposed tower top accelerations, LC2, Vhub= 1.3 m/s. (G) Energy distributions of decomposed tower top accelerations, LC3, Vhub = 2.1 m/s. (H) Energy distributions of decomposed tower top accelerations, LC4, Vhub= 3.3 m/s. (I) Energy distributions of decomposed tower base accelerations, LC1, Vhub= 0.7 m/s. (J) Energy distributions of decomposed tower base accelerations, LC2, Vhub= 1.3 m/s. (K) Energy distributions of decomposed tower base accelerations, LC3, Vhub= 2.1 m/s. (L) Energy distributions of decomposed tower base accelerations, LC4, Vhub= 3.3 m/s.
Figure 7A shows the decomposed histories of thrust load under the test wind speed of 0.7 m/s. The frequencies (2.53, 2.67) Hz in the FB dominate the thrust load, and the quantified influence can exceed 75%, as shown in Figure 8A. The rotor speed in the test case is 51.96 rpm; thus, the threefold blade passing frequency of 2.60 Hz significantly stimulates the thrust loads from the cut-in to rated wind speeds. The remarkable influence of the FBs [i.e., (2.67, 2.81) and (2.81, 2.95) Hz] must also be emphasized; the frequencies approximate the fundamental frequency of the scaled OWT model. As depicted in Figure 8A, the contribution of the frequencies in these two FBs can reach 8%. The dynamic characteristics of the thrust loads of the operational OWT model under scaled rated and above rated wind speeds are shown in Figures 7B, C. The figure indicates that these are approximately identical with the coupling mechanisms under the test wind speed of 2.1 m/s. The threefold blade passing frequency of 4.28 Hz in FB (4.22, 4.35) Hz and the frequencies approximating the OWT model fundamental frequency in FBs (2.67, 2.81) and (2.81, 2.95) Hz dominate the thrust loads for an operational OWT. As depicted in Figures 8B, C, the total influence of these frequencies reaches 51% and 48% under the test wind speed of 1.3 m/s and 2.1 m/s, respectively.
Compared with the normal operation test cases, for the parked OWT model under the test wind speed of 3.3 m/s, different coupling mechanisms are observed, as indicated in Figure 7D. In addition to the structural fundamental frequency, the first blade collective flap frequency of 4.19 Hz is identified. Remarkably, the influence of frequencies in FB (4.08, 4.22) Hz can reach 60%, as shown in Figure 8D. On the basis of the above comparisons, the coupling mechanisms of the scaled OWT model thrust load under different test winds are proven. Moreover, the influence of each dominant frequency is quantified using the wavelet packet method. Remarkable interactions between the RNA and support structure are observed even under the parked state.
4.3.2 Measured Tower Top Accelerations Under Different Inflows
The measured tower top accelerations are decomposed using the wavelet packet method to study the coupling mechanisms of tower motions under different inflow winds, as shown in Figures 7E–H. The quantified influences of dominant frequencies are depicted in Figures 8E–H.
The significant influence of the threefold blade passing frequency on the tower top acceleration under the test wind speed of 0.7 m/s must be considered. As shown in Figure 8E, its influence can exceed 70%. The frequencies near the fundamental frequency of the OWT model dominate the tower top acceleration in the remaining test cases for OWT operation. For example, the influence of decomposed FBs [i.e., (2.67, 2.81) and (2.81, 2.95) Hz] on the structure’s fundamental frequency can reach approximately 85% under the scaled rated test wind. Therefore, for the normal operation-scaled OWT model, the dynamic characteristics of tower motions under different inflow winds can be summarized as follows. The interactions between the rotor system and support structure, such as the observed significant influence of the threefold blade passing frequency under a test wind speed of 0.7 m/s, dominate the tower motions from cut-in to rated wind speeds. With the increase in inflow winds (exceeding the scaled rated wind) and deployed blade pitch control strategy, the tower motions are significantly stimulated by the frequency components that approximate the structure’s fundamental frequency, as shown in Figures 7F, G.Moreover, the effects of the natural frequencies of the rotor blades and OWT model on tower motions under a test wind speed of 3.3 m/s are comparable. As depicted in Figure 8H, the proportions of the fundamental frequencies of the first collective blade flap and OWT model are 32% and 27%, respectively. Although the blade feather control strategy is adopted to alleviate the thrust loads under the test wind exceeding the scaled cut-out wind speed, the influence of the coupling effects between the rotor system and support structure must also be considered for the parked OWT model.
4.3.3 Measured Tower Base Accelerations Under Different Inflow Winds
The recorded histories of tower base acceleration using the wavelet packet method under the test wind speed of 0.7 m/s are shown in Figure 7I. The figure shows the prominent influence of the threefold blade passing frequency on tower base acceleration. According to Figure 8I, the proportion of this dominant frequency can reach approximately 70%. The proportions of the rotor rotation and fundamental frequencies of the OWT model under the additional test cases are shown in Figures 8J, K. The coupling mechanisms of the tower base acceleration are proven to be approximately identical to the tower top acceleration under the selected test wind speeds. For example, the frequencies that approximate the fundamental frequency of the OWT model dominate the tower top and base accelerations at test wind speeds of 1.3 and 2.1 m/s, respectively. Moreover, the influence of the first collective blade flap frequency on the tower base acceleration can reach 49% at a test wind speed of 3.3 m/s, as depicted in Figure 8L.
Although the fundamental consistencies of the coupling mechanisms of the tower top and base accelerations have been proved, further detailed comparisons of the response statistics are implemented to distinguish the variations in tower motions at different inflow winds, as shown in Figure 7J. The tower base accelerations are generally smaller than the related tower top motions. Moreover, the distinctive influence of test winds and mechanical control strategies on tower acceleration is observed. The general increase in tower accelerations from scaled cut-in to rated wind speeds is due to the increase in thrust loads under such test winds, as listed in Table 7. In the normal operation range exceeding the scaled rated speed, the activated pitch control strategy and decreased thrust loads on the rotor plane cannot alleviate the tower accelerations, as indicated by the comparison between test winds 1.3 and 2.1 m/s (Figure 7J). The increased wind loads on the tower model at a test wind speed of 2.1 m/s and the nonuniformity of generated test wind fields are deemed as the primary reasons for the discrepancies. With the deployed blade pitch-to-feather control strategy for the parked OWT model, minimum tower accelerations compared with those in normal operation test cases are observed at a test wind speed of 3.3 m/s.
5 Conclusions
In this study, a fully coupled dynamic model test method is recommended for an ultra-large jacket OWT under wind and wave loads. The strict requirement of Reynolds number similarity is relaxed, and a scaled RNA model is designed on the basis of the similarities of the essential aerodynamic loads and operation parameters. By introducing the SD7032 airfoil and redesigning the chord length of the scaled blade model, thrust load similarity is satisfied without modifying the scaled test wind speeds. Auxiliary scaled drivetrain and blade pitch control systems are designed to ensure the similarities of the rotor speed and blade pitch angle. The mass of the scaled RNA model is strictly limited to 2.86 kg based on the selected geometry scale ratio. Accordingly, high-strength and low-density carbon fiber and aluminum are used as materials in the production of scaled blades and remaining RNA models, respectively.
The scaled support structure model is designed on the basis of joint hydro-structural elastic similarities, and PMMA is selected as the raw material. Then, additional approximately uniform additional weights are distributed along the support structure model (without a splash zone) to satisfy the density similarity. A sensor arrangement consisting of three-component load cell, acceleration sensors, and strain gauges is proposed. Typical scaled inflow wind test cases are selected and implemented in the present study. The following conclusions are drawn on the basis of the dynamic model tests.
(1) The accuracy of the scaled RNA model is calibrated, and the modeled average thrust loads on the rotor plane are found to coincide well with the related scaled values of the WT prototype, particularly from cut-in to rated wind speeds.(2) The fabrication precision of the integrated scaled OWT physical model is validated on the basis of the good agreement between the measured and scaled theoretical values, such as the OWT first mode and RNA model rotational frequency. Hence, the applicability of the proposed fully coupled dynamic model test method is verified.(3) The remarkable interactions between the RNA and support structure are observed on the basis of the measured thrust loads. The threefold blade passing frequency dominated the response in the range of scaled cut-in to rated wind speeds, and the fundamental frequency of the OWT model can also be observed from scaled rated to cut-out wind speeds. For the parked OWT model under the scaled cut-out wind speed, the first collective blade flap frequency is identified.(4) Under the normal operation test cases, the tower base accelerations are generally smaller than the related tower top motions. Moreover, the interactions between the rotor system and support structure dominate the tower motions from scaled cut-in to rated wind speeds. With the increase in inflow winds and deployment of the blade pitch control strategy exceeding the rated wind, the tower motions are significantly stimulated by the frequencies approximating the fundamental frequency of the OWT model.(5) The comparable influence of the rotor blades and OWT model natural frequencies on the tower motions is observed under parked OWT test cases. Although the blade feather control strategy is applied to mitigate the thrust loads under such cases, the coupling effects between the rotor system and support structure must also be considered. (6) According to the accurate modeling of aerodynamic thrust loads and essential parameters, the proposed design method of scaled RNA model consisting of performance-scaled blade model and the related drivetrain and pitch control systems can be applied to the other OWT model tests. Moreover, the applicability of the joint hydro-structural elastic similarity for the bottom fixed OWT model design is validated on the basis of the appropriately scaled support structural first bending mode.
Data Availability Statement
The original contributions presented in the study are included in the article/supplementary material. Further inquiries can be directed to the corresponding author.
Author Contributions
Conceptualization: DL; methodology: DL and CH; investigation: CH; writing—first draft preparation, writing, review, and editing: DL, SZ, WW, JS, XL, and QL; visualization: SZ, WW, and JS; supervision and funding acquisition: WW and XL; WW, XL, and QL set the objectives of the research, provided guidance for the research, and revised the paper. All authors contributed to the article and approved the submitted version.
Funding
The authors acknowledge the support from the National Natural Science Foundation of China (Grant Nos. 51939002 and 52001052).
Conflict of Interest
CH, SZ, JS, and QL are employed by PowerChina Huadong Engineering Corporation Limited.
The remaining authors declare that the research was conducted in the absence of any commercial or financial relationships that could be construed as a potential conflict of interest.
Publisher’s Note
All claims expressed in this article are solely those of the authors and do not necessarily represent those of their affiliated organizations, or those of the publisher, the editors and the reviewers. Any product that may be evaluated in this article, or claim that may be made by its manufacturer, is not guaranteed or endorsed by the publisher.
References
Abhinav K. A., Saha N. (2017). Stochastic Response of Jacket Supported Offshore Wind Turbines for Varying Soil Parameters. Renewable Energy. 101, 550–564. doi: 10.1016/j.renene.2016.09.019
Ahn H. J., Shin H. (2019). Model Test and Numerical Simulation of OC3 Spar Type Floating Offshore Wind Turbine. Int. J. Naval Architect. Ocean. Engineer. 11, 1–10. doi: 10.1016/j.ijnaoe.2017.09.010
Bachynski E. E., Thys M., Sauder T., Chabaud V., Saether L. O. (2016). “Real-Time Hybrid Model Testing of a Braceless Semi-Submersible Wind Turbine: Part II - Experimental Results,” Proceedings of the ASME 2016 35th International Conference on Ocean, Offshore and Arctic Engineering (Busan, South Korea: The American Society of Mechanical Engineers).
Bak C., Zahle F., Bitsche R., Kim T., Yde A., Christian Henriksen L., et al. (2013). Department of Wind Energy I-Report Description of the DTU 10 MW Reference Wind Turbine (Copenhagen, Denmark: Technical University of Denmark).
Browning J. R., Jonkman J., Robertson A., Goupee A. J. (2014). Calibration and Validation of a Spar-Type Floating Offshore Wind Turbine Model Using the FAST Dynamic Simulation Tool. J. Phys. 555(012015), 1–11. doi: 10.1088/1742-6596/555/1/012015
Carswell W., Arwade S. R., Johansson J., DeGroot D. J. (2022). Influence of Foundation Damping on Offshore Wind Turbine Monopile Design Loads. Mar. Struct. 83(103154), 1–16. doi: 10.1016/j.marstruc.2021.103154
Cheng P., Huang Y., Wan D. (2019). A Numerical Model for Fully Coupled Aero-Hydrodynamic Analysis of Floating Offshore Wind Turbine. Ocean. Engineer. 173, 183–196. doi: 10.1016/j.oceaneng.2018.12.021
Du W., Zhao Y., He Y., Liu Y. (2016). Design, Analysis and Test of a Model Turbine Blade for a Wave Basin Test of Floating Wind Turbines. Renewable Energy. 97, 414–421. doi: 10.1016/j.renene.2016.06.008
Etemaddar M., Blanke M., Gao Z., Moan T. (2016). Response Analysis and Comparison of a Spar-Type Floating Offshore Wind Turbine and an Onshore Wind Turbine Under Blade Pitch Controller Faults. Wind. Energy. 19, 35–50. doi: 10.1002/we.1819
Guo J., Hang D., Zhu X. (2020). Prediction of Crack Propagation in U-Rib Components Based on the Markov Chain. J. Bridge. Engineer. 25, 04020089. doi: 10.1061/(ASCE)BE.1943-5592.0001624
Ifeachor E. C., Jervis B. W. (2004). Digital Signal Processing:A Practical Approach (Second Edition) (Beijing: Publishing House of Electronics Industry of China).
Jonkman J. M. (2005). FAST User’s Guide (Golden, CO: National Renewable Energy Laboratory). Technical Report No. NREL/EL-500-38230.
Jonkman B., Jonkman J. M. (2016). FAST User’s Guide: Version 8.16.00 (Golden, CO: National Renewable Energy Laboratory).
Jonkman J. M., Sprague M. (2021). OpenFAST Documentation (Golden, CO: National Renewable Energy Laboratory).
Kim S., Sclavounos P. D(2001). "Fully Coupled Response Simulations of Theme Offshore Structures. In Water Depths of Up to 10,000 Feet." Paper presented at the The Eleventh International Offshore and Polar Engineering Conference, Stavanger, Norway, June 2001.
Larsen T. J., Hansen A. M. (2007). How 2 Horizontal Axis Wind Turbine Simulation Code 2nd Generation (HAWC2), the User’s Manual (Roskilde, Denmark: Technical University of Denmark).
Lifes50+ (2021). Qualification of Innovative Floating Substructures for 10MW Wind Turbines and Water Depths Greater Than 50m (Stuttgart: University of Stuttgart).
Li Y., Ning F., Jiang X., Yi Y. (2022). Feature Extraction of Ship Radiation Signals Based on Wavelet Packet Decomposition and Energy Entropy. Math. Problems Eng. 2022 (8092706), 1–12. doi: 10.1155/2022/8092706
Lin G., Zhu T., Lin B. (2000). Similarity Technique for Dynamic Structural Model Test. J. Dalian Univ. Techn. 40 (1), 1–8. doi: 10.3321/j.issn:1000-8608.2000.01.001
Li P., Wan D., Hu C. (2016). “Fully Coupled Dynamic Response of a Semi-Submerged Floating Wind Turbine System in Wind and Waves,” in Proceedings of the Twenty-sixth (2016) International Ocean and Polar Engineering Conference[Rhodes, Greece: International Society of Offshore and Polar Engineers (ISOPE).
Mahrous H., Ward R. (2016). “A Low Power Dirac Basis Compressed Sensing Framework for EEG Using a Meyer Wavelet Function Dictionary,”. Canadian Conference on Electrical and Computer Engineering. ( Institute of Electrical and Electronics Engineers Inc.)
Martin H. R. (2011). Development of a Scale Model Wind Turbine for Testing of Offshore Floating Wind Turbine System (Orono: University of Maine).
Plodpradit P., Dinh V. N., Kim K. (2019). Coupled Analysis of Offshore Wind Turbine Jacket Structures With Pile-Soil-Structure Interaction Using FAST V8 and X-SEA. Appl. Sci. 9(1633), 1–15. doi: 10.3390/app9081633
Putri R. M., Obhrai C., Jakobsen J. B., Ong M. C. (2020). Numerical Analysis of the Effect of Offshore Turbulent Wind Inflow on the Response of a Spar Wind Turbine. Energies (Basel) 13(2506), 1–22. doi: 10.3390/en13102506
Ren N., Li Y., Ou J. (2012). The Wind-Wave Tunnel Test of a Tension-Leg Platform Type Floating Offshore Wind Turbine. J. Renewable Sustain. Energy 4(063117), 1–14. doi: 10.1063/1.4767928
Ren Y., Venugopal V., Shi W. (2022). Dynamic Analysis of a Multi-Column TLP Floating Offshore Wind Turbine With Tendon Failure Scenarios. Ocean. Eng. 245, 110472. doi: 10.1016/j.oceaneng.2021.110472
Sørum S. H., Horn J. T. H., Amdahl J. (2017). Comparison of Numerical Response Predictions for a Bottom-Fixed Offshore Wind Turbine. Energy Procedia. 137, 89–99. doi: 10.1016/j.egypro.2017.10.336
Shi W., Park H., Han J., Na S., Kim C. (2013). A Study on the Effect of Different Modeling Parameters on the Dynamic Response of a Jacket-Type Offshore Wind Turbine in the Korean Southwest Sea. Renewable Energy. 58, 50–59. doi: 10.1016/j.renene.2013.03.010
Song J., Lim H. C. (2019). Study of Floating Wind Turbine With Modified Tension Leg Platform Placed in Regular Waves. Energies (Basel) 12 (703) 1–18. doi: 10.3390/en12040703
Thys M., Fontanella A., Taruffi F., Belloli M., Berthelsen P. A. (2019). Hybrid Model Tests For Floating Offshore Wind Turbines. J. Offshore Mechanics Arctic Eng., 1, 1–10. doi: 10.1115/IOWTC2019-7575
Tomasicchio G. R., D’Alessandro F., Avossa A. M., Riefolo L., Musci E., Ricciardelli F., et al. (2018). Experimental Modelling of the Dynamic Behaviour of a Spar Buoy Wind Turbine. Renewable Energy 127, 412–432. doi: 10.1016/j.renene.2018.04.061
Wan L., Gao Z., Moan T. (2015). Experimental and Numerical Study of Hydrodynamic Responses of a Combined Wind and Wave Energy Converter Concept in Survival Modes. Coast. Engineer. 104, 151–169. doi: 10.1016/j.coastaleng.2015.07.001
Wang W., Gao Z., Li X., Moan T. (2017). Model Test and Numerical Analysis of a Multi-Pile Offshore Wind Turbine Under Seismic, Wind, Wave, and Current Loads. J. Offshore Mechanics Arctic Engineer. 139, 1–17. doi: 10.1115/1.4035305
Wang Y., Shi W., Michailides C., Wan L., Kim H., Li X. (2022). WEC Shape Effect on the Motion Response and Power Performance of a Combined Wind-Wave Energy Converter. Ocean. Eng. 250, 111038. doi: 10.1016/j.oceaneng.2022.111038
Xi R., Du X., Wang P., Xu C., Zhai E., Wang S. (2021). Dynamic Analysis of 10 MW Monopile Supported Offshore Wind Turbine Based on Fully Coupled Model. Ocean. Eng. 234 (109346), 1–21. doi: 10.1016/j.oceaneng.2021.109346
Zayed A. I. (2021). Sampling Theorem for Two Dimensional Fractional Fourier Transform. Signal Process. 181,107902: 1–7. doi: 10.1016/j.sigpro.2020.107902
Keywords: offshore wind turbine, dynamic model test, wavelet packet method, scaled model design, joint hydro-structural elastic similarity
Citation: Huan C, Lu D, Zhao S, Wang W, Shang J, Li X and Liu Q (2022) Experimental Study of Ultra-Large Jacket Offshore Wind Turbine under Different Operational States Based on Joint Aero-Hydro-Structural Elastic Similarities . Front. Mar. Sci. 9:915591. doi: 10.3389/fmars.2022.915591
Received: 08 April 2022; Accepted: 23 June 2022;
Published: 26 July 2022.
Edited by:
Wei-Bo Chen, National Science and Technology Center for Disaster Reduction (NCDR), TaiwanReviewed by:
Amin Bibo, Clemson University, United StatesShuaishuai Wang, Norwegian University of Science and Technology, Norway
Copyright © 2022 Huan, Lu, Zhao, Wang, Shang, Li and Liu. This is an open-access article distributed under the terms of the Creative Commons Attribution License (CC BY). The use, distribution or reproduction in other forums is permitted, provided the original author(s) and the copyright owner(s) are credited and that the original publication in this journal is cited, in accordance with accepted academic practice. No use, distribution or reproduction is permitted which does not comply with these terms.
*Correspondence: Dongzhe Lu, bHVkb25nemhlQG1haWwuZGx1dC5lZHUuY24=