 Shoujia Jiang1†
 Zijian Gao
 Yong Zhang
 Xinxin You
 Qiong Shi
 Danqi Lu
95% of researchers rate our articles as excellent or good
Learn more about the work of our research integrity team to safeguard the quality of each article we publish.
Find out more
ORIGINAL RESEARCH article
Front. Mar. Sci. , 22 July 2022
Sec. Marine Molecular Biology and Ecology
Volume 9 - 2022 | https://doi.org/10.3389/fmars.2022.914028
This article is part of the Research Topic Omics-based identification, characterization, and validation of marine bioactive peptides View all 6 articles
Vibrio parahaemolyticus is an important marine pathogen that causes inflammation and even death in teleost fishes. It has brought significant economic losses to the aquaculture industry as well as high risks to the sustainable development of marine fisheries. In the present study, the fish Tetraodon nigroviridis and the bacterial pathogen Vibrio parahaemolyticus were used to explore the molecular mechanisms underlying the immune response of T. nigroviridis to V. parahaemolyticus exogenous infection. The microRNA (miRNA)–mRNA–protein omics and corresponding experimental validation, followed by comparative analysis, revealed several differentially expressed genes involved in various components of the immune system, including the following: complement system, chemokines, lysosomes, phagocytes, B-cell receptor signaling pathway, T-cell receptor signaling pathway, Janus kinase-signal transducer and activator of transcription (JAK-STAT) signaling pathway, and phospholipid metabolism, among others. Especially, the complements component 3 (C3) gene and protein expression levels were significantly higher after V. parahaemolyticus infection, and miRNAs targeting C3, including mir-6089-y, mir-460-y, and mir-1584-x, were significantly down-regulated. The gene and protein expression levels of complement 1 subunit qA (C1qA) were significantly down-regulated, while mir-203 targeting C1qA was significantly up-regulated. Overall, four complement genes (C1qA, IG, C3, and C5), which are key genes in the classical pathway of complement system activation for inflammatory response, were identified. Evolutionary analysis suggested that T. nigroviridis, acquired an increased ability to recognize pathogens by evolving a more complex complement system than terrestrial vertebrates. In addition, quantitative real-time polymerase chain reaction showed high consistency with the obtained multi-omics results, indicating the reliability of the sequencing data generated in the present study. In summary, our findings can serve as a fundamental basis for further in-depth multi-omics studies on the inflammatory processes of aquatic pathogens hindering fish sustainable production.
The green spotted puffer (Tetraodon nigroviridis) is a good animal model for genomic studies, giving its unique characteristics and advantages compared to other animals (Bian et al., 2020). Although its genome is the smallest among known vertebrates (~350 Mb), the number of genes and gene structures are similar to those of humans and zebrafish (Roest Crollius et al., 2000) making it valuable for identifying key conserved regulatory features within both intergenic and intronic regions. There has been a steady increase in the number of published papers in microbiology and immunology regarding T. nigroviridis and its immune factors, including the cytokine-like gene (M17) (Huang et al., 2007), suppressor of cytokine signaling 1 and 3 (SOCS-1 and SOCS-3) (Jin et al., 2007), T-cell receptors (TCRs) (Fischer et al., 2002), C-X-C motif chemokine receptor 3 (CXCR3) (Wang et al., 2017), mitochondrial antiviral signaling (MAVS) protein (Xia et al., 2011), and interferon gamma receptors 1 and 2 (IFNGR1-1 and IFNGR1-2) (Lu et al., 2014). Reports on these immune-related molecules have indicated that T. nigroviridis has both innate and acquired immunity and is, therefore, an ideal research model for fish immunology.
Vibrio parahaemolyticus is a widespread aquatic zoonotic bacterial pathogen, that causes histopathological changes in its host (Subramani and Vignesh, 2012) and may even lead to host death. Vibrio parahaemolyticus infections of marine organism have become more frequent owing to (1) the high survivability of this pathogen, which can live for more than one month at room temperature and up to 47 days in seawater (Oliver et al., 2012); (2) the expanding intensive aquaculture industry, which has led to suppression of the immune system and increased susceptibility of fish to bacterial infections; and (3) rising seawater temperatures due to global climate change, contributing to an increased worldwide prevalence of V. parahaemolyticus (Duan and Su, 2005; Yoon et al., 2008). Therefore, a more detailed understanding of host–pathogen interactions is necessary to elucidate the etiology of V. parahaemolyticus. In recent years, aquatic models have been used to study the pathogenesis of several Vibrio species, such as V. vulnificus and V. choler (Peng et al., 2018; Ali et al., 2021). However, the pathogenesis of V. parahaemolyticus infection remains unclear. Vibrio parahaemolyticus is a diverse and complex species with significant strain-specific variations (Zhang et al., 2016). To determine its epidemiology, we employed a multi-omics approach to characterize the innate immune response of T. nigroviridis to exogenous V. parahaemolyticus infection.
The complement system is a phylogenetically ancient host defense system against infection, and it efficiently identifies and removes pathogens through a variety of mechanisms (Law and Dodds, 1997; Forn-Cuni et al., 2014). It can be activated through the lectin, classical, and alternative complement pathways (Java et al., 2020) (Java et al., 2020) (Java et al., 2020). Complement component 3 (C3) is highly conserved among fishes and mammals, although various animal groups show differential characteristics (Dishaw et al., 2005; Zhu et al., 2005; Fujito et al., 2010). Mammalian C3 is encoded by a single gene, whereas many bony fish present multiple isoforms of C3 (Pinto et al., 2007). This may be due to (1) more intense selection pressure from the aquatic environment (such as exogenous bacteria and viruses), (2) fish complement system instability in response to heat, and/or (3) a more active complement bypass pathway in fish than that in mammals.
Researchers have hypothesized that teleost fishes may have evolved an enhanced innate ability to identify microbes by expanding C3 isoforms. However, pathogenic bacteria and viruses have developed countermeasures to evade the host’s immune system (Sunyer et al., 1998; Nakao et al., 2000; Chen et al., 2019). The classical pathway is activated by complement component 1 (C1), formed by C1q, C1r, and C1s, which bind to immune complexes via C3-convertase (De Córdoba and De Jorge, 2008). This pathway also participates in tolerance strategy through bacterial phagocytosis, cell adhesion, dendritic cell regulation, and B and T cell immune activities (Lu et al., 2008). Studies on C1qA have mostly focused on its binding to immunoglobulins (Yu et al., 2008; Bathige et al., 2013; Chen et al., 2018a). Overall, the functional mechanisms of the complement system response against exogenous bacterial infections in teleost fishes are poorly understood, especially at the protein and genome levels.
Rapid developments in multi-omics technology have enriched our understanding of the complex biological processes in various cells (Zhou et al., 2017). MicroRNAs (miRNAs) are widely expressed in bacteria, and are crucial for host development, metabolism, immune response, and disease response (Zheng et al., 2018; McGeary et al., 2019). Proteomics is a direct method for studying signal transduction and molecular development. In the present study, we applied multi-omics techniques at the miRNA, mRNA, and protein levels to explore the mechanisms of V. parahaemolyticus-related immune responses in the host, which may help reveal new strategies for the prevention of V. parahaemolyticus infections.
Seven hundred healthy T. nigroviridis individuals (length: 7.0–10 cm, weight: 10 g) were obtained from Guangzhou Jinyang Aquaculture Co. Ltd. (Guangdong, China) and were acclimated for several weeks in the laboratory at Sun Yat-Sen University. The fish were raised in a recirculating system at stocking density with a water flow rate of approximately 9.00–10.10 L/min. Fish were fed the commercial pellet with UV-sterilized frozen blood worms once daily at 18:00. Before the experiment, 100 individuals were tested in the preliminary experiment to establish the survival curve and determine the bacterial dose to be used in the experiment.
Serial dilutions from 1.4×10⁷ to 1.4×10¹² colony-forming units (CFU)/mL of V. parahaemolyticus were applied based on a previous report (Peng et al., 2016). Then, 60 individuals of T. nigroviridis were selected and randomly divided into six groups (A–F) of ten fish each, the each group was injected intraperitoneally (approximately 0.5 cm in front of the cloaca chamber): group A, mock injected with 200 μL of phosphate-buffered saline (PBS); groups B–F, injected with 200 μL of 1.4×10⁷, 1.4×10⁸, 1.4×10⁹, 1.4×10¹⁰, 1.4×10¹¹, and 1.4×10¹² CFU/mL, respectively. The Kaplan–Meier plot (log-rank χ2 test) was used to analyze the differences in mortality rates between the different groups.
We randomly assigned 600 individuals of T. nigroviridis into two treatment groups: group CS, which was mock-infected with 200 μL of PBS (200 individuals, two replicates), and group SS, infected with V. parahaemolyticus (400 individuals, four replicates). The Vibrio parahaemolyticuss used in the experiment were isolated from diseased Epinephelus coioides, stored at −80°C in glycerol as previously described (Peng et al., 2016), and then cultured in marine Zobell 2216E broth supplemented with 3.3% NaCl in PBS for 12–16 h with shaking at 200 rpm. According to the survival curve measured in the independent preliminary experiment, T. nigroviridis in the SS group were injected with 1.4×10¹⁰ CFU/mL. Twenty-four hours post-infection (hpi) and 2, 3, 7, and 11 days post-injection (dpi), spleen, liver, head, and kidney samples were collected at random from both CS and SS groups for subsequent multi-omics and quantitative experiments.
At 24 hpi, 18 fish (divided into six replicates) were sampled from CS and SS groups and anesthetized with 200 mg/L tricaine methanesulfonate (BIDE, Guangdong, China; cat. no. BD234866). Three of the six replicates were randomly selected for transcriptomic and miRNA sequencing. The entire liver of each fish was quickly sliced into small pieces (approximately 0.5 cm3), which were transferred into 15-mL centrifuge tubes and stored in liquid nitrogen until sequencing. Then, 30 fish (divided into six replicates) were collected from each group, and three of the replicates were randomly selected for proteomics. For pathological observations and quantitative experiments, another six fish from each group were collected at 2, 3, 7, and 11 dpi and anesthetized before analyses (three fish for pathological observations and three for quantitative analysis). The spleen, liver, and kidney of each specimen were rapidly excised and stored overnight in 4% paraformaldehyde at 4°C before dehydration.
Spleen and liver samples from five fish in the CS and SS groups were treated with the Advanced Vacuum Tissue Processor ASP300S (Leica, Wetzlar, Germany) using paraffin embedding. The tissues were then fixed with Bouin’s solution for 24 h at room temperature (20 to 25°C). Paraffin sections were cut to a thickness of 6 µm and stained with hematoxylin and eosin (Beyotime Institute of Biology, Suzhou, China). The stained sections were observed and imaged under an optical microscope (Eclipse Ni-U, Nikon, Tokyo, Japan).
Total RNA was extracted from each sample using TRIzol reagent (Invitrogen, Carlsbad, CA, USA). RNA quality was evaluated by aragose gel electrophoresis and NanoDrop spectrophotometry (Thermo Scientific, Loughborough, UK). The Agilent 2100 Bioanalyzer (Agilent Technologies, Palo Alto, CA, USA) was used to measure RNA quality and purity. Enriched mRNAs were reverse transcribed to construct six cDNA libraries. Subsequently, paired-end sequencing (300 bp) was performed on the HiSeq 2500 platform (Illumina, San Diego, CA, USA) according to the manufacturer’s instructions. Raw reads were filtered by fastp (version 0.18.0) (Chen et al., 2018b), and mapped to the reference genome using HISAT2.2.4 for obtaining clean reads (Guo et al., 2022), using the “-rna-strandness RF” and other default parameters. Gene transcription levels were estimated using an in-house Perl script (Kim et al., 2015). Two pairwise comparisons were performed between the control (CS) and 24 hpi stages (SS). The R package edgeR (Robinson et al., 2010) was used to identify differentially expressed genes (DEGs) between the two groups. Principal component analysis (PCA) was performed by metaX and R package (http://www.r-project.org/) (Wen et al., 2017).
Significant DEGs between groups were identified based on the |log2FC| ≥2.5 [fold change (FC)] and false discovery rate (FDR) <0.05 criteria (Love et al., 2014). These DEGs were then subjected to enrichment analysis to predict Gene Ontology (GO) (http://www.geneontology.org) and Kyoto Encyclopedia of Genes and Genomes (KEGG) pathway enrichment analysis (http://www.genome.jp/kegg/). Finally, 26 representative immune response-related DEGs were selected for quantitative real-time polymerase chain reaction (qRT-PCR) to validate the transcriptomic data. Specific primers (see detailed sequences in Table S1) were designed using Primer Premier6.0 (Premier, Canada) (Mao et al., 2021). All PCRs were performed in triplicate, and the relative expression levels were normalized to that of the GAPDH gene using the 2−ΔΔCT method (Livak and Schmittgen, 2001).
Total RNA was enriched by polyacrylamide gel electrophoresis in the range of 18–30 nucleotides. Adapters were then added before sequencing on the Illumina HiSeq 2500 platform. MicroRNAs and mRNAs have mutual regulation as they have a targeting relationship, and their expression are negatively correlated. The negatively regulated miRNA–target gene pairs were screened. Then, the miRNA–target gene regulatory network was constructed, and the miRNA target genes were enriched and analyzed to provide clues for the subsequent selection of target genes. The miRNAs with FDR <0.001 and |log2FC| ≥2.5 were selected for subsequent analysis. Statistical analysis was performed using the ggplots and heatmap packages in R to generate volcano plots and heat maps for differentially expressed miRNAs (DEMs), respectively. Three databases were employed for target gene prediction by Genedenovo Biotechnology Co., Ltd (Guangzhou, China): RNA hybrid v2.1.2+svm_light v6.01 (-f 2, 8, -b 1,-v 3,-u 3,-e -10,-n 24), Miranda v3.3a (-sc 140,-en -10,-strict,-go -4.0 -ge 9.0), (Joachims, 1999; Enright et al., 2003; Krüger and Rehmsmeier, 2006), and Target Scan v7.0 (https://www.targetscan.org/vert_70/).The STRING database (https://string-db.org) and Cytoscape v3.7.1 (https://cytoscape.org) were used for visualization (Shannon et al., 2003; Lewis et al., 2005; Szklarczyk et al., 2015; Zhang et al., 2016). The predicted target genes of all DEMS were analyzed by GO enrichment analysis and KEGG pathway analysis. Thirteen immune response and lipid metabolism-related DEMs were selected for qRT-PCR validation (see primer sequences in Table S2). The small nuclear RNA U6 was used as a reference for internal standardization, and analysis were performed in triplicate for each sample.
Peptides were separated at high pH using a linear gradient. The Ultimate 3000 system (Thermo Fisher Scientific, Waltham, MA, USA) equipped with a reversed-phase column (XBridge C18 column, 4.6 mm × 250 mm, 5 µm; Waters Corporation, Milford, MA, USA)] was used for fractionation. The flow rate of the column was allowed to re-equilibrate for 15 min under preliminary conditions. Its flow rate was kept at 1 mL/min at 30°C. Ten fractions were collected, and each fraction was dried in a vacuum concentrator for the next step.
The peptides were redissolved and analyzed using On-line Nanospray liquid chromatography tandem mass spectrometry (LC-MS/MS) on an Orbitrap Fusion combined with nanoACQUITY ultrapure LC (UPLC) (all Thermo Fisher Scientific) (Mao et al., 2021). The parameters for MS in the acquisition mode were set as follows: (1) MS, scan range (m/z) = 350–1500; resolution = 60,000; AGC target = 4e5; maximum injection time = 50 ms; (2) Higher-energy C-trap dissociation (HCD-MS/MS), resolution = 30,000; AGC target = 5e4; maximum injection time = 54 ms; isolation window = 4 m/z; collision energy = 35; stepped energy = 5%.
Raw data from the data-dependent acquisition (DDA) were analyzed using Spectronaut X (Biognosys AG, Zurich, Switzerland). A Spectronaut search database was established with trypsin as the digestion enzyme.
First, data acquisition was performed using nano-high-performance (HP)-LC-MS/MS, according to the above-mentioned method. Raw DIA data were processed and analyzed using Spectronaut X (Biognosys AG). After performing a Student’s t-test, differentially expressed proteins (DEPs) were filtered (based on Q value <0.05 and absolute AVG log2 ratio >0.58). A q-value (FDR) cut-off of 1% for precursor and protein levels was applied. The decoy generation was set to mutate, which is similar to scrambled generation but only applies a random number of amino acid position swamps (min = 2, max = length/2). All selected precursors passing through the filters were applied for quantification. The average top three filtered peptides that passed the 1% q-value cut-off were used to calculate the major group quantities.
Finally, DEPs were filtered based on FC >1.2 or <0.67 and p <0.05. GO and KEGG annotations were performed using the UniProt database (Consortium, 2015). Gene set enrichment analysis (GSEA) was performed using the GSEA MSigDB 3.0 (Liberzon et al., 2011) software to determine if set of genes under in certain GO terms or KEGG pathways showed significant differences between the two groups (Subramanian et al., 2007; Liberzon et al., 2011).
Based on the transcriptome, miRNA, and proteome data, the expression and functional of genes and proteins were compared using quantitative analysis of the association between the transcriptome and proteome, four-quadrant diagram, nine-quadrant diagram, and GO/KEGG analyses. Pearson’s correlation coefficient analysis was performed for the selected DEPs and DEGs using the R package. The screening conditions for the correlation analysis were set at |r|> 0.9 and p<0.01. The OmicStudio tool (https://www.omicstudio.cn/tool) was used for the network map analysis of the screened pairs.
To collect the coding DNA sequences (CDS) of C3, we selected 48 representative genome assemblies from various animals, including eight mammals, three birds, five reptiles, 28 ray-finned fish, two cartilaginous fish, and two basal deuterostomes. Public sequences for human (Homo sapiens), chicken (Gallus gallus), zebrafish (Danio rerio), and T. nigroviridis C3 sequences validated in the National Center for Biotechnology Information (NCBI) and ensemble databases (Table S1) were also selected as queries. Subsequently, the predicted C3 sequences were aligned using the ClustalW software with conserved regions extracted from aligned CDS sequences using blocks. Multiple sequence alignments of the full-length open reading frame sequence were performed based on the four conserved structural domains (a thioester GCGEQ site, RRKR, ANATO site, and C345C) (Wang et al., 2015). Finally, these sequences were analyzed in MrBayes (v3.2.6) (Ronquist et al., 2012) using the Bayesian method with the Metropolis-coupled Markov chain Monte Carlo algorithm.
The same methods were used for C1qA sequence alignment and phylogenetic tree construction in 29 representative species. To evaluate the conservation of C1qA in fishes, we investigated several neighboring genes located the upstream and downstream regions of C1qA paralog. Genes in upstream and downstream regions of C1qA in H. Sapiens (SP|P02745.2) G.gallus (XP_417654.2), Xenopus laevis (XM_018241847.1), and D.rerio (NP_001003482.1) were downloaded from GenBank (https://www.ncbi.nlm.nih.gov/genbank/) and used as reference sequences for searching syntenic regions in the tested genome sequences. Protein alignment to nucleotides was used to identify the same genes in fishes. The basic local alignment search tool (BLAST) was employed to search genome assemblies of the examined fish species, and the best hits were selected with a Perl script (Bian et al., 2020).
We conducted T. nigroviridis for 15 days after V. parahaemolyticus infection. Mortality was recorded daily, and at 15 dpi the mortality rate was determined (Figure 1A) Deaths appeared first at 24 hpi in the 1.4×10¹⁰ CFU/mL SS group, with the mortality rate peaking at 64% at 3 dpi. Vibrio parahaemolyticuss-infected fish showed heavy bleeding on the tail edges, reddening at the base of fins, skin ulcers with red margins, sluggish behavior, erratic movement, and avoidance of feed intake. Pathological observations of the liver revealed tissue damage and glycogen vacuoles (Figures 1B, C), as peak incidence of death mainly at 24 hpi). We hypothesized that the host response in peak infection would largely determine its final survival. Accordingly, we performed a multi-omics study of the entire liver at 24 hpi.
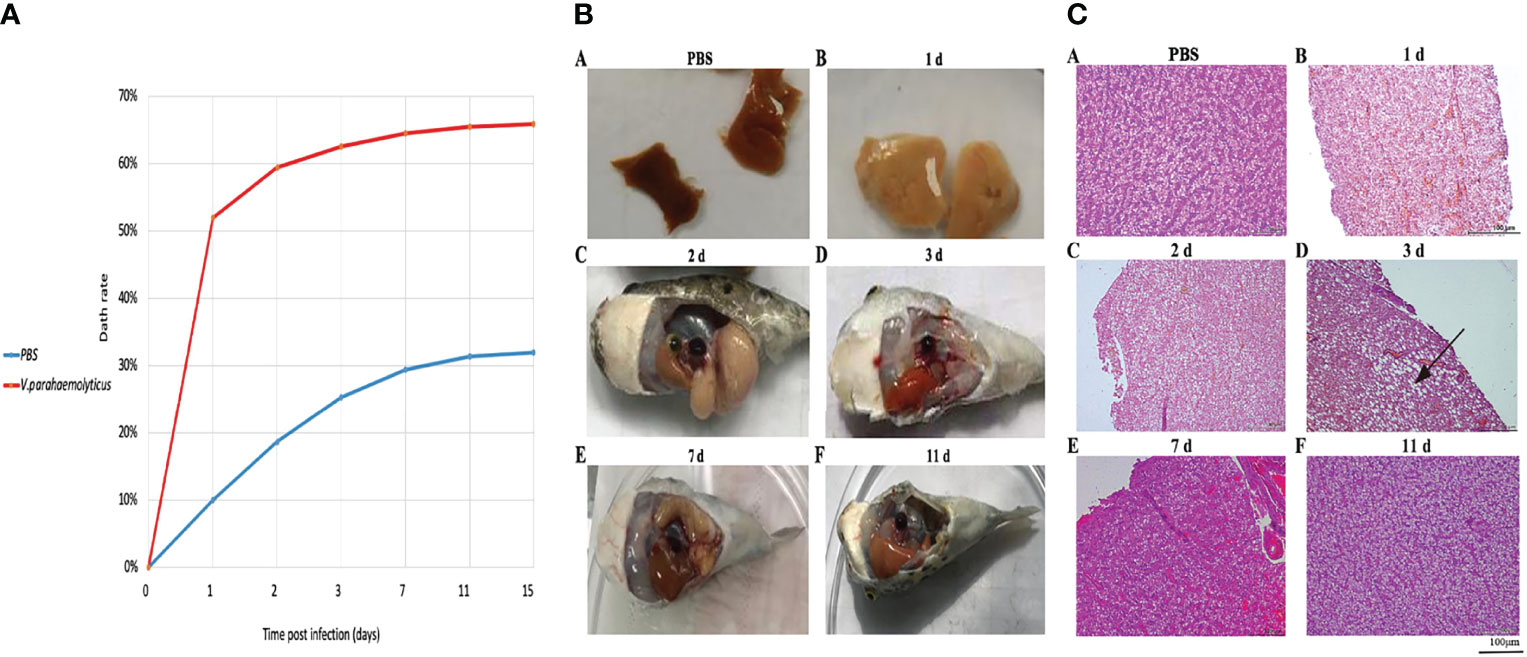
Figure 1 V. parahaemolyticus infection to T. nigroviridis. (A)The mortality rate of T. nigroviridis after V. parahaemolyticus infection. (B) Morphological changes of T.nigroviridis livers. (A) The control group (injected with PBS; (B) 1 dpi; (C) 2 dpi; (D) 3 dpi; (E) 7 dpi; (F) 11 dpi. (C) Histopathological examination of T.nigroviridis livers (magnification, ×100). (A) The control group; (B) 1 dpi; (C) 2 dpi; (D) 3 dpi; (E) 7 dpi; (F) 11 dpi. Black arrow points to fat vacuole.
To explore the immune responses of T. nigroviridis after V. parahaemolyticus infection, we performed transcriptome sequencing of spleen samples from both the CS and SS groups. A total of 468 million clean reads and 463 million high-quality clean reads (99%) were collected from all group (Table 1). Among these high-quality clean reads, 63.89-78.20% were mapped to the T. nigroviridis reference genome. Moreover, 16,902 all reference genes, 18,247 known genes (could be annotated in reference genome), 3,619 new gene (not annotatable in the reference genome) were identified.
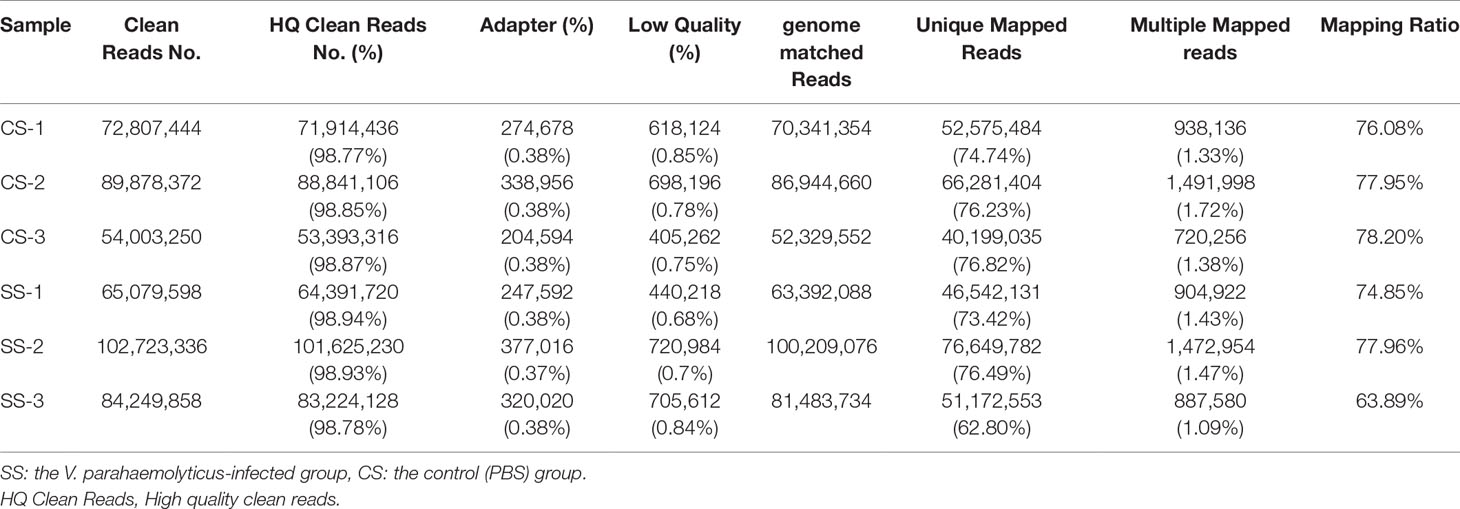
Table 1 Statistics of reads for the transcriptome sequencing.
Difference between the CS and SS groups are presented in a volcano plot. After setting the threshold value, 626 DEGs were identified, including 217 down-regulated DEGs and 409 up-regulated DEGs (Figure 2A). PCA compared the differences in transcriptome among the CS and SS groups and the degree of variation between parallel samples within the groups (Figure 2B). The GO analysis revealed that the 626 DEGs were associated with biological processes and were mainly enriched in cellular processes and single-organism processes (Figure 2C). Expression of DEGs related to “Binding” and “catalytic activity” was the most up-regulated and down-regulated, respectively (Table S2). KEGG pathway analysis indicated that the top canonical pathways associated with DEGs were cytokine-cytokine receptor interactions and phagosomes. Among the 284 enriched pathways, 71 were significantly enriched (Table S3 and Figure 2D).
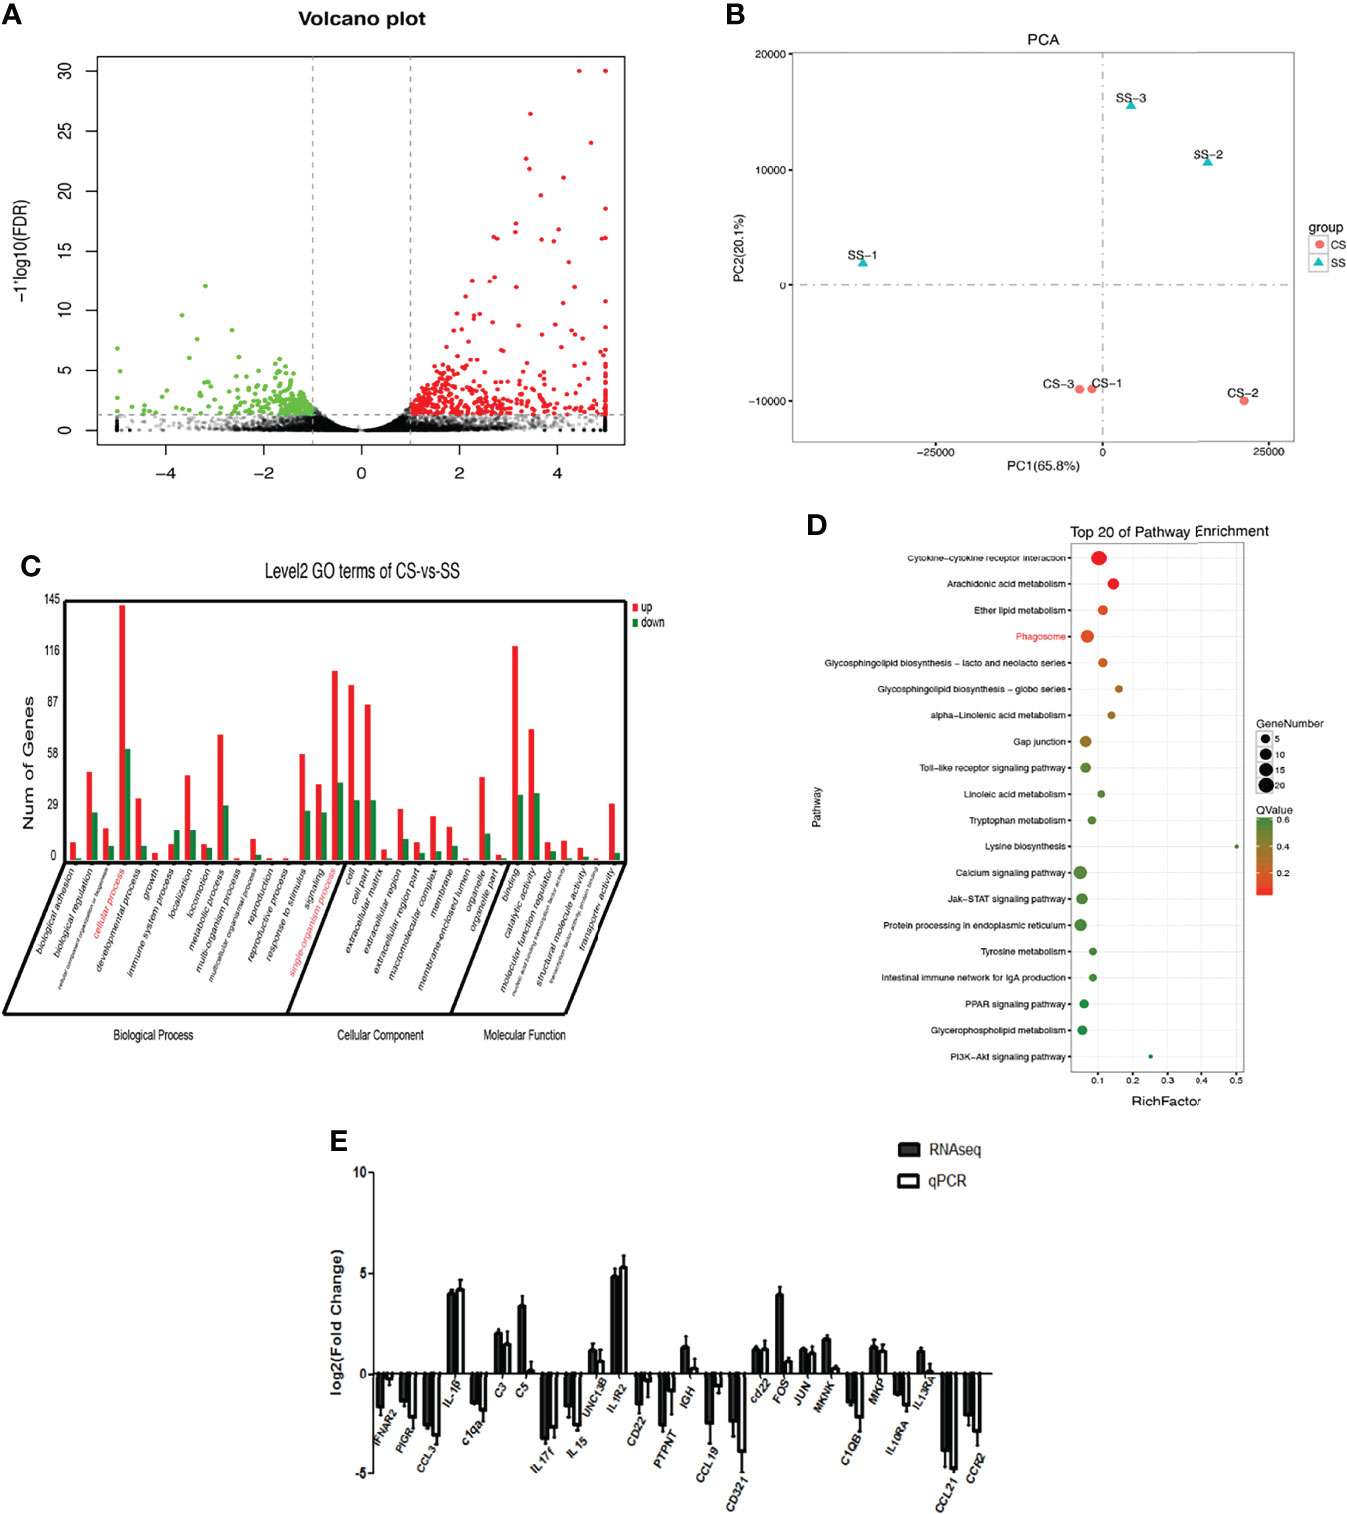
Figure 2 Differential gene expression by transcriptome sequencing. (A)Volcano plot presents the DEGs between CS and SS groups. Down-regulated DEGs are marked in green, and up-regulated DEGs are marked in red. The black dots stand for those genes without significant changes. (B) PCA compared the differences in transcriptome among the CS and SS groups. (C) GO analysis of the transcriptome data. (D) KEGG analysis of the DEGs. (E) Verification of representative DEGs by qRT-PCR.
Functional enrichment analysis indicated that down-regulated DEGs included immunity factors, cytokines, chemokines, and TLR. The upregulated DEGs were mainly enriched in the CXC chemokine family, CC chemokine ligand family (CCL), interferon alpha and beta receptor subunit 2 (IFNAR2), interleukin (IL) 10 receptor alpha subunit (IL-10RA), tumor necrosis factor superfamily member 14 (TNFSF14), IL1 receptor type 2 (IL-1R2), and apoptosis terms. Enriched immune response genes were related to IL-1β, IL-1R2, and major histocompatibility complex class I (MHC-I) presentation. Because lipid metabolism-related genes play important regulatory roles and are closely associated with many metabolic diseases, we also investigated the major DEGs enriched in lipid metabolism-related pathways (Table S4). We selected 26 immune-related DEGs for qRT-PCR (primers listed in Table S5). The transcription levels revealed by qRT-PCR were highly consistent with the transcriptome sequencing patterns (Figure 2E), suggesting the reliability of the high-throughput sequencing data generated in the present study.
To evaluate the association of miRNAs with V. parahaemolyticus infection in T. nigroviridis, we annotated all miRNAs and obtained a total of 41,939 target gene sites (Table 2). Our results indicated the dynamic regulation of 78 miRNAs, including 22 down-regulated DEMs and 56 up-regulated DEMs (Figure S2A). PCA compared the differences in miRNAs among the CS and SS groups in Figure 3A. The GO and KEGG enrichment analyses revealed miRNA-related functions based on the corresponding mRNA. Regarding the biological process terms, we found that responses to stimuli could be associated with a primary focus on binding and catalytic activity. KEGG analysis of the top 20 pathways (p <0.05) showed that they were primarily enriched in metabolic pathways, biosynthesis of secondary metabolites, and biosynthesis of antibiotics (Figures 3C, D).
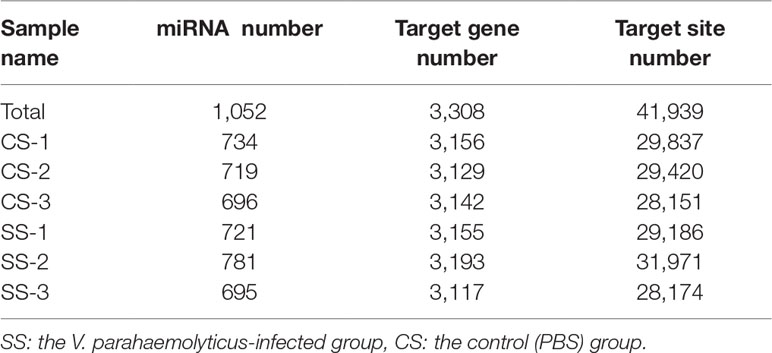
Table 2 Statistics of predicted miRNAs and corresponding target genes.

Figure 3 miRNA analysis of DEMs. (A) PCA compared the differences in miRNA among the CS and SS groups. (B) Go analysis of DEMs. (C) Verification of representative DEMs by qRT-PCR. (D) KEGG enrichment analysis of DEMs. (E) Histogram of miRNAs’ negative correlation with target genes by GO enrichment. (F) A bubble diagram of miRNAs’ negative correlation with target genes by KEGG enrichment.
For the association analysis of miRNAs and mRNAs, a DEM-based network was constructed, and four MCODE modules were identified from the network (Figure S2B). Our results indicated that DEGs and DEMs shared similar transcription trends. The combined analysis of miRNAs and target genes revealed targeting relationships, and miRNA-gene pairs with negatively correlated expression were screened. Additionally, 79 miRNAs potentially controlled 105 target genes, and 341 miRNA-target RNA pairs were obtained for negatively correlated miRNA-target gene pairs.
In addition, the GO and KEGG enrichment analyses of DEGs were consistent with those of the DEM targets (Figures 3E, F). We found 342 significantly differentially expressed miRNA-mRNA pairs in the association analysis (Table S6), including six miRNAs related to adhesive factors, three miRNAs related to complement factors, five miRNAs related to B-cell receptors, and three miRNAs related to CCL21. Some miRNA-mRNA pairs related to lipid metabolism were also identified (Table S7). Ultimately, a comprehensive analysis showed that groups of differentially regulated miRNAs were present during the different stages of V. parahaemolyticus infection. We selected 13 representative DEMs for validation using qRT-PCR (Table S8; Figure 3B; Table S9), which revealed results consistent with the changes observed in the miRNA-sequencing analysis.
In the proteome analysis, 64,519 precursors and 50,621 peptides were identified, corresponding to 6,082 protein groups and 7,003 proteins, respectively (Figure 4A). The intensity of the spectral peaks was used to normalize the intensity of the peaks in all samples, most samples achieved the same response intensity (Figure 4B). PCA compared the differences in proteome among the CS and SS groups in Figure 4C. We compared protein expression differences using the volcano map and a heatmap (Figure 4D). Among the 7,003 proteins, 606 DEPs (p<0.05) were identified, including 330 upregulated and 276 downregulated proteins (Figure 4E). GO and KEGG enrichment analyses were performed on the DEPs. According to the GO annotations, “biological processes,” “response to stimulus,” and “immune system process” were the three most enriched terms (Figures S3A–C). The most significant differences in the top 20 enrichment pathways identified using the KEGG analysis were in “lysosomal, complement and coagulation cascades” and “sphingolipid metabolism” (Figure S3D). The immune pathways based on the KEGG data are summarized in Table S10.
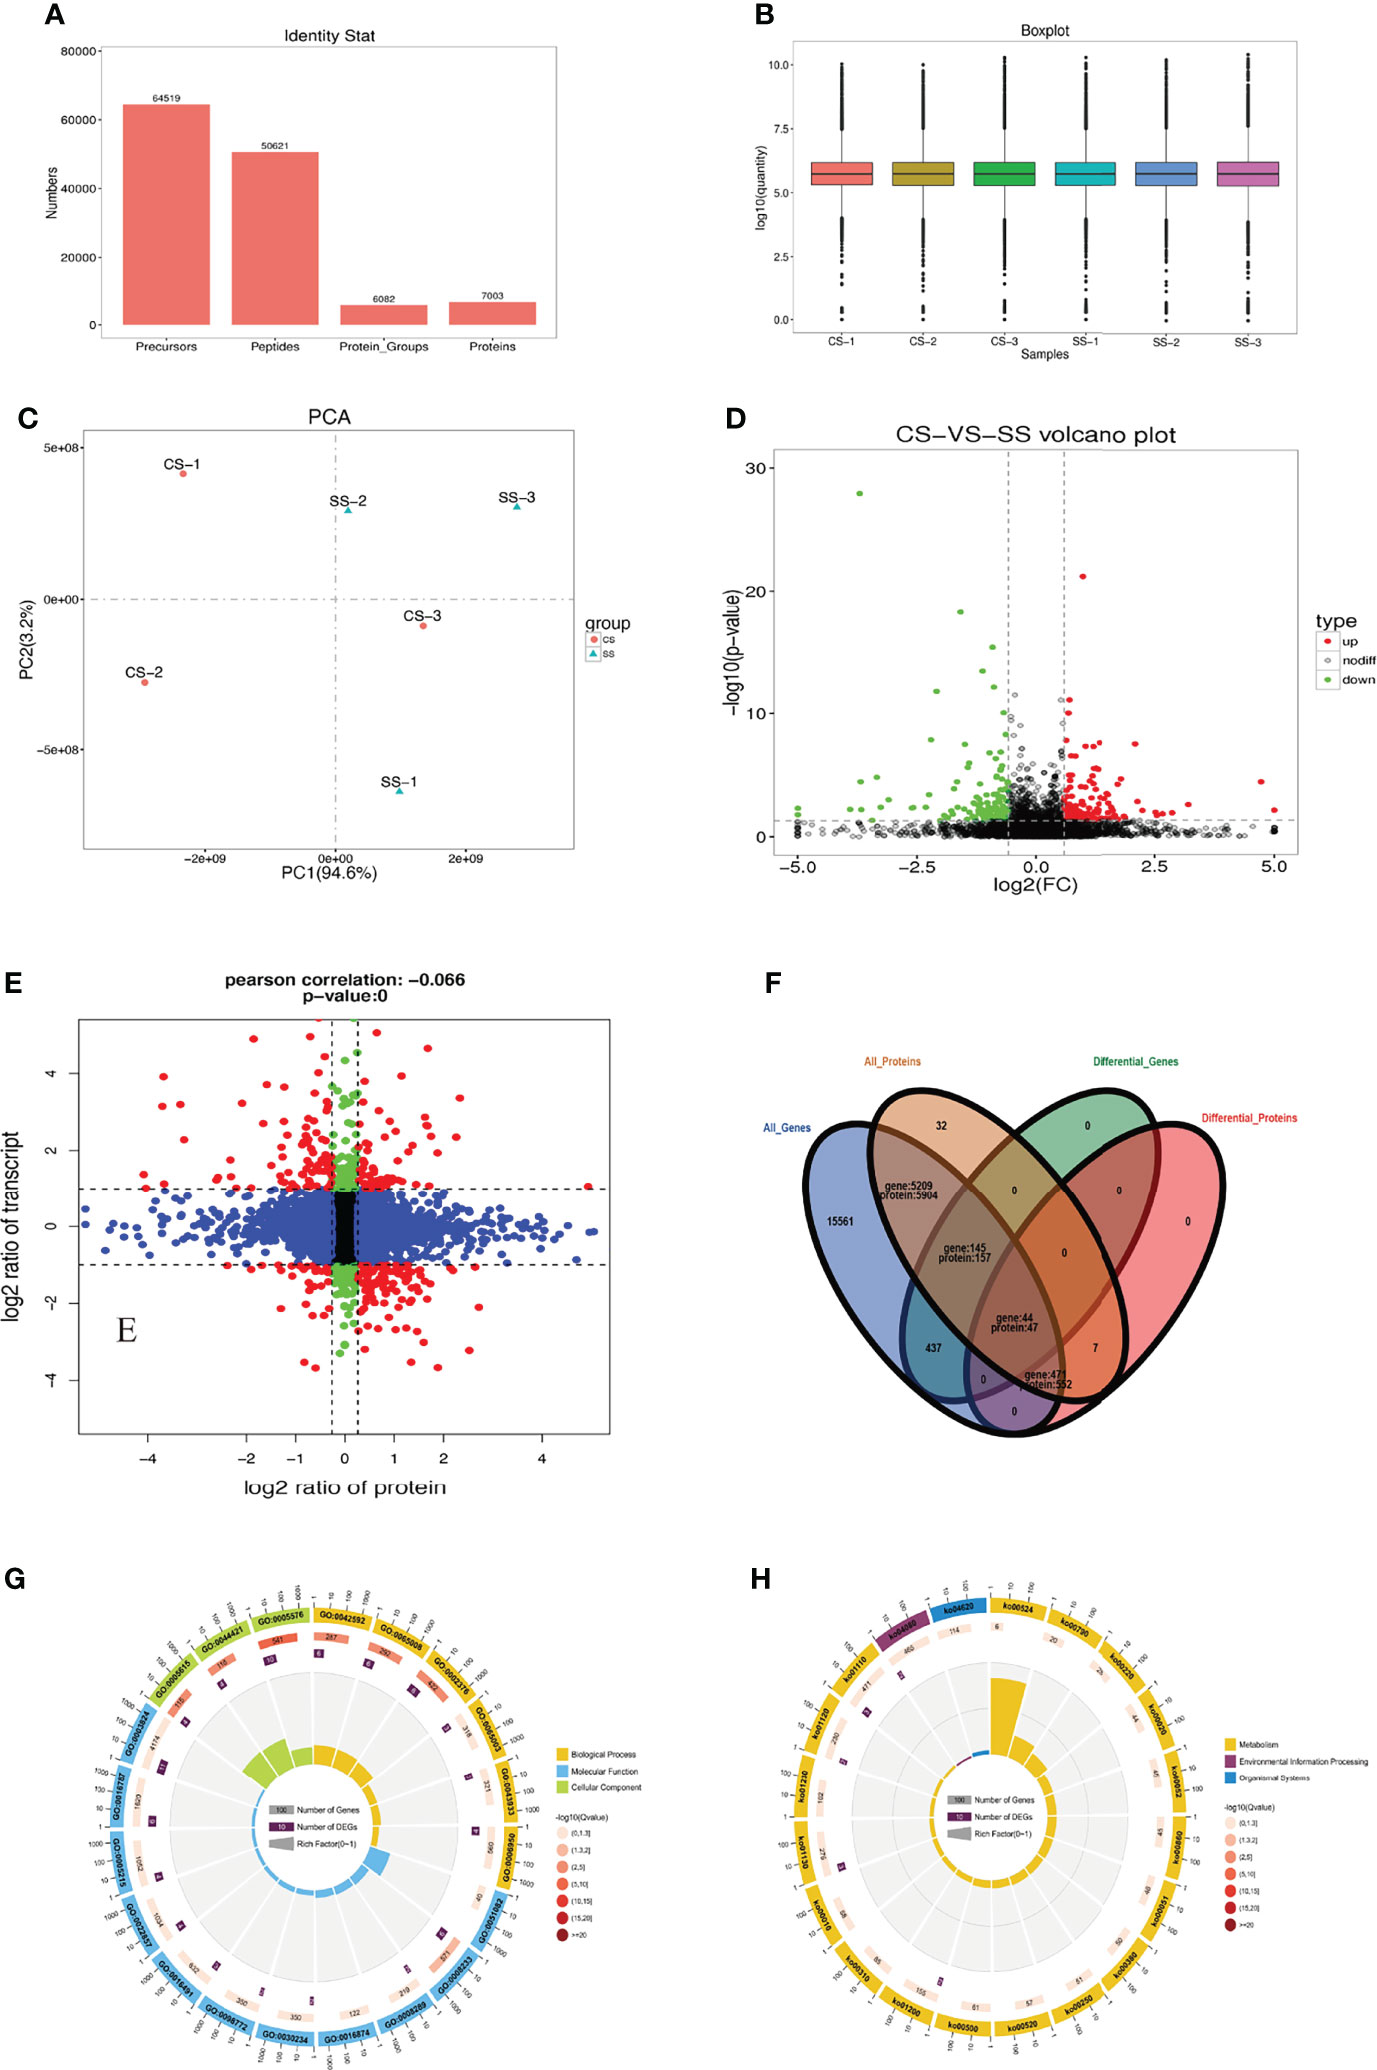
Figure 4 Statistics of protein identification by DIA. (A) Statistics of identified proteins by DIA. (B) Normalized comparison of all samples. (C) PCA compared the differences in protein among the CS and SS groups. (D) A volcano map of DEPs.(E) A nine-quadrant diagram of protein and transcriptome association analysis. (F) Venn diagram of protein and transcriptome association analysis. (G) Significant difference genes and significant difference proteins by GO enrichment. (H) Significant difference genes and significant difference proteins by KEGG enrichment.
We combined the proteome and transcriptome data within a quantitative, significantly different range to plot all genes, proteins, and DEG- (transcriptomics), and DEP- (proteomics) associated genes in a Venn diagram (Figure 4F). Forty-four significant common genes were found among the 626 DEGs and 606 DEPs. Fine distinctions of the transcriptome and proteome were performed to plot a nine-quadrant diagram. We also performed quantitative and enrichment analyses of the genes in each region of the nine-quadrant diagram. Pearson’s correlation coefficient was −0.066. Black dots (group 5) represent DEGs and DEPs with no changes. Red dots (groups 1, 3, 7, and 9) represent DEGs and DEPs that exhibited changes at the mRNA and protein levels. Green dots (groups 2 and 8) and blue dots (groups 4 and 6) indicate changes in either the mRNA or protein levels alone, respectively. The expression of 75 DEPs was up-regulated and 98 DEPs were down-regulated when the expression of corresponding DEGs was up-regulated; the expression of 32 DEPs was down-regulated and that of 110 DEPs was up-regulated, when the expression of the corresponding DEGs was down-regulated. Both DEGs and DEPs changed significantly in both the immune system (GO:0002376) and lysosome (GO:0005764; ko04142), according to the GO and KEGG analyses (Figures 4G, H).
Our comparative analysis revealed that the C3 gene and protein expression levels were significantly increased after V. parahaemolyticus infection, while miRNAs targeting C3 (including mir-6089-y, mir-460-y, and mir-1584-x) were significantly down-regulated. The C1qA gene and protein levels were significantly down-regulated, and mir-203 targeting C1qA was significantly up-regulated (Figure 5, Table 3). The results of the transcriptome-protein–miRNA comparison are shown in Table S11.
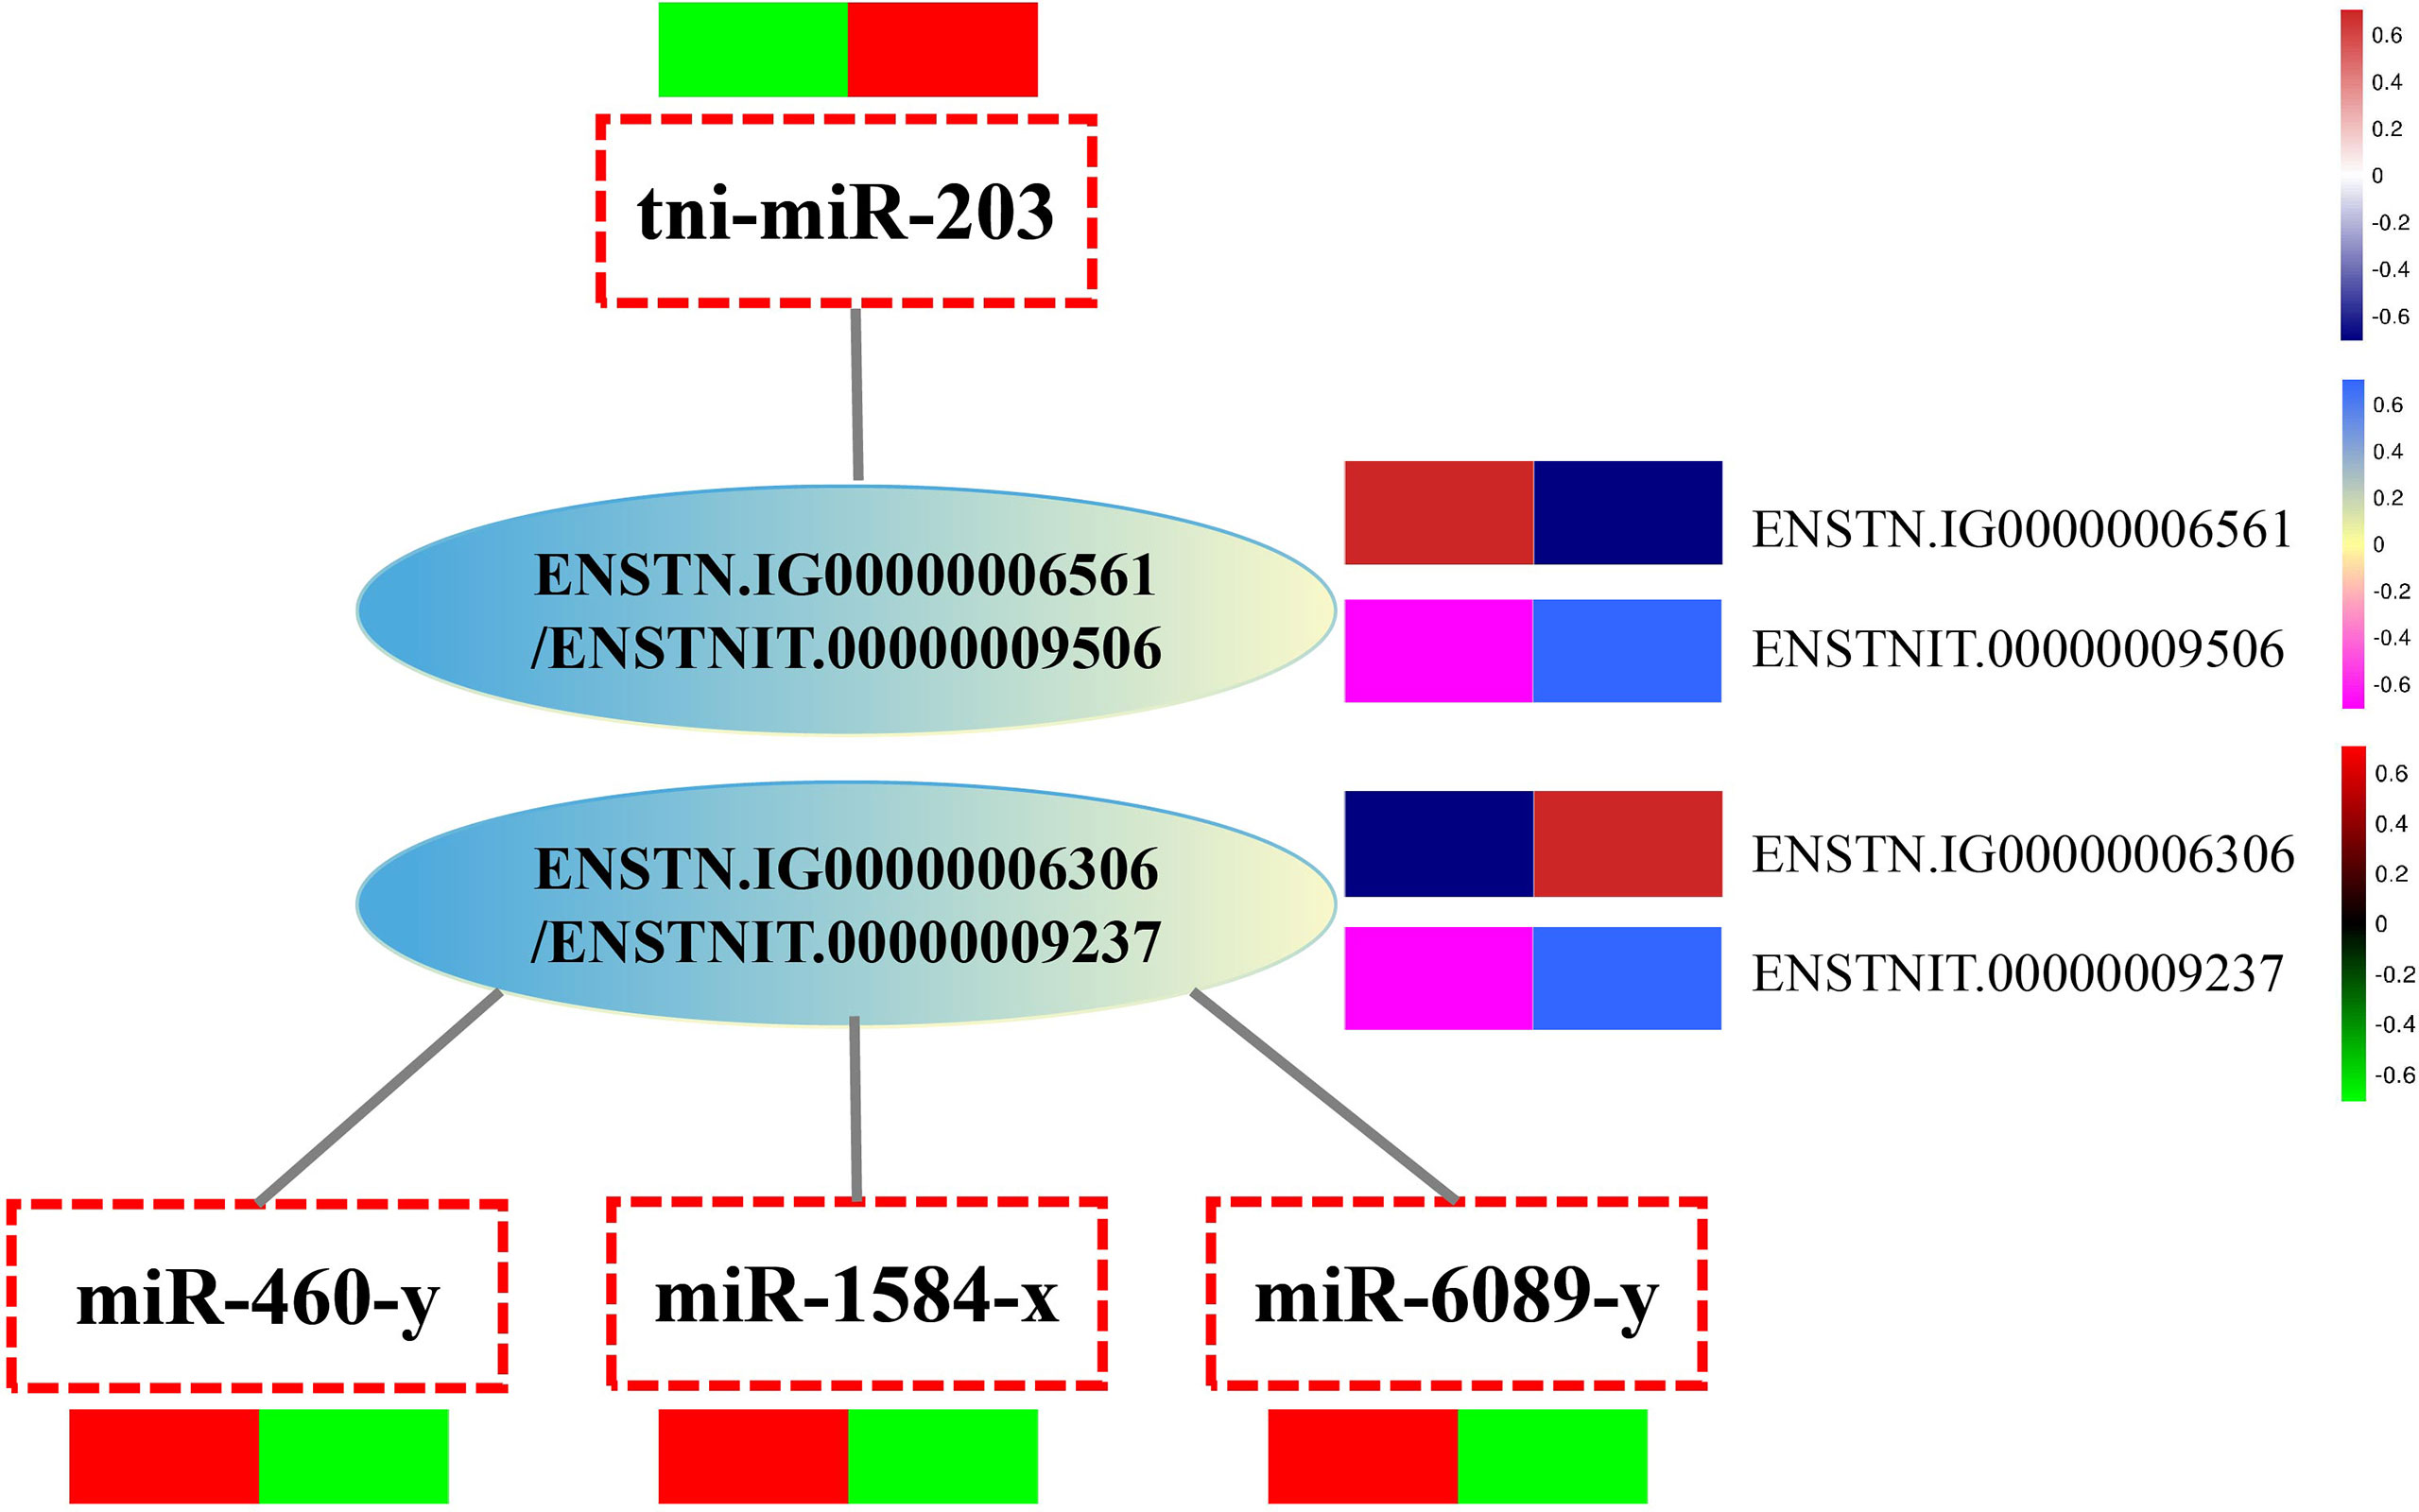
Figure 5 Integrated analysis of miRNA, proteome and transcription profiles. ProteinID: ENSTNIT00000009506 (C1qA), ENSTNIT00000009237 (C3b.2); GeneID: ENSTNIG00000006561, ENSTNIG00000006306; miRNA: tni-miR-203, miR-1584-x, miR-460-y, miR-6089-y.
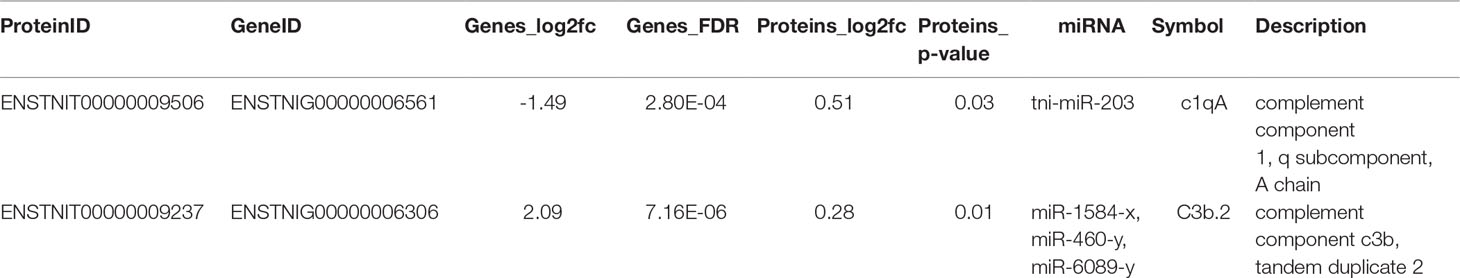
Table 3 Statistical table of joint analysis of all differences in transcriptome protein miRNA.
Nucleotide sequences of 84 C3 and seven other complement genes (C2, C4, C5, C6, C7, C8, and C9) from 37 species and their encoded protein sequences were collected. Reference sequences were downloaded from the NCBI and Ensemble databases (Table S10). C3 appeared to be classified as C3.1 and C3.2. As previously reported, the genomes of mammals and birds contain only one C3 copy. However, due to the greater complexity of fishes, several copies of the C3 gene were confirmed in fishes (two to five in Perciformes, two to eight, but mostly more than six, in Cypriniformes, four to seven in Salmoniformes, two to five in Cyprinodontiformes, and four to six in Tetraodontiformes) (Figure 6). In addition, we constructed a comprehensive phylogenetic tree based on these 84 synteny sequences to resolve the genetic relationships of C3 in various animals, using Branchiostoma floridae as the C3 outgroup and Branchiostoma belcheri as the C1qA outgroup. Based on the conserved blocks of the C3 CDS, we generated a Bayesian radial tree (Figure S4) and observed two clades in the corresponding topology, in with tetrapod forming a sister group to teleosts. Moreover, we observed that T. nigroviridis C3 was more closely related to C3.1.2.
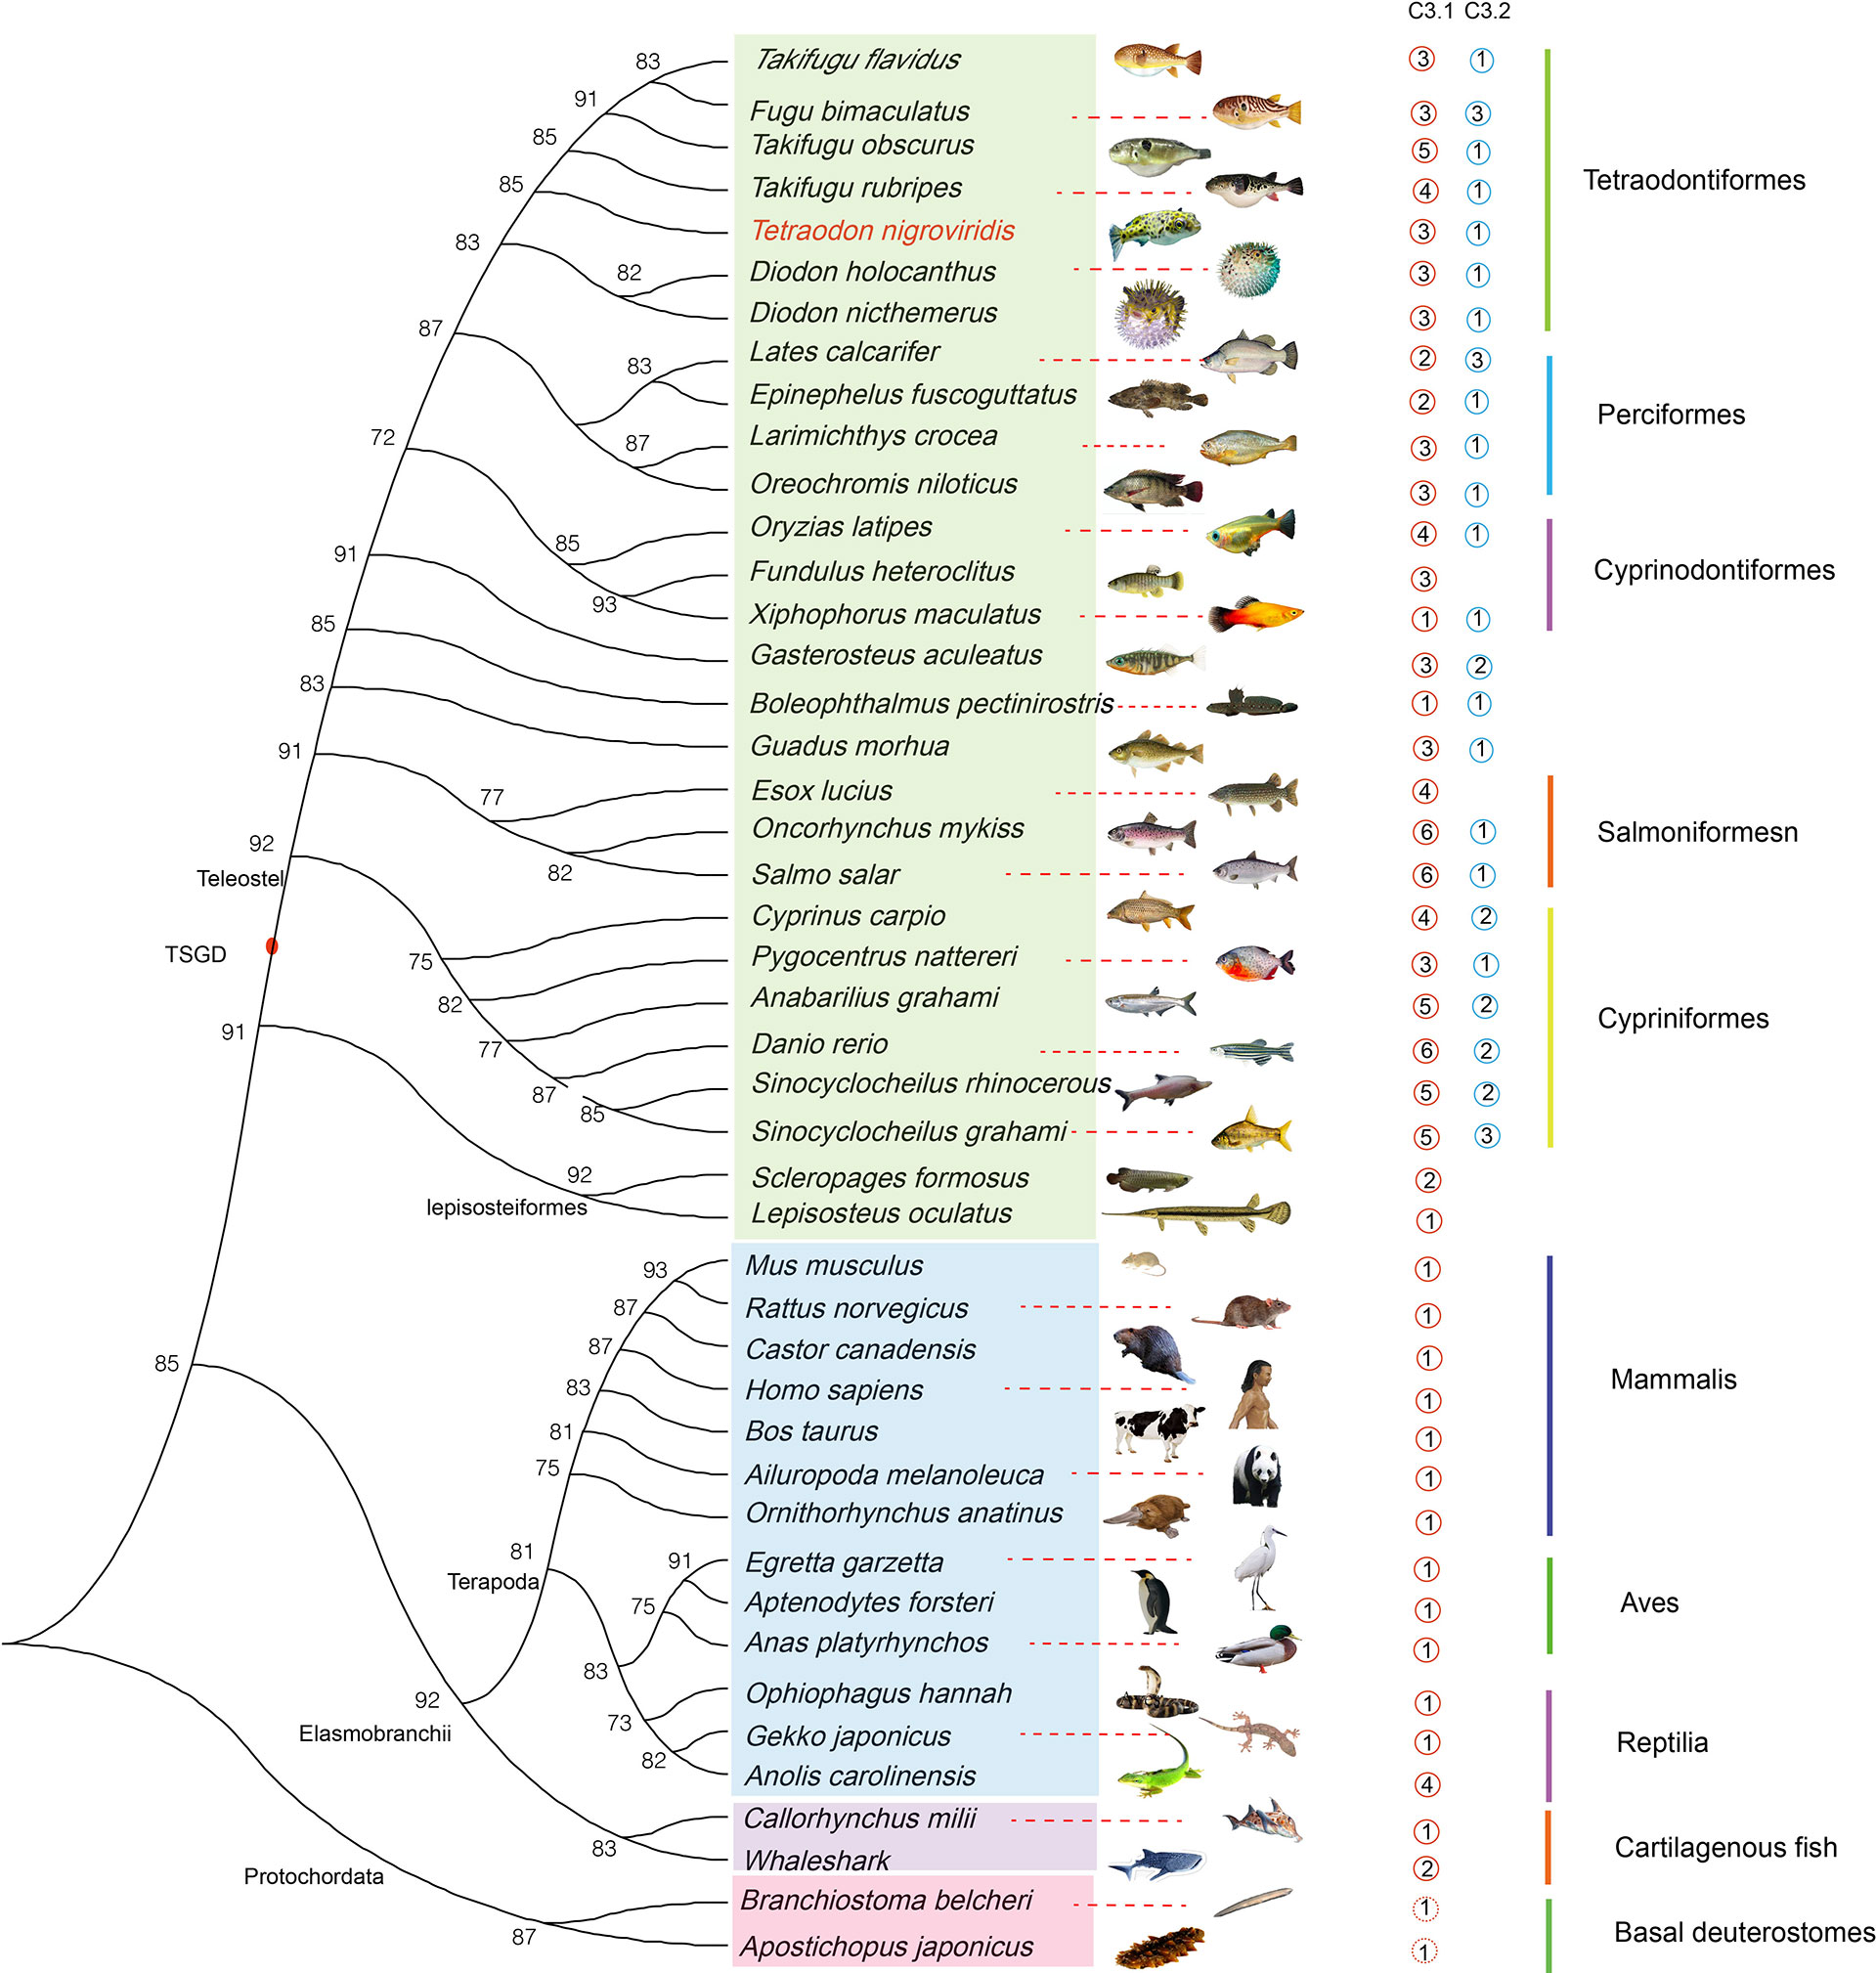
Figure 6 Dendrogram showing the number of predicted C3 genes in various fishes and other vertebrates. TSGD, teleost specific genome duplication.
In addition, we constructed a phylogenetic tree of C1qA in 29 species, and the domain of C1qA was displayed at corresponding positions on the phylogenetic tree (Figure 7). The results showed that the structural domains of C1q proteins did not change significantly during evolution. The synteny analysis of C1qA suggested, common upstream and downstream neighboring genes between mammals and birds, but these neighboring genes are highly different in reptiles and fishes (and even between different orders of fish; see Figure S5 for more details). The sequence alignment of C1qA proteins from various vertebrates is presented in Figure S6.
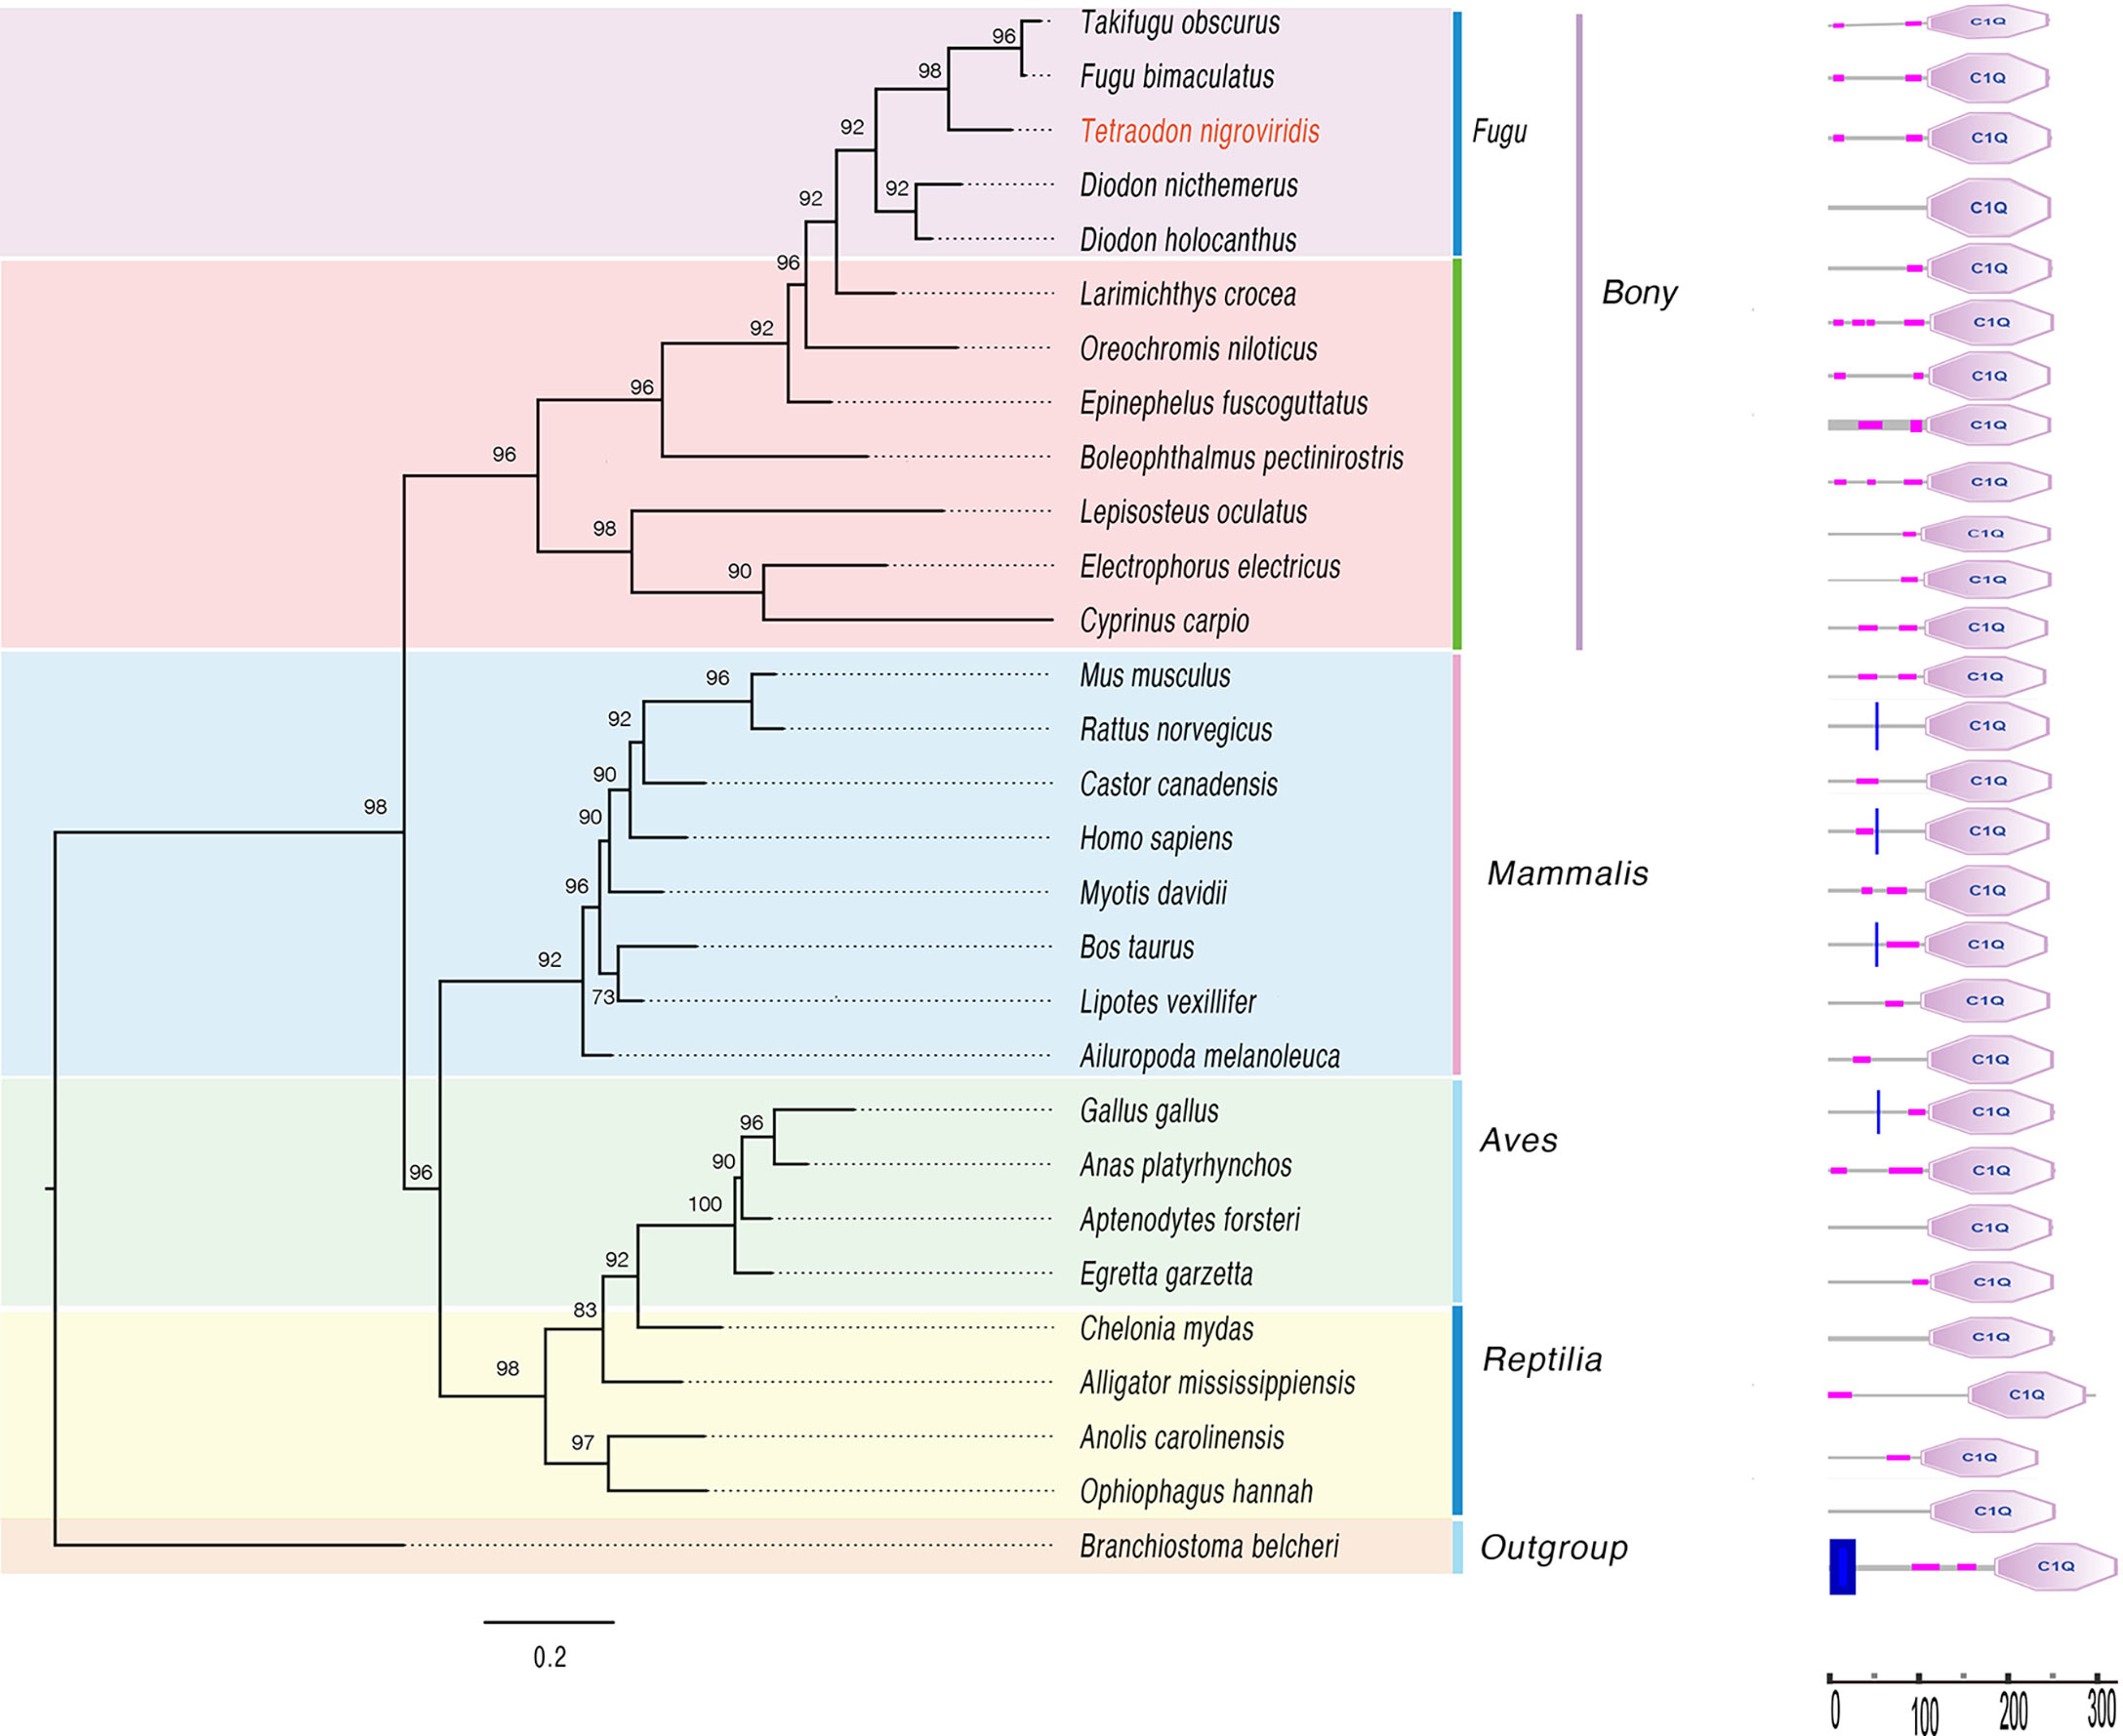
Figure 7 A phylogenetic tree of known C1qA proteins from 29 species (left) and its corresponding protein conserved domains (right). The predicted protein domain architecture of the 29 C1qA genes was determined by the SMART program (Castresana, 2000).
For the integrated analysis, a pipeline overview of the complex network construction is presented in Figure S1. Based on the three different-omics and corresponding experimental validations, we simultaneously associated four complement genes, namely C1qA, IG, C3, and C5, which coincide with the key genes of the classical pathway of complement activation. Finally, one theoretical model of the host response to exogenous V. parahaemolyticus infection was established containing both already known and yet unidentified mechanisms (Figure 8).
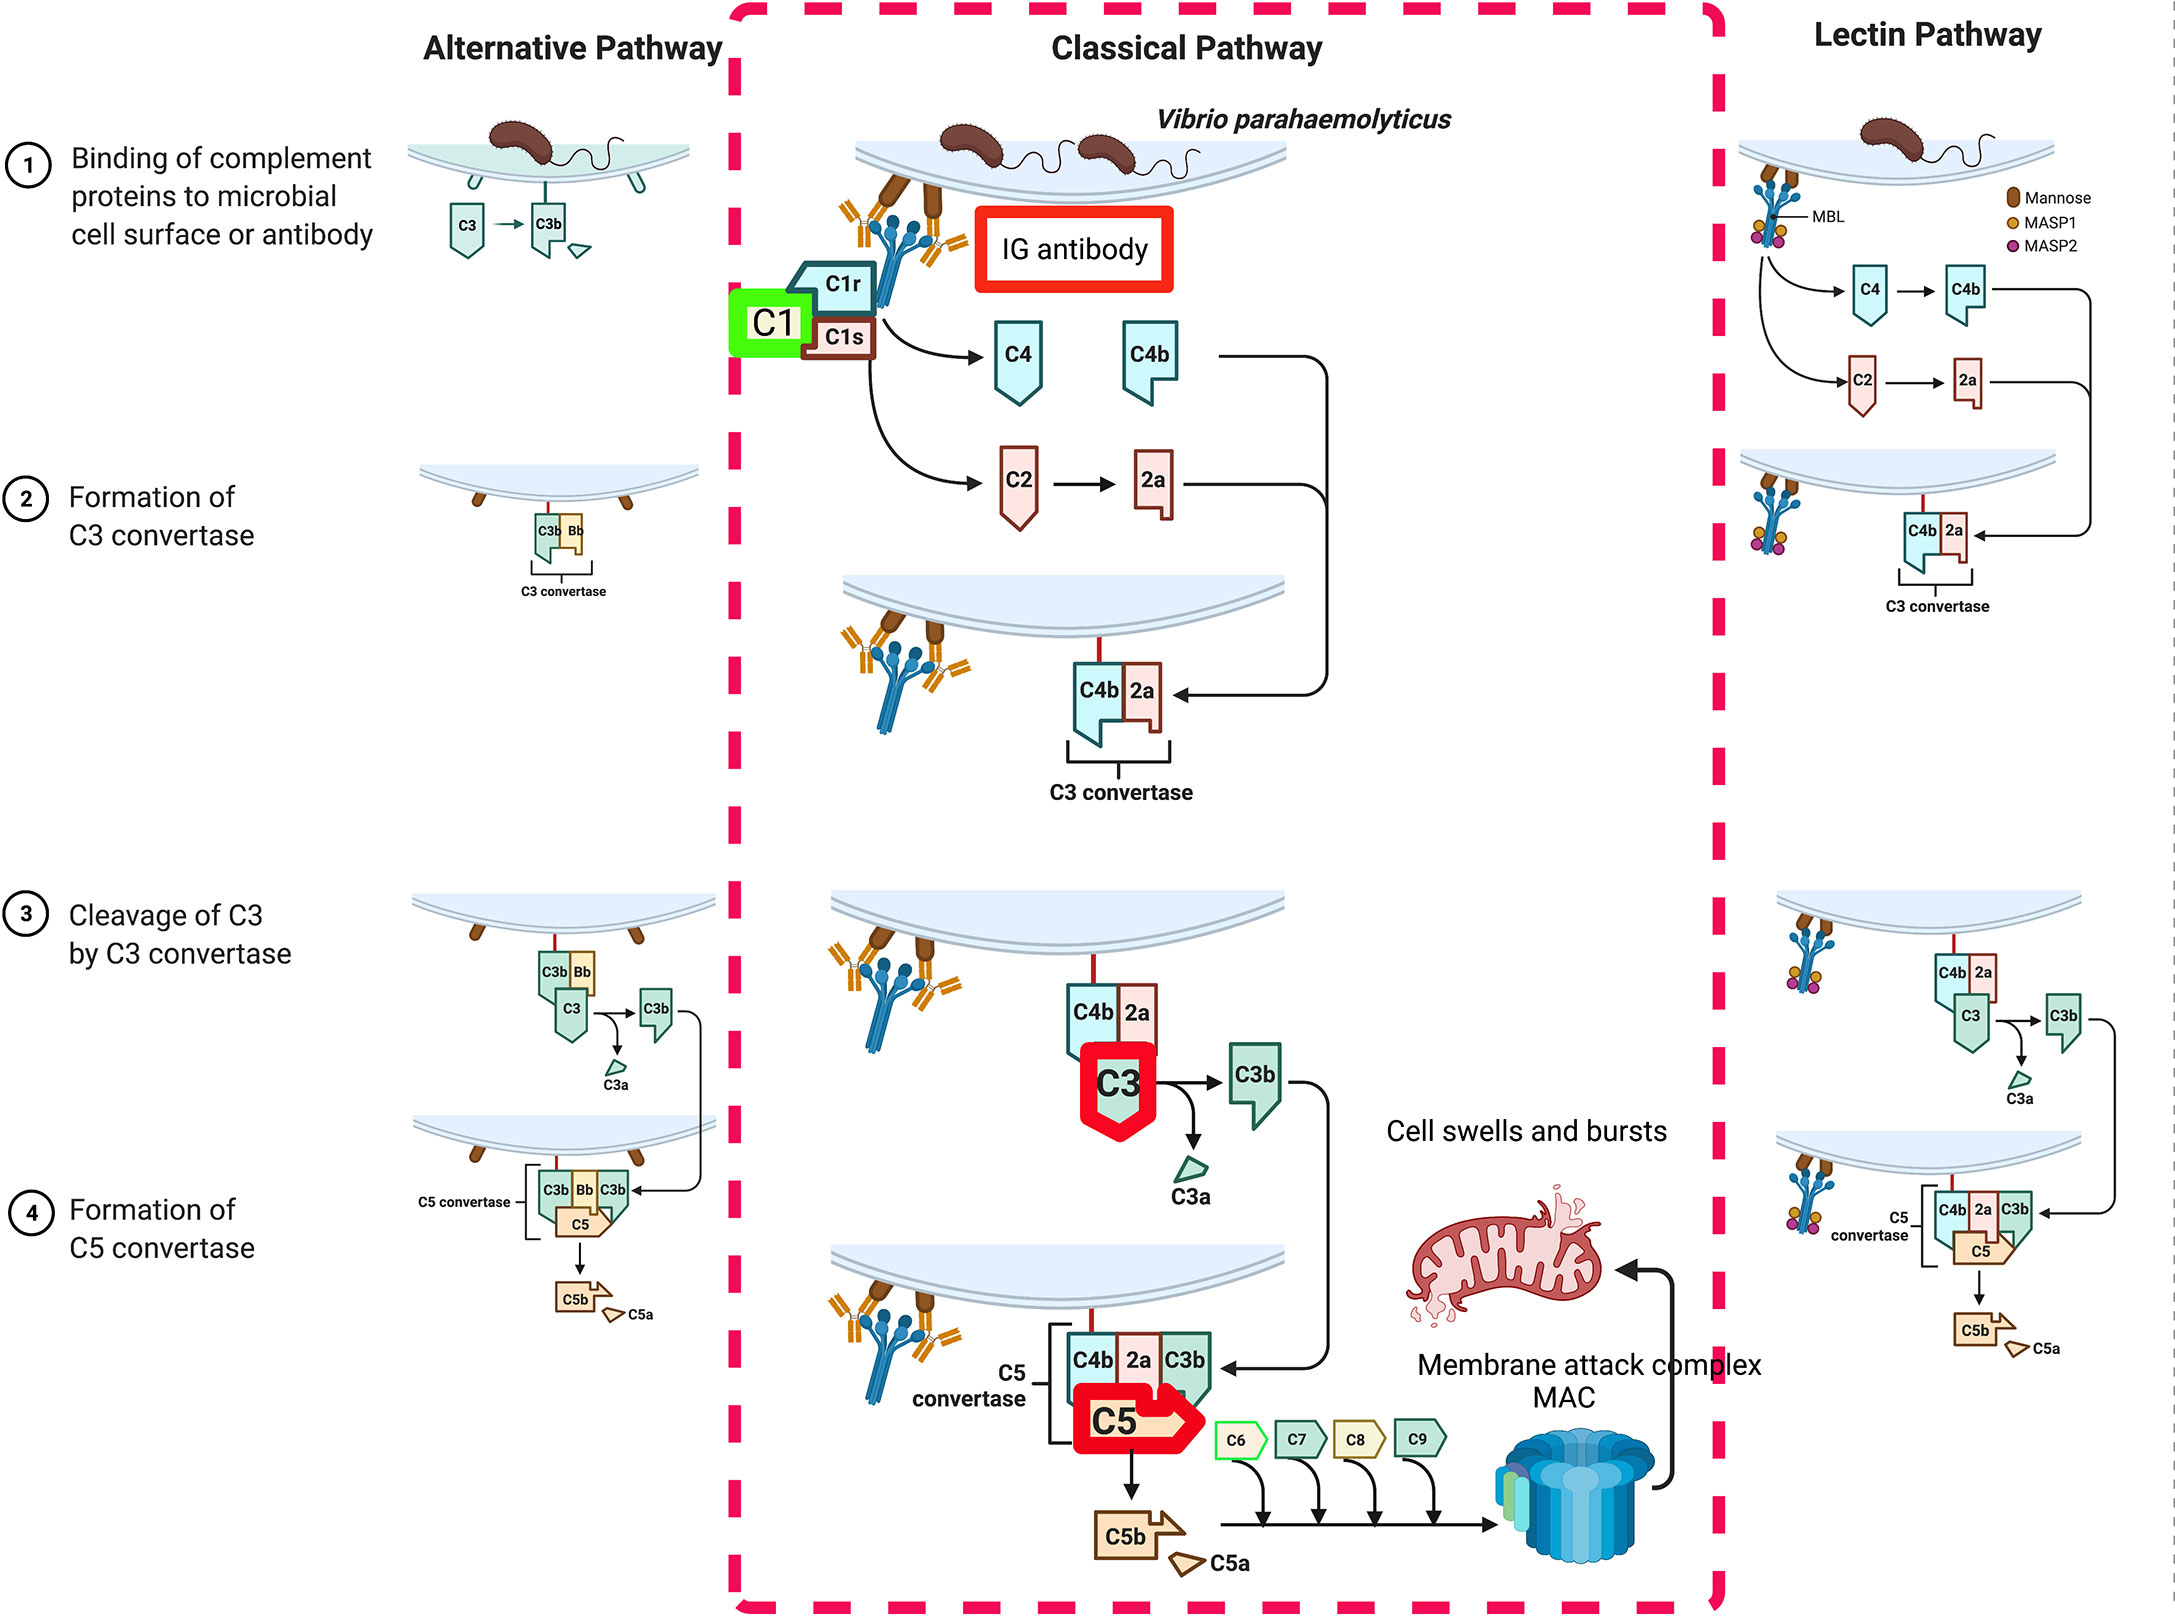
Figure 8 A theoretical model of the host response to exogenous V. parahaemolyticus infection.
Vibrio parahaemolyticus is an important cause of seafood poisoning. Moreover, it is one of the main Vibrio pathogens in aquaculture animals (Yeung and Boor, 2004; Broberg et al., 2011) and causing serious economic losses to the aquaculture industry worldwide (Wang et al., 2021). In the present in vivo study, upon analyzing V. parahaemolyticus infection in T. nigroviridis, fat vacuoles were observed in liver sections, and cell membranes displayed alterations at 1 dpi. At 3dpi, over 1/3 of the examined fish showed altered spleen, with increased plasma proteins and hematin pigments in the ellipsoids. Erythrocyte lysis was observed in the hemopoietic kidney, and the nuclei slowly disappeared, reaching a maximum by 3 dpi. However, at 5, 7, and 11 dpi, a gradual reduction of fat vacuoles was observed, and cell morphology slowly recovered to that observed in the control group (Figure 1). Tissue necrosis and congestion were also observed in other model animals, such as zebrafish and Qingdao amphioxus after V. parahaemolyticus infection (Huang et al., 2007; Paranjpye et al., 2013). In zebrafish, more than half of the cells were damage and showed erythrocyte crenation within 3 hpi. At 6 hpi, rounding and pyknosis of erythrocyte nuclei in the vasculature increased to more than 60%. Erythrocyte lysis and fat vacuoles were observed in 25% of the fish kidneys examined at 10 hpi. Intra-abdominal hemorrhage and organ disintegration were observed upon dissection following V. parahaemolyticus infection. Histological examination revealed serious damage to erythrocytes in the liver and spleen. Infection with V. parahaemolyticus has also been shown to cause hepatic steatosis. In fact, steatosis is caused by disruption in lipid metabolism, resulting in the appearance of fat vacuoles in the cytoplasmic region of infected cells. As erythrocytes transport oxygen with hemoglobin, the presence of fat vacuoles around hepatocytes may have resulted from hypoxia, which in turn affected fat metabolism, ultimately leading to the steatosis observed in T. nigroviridis.
Innate immunity is determined by various immunological factors, such as chemokines, interleukins, interferons, and complement factors (Alvarez-Pellitero, 2008). In the present study, most of the identified chemokines and chemokine receptors showed significant differential expression after V. parahaemolyticus infection, such as the CXC chemokine family, CCL family (CCL-3, CCL-5, CCL-19, and CCL-21), IFNAR2, IL10RA, TNFSF14, IL-1β, and IL1R2 (Table 2). Previous studies have shown that CCL19 and CCL21 induce a powerful pro-inflammatory differentiation program in dendritic cells (Marsland et al., 2005). In carp, CXCR3 is highly expressed in the gills and intestines, and its immune-related function has also been confirmed (Chadzinska et al., 2014). In the current study, we found that CXCR3 was highly expressed at 24 hpi by V. parahaemolyticus, which was consistent with a previous reports (Chadzinska et al., 2014). Interleukins and interferons play an important role in the immune system as they remove pathogenic bacteria (Seppola et al., 2008), and the expression of interleukin and interferon genes was significantly increased in the spleen of infected T. nigroviridis.
Based on the combined analysis of the transcriptome, proteome, and miRNA expression profiles, we found several DEGs involved in various components of the immune system, including the following: complement system, chemokines, lysosomes, phagocytes, cytokine receptors, pattern recognition receptors, B-cell receptor signaling pathway, T-cell receptor signaling pathway, Janus kinase-signal transducer and activator of transcription (JAK-STAT) signaling pathway, phosphatidylinositol-3-kinase/protein kinase signaling pathway, nuclear factor κB signaling pathway, mitogen-activated protein kinase signaling pathway, TNF signaling pathway, and phospholipid metabolism, among others. Our multi-omics analysis revealed that the C3 gene and protein levels in the complement signaling pathway were significantly up-regulated after V. parahaemolyticus infection. Furthermore, the expression of three DEMs (miR-6089-y, miR-460-y, and miR-1584-x) targeting the C3 DEG were significantly down-regulated, and the expression of the miR-203 DEM targeting the C1qA DEG was significantly up-regulated. These findings indicated that C3 and C1qA in the complement system may be important effectors of the immune responses of T. nigroviridis to exogenous V. parahaemolyticus infection. As Aeromonas hydrophila escapes serum killing by suppressing the complement pathways via the degradation of complement C3 in bony fishes (Chen et al., 2019), we hypothesized that V. parahaemolyticus may also escape killing by degrading host complement C3 to inhibit the complement pathway. As highlighted above, the different omics datasets did not overlap extensively (C3 and C1qA), and thus each different omics assesses only a fraction of a complex disease. Therefore, the analysis of a single omics subset provides an incomplete picture of the underlying biology (Menyhárt and Győrffy, 2021). Here we observed both C3 and C1qA variations at miRNA-mRNA-proteome and experimental levels, two molecules may be useful as biomarkers of V. parahaemolyticus infection.
The complement system is composed of many serum proteins that participate in the cascade reactions of proteolysis and assembly of protein complexesleading to, pathogen removal. The effector pathway of the complement system can be activated through the lectin, classical, and/or alternative pathways (Taylor et al., 1998). Once activated, the C3 in the complement system is cleaved to produce C3b, which is followed by C5 activation and C5b generation. Then, C5b initiates the lytic pathway in which C5b, C6, C7, C8, and C9 assemble, and the polymerization of C9 creates a transmembrane pore (Michailidou et al., 2015; Hammond et al., 2020). In lamprey, researchers have identified complement system components at the protein and/or DNA levels, including C3, mannose-binding lectin (MBL), C1q, three types of mannan-binding lectin serine protease (MASP-1, MASP-A, and MASP-B), B-factor, short consensus repeat (SCR)-containing control proteins, and I-factor (Matsushita et al., 2004). In the present study, we identified four complement components in T. nigroviridis, including C1qA, IG, C3, and C5, at both the gene and protein levels.
The immune system is considered to have contributed to the evolutionary success of fish in response to aquatic pathogens. Our phylogenetic analyses suggest that fish C3 genes share a common ancestral origin with those of humans and other tetrapods (Figure 6). In teleost genomes, both C3.1 and C3.2 genes have been identified, and the higher number of C3.1 genes compared to the number of C3.2 genes suggests these genes have evolved at variable rates within fishes. For instance, the C3.2 gene appeared after the third genome duplication event (Figure 6).
We obtained four to six C3 gene duplicates for seven Tetraodontiformes with published genomes. The results for Takifugu rubripes and T. nigroviridis were consistent with previous reports (Forn-Cuni et al., 2014), however, to the best of our knowledge, the gene copy numbers for the other five species were first reported. It seems that fish inhabiting environments with rich microbiota have evolved more complex complement systems and innate immune responses than terrestrial vertebrates, which might have improved their ability to recognize a wider range of pathogens. Furthermore, eight C3 copies were identified in zebrafish, and two C3.2 proteins were associated with the regulation of proinflammatory responses (Forn-Cuni et al., 2014). C1 is key as a C3 convertase of the classical pathway. Interestingly, in the synteny analysis of C1qA in various animals, we found that the upstream and downstream genes differed between the various fish orders (Figure 8). Further investigations are ongoing to examine fish C3 and C1qA (including pseudogenes or genome assembly errors) and to determine their functional diversity in teleosts.
The main finding of this study is that V. parahaemolyticus infection led to differences in the expressions of some genes and proteins involved in the complement system. Based on our multi-omics and qRT-PCR validation analysis, we identified the associated of four key genes in the classical pathway of complement system activation, i.e., C1qA, IG, C3, and C5. The classical pathway of complement system activation may be related to the pathological changes caused by inflammation. The evolutionary analysis revealed that the ancient genomic model T. nigroviridis, which inhabits aquatic environments, improved its ability to recognize pathogens by evolving a more complex complement system than terrestrial vertebrates. This study provides a basis for understanding the molecular mechanisms by which bacteria compromise the immunity of animals and promotes disease progression.
The datasets presented in this study can be found in online repositories. The names of the repository/repositories and accession number(s) can be found below: n CNGB Sequence Archive (CNSA) of China National GeneBank DataBase (CNGBdb) [accession: CNP0002406].
The animal study was reviewed and approved by The animal study was reviewed and approved by Institutional Animal Care and Use Committee (IACUC), Sun-Yat-Sen University (Approval No. SYSU-IACUC_2022_B0913).
DL initiated and managed the project. DL and YZ developed the bioinformatics analysis pipeline. LF prepared the samples and participated in data analysis. SJ and ZG performed genome assembly and annotation. SJ wrote the draft manuscript. DH, DL, QS, and XY revised the manuscript. All authors read and approved the final version for publication.
This work was supported by the National Key Research and Development (R&D) Program of China (no. 2018YFD0900301), R&D Projects in Key Areas of Guangdong Province (no. 2021B0202070002), and Guangzhou Science and Technology Project (no. 201904020043), Guangdong Provincial Special Fund for Modern Agriculture Industry Technology Innovation Teams (2019KJ143), Innovation Group Project of Southern Marine Science and Engineering Guangdong Laboratory (Zhuhai) (311021006), the Specific Research Fund of the Innovation Platform for Academicians of Hainan Province (YSPTZX202155).
The authors declare that the research was conducted in the absence of any commercial or financial relationships that could be construed as a potential conflict of interest.
All claims expressed in this article are solely those of the authors and do not necessarily represent those of their affiliated organizations, or those of the publisher, the editors and the reviewers. Any product that may be evaluated in this article, or claim that may be made by its manufacturer, is not guaranteed or endorsed by the publisher.
The Supplementary Material for this article can be found online at: https://www.frontiersin.org/articles/10.3389/fmars.2022.914028/full#supplementary-material
Supplementary Figure 1 | A pipeline overview of the integrated transcriptome, miRNA, and proteome analysis on the molecular mechanisms for T. nigroviridis in resistance to exogenous V. parahaemolyticus infection. The molecular and functional evolution of the essential genes C3 and C1qA were examined.
Supplementary Figure 2 | miRNA analysis of DEMs. (A) Statistics of differential expressed miRNAs. (B)Negative correlations of miRNA-target gene pairs.
Supplementary Figure 3 | GO enrichment of differentially expressed proteins (DEPs) from the DIA analysis.
Supplementary Figure 4 | A phylogenetic tree of C3 in various animals.
Supplementary Figure 5 | Synteny analyses of C1qA genes in various vertebrates. Black arrows mark these C1qA genes.
Supplementary Figure 6 | Sequence alignment of C1qA proteins from various vertebrates. The solid red boxes mark the C1qA structure. CLR, Collagen like region; C1q domain, Globular C1q domain; SP, signal peptide.
Ali S., Hossain M., Azad A. B., Siddique A. B., Moniruzzaman M., Ahmed M. A., et al. (2021). Diversity of Vibrio Parahaemolyticus in Marine Fishes of Bangladesh. J. Appl. Microbiol. 131 (5), 2539−2551. doi: 10.1111/jam.15093
Alvarez-Pellitero P. (2008). Fish Immunity and Parasite Infections: From Innate Immunity to Immunoprophylactic Prospects. Vet. Immunol. immunopathol. 126 (3-4), 171–198. doi: 10.1016/j.vetimm.2008.07.013
Bathige S., Whang I., Umasuthan N., Wickramaarachchi W. N., Wan Q., Lim B.-S., et al. (2013). Three Complement Component 1q Genes From Rock Bream, Oplegnathus Fasciatus: Genome Characterization and Potential Role in Immune Response Against Bacterial and Viral Infections. Fish shellfish Immunol. 35 (5), 1442–1454. doi: 10.1016/j.fsi.2013.08.013
Bian L., Li F., Ge J., Wang P., Chang Q., Zhang S., et al. (2020). Chromosome-Level Genome Assembly of the Greenfin Horse-Faced Filefish (Thamnaconus Septentrionalis) Using Oxford Nanopore PromethION Sequencing and Hi-C Technology. Mol. Ecol. Resour. 20 (4), 1069–1079. doi: 10.1111/1755-0998.13183
Broberg C. A., Calder T. J., Orth K. (2011). Vibrio Parahaemolyticus Cell Biology and Pathogenicity Determinants. Microbes Infect. 13 (12-13), 992–1001. doi: 10.1016/j.micinf.2011.06.013
Castresana J. (2000). Selection of Conserved Blocks From Multiple Alignments for Their Use in Phylogenetic Analysis. Mol. Biol. Evol. 17 (4), 540–552. doi: 10.1093/oxfordjournals.molbev.a026334
Chadzinska M., Golbach L., Pijanowski L., Scheer M., Verburg-van Kemenade B. (2014). Characterization and Expression Analysis of an Interferon-γ2 Induced Chemokine Receptor CXCR3 in Common Carp (Cyprinus Carpio L.). Dev. Comp. Immunol. 47 (1), 68–76. doi: 10.1016/j.dci.2014.07.008
Chen M., Ding M., Li Y., Zhong X., Liu S., Guo Z., et al. (2018a). The Complement Component 1 Q (C1q) in Nile Tilapia (Oreochromis Niloticus): Functional Characterization in Host Defense Against Bacterial Infection and Effect on Cytokine Response in Macrophages. Dev. Comp. Immunol. 87, 98–108. doi: 10.1016/j.dci.2018.05.023
Chen D.-D., Li J.-H., Yao Y.-Y., Zhang Y.-A. (2019). Aeromonas Hydrophila Suppresses Complement Pathways via Degradation of Complement C3 in Bony Fish by Metalloprotease. Fish shellfish Immunol. 94, 739–745. doi: 10.1016/j.fsi.2019.09.057
Chen S., Zhou Y., Chen Y., Gu J. (2018b). Fastp: An Ultra-Fast All-in-One FASTQ Preprocessor. Bioinformatics 34 (17), i884–i890. doi: 10.1093/bioinformatics/bty560
De Córdoba S. R., De Jorge E. G. (2008). Translational Mini-Review Series on Complement Factor H: Genetics and Disease Associations of Human Complement Factor H. Clin. Exp. Immunol. 151 (1), 1–13. doi: 10.1111/j.1365-2249.2007.03552.x
Dishaw L. J., Smith S. L., Bigger C. H. (2005). Characterization of a C3-Like cDNA in a Coral: Phylogenetic Implications. Immunogenetics 57 (7), 535–548. doi: 10.1007/s00251-005-0005-1
Duan J., Su Y. C. (2005). Occurrence of Vibrio Parahaemolyticus in Two Oregon Oyster-Growing Bays. J. Food Sci. 70 (1), M58–M63. doi: 10.1111/j.1365-2621.2005.tb09047.x
Enright A., John B., Gaul U., Tuschl T., Sander C., Marks D. (2003). MicroRNA Targets in Drosophila. Genome Biol. 4 (11), 1–27. doi: 10.1186/gb-2003-5-1-r1
Fischer C., Bouneau L., Ozouf-Costaz C., Crnogorac-Jurcevic T., Weissenbach J., Bernot A. (2002). Conservation of the T-Cell Receptor α/δ Linkage in the Teleost Fish Tetraodon Nigroviridis. Genomics 79 (2), 241–248. doi: 10.1006/geno.2002.6688
Forn-Cuni G., Reis E. S., Dios S., Posada D., Lambris J. D., Figueras A., et al. (2014). The Evolution and Appearance of C3 Duplications in Fish Originate an Exclusive Teleost C3 Gene Form With Anti-Inflammatory Activity. PLos One 9 (6), e99673. doi: 10.1371/journal.pone.0099673
Fujito N. T., Sugimoto S., Nonaka M. (2010). Evolution of Thioester-Containing Proteins Revealed by Cloning and Characterization of Their Genes From a Cnidarian Sea Anemone, Haliplanella Lineate. Dev. Comp. Immunol. 34 (7), 775–784. doi: 10.1016/j.dci.2010.02.011
Guo J., Gao J., Liu Z. (2022). “HISAT2 Parallelization Method Based on Spark Cluster,” in Journal of Physics: Conference Series. ( Shenzhen, China:International Conference on Modeling, Big Data Analytics and Simulation)
Hammond J. W., Bellizzi M. J., Ware C., Qiu W. Q., Saminathan P., Li H., et al(2020). Complement-Dependent Synapse Loss and Microgliosis in a Mouse Model of Multiple Sclerosis. Brain behavior Immun. 87, 739–750. doi: 10.1016/j.bbi.2020.03.004
Huang G., Liu H., Han Y., Fan L., Zhang Q., Liu J., et al. (2007). Profile of Acute Immune Response in Chinese Amphioxus Upon Staphylococcus Aureus and Vibrio Parahaemolyticus Infection. Dev. Comp. Immunol. 31 (10), 1013–1023. doi: 10.1016/j.dci.2007.01.003
Java A., Apicelli A. J., Liszewski M. K., Coler-Reilly A., Atkinson J. P., Kim A. H., et al. (2020). The Complement System in COVID-19: Friend and Foe? JCI Insight 5 (15), e140711. doi: 10.1172/jci.insight.140711
Jin H.-J., Xiang L.-X., Shao J.-Z. (2007). Identification and Characterization of Suppressor of Cytokine Signaling 1 (SOCS-1) Homologues in Teleost Fish. Immunogenetics 59 (8), 673–686. doi: 10.1007/s00251-007-0232-8
Joachims T. (1999). Svmlight: Support Vector Machine. SVM-Light Support Vector Machine Vol. 19 ( Cornell: University of Dortmund), 25. Available at: http://svmlight.joachims.org/.
Kim D., Langmead B., Salzberg S. L. (2015). HISAT: A Fast Spliced Aligner With Low Memory Requirements. Nat. Methods 12 (4), 357–360. doi: 10.1038/nmeth.3317
Krüger J., Rehmsmeier M. (2006). RNAhybrid: microRNA Target Prediction Easy, Fast and Flexible. Nucleic Acids Res. 34 (suppl_2), W451–W454. doi: 10.1093/nar/gkl243
Law S. A., Dodds A. W. (1997). The Internal Thioester and the Covalent Binding Properties of the Complement Proteins C3 and C4. Protein Sci. 6 (2), 263–274. doi: 10.1002/pro.5560060201
Lewis B. P., Burge C. B., Bartel D. P. (2005). Conserved Seed Pairing, Often Flanked by Adenosines, Indicates That Thousands of Human Genes are microRNA Targets. cell 120 (1), 15–20. doi: 10.1016/j.cell.2004.12.035
Liberzon A., Subramanian A., Pinchback R., Thorvaldsdóttir H., Tamayo P., Mesirov J. P. (2011). Molecular Signatures Database (MSigDB) 3.0. Bioinformatics 27 (12), 1739–1740. doi: 10.1093/bioinformatics/btr260
Livak K. J., Schmittgen T. D. (2001). Analysis of Relative Gene Expression Data Using Real-Time Quantitative PCR and the 2–ΔΔCT Method. methods 25 (4), 402–408. doi: 10.1093/bioinformatics/btr260
Love M. I., Huber W., Anders S. (2014). Moderated Estimation of Fold Change and Dispersion for RNA-Seq Data With Deseq2. Genome Biol. 15 (12), 1–21. doi: 10.1186/s13059-014-0550-8
Lu D.-Q., Leng T.-T., Ding X., Peng W., Yao M., Li S.-S., et al. (2014). Two IFNGR1 Homologues in Tetraodon Nigroviridis: Origin, Expression Analysis and Ligand-Binding Preference. Dev. Comp. Immunol. 44 (2), 270–279. doi: 10.1016/j.dci.2014.01.001
Lu J., Teh B. K., Wang L., Wang Y., Tan Y. S., Lai M. C., et al. (2008). The Classical and Regulatory Functions of C1q in Immunity and Autoimmunity. Cell. Mol. Immunol. 5 (1), 9–21. doi: 10.1038/cmi.2008.2
Mao K., Tan Q., Ma Y., Wang S., Zhong H., Liao Y., et al. (2021). Proteomics of Extracellular Vesicles in Plasma Reveals the Characteristics and Residual Traces of COVID-19 Patients Without Underlying Diseases After 3 Months of Recovery. Cell Death Dis. 12 (6), 1–18. doi: 10.1038/s41419-021-03816-3
Marsland B. J., Bättig P., Bauer M., Ruedl C., Lässing U., Beerli R. R., et al. (2005). CCL19 and CCL21 Induce a Potent Proinflammatory Differentiation Program in Licensed Dendritic Cells. Immunity 22 (4), 493–505. doi: 10.1016/j.immuni.2005.02.010
Matsushita M., Matsushita A., Endo Y., Nakata M., Kojima N., Mizuochi T., et al. (2004). Origin of the Classical Complement Pathway: Lamprey Orthologue of Mammalian C1q Acts as a Lectin. Proc. Natl. Acad. Sci. 101 (27), 10127–10131. doi: 10.1073/pnas.0402180101
McGeary S. E., Lin K. S., Shi C. Y., Pham T. M., Bisaria N., Kelley G. M., et al. (2019). The Biochemical Basis of microRNA Targeting Efficacy. Science, 366 (6472). doi: 10.1126/science.aav1741
Menyhárt O., Győrffy B. (2021). Multi-Omics Approaches in Cancer Research With Applications in Tumor Subtyping, Prognosis, and Diagnosis. Comput. Struct. Biotechnol. J. 19, 949–960. doi: 10.1016/j.csbj.2021.01.009
Michailidou I., Willems J. G., Kooi E. J., van Eden C., Gold S. M., Geurts J. J., et al. (2015). Complement C 1q-C 3–Associated Synaptic Changes in Multiple Sclerosis Hippocampus. Ann. Neurol. 77 (6), 1007–1026. doi: 10.1002/ana.24398
Nakao M., Mutsuro J., Obo R., Fujiki K., Nonaka M., Yano T. (2000). Molecular Cloning and Protein Analysis of Divergent Forms of the Complement Component C3 From a Bony Fish, the Common Carp (Cyprinus Carpio): Presence of Variants Lacking the Catalytic Histidine. Eur. J. Immunol. 30 (3), 858–866. doi: 10.1002/1521-4141(200003)30:3<858::AID-IMMU858>3.0.CO;2-M
Oliver J. D., Pruzzo C., Vezzulli L., Kaper J. B. (2012). Vibrio Species. Food Microbiol.: Fund. Front. 4 (16), 401–439. doi: 10.1128/9781555818463.ch16
Paranjpye R. N., Myers M. S., Yount E. C., Thompson J. L. (2013). Zebrafish as a Model for Vibrio Parahaemolyticus Virulence. Microbiology 159 (Pt_12), 2605–2615. doi: 10.1099/mic.0.067637-0
Peng W., Shi Y., Li G.-F., He L.-G., Liang Y.-S., Zhang Y., et al. (2016). Tetraodon Nigroviridis: A Model of Vibrio Parahaemolyticus Infection. Fish shellfish Immunol. 56, 388–396. doi: 10.1016/j.fsi.2016.07.017
Peng W., Sun Y., Li G.-F., He L.-G., Li R.-Z., Liang Y.-S., et al. (2018). Two Distinct Interferon-γ in the Orange-Spotted Grouper (Epinephelus Coioides): Molecular Cloning, Functional Characterization, and Regulation in Toll-Like Receptor Pathway by Induction of miR-146a. Front. Endocrinol. 9, 41. doi: 10.3389/fendo.2018.00041
Pinto M. R., Melillo D., Giacomelli S., Sfyroera G., Lambris J. D. (2007). Ancient Origin of the Complement System: Emerging Invertebrate Models. Curr. Topics Innate Immun. 598, 372–388. doi: 10.1007/978-0-387-71767-8_26
Robinson M. D., McCarthy D. J., Smyth G. K. (2010). Edger: A Bioconductor Package for Differential Expression Analysis of Digital Gene Expression Data. Bioinformatics 26 (1), 139–140. doi: 10.1093/bioinformatics/btp616
Roest Crollius H., Jaillon O., Bernot A., Dasilva C., Bouneau L., Fischer C., et al. (2000). Estimate of Human Gene Number Provided by Genome-Wide Analysis Using Tetraodon nigroviridis DNA Sequence. Nat. Genet. 25 (2), 235−238. doi: 10.1038/76118
Ronquist F., Teslenko M., van der Mark P., Ayres D. L., Darling A., Höhna S., et al. (2012). MrBayes 3.2: Efficient Bayesian Phylogenetic Inference and Model Choice Across a Large Model Space. Syst. Biol. 61 (3), 539–542. doi: 10.1093/sysbio/sys029
Seppola M., Larsen A. N., Steiro K., Robertsen B., Jensen I. (2008). ). Characterisation and Expression Analysis of the Interleukin Genes, IL-1β, IL-8 and IL-10, in Atlantic Cod (Gadus Morhua L.). Mol. Immunol. 45 (4), 887–897. doi: 10.1016/j.molimm.2007.08.003
Shannon P., Markiel A., Ozier O., Baliga N. S., Wang J. T., Ramage D., et al. (2003). Cytoscape: A Software Environment for Integrated Models of Biomolecular Interaction Networks. Genome Res. 13 (11), 2498–2504. doi: 10.1101/gr.1239303
Subramanian A., Kuehn H., Gould J., Tamayo P., Mesirov J. P. (2007). GSEA-P: A Desktop Application for Gene Set Enrichment Analysis. Bioinformatics 23 (23), 3251–3253. doi: 10.1093/bioinformatics/btm369
Subramani S., Vignesh S. (2012). MAR Index Study and MDR Character Analysis of a Few Golden Staph Isolates. Asian J. Pharm. Life Sci. ISSN 2231, 2 (2), 1–154.
Sunyer J. O., Zarkadis I. K., Lambris J. D. (1998). Complement Diversity: A Mechanism for Generating Immune Diversity? Immunol. Today 19 (11), 519–523. doi: 10.1016/s0167-5699(98)01341-3
Szklarczyk D., Franceschini A., Wyder S., Forslund K., Heller D., Huerta-Cepas J., et al. (2015). STRING V10: Protein–Protein Interaction Networks, Integrated Over the Tree of Life. Nucleic Acids Res. 43 (D1), D447–D452. doi: 10.1093/nar/gku1003
Wang H., Qi P., Guo B., He J., Wu C., Gul Y. (2015). Molecular Characterization and Expression Analysis of a Complement Component C3 in Large Yellow Croaker (Larimichthys Crocea). Fish Shellfish Immunol. 42 (2), 272–279. doi: 10.1016/j.fsi.2014.11.006
Wang L., Shao C., Xu W., Zhou Q., Wang N., Chen S. (2017). Proteome Profiling Reveals Immune Responses in Japanese Flounder (Paralichthys Olivaceus) Infected With Edwardsiella Tarda by iTRAQ Analysis. Fish shellfish Immunol. 66, 325–333. doi: 10.1016/j.fsi.2017.05.022
Wang Z.-a., Zheng J., Yang L., Zuo H., Niu S., Weng S., et al. (2021). Wnt11 Positively Regulates Immune Defense Against Vibrio Parahaemolyticus But Promotes White Spot Syndrome Virus Infection in Litopenaeus Vannamei. Aquaculture 542, 736910. doi: 10.1016/j.aquaculture.2021.736910
Wen B., Mei Z., Zeng C., Liu S. (2017). Metax: A Flexible and Comprehensive Software for Processing Metabolomics Data. BMC Bioinf. 18 (1), 1–14. doi: 10.1186/s12859-017-1579-y
Xia J. H., He X. P., Bai Z. Y., Yue G. H. (2011). Identification and Characterization of 63 MicroRNAs in the Asian Seabass Lates Calcarifer. PLos One 6 (3), e17537. doi: 10.1371/journal.pone.0017537
Yeung P. M., Boor K. J. (2004). Epidemiology, Pathogenesis, and Prevention of Foodborne Vibrio Parahaemolyticus Infections. Foodborne Pathog. Dis. 1 (2), 74–88. doi: 10.1089/153531404323143594
Yoon K., Min K., Jung Y., Kwon K., Lee J., Oh S. (2008). A Model of the Effect of Temperature on the Growth of Pathogenic and Nonpathogenic Vibrio Parahaemolyticus Isolated From Oysters in Korea. Food Microbiol. 25 (5), 635–641. doi: 10.1016/j.fm.2008.04.007
Yu Y., Huang H., Wang Y., Yu Y., Yuan S., Huang S., et al. (2008). A Novel C1q Family Member of Amphioxus was Revealed to Have a Partial Function of Vertebrate C1q Molecule. J. Immunol. 181 (10), 7024–7032. doi: 10.4049/jimmunol.181.10.7024
Zhang Q., Dong X., Chen B., Zhang Y., Zu Y., Li W. (2016). Zebrafish as a Useful Model for Zoonotic Vibrio Parahaemolyticus Pathogenicity in Fish and Human. Dev. Comp. Immunol. 55, 159–168. doi: 10.1016/j.dci.2015.10.021
Zheng J., Cao J., Mao Y., Su Y., Wang J. (2018). Identification of microRNAs With Heat Stress Responsive and Immune Properties in Marsupenaeus Japonicus Based on Next-Generation Sequencing and Bioinformatics Analysis: Essential Regulators in the Heat Stress-Host Interactions. Fish shellfish Immunol. 81, 390–398. doi: 10.1016/j.fsi.2018.05.030
Zhou Y., Xu X., Tian Z., Wei H. (2017). “Multi-Omics” Analyses of the Development and Function of Natural Killer Cells. Front. Immunol. 8, 1095. doi: 10.3389/fimmu.2017.01095
Keywords: bacterial infection, complement system, immune response, Tetraodon nigroviridis, multi-omics
Citation: Jiang S, Fu L, Gao Z, Deng H, Zhang Y, You X, Shi Q and Lu D (2022) Multi-Omics Study on the Molecular Mechanisms of Tetraodon Nigroviridis Resistance to Exogenous Vibrio Parahaemolyticus Infection. Front. Mar. Sci. 9:914028. doi: 10.3389/fmars.2022.914028
Received: 06 April 2022; Accepted: 16 June 2022;
Published: 22 July 2022.
Reviewed by:
Jin Sun, Ocean University of China, ChinaCopyright © 2022 Jiang, Fu, Gao, Deng, Zhang, You, Shi and Lu. This is an open-access article distributed under the terms of the Creative Commons Attribution License (CC BY). The use, distribution or reproduction in other forums is permitted, provided the original author(s) and the copyright owner(s) are credited and that the original publication in this journal is cited, in accordance with accepted academic practice. No use, distribution or reproduction is permitted which does not comply with these terms.
*Correspondence: Danqi Lu, bHVkYW5xaUBtYWlsLnN5c3UuZWR1LmNu
†These authors have contributed equally to this work
Disclaimer: All claims expressed in this article are solely those of the authors and do not necessarily represent those of their affiliated organizations, or those of the publisher, the editors and the reviewers. Any product that may be evaluated in this article or claim that may be made by its manufacturer is not guaranteed or endorsed by the publisher.
Research integrity at Frontiers
Learn more about the work of our research integrity team to safeguard the quality of each article we publish.