 Yue Hu
 Han Qian Zhou
 Xiao Mei Jin3*
 Yong Zhe Yan
- 1College of Science & Technology, Ningbo University, Ningbo, China
- 2Donghai Academy, Ningbo University, Ningbo, China
- 3School of International Trade and Economics, Ningbo University of Finance & Economics, Ningbo, China
- 4Marine Strategy and Planning Department of Ningbo Institute of Oceanography, Ningbo, China
As an important part of the national economy, the marine economy will be subject to various internal and external disturbances in the process of development. Different regions will show different resilience. Based on four dimensions of “resistance–recovery–reorientation–renewal,” this paper measures the marine economic resilience of the four provinces covered within the China’s Southern Marine Economy Circle from 2008 to 2018 by establishing an evaluation index system. The results show that 1) the overall resilience of economy in the Southern Marine Economy Circle showed a fluctuating upward trend from 2008 to 2018. Although there was a decline in 2011–2012 due to natural disasters, the value quickly resumed its increasing trend. 2) At present, there are obvious relative differences in the resilience of marine economy in each region of China’s Southern Marine Economy Circle, and the polarization phenomenon is serious. Among them, Guangdong belongs to the high-value region and Fujian is in the middle, while Hainan and Guangxi are temporarily in the low-value area.
Introduction
With the development of the global economy, the pressure on the development space caused by the scarcity of land resources is increasingly obvious. The vast marine has become a new field where the world’s maritime powers can enhance their comprehensive strength. The output of the global marine economy has rapidly increased, mainly because the world’s major marine countries, especially the European and American marine economic powers, have turned their attention to the blue ocean field for economic development. These countries analyze and plan the development of the marine economy from the perspective of national strategy. It was found that in 2007, the relevant departments of Ireland’s marine economy contributed €1.44 billion in gross value added (GVA) to the Irish economy (Morrissey et al., 2011). Moreover, Stebbings et al. (2020) found through an empirical research that the contribution of the marine economy to the UK economy is twice as much as previously estimated.
The 21st century is the era of the marine economy (Dong, 2020). As a maritime power, China clearly put forward the development goal of building a powerful maritime economy in the report of the 19th National Congress of the Communist Party, confirming the important position and role of the maritime economy in China’s future economic development. Since 2011, the added value of China’s major marine industries has surpassed that of the United States, becoming the world’s largest marine economy (Zhang et al., 2016). China divided the Bohai Rim, Yangtze River Delta, and Pearl River Delta into three marine economy circles: North, East, and South. The research area chosen for this paper is the Southern Marine Economy Circle, which is the forefront of China’s foreign trade exchanges, including the four provinces of Guangxi, Guangdong, Hainan, and Fujian. The marine Gross Domestic Product (GDP) or gross ocean product (GOP) of China in 2010 was nearly CNY4 trillion, which is around 9.7% of the total GDP. In 2014, the GOP reached CNY6 trillion, accounting for 9.4% of the China’s GDP in that year (Ebarvia, 2016). Moreover, from 2008 to 2018, the GOP of the Southern Marine Economy Circle climbed from 582.5 billion yuan to 329.34 billion yuan, and its contribution to the total value of China’s GOP increased from 19.6% to 39.5%. This indicates that the southern circle plays a pivotal role in China’s marine economy.
At the same time, the growing development of the marine economy is also facing a variety of unpredictable contingencies and risk shocks. The intersection of an economic crisis and an environmental crisis has enhanced the perceived sense of vulnerability and, hence, stimulated the search for new paths to “resilience” (Hudson, 2010). The GOP of numerous countries, including China, decreased because of the outbreak of the pandemic in 2020. However, the development of the marine economy in the China’s Southern Marine Economy Circle showed a stable performance, with the GOP reaching 309.25 billion yuan, accounting for 38.65% of the country. This figure is basically the same as the proportion of previous years, indicating a strong economic resilience. On this basis, this study measures the resilience of China’s Southern Marine Economy Circle and identifies the factors that affect it by creating an index system.
The innovation of this paper is to combine the concept of “resilience” with the marine economy. On the theoretical basis of defining the resilience of the marine economy, we construct an index system from four perspectives (resistance, recovery, reorientation, and renewal) and then introduce a comprehensive assessment model to carry out a quantitative analysis of the changes in the resilience of the Southern Marine Economy Circle in China. This study provides a basis for coastal regions and countries to make decisions, evaluate changes in marine economic resilience, identify factors that affect it, and develop effective strategies and policies.
Literature Review
Conception of Resilience
In the last decade since the global economic crisis, the concept of economic resilience has gained prominence in both scholarly and policy circles; it is being used in economy, psychology, agriculture, environmental, physical, political sciences, and so on. Up to date, resilience is included in most policy discussions on global sustainability, disaster management, and international development (Burnard and Bhamra, 2011). According to the characteristics of resilience diversification, it is divided into “engineering resilience,” “ecological resilience,” and “evolutionary resilience” (Evenhuis, 2017). Holling (1973) first proposed the notion of “engineering resilience,” emphasizing its equilibrium stability. At the same time, Holling (1973) introduced resilience into the ecological literature, considering it as a protection against the possible transformation of a system into an undesirable state. Holling (1996) then compared the two, which concerns whether the system will enter into another stable mode of development after disturbance and shock. Ecological resilience emphasizes the capacity of a site to adjust to external shocks and changes in controlling interactions, while engineering resilience emphasizes its ability to return to a state that existed before perturbation (Pickett et al., 2014). “Evolution resilience” refers to the ability of a region to “rebound forward,” that is, to respond to shocks by adjusting and changing its functions. In this case, resilience does not necessarily mean returning to the original status, but it is possible to reach a new equilibrium (Pendall et al., 2010; Pike et al., 2010).
In 2002, Reggiani et al. (2002) introduced the concept of “resilience” into the research category of spatial economics, which was later established as an analytical concept in the field of economics. Dhawan and Jeske (2006) considered the concept of “resilience” as an attribute of the economy. Later, Foster (2007), in his study of regional economies, defined regional economic resilience as the ability of a region to cope and recover from drastic changes in the external environment. On this basis, Martin (2012) developed the concept of economic resilience and emphasizes its usefulness in exploring the responses of regional economies to recessionary shocks. Martin also identified four processes of economic resilience: resistance, recovery, reorientation, and renewal. In 2015, he further proposed that resilience consists of five main dimensions necessary to fully understand its complexity in any given spatial and temporal context: shock (the origin of disturbance), system vulnerability (sensitivity to shock), resistance (the initial economic impact of a shock), robustness (adaptability to shocks), and recoverability (ability to return to initial conditions). Furthermore, Hallegatte (2014) believed that economic resilience can be classified into two components: instantaneous resilience and dynamic resilience. The former refers to the ability to limit the scale of current production losses in the case of a given asset loss, and the latter refers to the ability of reconstruction and restoration. (Woods, 2015) grouped the different uses of the “resilient” label around four basic concepts: (1) resilience as rebound from trauma and return to equilibrium; (2) resilience as a synonym for robustness; (3) resilience as the opposite of brittleness, that is, as graceful extensibility when surprise challenges boundaries; and (4) resilience as network architectures that can sustain the ability to adapt to future surprises as conditions evolve. Compared with European and American countries, the research on resilience in China started relatively late. From the perspective of evolution, He (2018) defined regional economic resilience as the ability of a region to continually reconstruct its economic structure or the ability to continuously form new economic growth paths.
All in all, there is currently no firm definition of resilience as the concept can refer to different characteristics and lack of a clear way to study it (Boschma, 2015; Martin and Sunley, 2015). The identification of its determinants remains an unexplored issue in the literature (Di Caro and Fratesi, 2018). Undoubtedly, economic resilience is of interest in the current era of globalization, regional democratization, instability, and uncertainty, where small or extreme shocks can induce new unpredictable dynamics in economic systems because of the high level of network connectivity among all their subsystems. The equilibrium or stability notions, as well as the uncertainty and unpredictability of current economic phenomena in an economy, not only reinforce the importance of the concept of economic resilience but also call for a greater emphasis on the investigation of economic resilience in economics, especially in the marine economy.
Measurement of Economic Resilience
At the beginning of the present century, many researchers began to understand the importance of measuring the contribution of the marine economy to the national economy (Smith, 2000; Kildow and McIlgorm, 2010). Due to the complexity of the economic system, there is currently no unified method for measuring the resilience of the regional economy. In this paper, we present a brief summary of the existing literature in Table 1.
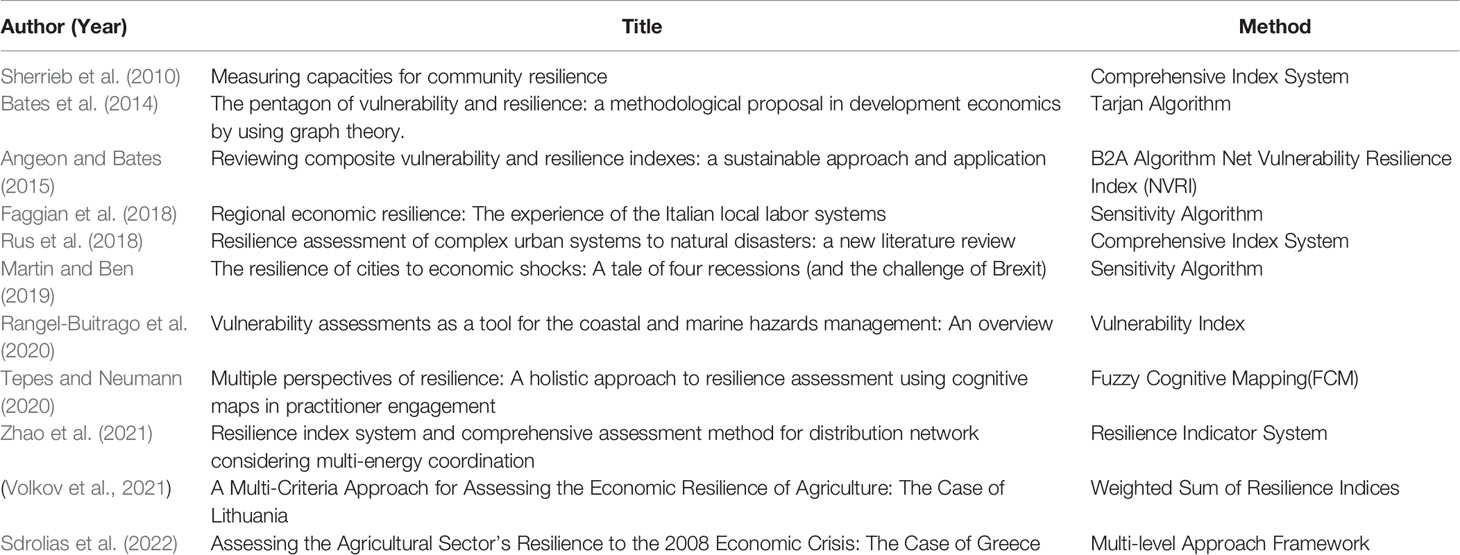
Table 1 The summary of the existing method for assessing resilience.
Two of the various approaches are the most common. The first is the sensitivity algorithm proposed by Martin and Gardiner (2019), which constructs a regional economic resilience index and selects one or two representative core variables, such as the GDP, GDP growth rate, proportion of unemployed population, and industrial added value. Similarly, Faggian et al. (2018) assessed the regional economic resilience by calculating the sensitivity coefficient, using the Italian region as an example. Rangel-Buitrago et al. (2020) outlined the Coastal Vulnerability Index (CVI) as a tool for coastal and marine hazard management. The advantage of this approach is that it can detect the trend of the resilience in the region over the study period as well as the resilience at a specific point in time. The difficulty of this method lies in the need to accurately identify the core variables, determine their weight, and update them over time. Another drawback is that the method cannot be used to identify factors that decrease (or increase) resilience.
Another common method for assessing resilience is to construct an indicator system. For example, Zhao et al. (2021) established a multi-dimensional resilience assessment index system based on the analytic network hierarchy process (ANP) to consider multi-energy coordination. Volkov et al. (2021) chose to assess the resilience of the agricultural economy by developing a system of indices composed of variables reflecting the core functions of the agricultural sector, with Lithuania as a case study. To ensure the accuracy of their conclusions, Sherrieb et al. (2010) systematically tests the intercorrelations between theoretical elements and between internal indicators to identify a parsimonious set of indicators. In 2018, Rus et al. tried to extend the discussion to some indicators that are not commonly considered, to quantitatively analyze the assessment of resilience exhibited by complex urban systems in response to natural hazards. The method compensates for the shortcomings of the sensitivity algorithm by revealing factors that affect economic elasticity and the intensity of their effects. It can also be used to identify changes in these factors and factors that require modification. The disadvantage of this method is that the indicator selection and weighting processes are subjective. Hence, the considered indicators are either incomplete or irrelevant (Rose and Krausmann, 2013), which required extensive literature reading and actual research for confirmation.
In addition to the two common approaches mentioned above, some scholars have new ideas to explore for resilience assessment. For example, Tepes and Neumann (2020) used the FCM tool to elicit people’s subjective assessment of regional economic resilience. Bates et al. (2014) used the Tarjan algorithm, while Angeon and Bates (2015) used a Net Vulnerability Resilience Index (NVRI) to assess resilience. Sdrolias et al. (2022) measures the resilience of the agricultural sector in response to the 2008 economic crisis by using a multilevel methodological framework with three dimensions: time (recovery and resilience), space (regional resilience), and sector (industrial resilience).
Methods
Marine Economy Resilience Index Construction
There is a growing recognition that the development of marine resources requires a coherent set of indicators (Strategy, 2007). As the resilience of the marine economy is influenced by both internal and external factors, its assessment result is largely dependent on the indicator chosen for the analysis. A single variable measuring resilience is not appropriate (Irwin et al., 2016). Brakman et al. (2014) examined the resilience of the EU regions to the 2008 economic crisis (period under consideration: 2008–2012) and found that the degree and nature of regional urbanization and specialization are important drivers of the resilience of EU regions. Martin et al. (2016) put forward a comprehensive analysis framework for the influencing factors of regional economic resilience from the aspects of the industrial structure, labor force, finance, and system. After that, some scholars conducted empirical research from the aspects of regional vulnerability, adaptability, resource abundance, the specialization level of industries such as manufacturing, and policy systems (Di Caro, 2015; Lagravinese, 2015). Furthermore, the impact of location conditions and high-growth companies on economic resilience had also begun to attract the attention of scholars (Brakman et al., 2015; Mason et al., 2015). Drawing on the four capabilities included in economic resilience proposed by Martin (2012), namely, resistance, recovery, reorientation, and renewal, this paper constructs an index system of marine economic resilience (Table 2), with 15 indicators, including 14 positive and 1 negative.
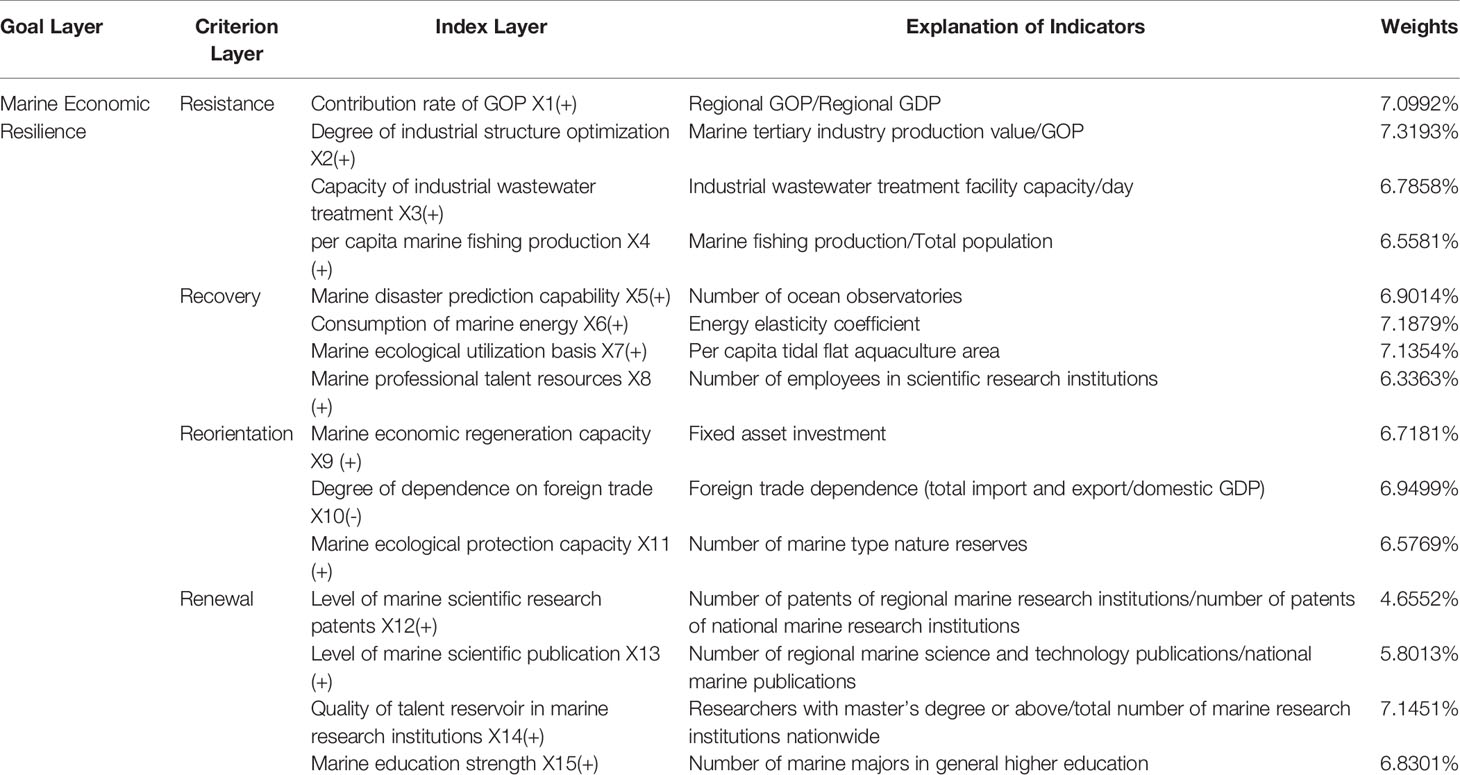
Table 2 Marine economic resilience indicator system.
Resistance capacity refers to the ability of the marine economic system to cope in the face of external shocks or changes in internal factors. The strength and foundation of economic or macroeconomic conditions greatly influence a country’s confrontational response to unexpected adverse factors (Chacon-Hurtado et al., 2020). A pre-crisis economic performance can be representative of pre-crisis economic fundamentals or conditions, which may affect the ability of regional economies to resist shocks (Giannakis and Bruggeman, 2017). Schwarz et al. (2011) examined the vulnerability and resilience of three coastal communities in the Solomon Islands, between January and May 2009, and found that social processes were critical in influencing the perception that people had about their community’s ability to build resilience and cope with change. The ocean economy contributes to the GDP of the EAS countries (East Asian Seas region) in varying degrees: 3% in RO Korea, 4.5% in the Philippines, 9% in China, and 13% in Indonesia (Ebarvia, 2016). The contribution rate of the GOP (X1) and the optimization degree of the marine industrial structure (X2) can reflect the current situation of the marine economic development level of a specific region in a certain period of time, moreover, predicting the prospect of its economic situation. The amount of GOP can not only reflect the activity of marine economy in a certain coastal area but also judge the efficiency of the marine economy in that area. Apart from this, industrial diversity contributes to better development of the marine economy. (Malizia and Ke, 1993) proposed that the industrial diversity is associated with innovation because industrial diversity can facilitate the spillover effects of knowledge, thereby promoting high-quality economic development. In China, the marine industry is divided into three industries on the basis of their attributes. The primary marine industry is the product of a combination of natural resources (i.e., marine fisheries and marine aquaculture), the ecological environment, and human labor, which is limited by natural conditions. The secondary marine industry includes the marine oil, gas, sea salt, and marine medicine industries. The tertiary marine industry generally provides social services for ocean productivity and circulation. Zheng et al. (2020) concluded that increasing the proportion of the tertiary industry in the marine economy will be conducive to the development of the marine economy. At present, the quality of marine economic development in China’s Southern Marine Economy Circle mainly depends on the proportion of its secondary and tertiary industries. Inherent natural resource advantages are equally as important as the level of acquired marine economic development in influencing the ability of the region’s marine economic system to maintain its structure and function while facing uncertainty shocks. The capacity of industrial wastewater treatment facilities (X3) and per capita marine fishing production (X4) demonstrate the advantages of natural resources brought about by the unique geographical location and the ability to protect and utilize the resources. The higher the daily tonnage of industrial wastewater treatment facilities, the stronger the awareness and ability to protect resources in the southern economic circle. The per capita marine fishing production not only reflects the richness of marine resources in the southern coastal area but also shows the quality of the living standard of the residents in the area from the side. Therefore, this paper selects indicators X1~X4 to reflect the ability of the Southern Marine Economy Circle to resist shocks.
Recovery capacity is the ability and potential of the marine economic system to quickly take positive steps, for recovering to the original stable state of normal operation, but on the premise of maintaining the internal overall structure unchanged after being disturbed and out of the stable state by factors. Marine infrastructure (such as seaports, docks, offshore platforms, and offshore wind power facilities) and ecological construction are important support for the rapid recovery of a marine economic system. The higher the level of regional marine infrastructure construction, the better the stable development of a marine economic system. An adequate number of marine observatories can effectively predict the impact and probability of natural disasters (X5), which is conducive to expanding the development scale and space of marine transportation, coastal tourism, and other industries. Second, the superior ecological environment is a critical element for the rapid recovery of the marine economic system. Once weakened, it will bring a great blow to economic development. The first key factor in economic development is the level of resources, i.e., the economic wealth available to a country or region for the welfare of its citizens (Horn, 1993). Marine aquaculture is seen as an important part of the Blue Economy, but the current discourse overlooks evidence that straightforward trickle-down effects—from aggregate economic growth at the national level to holistic benefits at the community level—rarely exist for marine aquaculture. Using the case of marine aquaculture in the United States, we argue that a shift in focus to community wellbeing is necessary to realize the potential benefits of marine aquaculture expansion (Campbell et al., 2021). By calculating the energy consumption resilience index and the per capita tidal flat aquaculture area, the consumption of marine energy in the southern region (X6) and its marine ecological utilization basis (X7) can be objectively shown. More importantly, marine economic growth cannot be achieved without the cultivation of human resources, especially marine professional talent resources (X8), which plays a critical role in making full use of resources to promote stable growth in scale. If an economy is characterized by unemployment and the lack of professional talent, the economy is very vulnerable to adverse shocks (Briguglio et al., 2009). The higher the quantity and quality of human resources, the stronger the regional economic system and its ability to recover. Thus, this paper selects indicators X5~X8 to reflect the ability of the Southern Marine Economy Circle to restore the stable state.
Reorientation capacity is the ability to adapt to new environments by integrating resources and reorganizing and optimizing internal and external factors in response to internal and external shock. Fixed asset investment is a crucial driving force for the marine economic system to function, which demonstrates the level of investment and the regenerative capacity of the marine economy to a certain extent (X9). The higher the amount of fixed asset investment, the stronger the regional economy and financial foundation for economic development. Foreign trade protectionism has gradually deepened in recent years, which will inevitably have an impact on China’s imports and exports and bring about trade shocks. The degree of the dependence of a particular region on foreign trade (X10), that is, foreign trade dependence, is negatively correlated with economic resilience. The higher the foreign trade dependence, the weaker the ability of region to develop itself, which goes against the stable and independent development of the marine economic system. Finally, a highly sustainable ecological environment can keep the marine economic system balanced and stable under different degrees of external shocks. Some scholars attach great importance to the study of the impact of the marine ecological environment on the resilience of the marine economy. The resilience and flexibility of the marine economic system can be maintained by taking measures such as establishing nature reserves and protecting marine ecosystems and marine biodiversity (Micheli et al., 2012; Levin and Lubchenco, 2008; Cheung William et al., 2017). The Southern Marine Economy Circle is rich in resources, and each coastal city should pay more attention to the marine ecological protection capacity (X11), as the marine economic system will lose its solid backing once the marine environment is irreversibly damaged. The denser the marine-type nature reserves in the region, the more secure the marine ecological environment they involve. Hence, this paper selects indicators X9~X11 to reflect the reorientation capacity of the Southern Marine Economy Circle.
Renewal capacity is the ability to explore and realize new and stable development models and paths for the marine economy through constant learning and innovation. Taking the South East and North East of England as examples, Simmie and Martin (2010) found that the former, with its focus on product and service innovation, showed a better ability to cope in the face of the same financial crisis. Bristow and Healy (2018) also discovered that the regions identified as innovation leaders at the time of the crisis were significantly more likely to have either resisted the crisis or recovered quickly from it. Technology is considered a primary productive force, and technological innovation is a key driving force for the regional marine economy. Innovation can mitigate labor shortages and ecological damage and increase marginal productivity and the efficiency of the value chain and industrial upgrading. Navarro-Espigares et al. (2012) empirically found that each unit increase in innovation investment can increase the economic resilience value of the region by 0.12. The number and patents (X12) and publications (X13) in regional marine research institutions reflect the progress of research and technological innovation; more patents and publications indicate active regional technological innovation and a strong capacity to handle risks and challenges. Generally speaking, talents with a master’s degree or above are more innovative to have a higher output rate and can bring better quality improvement solutions. The proportion of talents with a master’s degree or above (X14) can indicate the quality of personnel in research institutions to some extent. General higher education schools provide an influential platform for cultivating professional marine research talents. The number of its marine majors (X15) can demonstrate the region’s emphasis on marine economy. The more majors there are, the more extensive the fields of marine talents cultivated, which greatly improves the regional marine science and technology innovation ability. Therefore, this paper selects X12~X15 to reflect the renewal ability of the Southern Marine Economy Circle.
Data Sources
Since the 1980s, China’s marine economy has expanded, and the coastal regions’ marine resources have been developed vigorously (Jiang et al., 2014). Following the impact of the financial crisis in 2008, China has accelerated the pace of promoting the development of the marine economy. In 2013, China formally proposed the strategic goal of becoming a maritime power. Since the great majority of the indicators involved in this paper whose official data are still published until 2018, this paper chooses the 11 years from 2008 to 2018 as the time series of the study to conduct a more comprehensive study. The geographical unit of the study includes four provinces and regions in the Southern Marine Economy Circle: Guangdong, Guangxi, Hainan, and Fujian. The research data are obtained from the 2009–2019 China Marine Statistical Yearbook, China Marine Statistical Bulletin, China Statistical Yearbook, National Bureau of Statistics database, and so on. Owing to the inconsistency of the amount units, some officially obtained data were processed at the average exchange rate of the year for the raw data.
Research Methods
Weight Measurement—Entropy Weight Method
This study adopts the entropy method, an objective value assignment method, to determine the dispersion of indicators by calculating their information entropy. The entropy weight method (EWM) is a commonly used weighting method that measures value dispersion in decision-making. Shannon (1948) introduced the concept of entropy into the information theory for the first time and used it to measure the uncertainty of information. Since then, the concept of entropy has been widely used in the information theory. According to the concept of information entropy, information entropy can be used to determine the degree of variation in the amount of information: generally speaking, the more orderly an information system, the lower its information entropy value; if an information system is more chaotic, the higher the information entropy value. The entropy weight method is based on this characteristic of information entropy and uses the degree of change of the evaluation index to determine the weight of the index in the entire evaluation system. If the degree of change of an evaluation index is greater, the index has a greater amount of information, that is to say, the weight of the index in the evaluation system is greater and vice versa (Wang and Liu, 2019).
Since the concept of entropy is well suited to measure the relative intensities of contrast criteria in order to represent the average intrinsic information transmitted for decision-making (Zeleny, 1975), it is an appropriate and convenient choice for our purpose. The EWM has contributed to the resolution of a range of problems in areas. To be specific, Lahav and Gull (1989) applied the maximum entropy technique to distances to clusters of galaxies. Tran and Wagner (2000) initiated the concept of fuzzy entropy through a weight exponent on each fuzzy membership and applied it to Butterfly and Iris data sets. Zhu et al. (2020) assessed the effectiveness of EWM in decision-making and referred to the water resource selection problem. Fagbote et al. (2014) analyzed water quality indicators through the information entropy method. Additionally, the EWM was adopted to assign weights to each resilience dimension to define the marine economy–associated resilience value (Wu and Bo, 2022).
Such measurement is helpful to avoid the bias caused by subjective factors, making the research results more objective and convincing. However, the traditional entropy method generally makes a comprehensive evaluation only for cross-sectional data, that is, n regions with m indicators in a certain year. In order to better compare the marine economic resilience of each region in each year, this paper adds time variables, which is more in line with the three-dimensional characteristics of the research data so that the obtained results have high reliability and accuracy. The specific method is as follows.
Step 1: Construct an index data matrix
In this paper, we assume that there are r years, n regions, and m indicators; then, xqij refers to the j-th indicator of the i-th province in year q.
Step 2: Dimensionless processing
Different indicators have different levels and units, so the relevant data should be standardized first.
If the evaluation index is positive,
If the evaluation index is negative,
where xqij is the original data, x’qij is the standardized value of the j-th indicator of the i-th region in year q after dimensionless processing, max xj is the maximum value of the indicator, and min xj is the minimum value of the indicator. Since the zero value appears after the standardization of the extreme value, which makes it difficult to calculate, we unified the data with a non-negative translation. In this paper, the translation size is selected as 0.0001, which is represented by H here. The calculation formula is as follows:
Step 3: Weight calculation
• Calculate the weight of the j-th indicator of the i-th region in the q-th year pqij
• Calculate the entropy value of the j-th indicator ej
• Calculate the coefficient of variation gj for the j-th indicator
• Calculate the weight Wj of the j-th indicator
where k>0, k=ln(rn)
Resilience Value Measurement—Comprehensive Evaluation Method
• Calculate the comprehensive evaluation value of marine economic resilience for each province each year
Results
Overall Analysis
Entropy weighting is used in the index system, and the weights are summed to the mean, maximum, minimum, and median values for the four provinces (Guangdong, Guangxi, Hainan, and Fujian) in the Southern Marine Economy Circle between 2008 and 2018; Table 3 presents the results.
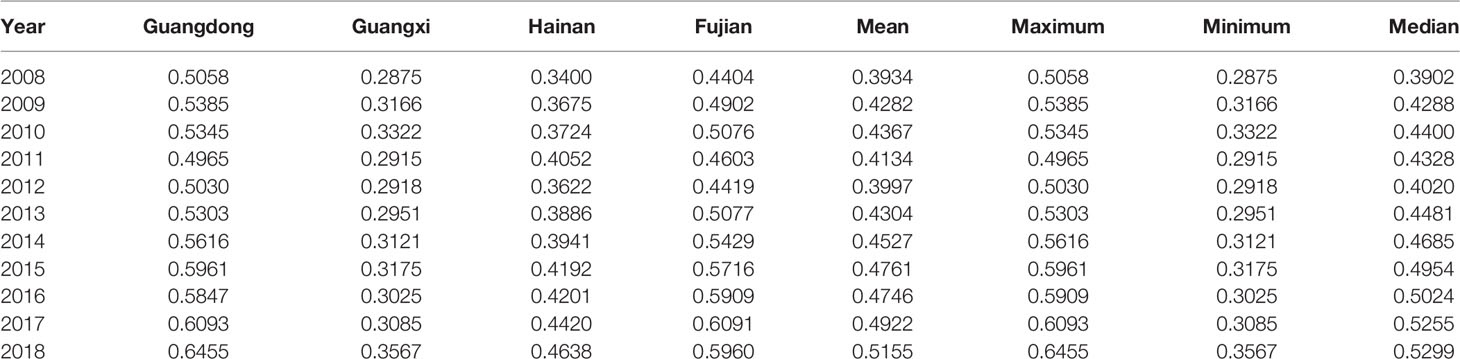
Table 3 Assessed values, mean, extreme, and median of marine economic resilience for provinces covered by the Southern Marine Economy Circle (2008–2018).
From Table 3, it can be found that the marine economic resilience of the Southern Marine Economy Circle showed a fluctuating upward trend during the 11 years from 2008 to 2018. In the years 2011 and 2012, the marine economic resilience of each province declined to different degrees, with the average value plummeting from 0.4367 in 2010 to 0.3997 in 2012, while the overall marine economic resilience of the four provinces showed a rapid and steady recovery after 2013. The reason for this transformation is that China suffered serious marine disasters in 2011–2012, especially the direct loss of red tide disaster in 2012 was as high as 2.015 billion yuan, which is the most serious in the past 20 years. Unfortunately, the Southern Marine Economy Circle happened to be a high incidence area of this marine disasters, where the marine resources and environmental systems had been severely damaged, slowing down the overall process of high-quality marine development. From 2010 to 2018, the mean value of marine economic resilience is constantly smaller than the median and the gap is expanding, indicating that there are more small numbers within this database, that is, the phenomenon that the resilience value generally exists in the low-value area is widespread and the development is unbalanced within the region.
Starting from the four dimensions of resilience, we conclude that the strong resilience of the marine economy of the Southern Marine Economy Circle is mainly a result of its excellent resistance capacity. As seen in Figure 1, the resistance capacity of the Southern Marine Economy Circle has not increased significantly but always remained in the high zone, until it successfully broke through 0.7 in 2018, which indicates that the overall marine economy of the Southern Marine Economy Circle is strong and can maintain the stability of the marine economic system as a priority in the face of external uncertainty shocks. On the recovery side, the Southern Marine Economy Circle was affected by tsunamis, typhoons, and other natural disasters in 2011–2012. As a result, its marine economy experienced a significant decline. Between the year 2014 and 2017, marine sustainability was negatively impacted to some extent and the growth rate of resilience slowed down as marine resources continued to be exploited. After the government continued to promote policies to protect the marine environment, the recovery capacity rebounded to 0.514 in 2018. Compared to the first two, the reorientation capacity and innovation capacity of the Southern Marine Economy Circle lagged relatively behind, mainly because the government did not pay enough attention to the marine economy in the previous period. To compensate for this deficiency, the Southern Marine Economy Circle has expedited the development of marine technology and enlisted marine professionals.
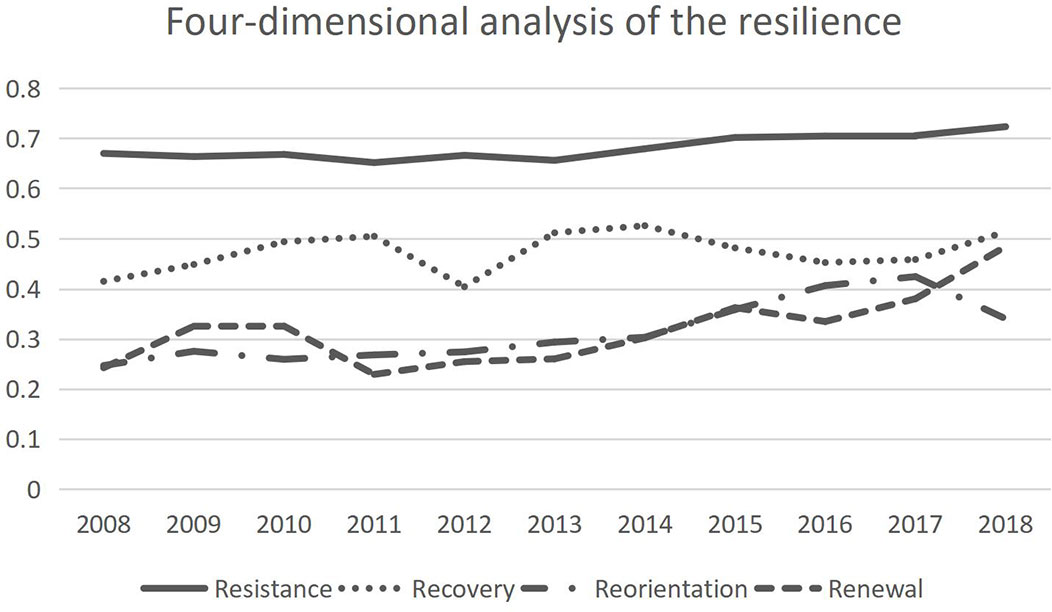
Figure 1 Four-dimensional analysis of the resilience of the marine economy in China’s Southern Marine Economy Circle.
Comparative Analysis of Provinces
Different regions in the Southern Marine Economy Circle have varying levels of high-quality development of the marine economy, presenting a layout with Guangdong as the center and spreading outward spatially. The marine economy resilience of Guangdong, a Tier 1 member, increased from 0.5058 in 2008 to 0.6455 in 2018, with an average annual growth of 2.56%. Guangxi’s marine economy resilience increased from 0.2875 in 2008 to 0.3567 in 2018, with an average annual growth of 2.44%. Hainan exhibited a similar change, with an average annual growth of 3.31%; its resilience increased from 0.3400 in 2008 to 0.4420 in 2018. For Fujian, resilience increased from 0.4404 in 2008 to 0.6091 in 2018, with an average annual growth of 3.29% (Figure 2). Analyzed from a horizontal perspective, the phenomenon of the polarization of marine economic resilience among provinces covered by the Southern Marine Economy Circle is obvious. This is evident in the case of renewal capacity; Guangdong far exceeds the other three regions, with the proportion of marine research theses in Guangdong accounting for 21% of all research theses in the region in 2018, compared to no more than 10% in Fujian, Hainan, and Guangxi. In the 2008–2018 interval, Guangdong ranked first in marine economic resilience for 10 consecutive years, followed by Fujian, while Hainan and Guangxi were perennially ranked third and fourth, especially Guangxi with a more obvious gap relative to the other three provinces. For example, in 2017, the marine economy resilience of Guangdong, Hainan, and Fujian was higher than 0.4; the resilience of Guangdong and Fujian was 0.6, whereas the resilience of Hainan was only 0.355. In 2008, the difference between the maximum and minimum marine economy resilience in the Southern Marine Economy Circle was 0.2183, and in 2018, this difference was 0.2888. This indicates that marine economy resilience in the Southern Marine Economy Circle is polarized, and the gap between extreme values continues to widen.
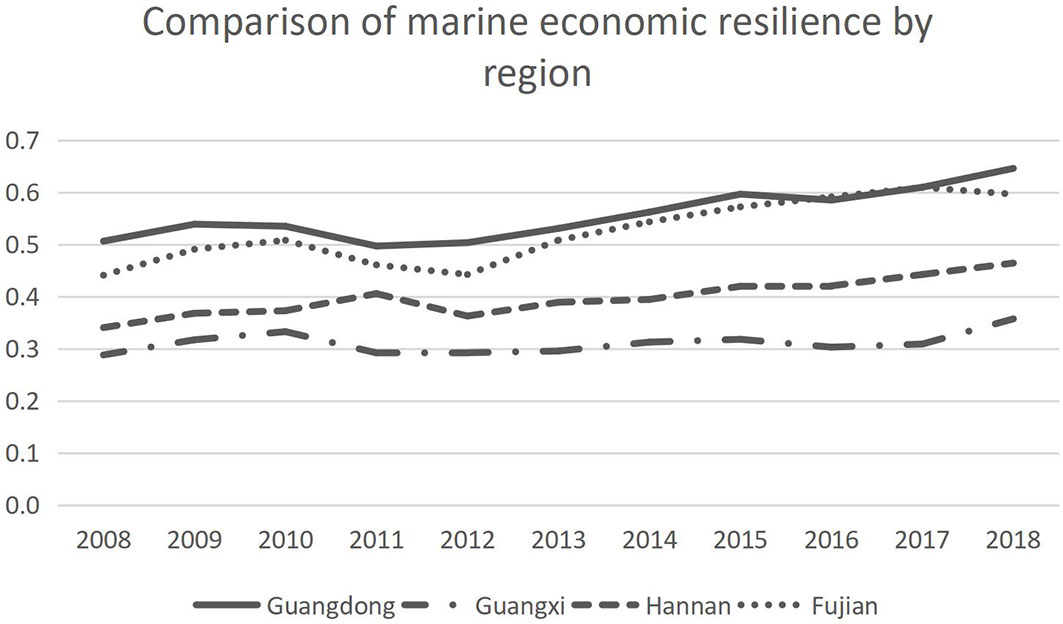
Figure 2 Comparison of marine economic resilience by region in China’s Southern Marine Economy Circle (2008–2018).
According to the above analysis, Guangdong undoubtedly belongs to the region of high-quality development of the marine economy, with favorable development prospects, gathering ecology, science and technology, economy, and other multi-dimensional advantages. Although Fujian’s marine economy is not fully developed, it has several comparative advantages. A considerable increase in marine nature reserves since 2015 facilitated upward development, enabling the region to overtake Guangdong in 2016 and become the strongest marine economy in the Southern Marine Economy Circle. In contrast, Hainan and Guangxi are also both improving year by year but still lag behind most other coastal regions, with huge potential for development. Hainan, in particular, developed rapidly in 2018, mainly due to its local marine-related departments giving full play to the region’s outstanding natural resource advantages as well as China’s strong support for the construction of the Pilot Free Trade Zone.
Conclusions
This study creates an evaluation system for marine economy resilience based on four dimensions: resistance, recovery, reorientation, and renewal. We employ an enhanced entropy method to quantitatively measure and empirically analyze the maritime economy resilience of four provinces in China’s Southern Marine Economy Circle (Guangdong, Guangxi, Hainan, and Fujian) between 2008 and 2018. The main conclusions are as follows:
The marine economic resilience of the Southern Marine Economy Circle from 2008 to 2018 is perturbed by internal and external factors and showed fluctuating changes. Although there was a small decline in 2011, 2012, and 2016, the overall trend is still on the rise. The mean marine economy resilience of the Southern Marine Economy Circle increased from 0.3934 in 2008 to 0.5155 in 2018, and the median increased from 0.3902 in 2008 to 0.5299 in 2018. Among the four provinces covered, Guangdong, which is in the leading position, is a high-resilience area. Fujian is a medium-resilience area that urgently needs to strengthen its innovation capability, while Guangxi and Hainan are low-resilience areas with a lot of potential and development room.
Each of the four provinces in the Southern Marine Economy Circle has improved its marine economic resilience at a different rate, but the horizontal inequalities between cities remain large. Guangdong is far ahead of the other three cities mainly attributed to its superior renewal capacity. The difference between the minimum and maximum marine economy resilience in the Southern Marine Economy Circle was 0.2183 in 2008 and 0.2888 in 2018. This indicates that although low-resilience areas expedited development in accordance with governmental regulations to increase resilience, they still differ considerably from high-resilience areas.
Discussion
Innovation
At present, global research on the resilience of the marine economy is still at an emerging stage, with basic theoretical definitions and measurement methods still being explored. There is a lack of quantitative analysis and empirical studies related to it. While pinpointing the beginning of an economic crisis is not an easy task (Sensier et al., 2016), it is important to constantly attempt to outline the type and duration of shocks in resilience studies as clearly as possible (Han and Goetz, 2015). In terms of theoretical significance, this paper enriches the theoretical basis for the assessment of marine economic resilience. By reviewing large amounts of literature, this study systematically organizes research processes and comprehensively analyzes marine economy resilience in terms of resistance, recovery, repositioning, and renewal. The indicator system has made a breakthrough in the assessment of marine economic resilience and explores its influencing factors upon this basis, providing a reference for future scholars to enrich and improve the research in this field. In a practical sense, this study provides useful ideas and reference for the high-quality and strong resilience development of China’s marine economy. This study reveals how resilience in China’s Southern Marine Economy changed over a 10-year period and identifies the internal and external factors affecting it.
Limitation
This paper enriches the research perspectives of the marine economy resilience assessment, and its conclusions have a certain reference value for realizing the high-quality development of China’s marine economy, but the following deficiencies still exist:
A limitation of this study (empirical evidence based only on the Southern China Marine Economic Circle) suggests expanding this research to a broader range of countries. This would allow revealing if the trend of rising economic resilience prevails across the China and even globally, or it is characteristic to the Southern China Marine Economic Circle only. Taking into account the diversity of regions, whether the resilience indicator system in this study is applicable to other countries still needs to be verified.
The index system for assessing the resilience of the marine economy needs to be further improved. Future studies could further investigate the reorientation and renewal ability and could emphasize the long-term process of realizing the adjustment and path orientation of marine economic systems. In the future, researchers could expand the data and optimize the index selection by different means to deeply analyze the long-term evolution and influencing factors of marine economic resilience. Most of the existing data come from the statistical yearbook, which do not involve marine ecological value services, marine-related enterprises, and so on. In the future, it is expected to combine remote sensing data inversion and an enterprise database to broaden the data source channels, improving the evaluation index system by optimizing the index selection, so as to deeply analyze the long-term evolution of marine economic resilience and its influencing factors. Moreover, the impact of marine development policies on regional resilience should not be ignored. Future resilience evaluation frameworks should include policy factors, and innovative research should be conducted with diversified research perspectives and emerging research data and research methods. More importantly, it is necessary to interview some marine professionals to explore more factors that may affect the changes in the resilience of the ocean economy, so as to make the assessment results more accurate.
Data Availability Statement
The original contributions presented in the study are included in the article/supplementary material. Further inquiries can be directed to the corresponding authors.
Author Contributions
The authors contributed equally to the conception of the idea, implementing and analyzing the experimental results, and writing the manuscript. All authors read and approved the final manuscript.
Funding
Foundation items: National Social Science Foundation Of China (NO.21BJY226), Soft Science Research Project Of Ningbo (2021R002).
Conflict of Interest
The authors declare that the research was conducted in the absence of any commercial or financial relationships that could be construed as a potential conflict of interest.
Publisher’s Note
All claims expressed in this article are solely those of the authors and do not necessarily represent those of their affiliated organizations, or those of the publisher, the editors and the reviewers. Any product that may be evaluated in this article, or claim that may be made by its manufacturer, is not guaranteed or endorsed by the publisher.
References
Angeon V., Bates S. (2015). Reviewing Composite Vulnerability and Resilience Indexes: A Sustainable Approach and Application. World Dev. 72, 140–162. doi: 10.1016/j.worlddev.2015.02.011
Bates S., Angeon V., Ainouche A. (2014). The Pentagon of Vulnerability and Resilience: A Methodological Proposal in Development Economics by Using Graph Theory. Econ. Model. 42, 445–453. doi: 10.1016/j.econmod.2014.07.027
Boschma R. (2015). Towards an Evolutionary Perspective on Regional Economic Resilience. Regional. Stud. 49 (5), 733–751. doi: 10.1080/00343404.2014.959481
Brakman S., Garretsen H., van Marrewijk C. (2014). The Crisis and Regional Resilience in Europe: On the Importance of Urbanization and Specialization. doi: 10.2139/ssrn.2428634
Brakman S., Garretsen H., van Marrewijk C. (2015). Regional Resilience Across Europe: On Urbanisation and the Initial Impact of the Great Recession. Cambridge. J. Reg. Econ. Soc. 8 (2), 225–240. doi: 10.1093/cjres/rsv005
Briguglio L., Cordina G., Farrugia N., Vella S. (2009). Economic Vulnerability and Resilience: Concepts and Measurements. Oxford. Dev. Stud. 37 (3), 229–247. doi: 10.1080/13600810903089893
Bristow G., Healy A. (2018). Innovation and Regional Economic Resilience: An Exploratory Analysis. Ann. Regional. Sci. 60 (2), 265–284. doi: 10.1007/s00168-017-0841-6
Burnard K., Bhamra R. (2011). Organisational Resilience: Development of a Conceptual Framework for Organisational Responses. Int. J. Product. Res. 18 (15), 5581–5599. doi: 10.1080/00207543.2011.563827
Campbell L. M., Fairbanks L., Murray G., Stoll J. S., D’Anna L., Bingham J., et al. (2021). From Blue Economy to Blue Communities: Reorienting Aquaculture Expansion for Community Wellbeing. Mar. Policy 124, 104361. doi: 10.1016/j.marpol.2020.104361
Chacon-Hurtado D., Kumar I., Gkritza K., Fricker J. D., Beaulieu L. J.. (2020). The Role of Transportation Accessibility in Regional Economic Resilience. J. Trans. Geograph. 84, 102695. doi: 10.1016/j.jtrangeo.2020.102695
Cheung William W. L., Jones M. C., Lam V. W. Y., Miller D., Ota Y., Teh L., et al. (2017). Transform High Seas Management to Build Climate Resilience in Marine Seafood Supply. Fish. Fish. 18 (2), 254–263.
Dhawan R., Jeske K. (2006). How Resilient is the Modern Economy to Energy Price Shocks? Econ. Review-Federal. Res. Bank. Atlanta. 91 (3), 21–32.
Di Caro P. (2015). Recessions, Recoveries and Regional Resilience: Evidence on Italy. Cambridge. J. Reg. Econ. Soc. 8 (2), 273–291. doi: 10.1093/cjres/rsu029
Di Caro P., Fratesi U. (2018). Regional Determinants of Economic Resilience. Ann. Regional. Sci. 60 (2), 235–240. doi: 10.1007/s00168-017-0858-x
Dong W. (2020). The Coordination Degree of Marine Economy and Social Economy Development. J. Coast. Res. 112 (SI), 161–164. doi: 10.2112/JCR-SI112-045.1
Ebarvia M. C. M. (2016). Economic Assessment of Oceans for Sustainable Blue Economy Development. J. Ocean. Coast. Eco. 2 (2), 7. doi: 10.15351/2373-8456.1051
Evenhuis E. (2017). New Directions in Researching Regional Economic Resilience and Adaptation. Geograph. Compass. 11 (11), e12333. doi: 10.1111/gec3.12333
Fagbote E. O., Olanipekun E. O., Uyi H. S. (2014). Water Quality Index of the Ground Water of Bitumen Deposit Impacted Farm Settlements Using Entropy Weighted Method. Int. J. Environ. Sci. Technol. 11 (1), 127–138. doi: 10.1007/s13762-012-0149-0
Faggian A., Gemmiti R., Jaquet T., Santini I.. (2018). Regional Economic Resilience: The Experience of the Italian Local Labor Systems. Ann. Regional. Sci. 60 (2), 393–410. doi: 10.1007/s00168-017-0822-9
Foster K. A. (2007). “A Case Study Approach to Understanding Regional Resilience,” in University of Califomia Berkeley, Working Paper Berkeley, CA: University of Califomia pp.08.
Giannakis E., Bruggeman A. (2017). Economic Crisis and Regional Resilience: Evidence From Greece. Pap. Regional. Sci. 96 (3), 451–476. doi: 10.1111/pirs.12206
Hallegatte S. (2014). “Economic Resilience: Definition and Measurement,” in World Bank Policy Research Working Paper Social Science Electronic Publishing a2 (2), 291–99. doi: 10.1111/j.1468-0289.1930.tb00792.x
Han Y., Goetz S. J. (2015). The Economic Resilience of U.S. Counties During the Great Recession. Rev. Regional. Stud. 45, 131–149. doi: 10.52324/001c.8059
He C. F. (2018). Evolution of Regional Industrial Development: Path Dependence or Path Creation? Geograph. Res. 37 (07), 1253–1267. doi: 10.11821/dlyj201807001
Holling C. S. (1973). Resilience and Stability of Ecological Systems. Annu. Rev. Ecol. Systemat. 4 (1), 1–23. doi: 10.1146/annurev.es.04.110173.000245
Holling C. S. (1996). “Engineering Resilience Versus Ecological Resilience,” in Engineering Within Ecological Constraints Washington, DC: National Academies Press, vol. 31., 32.
Horn R. V. (1993). Statistical Indicators for the Economic and Social Sciences (England, Cambridge: Cambridge University Press).
Hudson R. (2010). Resilient Regions in an Uncertain World: Wishful Thinking or a Practical Reality? Cambridge. J. Reg. Econ. Soc. 3 (1), 11–25. doi: 10.1093/cjres/rsp026
Irwin E., Campbell J., Wilson R., Faggian A., Moore R., Irwin N.. (2016). Human Adaptations in Food, Energy, and Water Systems. J. Environ. Stud. Sci. 6 (1), 127–139. doi: 10.1007/s13412-016-0375-8
Jiang X. Z., Liu T. Y., Su C. W. (2014). China's Marine Economy and Regional Development. Mar. Policy 50, 227–237. doi: 10.1016/j.marpol.2014.06.008
Kildow J. T., McIlgorm A. (2010). The Importance of Estimating the Contribution of the Oceans to National Economies. Mar. Policy 34 (3), 367–374. doi: 10.1016/j.marpol.2009.08.006
Lagravinese R. (2015). Economic Crisis and Rising Gaps North-South: Evidence From the Italian Regions. Cambridge. J. Reg. Econ. Soc. 8 (2), 331–342. doi: 10.1093/cjres/rsv006
Lahav O., Gull S. F. (1989). Distances to Clusters of Galaxies by Maximum Entropy Method. Month. Notice. R. Astro. Soc. 240 (4), 753–763. doi: 10.1093/mnras/240.4.753
Levin S. A., Lubchenco J. (2008). Resilience, Robustnes, and Marine Ecosystem-Based Management. BioScience 58 (1), 27–32. doi: 10.1641/B580107
Malizia E. E., Ke S. (1993). The Influence of Economic Diversity on Unemployment and Stability. J. Regional. Sci. 33 (2), 221–235. doi: 10.1111/j.1467-9787.1993.tb00222.x
Martin R. (2012). Regional Economic Resilience, Hysteresis and Recessionary Shocks. J. Econ. Geograph. 12 (12), 1–32. doi: 10.1093/jeg/lbr019
Martin R., Gardiner B. (2019). The Resilience of Cities to Economic Shocks: A Tale of Four Recessions (and the Challenge of Brexit). Pap. Regional. Sci. 98 (4), 1801–1832. doi: 10.1111/pirs.12430
Martin R., Sunley P. (2015). On the Notion of Regional Economic Resilience: Conceptualization and Explanation. J. Econ. Geograph. 15 (1), 1–42. doi: 10.1093/jeg/lbu015
Martin R., Sunley P., Gardiner B., Tyler P. (2016). How Regions React to Recessions: Resilience and the Role of Economic Structure. Regional. Stud. 50 (4), 561–585. doi: 10.1080/00343404.2015.1136410
Mason C., Brown R., Hart M., Anyadike-Danes M. (2015). High Growth Firms, Jobs and Peripheral Regions: The Case of Scotland. Cambridge. J. Reg. Econ. Soc. 8 (2), 343–358. doi: 10.1093/cjres/rsu032
Micheli F., Saenz-Arroyo A., Greenley A., Vázquez L., Espinoza Montes J. A., Rossetto M., et al. (2012). Evidence That Marine Reserves Enhance Resilience to Climatic Impacts. PloS One 7 (7), e40832. doi: 10.1371/journal.pone.0040832
Morrissey K., O' Donoghue C., Hynes S. (2011). Quantifying the Value of Multi Sectoral Marine Commercial Activity in Ireland. Mar. Policy 35 (5), 721–727. doi: 10.1016/j.marpol.2011.02.013
Navarro-Espigares J. L., Martín-Segura J. A., Hernández-Torres E. (2012). The Role of the Service Sector in Regional Economic Resilience. Service. Industries. J. 32 (4), 571–590. doi: 10.1080/02642069.2011.596535
Pendall R., Foster K. A., Cowell M. (2010). Resilience and Regions: Building Understanding of the Metaphor. Cambridge. J. Reg. Econ. Soc. 3 (1), 71–84. doi: 10.1093/cjres/rsp028
Pickett S. T. A., McGrath B., Cadenasso M. L., Felson A. J., et al. (2014). Ecological Resilience and Resilient Cities. Build. Res. Inf. 42 (2), 143–157. doi: 10.1080/09613218.2014.850600
Pike A., Dawley S., Tomaney J. (2010). Resilience, Adaptation and Adaptability. Cambridge. J. Region. Economy. Soc. 3 (1), 59–70. doi: 10.1093/cjres/rsq001
Rangel-Buitrago N., Neal W. J., Bonetti J. (2020). Vulnerability Assessments as a Tool for the Coastal and Marine Hazards Management: An Overview. Ocean. Coast. Manage. 189, 105134. doi: 10.1016/j.ocecoaman.2020.105134
Reggiani A., De Graaff T., Nijkamp P. (2002). Resilience: An Evolutionary Approach to Spatial Economic Systems. Networks Spat. Eco. 2 (2), 211–229. doi: 10.1023/A:1015377515690
Rose A., Krausmann E. (2013). An Economic Framework for the Development of a Resilience Index for Business Recovery. Int. J. Disaster. Risk Reduct. 5, 73–83. doi: 10.1016/j.ijdrr.2013.08.003
Rus K., Kilar V., Koren D. (2018). Resilience Assessment of Complex Urban Systems to Natural Disasters: A New Literature Review. Int. J. Disaster. Risk Reduction. 31, 311–330. doi: 10.1016/j.ijdrr.2018.05.015
Schwarz A. M., Béné C., Bennett G., Boso D., Hilly Z., Paul C., et al. (2011). Vulnerability and Resilience of Remote Rural Communities to Shocks and Global Changes: Empirical Analysis From Solomon Islands. Global Environ. Change 21 (3), 1128–1140. doi: 10.1016/j.gloenvcha.2011.04.011
Sdrolias L., Semos A., Mattas K. (2022). Assessing the Agricultural Sector's Resilience to the 2008 Economic Crisis: The Case of Greece. Agriculture 12 (2), 174. doi: 10.3390/agriculture12020174
Sensier M., Bristow G., Healy A. (2016). Measuring Regional Economic Resilience Across Europe: Operationalizing a Complex Concept. Spat. Econ. Anal. 11, 128–151. doi: 10.1080/17421772.2016.1129435
Shannon C. E. (1948). A Mathematical Theory of Communication. Bell. System. Tech. J. 27 (3), 379–423. doi: 10.1002/j.1538-7305.1948.tb01338.x
Sherrieb K., Norris F. H., Galea S. (2010). Measuring Capacities for Community Resilience. Soc. Indic. Res. 99 (2), 227–247. doi: 10.1007/s11205-010-9576-9
Simmie J., Martin R. (2010). The Economic Resilience of Regions: Towards an Evolutionary Approach. Cambridge. J. Region. Economy. Soc. 3 (1), 27–43. doi: 10.1093/cjres/rsp029
Smith H. D. (2000). The Industrialisation of the World Ocean. Ocean. Coast. Manage. 43 (1), 11–28. doi: 10.1016/S0964-5691(00)00028-4
Stebbings E., Papathanasopoulou E., Hooper T., Austen M. C., Yan X. (2020). The Marine Economy of the United Kingdom. Mar. Policy. 116, 103905. doi: 10.1016/j.marpol.2020.103905
Strategy S. C. (2007). Sea Change: A Marine Knowledge, Research and Innovation Strategy for Ireland 2007–2013 (Galway: Marine Institute).
Tepes A., Neumann M. B. (2020). Multiple Perspectives of Resilience: A Holistic Approach to Resilience Assessment Using Cognitive Maps in Practitioner Engagement. Water Res. 178, 115780. doi: 10.1016/j.watres.2020.115780
Tran D., Wagner M. (2000). Fuzzy Entropy Clustering//Ninth IEEE International Conference on Fuzzy Systems Vol. 1 (San Antonio: IEEE), 152–157.
Volkov A., Žičkienė A., Morkunas M., Baležentis T., Ribašauskienė E., Streimikiene D. (2021). A Multi-Criteria Approach for Assessing the Economic Resilience of Agriculture: The Case of Lithuania. Sustainability 13 (4), 2370. doi: 10.3390/su13042370
Wang B., Liu J. (2019). Comprehensive Evaluation and Analysis of Maritime Soft Power Based on the Entropy Weight Method (EWM). J. Physics: Conf. Series. 1168 (3), 032108. doi: 10.1088/1742-6596/1168/3/032108
Woods D. D. (2015). Four Concepts for Resilience and the Implications for the Future of Resilience Engineering. Reliability. Eng. System. Saf. 141, 5–9. doi: 10.1016/j.ress.2015.03.018
Wu J., Bo Li. (2022). Spatio-Temporal Evolutionary Characteristics and Type Classification of Marine Economy Resilience in China. Ocean. Coast. Manage. 217, 106016. doi: 10.1016/j.ocecoaman.2021.106016
Zeleny M. (1975). Multiple Criteria Decision Making J Oper Res Soc. 26 (2), 343–344. doi: 10.1057/jors.1975.71.
Zhang Y., Liu K., Peng F., Wang S., Wang Z., Liu H., et al. (2016). A Comparison of Marine Economy and Marine Industrial Structure Between China and the US: A Pragmatic Study Based on the Fact That China Surpassed the US in Marine Economic Output. Scientia. Geographic. Sin. 11, 1614–1621.
Zhao Q., Du Y., Zhang T., Zhang W. (2021). Resilience Index System and Comprehensive Assessment Method for Distribution Network Considering Multi-Energy Coordination. Int. J. Electric. Power Energy Syst. 133, 107211. doi: 10.1016/j.ijepes.2021.107211
Zheng D., Chen D., Lin Q. (2020). Research on the Influencing Factors of the Development Level of Marine Economy in Fujian Province. J. Coast. Res. 115 (SI), 434–437. doi: 10.2112/JCR-SI115-122.1
Keywords: marine economic resilience, resilience index system, entropy method, marine economy circle, resistance–recovery–reorientation–renewal
Citation: Hu Y, Zhou HQ, Jin XM, Shen YF and Yan YZ (2022) Assessing the Resilience of the Marine Economy: A Case Study of Southern China’s Marine Economy Circle. Front. Mar. Sci. 9:912462. doi: 10.3389/fmars.2022.912462
Received: 07 April 2022; Accepted: 29 April 2022;
Published: 31 May 2022.
Edited by:
Kum Fai Yuen, Nanyang Technological University, SingaporeReviewed by:
Athanasios Kampas, Agricultural University of Athens, GreeceYusheng Zhou, Nanyang Technological University, Singapore
Copyright © 2022 Hu, Zhou, Jin, Shen and Yan. This is an open-access article distributed under the terms of the Creative Commons Attribution License (CC BY). The use, distribution or reproduction in other forums is permitted, provided the original author(s) and the copyright owner(s) are credited and that the original publication in this journal is cited, in accordance with accepted academic practice. No use, distribution or reproduction is permitted which does not comply with these terms.
*Correspondence: Han Qian Zhou, Um9zZXpob3UwNjI4QDE2My5jb20=; Xiao Mei Jin, NjI2OTM1OTc4QHFxLmNvbQ==