 Rongliang Zhang1,2
 Qianqian Zhang3
 Jianmin Zhao3
 Zhongxin Wu4
 Hui Liu3*
 Lu Shou1,2*
 Yibo Liao1,2Qinghe Liu1,2
 Yanbin Tang1,2
 Jiangning Zeng1,2
- 1Key Laboratory of Marine Ecosystem Dynamics, Second Institute of Oceanography, Ministry of Natural Resources, Hangzhou, China
- 2Observation and Research Station of Yangtze River Delta Marine Ecosystems, Ministry of Natural Resources, Zhoushan, China
- 3Key Laboratory of Coastal Biology and Biological Resources Utilization, Yantai Institute of Coastal Zone Research Chinese Academy of Sciences, Yantai, China
- 4Center for Marine Ranching Engineering Science Research of Liaoning, Dalian Ocean University, Dalian, China
The comparison of trophic structure and energy flow between natural and artificial reefs is imperative to evaluate whether these man-made structures work similarly to comparable natural reefs. Here, to characterize the potential difference in functioning between two types of reef ecosystems, two trophic models (Ecopath) at an artificial reef and an adjacent natural reef on the coast of the north Yellow Sea, China, were established. Both Ecopath models were divided into 18 functional groups from primary producers (algae and phytoplankton) and detritus to predatory species (e.g., Sebastes schlegelii). Model outputs showed that the ecosystem scale was smaller in the artificial reef (total system throughput (TPP) = 6,455.47 t·km−2·year−1) relative to its natural counterpart (TPP = 9,490.48 t·km−2·year−1). At both reef types, a large proportion of energy occurred at trophic levels I and II, and most of the primary production was utilized through a detritus pathway. This result implies a bottom-up energy flow control for both cases. However, two types of reef systems were behaving in a reasonable manner, as mean transfer efficiencies were similar to the Lindeman efficiency (10%). The ecosystem maturity of the artificial reef is not comparable to that of the natural reef for its inferior value of total primary production/total respiration (TPP/TR). Moreover, both the connectance index (CI) and system omnivory index (SOI) were slightly higher at the artificial reef relative to the natural reef as well as other coastal systems with parallel latitudes, suggesting that the current artificial system has formed complicated interspecies relations and high-level stability. This work updates our knowledge about the functioning evolvement of established artificial reefs and provides a baseline for the efficient management of coastal zones and further investigations.
1 Introduction
As marine habitat loss and degradation become major threats to biodiversity and fishery reduction, the establishment of artificial reefs has become an effective way to alleviate habitat stressors (McCauley et al., 2015; Lima et al., 2019). A small scale biosphere reserve will arise in situ after the deployment of artificial reefs, where various organisms can find shelters (e.g., fish) or attachment bases (e.g., algae and filter feeders), leading to gathering effects on marine organisms (Bohnsack, 1989; Brickhill et al., 2005; Raj et al., 2020). Moreover, the upwelling generated around the reef will promote nutrient recycling and subsequently be conducive to primary production (Liu et al., 2013). As a result, these submerged structures facilitate populations of living marine resources and enhance biodiversity in situ with time extending.
Ecological succession around newly deployed reefs is not only characterized by the change of biological community but also accompanied by the evolvement of ecosystem functions (Nicoletti et al., 2007; Toledo et al., 2020). As artificial reefs have been deliberately constructed or placed to emulate some functions of natural reefs (United Nations Environment Programme, 2009), comparative biological surveys between two types of reefs are essential and have been performed worldwide (Paxton et al., 2020). Revealing similarities and differences in terms of community composition and biodiversity have brought insights into the performance of newly deployed reefs. However, current knowledge has rarely concerned the characteristics of trophic structure and energy flow, which allows for the performance evaluation of artificial reefs in ecosystem functioning. It has been widely accepted that energy sources and pathways play crucial roles in the functions of the artificial reef ecosystem (Brickhill et al., 2005). Thus, uncovering the trophic characteristics will shed light on the mechanism of these man-made structures involved in habitat restoration and fishery conservation and facilitate ecosystem-based approaches to fisheries finally.
As a common tool in depicting the characteristics of aquatic ecosystems, Ecopath with Ecosim (EwE) is now generally applied in assessing the sustainability, productivity, and resilience of an ecosystem (Polovina, 1984; Colléter et al., 2015; Abdou et al., 2020) and tracking the effects of anthropogenic and environmental stressors on ecosystems (Shin and Shannon, 2010; Reed et al., 2017). This model considers both the fishing impacts on target and non-target species and interactions between ecosystem components, thus providing a better understanding of implementing an ecosystem-based approach to fisheries management. In China, the application of EwE has extended to the artificial reef ecosystems over the years, such as Lidao (Wu et al., 2016), Laoshan Bay (Liu et al., 2019), and Laizhou Bay (Xu et al., 2019). Relevant studies analyzed trophic interactions and energy transfer between different functional groups and assessed the impact of artificial reefs on the original ecosystem functions in detail, which supplies important data and theories for the establishment of artificial reefs subsequently. Nevertheless, comparative studies on artificial reefs before and after deployments, and on ecosystems between artificial reefs and natural reefs remain limited (Lee and Zhang, 2018; Xu et al., 2019), which hinders our further evaluation of how well an artificial reef system performs after years’ development, especially when compared to its natural counterpart.
Over the past dozen years, to cope with coastal pollution (such as nutrition overloading) caused by anthropogenic activities and prevent bottom trawling, along with supporting habitat as well as marine aquatic resources rehabilitation, artificial reefs were deployed extensively in the coastal Yellow Sea, China. Accordingly, to assess the ecological and economic values brought by these man-made reefs and check whether their goals are achieved, a large amount of empirical data were collected based on the community composition and biodiversity (Wu et al., 2019; Zhou et al., 2019; Yu et al., 2020). Relevant studies generally underlined the higher biodiversity and fishery abundance after the reef was constructed, and they have pointed out that the reef design, submersion period, and environmental conditions also had an impact on the biological communities. Yet whether these artificial structures evolve to be identical to the natural reefs in terms of ecosystems functions remains unclear and warrants comparative research. In the current study, we characterized the potential difference in trophic structure and energy flow between an established artificial reef located on the coast of the Yellow Sea, China, and an adjacent natural reef ecosystem based on the Ecopath model. We aimed to illustrate how an artificial ecosystem developed after years’ deployment by comparing the trophic characteristics of two reef types. Our results are expected to provide reference cases and data support for the artificial reef establishment in the future.
2 Material and Methods
2.1 Study Area
This study was conducted on the coast of the Yellow Sea, China (Figure 1). The artificial reef was constructed in 2009 and distributed over an area of approximately 1,200 km2. All the reef modules were made of rocks or concrete cubes with holes (3 m × 3 m × 3 m) and had a depth of 10–20 m on soft sediment bottom. The natural reef, ca. 18 km west of the artificial reef, situates close to Yangma Island and is composed mainly of rocky stone. This natural rocky area is also interspersed with sediment bottoms, extending toward the offshore and reaching a maximum depth of 20 m.
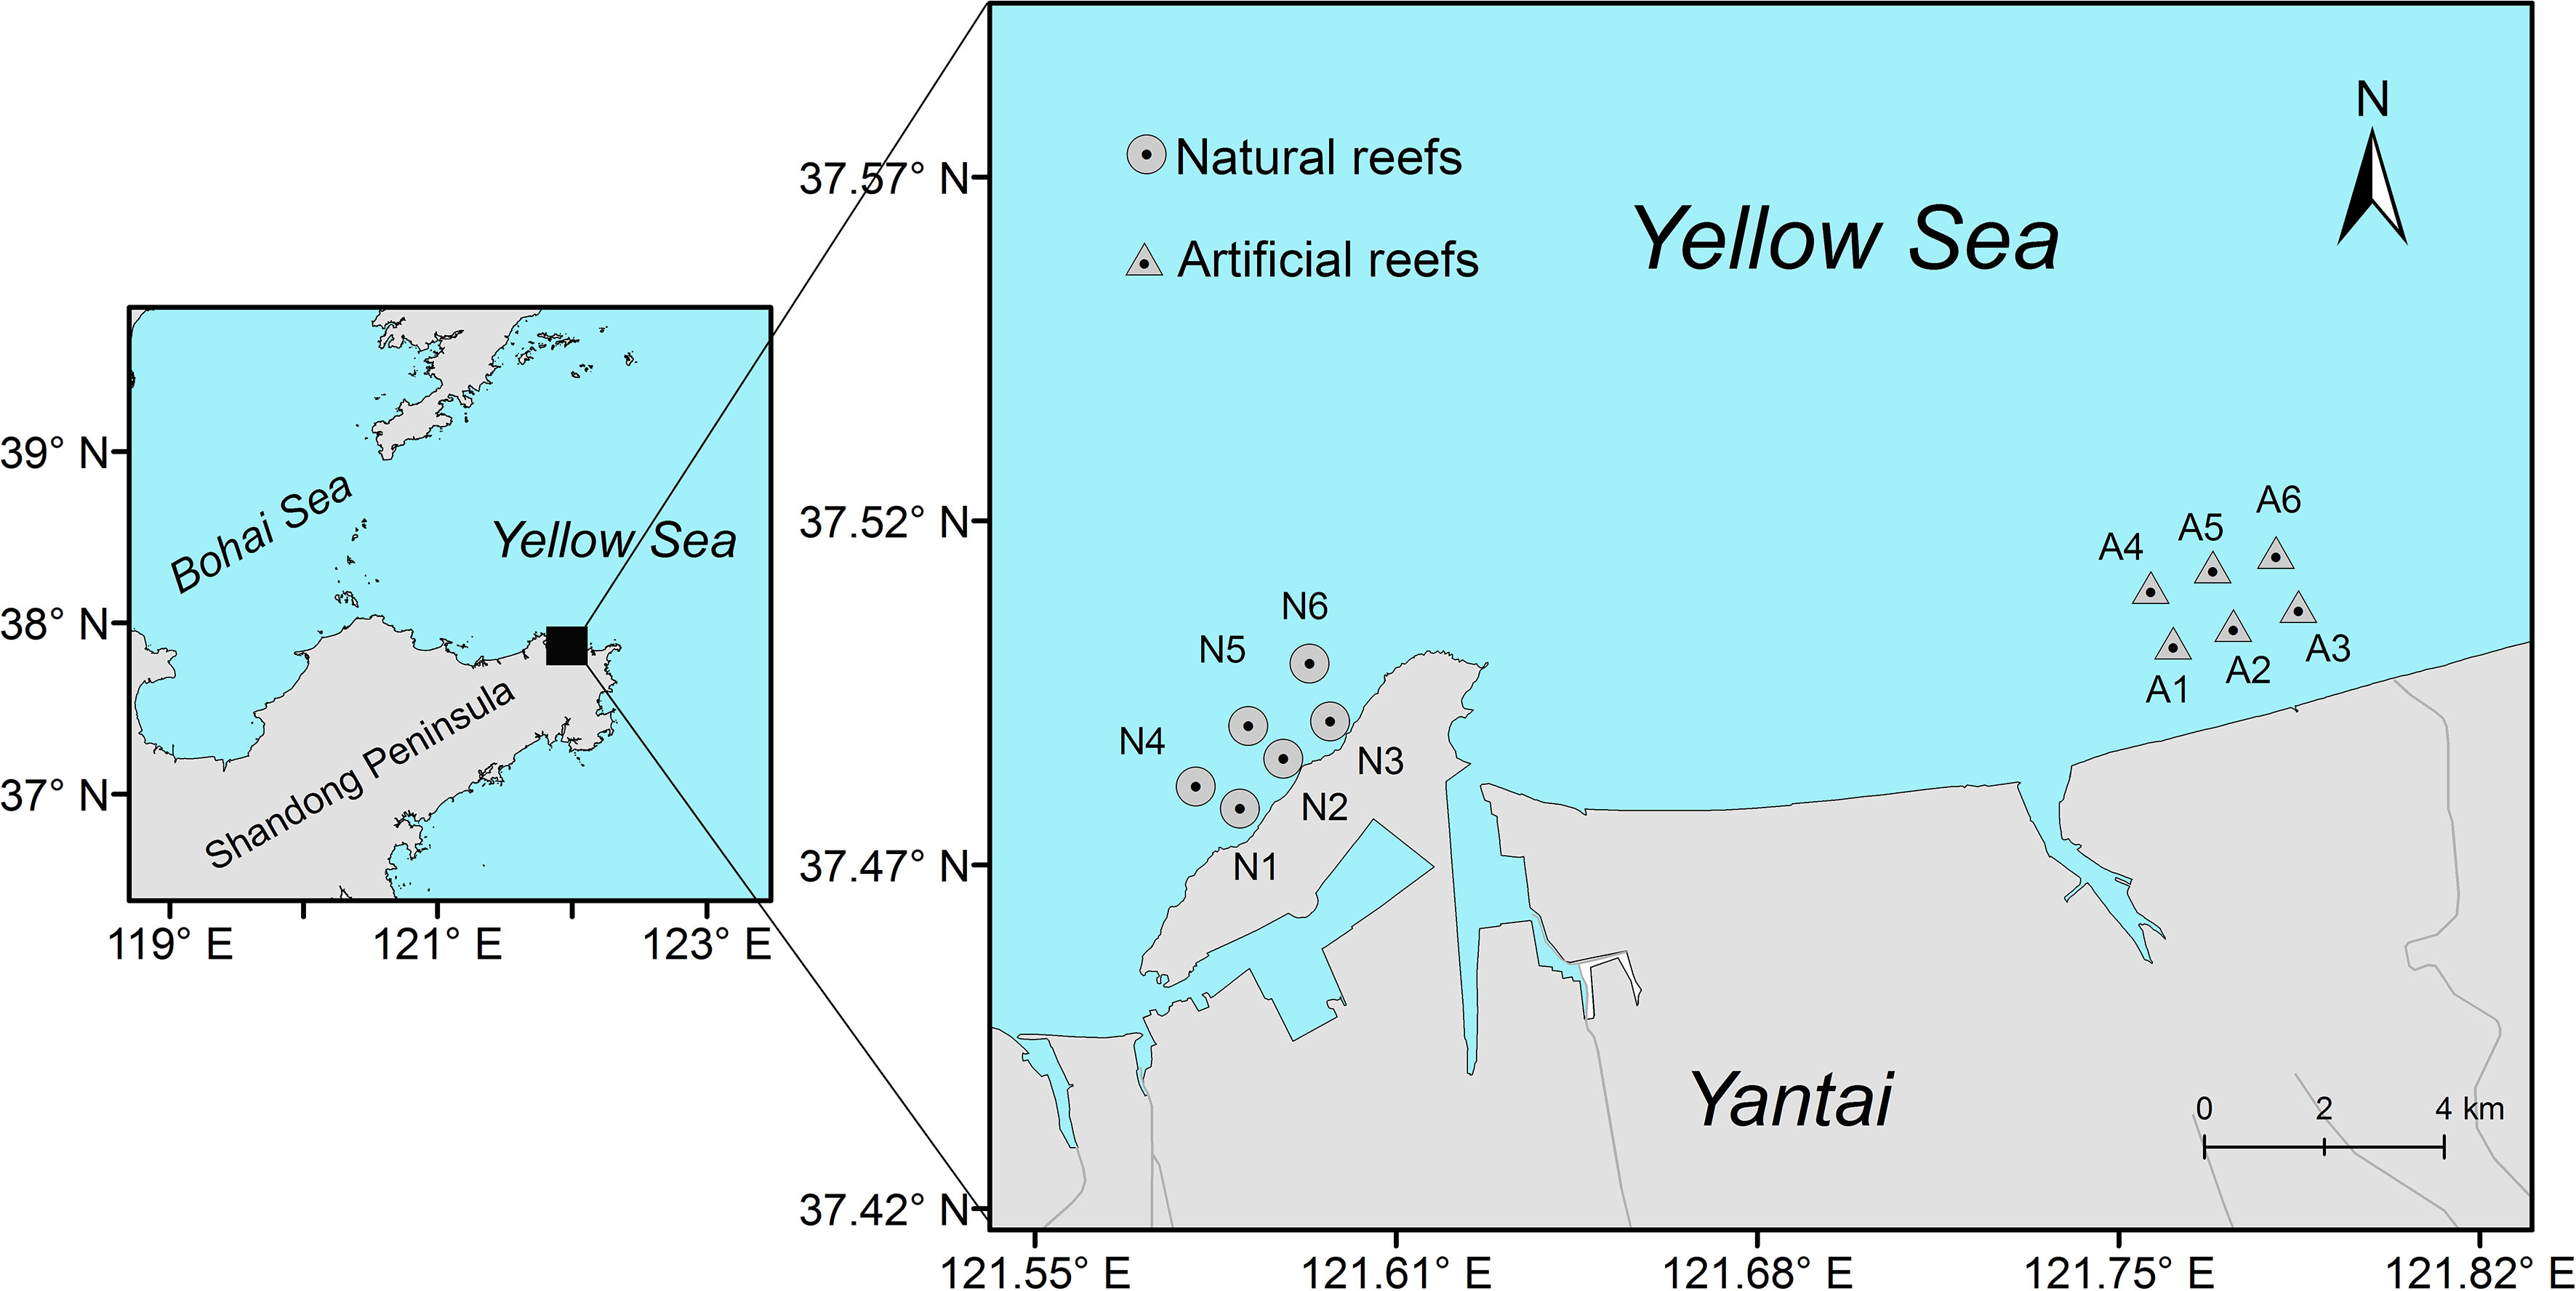
Figure 1 Study locations of artificial reefs and natural reefs on the coast of Yellow Sea, China.
2.2 Ecopath Models
EwE 6.5 software (Christensen and Walters, 2004; Christensen et al., 2008) was used as the construction platform for the Ecopath model here. The Ecopath model is composed of multiple interrelated functional groups, which must be qualified to represent the biological components in the ecosystem. All functional groups need to cover the entire process of energy flow in the ecosystem, and the oval operation process complies with the following equation:
2.2.1 Data Sources
Based on similarities in biological characteristics, feeding strategies, and ecological functions, the species included were clustered into 18 functional groups for both artificial and natural models, respectively (Table 1). And considering dominant species (measured from bottom fishery surveys) all year round coupled with their ecological and economic values, each of Korean Rockfish Sebastes schlegelii, Fat Greenlings Hexagrammos otakii, Japanese swimming crab Charybdis japonica, Pacific Oysters Crassostrea gigas, and Fang’s blenny Enedrias fangi was divided into a functional group separately.
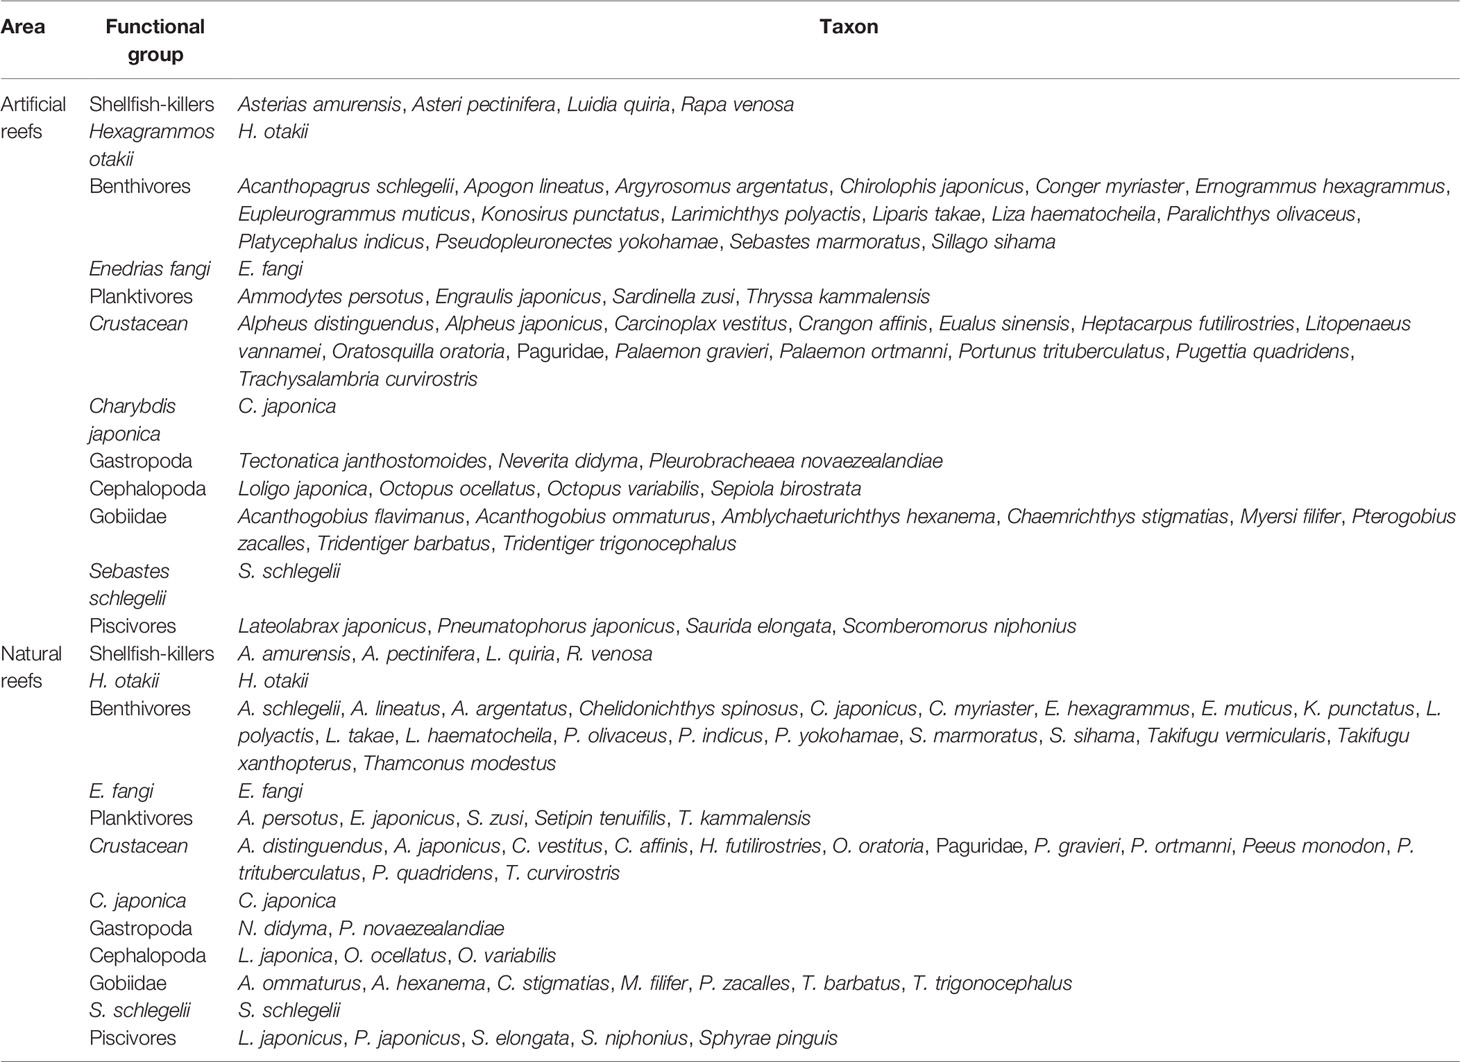
Table 1 Species composition of functional groups in the nearshore artificial and the natural reefs of Yellow Sea, China.
As for input parameters (B, P/B, Q/B, diet matrix DC, and catches Y) required in the model, empirical data wherever possible were used; otherwise, references and estimates from the model equations were used. Field samplings were undertaken in February, May, August, and November 2019, and the mean value of corresponding parameters was included in the models. For bottom fishery organisms, trap nets and trawl nets were used in or around both reef types. Sessile organisms (i.e., bivalves and macroalgae) were collected and measured by using 0.5 × 0.5 m quadrats by scuba diving, with at least three replicates at each station seasonally. The macrobenthos was sampled by box dredger with a 0.1-m2 area, and the zooplankton was obtained by plankton net with 505-μm mesh size. The biomass of phytoplankton was measured by converting the average annual chlorophyll concentration (mg/m3) to biomass (Sandu et al., 2003). For the biomass of each functional group input in the Ecopath model at both reef types, the details are shown in Table 2.
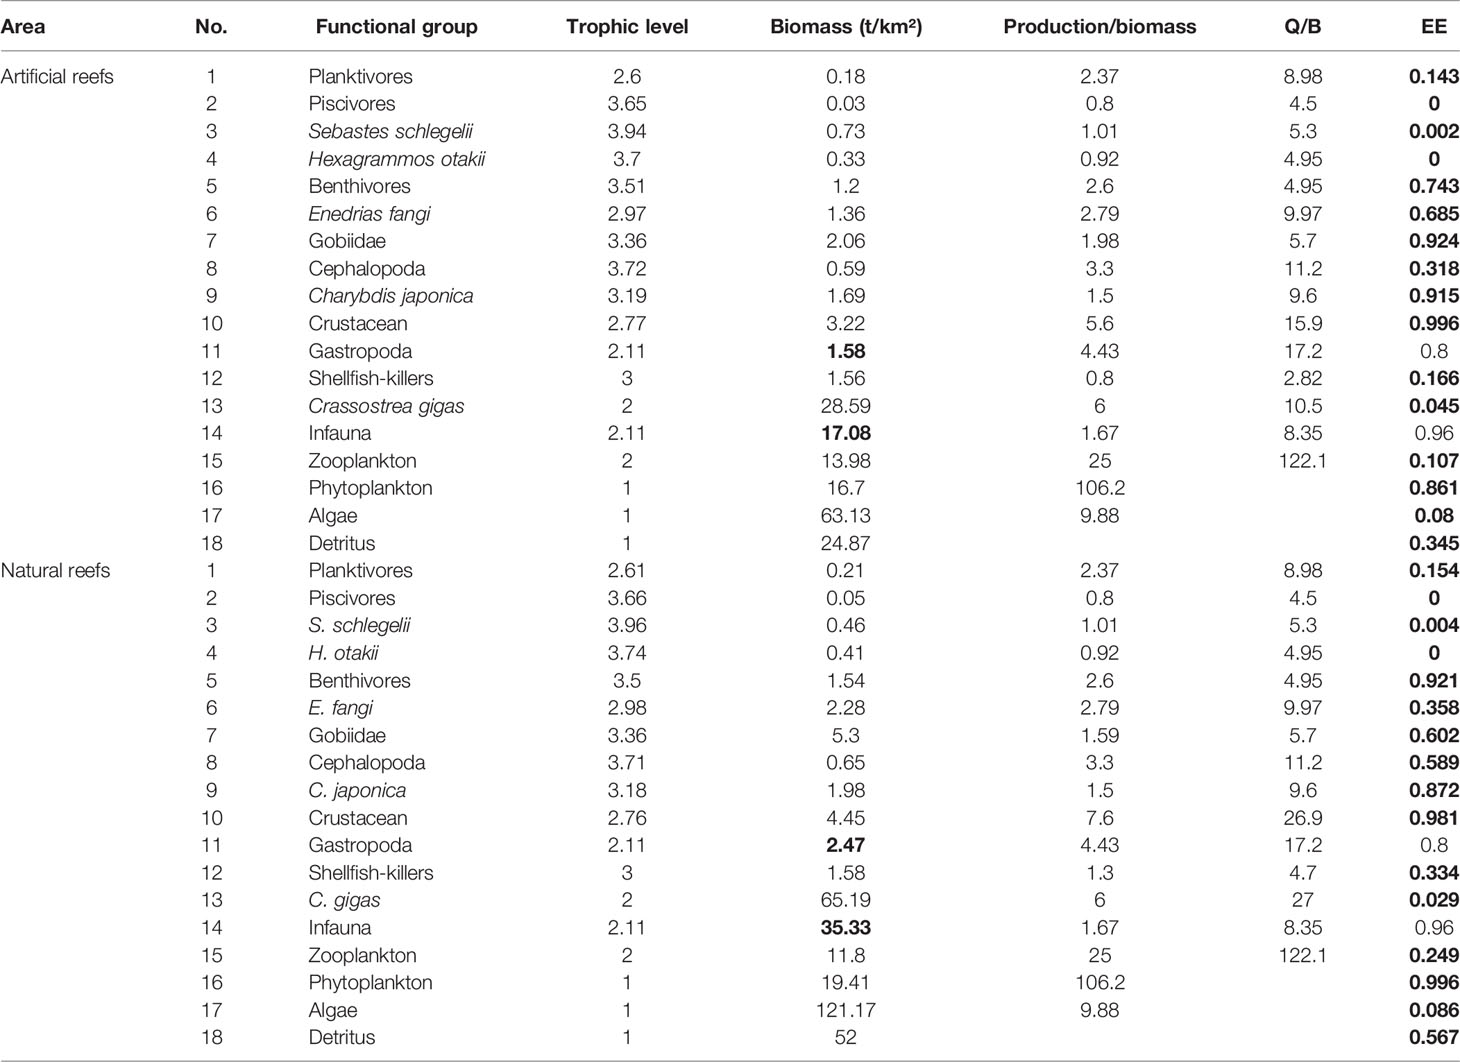
Table 2 Initial input and estimated parameters (in bold) in the Ecopath models of the artificial and natural reefs on the coast of Yellow Sea, China.
The P/B and Q/B ratios of fish and other functional groups, as well as the production and biomass of heterotrophic bacteria and detritus in water, were obtained from FishBase (www.fishbase.org), and relevant publications were carried out in areas nearby or with the same latitude worldwide (Okey et al., 2004; Ouyang and Guo, 2010; Wu et al., 2016; Xu et al., 2019). The input B value of each functional group was the sum of a weighted average of its internal members’ biomass, and the weights of each member were mainly based on their biomass ratio in the functional group (Table 2). The diet composition matrix (Table 3) was mainly from the result of our previous studies (Zhang et al., 2021a; Zhang et al., 2021b), together with published literature on feeding ecology in nearby areas (Yang, 2001a; Yang, 2001b; Zhang et al., 2012; Zhang, 2018) and FishBase. As biomass and diet composition were usually the most uncertain parameters among that input, they were slightly adjusted to achieve mass balance of the model whenever necessary.
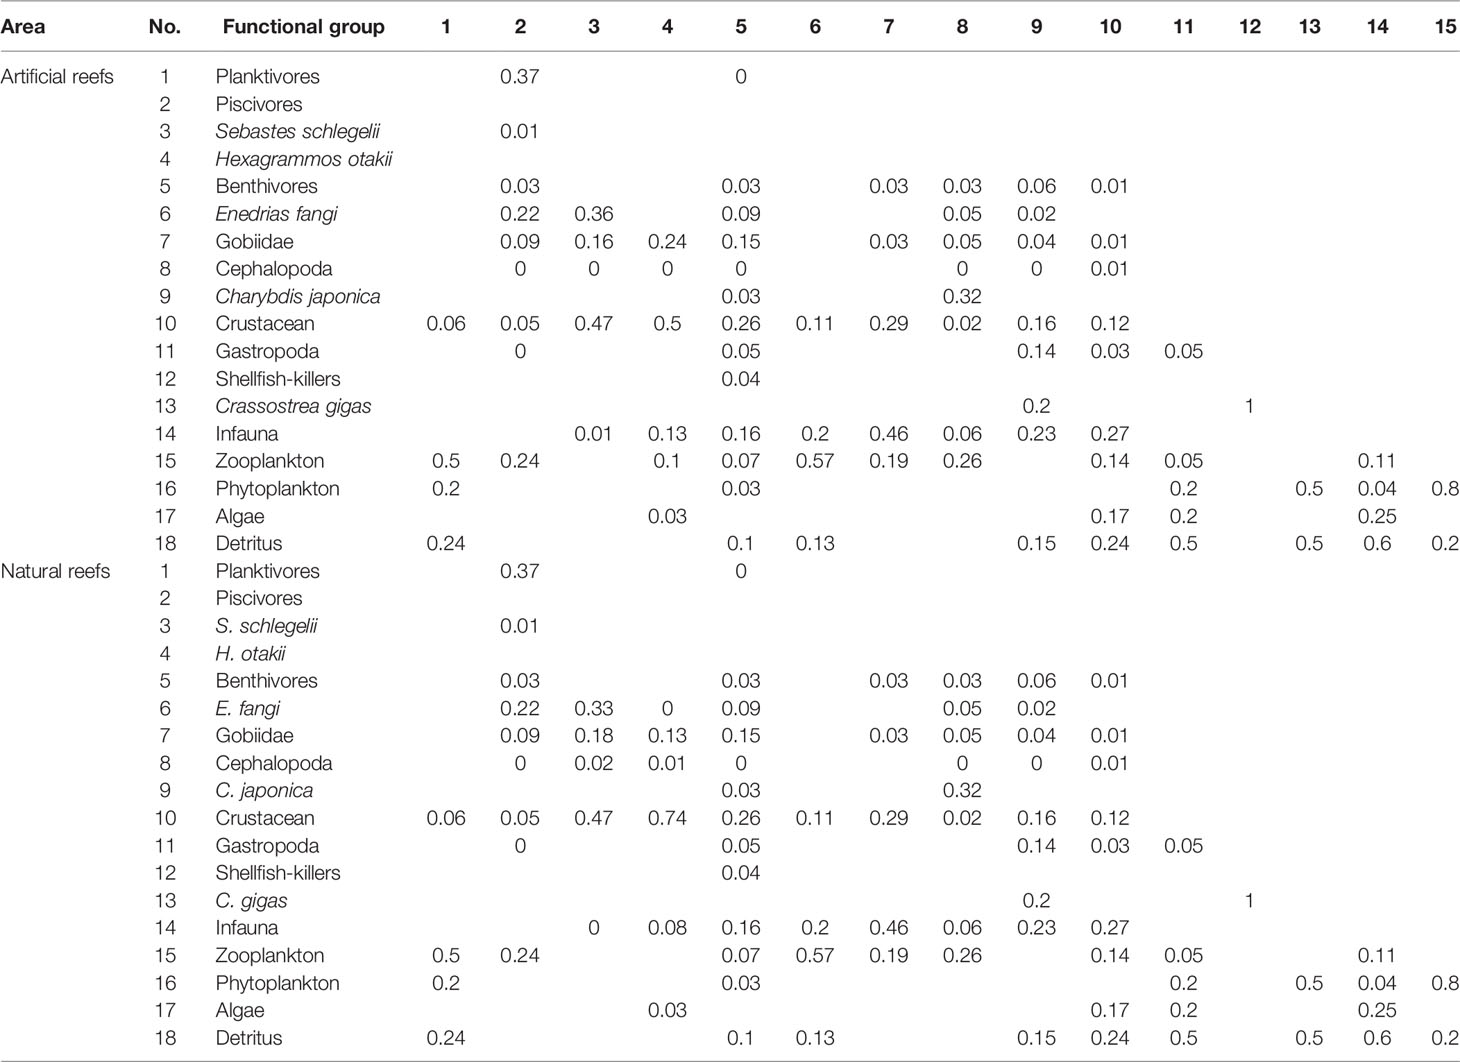
Table 3 Diet matrix imported into the Ecopath models of the artificial and natural reefs on the coast of Yellow Sea, China.
2.2.2 Model Balancing and Ecological Indicators
The Ecopath model was debugged according to Heymans et al. (2016), until balanced. Before the model was run, it was checked whether the parameter values had biological credibility. After the model parameters were initialized, the 0 < EE ≤ 1 and P/Q < 0.5 of each functional group were adjusted to ensure the model balance. Considering the reliability and accuracy of model parameters are the main factors affecting model quality, the pedigree index (p-value) was calculated to reflect the sensitivity of the model and quantify the uncertainty of the input parameters (Christensen and Walters, 2004). The p-value of each functional group was finally integrated and unified into the overall P index, to evaluate the overall quality of the Ecopath model. Besides, sensitivity analyses were performed on both Ecopath models to test the effects of input parameter variation (−50% to 50%) on the estimated parameters. A mixed trophic impact (MTI) analysis was also conducted to assess the direct and indirect trophic interactions among compartments, including impacts of fishery practices throughout the system (Ulanowicz and Puccia, 1990; Christensen et al., 2008). This routine would evaluate the influence of small biomass increases of one group on the biomass of other groups, thus providing a manner of sensitivity analysis.
Ecological indicators were calculated based on network analysis (Ulanowicz, 1986). Specifically, the total system throughput (TST) was considered, which is consist of total consumption (TC), total exports (TEX), total respiration (TR), and total flows into detritus (TDET), to measure the ecological size of a system (Finn, 1976) and its metabolism (Ortiz et al., 2015). More descriptive indicators, such as total primary production (TPP) and total biomass (TB), characterize the overall activity and the size of the ecosystem (Latham, 2006; Ortiz et al., 2015). Net system production (NSP), the difference value between TPP and TR, represents the sum of the productivity of all producers. TPP/TR describes system maturity (Odum, 1969; Christensen, 1995). Mean transfer efficiency (MTE) within trophic levels (TLs), measures the efficiency of energy utilization of each TL in the system (Christensen et al., 2008). Connectance index (CI) and system omnivory index (SOI) reflect the complexity of the system’s internal connections (Christensen and Walters, 2004; Libralato, 2013).
3 Result
3.1 Overall Characteristics of Ecosystem Energy Flow
The P index in each model was 0.469, which sits in the middle of those values obtained from more than 150 Ecopath models worldwide (Morissete et al., 2006), indicating the input and statistics data quality were of good reliability and credibility to a certain degree. The sensitivity of the estimated parameters to changes in input parameters of different functional groups depends on the degree of trophic linkages between these functional groups. Results showed that the resulting change in the estimated parameter ranged from −39.8% to 194.3%. The first six most sensitive estimated parameters were extracted in each model and visualized in Figure 2. Apart from two groups exhibiting a remarkable change in the estimated parameters, i.e., effects of Gastropoda (P/B) on Gastropoda (B) and effects of Infanna (EE) on Infauna (B), the other five groups of input parameters in both artificial and natural Ecopath models had a slight effect on the estimated parameters. The change in P/B value for the Gastropoda group had a great influence on the corresponding biomass estimation. When P/B decreased by 50%, the estimated biomass of Gastropoda increased by 194.3%. When EE of other benthic animals decreased by 50%, the estimation of corresponding biomass changed by 100% (Figure 2). The sensitivity analysis indicated that most estimated parameters were insensitive to changes in input parameters in both reef models.
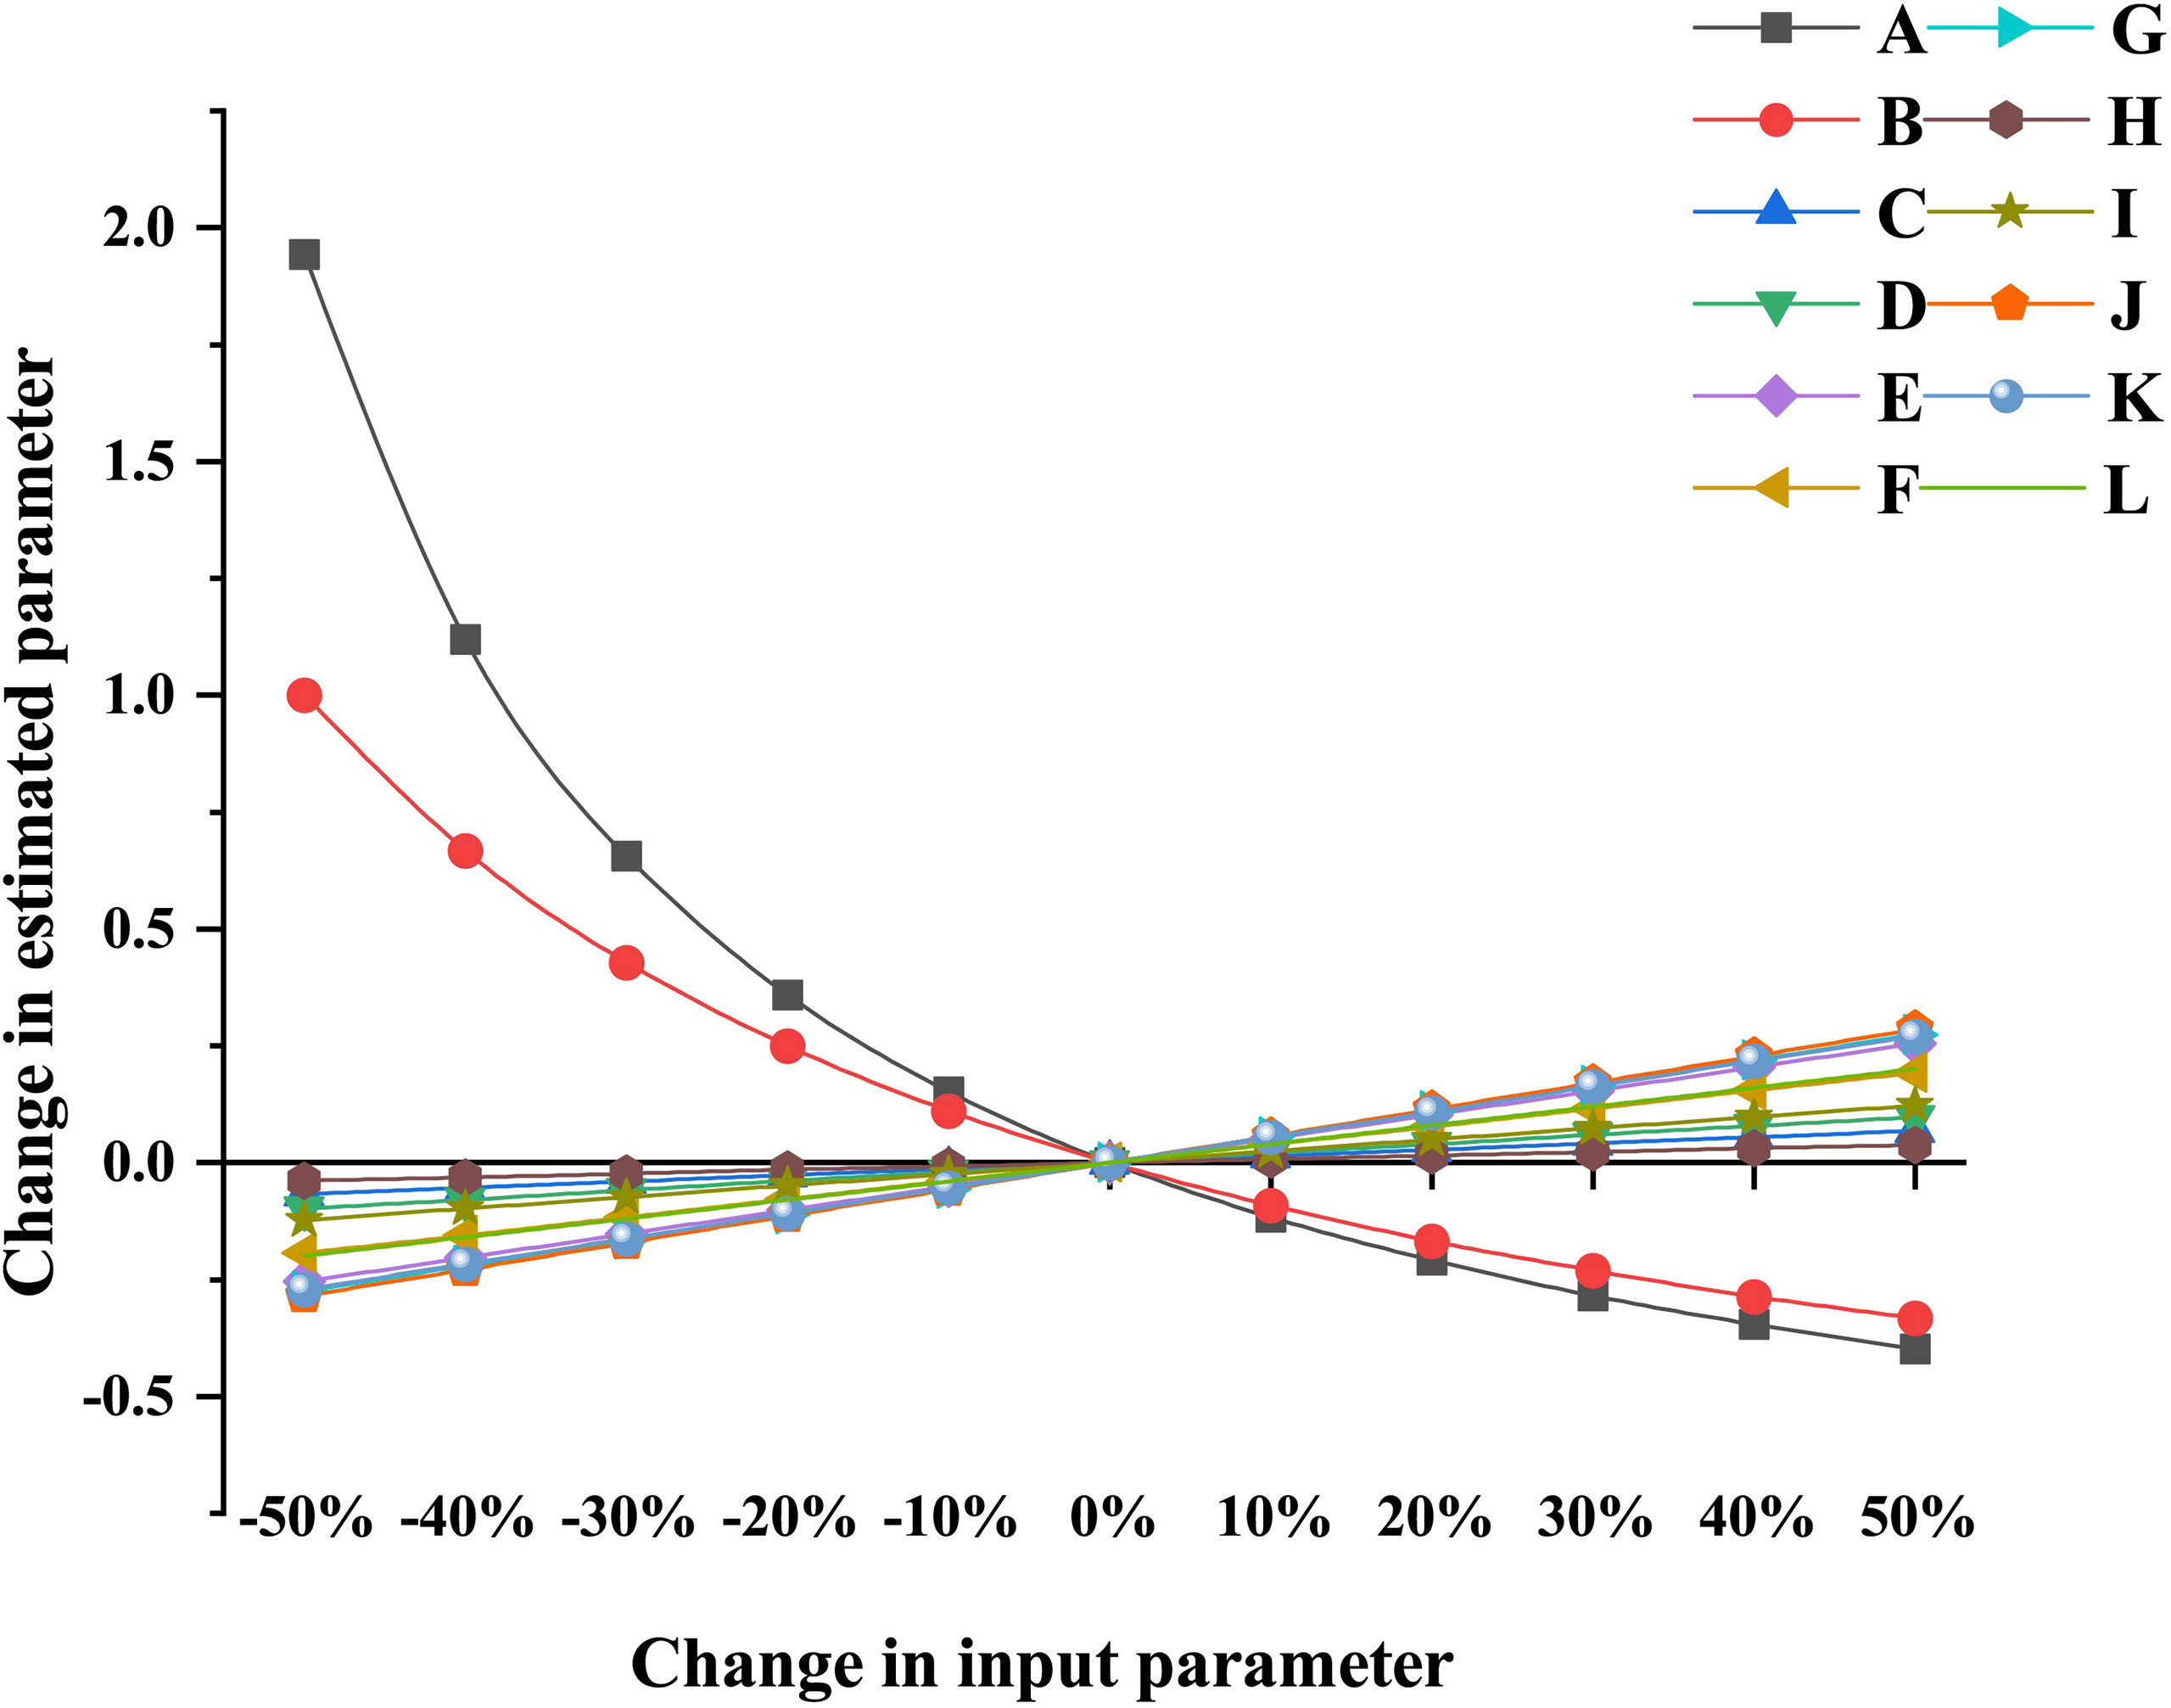
Figure 2 Partial sensitivity analysis of Ecopath model for artificial reef and natural reef ecosystems. (A) Effects of Gastropoda (P/B) on Gastropoda (B) of Ecopath model for artificial reef and natural reef ecosystems. (B) Effects of Infauna (EE) on Infauna (B) of Ecopath model for artificial reef and natural reef ecosystems. (C) Effects of Charybdis japonica (B) on Infauna (B) of Ecopath model for artificial reef ecosystem. (D) Effects of Gobiidae (B) on Infauna (B) of Ecopath model for artificial reef ecosystem. (E) Effects of Crustacean (B) on Infauna (B) of Ecopath model for artificial reef ecosystem. (F) Effects of Crustacean (B) on Gastropoda (B) of Ecopath model for artificial reef ecosystem. (G) Effects of C. japonica (B) on Gastropoda (B) of Ecopath model for artificial reef ecosystem. (H) Effects of C. japonica (B) on Infauna (B) of Ecopath model for natural reef ecosystem. (I) Effects of Gobiidae (B) on Infauna (B) of Ecopath model for Natural Reef ecosystem. (J) Effects of Crustacean (B) on Infauna (B) of Ecopath model for Natural Reef ecosystem. (K) Effects of Crustacean (B) on Gastropoda (B) of Ecopath model for natural reef ecosystem. (L) Effects of C. japonica (B) on Gastropoda (B) of Ecopath model for natural reef ecosystem.
The aggregated summary statistics and indicators of network flow and ecosystem structure for each model are listed in Table 4. For the artificial system, the TST was 9,490.48 t·km−2·year−1, comprising percentage contributions of TC (39.6%), TR (23.07%), TEX (11.28%), and TDET (26.05%). For the natural system, TST was 6,455.47 t·km−2·year−1, of which 35.53% was consumed, 19.24% was respired, 17.91% was exported, and 27.32% flowed to detritus. TDET values accounted for over 26% of the TST for both cases, indicating that re-entering the ecosystem and recycling subsequently were the main ways of energy utilization for both reef systems, and energy underutilization occurred in each case. The TPP/TR and CI values were higher in the artificial system relative to its natural counterpart, while SOI values were similar for both cases (Table 4).
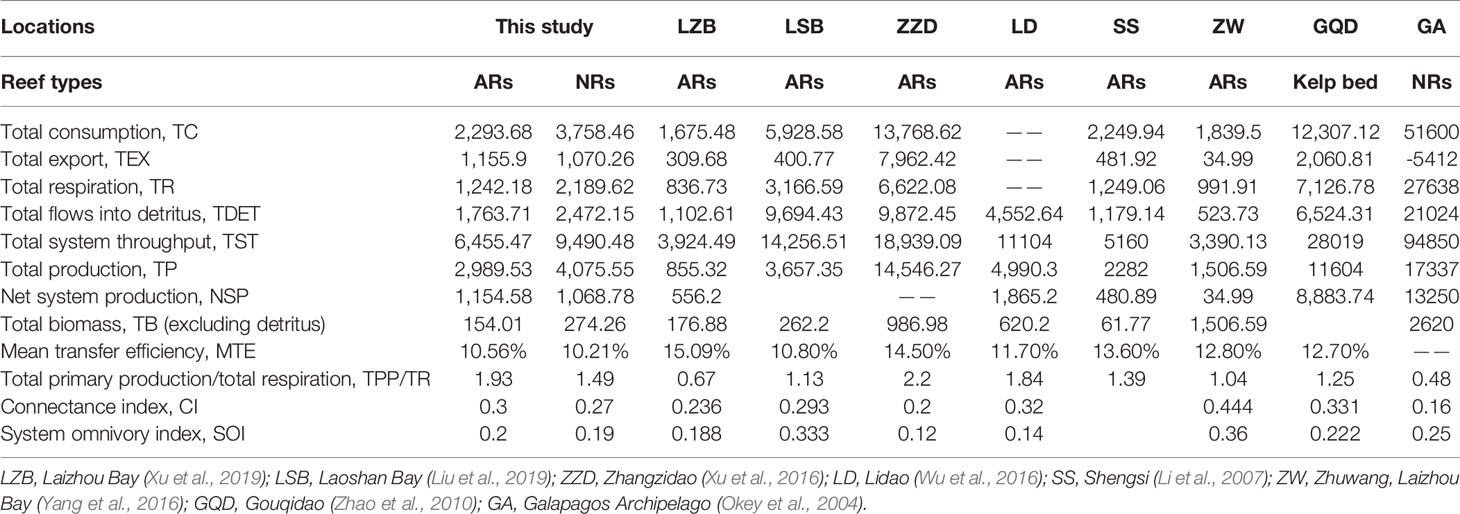
Table 4 Comparisons of ecosystem attributes estimated by balanced Ecopath model between the nearshore artificial reef (AR) and the natural reef (NR) in Yellow Sea, China, and other costal reef areas.
3.2 Trophic Levels and Energy Distribution
In each balanced model, the highest TL emerged in S. schlegelii (3.94 and 3.96 in the artificial and natural systems, respectively) among fish groups, followed by H. otakii (3.70 and 3.74 in the artificial and natural reef systems, respectively). Similarly, Cephalopods displayed the highest TL among invertebrates, with 3.72 and 3.71 in the artificial and natural models, respectively. Overall, the biomass at both reef types complies with the “pyramid” law, where low TL species accounted for a large portion, and the biomass reduced gradually with increasing TL (Figure 3).
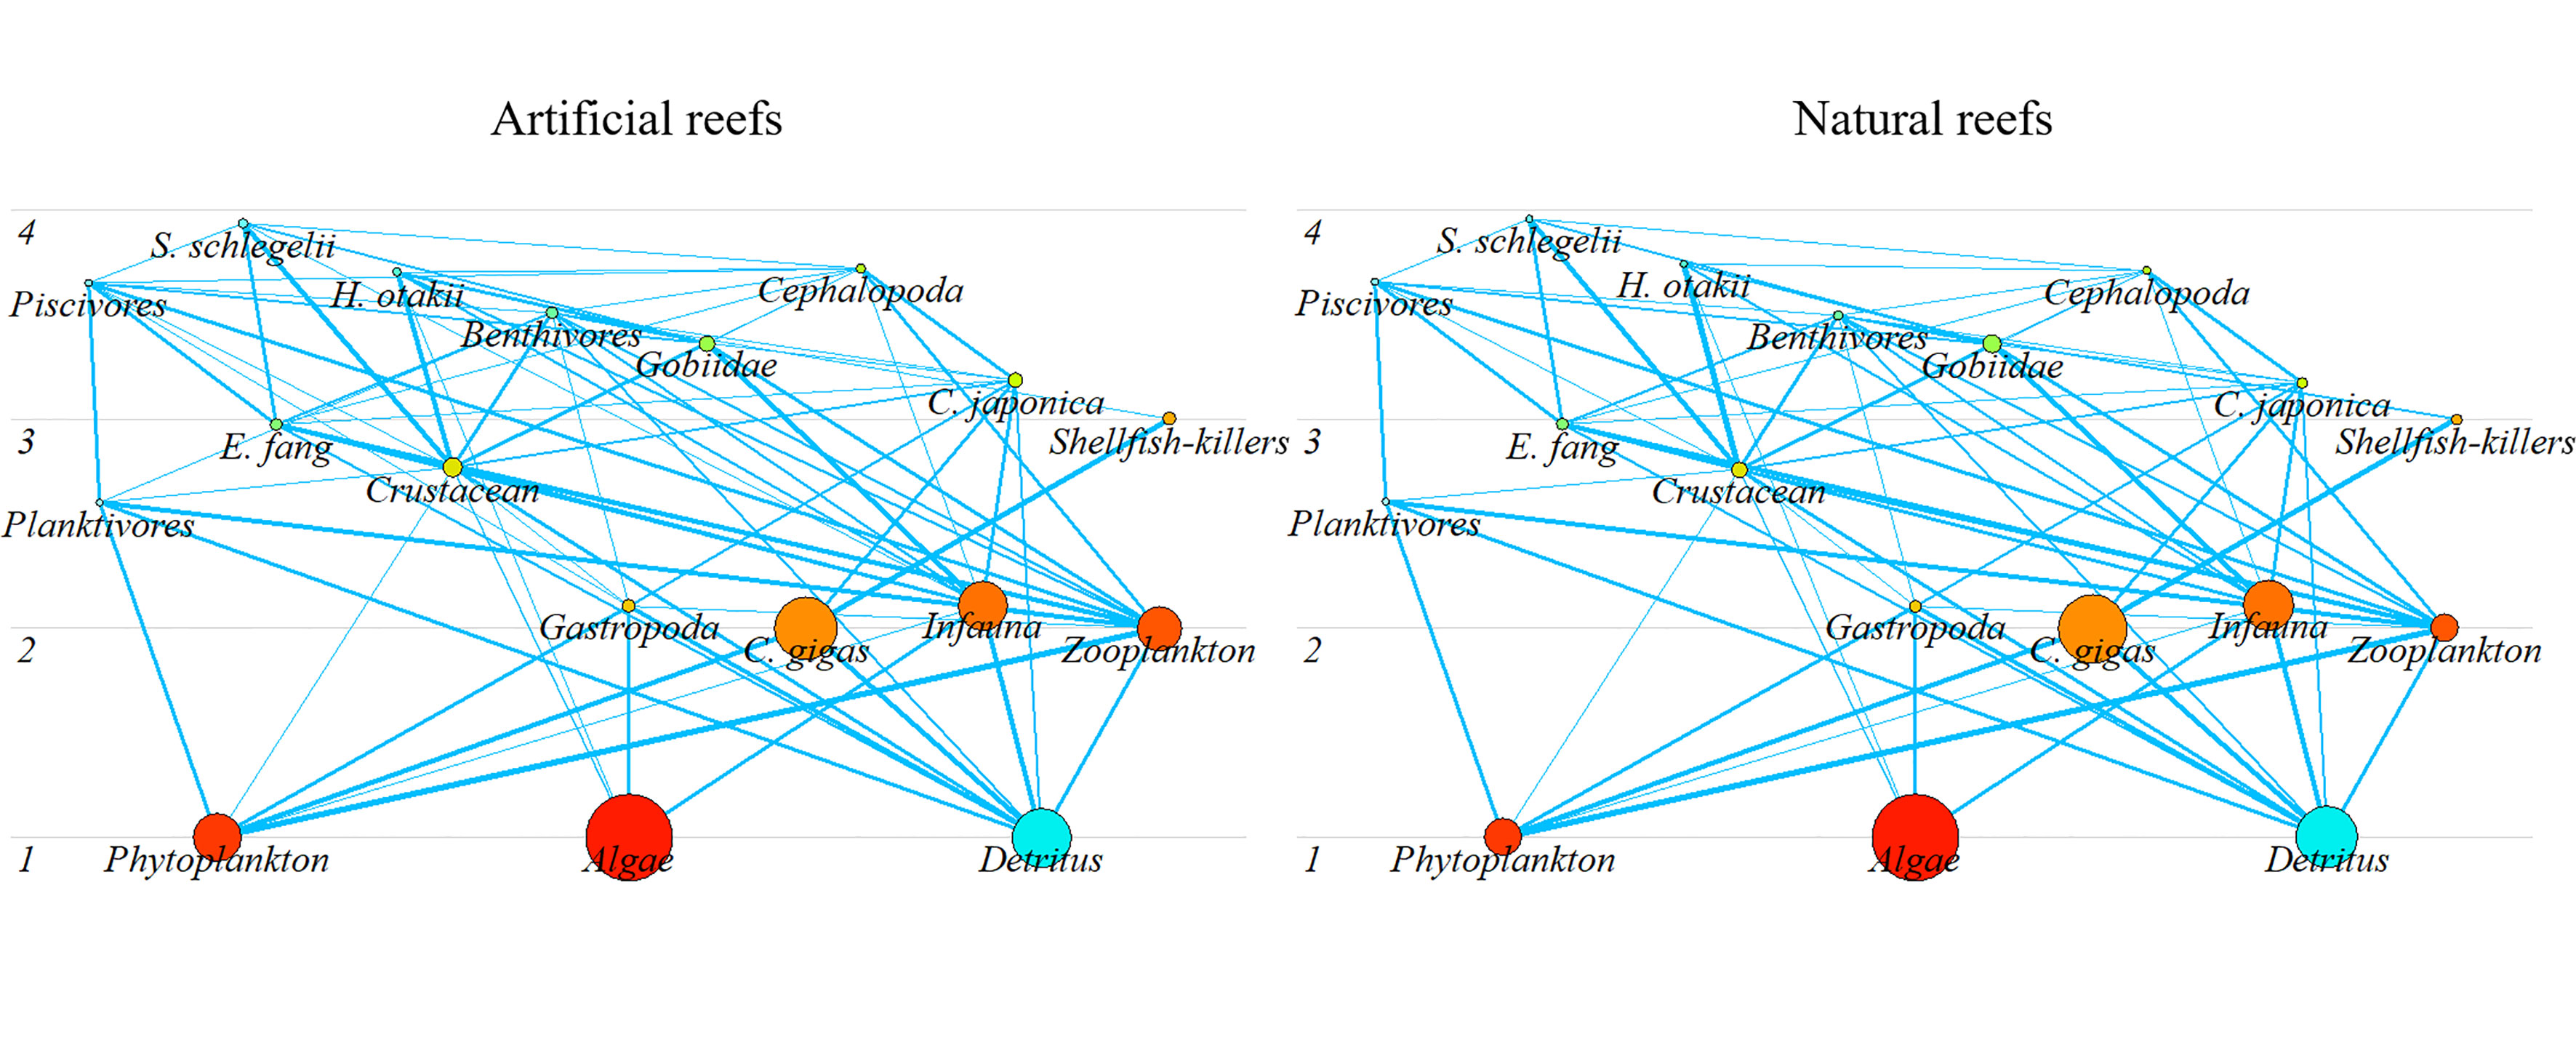
Figure 3 Trophic structure of the artificial and natural reef ecosystems on the coast of Yellow Sea, China. Circle size represents the biomass proportion.
Energy flows in both models were derived directly from detritus or indirectly from primary production by detritus- or grazing-based food chains, respectively (Figure 3). The majority of energy flows converged between integrated TLs I, II, and III for each reef system, collectively accounting for over 95% of TST for both cases (Figure 4). The total energy flowing into the detritus was 1,484 and 1,932 t·km−2·year−1 in the artificial and natural systems, respectively, to which principally contributed by primary producers (55.25% and 57.03% in artificial and natural models, respectively) and TL II taxa (43.7% and 41.46% in artificial and natural models, respectively), mainly zooplankton and benthic invertebrates. The TPP of artificial and natural systems was 2,396.8 and 3,258.4 t·km−2·year−1, respectively, of which 65.8% and 66.16% flow into TL II, respectively. Besides, the consumption of detritus by TL II was also high in each model (Figure 4).
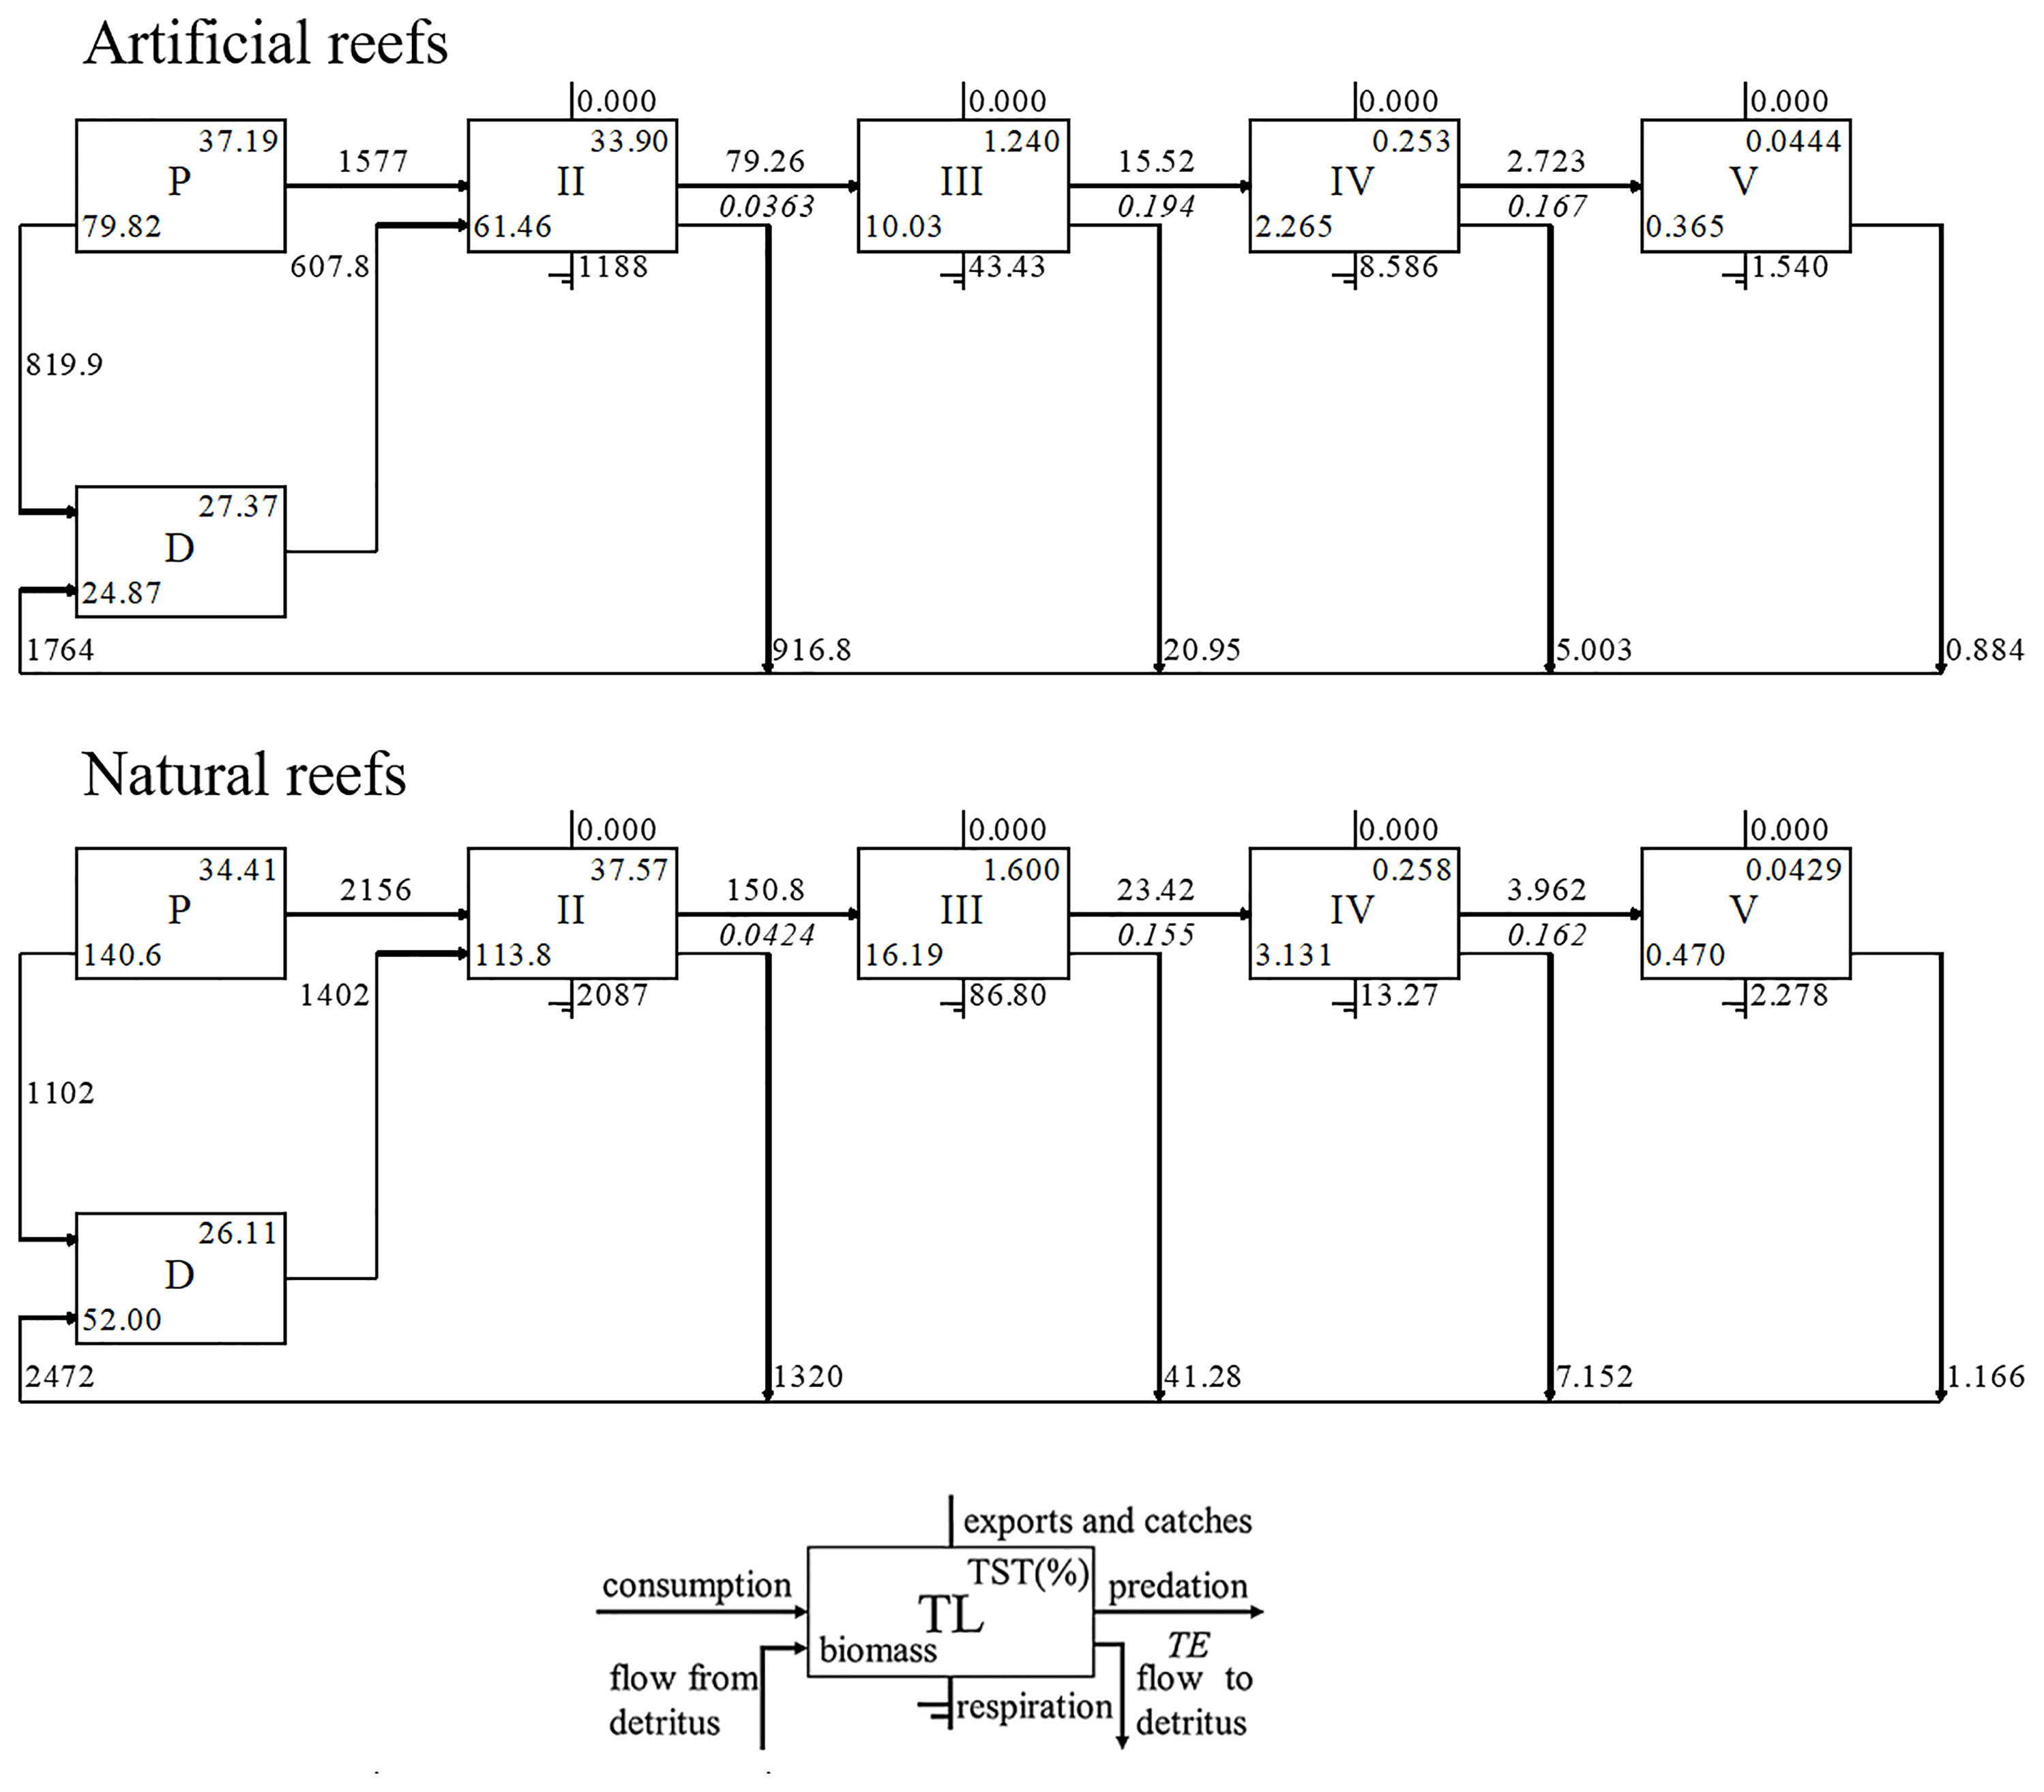
Figure 4 Lindeman spine diagram at the artificial and natural reef ecosystems on the coast of Yellow Sea, China.
Overall, the MTE in the artificial model (10.56%) was similar to that in the natural system (10.21%), both of which were in proximity to the desired Lindeman efficiency of 10% (Lindeman, 1991). In the natural system, the MTE from the detritus (10.36%) was nearly the same as that of primary producers (10.11%), but in the artificial system, the MTE from the detritus (9.86%) was lower than that from the primary producers (12.03%). Moreover, the highest transfer efficiency from primary producers (19.26%) and detritus (19.64%) occurred in TL III in the artificial model, while these two parameters (16.23% and 16.28%, respectively) peaked at TL IV in the natural model.
3.3 Mixed Trophic Impact Analysis
Direct and indirect trophic interactions in both systems are revealed based on MTI analysis (Figure 5). Overall, the bait groups had positive effects on their predators, while the predator groups posed a direct or indirect negative effect on other groups, such as the planktonic group and piscivorous group, E. fangi and S. schlegelii. The diagonal line indicating negative effects also represents the interspecific competition in diet (Figure 5). No significant correlation was detected between two top predators, S. schlegelii and H. otakii, indicating that there is no fierce predation or competition between them. Moreover, as basal food sources, the algae, phytoplankton, and detritus displayed positive impacts on most functional groups.
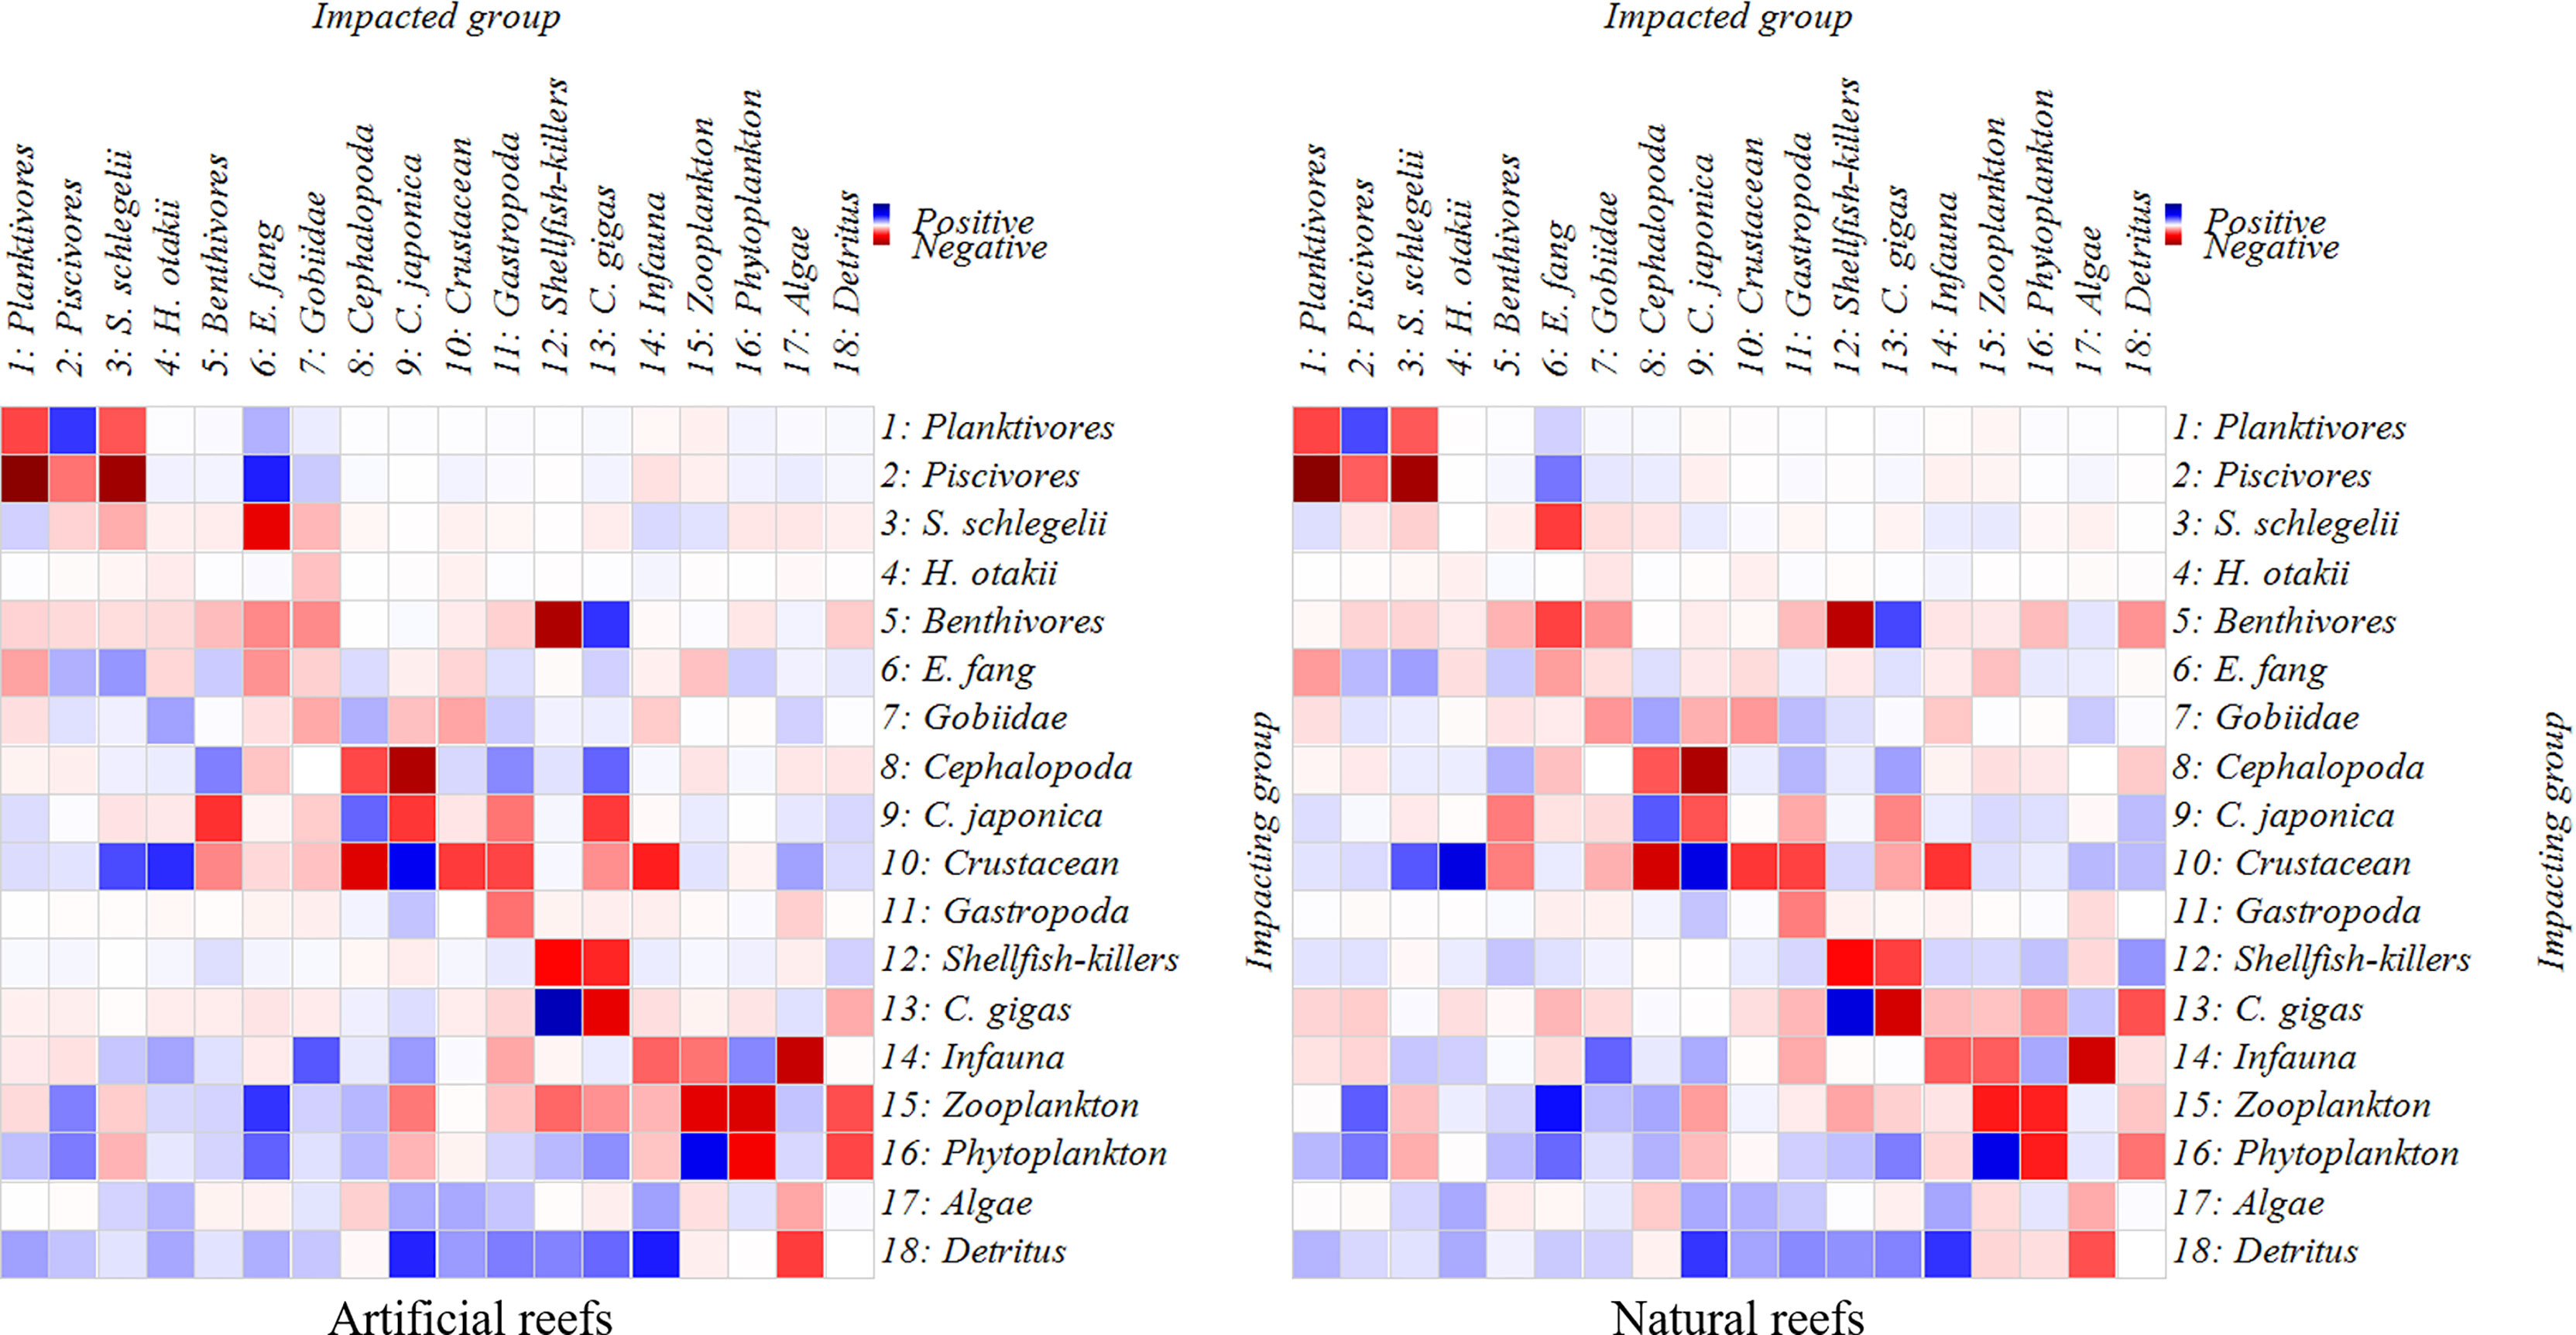
Figure 5 Mix trophic impacts analysis for the artificial and natural reef ecosystems on the coast of Yellow Sea, China. Positive impacts are denoted in blue rectangles while negative impacts in red rectangles, and the color concentration represents the impact strength.
4 Discussion
4.1 Model Quality Evaluation
The Ecopath model synthesizes existing knowledge into a quantitative relationship that explains the overall ecosystem functioning and allows comparisons of organic matter input and transfer along with the food-web dynamics between the artificial and natural systems. The p-values in each model were not at a very high level, implying that our models may be not sufficiently time-sensitive and that the applicability of the conclusions still needs the supplement of new empirical data. Due to the limitations of geographical conditions in situ and the restrictions on sampling methods (for instance, the scattered fishing activities in the local area made the fishery catches hard to estimate; the bottom trawling could only be executed in an adjacent area other than in reef area), the model precision is unguaranteed generally. Furthermore, uncertainties in input parameters (e.g., dietary composition, P/B, and Q/B) for some functional groups also increased the difficulties in the model construction. To overcome the disadvantages, we kept consistent the survey methods, sampling time, and post-data processing procedures at both reef types during the model construction to guarantee that the “distortion” degree in the two models is comparable. As this study aimed to emphasize the comparison of energy flow characteristics, detecting the “potential gap” on the same parameters to reflect the difference in structure and function between two types of reef systems was more underlined. Insufficiency or difficulties in quantifying the biological resource also indicate new requirements for future research in reef areas, where optimizing the experimental plan and improving survey methods should be paid more attention.
4.2 Overall System Characteristics
Both types of reef ecosystems were characterized by high biomass of algae, filter-feeding shellfish (C. gigas), and crustaceans (Table 2). The dominance of consumers with lower TLs probably results from the high productivity and standing crop of benthic macroalgae in each area, which has also been documented previously in other coastal systems (Okey et al., 2004; Wu et al., 2016). As representing organisms in reef areas, S. schlegelii and H. otakii occupied the top two positions in biomass and TLs in both models, which once again confirms that the artificial reefs could support the aggregation of reef fishes (Streich et al., 2017; Cresson et al., 2019).
The TPP of the artificial reef system was lower relative to its natural counterpart, generally indicating that there remains plenty of scope for the artificial ecosystem in scale. Apart from the disparity of the development duration, this can be explained by the smaller area of the artificial reef, supporting less colonization of sessile filter feeders (e.g., C. gigas) and benthic micro- and macroalgae when compared to the natural reef. Additionally, man-made modules were arranged in a regular manner, leading to a more homogeneous habitat. This pattern may only attract reef-associated species and will confine the development of the biodiversity even if the whole ecosystem has been formed for a long term. Previous studies have also implied that other conservation actions could impact the development of the artificial reef, such as establishing marine protected areas and reducing overfishing and unsustainable fishing practices (Baine, 2001; Lima et al., 2019). Hence, long-term monitoring in conjunction with conservation actions is advised to estimate the scale of developing the artificial reef.
Compared with other identical reef ecosystems in China and Galapagos, Ecuador (Table 4), the scales of both artificial and natural reef systems in this study stay at a medium level, with the TPPs merely higher than those of Laizhou Bay (Xu et al., 2019) and Shengsi (Li et al., 2007) but lower than those of Laoshan Bay (Liu et al., 2019), Zhangzidao (Xu et al., 2016), Zhuwang, Laizhou Bay (Yang et al., 2016), Lidao (Wu et al., 2016), Gouqidao (Zhao et al., 2010), and Galapagos Archipelago (Okey et al., 2004). The aforementioned differences can be explained by the spatial heterogeneity of the ecological environment in different study areas, where the nutrient richness, current condition, and chlorophyll-a content would directly affect the primary productivity, while differences in the substrate environment may also cause geographical differences in community structures (Mills et al., 2017). In addition, differences in data collection and model debugging during the model building could also be non-negligible factors.
4.3 Energy Flow and Transfer Efficiency Between Trophic Levels
The overall energy flow distribution showed a gradual decrease from low TL to high TL, which is in line with the energy “pyramid” principle. Both the intake proportion of TL I and the TPP proportion of TL I and II in the two models were high, indicating that low TLs composed mainly of macroalgae, phytoplankton, and detritus are the main energy sources in both reef ecosystems. Based on the energy proportion of each TL flowing into the detritus, both TL I and TL II were underutilized, while those above were more utilized for each case, which is in agreement with the conclusion that the detritus-based pathway dominates in the temperate reef ecosystem (Pinkerton et al., 2008). Energy derived from TLs I and II was blocked up to the classical food chain, which probably is attributed to the insufficient biomass of consumers. For example, grazing groups (such as sea urchins and abalone) in both areas were nearly absent, which cannot effectively transfer the amount of primary productivity to the next TL directly.
Studies have found that a considerable part of macroalgae will decay and settle on the seafloor, which will firstly be decomposed by bacteria and then enter the debris channel to provide energy for other TLs indirectly (Schaal et al., 2010). According to Krumhansl and Scheibling (2012), the global average rate of detritus derived from kelps accounts for ca. 82% of the annual kelp productivity. As the energy of TL I flowing to the detritus is lower in the artificial system than in the natural system here, this is probably related to the spatial difference in algae provision. Overall, the natural reef covers a larger area than the artificial reef and may across multiple water columns, thus facilitating the colonization and growth of more macroalgae. Alternatively, the natural reef area is located near an island, where abundant algae detritus in the intertidal zone would inevitably flow into the natural system and provides significant energy subsidies for the enhancement of benthos stock. Conversely, most of the reef structures were deployed at a depth of no less than 15 m, where sunshine penetration was lower, thus weakening the production of algae. Furthermore, the surroundings of the artificial reef featured sediment mixed with sand, and the external input of detritus was lower.
Based on Figure 4, we observed that the highest transfer efficiency occurred differently in both reef ecosystems. The highest transfer efficiency in the artificial reef occurred in TL III, above which the transfer efficiency went down dramatically. This reflects the pivotal roles of invertebrates, especially crustaceans and other functional groups with low TLs, in the artificial reef food web. In contrast, the highest transfer efficiency went to the TL IV in the natural reef, indicating that higher TLs still had an obvious regulation on the food web. This difference is probably related to the development time of the ecosystem. For a newly established ecosystem, the ecosystem functioning depends on the phase of community succession, which means the network of energy, nutrients, and organic matter fluxes will be incomplete prior to the community being mature, and this process always undergoes long periods. Previous studies have observed that artificial reefs with similar structural features supported fish communities similar to those found on natural reefs, after several years’ deployment (Perkol-Finkel et al., 2006; Granneman and Steele, 2015; Paxton et al., 2020). However, the recovery of the community metrics does not mean a function recovery, since the latter will take more time than the former (James et al., 2020). The geographical difference could be another reason for the difference above. For instance, the hydrological condition and the complexity of substrate structure would impose on the habitat diversity, which will have an effect on the biodiversity and the ecosystem functions at last. The average transfer efficiency in both natural and artificial reef systems was similar to the Lindeman efficiency (10%) (Lindeman, 1942) and the average result from 48 global aquatic ecosystems (10.1%) (Pauly and Christensen, 1995), and this result suggests not only the characteristics of temperate coastal ecosystems but also the overall health of both reef ecosystems in energy flow.
4.4 System Maturity and Stability
Usually, the TPP/TR ratio is used to indicate the maturity of an ecosystem (Odum, 1969). As one of the principal features of mature ecosystems, TPP/TR close to 1 implies that all primary production is used for respiration with no residual production left. In the early stage of an ecosystem, TPP/TR ratio tends to be greater than 1, because the structure of the food web’s incomplete, and the primary production cannot be fully utilized. Later on, the ecosystem gets fully matured with the development of the system when the TB tends to be the maximum, and the corresponding TPP/TR ratio will get smaller. In the current study, the TPP/TR ratio in natural and artificial reef systems was slightly higher than that in Zhuwang, Laizhou Bay (Yang et al., 2016), Shengsi (Li et al., 2007), and Laoshan Bay (Liu et al., 2019) when compared to other similar ecosystems with parallel latitudes, reflecting the maturity difference caused by spatial and temporal variation. CI and SOI are indices elucidating the ecosystem complexity, as their higher values indicate more complex population interactions. Here, the CI and SOI values in the artificial reef system were slightly higher than those in the natural reef system and were not significantly different from other ecosystems with identical latitudes. Therefore, it can be concluded that excess production can be reutilized in artificial systems than its natural counterpart. This indicates that the artificial reef system is less mature than the natural reef, even though it has formed a relatively complex interspecific relationship and high stability. Using the Ecopath model, Pitcher et al. (2002) proposed that it would take 10 to 25 years for artificial reefs to have a significant positive effect on local biological resources, and they highlighted the necessity to extend the fishing moratorium to magnify the post-reef effect. In the present study, the artificial reef is less than 10 years old, and the changes in ecological functions of which during the developing time still need to be further tracked and monitored. On the other hand, we notice that the natural reef system seemed to be inadequate compared to other ecosystems with parallel latitudes in terms of maturity (Table 4). This could be owing to the marine aquaculture and other fishery activities around the natural reefs, which would probably interfere with the normal ecosystem functioning and weaken its maturity if the variation was not caused by geographical heterogeneity. This also reminds us to strengthen the restoration and protection of islands and reefs in the future, by regulating the development and utilization activities, to maintain or restore their original ecological functions gradually.
Our work compares the system characteristics including trophic structures and energy flow between the artificial and natural reef ecosystems. However, regional‐scale heterogeneity in initial environment characteristics (e.g., currents, nutrients, and terrigenous inputs) was not included here due to inadequate data recording, which may interfere with the comparison and weaken the robustness of conclusions. Theoretically, comparisons between two types of reefs should be performed in areas with comparable environmental conditions initially, to underscore the ecosystem changes in situ with the deployed ages of artificial reefs. Yet areas with optimal conditions are hard to find practically, which probably explains why studies of interest are relatively few. With results of the present study as a base, future work on artificial reefs could be directed toward a better data recording prior to and after artificial reef projects, to provide more information about not only the successional process of biota communities but also more complete trajectories of the ecosystem functioning development.
5 Conclusions
With the establishment of Ecopath models at two types of the reef on the coast of the Yellow Sea, China, this study performed comparisons of trophic structure and energy flow between artificial and natural reef systems. The TPP was estimated to be lower in the artificial system than in the natural reef system, indicating that there is still development potential for the artificial reef. A large proportion of energy was occupied by medium and low TLs in each system, reflecting that the primary production (macroalgae and phytoplankton) and detritus were the main energy sources driving both systems, and the detritus-based channel played a dominant role. Both systems were highly consistent in terms of the energy transfer efficiency, which was close to the Lindeman efficiency (10%), reflecting the good operation of the energy flow for both reef systems. Moreover, the models estimated that there is still a gap between the artificial and natural systems with regard to maturity, but the former has developed relatively complex interspecific interaction and high stability.
Data Availability Statement
The original contributions presented in the study are included in the article/supplementary materials, further inquiries can be directed to the corresponding authors.
Author Contributions
RZ: formal analysis and original draft writing. QZ and JZ: writing—review and editing. ZW: data curation and validation. HL and LS: funding acquisition and writing—review and editing. YL, QL, YT, and JZ: writing—review and editing.
Conflict of Interest
The authors declare that the research was conducted in the absence of any commercial or financial relationships that could be construed as a potential conflict of interest.
Publisher’s Note
All claims expressed in this article are solely those of the authors and do not necessarily represent those of their affiliated organizations, or those of the publisher, the editors and the reviewers. Any product that may be evaluated in this article, or claim that may be made by its manufacturer, is not guaranteed or endorsed by the publisher.
Acknowledgments
This research was jointly supported by the Strategic Pilot Project of Chinese Academy of Sciences (XDA23050303), National Natural Science Foundation of China (41806150), and the Youth Innovation PromotionAssociation, Chinese Academy of Sciences (No. 2019216). We also address special thanks to those who gave supports in field surveys and laboratory works, provided suggestions for data analysis, or facilitated access to the paper writing.
References
Abdou K., Le Loc’h F., Gascuel D., Romdhane M. S., Aubin J., Ben RaisLasram F., et al. (2020). Combining Ecosystem Indicators and Life Cycle Assessment for Environmental Assessment of Demersal Trawling in Tunisia. Int. J. Life Cycle Ass. 25, 105–119. doi: 10.1007/s11367-019-01651-5
Baine M. (2001). Artificial Reefs: A Review of Their Design, Application, Management and Performance. Ocean. Coast. Manag. 44, 241–259. doi: 10.1016/S0964-5691(01)00048-5
Bohnsack J. A. (1989). Are High-Densities of Fishes at Artificial Reefs the Result of Habitat Limitation or Behavioral Preference. B Mar. Sci. 44, 631–645. doi: 10.1515/botm.1989.32.2.181
Brickhill M. J., Lee S. Y., Connolly R. M. (2005). Fishes Associated With Artificial Reefs: Attributing Changes to Attraction or Production Using Novel Approaches. J. Fish. Biol. 67, 53–71. doi: 10.1111/j.0022-1112.2005.00915.x
Christensen V. (1995). Ecosystem Maturity — Towards Quantification. Ecol. Modell. 77, 3–32. doi: 10.1016/0304-3800(93)E0073-C
Christensen V., Walters C. J. (2004). Ecopath With Ecosim: Methods, Capabilities and Limitations. Ecol. Modell. 172, 109–139. doi: 10.1016/j.ecolmodel.2003.09.003
Christensen V., Walters C. J., Pauly D., et al. (2008). Ecopath With Ecosim Version 6 User Guide Vancouver, Canada: Fisheries Center Univ. of BritishColumbia, p. 1–235.
Colléter M., Valls A., Guitton J., Gascuel D., Pauly D., Christensen V., et al. (2015). Global Overview of the Applications of the Ecopath With Ecosim Modeling Approach Using the EcoBase Models Repository. Ecol. Modell. 302, 42–53. doi: 10.1016/j.ecolmodel.2015.01.025
Cresson P., Le Direach L., Rouanet E., Goberville E., Astruch P., Ourgaud M., et al. (2019). Functional Traits Unravel Temporal Changes in Fish Biomass Production on Artificial Reefs. Mar. Environ. Res. 145, 137–146. doi: 10.1016/j.marenvres.2019.02.018
Finn J. T. (1976). Measures of Ecosystem Structure and Function Derived From Analysis of Flows. J. Theor. Biol. 56, 363–380. doi: 10.1016/S0022-5193(76)80080-X
Granneman J. E., Steele M. A. (2015). Effects of Reef Attributes on Fish Assemblage Similarity Between Artificial and Natural Reefs. Ice. J. Mar. Sci. 72, 2385–2397. doi: 10.1093/icesjms/fsv094
Heymans J. J., Coll M., Link J. S., Mackinson S., Steenbeek J., Walters C., et al. (2016). Best Practice in Ecopath With Ecosim Food-Web Models for Ecosystem-Based Management. Ecol. Modell. 331, 173–184. doi: 10.1016/j.ecolmodel.2015.12.007
James W. R., Lesser J. S., Litvin S. Y., Nelson J. A. (2020). Assessment of Food Web Recovery Following Restoration Using Resource Niche Metrics. Sci. Tot. Env. 711, 134801. doi: 10.1016/j.scitotenv.2019.134801
Krumhansl K. A., Scheibling R. E. (2012). Production and Fate of Kelp Detritus. Mar. Ecol. Prog. Ser. 467, 281–302. doi: 10.3354/meps09940
Latham L. G. (2006). Network Flow Analysis Algorithms. Ecol. Modell. 192, 586–600. doi: 10.1016/j.ecolmodel.2005.07.029
Lee S. I., Zhang C. I. (2018). Evaluation of the Effect of Marine Ranching Activities on the Tongyeong Marine Ecosystem. Ocean. Sci. J. 53, 557–582. doi: 10.1007/s12601-018-0045-8
Libralato S. (2013). System Omnivory Index. Encycloped. Ecol. 4, 3472–3477. doi: 10.1016/B978-0-12-409548-9.00605-9
Lima J. S., Zalmon I. R., Love M. (2019). Overview and Trends of Ecological and Socioeconomic Research on Artificial Reefs. Mar. Environ. Res. 145, 81–96. doi: 10.1016/j.marenvres.2019.01.010
Lindeman R. L. (1942). The Trophic-Dynamic Aspect of Ecology. Ecology. 23, 399–418. doi: 10.2307/1930126
Lindeman R. L. (1991). The Trophic-Dynamic Aspect of Ecology. Bull. Math. Biol. 53, 167–191. doi: 10.1016/S0092-8240(05)80045-X
Liu H. Y., Yang C. J., Zhang P. D., Li W. T., Zhang X. M. (2019). An Ecopath Evaluation of System Structure and Function for the Laoshan Bay Artificial Reef Zone Ecosystem. Acta Ecol. Sinica. 39, 3926–3936. doi: 10.5846/stxb201805301193
Liu Y., Zhao Y. P., Dong G. H., Guan C. T., Cui Y., Xu T. J. (2013). A Study of the Flow Field Characteristics Around Star-Shaped Artificial Reefs. J. Fluid. Struct. 39, 27–40. doi: 10.1016/j.jfluidstructs.2013.02.018
Li Y. G., Wang Z. H., Zhang S. Y. (2007). A Prelmi Inary Approach on the Ecosystem Model of the Artificial Reef in Shengsi. Mar. Fish. 29, 226–234. doi: 10.3969/j.issn.1004-2490.2007.03.006
McCauley D. J., Pinsky M. L., Palumbi S. R., Estes J. A., Joyce F. H., Warner R. R. (2015). Marine Defaunation: Animal Loss in the Global Ocean. Science. 347, 1255641. doi: 10.1126/science.1255641
Mills K. A., Hamer P. A., Quinn G. P. (2017). Artificial Reefs Create Distinct Fish Assemblages. Mar. Ecol. Prog. Ser. 585, 155–173. doi: 10.3354/meps12390
Morissete L., Hammill M. O., Savenkoff C. (2006). The Trophic Role of Marine Mammals in the Northern Gulf of StLawrence. Mar. Mamm. Sci. 22, 74–103. doi: 10.1111/j.1748-7692.2006.00007.x
Nicoletti L., Marzialetti S., Paganelli D., Ardizzone G.D. (2007). Long-Term Changes in a Benthic Assemblage Associated With Artificial Reefs. Hydrobiologia. 580, 233–240. doi: 10.1007/s10750-006-0450-3
Odum E. P. (1969). The Strategy of Ecosystem Development. Science. 164, 262–270. doi: 10.1126/science.164.3877.262
Okey T. A., Banks S., Born A. R., Bustamante R. H., Calvopina M., Edgar G. J., et al. (2004). A Trophic Model of a Galapagos Subtidal Rocky Reef for Evaluating Fisheries and Conservation Strategies. Ecol. Modell. 172, 383–401. doi: 10.1016/j.ecolmodel.2003.09.019
Ortiz M., Berrios F., Campos L., Uribe R., Ramirez A., Hermosillo-Núñez B., et al. (2015). Mass Balanced Trophic Models and Short-Term Dynamical Simulations for Benthic Ecological Systems of Mejillones and Antofagasta Bays (SE Pacific): Comparative Network Structure and Assessment of Human Impacts. Ecol. Modell. 309-310, 153–162. doi: 10.1016/j.ecolmodel.2015.04.006
Ouyang L. J., Guo X. W. (2010). Studies on the Q/B Values and Food Consumption of Major Fishes in the East China Sea and the Yellow Sea. Prog. Fish. Sci. 31, 23–29.
Pauly D., Christensen V. (1995). Primary Production Required to Sustain Global Fisheries. Nature. 374, 255–257. doi: 10.1038/374255a0
Paxton A. B., Shertzer K. W., Bacheler N. M., Kellison G. T., Riley K. L., Taylor J. C. (2020). Meta-Analysis Reveals Artificial Reefs can be Effective Tools for Fish Community Enhancement But Are Not One-Size-Fits-All. Front. Mar. Sci. 7, 282. doi: 10.3389/fmars.2020.00282
Perkol-Finkel S., Shashar N., Benayahu Y. (2006). Can Artificial Reefs Mimic Natural Reef Communities? The Roles of Structural Features and Age. Mar. Environ. Res. 61, 121–135. doi: 10.1016/j.marenvres.2005.08.001
Pinkerton M. H., Lundquist C. J., Duffy C. A. J., Freeman D. J. (2008). Trophic Modelling of a New Zealand Rocky Reef Ecosystem Using Simultaneous Adjustment of Diet, Biomass and Energetic Parameters. J. Exp. Mar. Biol. Ecol. 367, 189–203. doi: 10.1016/j.jembe.2008.09.022
Pitcher T. J., Buchary E. A., Hutton T. (2002). Forecasting the Benefits of No-Take Human-Made Reefs Using Spatial Ecosystem Simulation. Ice. J. Mar. Sci. 59, S17–S26. doi: 10.1006/jmsc.2002.1185
Polovina J. J. (1984). Model of a Coral-Reef Ecosystem. Coral. Reef. 3, 1–11. doi: 10.1007/Bf00306135
Raj K. D., Mathews G., Edward J. K. P. (2020). Long-Term Benefits of Artificial Reef Modules for Reef Recovery in Gulf of Mannar, Southeast India. J. Coast. Conserv. 24, 53. doi: 10.1007/s11852-020-00773-5
Reed J., Shannon L., Velez L., Akoglu E., Bundy A., Coll M., et al. (2017). Ecosystem Indicators—Accounting for Variability in Species’ Trophic Levels. Ice. J. Mar. Sci. 74, 158–169, fsw150. doi: 10.1093/icesjms/fsw150
Sandu C., Iacob R., Nicolescu N. (2003). Chlorophyll-A Determination - A Reliable Method for Phytoplankton Biomass Assessment. Acta Bot. Hung. 45, 389–397. doi: 10.1556/ABot.45.2003.3-4.13
Schaal G., Riera P., Leroux C. (2010). Trophic Ecology in a Northern Brittany (Batz Island, France) Kelp (Laminaria Digitata) Forest, as Investigated Through Stable Isotopes and Chemical Assays. J. Sea. Res. 63, 24–35. doi: 10.1016/j.seares.2009.09.002
Shin Y.-J., Shannon L. J. (2010). Using Indicators for Evaluating, Comparing, and Communicating the Ecological Status of Exploited Marine Ecosystems. 1. IndiSea. Proj. Ice. J. Mar. Sci. 67, 686–691. doi: 10.1093/icesjms/fsp273
Streich M. K., Ajemian M. J., Wetz J. J., Williams J. A., Shipley J. B., Stunz G.W. (2017). A Comparison of Size Structure, Age, and Growth of Red Snapper From Artificial and Natural Habitats in the Western Gulf of Mexico. T. Am. Fish. Soc 146, 762–777. doi: 10.1080/00028487.2017.1308884
Toledo M. I., Torres P., Diaz C., Zamora V., López J., Olivares G. (2020). Ecological Succession of Benthic Organisms on Niche-Type Artificial Reefs. Ecol. Proc. 9, 38. doi: 10.1186/s13717-020-00242-9
Ulanowicz R. E. (1986). Growth and Development: Ecosystems Phenomenology. New York, NY: Springer-Verlag, XF2006293306.11. doi: 10.2307/1351721
United Nations Environment Programme (2009). London Convention and Protocol/UNEP Guidelines for the Placement of Artificial Reefs (London: United Nations Environment Programme (UNEP).
Wu Z., Tweedley J. R., Loneragan N. R., Zhang X. (2019). Artificial Reefs Can Mimic Natural Habitats for Fish and Macroinvertebrates in Temperate Coastal Waters of the Yellow Sea. Ecol. Eng. 139, 105579. doi: 10.1016/j.ecoleng.2019.08.009
Wu Z., Zhang X., Lozano-Montes H. M., Loneragan N. R. (2016). Trophic Flows, Kelp Culture and Fisheries in the Marine Ecosystem of an Artificial Reef Zone in the Yellow Sea. Estuar. Coast. Shelf. Sci. 182, 86–97. doi: 10.1016/j.ecss.2016.08.021
Xu Z. X., Chen Y., Tian T., Liu Y. H., Yin Z. Q., Liu H. C. (2016). Structure and Function of an Artificial Reef Ecosystem in Zhangzi Island Based on Ecopath Model. J. Dalian. Ocean. Univ. 31, 85–94. doi: 10.16535/j.cnki.dlhyxb.2016.01.015
Xu M., Qi L., Zhang L., Zhang T., Yang H., Zhang Y. (2019). Ecosystem Attributes of Trophic Models Before and After Construction of Artificial Oyster Reefs Using Ecopath. Aquacult. Env. Interac. 11, 111–127. doi: 10.3354/aei00284
Yang J. M. (2001a). A Study on Food and Trophic Levels of Bohai Sea Fish. Modern. Fish. Info. 16, 10–19.
Yang J. M. (2001b). A Study on Food and Trophic Levels of Bohai Sea Invertebrates. Modern. Fish. Info. 16, 8–16. doi: 10.3969/j.issn.1004-8340.2001.09.002
Yang C. J., Wu Z. X., Liu H. Y., Zhang P. D., Li W. T., Zeng X.Q., et al. (2016). The Fishing Strategy of Charybdis Japonica and Rapana Venosa and the Carrying Capacity of Apostichopus Japonucus in Zhuwang, Laizhou Artificial Reef Ecosystems Based on Ecopath Model. Periodic. Ocean. Univ. China. 46, 168–177. doi: 10.16441/j.cnki.hdxb.20160112
Yu H., Yang W., Liu C., Tang Y., Song X., Fang G. (2020). Relationships Between Community Structure and Environmental Factors in Xixiakou Artificial Reef Area. J. Ocean. U. China. 19, 883–894. doi: 10.1007/s11802-020-4298-3
Zhang B. (2018). Feeding Ecology of Fishes in the Bohai Sea. Prog. Fish. Sci. 39, 11–22. doi: 10.19663/j.issn2095-9869.20171103001
Zhang B., Li Z. Y., Jin X. S. (2012). Functional Groups of Fish Assemblages and Their Major Species in the Bohai Sea. J. Fish. China. 36, 64–72. doi: 10.3724/SP.J.1231.2012.27617
Zhang R. L., Liu H., Zhang Q. Q., Zhang H., Zhao J. M. (2021a). Trophic Interactions of Reef-Associated Predatory Fishes (Hexagrammos Otakii and Sebastes Schlegelii) in Natural and Artificial Reefs Along the Coast of North Yellow Sea, China. Sci. Tot. Environ. 791, 148250. doi: 10.1016/j.scitotenv.2021.148250
Zhang R. L., Zhang H., Liu H., Zhao J. M. (2021b). Differences in Trophic Structure and Trophic Pathways Between Artificial Reef and Natural Reef Ecosystems Along the Coast of the North Yellow Sea, China, Based on Stable Isotope Analyses. Ecol. Indic. 125, 107476. doi: 10.1016/j.ecolind.2021.107476
Zhao J., Zhang S. Y., Xu M. (2010). The Primary Research of the Energy Flow in Gouqi Kelp Bed Ecosystem. J. Shanghai. Ocean. Univ. 19, 98–104.
Keywords: artificial reefs, natural reefs, Ecopath, trophic structure, energy flow
Citation: Zhang R, Zhang Q, Zhao J, Wu Z, Liu H, Shou L, Liao Y, Liu Q, Tang Y and Zeng J (2022) Using Ecopath Models to Explore Differences in Ecosystem Characteristics Between an Artificial Reef and a Nearby Natural Reef on the Coast of the North Yellow Sea, China. Front. Mar. Sci. 9:911714. doi: 10.3389/fmars.2022.911714
Received: 03 April 2022; Accepted: 12 April 2022;
Published: 11 May 2022.
Edited by:
Ying Xue, Ocean University of China, ChinaReviewed by:
Yunkai Li, Shanghai Ocean University, ChinaChongliang Zhang, Ocean University of China, China
Copyright © 2022 Zhang, Zhang, Zhao, Wu, Liu, Shou, Liao, Liu, Tang and Zeng. This is an open-access article distributed under the terms of the Creative Commons Attribution License (CC BY). The use, distribution or reproduction in other forums is permitted, provided the original author(s) and the copyright owner(s) are credited and that the original publication in this journal is cited, in accordance with accepted academic practice. No use, distribution or reproduction is permitted which does not comply with these terms.
*Correspondence: Hui Liu, aHVpbGl1QHlpYy5hYy5jbg==; Lu Shou, c2hvdWx1OTgxQHNpby5vcmcuY24=