 Jian Su
 Jens Murawski
 Jacob W. Nielsen
 Kristine S. Madsen
95% of researchers rate our articles as excellent or good
Learn more about the work of our research integrity team to safeguard the quality of each article we publish.
Find out more
ORIGINAL RESEARCH article
Front. Mar. Sci. , 18 October 2022
Sec. Coastal Ocean Processes
Volume 9 - 2022 | https://doi.org/10.3389/fmars.2022.910088
This article is part of the Research Topic Advances in Sea State Modeling and Climate Change Impacts View all 19 articles
In the future, shifts in wind storms across the North and Baltic Seas are highly unpredictable, challenging the projection of wave conditions for managing coastal hazards. Moreover, regional sea level rise (SLR), with very large uncertainty, complicates the situation for stakeholders seeking recommendations for climate adaptation plans. The purpose of this study is to examine the change of the storm surge and wind wave components of the water level due to climate change in a low tidal range Køge Bay near the entrance of the Baltic Sea. Under a high greenhouse gas emission scenario RCP8.5, we employed a regional climate model (HIRHAM) forced wave model (WAM) and focused on the wave model results during the “storm surge conditions” (exceeding 20 years storm surge events) and “stormy conditions” (exceeding 90th percentile of wave heights). We find that the change in both wave height and period in the future is negligible under “stormy conditions”. Nevertheless, under “storm surge conditions” when considering SLR, the simulated wave height is projected to double in the near future (mid-century) under RCP 8.5, and the wave period may also increase by about 1.5 seconds. This is because some high significant wave height events in the future are associated with the storm surge events when considering SLR. The findings suggest that the combined effects of mean sea level rise, storm surge and waves are likely to increase the risk to a bay with geography and exposure comparable to Køge Bay. As a result, the future plan for climate engineering protection should place a premium on the additional wave energy protection associated with storm surges.
As the mean sea level rises, high water level events along the coasts will become more frequent and intense, causing more damage. Water levels contain components that operate on a variety of temporal and spatial scales, such as the effects of sea level rise (SLR), tides, oceanic currents, storm surge, and locally generated wind waves (Woodworth et al., 2019). However, these components of sea level are highly variable on a regional and interannual basis. Thus, the earlier global evaluations of the dominant components are inapplicable to regional and local issues, as they are often based on global climate models (GCMs) with a relatively coarse spatial resolution (Muis et al., 2016; Morim et al., 2019; Lobeto et al., 2021). Multiple components frequently have a dominating role in a region, although this role changes depending on the coastline morphology and sea state features. As a result, projections of future coastal water levels and flooding should identify which processes are of leading order, and, where appropriate, local impact modeling is required to aid in the development of local climate adaption strategies (see review of those processes in Idier et al. (2019) and references therein). Our study area, the southern regions of the Copenhagen metropolitan area in Denmark, is vulnerable to future climate change, particularly sea level rise, because relatively small changes in the mean sea level would result in large changes in the return time of storm surge flooding at a given level (Ditlevsen et al., 2019; Su et al., 2021). According to a specialized research in the region (Hallegatte et al., 2011a; Hallegatte et al., 2011b; Jebens et al., 2016), sea level rise will dramatically increase flood risks in Copenhagen in the absence of adaptation (Figure 1), and the city has been designated as flood prone under the EU flood regulation (European Commission [EC], 2019). Furthermore, a number of studies provide evidence for positive projected trends in extreme wave events along the western European coast (Debernard and Røed, 2008; Grabemann and Weisse, 2008).
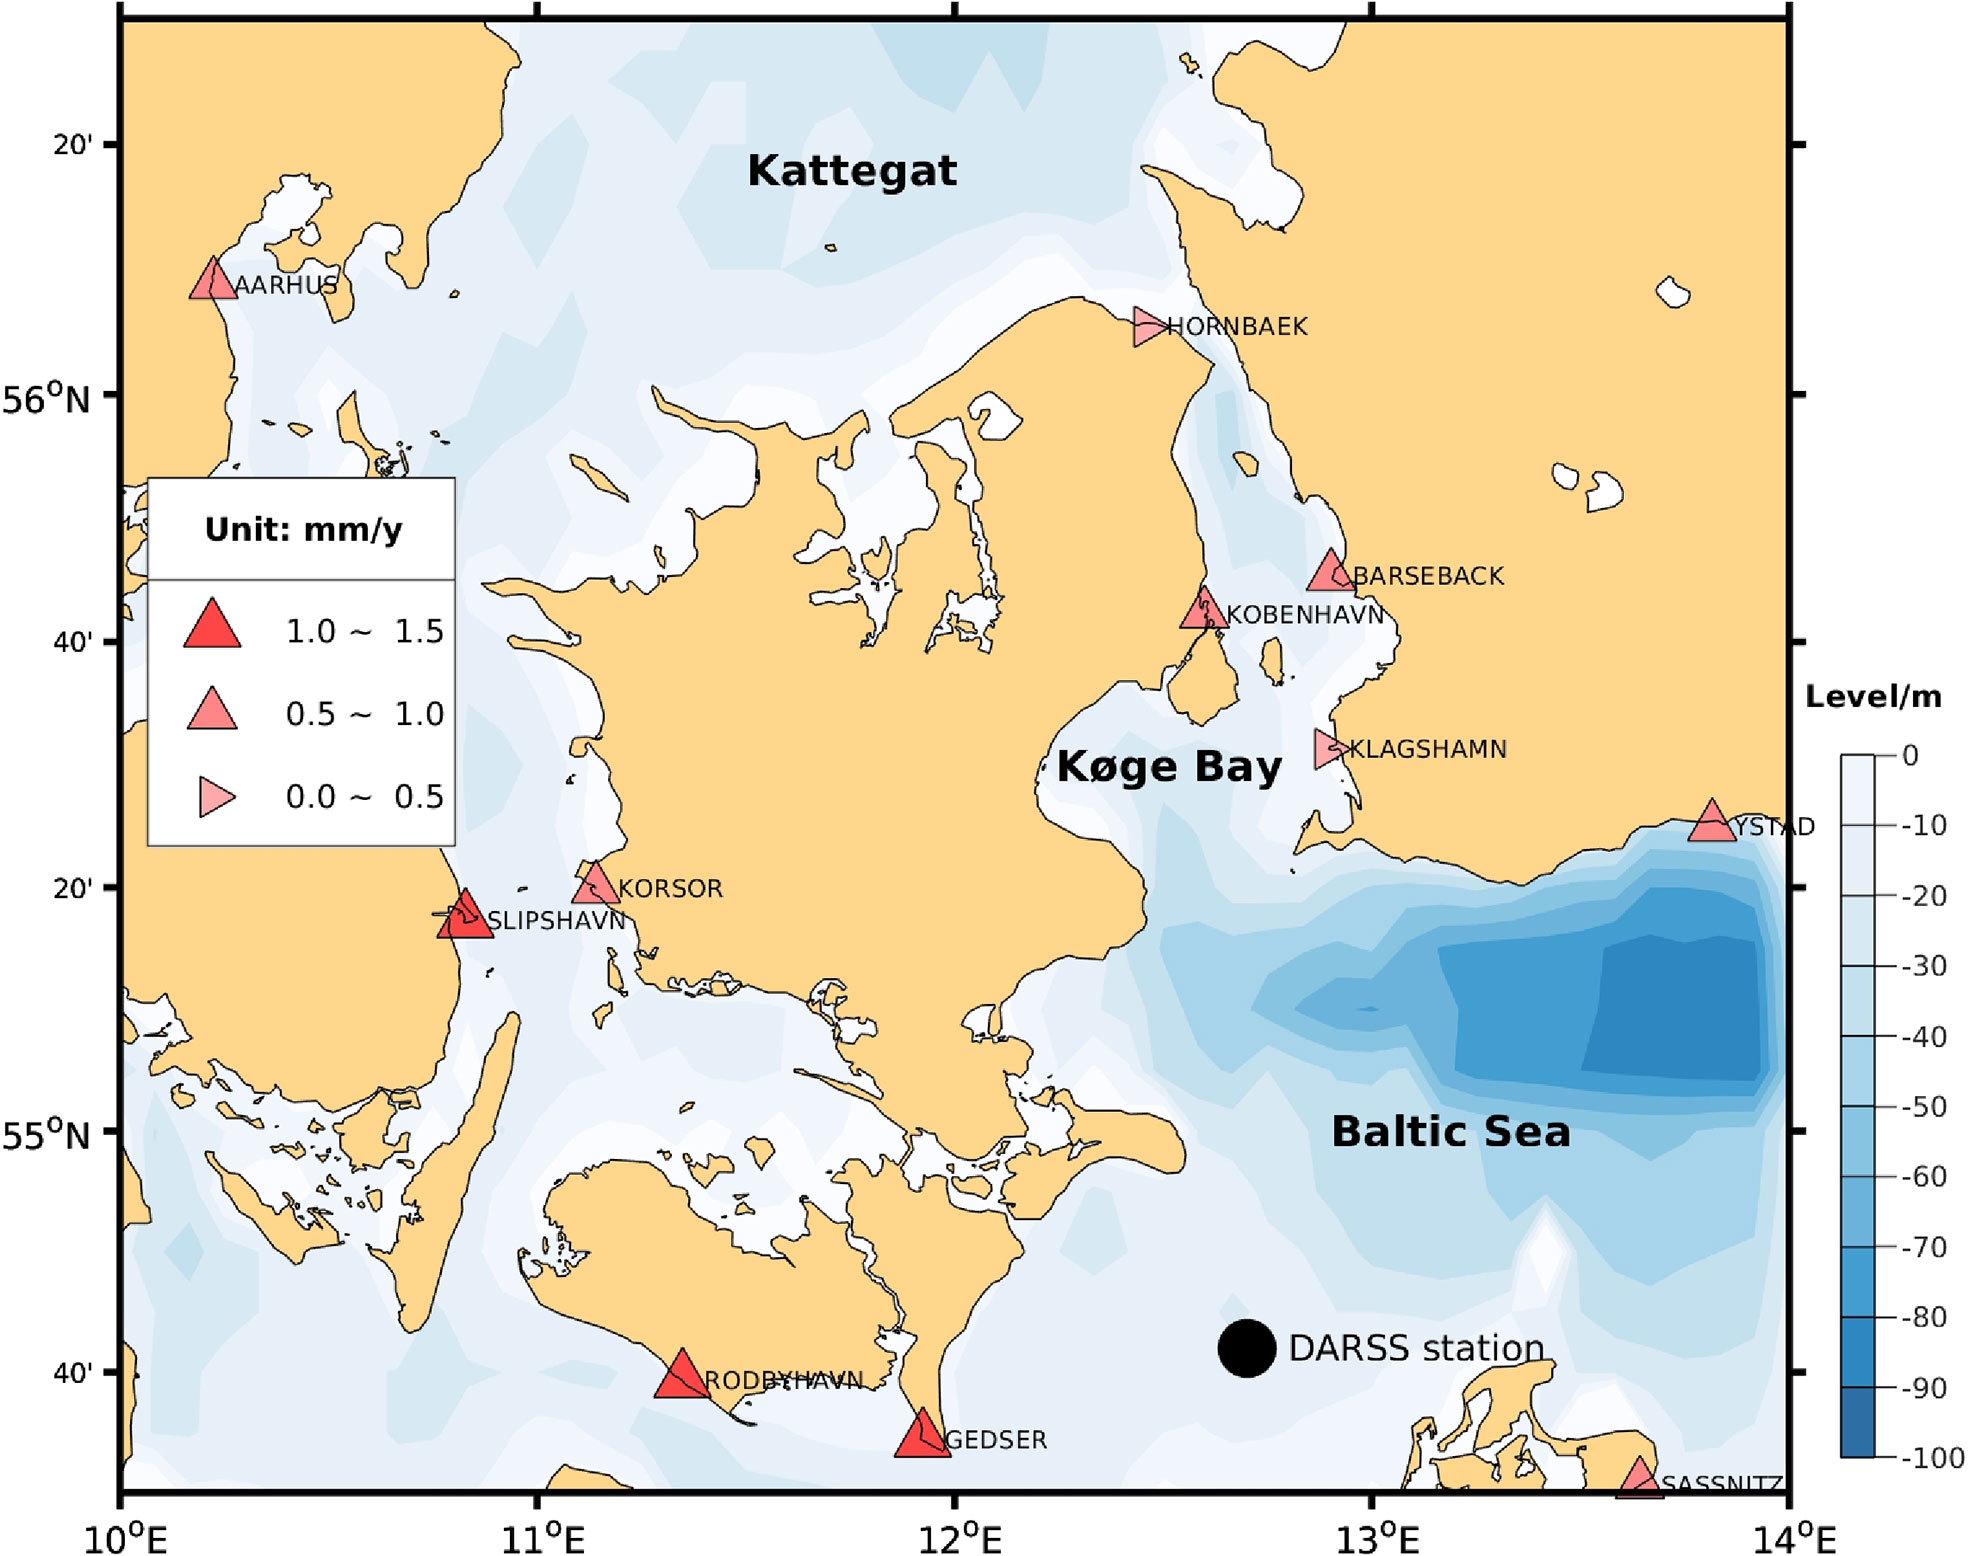
Figure 1 Background shaded color: bathymetry (m) of the Inner Danish Waters. The study area is Køge Bay, located at the south of Copenhagen. The closest PSMSL tide gauge station (Permanent Service for Mean Sea Level (PSMSL), 2020) is København (Copenhagen) station. Top symbols: relative sea level rise trends (by change rate, mm y-1) of the PSMSL data set (Permanent Service for Mean Sea Level (PSMSL), 2020). For the methods to calculate the relative sea level rise trends, please refer to https://www.psmsl.org/products/trends/methods.php; black dot is the position of the wave buoy station DARSS.
With respect to the future changes in wave climate and extreme ocean wave events, it is often derived from wave climate projections (Meucci et al., 2020; Lobeto et al., 2021; Morim et al., 2021). Regional wave projections can be downscaled using physical and atmospheric variable outputs from GCMs dynamically (Dobrynin et al., 2012; Hemer et al., 2013; Casas-Prat et al., 2018) or statistically (Perez et al., 2015; Cannaby et al., 2016; Camus et al., 2017; Leach et al., 2021). The Coordinated Ocean Wave Climate Project (COWCLIP) contributes to integrating and assessing the robustness of wave climate studies (Morim et al., 2018; Morim et al., 2019). Our research location, Køge Bay, is situated in an area that is characterized as a low wave energy environment due to the coastline’s orientation with regard to dominant westerly winds and limited fetches. Due to the bay’s shape, the shoreline is largely shielded from large waves. The predominant direction of wave energy is southeast (Sistermans and Nieuwenhuis, 2004). Over the last century, a barrier island system has formed (Figure 2, low-right panel). The first barriers appeared in 1909, and they have gradually grown since then. The beach park at Køge Bay (Køge Beach) was built in 1977 as an extension of the natural barrier islands, and has an 8 km beach today. It is an environmentally friendly land reclamation project (Figure 2), demonstrating how it is feasible to cooperate with natural processes (sand deposition) to construct a sturdy structure with minimum maintenance requirements. Not only is the beach park a recreational zone, but it also acts as a buffer zone against floods in the hinterland. Based on prior well-designed interviews conducted as part of the Copernicus Climatic Change Service (C3S) project, it is obvious that climate projections for sea level rise, storm surge, and waves are needed for local municipalities to design climate adaptation plans (Madsen et al., 2019). Sea level rise and storm surge climate projections were developed as part of the Danish Climate Atlas project (Su et al., 2021). The purpose of this work is to demonstrate the feasibility of using a reasonably efficient and low-cost approach for regional wave model climate projections. Therefore, we employ a dynamical projection approach of regional wave climate using a regional wave model-WAM in this study. This study also serves as the first step towards insight into a more pressing problem that must be investigated, namely whether wind-driven wave disasters are a concern in the study area. In the context of climate change impact, the concept of risk is a key aspect of concern (IPCC, 2012).
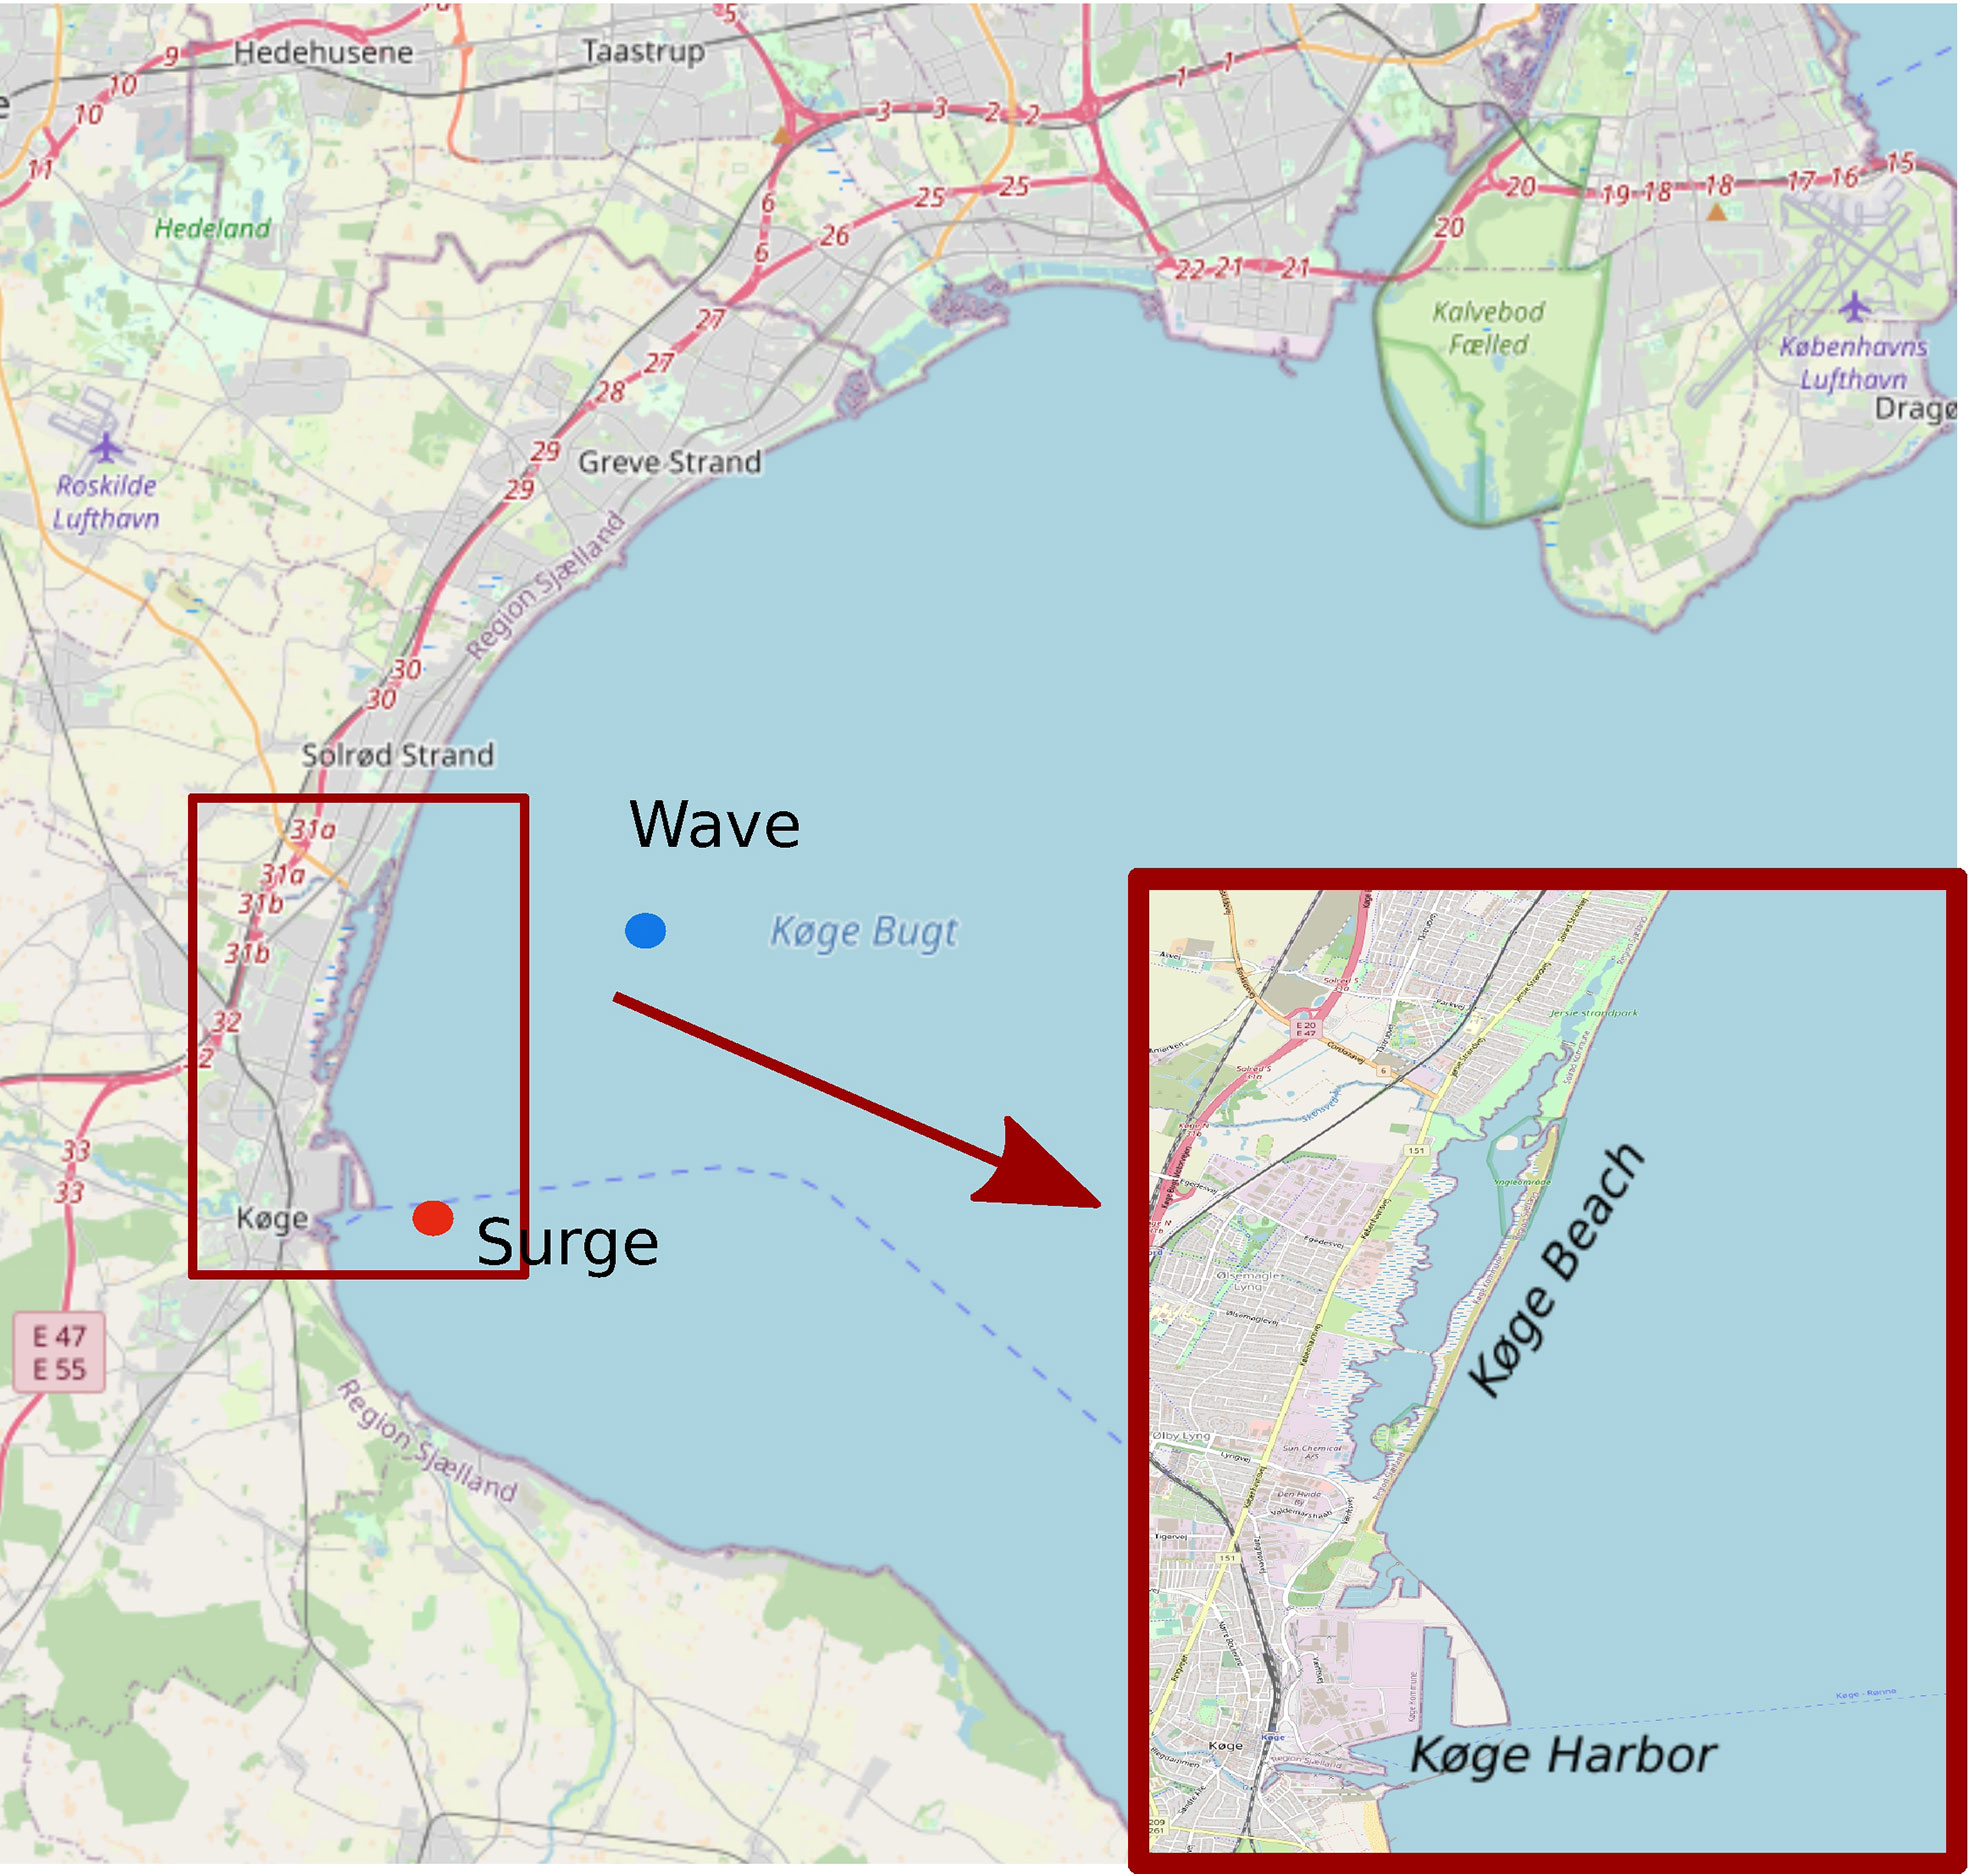
Figure 2 Map of the Køge Bay with a red rectangle box indicating the location of the Køge Bay Beach Park. The Beach Park in the bottom right panel shows the barrier islands and the location of Køge harbor. The blue dot represents the grid point from which we extracted the wave model results, and the red dot represents the grid point from which we retrieved the surge level data, since it is the closest grid point to the Køge Harbor tidal gauge station. Base map and data from OpenStreetMap and OpenStreetMap Foundation under the Open Database License.
Extreme wave events have severe consequences, such as endangering the safety of coastal residents, causing damage to coastal infrastructure, reshaping a coastline, and elevating coastal sea levels through wave run-up. Nevertheless, the intensity of the impact of extreme weather events is highly dependent on the degree of vulnerability and exposure to these events (IPCC, 2012). Climate-related hazards, exposure, and vulnerability combine interactively to produce the risks associated with climate change consequences (Ara Begum et al., 2022). In the climate community, “vulnerability” is defined as the propensity of an individual or group to be harmed by various risks, hazards, or stressors, whereas “exposure” is the “external side of vulnerability” and refers to the negative impacts of a hazard that have the potential to change the social conditions of a system (Cardona et al., 2012). A study based on social vulnerability models for Denmark showed that the municipalities around Køge Bay expose moderate levels of vulnerability (Pappa, 2019), but extreme wave events are not taken into account. Traditionally, in order to quantify the risk assessment, an analytical framework linking climate information to impact models would be established, followed by the application of damage models and decision-making tools (Hallegatte et al., 2011a; Halsnæs and Kaspersen, 2018). Our study serves as a first step toward risk assessment, i.e. developing a paradigm for wave climate information using impact models. We focus on the extreme conditions in Køge Bay, i.e. storm surge and wind wave components of the water level, as well as their interactions with mean sea level rise. The bay is located in the transition zone between the North and Baltic Seas and has a small tidal range. The Baltic Sea is a semi-closed basin with a tidal range of less than twenty centimeters (Medvedev et al., 2016). Thus, sea level research is simplified compared to that in a hypertidal estuary (Lyddon et al., 2018). Local wind waves often play a significant part in rising sea levels and inundating the shore during a catastrophic high sea level event. During a storm surge event, the coupling impact of surge and wave would increase the threat to coastal zones (Staneva et al., 2016; Marcos et al., 2019). Additionally, the storm surge and wave contributions to a disaster depend on the geography and coastline morphology (Wolf, 2009).
The meteorological forcing was derived from a single regional climate model, DMI-HIRHAM, developed at the Danish Meteorological Institute (DMI, Christensen et al., 1998), which is a part of CORDEX (Coordinated Regional Climate Downscaling Experiment) ensemble in Europe (EURO-CORDEX, Jacob et al., 2014). The regional model was downscaled from an EC-EARTH r3i1p1 global climate model simulation. The spatial resolution of this EURO-CORDEX ensemble member is 0.11 degree (EUR-11, 12.5 km). The ensemble approach aims at presenting a data set from a multi-model multi-scenario ensemble of regional climate simulations for impact research (Kotlarski et al., 2014). However, a clear definition of the ensemble statistical method for extreme wind speed has not reached a consensus. We show an example of the ensemble annual maximum wind speed time series (16 members) at the Køge Bay (Figure 3). The ensemble annual maximum wind speed (thick black line) is the median of the multi-model results, which shows a very small variability (standard deviation < 2 m/s). Such a small variable time-series is not suitable for this study, which focuses on extreme winds. As a result, we are employing a single member as a driving forcing in our investigation. The variables of DMI-HIRHAM used to force the WAM model are hourly 10 m wind (m/s) and mean sea level pressure (hPa).
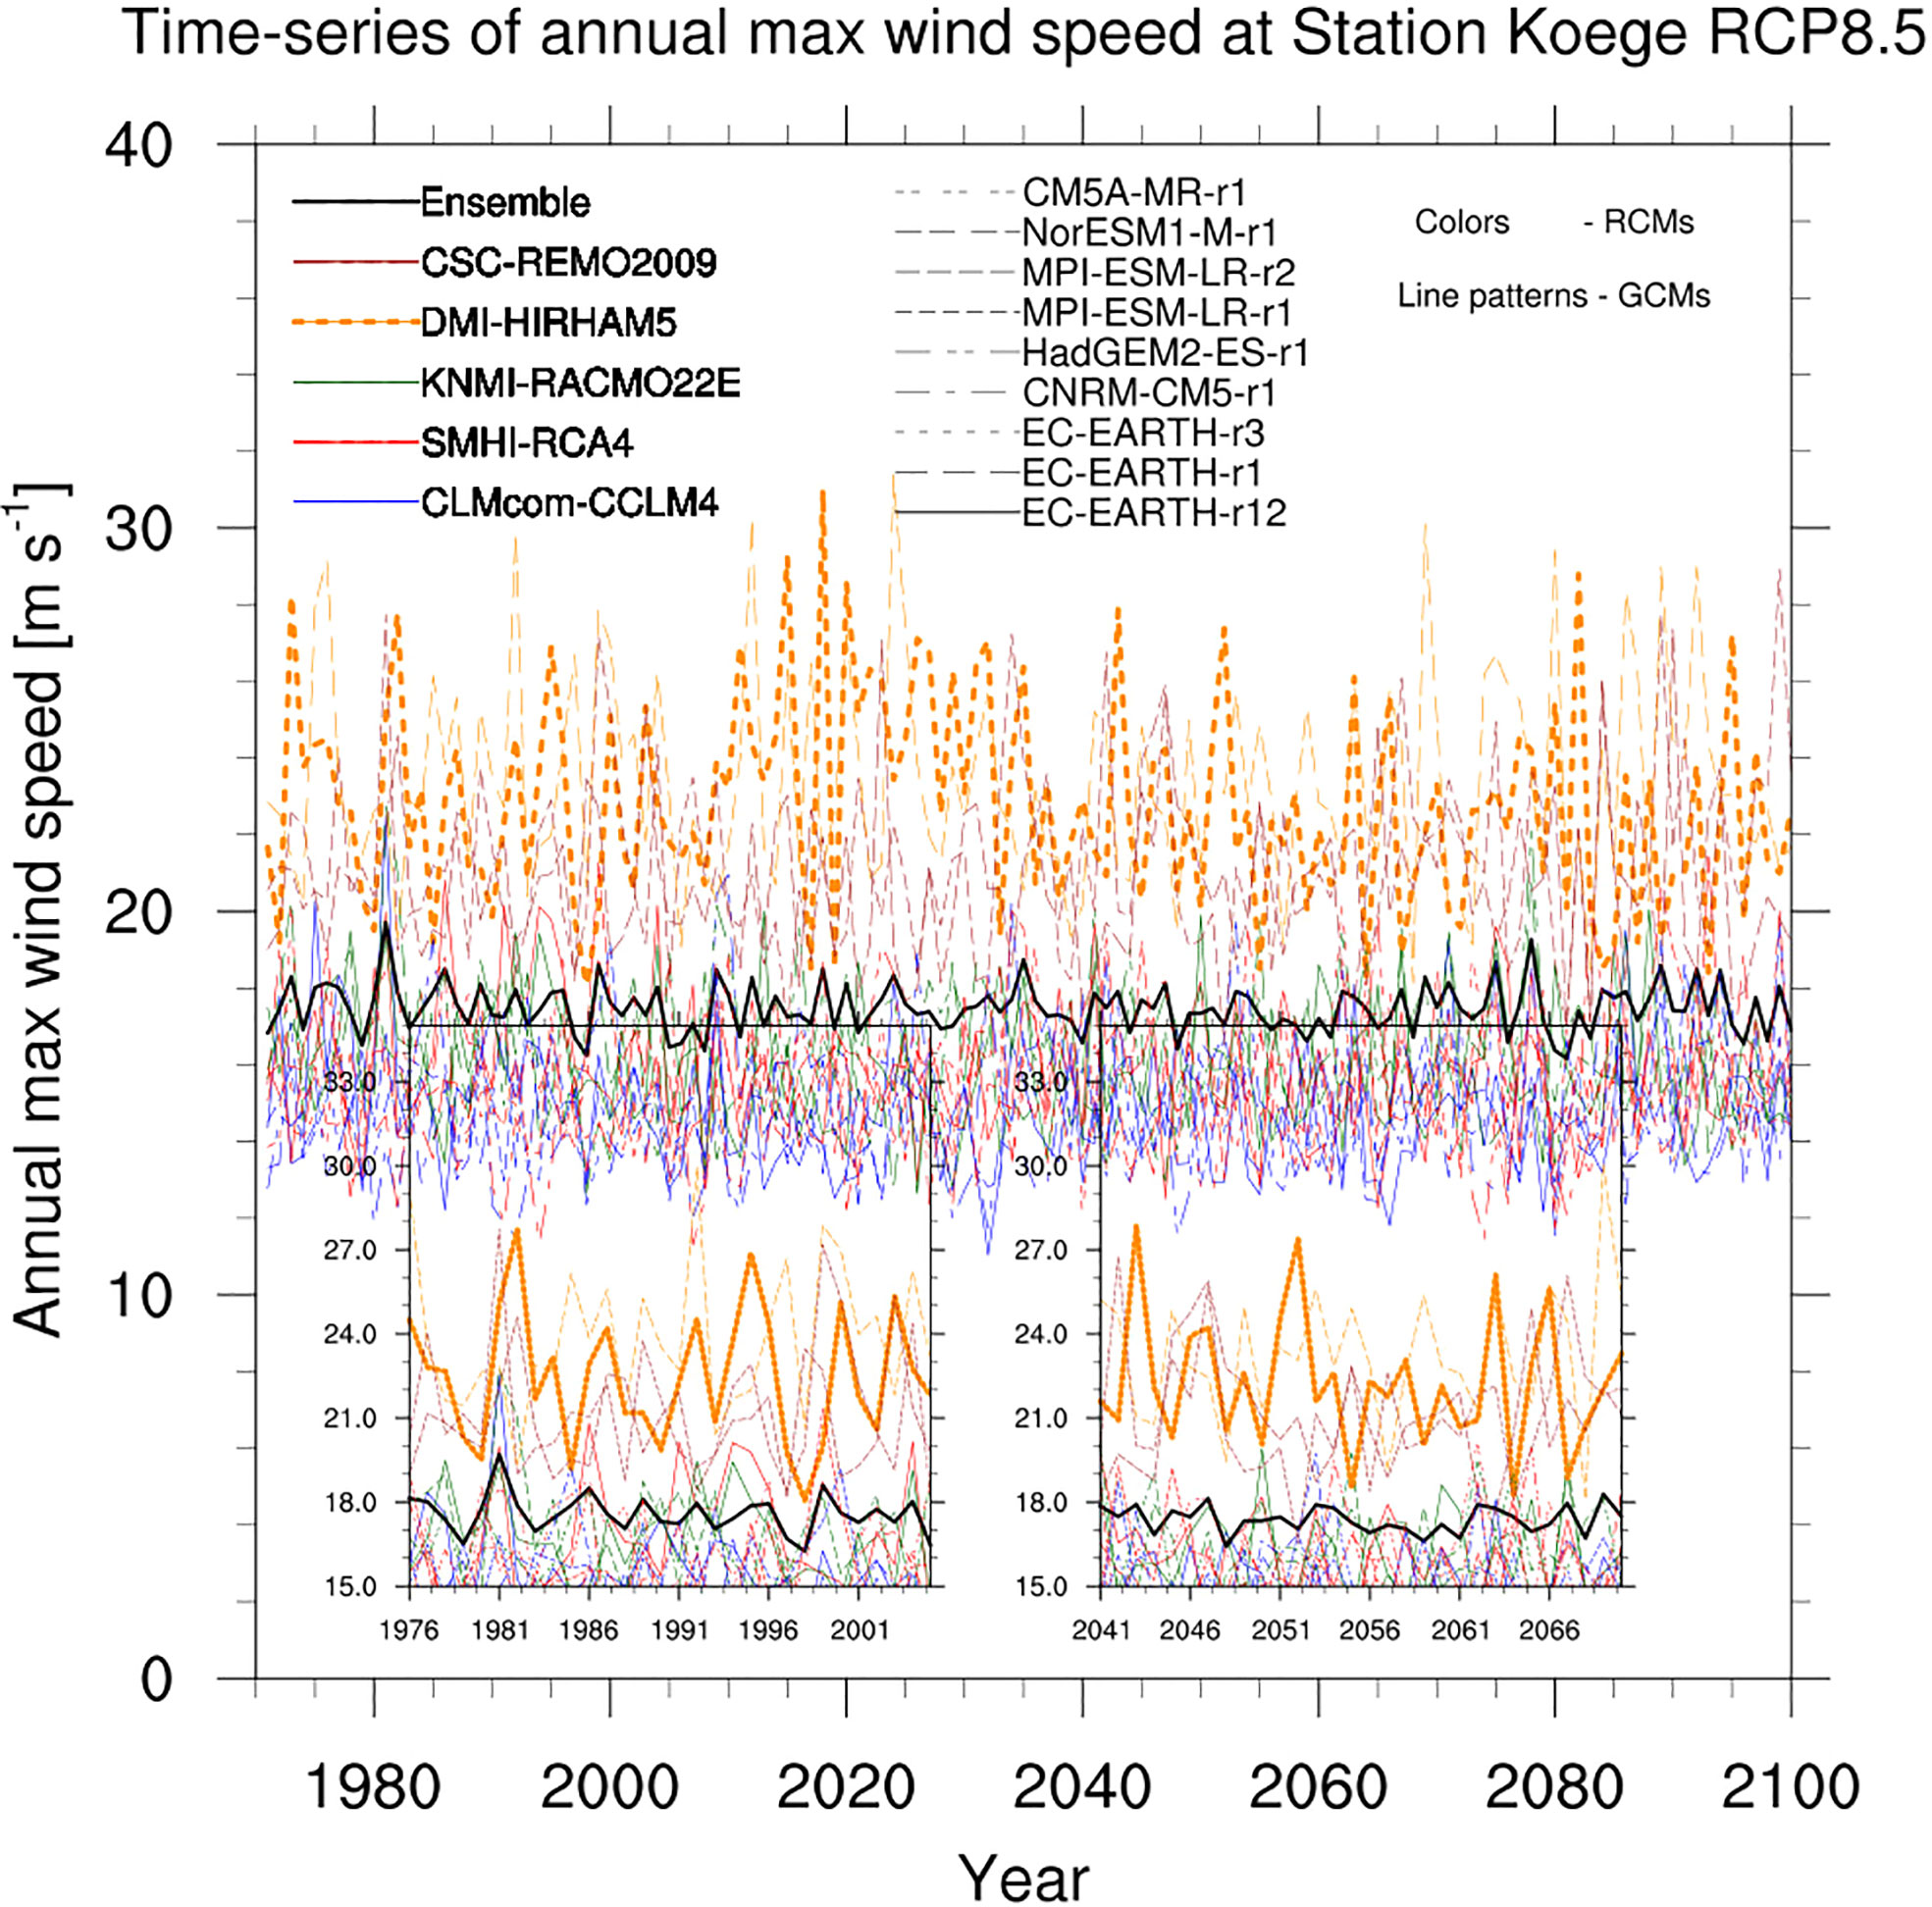
Figure 3 Time series of annual maximum wind speed at the Køge station for 130 years of simulations from multi-RCMs (16 members, including 5 RCMs, REMO2009: 2; HIRHAM5: 2; RACMO22E: 3; RCA4: 5; CCLM4: 4 members) under RCP 8.5 scenario. The line colours indicate different RCMs, while different line patterns refer to GCMs (downscale to RCMs). DMI-HIRHAM5 downscaled from EC-EARTH (used in this project) is the single dashed thick yellow line. The two panels depict the same time series during two time slices of the projection simulations, i.e. 1976 - 2005 and 2041 - 2070.
In Køge Bay, annual maximum wind speed in DMI-HIRHAM was larger than in other RCMs (Figure 3). The coastal wind is rather dynamic, since it is a result of a variety of factors such as differential heating between land and sea, topography and morphology of the coastline, and so on. Generally, the shoreline displays a sharp discontinuity in surface roughness. Therefore, we preprocess the forcing data to exclude wind over land.
Apart from the regional climate model, we use the operational forecast suite DMI-HIRLAM (Sass et al., 2002) to get an accurate portrayal of a severe weather event in 2017 (Table 1). HIRLAM (High Resolution Limited Area Model) forecasting is a numerical weather prediction model created by the worldwide HIRLAM consortium (Undén et al., 2002). Throughout the research period, the DMI-HIRLAM model system generated the atmospheric forcing employed in practical storm surge and wave modeling at DMI.
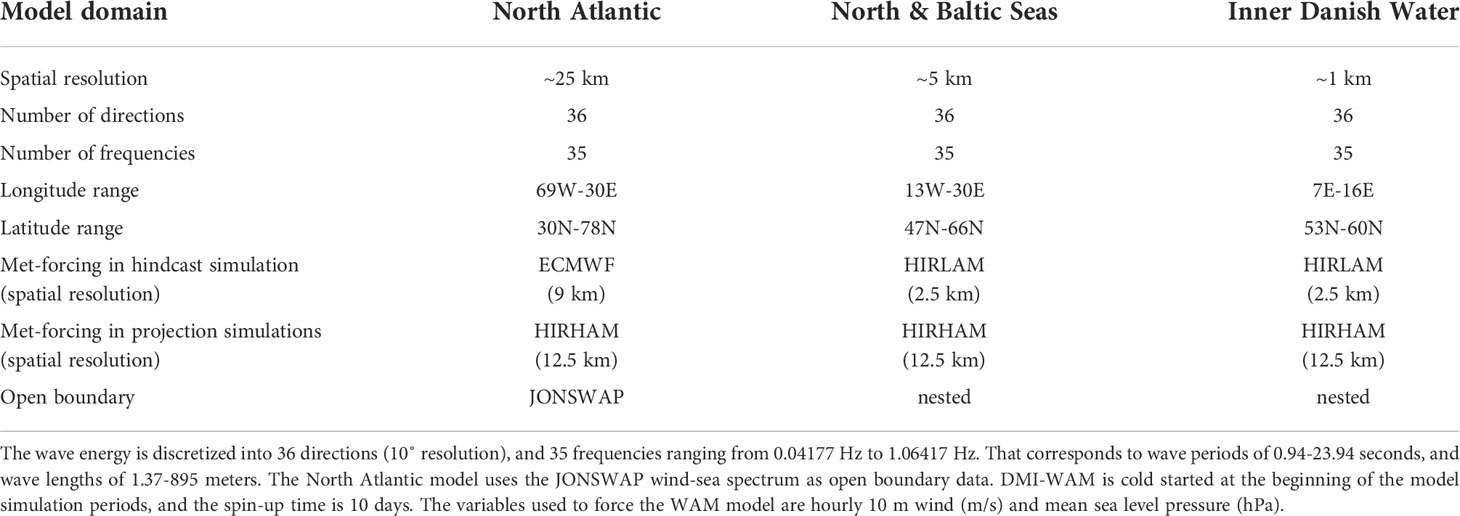
Table 1 Regional wave model DMI-WAM setup and meteorological forcing used in this study.
The climate ocean circulation simulations were conducted using the operational model HBM (the HIROMB-BOOS Model) at DMI. The use of operational models in climate research enables the same degree of detail in climate predictions as is possible with the operational setup used for ocean forecasts, ensuring a well-tested and verified approach. DMI runs the regional three-dimensional ocean model HBM for the North and Baltic Seas in order to forecast the physical state of the Danish and adjacent seas in the near future (Berg and Poulsen, 2012; Fu et al., 2012). The model code version was HBM-2.8, and the set-up used in the present study is the DKSS2013 operational version launched at DMI in October 2013 (details on http://ocean.dmi.dk/models/hbm.uk.php). The spatial resolution in Køge Bay is 0.5 nautical miles, and the model grid point for validation is close to Køge Harbor (Figure 2, red dot). The validation of HBM to the storm surge events can be found in Andrée et al. (2021). The validation for the storm surge forecast includes online validation and case studies, and details can be found on http://ocean.dmi.dk/validations/surges/index.uk.php.
Apart from meteorological forcing, hydrodynamic model simulations need initial conditions, boundary conditions, and runoff data. We used the operational forecasted state vector valid on 1st July 2014 00z as the initial condition, and applied a two-and-a-half-year spin-up period for each time slice. We used boundary conditions derived from the EC-EARTH global climate model findings. We utilized E-HYPE3 run-off for the historical period and added trends from the literature for the scenario simulations.
The DMI operational wave forecasting service DMI-WAM makes use of the third generation spectral wave model WAM Cycle version 4.5.4 (Günther et al., 1992; Komen et al., 1996) which is forced by DMI’s numerical weather prediction model referred to in the above section. The details of the setup are listed in Table 1, and also on http://ocean.dmi.dk/models/wam.uk.php. Køge Bay is in the Inner Danish Waters nested model domain (Table 1), and the spatial resolution is 1 km. We extracted the wave model results at a model grid point close to Køge Beach (Figure 2, blue dot). The closest wave buoy data used for validating the wave model hindcast simulation is from a permanent buoy station DARSS sill station, located outside the Køge Bay at 54.7 ˚N, 12.7 ˚E (Figure 1, black dot). There is also online validation for the forecast periods between the simulated wave height results and buoy measurements. Besides the validation, a monthly report for a global comparative wave model verification and a simple comparison between the model and satellite wave data are shown on http://ocean.dmi.dk/validations/waves/index.uk.php.
Regarding the time frame and IPCC scenarios of the wave-related climate issues, we conducted interviews of the municipalities, outlined in Madsen et al. (2019). We found that time scales are determined by how the data is used for climate preparation, i.e., risk assessments (ten to fifty years), or long-term strategic planning (50-to-200 years). Clients are interested in near-future data for wind wave disasters for risk management. Therefore, the study of the near-future weather extremes under the high greenhouse gas emission scenario (RCP8.5 scenario) is more relevant than the examination of low emission scenarios. For these reasons, we decided to perform both HBM and WAM simulations for the historical period and near-future periods under RCP8.5, respectively, from 1976 to 2005 and 2041 to 2070.
“Stormy conditions” are defined as the significant wave height (SWH) exceeding the 90th percentile of the distribution (Figure 4). This “stormy condition” may be used to reflect the winter wind conditions in Køge Bay. Wave heights below the 90th percentile are referred to as “normal conditions”.
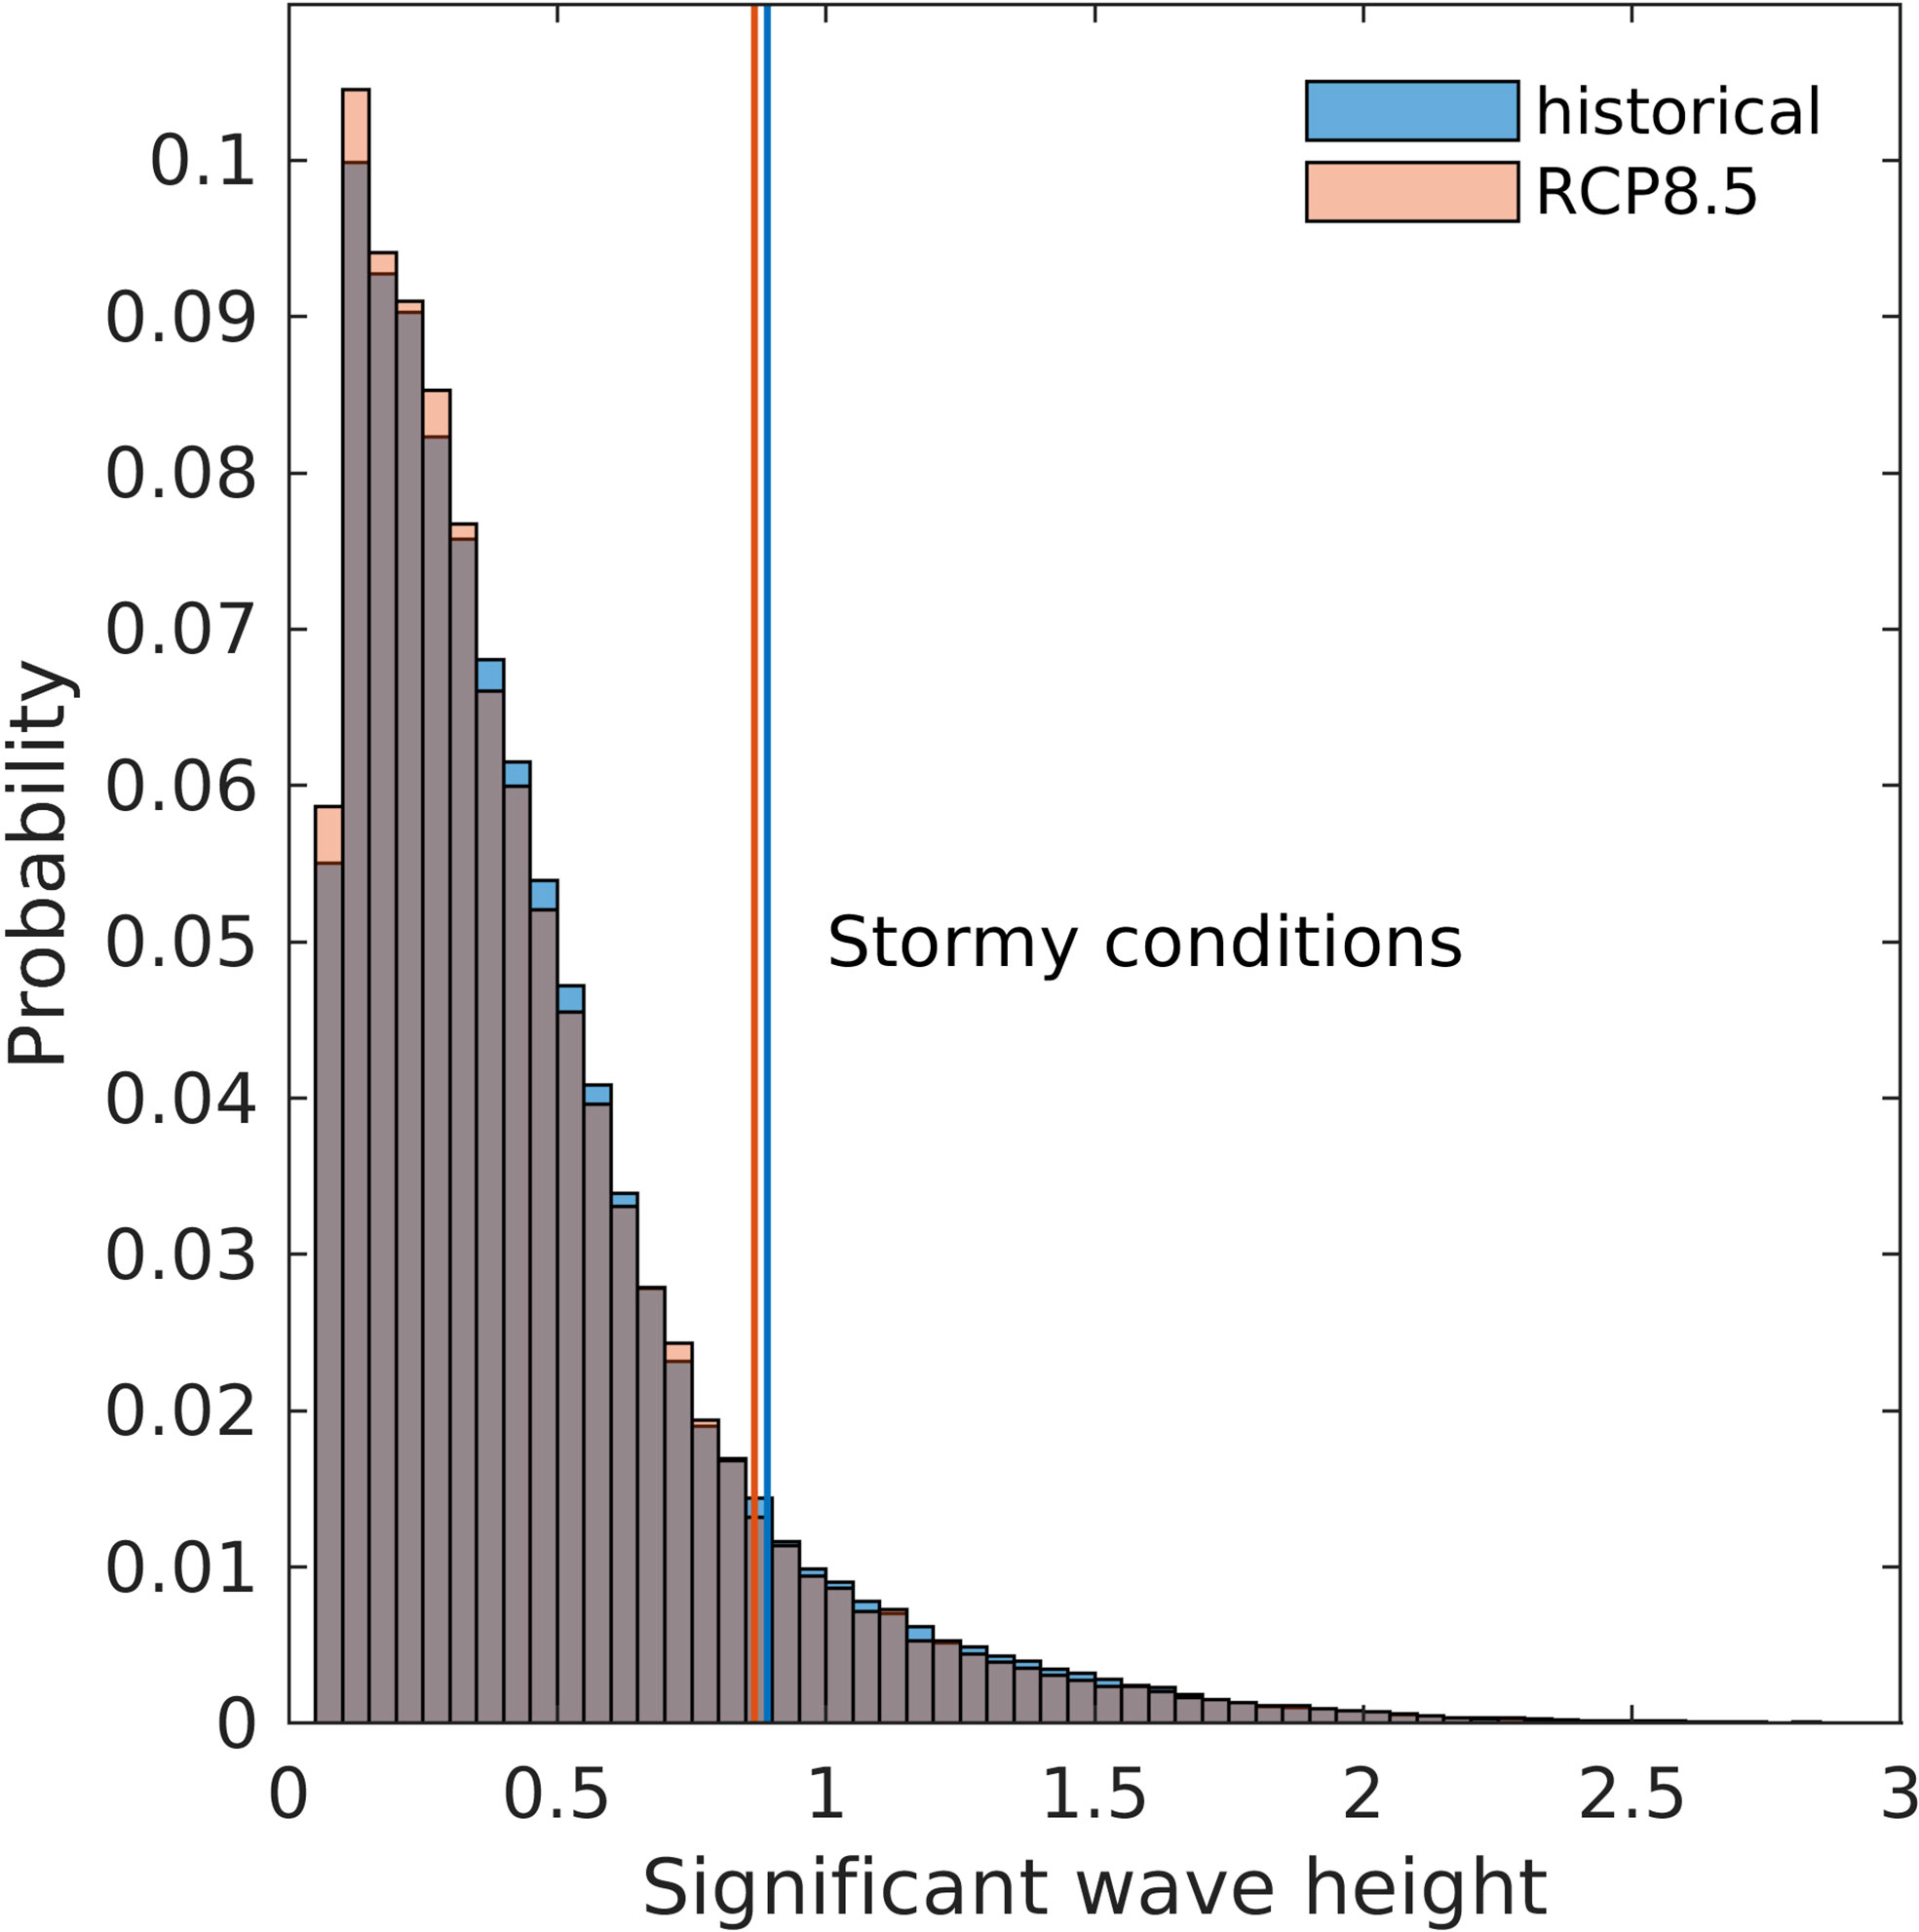
Figure 4 Significant wave height (SWH) histograms for historical (blue) and mid-century (orange) periods under RCP8.5. The model output has a temporal resolution of ten minutes. The lines denote the 90th percentile of the distribution. “Stormy conditions” are defined as those in which SWH exceeds the 90th percentile.
“Storm surge conditions” are defined in this research as a water surge level that exceeds the 20-year-return storm surge level. The classification of high sea level events as a 20-year return value is in accordance with the Danish Storm Council’s standard. The storm surge statistics were calculated using the peak over threshold (POT) and generalized Pareto distribution (GPD) methods, following the suggestion of Arns et al. (2013). The POT threshold for storm surge statistics is based on the statistics from the Danish Coastal Authority (111 cm for Køge Bay, Ditlevsen et al., 2019). We calculated the 20-year return values for two simulated time periods. The median value of the mean sea level increase for the period 2041-2070 under RCP8.5 is 22 cm, which was simply added to the return values [see the sea level rise calculation in Su et al. (2021)]. The wave climate indicators show the changes in SWH and wave period in 2041 - 2070 compared to the reference period (1976 – 2005), taking into consideration future sea level rise and wind pattern changes.
In practice, model outputs are commonly extracted or interpolated to a particular location in order to validate them against observed data. Consequently, model results should be evaluated cautiously for various purposes. We chose the closest model grid point to Køge Harbor, where the tidal gauge station is located, for the surge model results (Figure 2). This is also common practice for forecasting and warnings of storm surges. The time series of the results from the storm surge forecast model in Køge Bay revealed that storm surge events exceeding 1 m had occurred around 10 times in the last decade (Figure 5, blue line). The highest recorded level was 1.57 m during the January 2017 storm surge event, which we will discuss in depth in the next section.
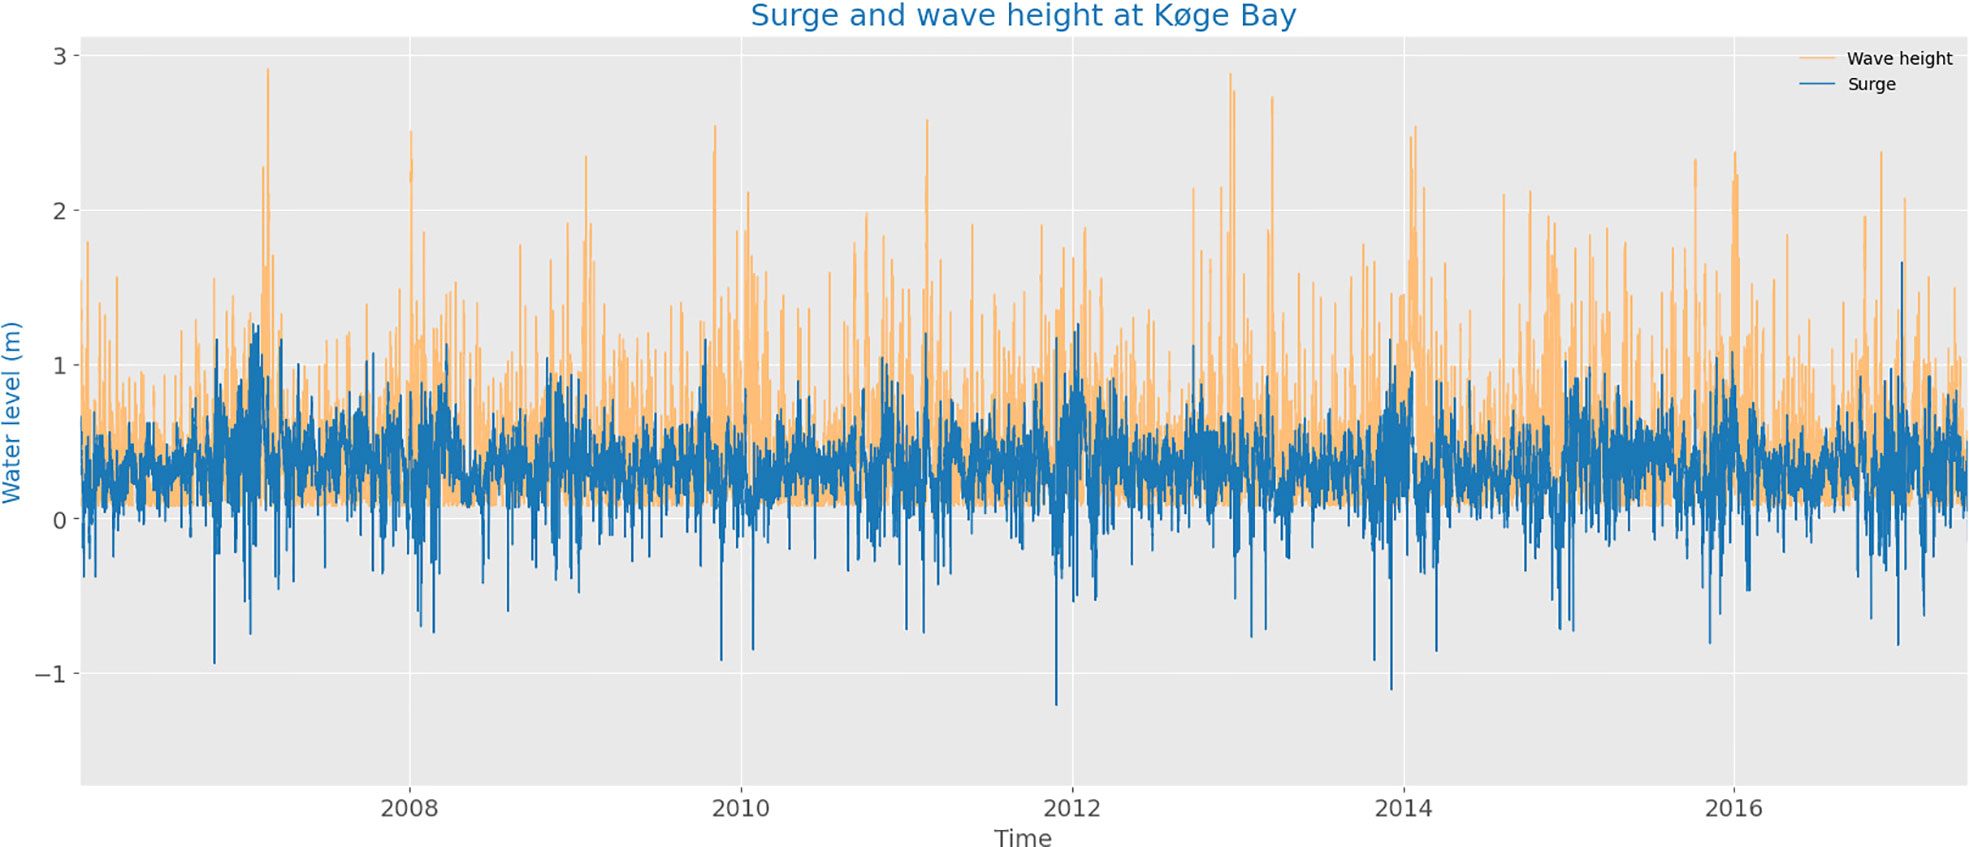
Figure 5 The time series of water level (blue) and significant wave height (yellow) from HBM and WAM model results forced by the weather forecast model from 2006 to 2017. The model grid points to extract the water level are shown in Figure 2. The validation of the WAM model with the wave buoy data refers to Table 2.
It is common to calculate an area mean of wave parameters for a bay area when analyzing wave model results. However, we extracted the results at one model grid point offshore Køge Beach (see Figure 2 for the location). As noted in the introduction, the region offshore Køge Beach is the most exposed to waves in Køge Bay, and it is here that we should make recommendations for a climate adaptation plan. The time series of wave heights depicted in Figure 5 (yellow line) demonstrates that high wave events (>2 m) are not always associated with a large storm surge event. For example, the highest SWH from a wave forecast in recent decades was close to 3 m, which is during the Bodil windstorm in 2013 (Clemmensen et al., 2016). Luckily, the Bodil windstorm did not result in a storm surge event in Køge Bay.
The validation of SWH in DMI-WAM hindcast simulation is shown in Table 2. We extracted the WAM results at the DARSS wave buoy station (54.7 ˚N 12.7 ˚E, Figure 1), which is the closed observation station to our study area. We provided annual based error statistics for recent 10 years (2008-2017) in the hindcast simulation period. The mean error statistics for 10 years are: mean error/bias (observation - model) is 0.03 m, root mean square error (RMSE) is 0.26 m, scatter index (RMSE divided by mean of the values) is 0.32, correlation coefficient is 0.9, annual peak event error (observation - model) is 0.47 m, mean error of annual 10 maximum wave events is 0.19 m (Table 2). In cases of peak values, the WAM underestimates SWH, although it is acceptable in long simulations (Cherneva et al., 2008). In general, model outputs and buoy-measured data are in good agreement, which ensures the quality of simulations by giving a good scatter index and correlation coefficients.
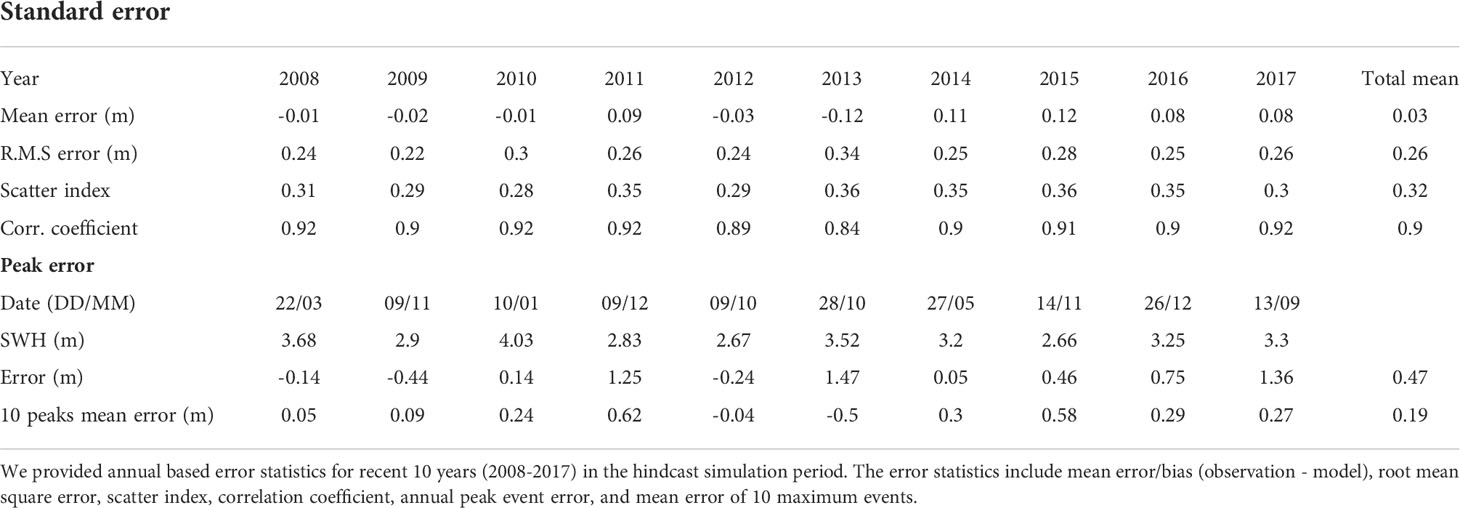
Table 2 The validation of significant wave height (SWH) in DMI-WAM hindcast simulation against the wave buoy observation at DARSS position (54.7 ˚N 12.7 ˚E).
On January 4-5, 2017, a storm surge hit the southern Baltic Sea and Køge Bay. A period of persistent westerlies increased the mean sea level of the semi-enclosed Baltic Sea by approximately half a meter. This was followed by the passage of an extratropical storm from west to east. A strong easterly wind has developed across the central Baltic Sea, moving the Baltic water mass into the west Baltic Sea, where Køge Bay is located. A number of harbors experienced a storm surge that was classified as a 100-year storm surge event, despite the fact that local wind conditions were not extreme (She and Nielsen, 2019). At the Køge tide gauge station, the maximum water level was registered at 1.57 m (Figure 6, red line), which is the highest level recorded since the tidal gauge station was established in 1955. It was estimated to be a 100-year event Ditlevsen et al., 2019) that occurred during relatively calm circumstances, and has therefore been named “the silent storm surge” (She and Nielsen, 2019). The surge was well predicted in advance, and the coastal defense was implemented to avert casualties and significant material damage. Nonetheless, the event served as a wake-up call, as large sections of the Køge Bay were on the verge of flooding, and it could have been much worse if the wind had been stronger, resulting in a larger local wind wave, or the average sea level had been higher due to climate change. This has accelerated Denmark’s climate adaption efforts.
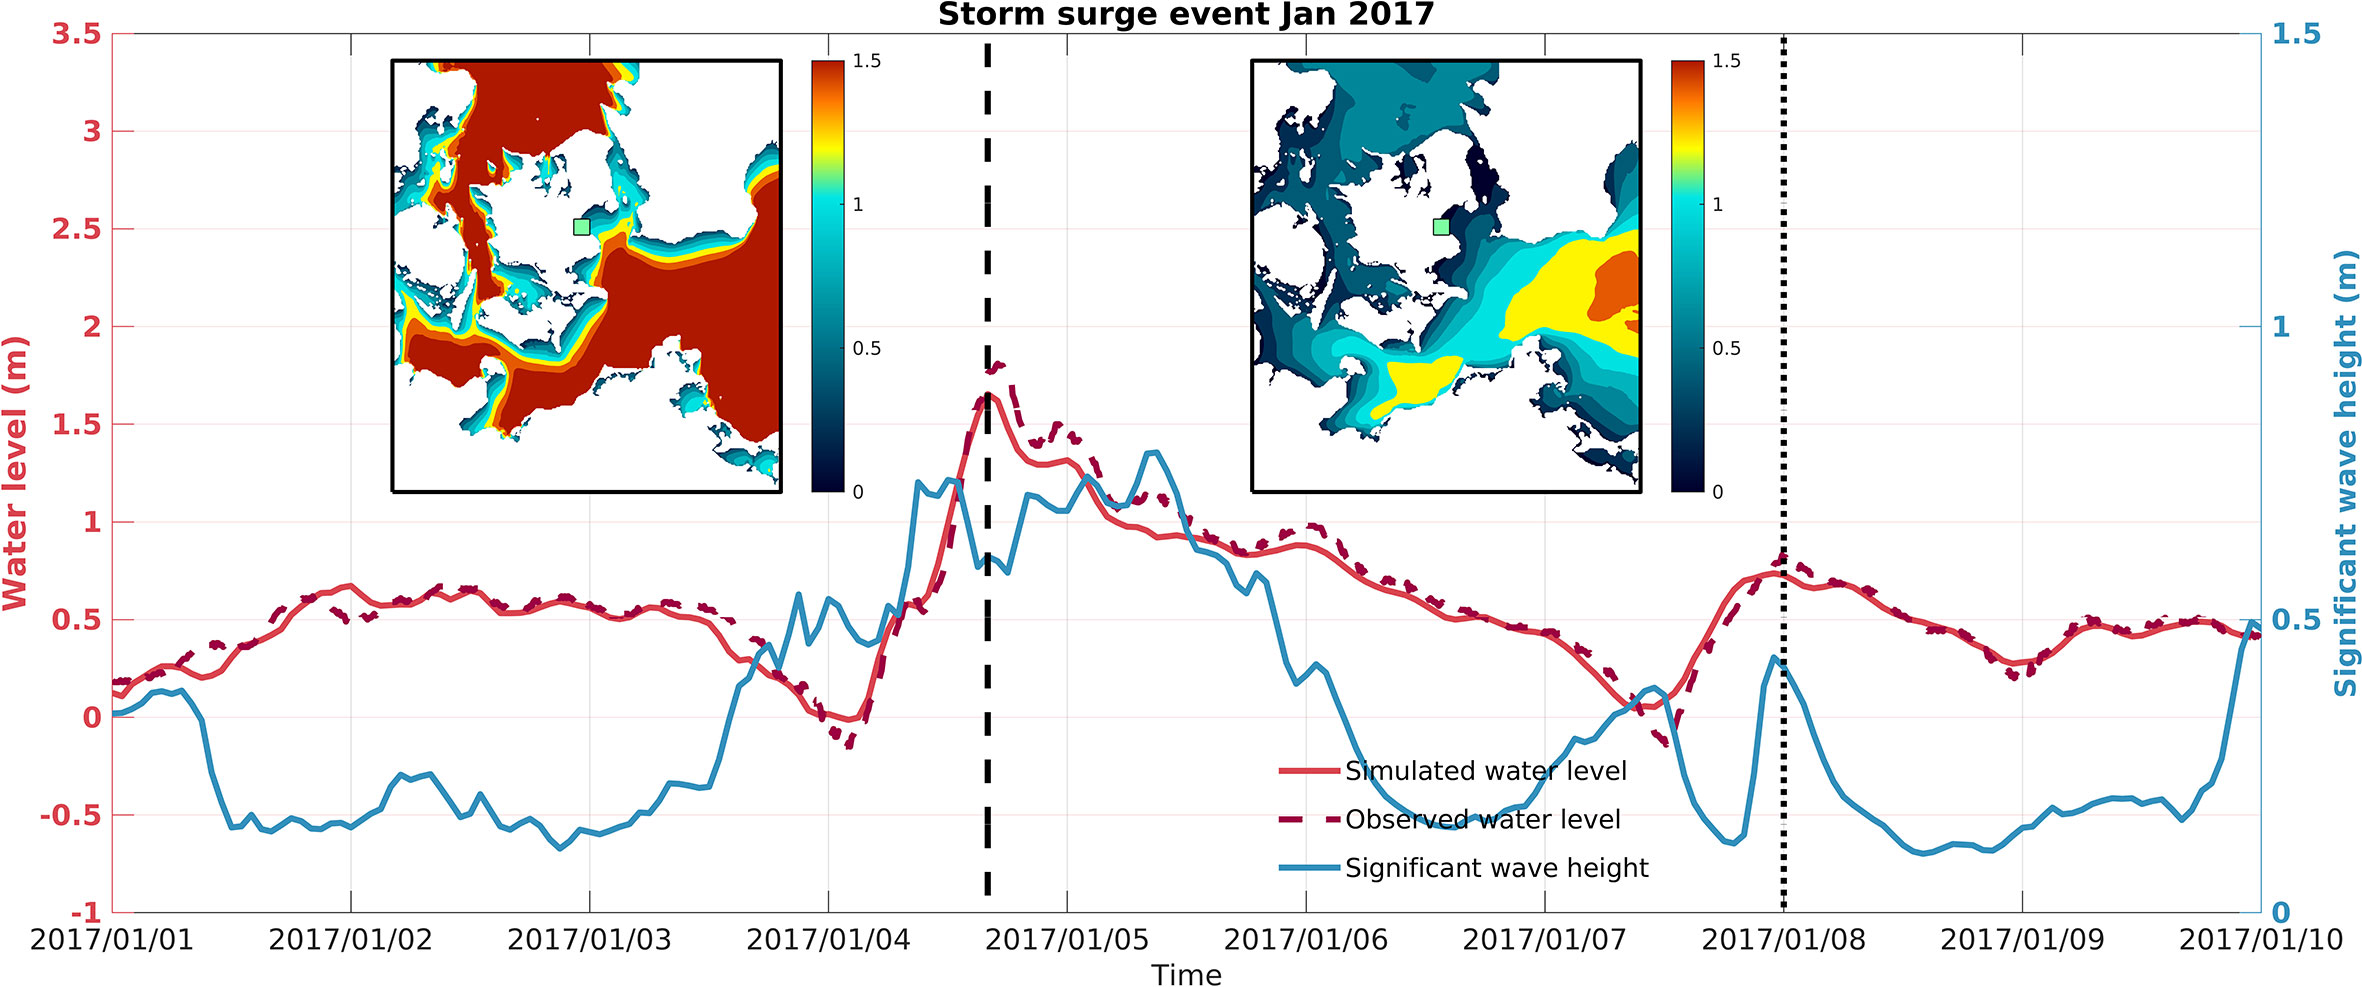
Figure 6 The line plot illustrates simulated water level (m, red solid line), observed water level (m, red dashed line) and simulated significant wave height (SWH, m, blue line) near Køge Beach (black square in the shaded plot) during a storm surge event in 2017. Inside, two color-shaded panels depict the spatial distribution of SWH at the storm surge’s peak period (dashed line) and at the calm condition (dotted line).
Køge Bay is very well sheltered from large waves due to limited fetches. Even though the wind was not as strong as it is during the stormy days, the SWH remained over 0.6 m, with a maximum of 0.8 m, for nearly a day (Figure 6, blue line). The decreasing of the surge level, in particular, is relatively gradual, which is characteristic of a storm surge in general. Throughout the decreasing surge phase, the SWH is somewhat larger than the average wind wave level during the flooding period. The surge-wave coupling characteristics exacerbated the situation at Køge Bay, and the authorities reported that they were approaching their protection capacity.
The spatial distributions of the maximum and low surge levels during the “silent storm surge” are shown on inside panels of Figure 6. This depicts the “storm surge situation” and “normal condition” described in Wave projections under “stormy conditions” and “storm surge conditions”. First, wave heights in Køge Bay and nearby bays remain much lower than in waters outside the bays. Second, the offshore wave height in the western Baltic Seas approaches more than 2 m at the peak of the surge level (Figure 6, inside panel). As a consequence, the coastline morphology of a bay is more vulnerable to surge flooding than to waves. Third, the wave height in the bay is very modest under normal conditions, suggesting that it will not be an extreme event even with future mean sea level rise.
The time series of the wave model results at Køge Bay (location in Figure 2) over the 2041-2070 period (near-future) under RCP8.5 scenario is depicted in Figure 7. During both historical and near-future 30-year time slices, the number of storm surge events (exceeding 20-year event) is two. When SLR (22 cm) under RCP8.5 is taken into account, the number of storm surge events increases to seven. Intuitively, some high SWH events are associated with storm surge events when considering SLR. This indicates that some of the high wave events in the present climate may reach a critical level and become a problem in the future, when more of these events might be associated with storm surges. In other words, storm events with high SWH, and a similar magnitude of wind speed as during the Bodil Storm, might become a concern in the future. As a result, the wave height during “storm surge conditions” increases from 0.75 m during the historical period to 1.63 m during the near-future period (Figure 8).
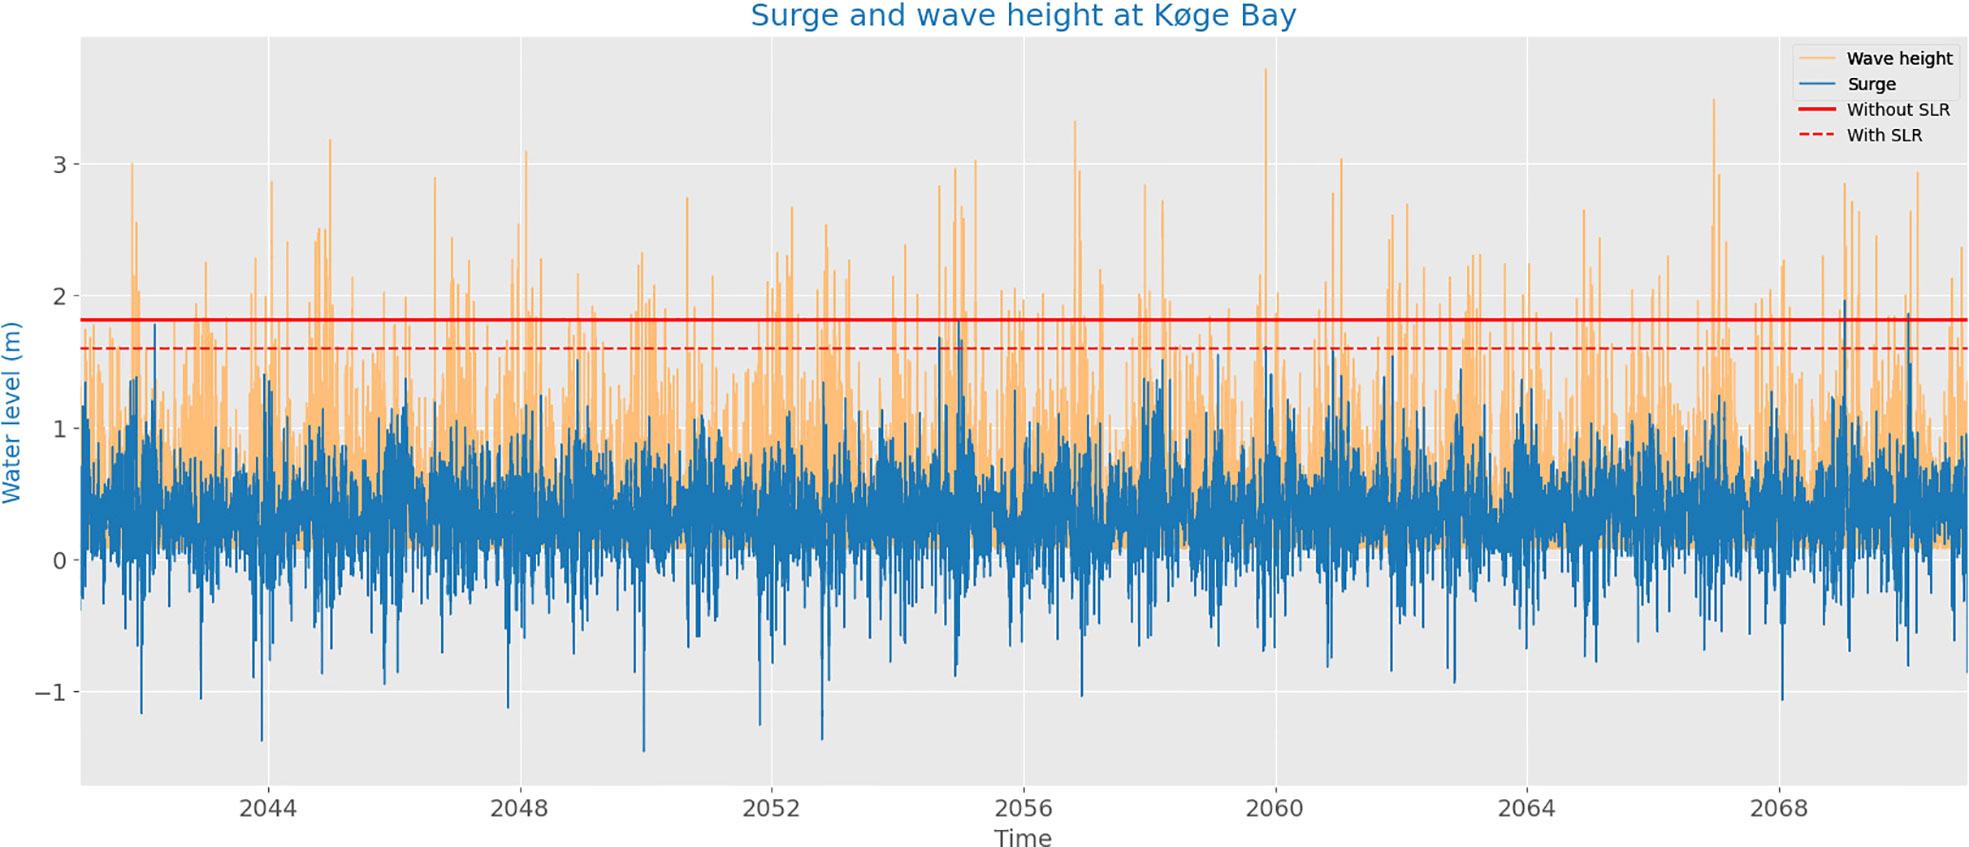
Figure 7 During the future period under RCP8.5 scenario (2041 - 2070), the time series of the surge (blue) and wave height (yellow) are shown. The red line represents the 20-year-event without consideration for sea level rise (SLR, 1.82 m), whereas the red dashed line represents the 20-year-event with regard to SLR (1.6 m). Note that to keep the same line as present day, we need to lower the threshold under SLR conditions. Two events are considered “storm surge conditions” in the absence of SLR, whereas seven events are included with SLR.
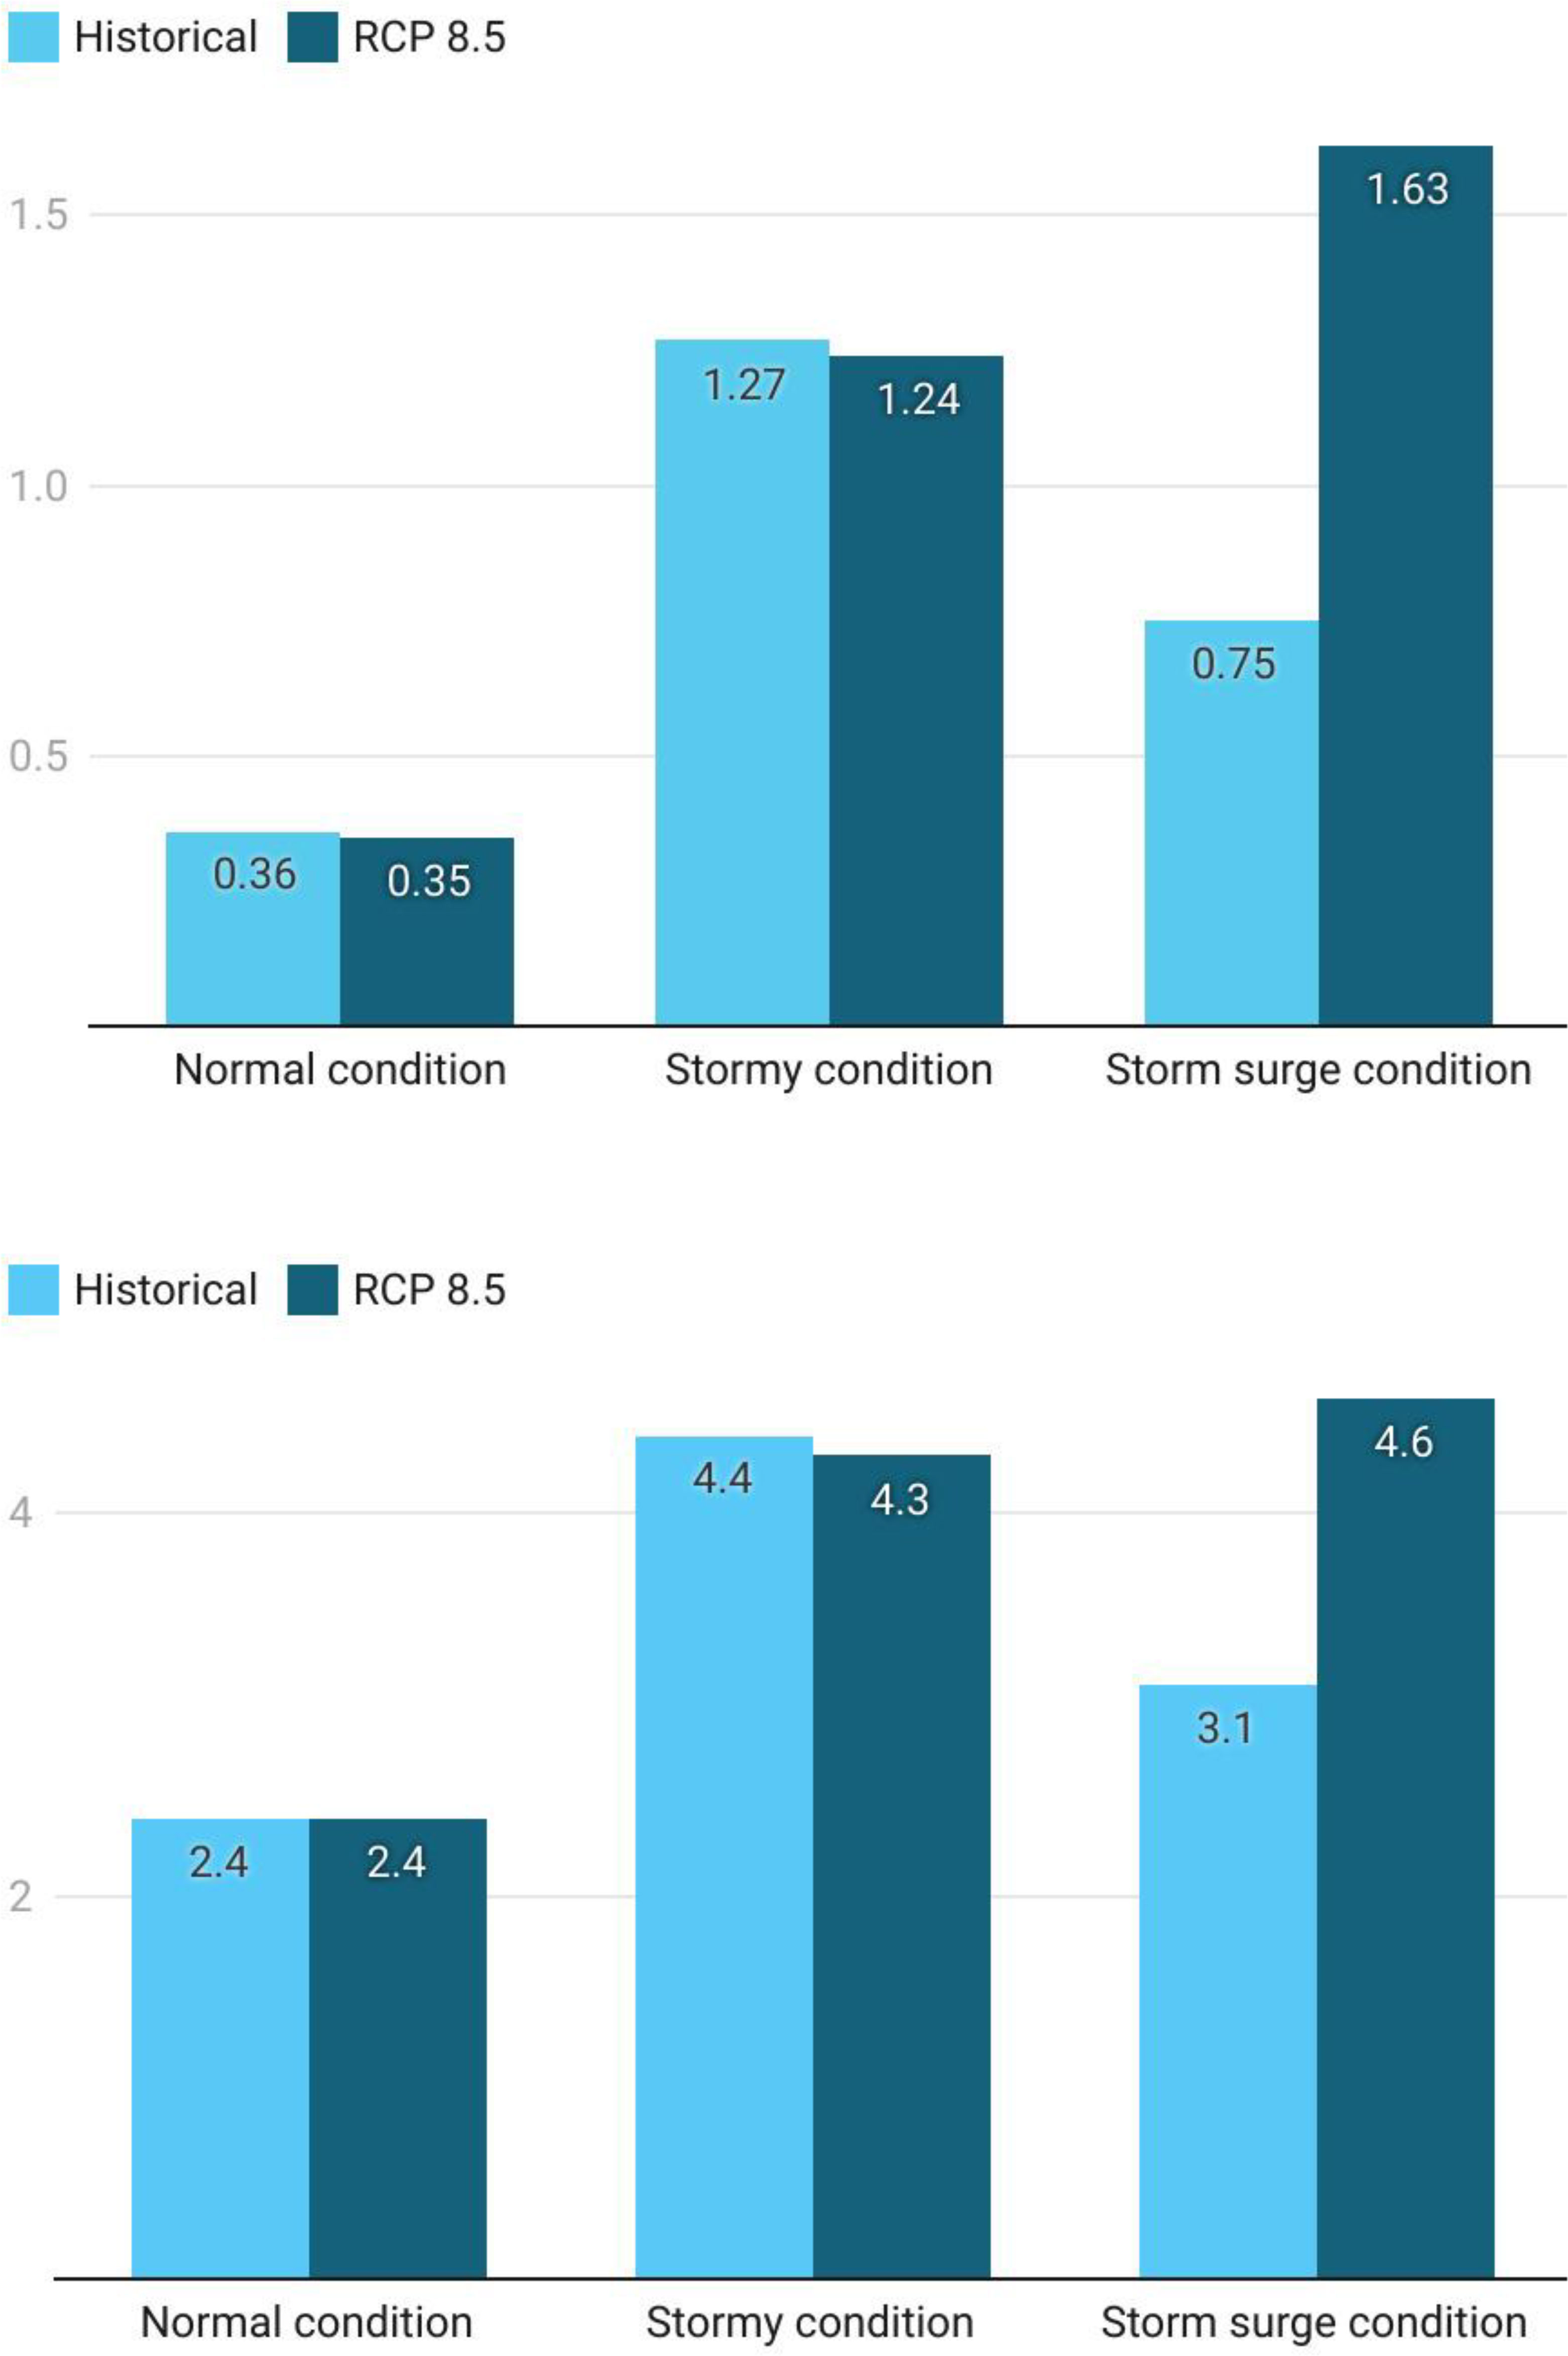
Figure 8 Wave height (left panel) and wave period (right panel) during RCP8.5 mid-century and historical period (1976 - 2005) under ”normal conditions” (first column), ”stormy conditions” (second column) and ”storm surge conditions” (third column).
The wave climate indicators measure the change in mean SWH and in wave periods during stormy and storm surge conditions and are shown in Figure 8. It was computed as changes in wave height and wave periods from one single ensemble forced model result (see Wave projections under “stormy conditions” and “storm surge conditions”). During stormy conditions, the change in wave height in the future is negligible (Figure 8, second column). Nevertheless, during storm surge conditions (exceeding 20 years return value), the simulated wave height is projected to double in the near future (Figure 8, third column), and the wave period may also increase by about 1.5 second (Figure 8). The results indicate a possible increased coastal risk from the combined effects of storm surge and waves. For municipalities, it is quite relevant to coastal planning.
Uncertainty of the wave projection has numerous ways to assess, including multi-models, multi-scenarios, and uncertainty of SLR, etc. A multi-model ensemble is frequently necessary in order to conduct a comprehensive risk assessment for a wave model climate projection study. However, prior to the estimation of the level of uncertainty, our study presents first insight into a more pressing problem that must be investigated, namely, whether or not increasing disastrous wind waves may be a concern in our study region. From our model results, it is evident that mean SLR and the associated uncertainty are the most important threats to the coasts under RCP8.5 scenario (Figure 8). Therefore, we contend that uncertainty of wind wave height and period, based on a multi-model ensemble, is of secondary importance in this region. The arguments listed below also support our conclusions.
Firstly, the existing multi-model ensemble based on GCMs is insufficient to systematically sample the uncertainty associated with wave-climate projections (Hemer et al., 2013). While the comparison of high wind events among EURO-CORDEX members is essential in this work, the effects of extreme wind on climate scenario simulations have not been thoroughly addressed in prior ensemble studies (Kunz et al., 2010). Other relevant parameters, such as the time averaged wind field and mean sea level pressure, have been carefully investigated in a number of papers (Kotlarski et al., 2014; Jacob et al., 2014; Tobin et al., 2016; Moemken et al., 2018). We illustrate, using a time series of annual maximum wind speed from Køge Bay, why ensemble averages of the highest wind fields are inappropriate for our investigation (Figure 3). It is worth noting that among all RCMs, in Køge Bay HIRHAM annual maximum coastal winds are the strongest, but this result cannot be generalized. We analyzed several locations (not shown) and found HIRHAM results lower than other RCMs. Following the analysis from Kotlarski et al. (2014), we conclude that the wind results of DMI-HIRHAM are within the ensemble spread. However, extreme winds across Europe should be investigated further, particularly in comparison to observed winds during catastrophic events. Without a systematic assessment of the uncertainty of extreme winds, the quantification of the uncertainty of the wave projections remains unreliable.
Secondly, the uncertainty associated with multi-scenarios is impractical for coastal risk management. The main use of various climate scenarios is for mitigation measures, which is not very relevant for wave climate projections. In particular, sea state conditions in scenarios with low greenhouse gas emissions are similar to present day values. In this paper, we focus on the high greenhouse gas emission scenario, which offers a foundation for risk management to be well-prepared for the intensifying future weather extremes. Furthermore, the regional wave model climate simulation is costly. It is reasonable to question whether the benefits of uncertainty quantification based on model ensembles outweigh the costs.
Another relevant concern of the wave disaster is the wave run-up. Wave run-up is an important component of coastal flooding and erosion processes, particularly under extreme conditions when it is paired with high tides and storm surges (Senechal et al., 2011). For the climate projection study, an empirical formula for wave run-up may be utilized based on probabilistic models for surge, wave and morphological conditions. However, the complexity of wave run-up on realistic cross-shore profiles precludes analytical solutions; hence, simplified wave run-up formulae should rely on field observations and laboratory experimentation (Didier et al., 2015; Park and Cox, 2016). The complexity of the Køge Bay shoreline is also the reason the municipalities near the Køge Bay stressed that they require spatially high-resolution wave data sets that cover the local coasts of their urban and sub-urban municipalities at a spatial resolution of 100 meters to resolve wave run-ups (Madsen et al., 2019). We argue that the risk management for the disaster of the wave run-up is associated with storm surge conditions, which is in line with our suggestions in this paper, i.e. storm surges under SLR are the most important threat to concern. Moreover, a very high resolution wave model is beyond the capability of our operational wave model in its present configuration. In other words, warnings related to wave run-up and storm surges are merged in the present day. Consequently, we believe that the wave run-up study is more pertinent to understanding wave-surge coupling processes using a high resolution coupled wave-circulation model, such as the study in Staneva et al. (2016); Ding et al. (2020). Then, the spatial resolution of the meteorological forcing of RCMs, (12.5,km) is not suitable for this study; hence, it falls beyond the scope of the wave projection work.
Model results of extreme sea level and wave events aid decision-making in the domain of coastal zone management, planning, and defense. In Denmark, these choices are determined at the municipal level, with cooperation from the Danish Coastal Authority. Our research region, Køge Bay, serves as a recreational area and port sector for the Copenhagen metropolitan area, and has experienced tremendous expansion in services, trade, transport, and logistics, among other industries. Consequently, the vulnerability to extreme flooding event has increased with the urbanization in recent years (Sørensen, 2016). To quantify the risk assessment, a damage model and decision-making tools would be required (Halsnæs and Kaspersen, 2018), which is outside the scope of this study. Consequently, we only present the qualitative implications of our model results for climate risk management.
Due to the fact that coastal climate change significantly increases the danger of flooding from storm surges, adaptation offers obvious advantages for municipalities, particularly when long-term planning is considered (Zougmore et al., 2012). The targeted coastal climate information derived from our data and methods will assist municipalities in making future business decisions by establishing a credible foundation for decision making and prioritizing resources for coastal climate adaptation. Our model experiment revealed that mean SLR is the most important threat to the coasts under a high emission scenario. In the future, the coastal hazards under SLR scenarios should be considered for future spatial planning and urban recreational development. We propose that the risk caused by wind-generated waves is of secondary significance for long-term coastal zone planning. The combined effects of mean SLR, storm surge, and waves are anticipated to enhance the threat to Køge Bay, and should thus be considered first.
The connection between climate data and decision-making should be strengthened so that society can manage the risks and possibilities associated with climate change. Effective engagement between users and providers of climate services is a crucial component of any climate service, according to Hewitt et al. (2012); the added value of the Danish Climate Atlas initiatives (Su et al., 2021) is precisely this. The research from the Danish Climate Atlas reveals that a rise in mean sea level will significantly increase the risk of flooding from storm surges in the study region, with significant economic consequences. Our wave model results were communicated during the subsequent workshop on designing climate indicators for the wave catastrophe. The municipalities recognized that this study is a first step in the development of a paradigm for wave projections.
The aim of this research is to analyze the change in storm surge and wind wave (surge-wave) components of the water level caused by climate change in the low tidal range Køge Bay, located near the Baltic Sea entrance. We utilized a regional climate model driven wave model to study the wave climate projections in the near future under RCP8.5 scenario. Under “stormy” conditions, we find that wave height and period will not change significantly in the future. It is possible that under “storm surge conditions” when taking into account SLR, the wave height may double and the wave period increase by around 1.5 seconds under RCP8.5. This is due to future storm surge events being linked to high-significance wave height events when sea level is rising. The results indicate that the flooding and erosive threats to a bay with a similar coastline and exposure as Køge Bay are expected to grow due to the combined effects of mean SLR, storm surge, and wind waves. Storm surges are the major threats, but additional wave run-up protection should be prioritized in the near future.
Additionally, our studies advocate that long-term urban planning should include adaptation as a component of initiatives to mitigate the consequences of climate change. For example, one of Denmark’s greatest climate adaptation projects is located south of Copenhagen, and involves the elevation and expansion of dikes, as well as the development of additional flood gates (Danish Nature Agency [DNA], 2013). This work gives a first step toward developing a paradigm for climate wave projections in the study region, i.e. wave information should be considered only when combining storm surge and SLR.
The datasets for this study can be found in the Climate Data Store (CDS) from Copernicus Climate Change Service, at https://climate.copernicus.eu/climate-change-koge-bay-region-baltic-sea.
JS: Drafting of manuscript, analysis and interpretation of data. JM: Acquisition of data, analysis and interpretation of data. JN: Performed the model simulation required for derivation of indicators. KM: Study conception and design, project coordinator. All authors contributed to manuscript revision, read, and approved the submitted version.
This work is co-funded by CoDEC and Danish Climate Atlas projects. CODEC is funded by the Copernicus Climate Change Service the C3S_422_Lot2_Deltares contract on coastal climate change. Danish Climate Atlas is funded by the Danish State.
We would like to thank Dr. Ole Bøssing Christensen for his advice and assistance with the regional climate model analyses.
The authors declare that the research was conducted in the absence of any commercial or financial relationships that could be construed as a potential conflict of interest.
All claims expressed in this article are solely those of the authors and do not necessarily represent those of their affiliated organizations, or those of the publisher, the editors and the reviewers. Any product that may be evaluated in this article, or claim that may be made by its manufacturer, is not guaranteed or endorsed by the publisher.
Danish Nature Agency [DNA]. (2013). Klimatilpasningsplaner og klimalokalplaner - guidelines. Available at: http://www.klimatilpasning.dk/media/598918/klimatilpasningsvejledning_web.pdf (Accessed Jan 21, 2021).
Andrée E., Su J., Larsen M. A. D., Madsen K. S., Drews M. (2021). Simulating major storm surge events in a complex coastal region. Ocean Model. 162, 101802. doi: 10.1016/j.ocemod.2021.101802
Ara Begum R., Lempert R., Ali E., Benjaminsen T., Bernauer T., Cramer W., et al. (2022). “Point of departure and key concepts,” in The intergovernmental panel on climate change (Cambridge, United Kingdom and New York, NY, USA: Cambridge University Press). Available at: https://www.ipcc.ch/report/ar6/wg2/downloads/report/IPCC_AR6_WGII_Chapter01.pdf.
Arns A., Wahl T., Haigh I., Jensen J., Pattiaratchi C. (2013). Estimating extreme water level probabilities: A comparison of the direct methods and recommendations for best practise. Coast. Eng. 81, 51–66. doi: 10.1016/j.coastaleng.2013.07.003
Berg P., Poulsen J. W. (2012). Implementation details for HBM. Tech. Rep., 12–11. Danish Meteorological Institute.
Camus P., Losada I. J., Izaguirre C., Espejo A., Menéndez M., Pérez J. (2017). Statistical wave climate projections for coastal impact assessments. Earth’s Future 5, 918–933. doi: 10.1002/2017EF000609
Cannaby H., Palmer M. D., Howard T., Bricheno L., Calvert D., Krijnen J., et al. (2016). Projected sea level rise and changes in extreme storm surge and wave events during the 21st century in the region of Singapore. Ocean Sci. 12, 613–632. doi: 10.5194/os-12-613-2016
Cardona O.-D., van Aalst M. K., Birkmann J., Fordham M., McGregor G., Perez R., et al. (2012). Determinants of risk: Exposure and vulnerability (Cambridge, United Kingdom and New York, NY, USA: Cambridge University Press, 65–108. doi: 10.1017/CBO9781139177245.005
Casas-Prat M., Wang X., Swart N. (2018). CMIP5-based global wave climate projections including the entire Arctic ocean. Ocean Model. 123, 66–85. doi: 10.1016/j.ocemod.2017.12.003
Cherneva Z., Andreeva N., Pilar P., Valchev N., Petrova P., Guedes Soares C. (2008). Validation of the WAMC4 wave model for the black Sea. Coast. Eng. 55, 881–893. doi: 10.1016/j.coastaleng.2008.02.028
Christensen O. B., Christensen J. H., Machenhauer B., Botzet M. (1998). Very high-resolution regional climate simulations over Scandinavia–present climate. J. Climate 11, 3204–3229. doi: 10.1175/1520-0442(1998)011<3204:VHRRCS>2.0.CO
Clemmensen L. B., Glad A. C., Kroon A. (2016). Storm flood impacts along the shores of micro-tidal inland seas: A morphological and sedimentological study of the vesterlyng beach, the belt Sea, Denmark. Geomorphology 253, 251–261. doi: 10.1016/j.geomorph.2015.10.020
European Commission [EC]. (2019). Flood risk management - water - environment - European commission. Available at: https://ec.europa.eu/environment/water/flood_risk/ (Accessed Jan 21, 2021).
Debernard J. B., Røed L. P. (2008). Future wind, wave and storm surge climate in the northern seas: a revisit. Tellus A: Dynamic Meteorology Oceanography 60, 427–438. doi: 10.1111/j.1600-0870.2007.00312.x
Didier D., Bernatchez P., Boucher-Brossard G., Lambert A., Fraser C., Barnett R. L., et al. (2015). Coastal flood assessment based on field debris measurements and wave runup empirical model. J. Mar. Sci. Eng. 3, 560–590. doi: 10.3390/jmse3030560
Ding Y., Ding T., Rusdin A., Zhang Y., Jia Y. (2020). Simulation and prediction of storm surges and waves using a fully integrated process model and a parametric cyclonic wind model. J. Geophysical Research: Oceans 125, e2019JC015793. doi: 10.1029/2019JC015793
Ditlevsen C., Ramos M., Sørensen C., Ciocan U., Piontkowitz T. (2019). Højvandsstatistikker 2017. Tech. Rep. Kystdirektoratet.
Dobrynin M., Murawsky J., Yang S. (2012). Evolution of the global wind wave climate in CMIP5 experiments. Geophysical Res. Lett. 39:L18606 doi: 10.1029/2012GL052843
Fu W., She J., Dobrynin M. (2012). A 20-year reanalysis experiment in the Baltic Sea using three-dimensional variational (3DVAR) method. Ocean Sci. 8, 827–844. doi: 10.5194/os-8-827-2012
Grabemann I., Weisse R. (2008). Climate change impact on extreme wave conditions in the north Sea: an ensemble study. Ocean Dynamics 58, 199–212. doi: 10.1007/s10236-008-0141-x
Hallegatte S., Henriet F., Corfee-Morlot J. (2011a). The economics of climate change impacts and policy benefits at city scale: a conceptual framework. Climatic Change 104, 51–87. doi: 10.1007/s10584-010-9976-5
Hallegatte S., Ranger N., Mestre O., Dumas P., Corfee-Morlot J., Herweijer C., et al. (2011b). Assessing climate change impacts, sea level rise and storm surge risk in port cities: a case study on Copenhagen. Climatic Change 104, 113–137. doi: 10.1007/s10584-010-9978-3hallegatte2011assessing
Halsnæs K., Kaspersen P. S. (2018). Decomposing the cascade of uncertainty in risk assessments for urban flooding reflecting critical decision-making issues. Climatic Change 151, 491–506. doi: 10.1007/s10584-018-2323-y
Hemer M. A., Fan Y., Mori N., Semedo A., Wang X. L. (2013). Projected changes in wave climate from a multi-model ensemble. Nat. Climate Change 3, 471–476. doi: 10.1038/nclimate1791
Hewitt C., Mason S., Walland D. (2012). The global framework for climate services. Nat. Climate Change 2, 831–832. doi: 10.1038/nclimate1745
Idier D., Bertin X., Thompson P., Pickering M. D. (2019). Interactions between mean Sea level, tide, surge, waves and flooding: Mechanisms and contributions to Sea level variations at the coast. Surveys Geophysics 40, 1603–1630. doi: 10.1007/s10712-019-09549-5
IPCC (2012). Managing the risks of extreme events and disasters to advance climate change adaptation (Cambridge, England: Cambridge University Press).
Jacob D., Petersen J., Eggert B., Alias A., Christensen O. B., Bouwer L. M., et al. (2014). EURO-CORDEX: New high-resolution climate change projections for European impact research. Regional Environ. Change 14, 563–578. doi: 10.1007/s10113-013-0499-2
Jebens M., Sorensen C., Piontkowitz T. (2016). Dynamics and modelling of ocean waves,” in E3S Web of Conferences, (Cambridge, United Kingdom: Cambridge University Press) 7, 23005. doi: 10.1051/e3sconf/20160723005
Komen G. J., Cavaleri L., Donelan M., Hasselmann K., Hasselmann S., Janssen P. A. E. M. (1996). Dynamics and modelling of ocean waves.
Kotlarski S., Keuler K., Christensen O. B., Colette A., Déqué M., Gobiet A., et al. (2014). Regional climate modeling on European scales: a joint standard evaluation of the EURO-CORDEX RCM ensemble. Geoscientific Model. Dev. 7, 1297–1333. doi: 10.5194/gmd-7-1297-2014
Kunz M., Mohr S., Rauthe M., Lux R., Kottmeier C. (2010). Assessment of extreme wind speeds from regional climate models – part 1: Estimation of return values and their evaluation. Natural Hazards Earth System Sci. 10, 907–922. doi: 10.5194/nhess-10-907-2010
Leach C., Hague B. S., Kennedy D. M., Carvalho R. C., Ierodiaconou D. (2021). Identifying oceanographic conditions conducive to coastal impacts on temperate open coastal beaches. Natural Hazards 109, 499–521. doi: 10.1007/s11069-021-04845-z
Lobeto H., Menendez M., Losada I. J. (2021). Future behavior of wind wave extremes due to climate change. Sci. Rep. 11, 7869. doi: 10.1038/s41598-021-86524-4
Lyddon C., Brown J. M., Leonardi N., Plater A. J. (2018). Flood hazard assessment for a hyper-tidal estuary as a function of tide-surge-morphology interaction. Estuaries Coasts 41, 1565–1586. doi: 10.1007/s12237-018-0384-9
Madsen K. S., Murawski J., Blokhina M., Su J. (2019). Sea Level change: Mapping Danish municipality needs for climate information. Front. Earth Sci. 7. doi: 10.3389/feart.2019.00081
Marcos M., Rohmer J., Vousdoukas M. I., Mentaschi L., Le Cozannet G., Amores A. (2019). Increased extreme coastal water levels due to the combined action of storm surges and wind waves. Geophysical Res. Lett. 46, 4356–4364. doi: 10.1029/2019GL082599
Medvedev I. P., Rabinovich A. B., Kulikov E. A. (2016). Tides in three enclosed basins: The Baltic, black, and Caspian seas. Front. Mar. Sci. 3. doi: 10.3389/fmars.2016.00046
Meucci A., Young I. R., Hemer M., Kirezci E., Ranasinghe R. (2020). Projected 21st century changes in extreme wind-wave events. Sci. Adv. 6, eaaz7295. doi: 10.1126/sciadv.aaz7295
Moemken J., Reyers M., Feldmann H., Pinto J. G. (2018). Future changes of wind speed and wind energy potentials in EURO-CORDEX ensemble simulations. J. Geophysical Research: Atmospheres 123, 6373–6389. doi: 10.1029/2018JD028473
Morim J., Hemer M., Cartwright N., Strauss D., Andutta F. (2018). On the concordance of 21st century wind-wave climate projections. Global Planetary Change 167, 160–171. doi: 10.1016/j.gloplacha.2018.05.005
Morim J., Hemer M., Wang X. L., Cartwright N., Trenham C., Semedo A., et al. (2019). Robustness and uncertainties in global multivariate wind-wave climate projections. Nat. Climate Change 9, 711–718. doi: 10.1038/s41558-019-0542-5
Morim J., Vitousek S., Hemer M., Reguero B., Erikson L., Casas-Prat M., et al. (2021). Global-scale changes to extreme ocean wave events due to anthropogenic warming. Environ. Res. Lett. 16, 074056. doi: 10.1088/1748-9326/ac1013
Muis S., Verlaan M., Winsemius H. C., Aerts J. C., Ward P. J. (2016). A global reanalysis of storm surges and extreme sea levels. Nat. Commun. 7, 11969. doi: 10.1038/ncomms11969
Pappa M. (2019) Social vulnerability to coastal floods in Denmark: Investigating the spatial patterns among the Danish. Available at: https://projekter.aau.dk/projekter/files/307155336/PappaMariathesis.pdf (Accessed May 31, 2022).
Park H., Cox D. T. (2016). Empirical wave run-up formula for wave, storm surge and berm width. Coast. Eng. 115, 67–78. doi: 10.1016/j.coastaleng.2015.10.006
Perez J., Menendez M., Camus P., Mendez F. J., Losada I. J. (2015). Statistical multi-model climate projections of surface ocean waves in Europe. Ocean Model. 96, 161–170. doi: 10.1016/j.ocemod.2015.06.001
Permanent Service for Mean Sea Level (PSMSL) (2020). Available at: http://www.psmsl.org/data/obtaining/. [Dataset]
Sørensen C. S. (2016). “Water NOT wanted-coastal floods and flooding protection in Denmark,” in Sicherung von dämmen, deichen und stauanlagen: Handbuch für theorie und praxis. Eds. Herrmann R. A., Jensen J. (Siegen: Universität Siegen), 3–21.
Sass B. H., Nielsen N. W., Jørgensen J. U., Amstrup B., Kmit M., Mogensen K. S. (2002). “The operational DMI-HIRLAM system 2002-version,” in Technical report 02-05 (Copenhagen, Denmark.: Danish Meteorological Institute).
Senechal N., Coco G., Bryan K. R., Holman R. A. (2011). Wave runup during extreme storm conditions. J. Geophysical Research: Oceans 116, C07032. doi: 10.1029/2010JC006819
She J., Nielsen J. W. (2019). Silent’ storm surge extremes in the western Baltic Sea on 4 January 2017. J. Operational Oceanography 12, S111–S11+. doi: 10.1080/1755876X.2019.1633075
Sistermans P., Nieuwenhuis O. (2004) EUROSION case study - Køge Bay. Available at: http://copranet.projects.eucc-d.de/files/000110_EUROSION_koge_bay.pdf (Accessed March 1, 2022).
Staneva J., Wahle K., Koch W., Behrens A., Fenoglio-Marc L., Stanev E. V. (2016). Coastal flooding: impact of waves on storm surge during extremes – a case study for the German bight. Natural Hazards Earth System Sci. 16, 2373–2389. doi: 10.5194/nhess-16-2373-2016
Su J., Andrée E., Nielsen J. W., Olsen S. M., Madsen K. S. (2021). Sea Level projections from IPCC special report on the ocean and cryosphere call for a new climate adaptation strategy in the skagerrak-kattegat seas. Front. Mar. Sci. 8. doi: 10.3389/fmars.2021.629470
Tobin I., Jerez S., Vautard R., Thais F., van Meijgaard E., Prein A., et al. (2016). Climate change impacts on the power generation potential of a European mid-century wind farms scenario. Environ. Res. Lett. 11, 34013. doi: 10.1088/1748-9326/11/3/034013
Undén P., Rontu L., Jarvinen H., Lynch P., Calvo Sánchez F. J., Cats G., et al. (2002). HIRLAM-5 scientific documentation. Tech. Rep. Swedish Meteorological and Hydrological.
Wolf J. (2009). Coastal flooding: impacts of coupled wave–surge–tide models. Natural Hazards 49, 241–260. doi: 10.1007/s11069-008-9316-5Wolf2009
Woodworth P. L., Melet A., Marcos M., Ray R. D., Wöppelmann G., Sasaki Y. N., et al. (2019). Forcing factors affecting sea level changes at the coast. Surveys Geophysics 40, 1351–1397. doi: 10.1007/s10712-019-09531-1
Zougmore R., Kadi M., McGregor G. R., Rao P., Pulwarty R., Ndiaye O., et al. (2012). “Improving climate risk management at local level - techniques, case studies, good practices and guidelines for world meteorological organization members,” in Risk management - current issues and challenges. Ed. Banaitiene N. (London, United Kingdom: IntechOpen).
Keywords: climate change, Wave projection, Significant wave height, wave period, Sea state modelling, Risk management
Citation: Su J, Murawski J, Nielsen JW and Madsen KS (2022) Regional wave model climate projections for coastal impact assessments under a high greenhouse gas emission scenario. Front. Mar. Sci. 9:910088. doi: 10.3389/fmars.2022.910088
Received: 31 March 2022; Accepted: 21 September 2022;
Published: 18 October 2022.
Edited by:
Giovanni Besio, University of Genoa, ItalyReviewed by:
Han Soo Lee, Hiroshima University, JapanCopyright © 2022 Su, Murawski, Nielsen and Madsen. This is an open-access article distributed under the terms of the Creative Commons Attribution License (CC BY). The use, distribution or reproduction in other forums is permitted, provided the original author(s) and the copyright owner(s) are credited and that the original publication in this journal is cited, in accordance with accepted academic practice. No use, distribution or reproduction is permitted which does not comply with these terms.
*Correspondence: Jian Su, amlzQGRtaS5kaw==
Disclaimer: All claims expressed in this article are solely those of the authors and do not necessarily represent those of their affiliated organizations, or those of the publisher, the editors and the reviewers. Any product that may be evaluated in this article or claim that may be made by its manufacturer is not guaranteed or endorsed by the publisher.
Research integrity at Frontiers
Learn more about the work of our research integrity team to safeguard the quality of each article we publish.