- 1Ocean and Ecosystem Sciences Division, Bedford Institute of Oceanography, Fisheries and Oceans Canada, Dartmouth, NS, Canada
- 2Department of Oceanography, Dalhousie University, Halifax, NS, Canada
- 3Maurice Lamontagne Institute, Fisheries and Oceans Canada, Mont-Joli, QC, Canada
- 4Zachry Department of Civil and Environmental Engineering, Texas A&M University, College Station, TX, United States
- 5Center for Natural Resources, The New Jersey Institute of Technology, Newark, NJ, United States
The freshwater transport (FWT) by the Labrador Current (LC) around the Grand Banks of Newfoundland (GBN) is diagnosed with the 26-year Global Ocean Physical Reanalysis 1/12° data (GLORYS12v1) during 1993 - 2018. The time-mean FWT of the LC above the 1027.25 kg/m3 isopycnal surface is 83.6 mSv (1 mSv = 103m3/s) southward through the Flemish Pass. Among this 83.6 mSv, 42% (35.2 mSv) is exported into the interior of the North Atlantic along the whole pathway of the LC from the Flemish Pass to the Tail of the GBN, with 25.5 mSv by the mean advection and 7.2 mSv by the mesoscale eddy transport. The seasonal and inter-annual variations of the FWT in the east of the GBN are mainly caused by the variation of the horizontal velocity of the LC, and the variation of salinity makes a nontrivial contribution to the variation of the FWT to the north of 45°N. Around the Tail of the GBN, the mesoscale eddies make significant contributions to the time-mean FWT and the seasonal and inter-annual variations of the FWT.
1 Introduction
The Labrador Current (LC) flows southward offshore of Labrador and Newfoundland, carrying cold and fresh water to meet the warm and salty water of the North Atlantic Current (NAC) in the east and south of the Grand Banks of Newfoundland (GBN), as shown schematically in Figure 1. The freshwater within the LC enters the interior of the North Atlantic through different processes, such as the wind-driven Ekman transport, eddy exchange (Howatt et al., 2018) and advection by the time-mean flow (Fratantoni and McCartney (2010), hereinafter referred to as F&M2010). This freshwater, entering the interior of the North Atlantic, modifies the upper layer stratification. Eventually, the strength of upper layer stratification in the subpolar North Atlantic affects the amount of deep water formation through vertical convection in winter and hence tunes the Atlantic Meridional Overturning Circulation (AMOC) that has a strong impact on climate (e.g., Zhang, 2015). Studies have suggested a linkage between freshwater discharge into the North Atlantic and the climate variability (Renssen et al., 2002).
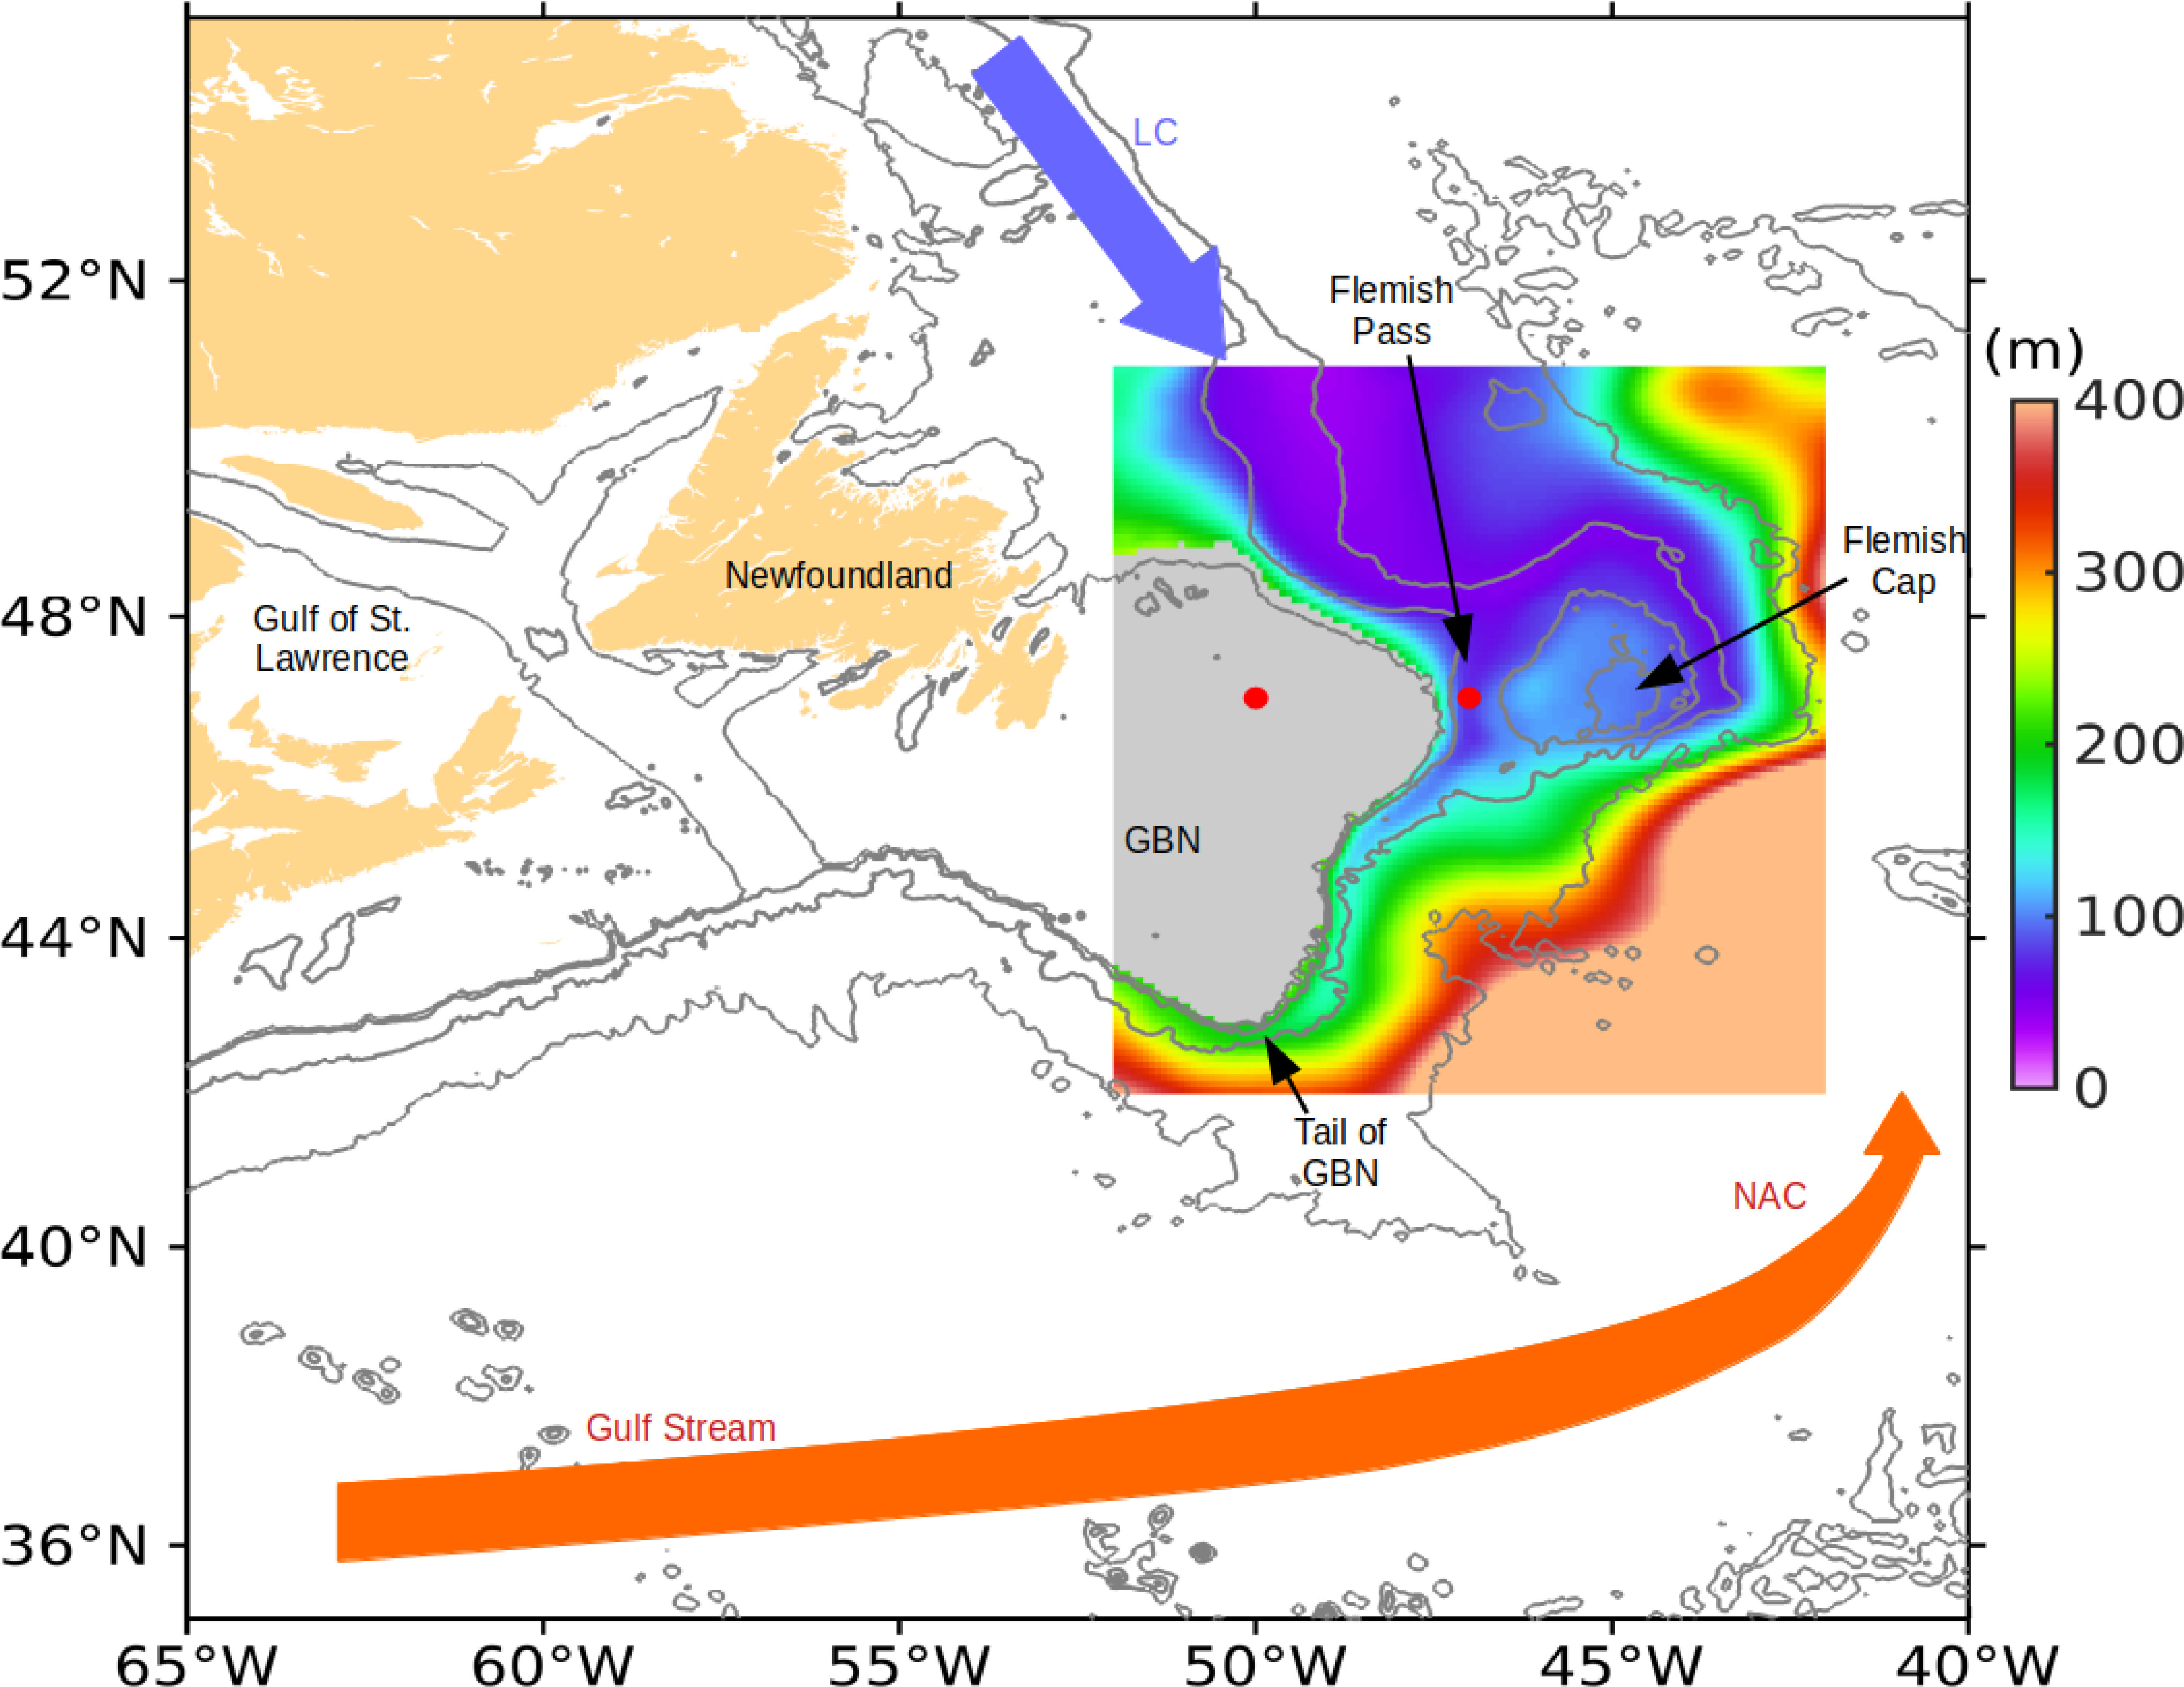
Figure 1 The western North Atlantic with the red and blue vectors denoting the direction of the North Atlantic Current (NAC) and Labrador Current (LC). The box outlines the Grand Banks of Newfoundland (GBN) and adjacent oceans. The color shading shows the depth of the isopycnal surface of 1027.25 kg/m3 determined from the potential density averaged over 1993 - 2018. In grey shaded area, the maximum potential density is less than 1027.25 kg/m3. Black contours are isobaths of 200 m, 500 m, 2000 m and 4000 m. The two red dots at (50°W, 47°N) and (47°W, 47°N) are the positions for calculating the sea surface height differences shown in Figure 9.
As a confluence of the West Greenland Current, the Baffin Island Current and the outflow from the Hudson Strait, the LC has multiple freshwater sources: the Arctic seawater, river discharge and ice sheet melting from continents. The Arctic Ocean exports its freshwater into the LC through two main pathways: one through the Fram Strait and continuing along the east and then west coasts of Greenland (Aagaard and Carmack, 1989); the other through the Canadian Arctic Archipelago (CAA) to the Baffin Bay and the Davis Strait (Cuny et al., 2005). Additionally, a small portion of the Arctic water flows through the Fury and Hecla Straits into the Hudson Bay and outflows through the Hudson Strait (Straneo and Saucier, 2008). The discharge of continental rivers into the Hudson Bay and CAA is another freshwater source for the LC (Déry et al., 2009). Moreover, the ice sheets over Greenland are an additional freshwater source for the LC in the form of melting water and sea ice (Mernild et al., 2009).
Receiving freshwater from those sources with significant seasonal variations, the salinity of the LC has an evident seasonal cycle. Using historical hydrographic observation data, F&M2010 studied the seasonal variation of the salinity of the LC within the shelf water layer between the isopycnal surface of 1026.8 kg/m3 and the ocean surface. Overall, they found that the LC south of 51°N is fresher in summer and saltier in winter because of more river discharge and ice melting in summer (Petrie et al., 1991; Schmidt and Send, 2007; Straneo and Saucier, 2008). At the downstream of the LC on the eastern shelf break of the GBN, the salinity anomaly signal can be mainly attributed to advection from upstream rather than being caused locally by the freshwater flux across the air-sea interface (F&M2010).
The LC transports the low salinity water from the upstream, and along its pathway, this freshwater is gradually lost into the interior of the North Atlantic. Previous observations and numerical model simulations (Lazier and Wright, 1993; Han et al., 2008; Ma et al., 2016) have shown that the LC has an inshore branch flowing along the coast of Newfoundland and an offshore branch near the shelf break. A part of the inshore branch of the LC passes through the Avalon Channel, and the other part joins the offshore branch of the LC around 49°N. The offshore branch bifurcates around 48°N ~ 49°N north of the Flemish Pass, with a small portion of freshwater exported eastward but the major part exported southward through the Flemish Pass. The offshore branch of the LC can exchange the freshwater with the interior of the North Atlantic along its pathway. Based on the observations with the gliders, Howatt et al. (2018) revealed that the freshwater can be exported from the Labrador Shelf into the interior of the Labrador Sea by the Ekman transport and mesoscale eddies. They concluded that only a small proportion (approximately 3%) of freshwater originating from the Hudson and Davis Straits is exported across the shelf break into the interior of the Labrador Sea. Observations by Loder et al. (1998) suggested that a large portion of freshwater, carried by the branch of the LC on the shelf break, is lost in the region between Flemish Pass and the Tail of the GBN. F&M2010 suggested that, in the east of the GBN, the retroflection of the LC above the main pycnocline is the primary process of the freshwater transport (FWT) into the interior of the North Atlantic. They described the retroflection of the LC as the “Southwest Corner” of the subpolar gyre overshooting, analogous to the “Northwest Corner” that is the overshooting of the subtropical gyre.
Depending on where the freshwater enters the interior of the North Atlantic, the impacts of freshwater on the upper layer stratification can be different. As the major process of transporting freshwater from the LC to the interior of the North Atlantic, the LC retroflection was previously believed to only occur at the Tail of the GBN. F&M2010 constructed a map to show the depth of the 1027.25 kg/m3 isopycnal surface with the time-mean hydrographic data. They interpreted the contours of the isopycnal surface depth as the streamlines of the geostrophic flows, and suggested that the LC retroflected along the entire pathway of the LC from the Flemish Cap to the Tail of the GBN. While F&M2010 depicted the picture of the FWT with the time-mean retroflection of the LC, they were unable to describe the temporal variations of the FWT or quantify the contribution of the mesoscale eddies due to the temporal-spatial sparseness of the hydrographic surveys and the lack of velocity observations.
In this contribution, a high-resolution, data assimilative global ocean reanalysis product is analyzed to diagnose the spatial and temporal variations of the FWT of the LC near the GBN. This product, referred to as GLORYS12v1, is obtained from the Copernicus Marine Service (CMS, https://marine.copernicus.eu; https://doi.org/10.48670/moi-00021). It has a horizontal resolution of 1/12° in longitude/latitude and 50 levels in the vertical direction and spans from January 1993 to December 2018. The ocean model is based on the Nucleus for European Modelling of the Ocean (NEMO). The assimilated observational data include the sea surface heights (SSH), sea surface temperature and sea ice concentration retrieved from satellite remote sensing, and vertical profiles of salinity and temperature from multiple versions of CORA (Coriolis Ocean database for Re-Analysis) database containing ship-board surveys and Argo floats, etc. Comprehensive evaluations of GLORYS12v1 are described in details in a “Quality Information Document” at the CMS website, and also in Lellouche et al. (2018) and Lellouche et al. (2021). These evaluations suggest that GLORYS12v1 possesses good skills in reproducing the observed mean state and mesoscale variations of ocean circulation and salinity, as well as other ocean and sea-ice parameters. We use the monthly-mean GLORYS12v1 output of the salinity and the horizontal velocities to compute the volume flux and FWT.
In section 2, we introduce the method of decomposing the variations of the FWT into different components based on time scales. The results of the time-mean FWT are presented in section 3. Section 4 presents the analysis of the temporal variations of the FWT. Finally, section 5 presents the conclusions and discussion of the results.
2 FWT calculation
2.1 Regional ocean climatology
With the monthly salinity and temperature from GLORYS12v1, the monthly potential density is calculated during 1993 - 2018 for all the 50 levels in the region around the GBN. Following F&M2010, the FWT is calculated for the upper layer with a potential density less than 1027.25 kg/m3. Figure 1 presents the depth of the 1027.25 kg/m3 isopycnal surface, interpolated from the potential density averaged over 1993 - 2018. Along two sections at 45°N and 50°W, Figure 2 shows that this isopycnal surface only varies slightly in different seasons. In Figure 1, the GBN shelf is shaded grey because the maximum density on the seafloor is smaller than 1027.25 kg/m3. The 1027.25 kg/m3 isopycnal surface is shallower than 150 m in the region of the LC and deeper in the NAC region, exceeding 400 m to the south of 42°N. To the east of the shelf break of the GBN, the 1027.25 kg/m3 isopycnal surface shows a ridge shape whose minimum depth is about 150 m at 45°N, and this ridge disappears close to the Tail of the GBN. As described by F&M2010, the contours of this isopycnal depth represent the streamlines of the time-mean geostrophic flow. Thus the map of Figure 1 reveals a retroflection of the LC: the LC flowing southward along the eastern shelf break of the GBN, turning offshore near the Tail of the GBN and continuing flowing northeastward. The map of the depth of the 1027.25 kg/m3 isopycnal surface also indicates a flow meander around (47°W, 44°N), corresponding to a similar meander of the 4000 m isobath. Figure 2 shows the time-mean (a) meridional and (b) zonal velocities across the sections at 45°N and 50°W. On the 45°N section, a steep ridge of the 1027.25 kg/m3 contour appears in the core of the LC around 48.6°W, where the maximum southward velocity reaches 0.5 m/s. On the 50°W section, the same isopycnal does not show a ridge, but the 1027 kg/m3 contour at shallower depth contains a gradual ridge associated with a much weaker time-mean zonal flow. On both sections at 45°N and 50°W, the 34.8 isohaline mainly lies below the 1027.25 kg/m3 isopycnal surface within and adjacent to the LC and shoals rapidly in the region where the NAC is present.
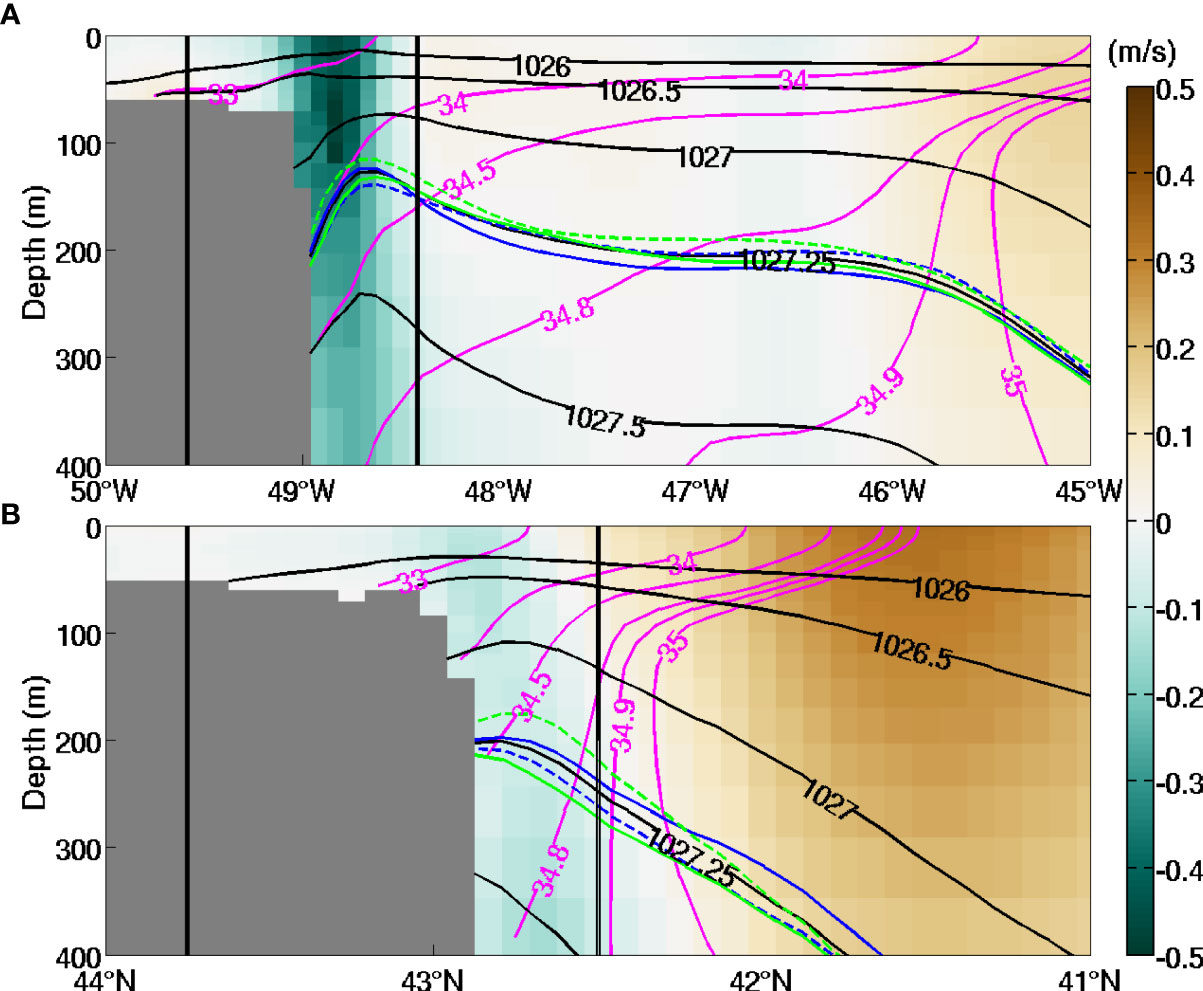
Figure 2 Velocity, salinity and potential density averaged over 1993-2018 on sections at (A) 45°N, and (B) 50°W. Colors present the meridional velocity (northward as positive) in (A) and zonal velocity(eastward as positive) in (B). The magenta and black contours are the isohalines and isopycnals averaged for all the seasons. The seasonal variations of the 1027.25 kg/m3 isopycnals are presented using the solid blue (Winter: January to March), dashed blue (Spring: April to June), solid green (Summer: July to September), and dashed green (Fall: October to December) curves. The two vertical black lines show the locations of sections B and D.
2.2 Freshwater flux
The freshwater flux vector (FWV), , is defined as
Here x,y,z are the coordinates in the zonal, meridional and vertical directions with the positive directions as eastward, northward and upward; t is time; is the horizontal velocity. The non-dimensional variable SR(x,y,z,t) is the relative salinity, defined as
where S(x,y,z,t) is the salinity of the seawater, and Sref is a reference salinity. The value of Sref is set to be 34.8, consistent with the previous studies of the FWT of the LC (Mertz et al., 1993; Petrie and Buckley, 1996).
The salinity and horizontal velocity vary on different time scales, i.e., seasonal, inter-annual and intra-seasonal. In order to investigate the contributions of the variations on different time scales to the variations of the FWT, SR(x,y,z,t) and are decomposed according to
The symbol “ – ” denotes the time-mean quantity, obtained by averaging the monthly data over 1993 - 2018. The symbol “ ~ ” stands for the seasonal cycle, obtained by taking the average of the data of the same calendar month over the 26 years and with the above time-mean value subtracted. The symbol “ * ” denotes the inter-annual anomaly, calculated as averaging the data of each year, again with the time-mean value subtracted. Finally, the symbol “′” denotes the residual that mainly represents the intra-seasonal anomaly mostly due to the mesoscale eddies.
Substituting (3) into (1), the various components of are defined as
The first term on the right-hand-side (r.h.s) of (4) is the time-mean FWV, expressed as
It is obtained by taking the time average of all products of different components of SR and , but only keeping those terms that have a non-zero mean. For example, SR and at different time scales are not correlated hence their products have zero mean values, while SR and at the same time scales can have non-zero mean values.
The second term on the r.h.s of (4) is the seasonal variation, practically obtained by averaging the monthly anomalies of in the same calendar month over different years. Mathematically it can be expressed as
That is, this term represents the sum of the seasonal components that may be contained in the products of various components of SR and . For example, the third term at r.h.s. of (6) comes from the product of the seasonal variations of SR and , which can include a non-zero mean component [second term at r.h.s. of (5)] and a semi-annual variation accounted here as the seasonal component. In practice, all terms at r.h.s. of (6) can be obtained by averaging the monthly anomalies of each product term in the same calendar month over different years. The seasonal components in the products of with and should be very small because the anomalies at different time scales are not correlated, and similarly for products of , , and .
The third term on the r.h.s. of (4) is the inter-annual variations, practically obtained by taking the annual average of the monthly anomalies of . Following the similar argument as deriving equation (6) this term can be approximately expressed as
And finally, the fourth term is the intra-seasonal variation of the FWV, defined as
Figure 3 shows the meridional component of on the section at 45°N. The southward FWV within the LC mostly occurs above the depth of the 1027.25 kg/m3 isopycnal surface. Thus, the layer between the ocean surface and the 1027.25 kg/m3 isopycnal surface is selected for studying the FWT of the LC. In the following, the FWT per unit length (hereinafter referred to as unit FWT), , is obtained by vertically integrating for this layer as
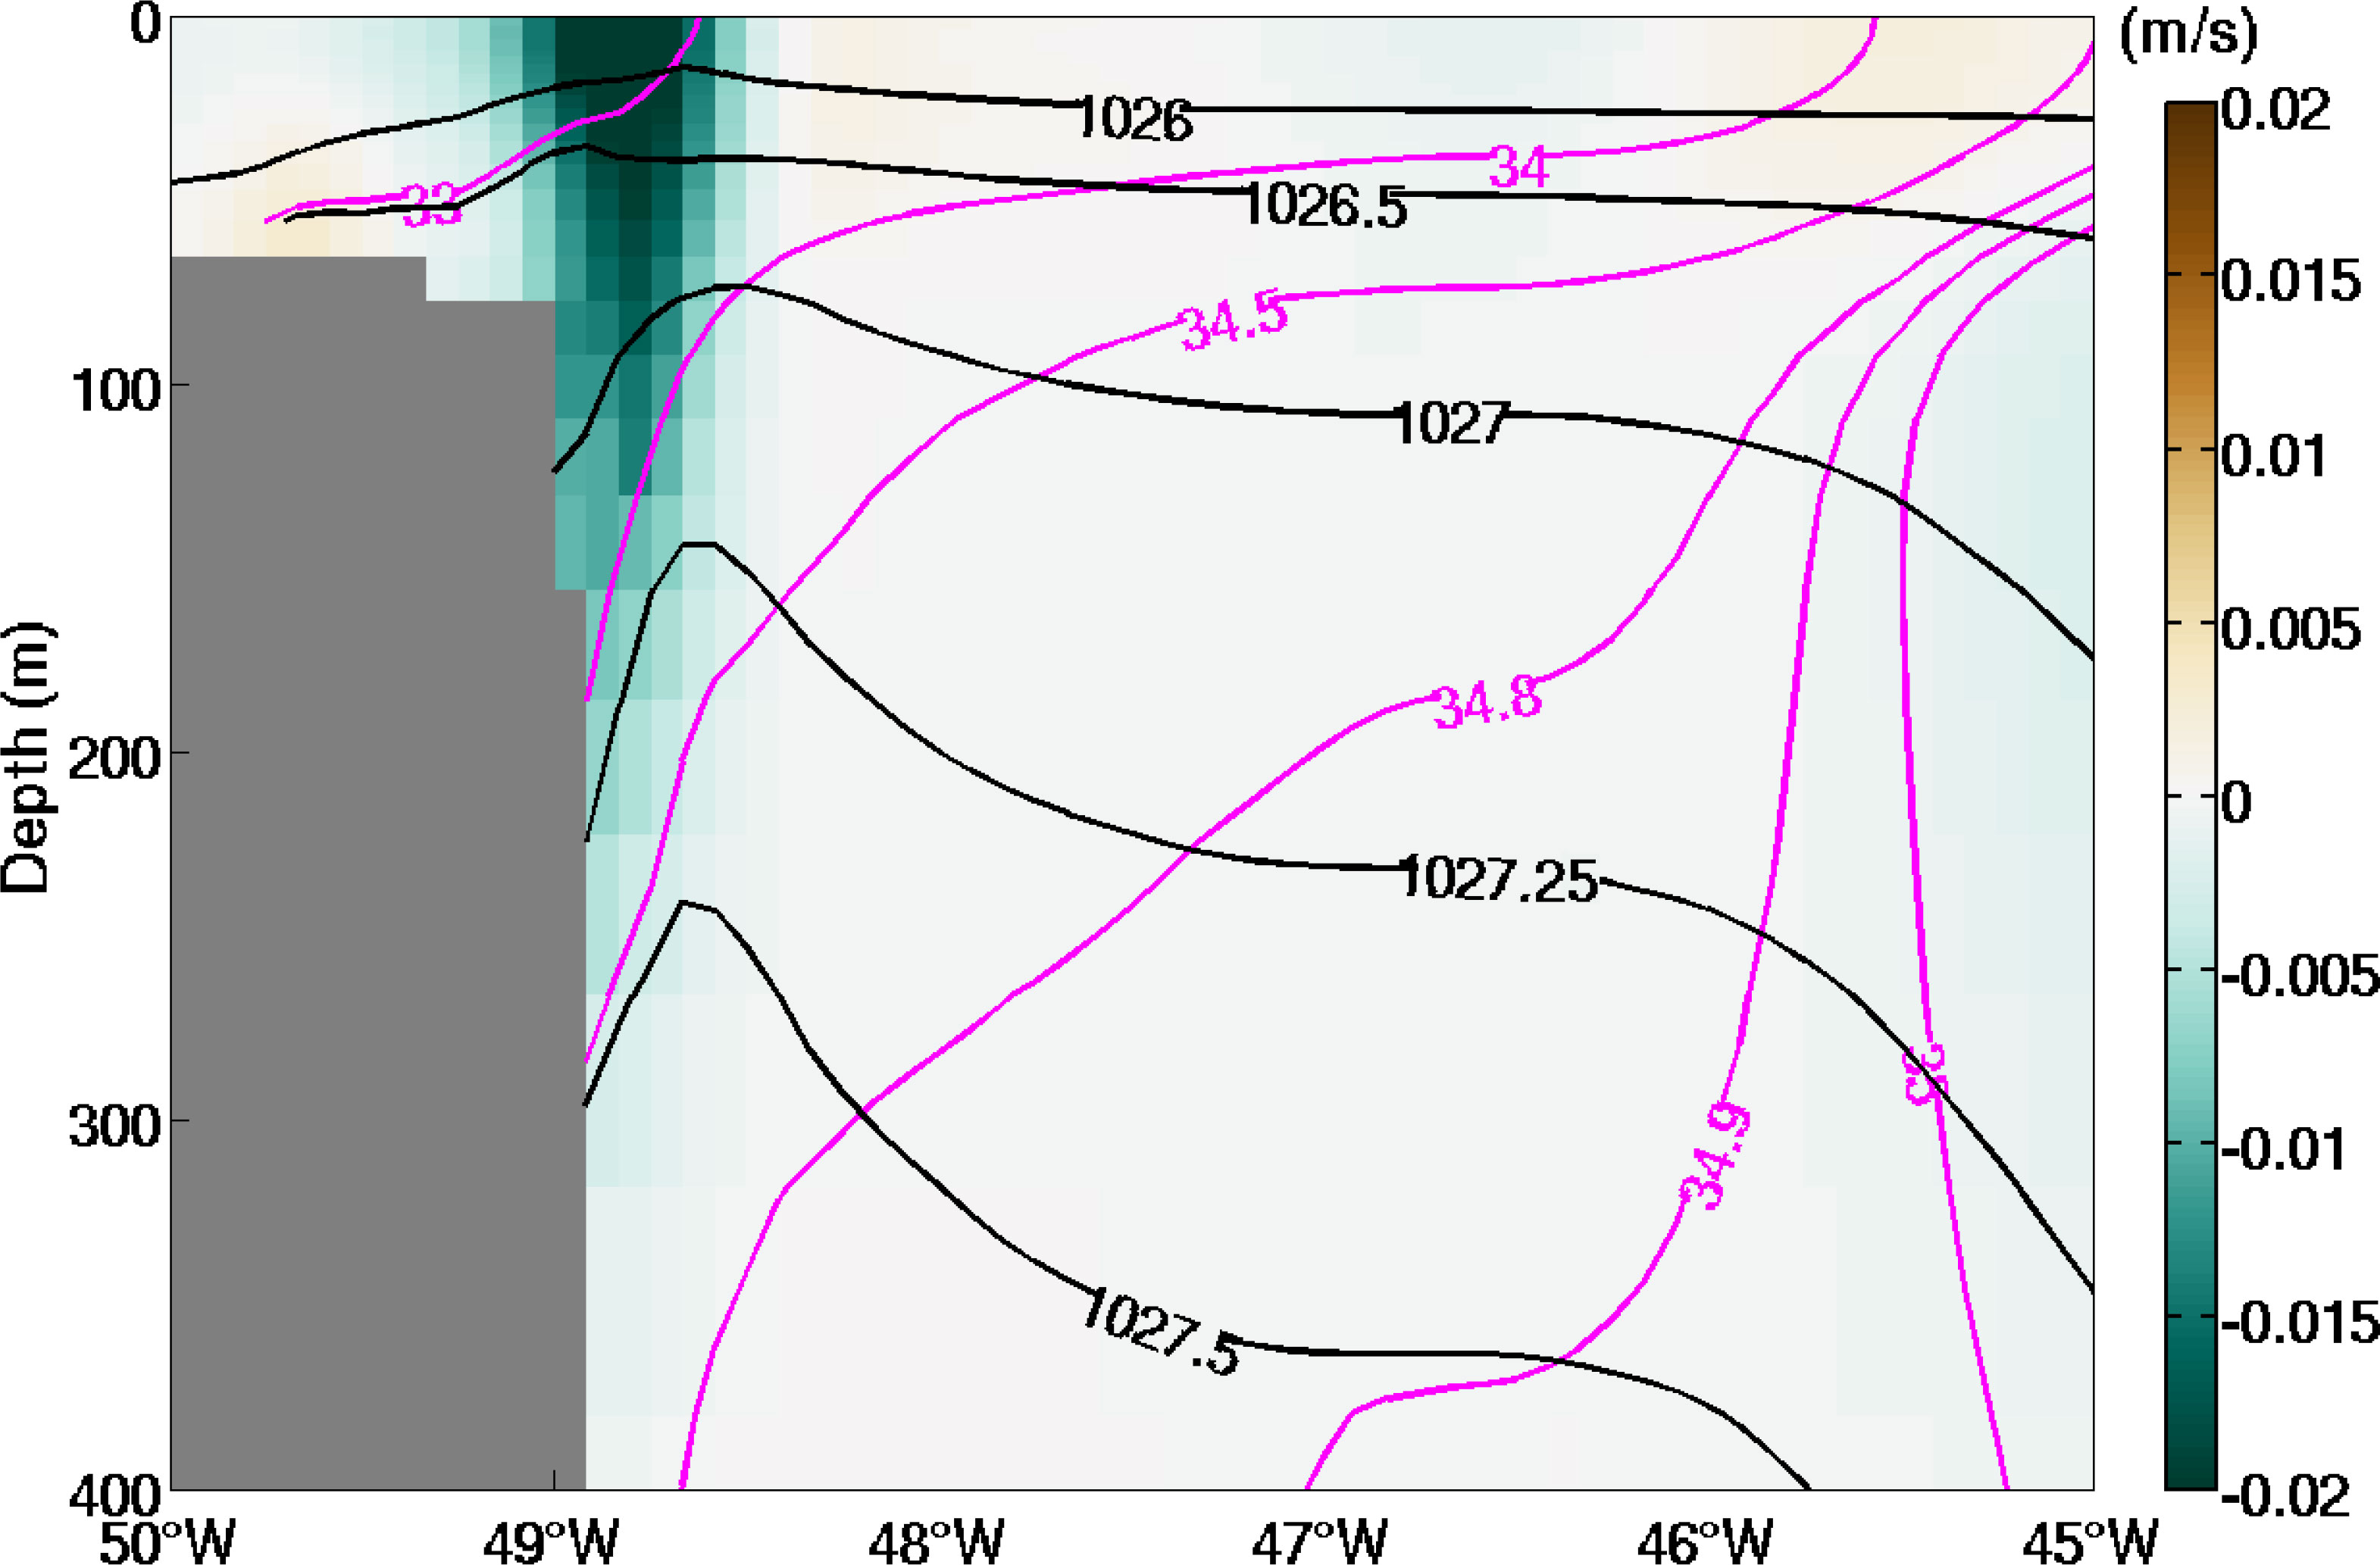
Figure 3 Same as in Figure 2A except that the colors show the meridional component of .
Here, H(x,y) is the depth of the 1027.25 kg/m3
isopycnal surface determined from the time-mean density field (see Figure 1). Replacing in (9) with its components of , , and as given in (5), (6), (7) and (8), we can obtain the time-mean value, and the seasonal, inter-annual and intra-seasonal variations of the FWT per unit length, denoted as , , and , respectively. Additionally, the vertically integrated volume flux per unit length, , is defined as
3 Time-mean FWT
3.1 Horizontal view of the FWT
Figures 4A, B show the horizontal view of and during 1993 - 2018. Because we focus on the transport of seawater with low salinity, the region with the depth-mean salinity greater than Sref is shaded grey. High amplitudes of both and appear on the shelf break of the GBN, indicating the main pathway of the LC. In In Figure 4A, the center-line of the LC (magenta curve) is identified as the locations where the amplitude of are the largest across the LC. Figure 4B shows that the main source of freshwater of the LC on the eastern shelf break of the GBN is the inshore branch of the LC that directs eastward at 49°N. A small portion of splits from the main branch and directs eastward to the north of the Flemish Cap. To the south of 47°N, directs southward, and its amplitude decreases dramatically before reaching the Tail of the GBN. Further offshore, and have opposite directions from those on the shelf break.
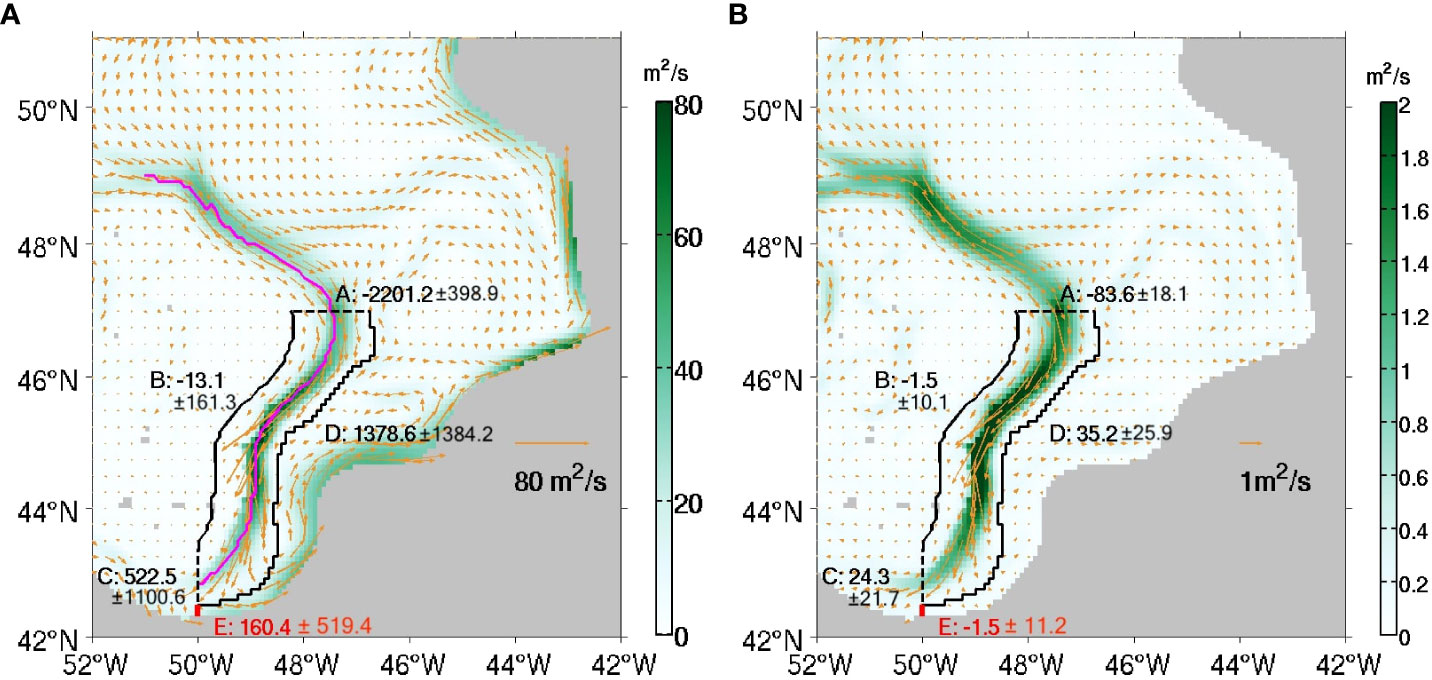
Figure 4 Vectors and color shading: (A) and (B) and their amplitudes. The grey-shaded area represents the region where the salinity, averaged temporally over 1993 - 2018 and vertically above the 1027.25 kg/m3 isopycnal surface, is greater than Sref = 34.8. The magenta curve in (A) marks the centre line of the LC, which is obtained as the locations where the amplitudes of reach the maximum values across the LC. Numbers beside sections A, B, C, D (boundaries of the control volume) and E are the integrals of and along these sections with the units of mSv. Negative (positive) values denote that the fluxes/transports are into (out of) the control volume, or westward (eastward) across section E The values following the ± sign are the standard deviations of the monthly time series.
A control volume is closed by four horizontal sections (marked with A, B, C and D in Figure 4), the mean 1027.25 kg/m3 isopycnal surface (see Figure 1) and the ocean surface. Section D is set at the location where the meridional component of vanishes between 43°N and 47°N. Similarly, at 50°W, the endpoint of section D is located at the position where the zonal component of is equal to zero. Moreover, the point at 43°N and the endpoint at 50°W, obtained from the above steps, are smoothly connected with a cubic polynomial curve. In this way, section D separates the flows with opposite directions, the south- or westward LC and the north- or eastward retroflection of the LC and the NAC. Section B is set to have a fixed distance of 60 km from the center-line of the LC, but its locations do not extend westward of 50°W. Sections A and C are set at the fixed latitude of 47°N and longitude of 50°W, respectively, with the same endpoints as sections B and D. Moreover, a short section E is set to characterize the retroflection of the LC after its westward passing across section C. Section E is along the meridian of 50°W starting from the southern endpoint of section C till the location where the salinity, averaged over time and depth within the layer above the 1027.25 kg/m3 isopycnal surface, equals 34.8. At each boundary of the control volume, a flux/transport is defined as positive (negative) if it is out of (into) the control volume. As for section E, the eastward flux/transport is defined as positive.
The time-mean volume flux and FWT (± standard deviation) across the five sections, defined above in unit of milli-Sverdrup (mSv, 1 mSv = 103 m3/s), are shown in Figure 4. The freshwater is transported into the control volume through sections A and B with the time-mean FWT of 83.6 mSv and 1.5 mSv. The main part of their sum, about 42%, directs out of the control volume across the offshore section D. The outflow of low salinity water across section D mixes with the northeastward NAC, then passes the east of the Flemish Cap to the Northwest Corner. About 29% of the FWT of the LC directs westward across section C. Across section E, the FWT is only 1.5 mSv and directs westward, while the volume flux is eastward with a value of 160.4 mSv that is about 31% of the westward volume flux through section C. The opposite directions between the volume flux and FWT through section E are related to the contributions to FWT by the mesoscale eddies. The FWT and volume flux through these sections have significant amplitude of standard deviations related to seasonal, inter-annual and intra-seasonal variations. The time variations of FWT will be discussed in section 4.
In order to examine the locations where the LC water is exported out of the control volume through section D, the cumulative volume flux and FWT across section D are computed by integrating and starting from the northern endpoint of section D at 47°N till the southern endpoint at 50°W, as shown in Figure 5. The outward volume flux and FWT occur at almost all locations along section D, consistent with the findings of F&M2010 that the retroflection occurs along the whole pathway of the LC in the east of the GBN. Moreover, the outward transports are more intense south of 43.5°N, indicating that a larger proportion of the retroflection takes place there.
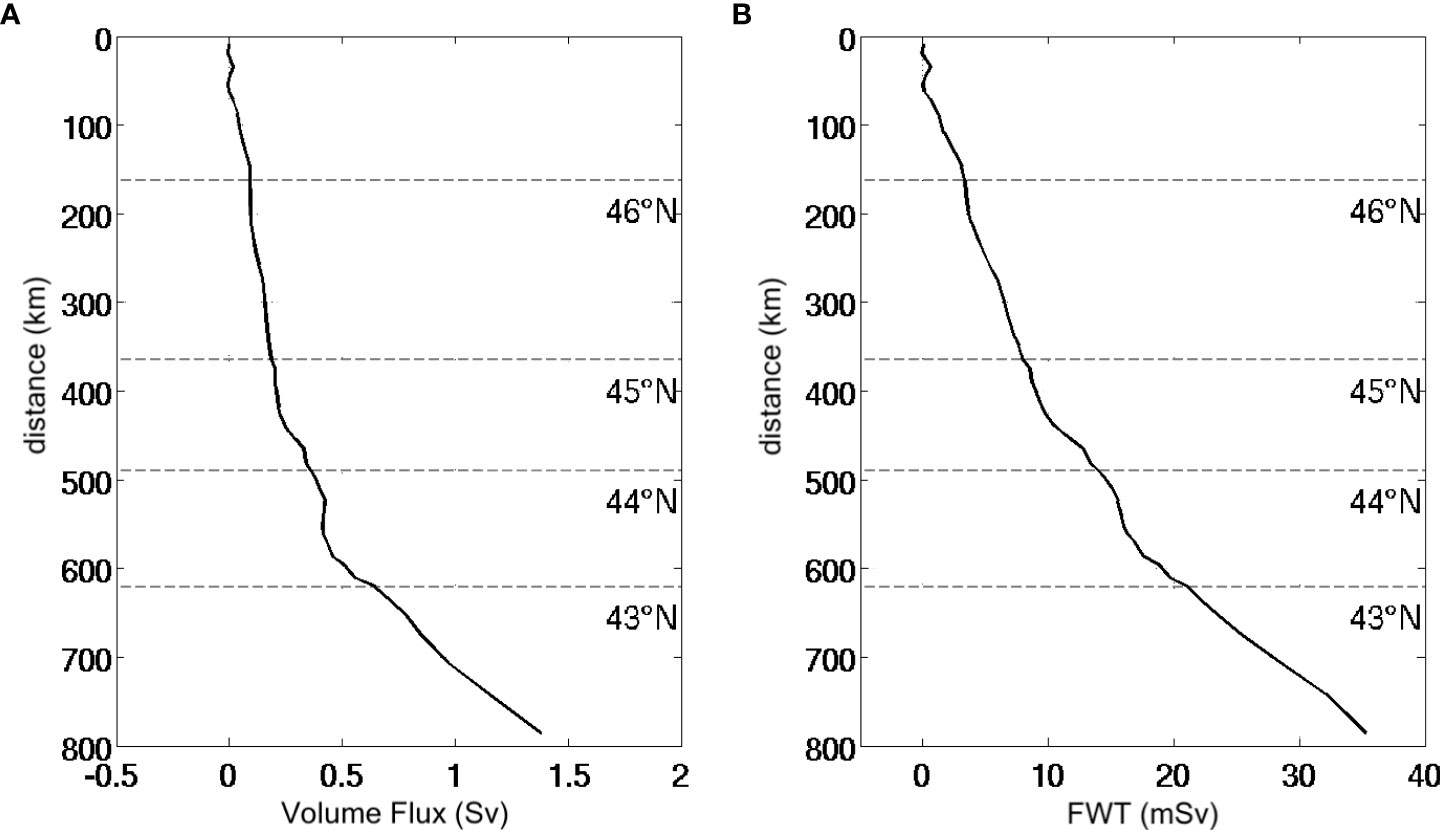
Figure 5 The cumulative time-mean (A) volume flux and (B) FWT, along section D starting from its northern endpoint at 47°N. The vertical axis is the distance from a location on section D to the northern endpoint, with the corresponding latitudes marked with the horizontal dashed lines.
3.2 Decomposition of time-mean FWT
Figure 6 shows the spatial distributions of the vector norms of the four components of , which represent contributions of the mean advection and the seasonal, inter-annual and intra-seasonal variations of the horizontal velocity and salinity, respectively, calculated by vertically integrating the r.h.s. of (5). Across section A, the dominant component of 84.4 mSv of the southward FWT is due to the mean advection, which is slightly greater than the total time-mean FWT of 83.6 mSv southward through this section. The seasonal variations of the velocity and salinity induce a northward FWT of 0.6 mSv, and the components of the FWT caused by the inter-annual and intra-seasonal variations are both 0.1 mSv northward. The mean advection contributes 1.2 mSv FWT through section B into the control volume, which accounts for 80% of the total FWT across this section. The remaining contributions to the FWT are from the inter-annual variation (13%) and intra-seasonal variation (7%).
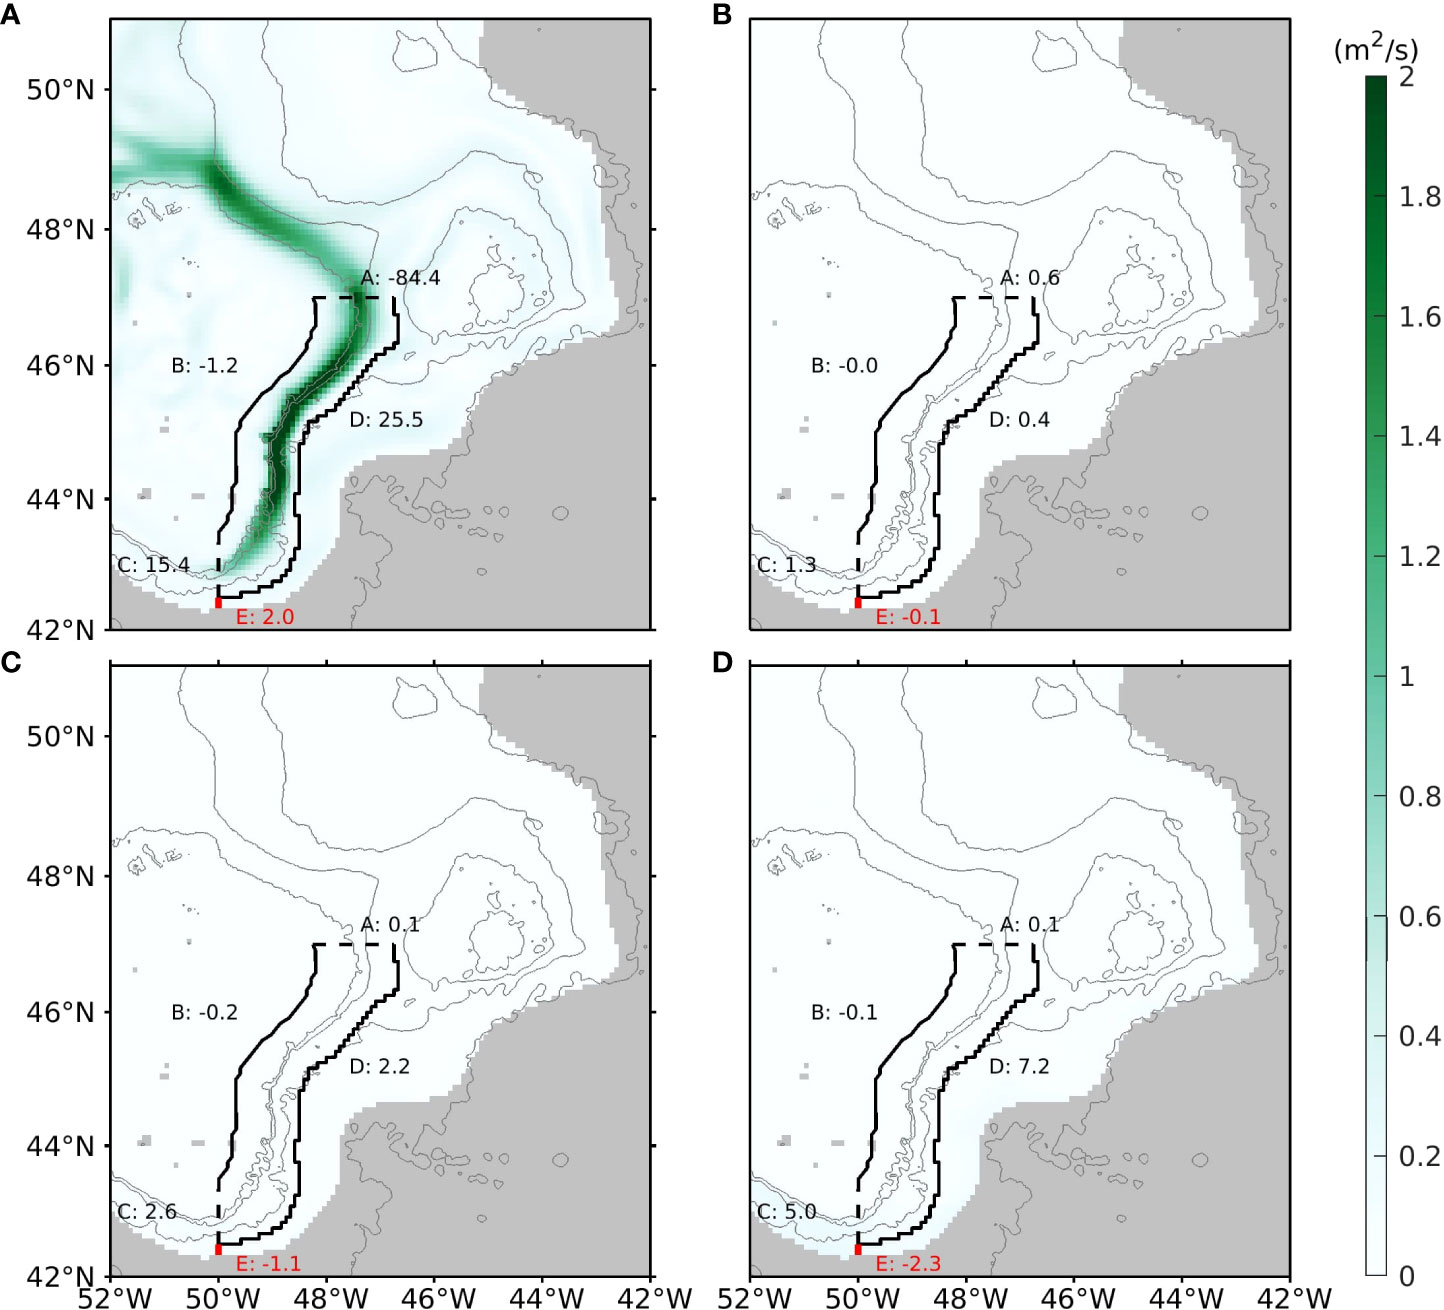
Figure 6 Same as Figure 4B, except for the contributions to by the (A) mean advection, (B) seasonal variation, (C) inter-annual variation, and (D) intra-seasonal variation, calculated by vertically integrating (5).
Through section C, the time-mean velocity causes 15.4 mSv FWT out of the control volume, which accounts for 63% of the total FWT across this section. Seasonal and inter-annual variations also contribute to the westward FWT with the values of 1.3 mSv and 2.6 mSv, respectively. The intra-seasonal variation makes a 5 mSv contribution to the westward FWT, which is 21% of the total FWT through section C. Across section D, the mean advection contributes 25.5 mSv to the FWT, which accounts for 72% of the total eastward FWT through this section. The seasonal, inter-annual, and intra-seasonal variations contribute the remaining 28% with the values of 0.4 mSv, 2.2 mSv and 7.2 mSv, respectively.
Across section E, the mean advection contributes an eastward 2.0 mSv to the total FWT. However, the contributions to the time-mean FWT by the seasonal, inter-annual and intra-seasonal variations are 0.1 mSv, 1.1 mSv and 2.3 mSv, respectively, and direct westward. Thus the net FWT through section E is 1.5 mSv westward.
4 Time variations OF FWT
Figure 7 shows the monthly time series of the FWT through the A, B, C and D boundaries of the control volume and section E, superimposed with the low-pass filtered time series with a cut off frequency of 0.67 cpy (18-month period). A wavelet analysis is performed for each time series of above, and the results are shown in Figure 8. For this analysis, we adopt the method proposed by Liu et al. (2007), which rectifies the bias towards the low frequencies in traditional wavelet analysis method. Statistical significance testing is performed for a red-noise process with a lag-1 coefficient of 0.72 (Torrence and Compo, 1998), and the 90% confidence level is shown as the black contour lines in the left column of Figure 8. According to the time-averaged wavelet power spectra (right column of Figure 8), the variations of the FWT through sections A, C and D exhibit an evident seasonal cycle. At sections A and C, the seasonal cycle dominates the FWT variations over other (inter-annual and intra-seasonal) time scales (right panels of Figures 8A, C). This feature of seasonal cycle dominance at these two sections presents in most the years during 1993 - 2018 (left panels of Figures 8A, C).
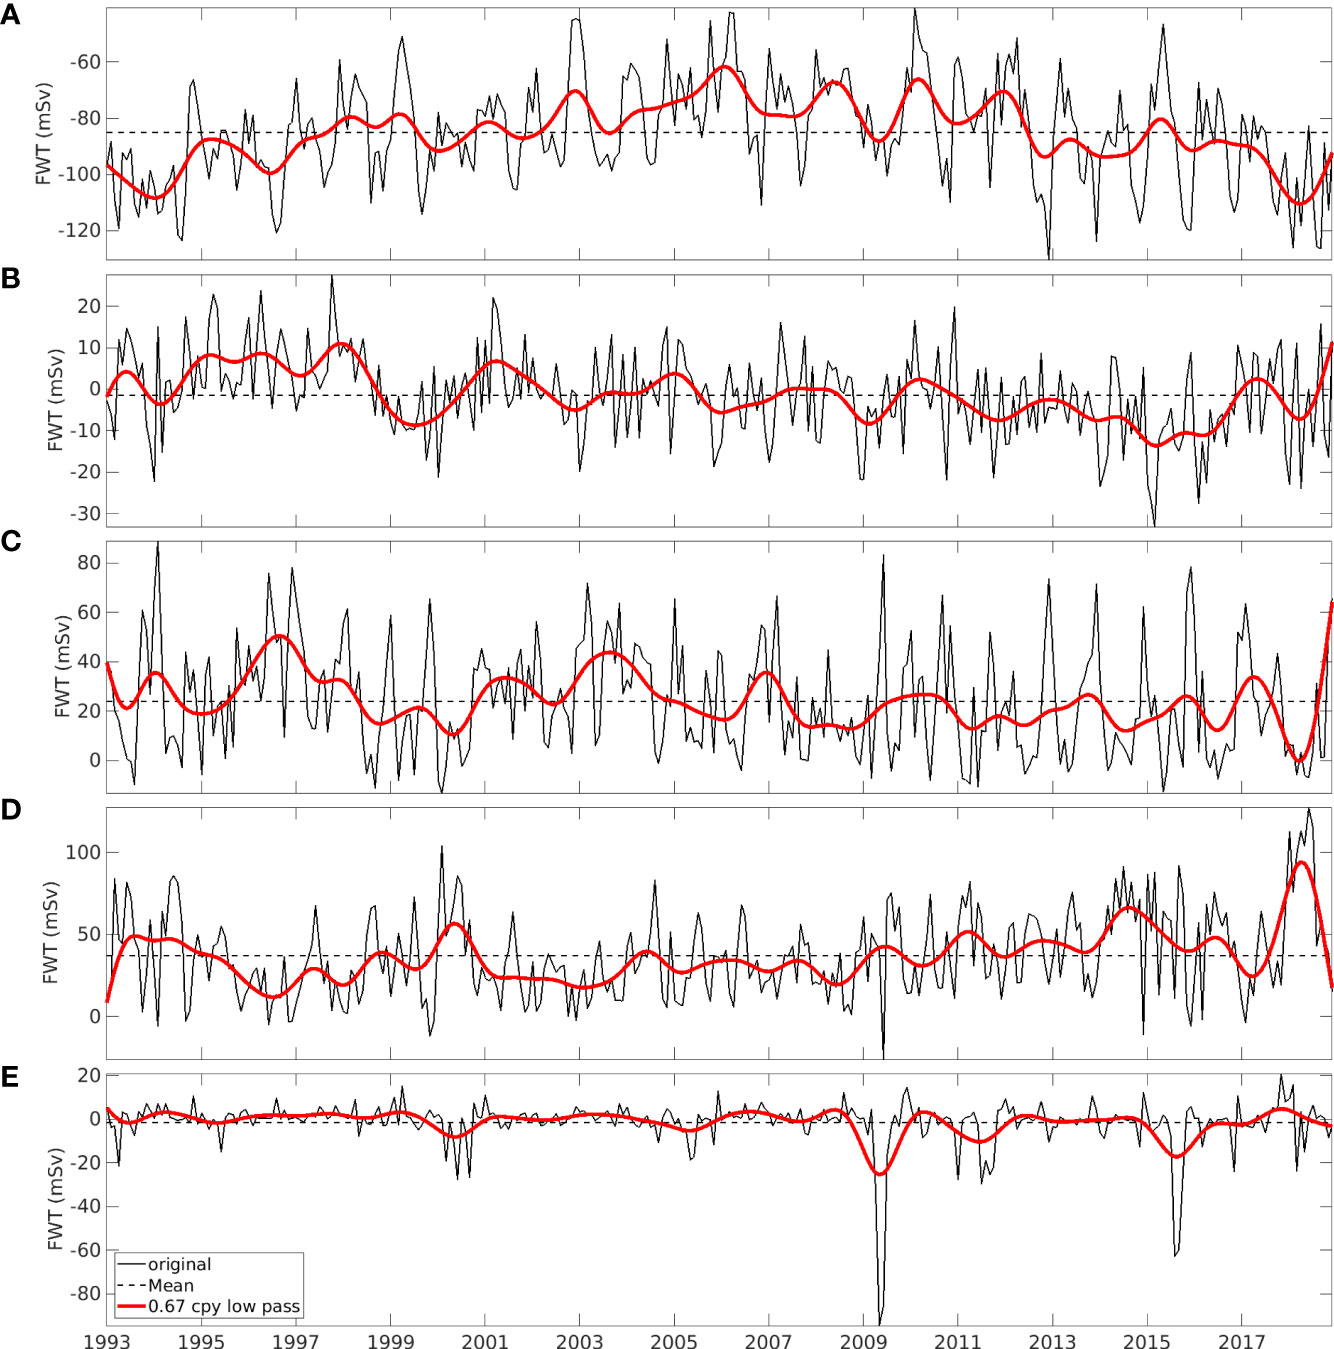
Figure 7 Monthly time series (black curve) of FWT through the boundaries (A-D) of the control volume and section (E), superimposed with the low pass filtered time series (red curve) with a cut-off period of 1.5 years. The dashed lines indicate the time-mean values of the corresponding monthly time series.
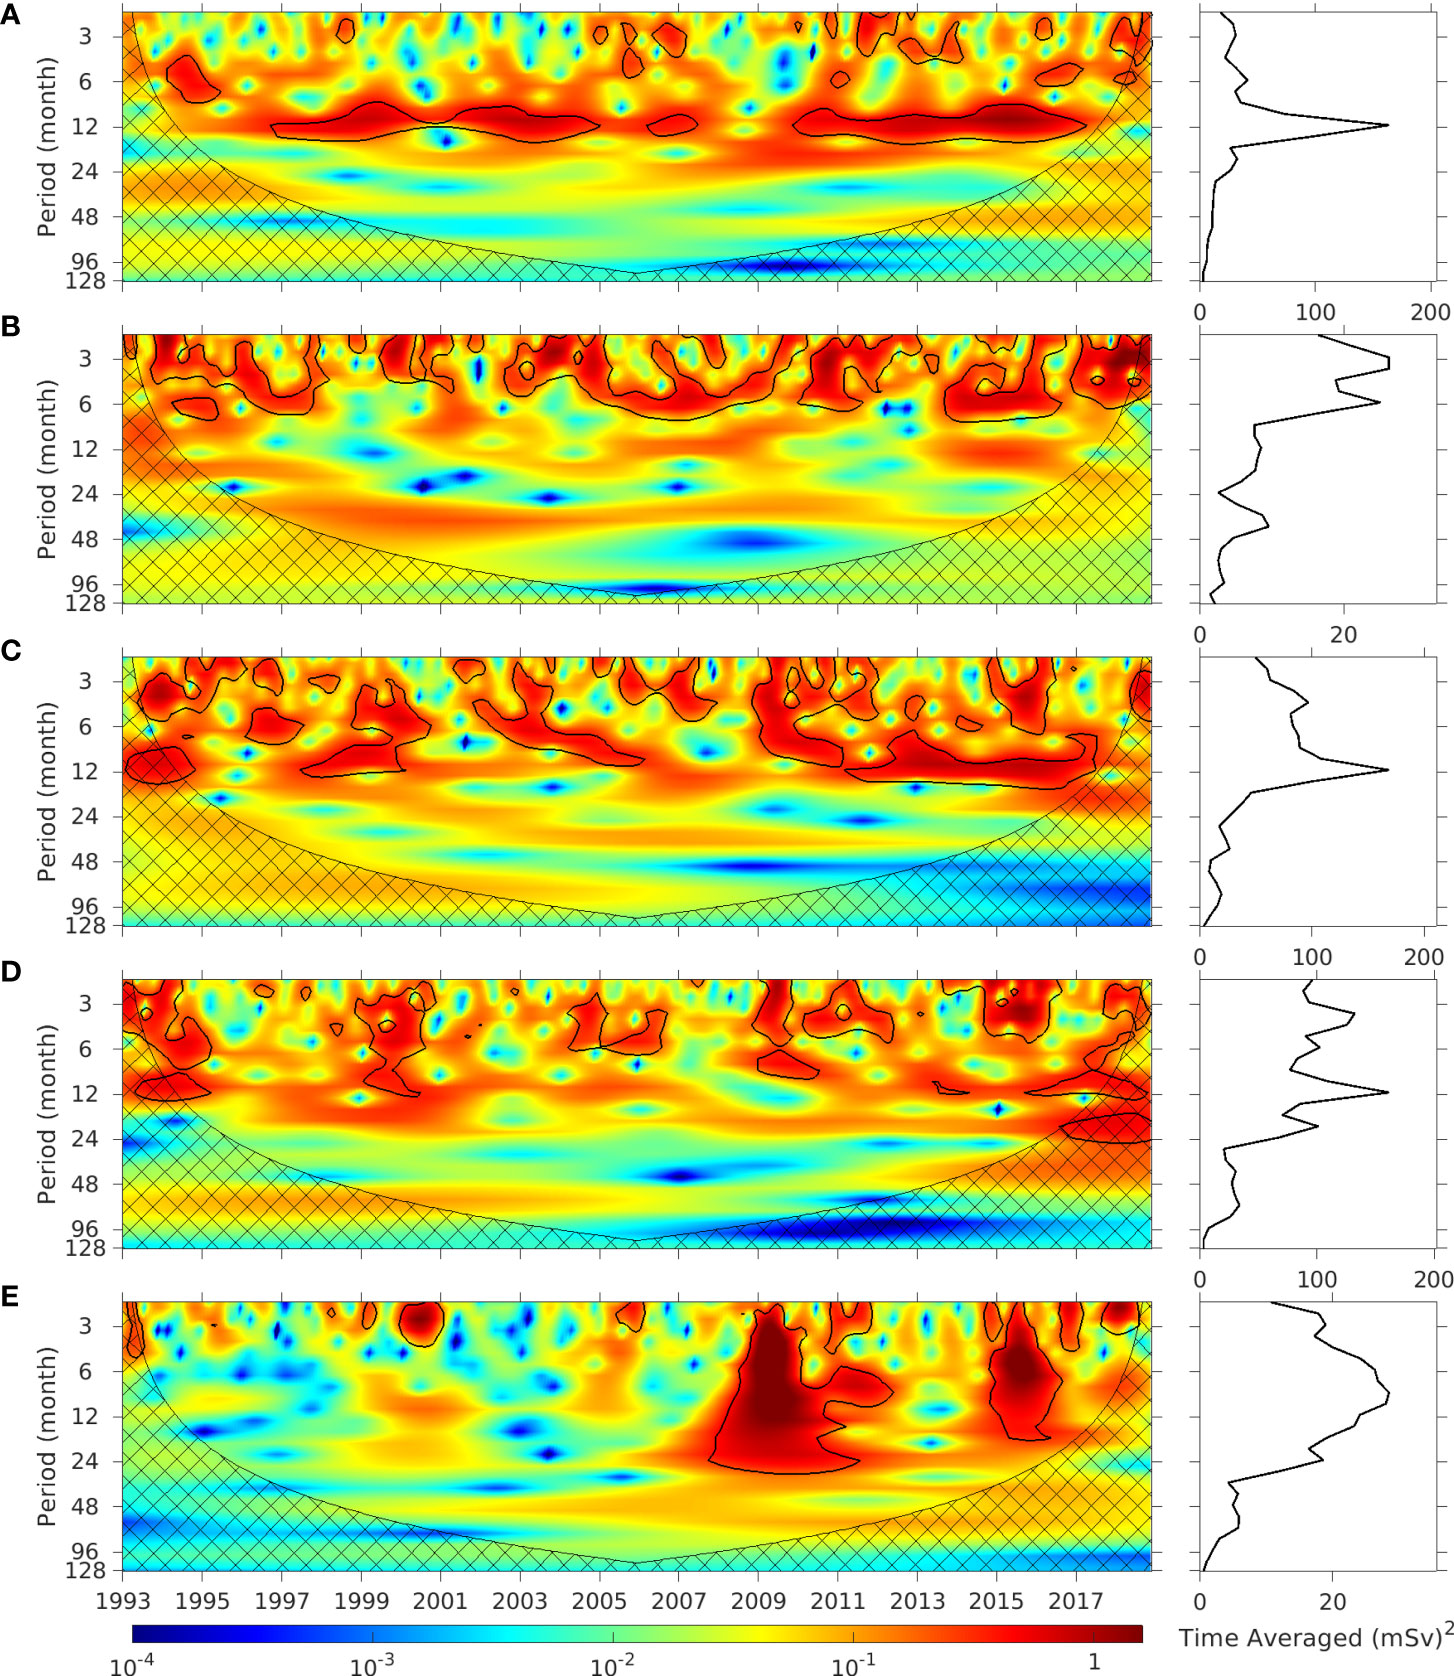
Figure 8 Left: normalized rectified wavelet power spectra for the time series through sections (A–E) shown in Figure 7. Values within the black contours are above the 90% confidence level. Values overlaid with crossed lines are affected by the edge effects. Right: the time-averaged wavelet power spectra multiplied by the variance of the FWT time series.
Section B shows no seasonal cycle but an evident semi-annual cycle. Moderate inter-annual variations of the FWT are present at sections B, C and D. Intra-seasonal variations make significant contributions to the variances of the FWT across sections B, C, D and E. At section E, the variation of the FWT covers the broad time scales from intra-seasonal to inter-annual without an evident seasonal cycle, while the time evolution of the wavelet spectrum (left panel of Figure 8E) and the time series of the FWT (Figure 7E) suggest extremely strong eddy variations during 2009 and 2015. These strong meso-scale eddy events near the Tail of GBN are evident in an animation of the SSH anomalies (not shown).
4.1 Seasonal variation
The seasonal variation of the FWT of the LC can be attributed to the variation of the major sources of freshwater, e.g., outflows through the Hudson Strait and the Davis Strait. The southward FWT through the Davis Strait, calculated using the one-year-long observational data, has a mean value of 116 mSv and peaks in December-January (Curry et al., 2011). The FWT through the Hudson Strait into the LC was estimated to be 42 mSv (Dickson et al., 2007) with a peak in October-December (Straneo and Saucier, 2008). At the downstream of the LC on the Labrador Shelf, the minimum salinity at 200 m appears in December (Lazier, 1982), consistent with the peaks of FWT from both upstream straits. However, Lazier (1982) showed that the minimum salinity occurred in July-August at the surface and progressively later with increasing depth. F&M2010 found that the minimum values of the salinity appeared in July-September for both the inshore and offshore branches of the LC above the isopycnal surface of 1026.8 kg/m3 (less than 100 m on the Labrador Shelf). F&M2010 suggested that the seasonal pulses of the low salinity along the shelf break and close to the coast were more dominated by the advection process rather than the local atmosphere forcing.
With the observational data, the above studies (Lazier, 1982; F&M2010) were able to characterize the seasonal variation of the salinity. However, the seasonal variation of the FWT consists of different components as in (6). Figure 9 shows the seasonal variations of the volume flux and FWT across the four boundaries of the control volume and section E, obtained by averaging the monthly anomalies in the same calendar month during 1993 - 2018. Through section A, the seasonal variation of the volume flux reaches the positive (northward) maximum value of 0.34 Sv in June and negative (southward) maximum value of -0.25 Sv in January, and the seasonal variation of the FWT reaches the positive (northward) maximum value of 9.8 mSv in February and the negative (southward) maximum value of -14.1 mSv in September. Note that a positive (northward) maximum value of the variation of the volume flux or FWT across section A means that the southward LC is seasonally the weakest across this section and vice versa for the minimum value. The difference in seasonal phases between the volume flux and FWT across section A is caused by the phase difference between the salinity and velocity. Across this section, the first two terms at r.h.s. of (6) make similar contribution to the seasonal FWT (Figure 10), with their phases determined by the seasonal velocity and salinity, respectively.
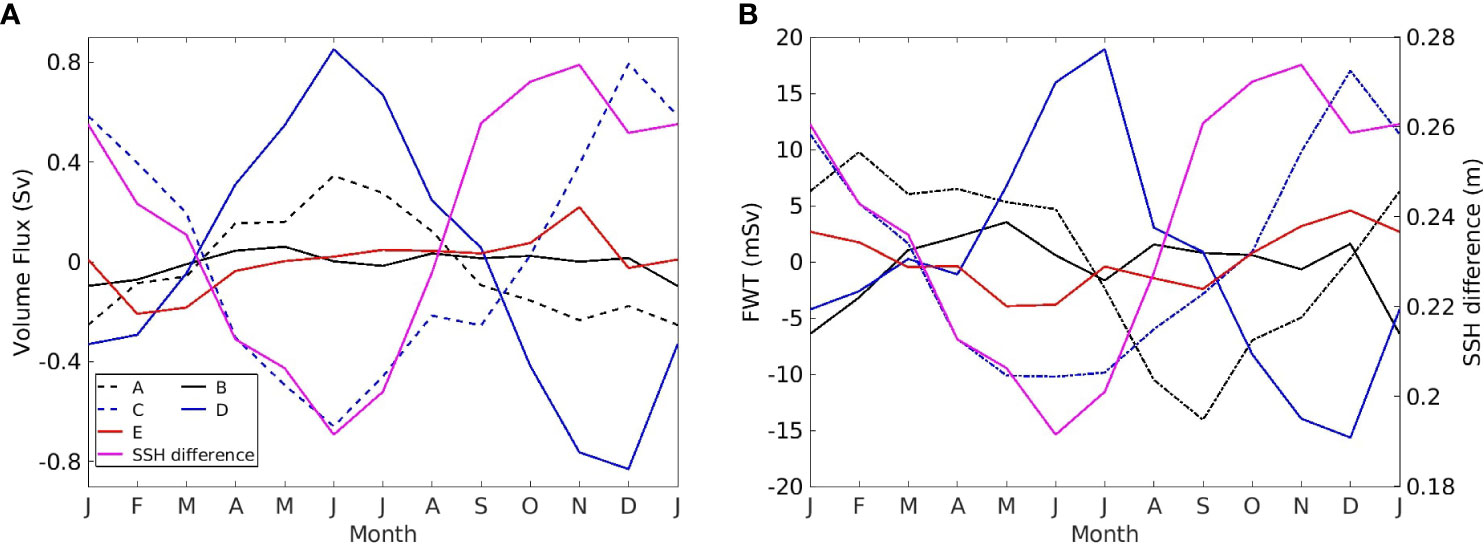
Figure 9 Seasonal variations of the (A) volume flux and (B) FWT through the 5 sections, and the result by subtracting the SSH value at (47°W, 47°N) from that at (50°W, 47°N), then taking the average for the same calendar month over 1993- 2018. The positive directions of the seasonal variations of the volume flux and FWT for each section are (A): northward; (B): westward; (C): westward; (D): eastward, and (E): eastward. The two locations for calculating the SSH difference are shown in Figure 1.
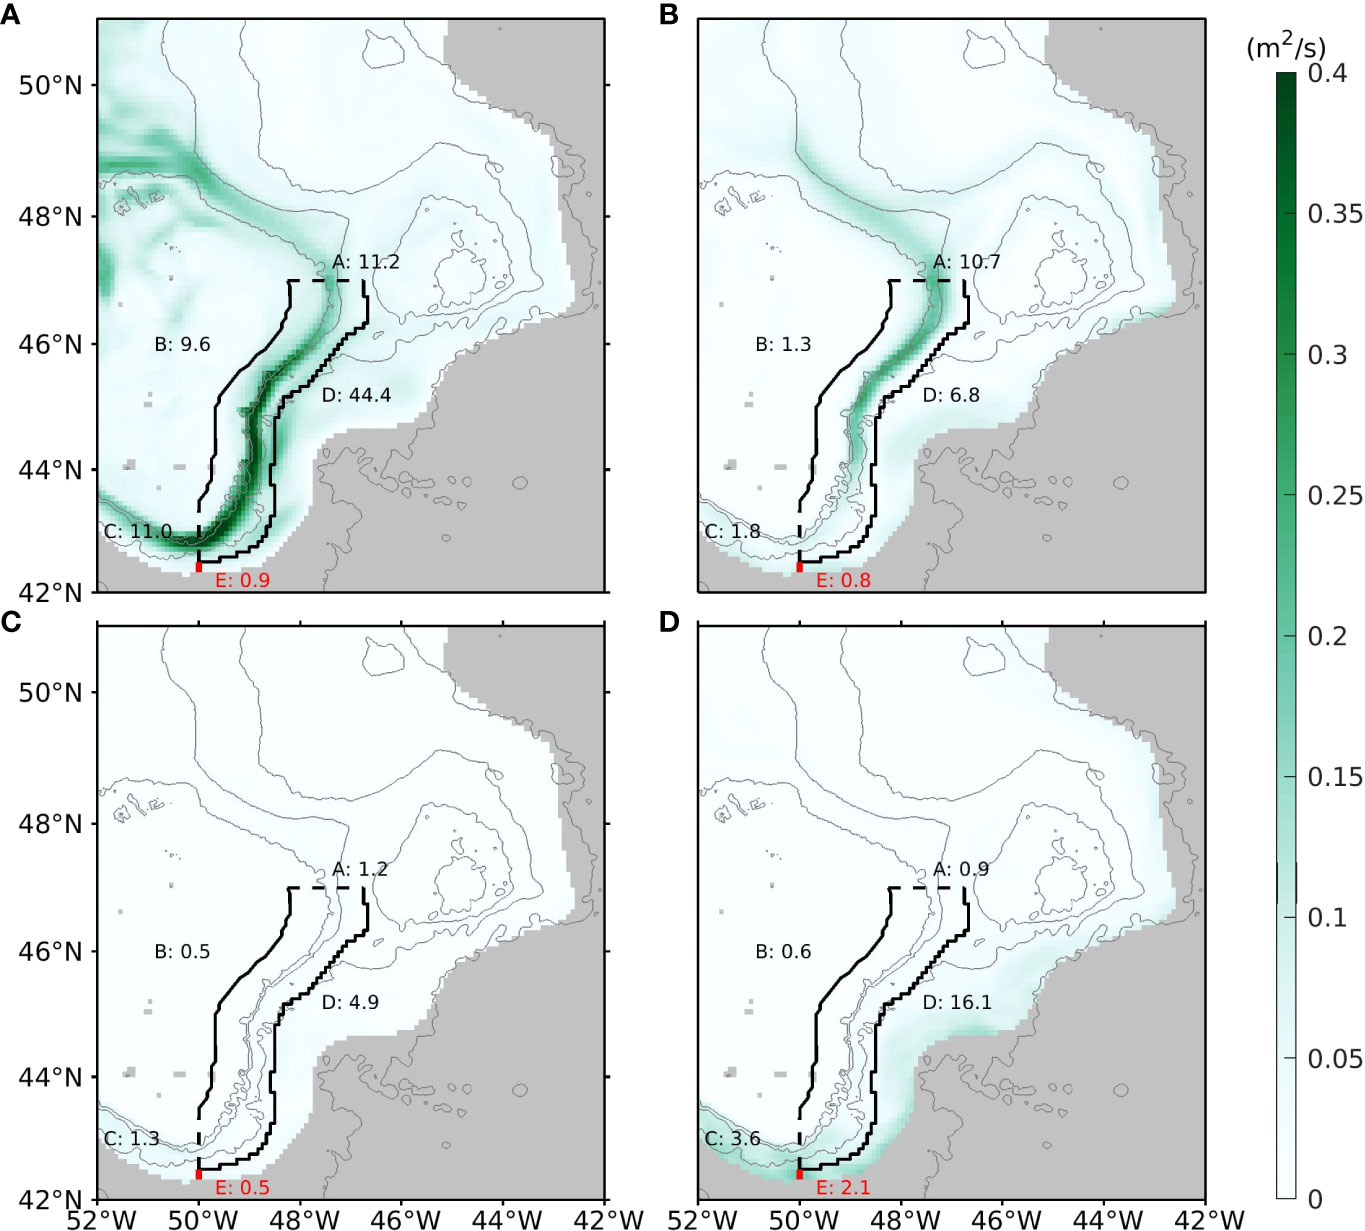
Figure 10 The RMS of the vector norms of the four components of : (A) , (B) , (C) and (D) , which are the vertical integrals of the four terms on the right hand side of (6). Numbers having the unit of mSv are the RMS of the four components of the seasonal variation of the FWT across different sections.
The seasonal phases of the horizontal velocity and salinity in the vicinity of section A are discussed below. As reviewed in the introduction, in summer the salinity within this part of LC is low as a result of the southward advection of low salinity water from upstream. The low salinity in combination with high water temperature leads to higher SSH within the LC. Further to the west on the GBN the increase of SSH is smaller, thus the SSH gradient from west to east is reduced. This is confirmed by the magenta curve in Figure 9, which is the mean seasonal cycle of the SSH at (50°W, 47°N) minus that at (47°W, 47°N) (the two locations marked in Figure 1). Again the mean seasonal cycle is calculated by taking the average of the SSH difference in the same calendar month during 1993 - 2018. This mean seasonal SSH difference has a minimum value in June. It corresponds to the minimum southward LC velocity (or the maximum northward anomaly), because the LC velocity has a weak vertical shear (Figure 2A) hence closely follows the variation of the SSH difference. While the southward FWT across section A increases due to the lower salinity, the southward volume flux decreases because of the reduced velocity.
Across section B, the volume flux and FWT show weak semi-annual variation with two troughs in January and July and two peaks in May and December in Figure 9. Across section D, the volume flux and FWT out of the control volume both reach maximum (minimum) in June/July (December). At section C, the seasonal variations of the volume flux and FWT have the opposite phases from those at section D. Hence, the stronger outflow through section D corresponds to the weaker outflow through section C. With a weaker inflow from section A in summer, there is more LC water passing through section D, and vice versa in winter. In the study of the Agulhas Current retroflection with an idealized model, Dijkstra and De Ruijter (2001) stated that the inertia plays a more important role in controlling the retroflection than the side-wall friction if the Agulhas Current is strong. Apply this to the LC, the stronger flow in winter could overshoot the Tail of the GBN, westward pass across section C and retroflect eastward across section E, resulting in a larger westward volume flux or FWT across section C. On the other hand, with the weaker incoming flow in summer, the LC may detach from the shelf break of the GBN, analogous to the phenomenon of the western boundary currents separating from their coasts as investigated by many others (Dengo, 1993; Pichevin et al., 2009; Pierini et al., 2011; Ezer, 2016). Thus in summer, the LC may retroflect at higher latitudes rather than after overshooting the Tail of the GBN, resulting in more LC water exported across section D. Through section E, the volume flux and FWT show weak seasonal variations with different phases. The eastward FWT through section E roughly corresponds to the westward FWT through section C.
Figure 10 shows the Root Mean Square (RMS) of the vector norm of each component of (seasonal unit FWT). Along the LC pathway, can be mainly attributed to the seasonal variation of the horizontal velocity (Figure 10A). The contribution due to the seasonal variation of the salinity is significant to the north of 44°N. By integrating the four components of along each section, the values of the RMS of each component at different sections are indicated with numbers in Figure 10. The variation of the horizontal velocity results in 11.2 mSv of the RMS of the seasonal variation of the FWT across section A, while the seasonal variation of the salinity causes 10.7 mSv. Through section B, the seasonal variation of the FWT is mainly caused by the variation of the horizontal velocity with an RMS value of 9.6 mSv, much greater than the other three components. Through section C, the seasonal variation of the horizontal velocity makes the most contribution to the FWT seasonal variation, and the seasonal variation of the salinity is not important, while the seasonal variation of mesoscale eddies makes a sizable contribution of 3.6 mSv to the RMS. Section D is similar to section C, where the seasonal variations of the horizontal velocity and mesoscale eddies both make major contributions. Finally, through section E, intra-seasonal variations (mesoscale eddies) make the largest contribution to the seasonal variation of FWT.
4.2 Inter-annual variation
Figure 11 shows the inter-annual variations of the volume flux and FWT through boundaries A, B, C and D of the control volume and section E. The inter-annual variation of the southward volume flux through section A has a magnitude of 0.4 Sv. The variations of the volume fluxes through sections C and D have larger magnitudes of 1.8 Sv and 2.2 Sv, respectively, and their correlation coefficient is -0.92. The increase of volume flux westward through section C corresponds to the decrease of the volume flux eastward through section D. The fact that the magnitude of the variation of the volume flux across either section C or D is much greater than that across section A can be caused by multiple mechanisms, including the inter-annual variation of the location of the LC retroflection position and the impact of the NAC. Although the magnitude of the inter-annual variation of the volume flux through section C or D is greater than that through section A, the inter-annual variations of the FWT through sections A, C and D have the similar magnitudes of 40 mSv. Thus is related to the combined contributions of the inter-annual variations of velocity and salinity, to be discussed below.
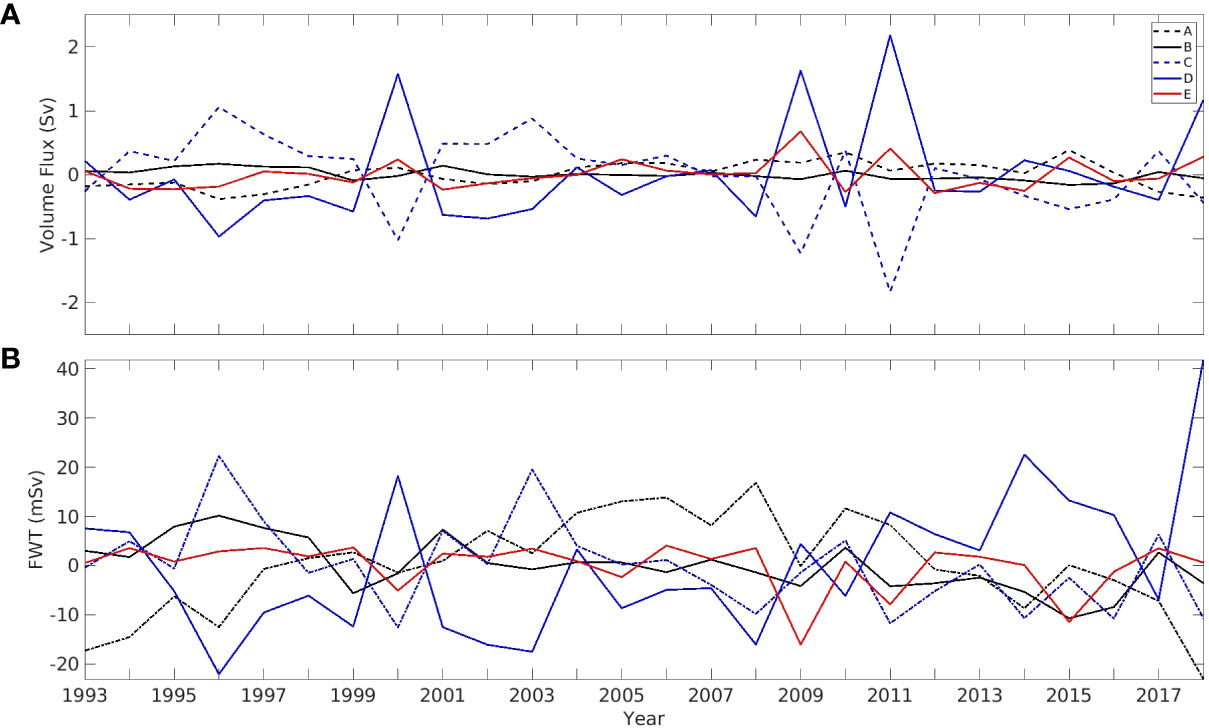
Figure 11 As in Figure 9, except for the inter-annual variations of the (A) volume flux and (B) FWT.
Figure 12 shows the RMS of the vector norms of the four components of (inter-annual unit FWT). Similar to the seasonal variation , is mainly caused by the inter-annual variation of horizontal velocity in most regions. The inter-annual variation of the salinity makes a significant contribution to the RMS of vector norm of in the north of 44N. The variation of the salinity makes a significant contribution to the RMS of the inter-annual variation of the FWT across section A. The contribution due to the interaction between the inter-annual anomalies of the velocity and salinity is smaller than the first two components in most regions but is nontrivial at section D. Finally, the fourth component, mainly representing the inter-annual variation of mesoscale eddies, makes significant contributions at sections C, D and E.
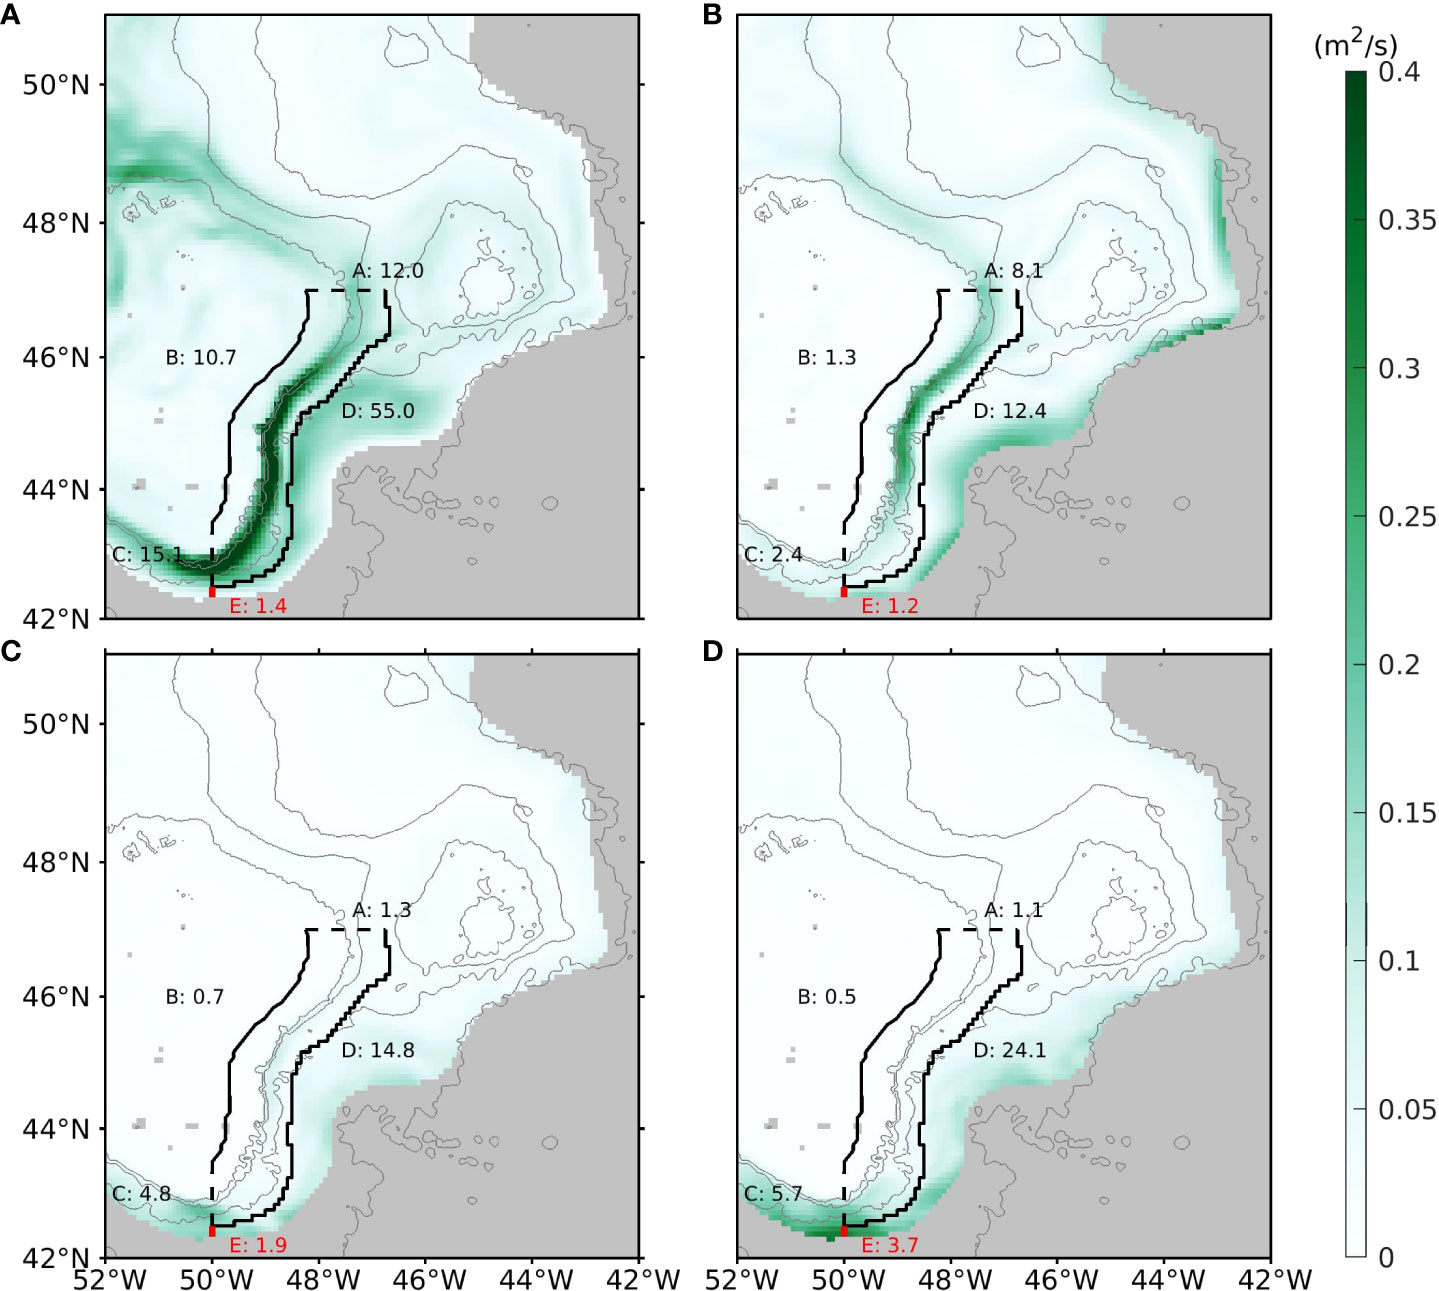
Figure 12 As in Figure 10, except for the four components of : (A) , (B) , (C) and (D) .
5 Conclusion and discussion
The global ocean reanalysis product, GLORYS12v1, is analyzed for quantifying the spatial-temporal variations of the FWT above the 1027.25 kg/m3 isopycnal surface in the region east of the GBN. Firstly, the results for the time-mean FWT are presented in Figures 4–6 and Table 1. The GLORYS12v1 product enables the quantification of the spatial variation of the time-mean FWT and the magnitudes of the standard deviations, as well as the contributions to the time-mean by the mean advection and the interactions between the time variations of velocity and salinity on seasonal, inter-annual and intra-seasonal time scales [equation (5)]. Through section A at the Flemish Pass, the southward LC is the dominant FWT into the defined control volume due mainly to the mean advection. A major proportion of the freshwater carried by the LC enters into the interior of the North Atlantic along the offshore boundary of the LC between the Flemish Pass and the Tail of the GBN. Across section D, the eastward FWT amounts to 42% of the southward FWT across section A. The FWT through section D can be further decomposed to 72% due to the mean advection and 27% due to the combined contributions of the inter-annul and intra-seasonal variations of the circulation and salinity. At the Tail of the GBN, the westward FWT through section C accounts to 29% of the southward FWT through section A, and 63% of this westward FWT is due to mean advection while 37% is due to the other three components. After the LC passes across section C, a part of this cold and fresh water continues flowing westward to the Scotian Slope (Loder et al., 1998; Brickman et al., 2018), and another part mixes with the NAC and retroflects eastward to the interior of the North Atlantic (F&M2010). The retroflection of the LC is diagnosed through a short section E to the south of the Tail of the GBN. Through section E, the time-mean FWT is westward, amounting to 6% of the westward FWT through section C. We note that the FWT due to the mean advection is eastward, consistent with the direction of the LC retroflection. However, the eastward mean advection is overtaken by the westward FWT due to the inter-annual and intra-seasonal variations of the circulation and salinity.

Table 1 A summary of time-mean FWT (± standard deviation) through the 5 sections as shown in Figure 4B and the four components that contribute to the time-mean FWT as shown in Figure 6.
The monthly FWTs across the five sections, based on 26 years of data from GLORYS12v1, show significant magnitudes of standard deviations. The time series and power density spectra further show the FWT variations at the seasonal, inter-annual and intra-seasonal time scales. The seasonal and inter-annual variations are further decomposed into contributions due to the variations of velocity and salinity, including their correlations (equations (6) and (7), Figures 10, 12). For FWT variations at both time scales, the variations of velocity (advecting the time-mean salinity) cause the largest FWT RMS values across sections A, B, C and D. Only across section A, the variations of salinity (advected by the time-mean velocity) cause the RMS values comparable to that caused by the variations of velocity. The correlations between variations of velocity and salinity, at both seasonal and inter-annual scales, cause relatively smaller RMS values across each section. Finally, the correlation between the intra-seasonal variations the velocity and salinity causes significant RMS values across sections C and E, and specifically the largest across section E, for both seasonal and inter-annual FWT variations.
The inter-annual variations of the volume fluxes across sections C and E are negatively correlated, as shown in Figure 11A, with the correlation coefficient of -0.69. On the other hand, the inter-annual variations of the FWT across these two sections are positively correlated, as shown in Figure 11B. The above behavior can be explained by the variation of the positions of the LC or NAC in the meridional direction, and the contribution of the mesoscale eddies. Because the two sections are separated at = 0, a northward shift of NAC (LC) will decrease the westward volume transport across section C while increase the eastward transport across E. In the meanwhile, as the high salinity water shifts northward, the westward FWT across section C decreases. Across section E, the increases of both eastward velocity and salinity favor the decrease of the eastward FWT. The opposite occurs when the NAC (LC) shifts southward. Note that the inter-annual variations of the FWT across section E are mostly caused by the correlation between intra-seasonal variations of the velocity and salinity, representing the contributions due to the mesoscale eddies. A cyclonic cold-core (low salinity) eddy, near the separation position between sections C and E, will cause u' > 0 and (smaller S) across E, hence the increase of the eastward FWT, while u'< 0 (increased westward velocity) and (larger S) across C cause the increase of the westward FWT. The opposite occurs when an anti-cyclonic warm-core (high salinity) eddy is present. Thus, the mesoscale eddies cause evident inter-annual variations of the westward FWT across section C, which is positively correlated with the eastward FWT across section E.
Overall, the main results of the present study are consistent with the conclusions of previous studies. However, the continuous time series of a multi-decade eddy-resolving ocean product (GLORYS12v1) enables a more comprehensive quantification of the multi-scale variations of the FWT carried by the Labrador Current, and the different contribution components to the time-mean, and seasonal and inter-annual variations of the FWT. Such quantification is difficult to achieved using sparse observation data and coarse resolution or short-term model simulation results. The model results may help to assess the accuracy of the FWT estimates derived from observations and guide the design of observations. For example, for the time-mean FTW, through sections A and B they are mainly caused by the mean advection, hence the accuracy of their estimations depends on that of the measured time-mean velocity and salinity; for sections C, D and E, simultaneous measurements of the time variations of and salinity are needed because their correlations make significant contributions to the time-mean FWT.
The present study focuses on the LC east of the GBN till reaching its southern tail. In future work it would be interesting to analyze how the fresh (and cold) water carried by the LC impacts the variations of hydrography from the west of the tail to the Scotian Slope. Furthermore, because of the significant influences of intra-seasonal (mesoscale) variations, exploring the predictability of hydrography (and circulation) in this region is challenging, and we hope that advancements in this aspect can be achieved using more advanced analysis methods (e.g., machine learning). Finally, GLORYS12v1 is one of the eddy-resolving global analysis products created with intensive assimilation of ocean observational data in recent years. Its 1/12° horizontal resolution, and also the use of monthly data in this study, may cause underestimation of the contribution of the mesoscale eddies. It would be valuable to compare the present analysis results with that based on daily output of GLORYS12v1 and the simulation/reanalysis results of other models with similar and higher spatial resolutions.
Data availability statement
Publicly available datasets were analyzed in this study. This data can be found here: https://marine.copernicus.eu/.
Author contributions
YL and DG initiated the analysis topic. YM analyzed the data. YM and YL wrote the manuscript. XH provided data analysis software and analysis. All authors contributed to the refinement of the manuscript writing and approved the submitted version.
Funding
We acknowledge the funding support to this study by the Marine Environmental Observation, Prediction and Response, the International Governance Strategy and the Multi-Partner Research Initiative on marine oil spill research by Fisheries and Oceans Canada.
Acknowledgments
The GLORYS12v1 product is obtained from the Copernicus Marine Service. We thank our colleagues Drs. Zeliang Wang and Igor Yashayaev and three reviewers for providing constructive reviews.
Conflict of interest
The authors declare that the research was conducted in the absence of any commercial or financial relationships that could be construed as a potential conflict of interest.
Publisher’s note
All claims expressed in this article are solely those of the authors and do not necessarily represent those of their affiliated organizations, or those of the publisher, the editors and the reviewers. Any product that may be evaluated in this article, or claim that may be made by its manufacturer, is not guaranteed or endorsed by the publisher.
References
Aagaard K., Carmack E. C. (1989). The role of sea ice and other fresh water in the arctic circulation. J. Geophys. Res.: Oceans. 94, 14485–14498. doi: 10.1029/JC094iC10p14485
Brickman D., Hebert D., Wang Z. (2018). Mechanism for the recent ocean warming events on the scotian shelf of eastern canada. Cont. Shelf. Res. 156, 11–22. doi: 10.1016/j.csr.2018.01.001
Cuny J., Rhines P. B., Kwok R. (2005). Davis Strait volume, freshwater and heat fluxes. Deep. Sea. Res. Part I. 52, 519–542. doi: 10.1016/j.dsr.2004.10.006
Curry B., Lee C. M., Petrie B. (2011). Volume, freshwater, and heat fluxes through davis strait 2004–05. J. Phys. Oceanogr. 41, 429–436. doi: 10.1175/2010JPO4536.1
Dengo J. (1993). The problem of gulf stream separation: A barotropic approach. J. Phys. Oceanogr. 23, 2182–2200. doi: 10.1175/1520-0485(1993)023<2182:TPOGSS>2.0.CO;2
Déry S. J., Hernández-Henríquez M. A., Burford J. E., Wood E. F. (2009). Observational evidence of an intensifying hydrological cycle in northern canada. Geophys. Res. Lett. 36, L13402. doi: 10.1029/2009GL038852
Dickson R., Rudels B., Dye S., Karcher M., Meincke J., Yashayaev I. (2007). Current estimates of freshwater flux through arctic and subarctic seas. Prog. Oceanogr. 73, 210–230. doi: 10.1016/j.pocean.2006.12.003
Dijkstra H. A., De Ruijter W. P. M. (2001). On the physics of the agulhas current: Steady retroflection regimes. J. Phys. Oceanogr. 31, 2971–2985. doi: 10.1175/1520-0485(2001)031<2971:OTPOTA>2.0.CO;2
Ezer T. (2016). Revisiting the problem of the gulf stream separation: on the representation of topography in ocean models with different types of vertical grids. Ocean. Modell. 104, 15–27. doi: 10.1016/j.ocemod.2016.05.008
Fratantoni P. S., McCartney M. S. (2010). Freshwater export from the labrador current to the north atlantic current at the tail of the grand banks of newfoundland. Deep. Sea. Res. Part I. 57, 258–283. doi: 10.1016/j.dsr.2009.11.006
Han G., Lu Z., Wang Z., Helbig J., Chen N., de Young B. (2008). Seasonal variability of the labrador current and shelf circulation off newfoundland. J. Geophys. Res.: Oceans. 113, C10013. doi: 10.1029/2007JC004376
Howatt T., Palter J., Matthews R., Deyoung B., Bachmayer R., Claus B. (2018). Ekman and eddy exchange of freshwater and oxygen across the labrador shelf break. J. Phys. Oceanogr. 48, 1015–1031. doi: 10.1175/JPO-D-17-0148.1
Lazier J. R. N. (1982). Seasonal variability of temperature and salinity in the Labrador current. J. Mar. Res. 40(suppl.), 341–356.
Lazier J. R. N., Wright D. G. (1993). Annual velocity variations in the labrador current. J. Phys. Oceanogr. 23, 659–678. doi: 10.1175/1520-0485(1993)023<0659:AVVITL>2.0.CO;2
Lellouche J.-M., Greiner E., Bourdallé-Badie R., Garric G., Melet A., Marie D., et al. (2021). The Copernicus global 1/12° oceanic and Sea ice GLORYS12 reanalysis. Front. Earth Sci. 9, 698876. doi: 10.3389/feart.2021.698876
Lellouche J.-M., Greiner E., Galloudec O. L., Garric G., Regnier C., Drevillon M., et al. (2018). Recent updates to the Copernicus marine service global ocean monitoring and forecasting real-time 1/12° high-resolution system. Ocean. Sci. 14, 1093–1126. doi: 10.5194/os-14-1093-2018
Liu Y., Liang X. S., Weisberg R.H. (2007). Rectification of the bias in the wavelet power spectrum. J. Atmos. Ocean. Technol. 24, 2093–2102. doi: 10.1175/2007jtecho511.1
Loder J., Petrie B., Gawarkiewicz G. (1998).The coastal ocean off northeastern north America: A large-scale view,” in The Sea, volume 11: The global coastal ocean: Regional studies and syntheses, vol. 5 . Eds. Robinson A. R., Brink K. H. (Hoboken, NJ, USA:John Wiley & Sons, Inc), 105–133.
Ma Z., Han G., Chassé J. (2016). Simulation of circulation and ice over the newfoundland and labrador shelves: The mean and seasonal cycle. Atmos. Ocean. 54, 248–263. doi: 10.1080/07055900.2015.1077325
Mernild S. H., Liston G. E., Hiemstra C. A., Steffen K., Hanna E., Christensen J.H. (2009). Greenland Ice sheet surface mass-balance modelling and freshwater flux for 2007, and in a 1995–2007 perspective. Hydrol. Processes. 23, 2470–2484. doi: 10.1002/hyp.7354
Mertz G., Narayanan S., Helbig J. (1993). The freshwater transport of the labrador current. Atmos. Ocean. 31, 281–295. doi: 10.1080/07055900.1993.9649472
Petrie B., Buckley J. (1996). Volume and freshwater transport of the labrador current in flemish pass. J. Geophys. Res.: Oceans. 101, 28335–28342. doi: 10.1029/96JC02779
Petrie B., Loder J., Akenhead S., Lazier J. (1991). Temperature and salinity variability on the eastern newfoundland shelf: The annual harmonic. Atmos. Ocean. 29, 14–36. doi: 10.1080/07055900.1991.9649390
Pichevin T., Herbette S., Floc’h F. (2009). Eddy formation and shedding in a separating boundary current. J. Phys. Oceanogr. 39, 1921–1934. doi: 10.1175/2009JPO4151.1
Pierini S., Falco P., Zambardino G., McClimans T. A., Ellingsen I. (2011). A laboratory study of nonlinear western boundary currents, with application to the gulf stream separation due to inertial overshooting. J. Phys. Oceanogr. 41, 2063–2079. doi: 10.1175/2011JPO4514.1
Renssen H., Goosse H., Fichefet T. (2002). Modeling the effect of freshwater pulses on the early holocene climate: The influence of high-frequency climate variability. Paleoceanography 17, 10–1–10–16. doi: 10.1029/2001PA000649
Schmidt S., Send U. (2007). Origin and composition of seasonal labrador sea freshwater. J. Phys. Oceanogr. 37, 1445–1454. doi: 10.1175/JPO3065.1
Straneo F., Saucier F. (2008). The outflow from hudson strait and its contribution to the labrador current. Deep. Sea. Res. Part I. 55, 926–946. doi: 10.1016/j.dsr.2008.03.012
Torrence C., Compo G. P. (1998). A practical guide to wavelet analysis. Bull. Am. Meteorol. Soc 79, 61–78. doi: 10.1175/1520-0477(1998)079<0061:apgtwa>2.0.co;2
Keywords: Grand Banks of Newfoundland, Labrador Current, freshwater transport, retroflection, multi-scale variations
Citation: Ma Y, Lu Y, Hu X, Gilbert D, Socolofsky SA and Boufadel M (2022) Model simulated freshwater transport along the Labrador current east of the Grand Banks of Newfoundland. Front. Mar. Sci. 9:908306. doi: 10.3389/fmars.2022.908306
Received: 30 March 2022; Accepted: 19 October 2022;
Published: 15 November 2022.
Edited by:
Bahareh Kamranzad, Kyoto University, JapanReviewed by:
Riccardo Farneti, The Abdus Salam International Centre for Theoretical Physics (ICTP), ItalyYonggang Liu, University of South Florida, United States
Copyright © 2022 Ma, Lu, Hu, Gilbert, Socolofsky and Boufadel. This is an open-access article distributed under the terms of the Creative Commons Attribution License (CC BY). The use, distribution or reproduction in other forums is permitted, provided the original author(s) and the copyright owner(s) are credited and that the original publication in this journal is cited, in accordance with accepted academic practice. No use, distribution or reproduction is permitted which does not comply with these terms.
*Correspondence: Youyu Lu, WW91eXUuTHVAZGZvLW1wby5nYy5jYQ==
†ORCID: Denis Gilbert, orcid.org/0000-0002-9554-9594
 Yongxing Ma
 Youyu Lu
 Xianmin Hu2
 Michel Boufadel