 Yao Liu
 Fu Qiao2
94% of researchers rate our articles as excellent or good
Learn more about the work of our research integrity team to safeguard the quality of each article we publish.
Find out more
ORIGINAL RESEARCH article
Front. Mar. Sci., 09 June 2022
Sec. Marine Pollution
Volume 9 - 2022 | https://doi.org/10.3389/fmars.2022.907378
Diarrhetic shellfish poisoning (DSP) toxins are potent marine biotoxins. It can cause a severe gastrointestinal illness by the consumption of mussels contaminated by DSP toxins. New methods for effectively and rapidly detecting DSP toxins-contaminated mussels are required. In this study, we used near-infrared (NIR) reflection spectroscopy combined with pattern recognition methods to detect DSP toxins. In the range of 950-1700 nm, the spectral data of healthy mussels and DSP toxins-contaminated mussels were acquired. To select optimal waveband subsets, a waveband selection algorithm with a Gaussian membership function based on fuzzy rough set theory was applied. Considering that detecting DSP toxins-contaminated mussels from healthy mussels was an imbalanced classification problem, an improved approach of twin support vector machines (TWSVM) was explored, which is based on a centered kernel alignment. The influences of parameters of the waveband selection algorithm and regularization hyperparameters of the improved TWSVM (ITWSVM) on the performance of models were analyzed. Compared to conventional SVM, TWSVM, and other state-of-the-art algorithms (such as multi-layer perceptron, extreme gradient boosting and adaptive boosting), our proposed model exhibited better performance in detecting DSP toxins and was little affected by the imbalance ratio. For the proposed model, the F-measure reached 0.9886, and detection accuracy reached 98.83%. We explored the physical basis for the detection model by analyzing the relationship between the occurrence of overtone and combination bands and selected wavebands. This study supports NIR spectroscopy as an innovative, rapid, and convenient analytical method to detect DSP toxins in mussels.
Mussels (Perna Viridis) are economically important coastal bivalve mollusks belonging to the family Mytilidae. The mussels can supply certain vitamins such as niacin, thiamine, riboflavin, and essential trace metals (e.g. Ca, Fe) (Aktar, 2014). They have become important sources of nutrients for human consumption around the world. Whether from wild fisheries or aquaculture, mussels are grown and harvested under natural conditions. They have the capacity of accumulating contaminants from food and sediment, in concentrations that significantly exceed those found in the environment (Pinto et al., 2015). Therefore, the chemical and biological quality of the growing environment is very important for the survival and growth of mussels hence affecting the quantity and quality of the yield.
In the last several decades, the occurrence of harmful algal blooms has increased due to changes in climate conditions, anthropogenic activities, and technological advances. Mussels are filter-feeding organisms. They can accumulate large amounts of toxins produced by harmful algal blooms (Costa, 2019). Toxins mainly accumulate in the mussel’s digestive glands and do not adversely affect the mussel itself. Severe intoxication may occur if humans consume substantial amounts of contaminated mussels (Gerssen et al., 2010).
DSP toxins are among the most frequent occurrence and the widest distributed marine biotoxins (Zou et al., 2016). They include okadaic acid and diaphysis toxins. Human consumption of mussels contaminated with DSP toxins can cause poisoning (Yuan et al., 2021). DSP symptoms include diarrhea, abdominal cramps, vomiting, and nausea after ingestion (Eberhart et al., 2013). Several studies suggest that the consumption of DSP toxins-contaminated mussels may increase the risk of cancers in the digestive system (Li et al., 2014). More importantly, after cooking or freezing, the properties of the DSP toxins do not change, nor do they affect the taste of the contaminated mussels. Thus, they are often difficult to detect without rigorous testing (McCarron et al., 2008). How to effectively and rapidly detect the mussels contaminated by DSP toxins has attracted widespread attention.
So far, many methods have been developed for DSP toxins detection, including the mouse bioassay, cell toxicity assay, enzyme-linked immunosorbent assay, high-performance liquid chromatography fluorescence detection (HPLC-FLD), liquid chromatography coupled to tandem mass spectrometry (LC-MS/MS), and surface-enhanced Raman spectroscopy (SERS) (Prassopoulou et al., 2009). The mouse bioassay method is easy to operate, nevertheless, it needs a complex process in toxin extraction and a long time to get the result, and the false-positive results often occur caused by many different reasons (Li et al., 2006). The cell toxicity test is tedious and requires large numbers of cells and a long test time. The immune analysis technology is not easy to obtain pure antibodies, and cross-reaction of the toxin is low (Huai et al., 2013). The applications of LC-MS/MS and HPLC-FLD are often hampered by expensive reference substances and instruments, and the lack of well-trained professionals (Zou et al., 2016). For the SERS method, it is difficult to record a reference Raman spectrum of DSP toxins because of the low concentrations of the commercially available standard solutions (Cintă Pinzaru et al., 2016). These methods do not have the capability of rapid detection and are not suitable for routine monitoring. Therefore, cost-effective, real-time, and technically less complex techniques are highly needed for detecting DSP toxins.
To overcome the disadvantages and limitations of the previous methods, spectroscopy coupled with chemometrics and machine learning techniques has been explored as alternative tools for DSP toxins detection. Spectroscopy is the study of the interaction of electromagnetic radiation with substance (Ghidini et al., 2019). The result of these interactions is a spectrum that contains many characteristics of the substance being analyzed. In the NIR region, the fundamental molecular vibrations of chemical bonds C-H, O-H, N-H, C=O, and other functional groups are detected. Substances containing components like protein, fat, water, and carbohydrate have these bonds. They absorb the light with wavelengths that match the vibrations of a particular functional group when irradiated with NIR light. The rest of the wavelengths is either transmitted or reflected. The light undergoing reflection, transmission, or absorption is detected (Chakrabarti et al., 2020). These specific patterns exhibited by the substances in the NIR region can reveal the physical and chemical composition of the substances being studied. Therefore, NIR spectroscopy coupled with chemometrics is a good tool for detection that provides a rapid, simple, accurate, and reliable measurement of food quality and safety. It has been used to detect meat, fruit, seafood, grains, and others (Tao et al., 2019; Caramês ET dos et al., 2020; Mishra and Passos, 2021).
As for specific applications to shellfish, NIR spectroscopy has been successfully applied to qualitatively discriminate and quantitatively analyze. It was applied to analyze moisture, fat, protein, and glycogen of oyster samples (Brown, 2011), to classify healthy Tegillarca granosa and Tegillarca granosa that were contaminated by heavy metals (Chen et al., 2015), to characterize objectively changes in the freshness of Pacific oysters (Madigan et al., 2013), to detect of Perkinsus Marinus in the eastern oyster, which was a disease caused by the protozoan parasite (Guévélou et al., 2021), and to rapidly detect mussels contaminated with Cd, Zn, Pb, and Cu (Liu et al., 2022). However, there is little documented information on the use of NIR spectroscopy to detect mussels contaminated with DSP toxins. Hence, the aim of our research is to evaluate the feasibility of NIR spectroscopy for rapidly detecting DSP toxins, with minimal processing of mussel samples.
The NIR spectra data contains a lot of information, but part of which is in some cases irrelevant or redundant. When learning models face numerous input features which are not necessary for predicting output, the predictive performance degrades. Therefore, the selection of optimal wavelengths that correlate best with the object of interest is necessary. To obtain the best prediction accuracy, wavelength selection algorithms select as few wavelengths as possible, since the less the data needs to be analyzed the faster the learning model is. Many wavelength selection algorithms have been explored and proven that models’ performance is improved and learning time is decreased in many application domains. In this study, for maximally preserving the useful information in the original data, fuzzy rough sets (FRS) theory (Liu et al., 2019) has been used.
A phenomenon is encountered in the real-world application of DSP toxins detection, that is, samples contaminated by DSP toxins are unlikely to occur as frequently as healthy samples. In machine learning applications, datasets, where one class has more samples than the other, are known as the class imbalanced problem. The class with the fewer number of samples is called the minority class, while the class with the larger number is called the majority class (Hoyos-Osorio et al., 2021). Traditional classification models usually assume that training samples are evenly distributed between classes, therefore, training of models needs a sufficient amount of healthy mussel samples as well as corresponding contaminated ones by DSP toxins. However, it is difficult to acquire sufficient contaminated samples for calibrating detection models in practical applications. In general, imbalanced numbers of healthy mussels and contaminated mussels always present in a real environment. Without consideration of the imbalanced problem, the classification algorithms tend to favor the majority class, that is, the classifiers might classify most of the samples as healthy samples. Thus, it is important to find solutions for imbalanced datasets. In this work, a novel approach based on twin support vector machines (TWSVM) (Huang et al., 2018), called improved TWSVM (ITWSVM), is attempted to solve the imbalanced classification problem.
The main contributions of this paper are as follows.
● We propose a NIR spectroscopy method to detect DSP toxins-contaminated mussels non-destructively and rapidly.
● We select characteristic wavelengths that distinguish healthy mussels and contaminated mussels by a waveband selection algorithm based on the FRS theory.
● Considering that detecting DSP toxins-contaminated mussels was an imbalanced classification problem, we construct the ITWSVM model.
● We explore the physical basis for the detection model by analyzing the relationship between the occurrence of overtone and combination bands and selected wavebands.
This work provides new insights into approaches for efficient and rapid detection of DSP toxins-contaminated mussels using the NIR spectroscopy technology.
Mussels were purchased from the Dongfeng seafood market in Zhanjiang, Guangdong Province, China. Mussels of similar size were selected and placed in a plastic container for acclimatization to adapt to the experimental environment. After 3 days of acclimatization, the mussels with high vitality were selected for follow-up experiments. The selected mussels were transferred to two plastic tanks of 119 × 108 × 32 cm. Each tank was filled with 80 L seawater, whose salinity level was 30 ‰ and temperature was 26°C. The mussels of the experimental group were fed with 1 L Prorocentrum Lima with a concentration of 7.3×10⁹ cell L-1 and those of the control group were fed with 0.5 L of photosynthetic bacteria with a concentration of 109 cell L-1 every day. The feeding amount of Prorocentrum Lima and photosynthetic bacteria was determined by previous experiments to maintain the healthy state of mussels.
The seawater in the feeding tank was aerated continuously during the experiment to maintain the good physiological state of the mussels. The seawater was changed every 24 hours to keep the mussels’ living environment clean. The experiment lasted for 6 days to allow DSP toxins to accumulate in the mussel samples. During this period, several mussels died from DSP toxins-contamination. The dead mussels were picked out. A total of 240 samples (120 samples for each group) were collected for spectral acquisition.
NIR spectra for each mussel sample were obtained using a NIR spectroscopy measurement system (Figure 1), which consists of a NIR spectrometer (SW2520-050-NIRA, OtO Photonics Inc., Taiwan, China), a halogen light source, an optical fiber, a USB data line, an adjustable displacement platform, and a computer. NIR spectra included 114 variables ranging from 950 nm to 1700 nm with 6.5 nm intervals. Before collecting NIR spectra of mussels, the black and white correction (Xiao et al., 2019) was carried out to reduce noise. The white reference data were taken from a standard reflectance board with a reflectivity of approximately 100%, while the source light was on. The dark reference data were obtained by turning off all the lights. The raw spectrum was calibrated as R = (raw-dark)/(white-dark).
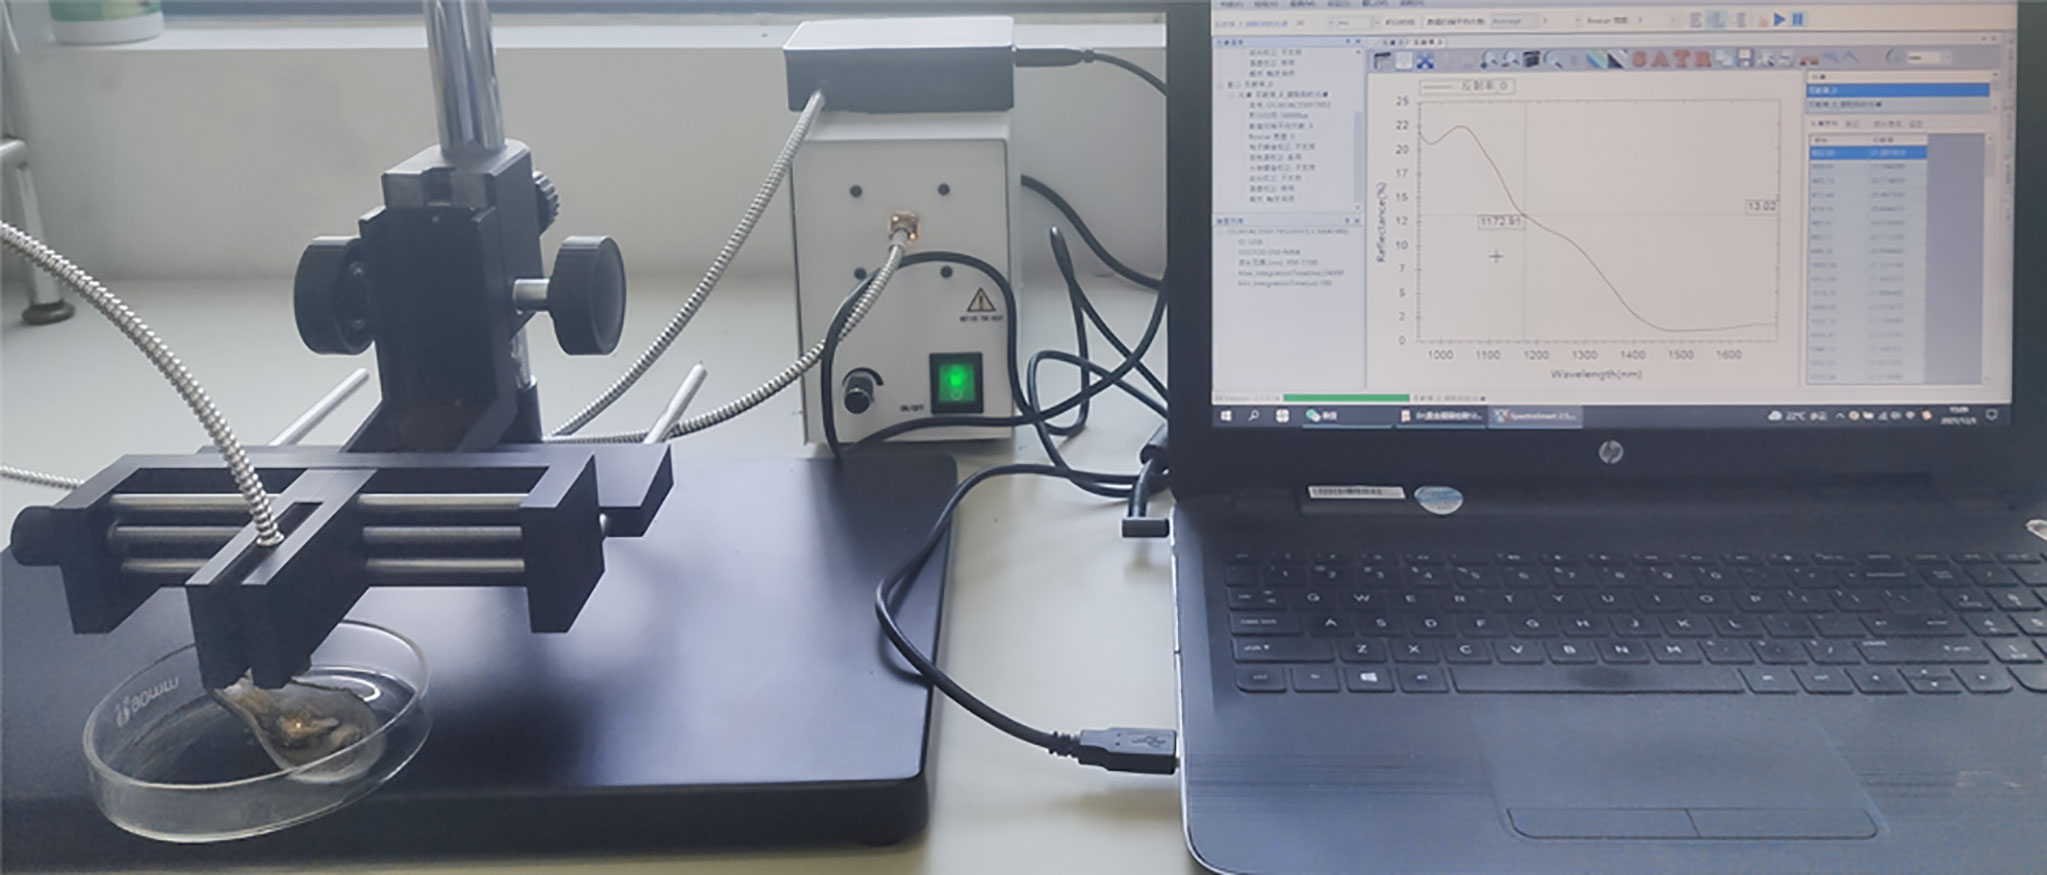
Figure 1 A NIR spectroscopy measurement system.
Mussels were removed from the seawater tanks. We opened the shell of mussel and put the tissue of mussels on half of its shell. After positioning the fiber probe directly on the central surface of the mussel, spectral measurements were carried out. The spectrum for each sample was the average of three scans in the reflectance mode. Spectral data of samples were obtained through SpectraSmart software.
NIR spectral data contains some highly correlated variables and noise. It is required for waveband selection, which can extract relevant information that correlates best with the detection of DSP toxins. It can decrease learning time, measurement efforts, and storage space, and improve the performance of the classification model by taking optimum subsets of wavebands as inputs. Here, the waveband selection algorithm based on FRS theory (Qian et al., 2015) was used for seeking optimum subsets. A forward greedy algorithm was employed to search for a subset of wavebands for preserving the same information as provided by all the wavebands.
The flow chart of the waveband selection algorithm based on the FRS theory (Liu et al., 2019) is shown in Figure 2.
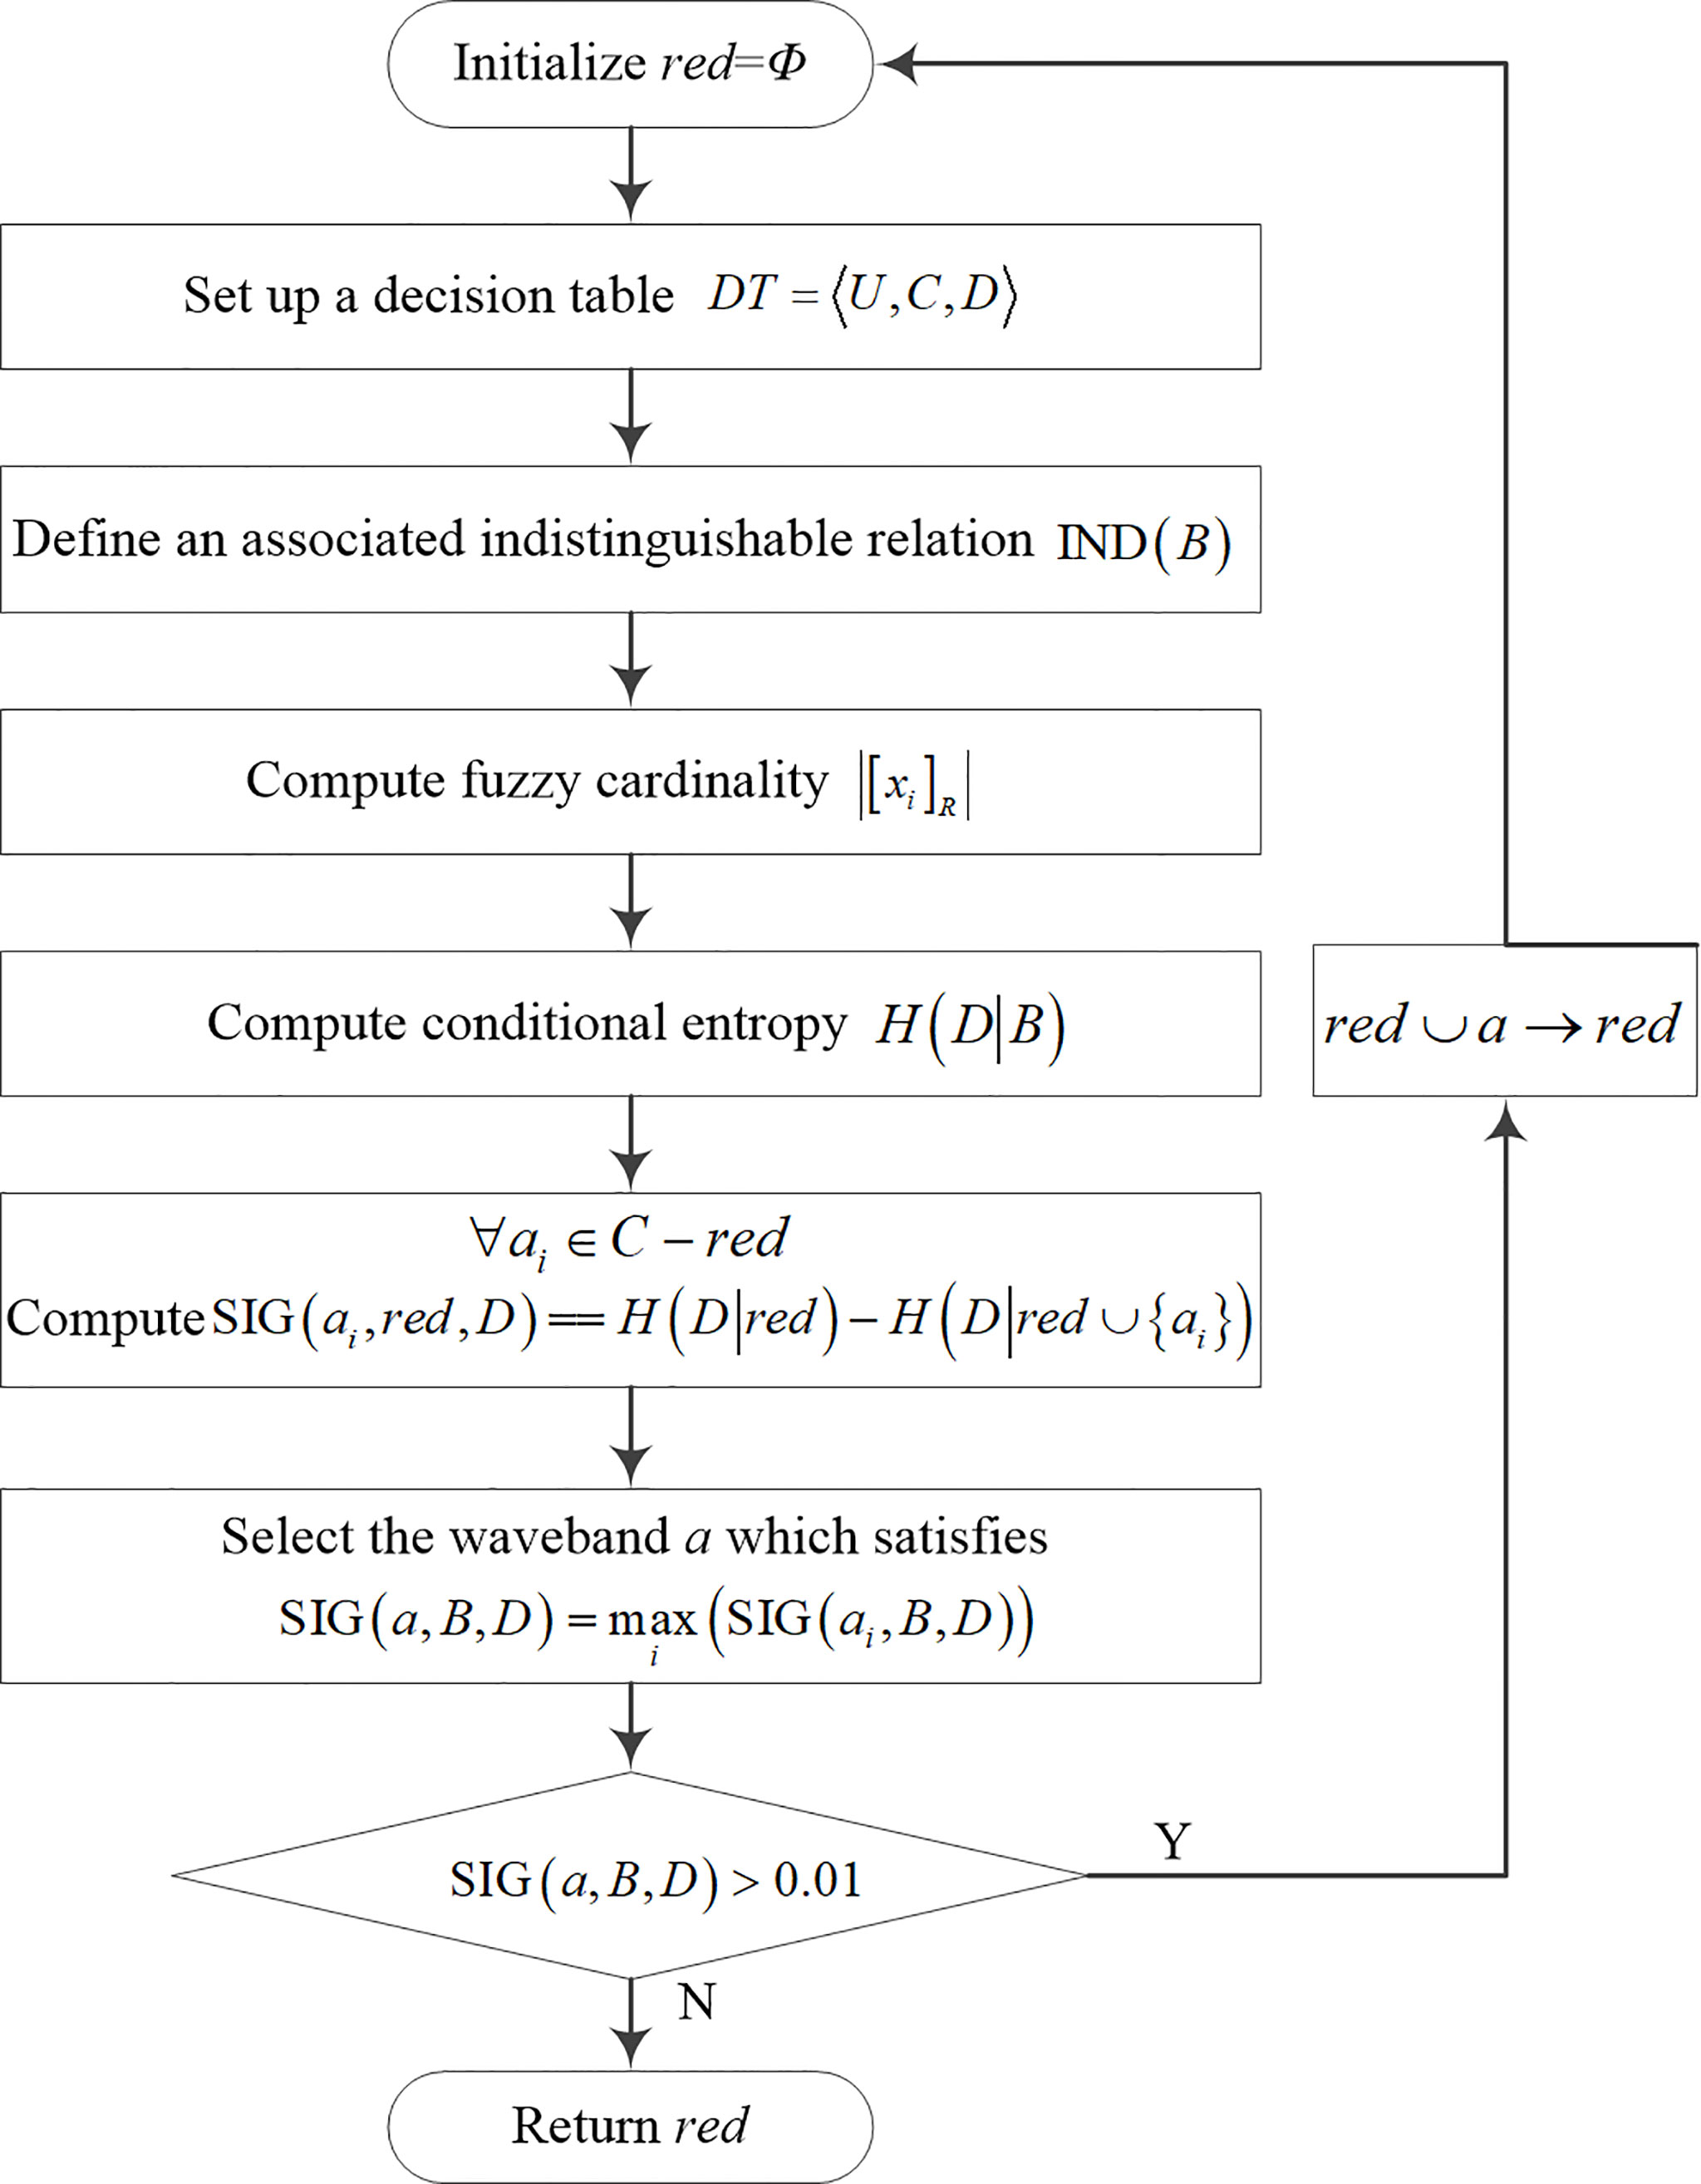
Figure 2 The flow chart of the waveband selection algorithm based on the FRS theory.
In the decision table DT=<U,C,D>, C and D are condition and decision feature sets, respectively. For NIR spectral datasets, the category labels are denoted by D, and the spectral-waveband matrices are denoted by C. U={x1 , x2 , .... , xn} is a finite set of samples. The associated indistinguishable relation is defined as IND(B)={ (xi,xj)∈U×U|∀a∈B,f(xi,a)=f(xj,a) }
Fuzzy cardinality is computed by , where [ xi ]R is fuzzy equivalence class, and rij=(xi,xj,) represents the grade in which the two elements are equivalent or indiscernible. The samples in the boundary region are taken values by Gaussian membership function, which is defined as .
Information quantity of fuzzy equivalence relation is defined by and conditional entropy of D conditioned to B is defined by ,where [xi]B and [xi]D are fuzzy equivalence classes produced by B and D, respectively.
SIG(ai,red,D)=H(D|red)−H(D|red∪{ ai }) is used to compute the significance of ai. If SIG(ai ,red,D)>0.01, the waveband which brings the maximum of SIG(ai ,red,D) is selected and added to the subset red. The waveband subset red is an optimum subset we need.
For the FRS algorithm, the parameter λ controls the granularity of approximation and tunes the width of the membership functions. Different optimal waveband subsets are generated according to different λ. To study the impact of parameter λ on the result of waveband selection and classification, various values of λ in the range of 0 - 1 are tested.
Among supervised machine learning approaches, SVM has obvious advantages in complex nonlinear and high dimensional space classification. The core of SVM is about attempting to reduce generalization error by maximizing the margin between two disjoint half planes (Jayadeva et al., 2007). Optimization tasks are resolved by minimizing the convex quadratic function under linear inequality constraints. However, classical SVM can’t handle imbalanced data well. A TWSVM method has emerged in recent years, which finds two hyperplanes, one for each class. It classifies a point according to the hyperplane closest to a given point (Ding et al., 2019). The TWSVM method does not include a proper mapping based on reproducing kernel Hilbert space (RKHS) within their optimization. Thus, the virtues of dual problems and intrinsic formulation concerning the kernel method are neglected (Jimenez-Castaño et al., 2020). Moreover, the performance of TWSVM also depends on the adjustment of regularization parameters and kernel parameters.
An ITWSVM method is presented for imbalanced data classification, which allows coding a decision function in a possible infinity dimension RKHS. To favor data separability, an approach based on a centered kernel alignment (CKA) is used (Alvarez-Meza et al., 2017).
The Gaussian kernel is favored in pattern classification because of its general approximation ability and mathematical tractability. In the ITWSVM approach, the kernel function is .
In this study, to reveal discriminative data structures and avoid instability issues, a strategy based on CKA has been used to learn the covariance matrix of the Gaussian kernel Σ, where Σ ∈ RP × P. It leverages a data-driven to tune covariance matrix by quantifying the similarity between input kernel matrix K and a kernel computed over output labels Z. The inverse covariance matrix is written as Σ-1=EET, where E ∈ RP × P′(P′ ≤ P). The traditional Gaussian kernel function is redefined as This kernel function encourages the matching between K and Z based on the CKA-based cost where and ∥∥F stands for a centered kernel matrix and the matrix based Frobenius inner product and norm. The cost function is applied to learn the inverse of covariance matrix Σ-1 from E as follows:
The ITWSVM is summarized in Algorithm 1.
Algorithm 1. The ITWSVM algorithm for imbalanced classification.
Step 1: Build the minority class matrix X+ ∈RP×N+ (output labels tn=+1) and majority class matrix X-∈RP×N- (output labels tn=-1), where P is the number of features and N=N++N- is the number of samples.
Step 2: Compute the projection matrix
Step 3: Compute the input data similarities based on
Step 4: Compute the Lagrangian multipliers αl’by solving , where l and l’ are indexing variables to distinguish between majority and minority class parameters, c1,l’ and c2,l’ are regularization parameters, and 1l′ is an all ones column vector. The kernel matrices can be inferred as (the imbalanced dataset in the RKHS defined as Φ) and respectively. Al is computed as .
Step 5: Compute the score of a new sample as ,where ζl'=+1 if l=+, otherwise, ζl′=−1; k∗,l holds elements k∗,l={k(x∗, xn):tn=ζl }, and .
Step 6: Compute the weighting normal vector where ℋ is an RKHS, which is a high dimensional feature space. The dot product in ℋ is computed through kernel function KΣ( , ).
Step 7: The distance from a new sample to the hyperplanes is used to classify the sample, which is based on
For classifiers, accuracy is the most intuitive and simplest evaluation index, which assesses the probability of the true value of the class label. It is no longer a proper measure for the evaluation of imbalanced data since it values the majority class more than the minority class (Gu et al., 2009). This measurement is meaningless for learning tasks that focus on the identification of the minority class. In terms of detecting mussels contaminated with DSP toxins in our research, a classifier to perform well on the contaminated samples is of great interest. In this case, we would like to have a classifier that has high prediction accuracy for the minority class while maintaining reasonable accuracy for the majority. Therefore, additional metrics are developed by combining initially sensitivity, specificity, and precision. They are computed as , , and where TP, TN, FP, and FN are the number of true positive, true negative, false positive, and false negative, respectively (Bekkar et al., 2013). By convention, the class labels of the minority class are positive, and the class labels of the majority class are negative.
F-measure can characterize the trade-off between sensitivity and specificity, which provides more insight into the functionality of a classifier than the accuracy metric (Shao et al., 2014). In our experiments, we use F-measure and accuracy to test the performance of imbalanced classification.
F-measure is defined as the harmonic mean of sensitivity and precision (Bekkar et al., 2013) The harmonic mean of two values tends to be closer to the smaller.
Therefore, only when the sensitivity and precision are large, the F-measure value will be large, and the model will perform better in the minority class. To evaluate the performance of ITWSVM for detecting contaminated mussels, we have used F-measure and accuracy as evaluation measures.
The spectra of all 240 samples of DSP toxins-contaminated mussels and healthy mussels at NIR range 950-1700 nm are displayed in Figure 3(A). Spectral curves of samples have similar change trends because they belong to the same species. Average spectral curves of contaminated mussels and healthy mussels are respectively plotted in Figure 3(B) to show spectral differences of two the groups of samples. The average spectral curve of DSP toxins-contaminated mussels is always higher than that of healthy mussels except in the vicinity of 1500 nm. In these ranges, two curves overlap slightly. Significant differences in average spectral curves occur in the 950-1400 nm ranges. This is because while feeding on toxin-producing algae, mussels can accumulate DSP toxins in their soft tissues. In mussels, a complex set of reactions produces, including metabolic and detoxification processes (Lopes et al., 2018). The DSP toxins have lipophilic properties and tend to accumulate in the adipose tissues. As increasing accumulation and esterification of DSP toxins in tissues, the fatty acid content gradually decreases. During this process, the lipid enzymes are actively involved in the metabolism of fatty acids in the digestive gland. Related to both xenobiotic metabolism and stress response, several enzymatic activities alter. Moreover, mussels are capable of the biochemical transformation of DSP toxins, thus generating novel metabolites. Extremely complex mechanisms of chemical and enzymatic conversion might be involved after the mussels are contaminated by DSP toxins. That causes differences in the components of chemical compositions of contaminated and healthy mussels.
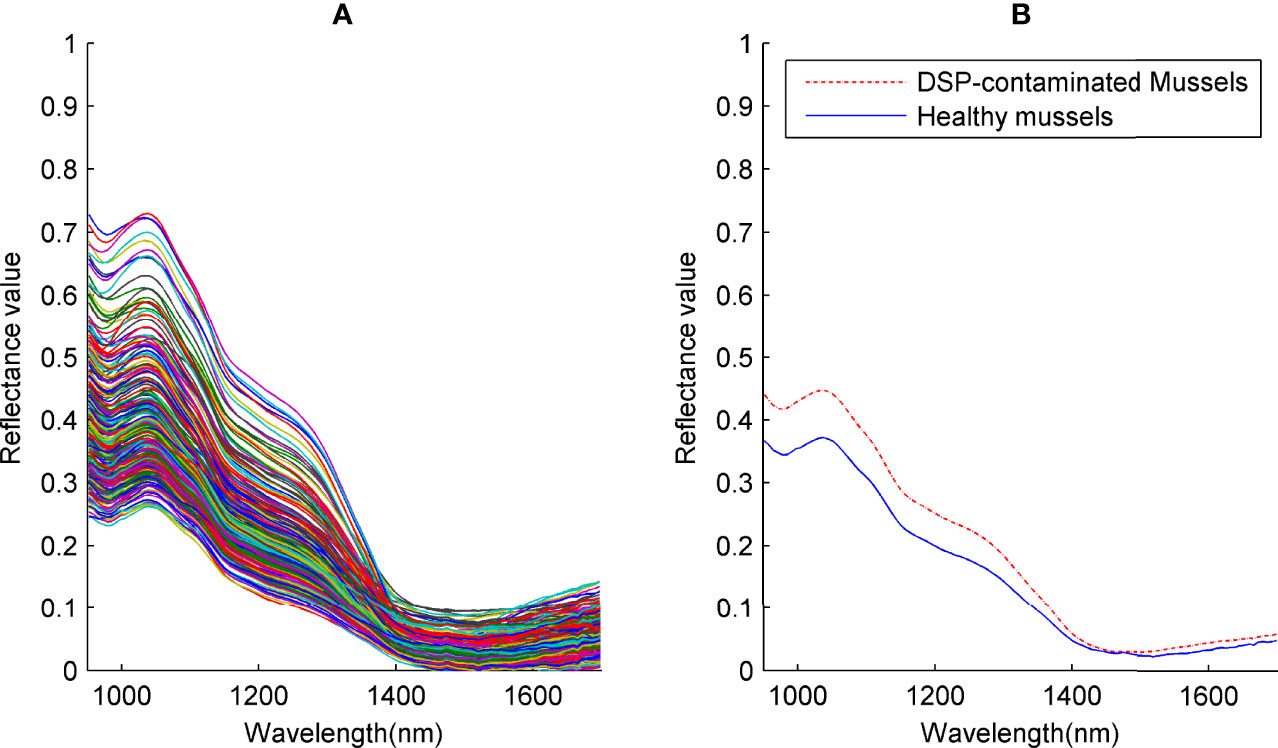
Figure 3 (A) The spectra of all 240 samples, (B) Average spectral curves of contaminated mussels and healthy mussels.
In the NIR region, there are spectral features regarding absorption bands of many chemical compounds (Barbin et al., 2020). Overtones and combinations of fundamental vibrations of O-H, N-H, C-H, and S-H functional groups are the most prominent absorption bands in the NIR region. Thus, spectral differences exist between DSP toxins-contaminated mussels and healthy mussels at particular wavebands caused by differences in compositions. These differences indicate the potential to detect DSP toxins-contaminated mussels using NIR spectroscopy.
Natural variability in the morphology (shape and size) of mussels resents a difficulty in the use of NIR spectra for identifying DSP toxins-contaminated mussels, since the spatial position in non-flat samples (the morphological effect) may cause spectral variability and light scattering, and differences in the effective path length inside solids may cause systematic variations (Esquerre et al., 2012). Therefore, it is essential to enhance chemical and physical differences between samples while attenuating the effect of the morphology of samples.
Prior to the development of classification models, original spectral data are pre-processed by applying some corrections to enhance spectral characteristics. Pre-processing algorithms include differentiation methods, standard normal variate, multiplicative scatter correction (MSC), filtering-based methods, and so on (Tuncer et al., 2021). In this study, the MSC pre-processing technique has been used to improve the accuracy of classification models.
To select the optimum subset of waveband variables, the Gaussian membership function has been used as a fuzzy similarity relation, in which parameter λ controls the granularity (Liu et al., 2019). We have performed experiments to explore the impact of λ on the effectiveness of the FRS algorithm by setting λ between 0.01 and 1 by adding 0.01 at a time. The test set contains 20 healthy samples and 20 DSP toxins-contaminated samples.
Figure 4 shows the variation in F-measure and the number of selected wavebands with λ for different imbalance ratios (IR). The IR is the degree of imbalance between healthy mussels and DSP toxins-contaminated mussels. For example, the IR of 100:60 means that there are 100 healthy samples and 60 samples contaminated with DSP toxins in the training dataset. When parameter λ is larger than certain values, no waveband has been selected in the FRS algorithm. The certain values of λ are 0.17 for IR of 100:100, 100:80 and 100:60, 0.18 for IR of 100:40 and 0.22 for 100:20. The number of selected wavebands shows an increase with the increase in λ first and then small fluctuations. The selected wavebands are about 10, and fewer than 15. It achieves the purpose of data reduction. Different waveband subsets have been obtained with different λ. The appropriate value of λ cannot be determined only by the number of selected wavebands and might be combined with the classification results of classifiers.
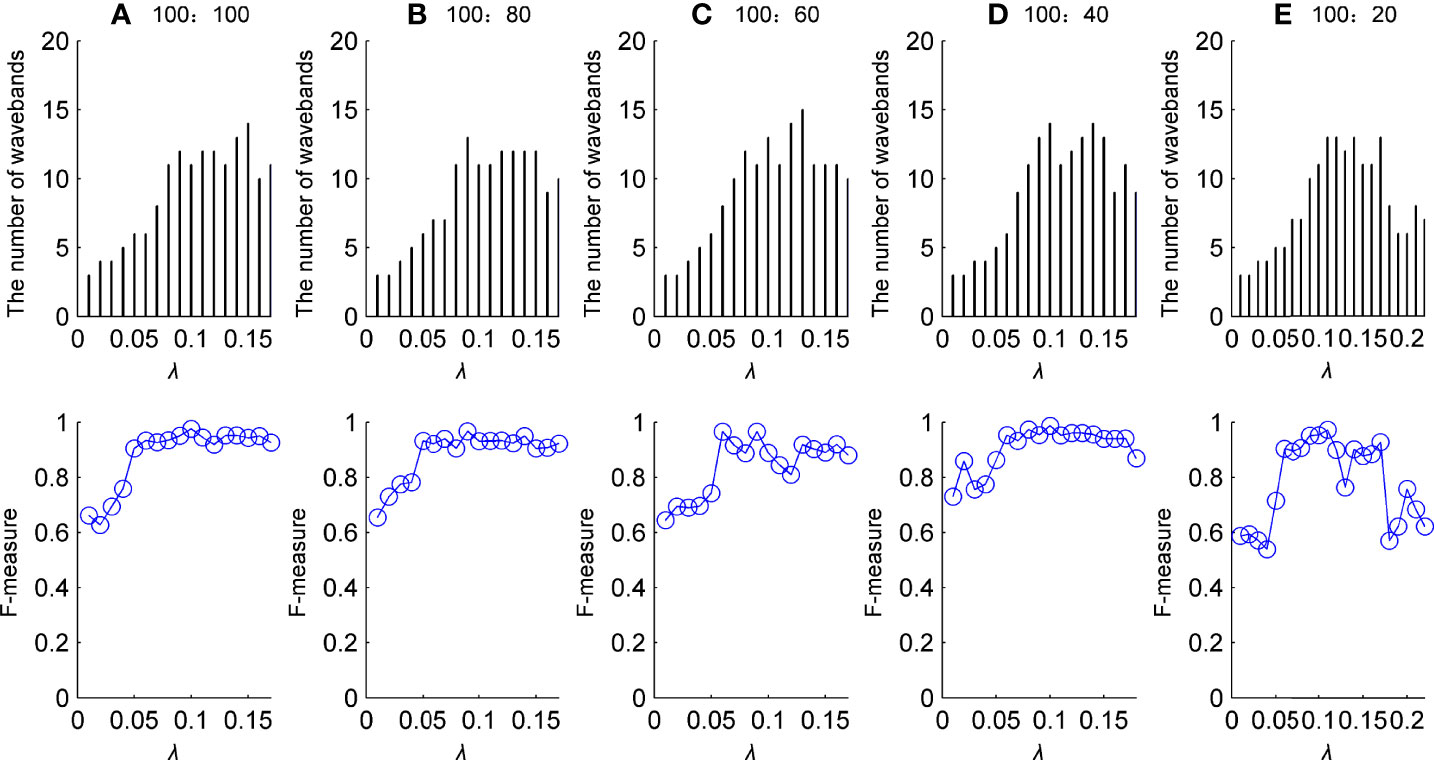
Figure 4 Variations in F-measure and the number of wavebands with λ. (A–E) Represent specific variations for different IR.
F-measure has been applied to measure the classification performance for an imbalanced dataset. For the ITWSVM classifier, the bandwidth value σ2 in the covariance Σ=σ2 of the Gaussian kernel has been searched within the range {0.1σ0,0.2σ0,… σ0}, where σ0 is the median value of ∥xn-xn′∥2. We have fixed the regularization hyperparameters c1,l= c1,l′ and c2,l= c2,l′ to reduce the computational complexity. To obtain the optimal regularization hyperparameters, a 10-fold nested cross-validation scheme has been applied. The hyperparameters have been obtained through a grid search in the range {2-9,2-7,2-5,2-3,2-1,20,21,23,25,27,29}.
The results of the F-measure in Figure 4 are the average of 30 runs by randomly selecting samples of the training set and testing set. At first, the values of the F-measure significantly increase as λ value increases. There is an oscillation in the process of increasing of F-measure. When the number of selected wavebands increases to about ten, F-measure does not exhibit an increasing profile with the increase of λ. This indicates that the mere addition of wavebands provides no reliable improvement in classification performance. The improvement of classification performance depends on the specific wavebands contained in the subset. According to F-measure values, optimal values of λ and the number of wavebands for different IR are exhibited in Table 1.
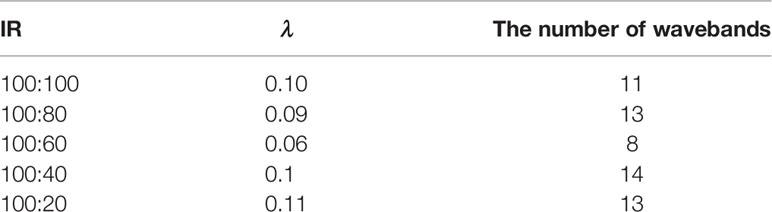
Table 1 Determined parameters for different IR.
We have further explored the physical basis for the detection model by analyzing the relationship between the occurrence of overtone and combination bands and selected wavebands. In Figure 5, specific wavebands contained in the subsets for detecting DSP toxins are marked on the spectral curves. For different IR, the selected wavebands are similar. Some wavebands have a great opportunity of being selected because they can provide abundant critical information for detection. The wavebands around 980 nm, 1100 nm, 1380 nm, 1470nm, 1520 nm, 1570 nm, 1620 nm, and 1700 nm are selected by the FRS algorithm. It has been reported that wavebands related to bonds associated with proteins were found in the ranges 1470 nm - 1516 nm and 1526 nm - 1536 nm, and signals attributed to lipids were revealed at 1690 nm - 1700 nm (Mamani-Linares et al., 2012).
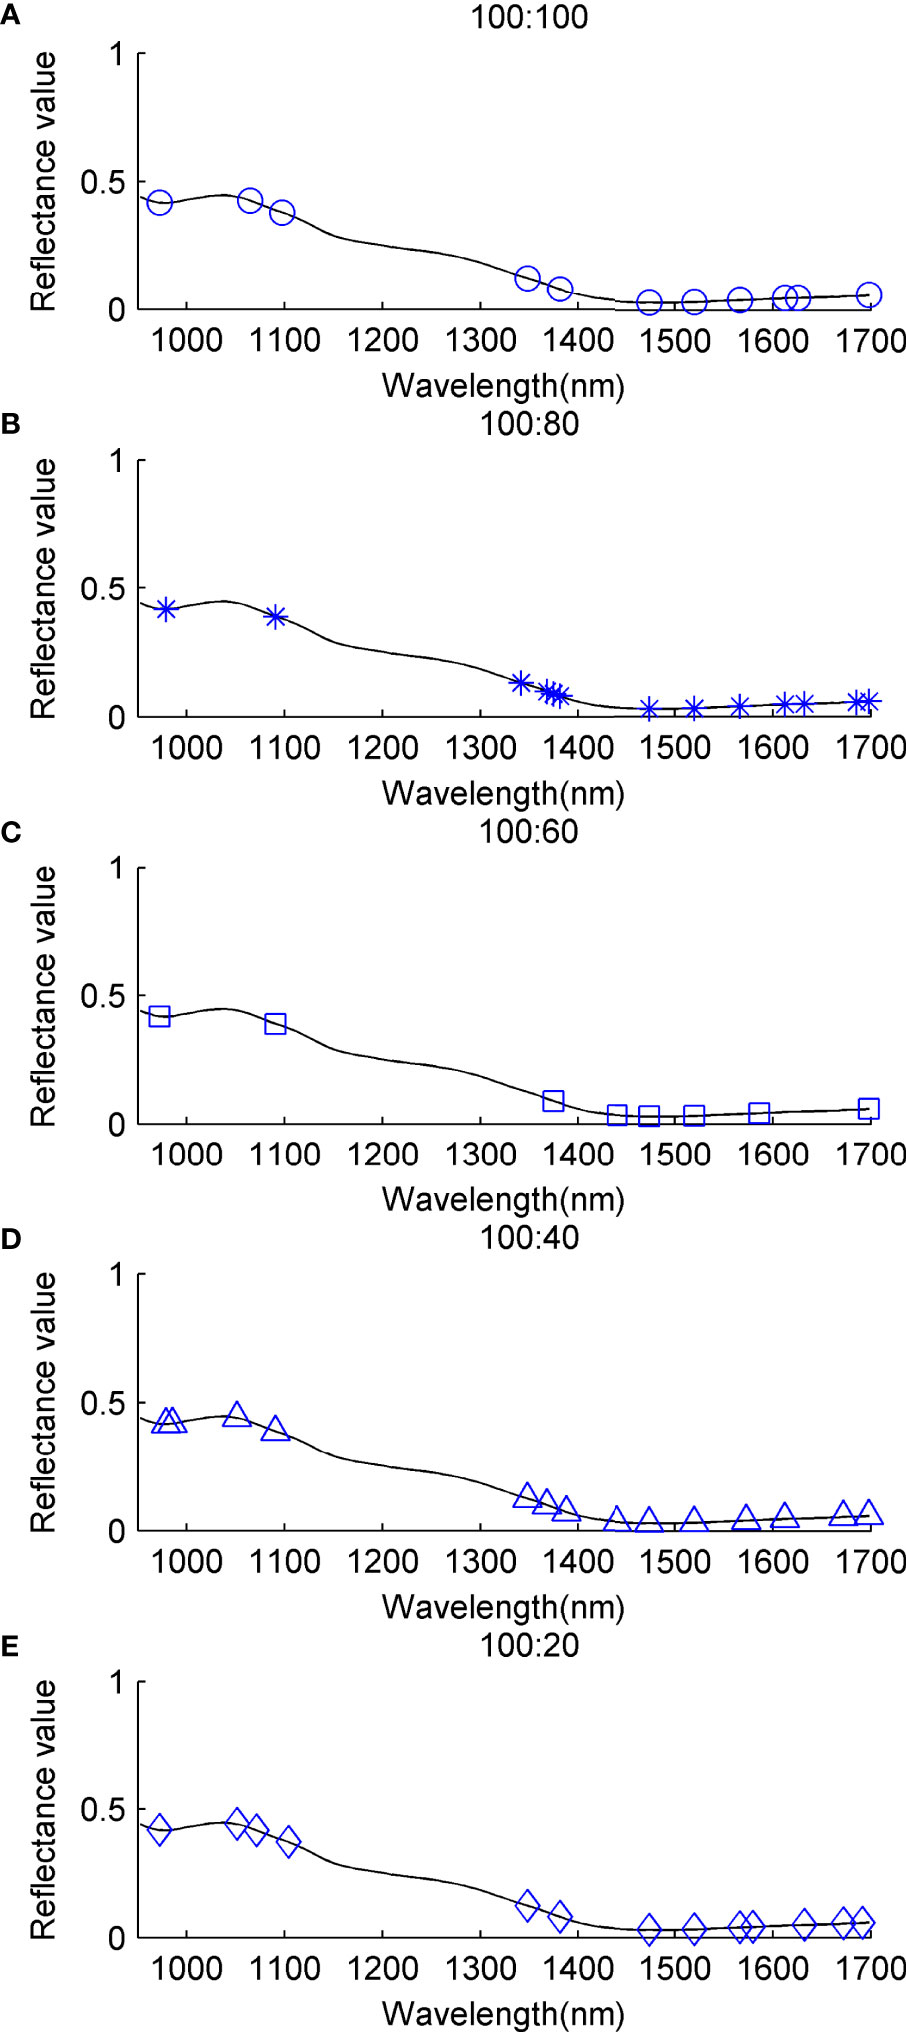
Figure 5 Selected wavebands of different IR for detecting DSP toxins. (A) IR=100:100, (B) IR=100:80, (C) IR=100:60, (D) IR=100:40, (E) IR=100:20.
Waveband subsets selected by our algorithms can reflect spectral differences. Therefore, the detection of DSP toxins-contaminated mussels can be realized by extracting important information from spectra.
For an in-depth illustration of the impact of regularization hyperparameters on classification performance in the ITWSVM model, we have performed experiments by taking IR of 100:80 as an example.
Figure 6 displays F-measure as a function of regularization hyperparameter values of c1,l and c2,l when the bandwidth value σ2 = σ0 = 2.94. F-measure varies dramatically with regularization hyperparameters c1,l and c2,l. The results are significantly affected by the choice of c1,l and c2,l. The optimal F-measure value is 0.9631 when c1,l = c1,l' ={21,23,25,27,29} and c2,l= c2,l'=2-7. This result is a result of a randomized run only and does not represent the best result.
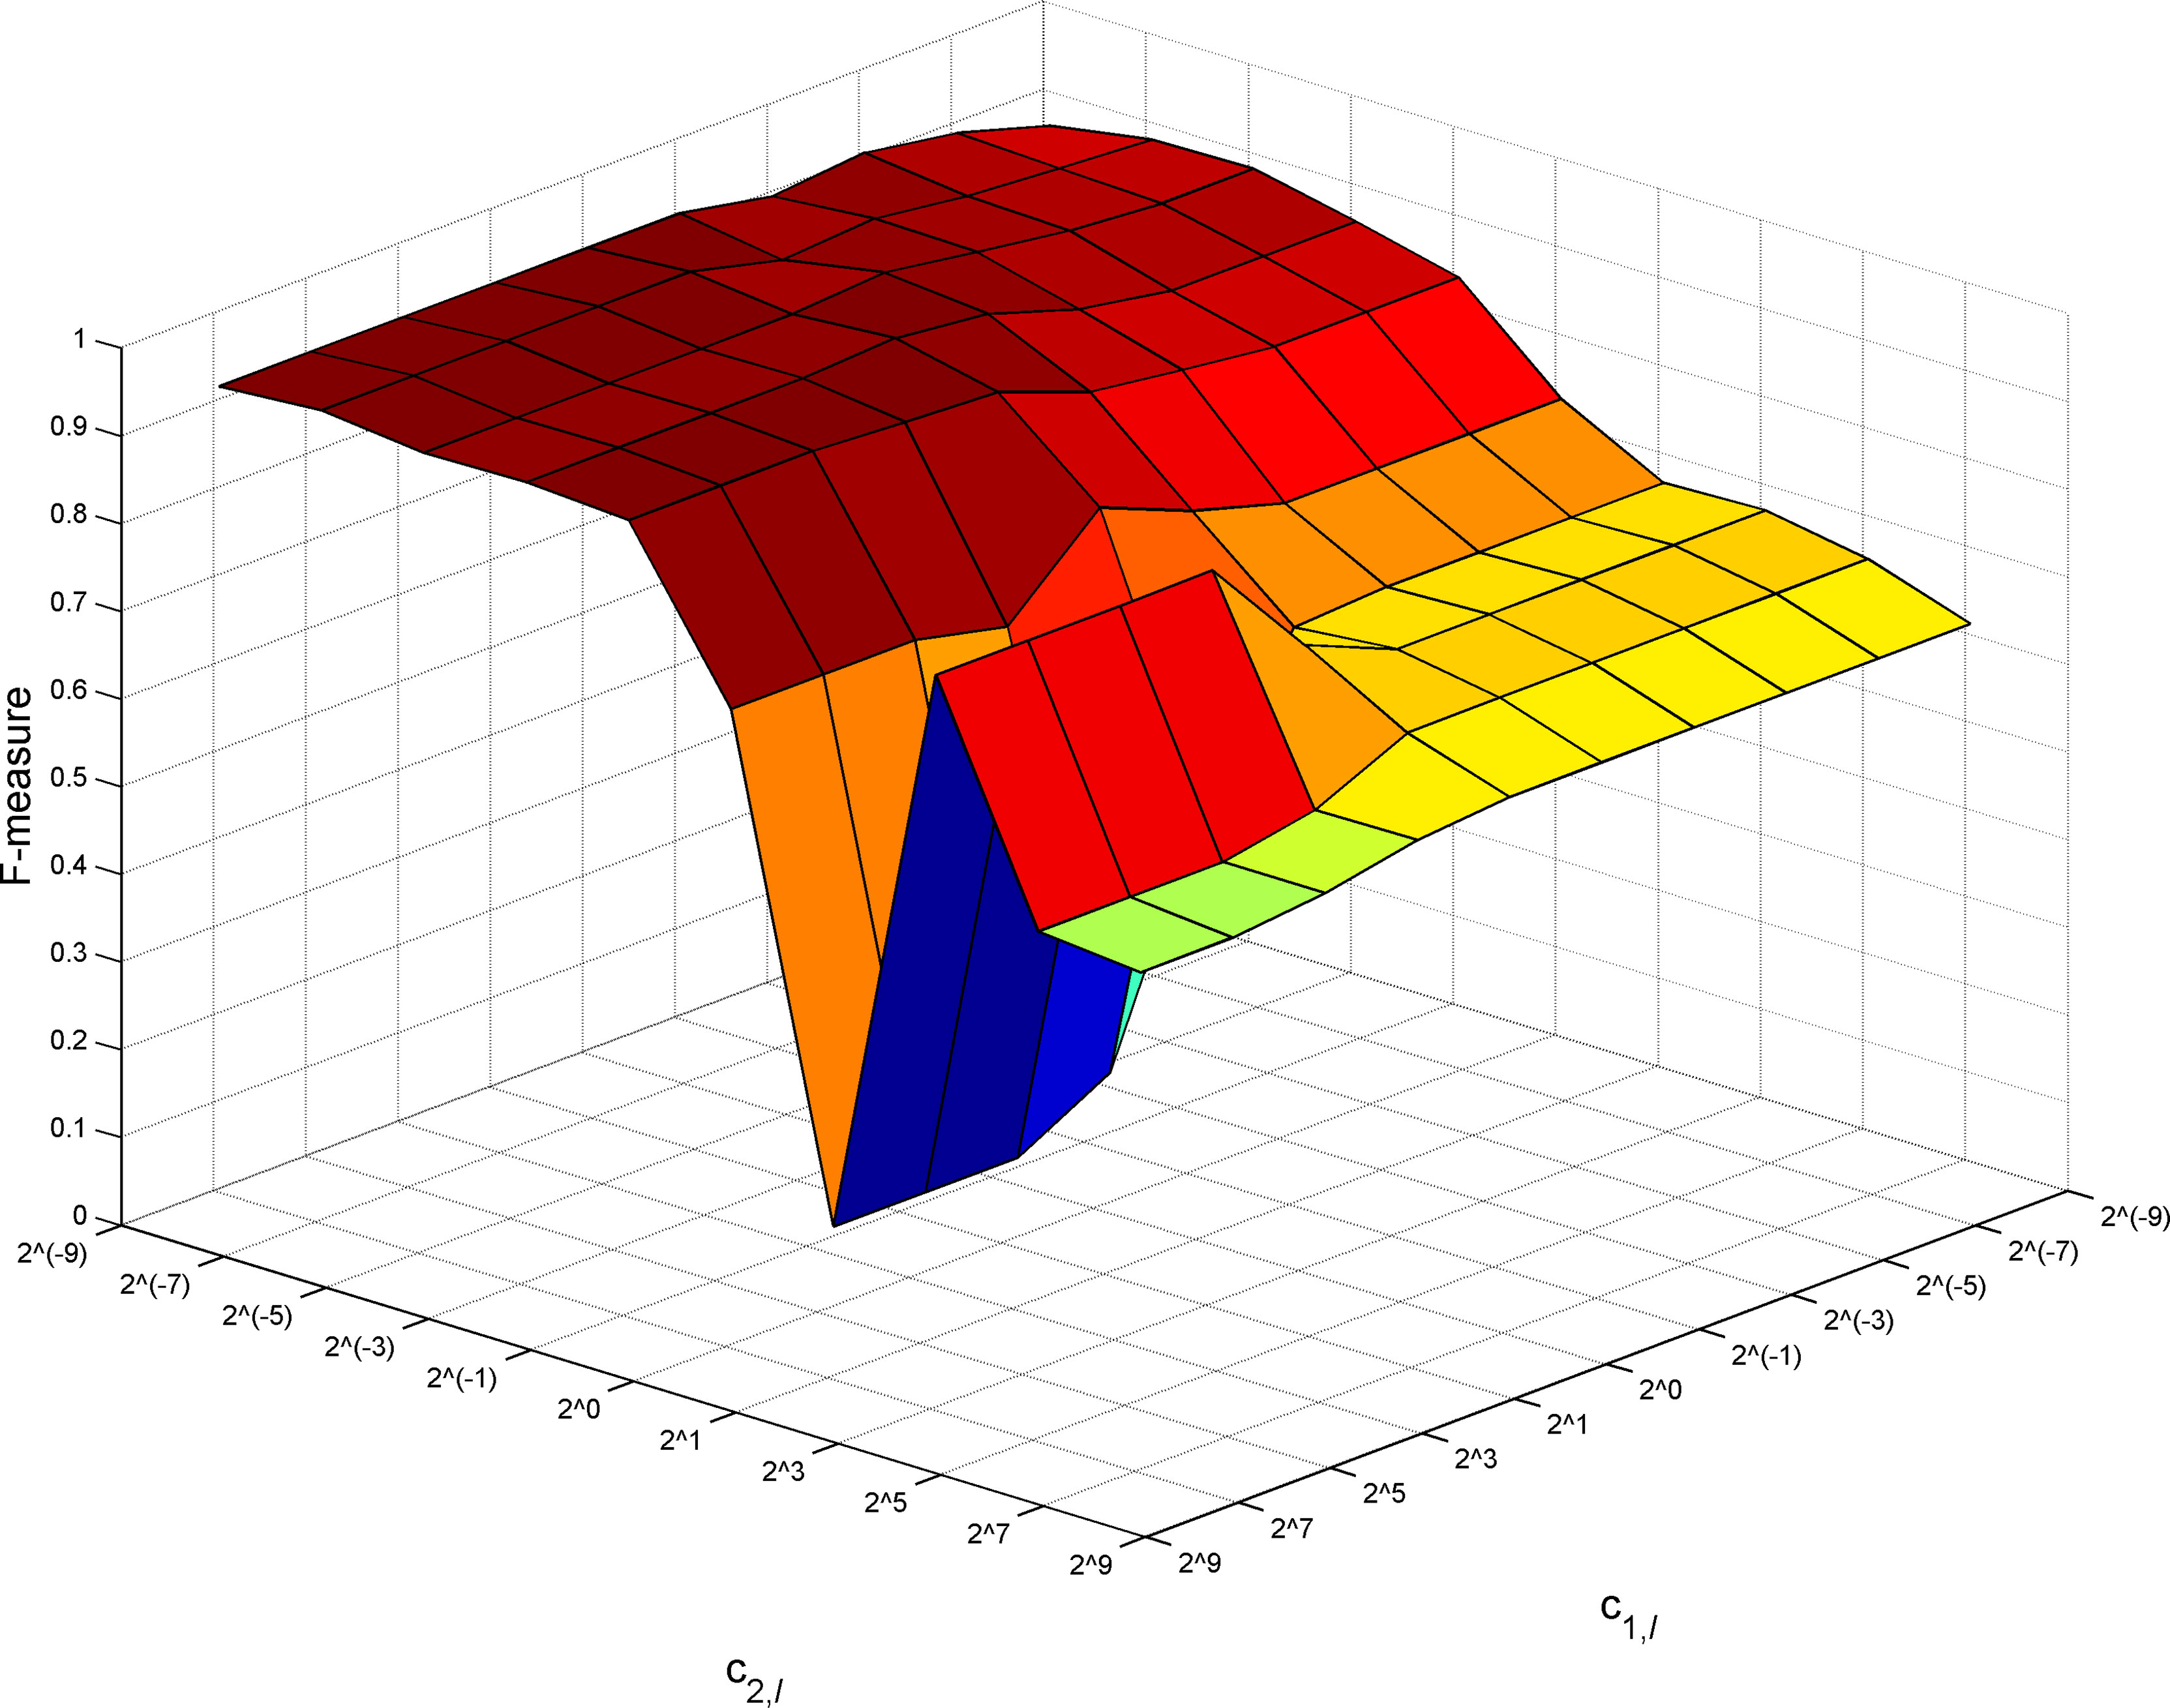
Figure 6 Variations in F-measure with regularization hyperparameters for IR=100:80.
Regarding other IR and other bandwidth values, there are similar patterns of changes in F-measure values with parameters c1,l and c2,l. Therefore, adjusting the regularization hyperparameters c1,l and c2,lis useful in practice.
To evaluate the performance of detection methods for DSP toxins, we focus on the comparison of ITWSVM with classical TWSVM and SVM strategies. The detection performance of models is assessed by measuring the F-measure and classification accuracy of 30 different divisions of the training set and test set. For TWSVM and SVM models, the parameters are set to their optimal value with which TWSVM and SVM models achieve the best results.
The experimental results are shown in Figures 7, 8, in which the average and standard deviation of F-measure and accuracy are presented. Our proposed ITWSVM approach achieves the best results regarding the average and the standard deviation for each IR, whose average is larger than and the standard deviation is smaller than TWSVM and SVM approach. The F-measure and accuracy of the ITWSVM algorithm achieve over 0.9647 and 96.58%, respectively. The proposed detection method can effectively detect DSP toxins. When the value of IR changed from 100:100 to 100:40, the F-measure and accuracy do not decrease, instead, they increase slightly. The maximum F-measure and accuracy appear at IR=100:40, which are 0.9886 and 98.83%, respectively. This result supports that ITWSVM is excellent at dealing with an imbalanced dataset.

Figure 7 Average and standard deviation of F-measure.
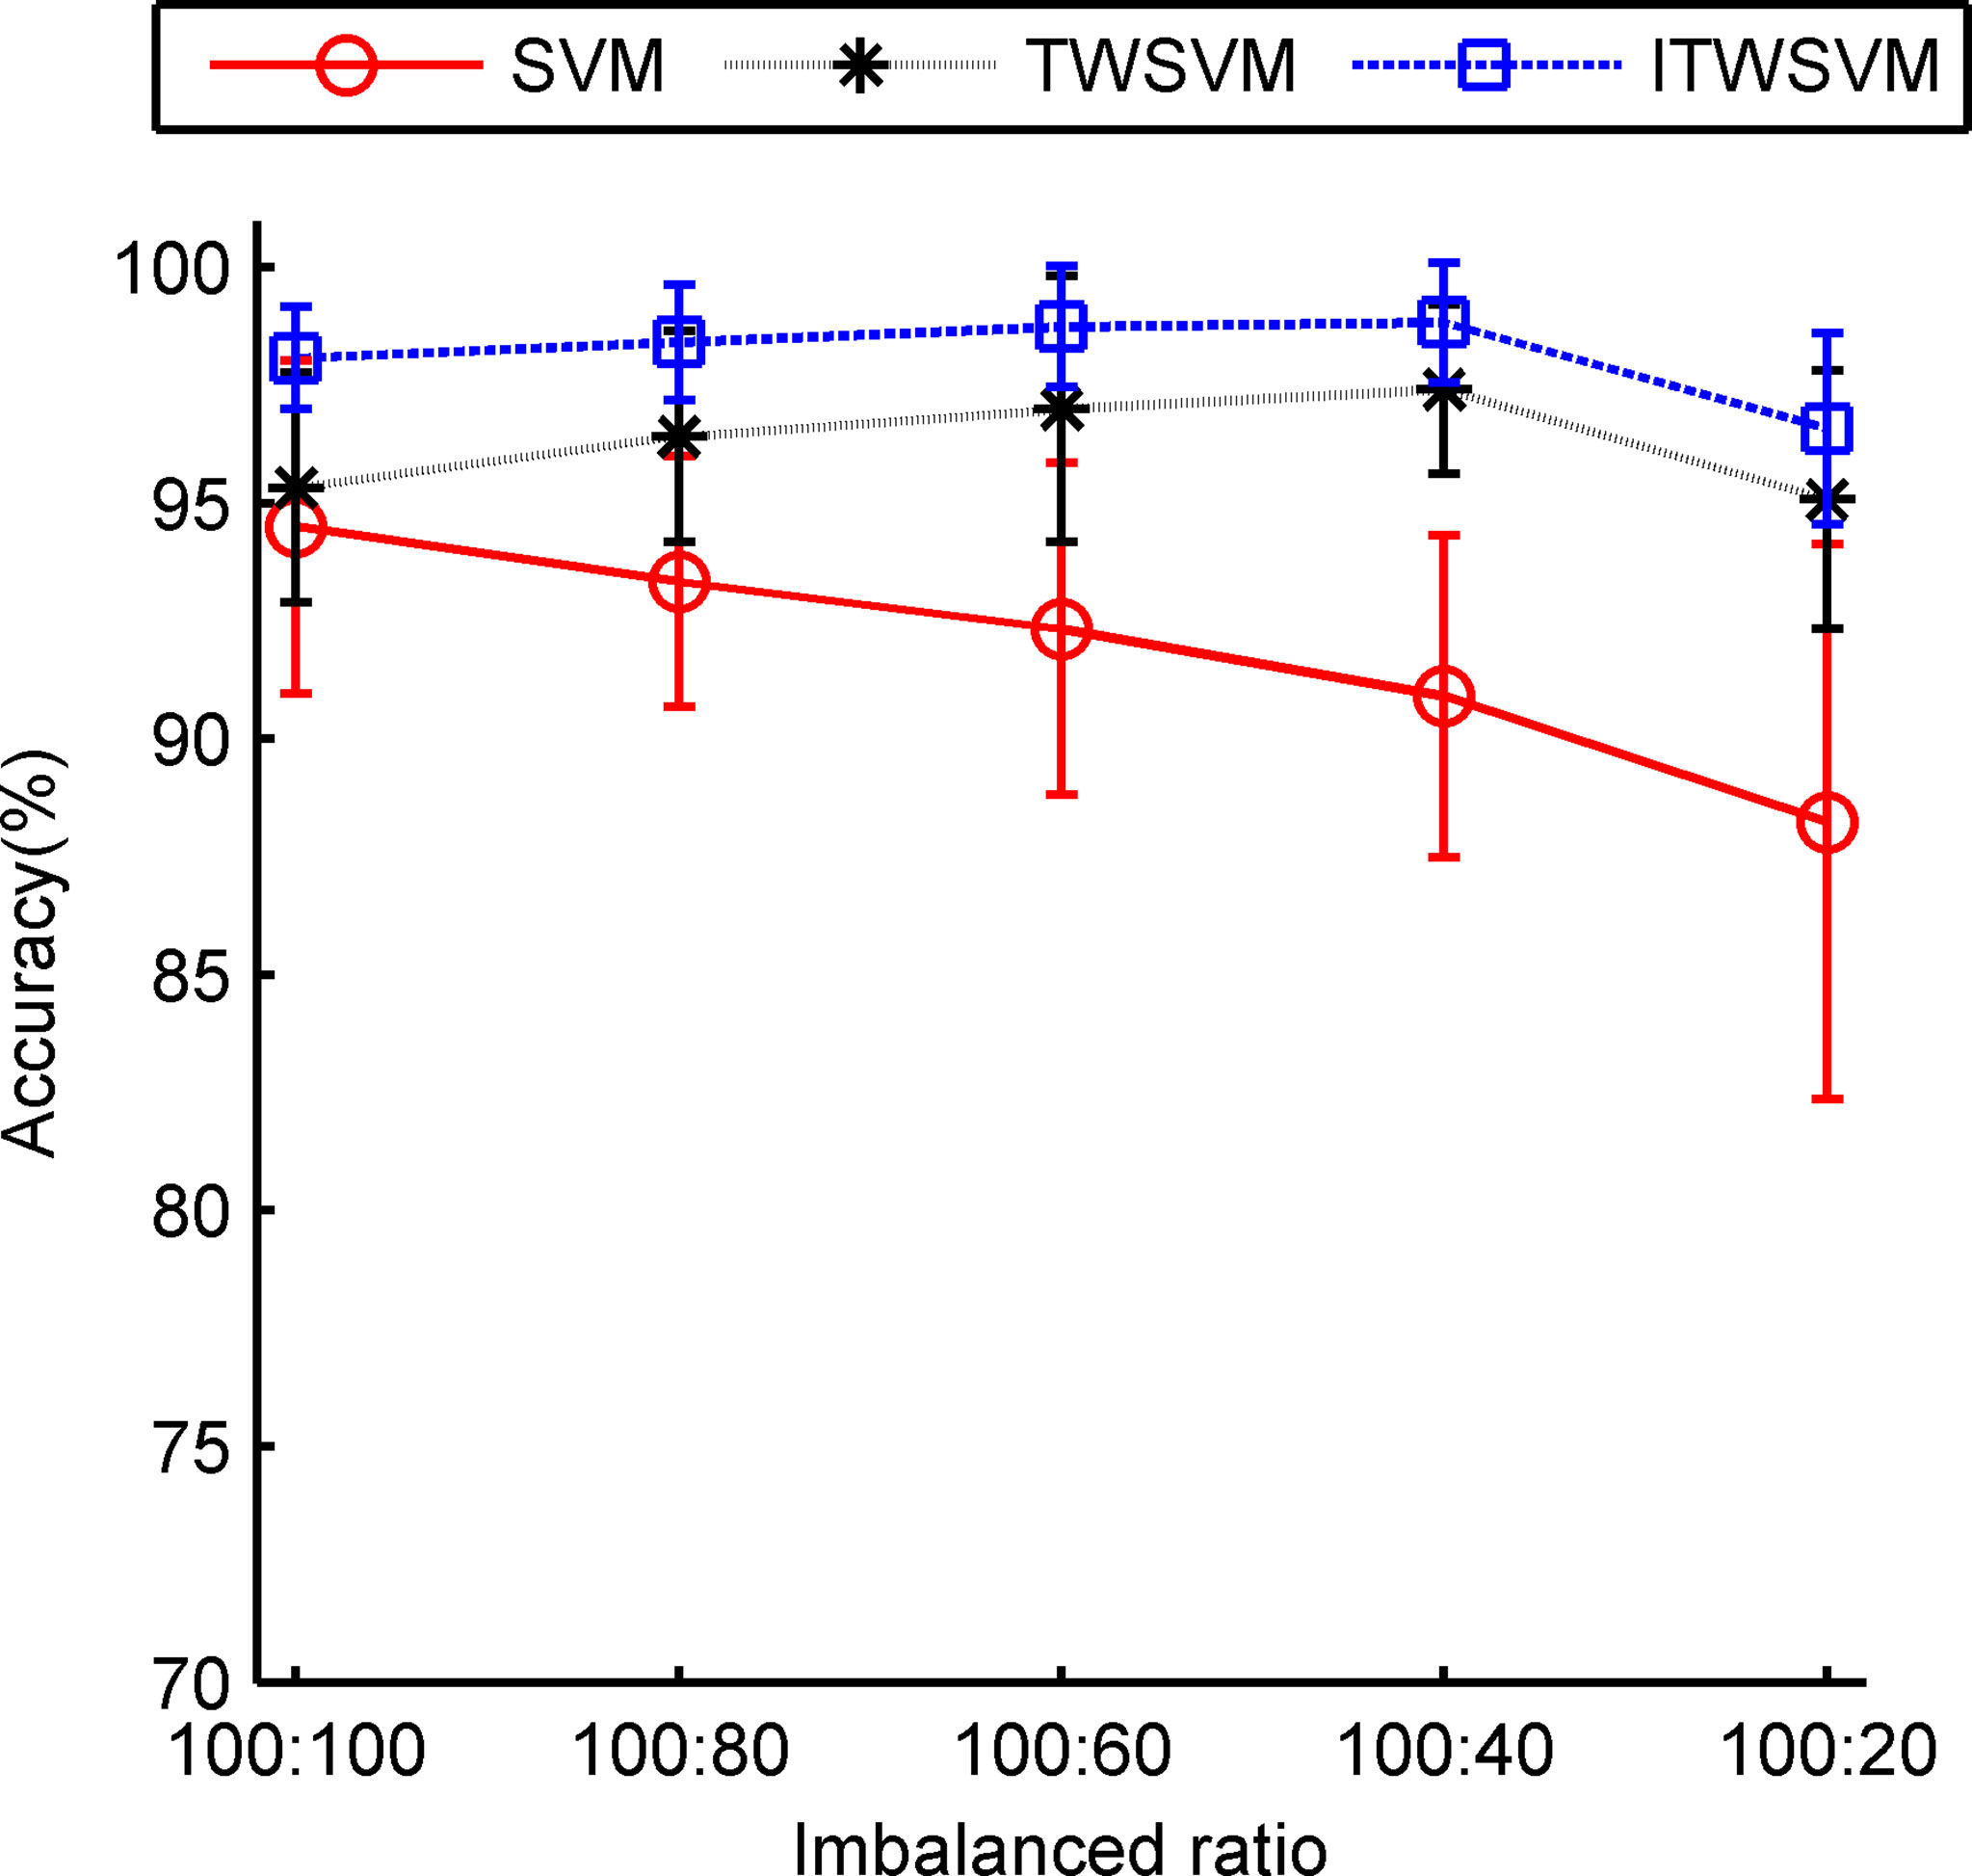
Figure 8 Average and standard deviation of accuracy.
The F-measure and accuracy of SVM vary greatly with IR, that is, the more imbalanced the training samples are, the worse the detection results are. The SVM algorithm ignores the imbalance between healthy mussels and DSP toxins-contaminated mussels, obtaining biased results. The ITWSVM and TWSVM algorithms are little affected by IR. That indicates that our proposed detection model is more suitable for datasets of imbalanced training samples.
To demonstrate the statistical significance of the ITWSVM algorithm compared with classical SVM and TWSVM algorithms, the pairwise Wilcoxon rank sum test (nonparametric analysis) has been conducted. The significance level is set as 0.05, that is, when the estimated p-value is less than 0.05, the performance difference between the two methods is statistically significant. Table 2 lists the calculated p-values obtained by the Wilcoxon test, which correspond to F-measure and classification accuracy, respectively. All results in Table 2 are less than 0.05. The results indicate that the performance differences between ITWSVM and the other two algorithms (SVM and TWSVM) are statistically significant for various IR. The performance difference between ITWSVM and SVM is more significant than that between ITWSVM and TWSVM. The above experimental results validate the effectiveness of our proposed ITWSVM model.

Table 2 The p-values between the ITWSVM algorithm and classical SVM and TWSVM algorithms for various IR.
To compare the performance of the proposed ITWSVM model with other state-of-the-art models in DSP toxins detection, we have conducted experiments under various IR. Multi-layer perceptron (MLP) (Murlidhar et al., 2021), extreme gradient boosting (XGBoost) (Zhao et al., 2022), adaptive boosting (AdaBoost) (Liu, 2010), random forest (RF) (Chen et al., 2021), and k-nearest neighbor (KNN) (Wang et al., 2021) models have been selected for comparison.
Tables 3, 4 summarize the experimental results in terms of average detection accuracy and F-measure of models. The accuracy and F-measure are averaged from the results of 30 times randomly divided datasets. Outstandingly, our ITWSVM model achieves the best results regarding detection accuracy and F-measure. As for other classifiers except for ITWSVM, from the accuracy and F-measure, we can see that MLP is outperforming other models. The performance of the AdaBoost and XGBoost models is comparable but slightly worse than that of MLP. The results of these models support our argument that ITWSVM can effectively explore the detection of DSP toxins in mussels, especially the imbalance problem.
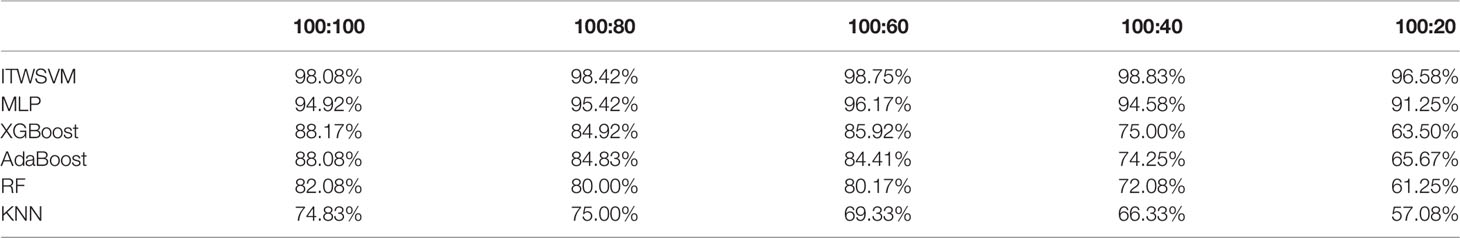
Table 3 The comparison of average accuracy for various IR.
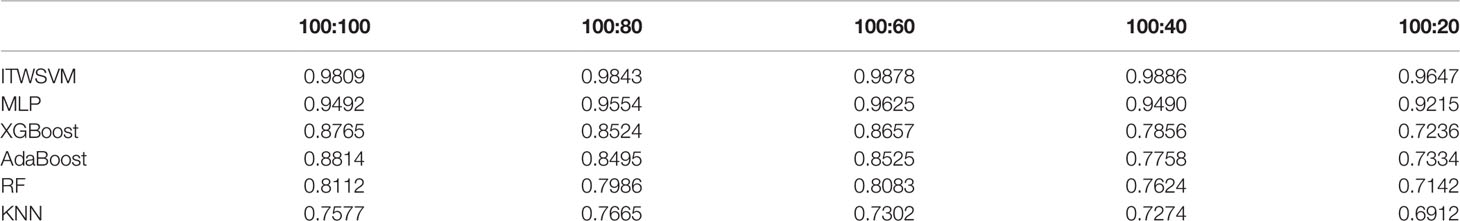
Table 4 The comparison of average F-measure for various IR.
This study confirms the viability of NIR spectroscopy as a rapid, reliable, and efficient analytical method for detecting DSP toxins in mussels. The characteristic wavebands selected by the FRS algorithm can effectively distinguish DSP toxins-contaminated mussels and healthy mussels. A novel learning model ITWSVM has been proposed to solve the imbalanced dataset problem in DSP toxins detection. Taking F-measure and accuracy as performance measures, the performance of ITWSVM outperforms TWSVM and SVM algorithms for different IR. We have analyzed the impact of parameters of the FRS algorithm and regularization hyperparameters of the ITWSVM model on detection performance. The optimal parameters of detection models have been determined by experiments. The hyperparameters selection of the ITWSVM model is important, therefore different optimization methods could be studied to improve the ITWSVM model in the future. Moreover, coupling the ITWSVM with resampling methods to improve the classification performance for datasets of imbalanced training samples would be an exciting research line.
The components and concentrations of chemical compositions of DSP toxins -contaminated and healthy mussels are different, which causes the difference in the profile of the corresponding NIR spectra. This paper has explored the feasibility of DSP toxins detection by NIR spectroscopy with chemometrics. The results provide a reference for preventing seafood poisoning and identifying the contaminant. NIR spectroscopy, when coupled with innovative chemometrics and machine learning techniques, is expected to play an important role in shellfish and seafood monitoring. In further research, the development of portable on-site instruments for toxic detection will be carried out, which is a highly-required tool for shellfish farmers and environmental management. It is expected to play an important role in the in-situ monitoring of the occurrence of harmful algal blooms.
The raw data supporting the conclusions of this article will be made available by the authors, without undue reservation.
YL: Conceptualization, Methodology, Funding Acquisition, Software, Formal Analysis, Writing - original draft, Writing - review and editing. FQ: Visualization, Validation. LX: Methodology, Investigation. RW: Supervision, Conceptualization, Writing - review and editing. WJ: Investigation, Formal analysis. ZX: Visualization, Resources. All authors contributed to the article and approved the submitted version.
This work was supported by the National Natural Science Foundation of China (grant number 62005109), Guangdong Basic and Applied Basic Research Foundation (grant numbers 2020A1515011368, 2021A1515012440), Lingnan Normal University Nature Science Research Project (grant numbers ZL1902, ZL2007).
The authors declare that the research was conducted in the absence of any commercial or financial relationships that could be construed as a potential conflict of interest.
All claims expressed in this article are solely those of the authors and do not necessarily represent those of their affiliated organizations, or those of the publisher, the editors and the reviewers. Any product that may be evaluated in this article, or claim that may be made by its manufacturer, is not guaranteed or endorsed by the publisher.
Aktar M. (2014). Trace Metal Concentrations in the Green-Lipped Mussel Perna Viridis (Linnaeus, 1758) Collected From Maheshkhali Channel, Cox’s Bazar, Bangladesh. J. Fisher. Sci. 8 (1), 42–51. doi: 10.3153/jfscom.2014005
Alvarez-Meza A. M., Orozco-Gutierrez A., Castellanos-Dominguez G. (2017). Kernel-Based Relevance Analysis With Enhanced Interpretability for Detection of Brain Activity Patterns. Front. Neurosci. 11, 550. doi: 10.3389/fnins.2017.00550
Barbin D. F., Badaró A. T., Honorato D. C. B., Ida E. Y., Shimokomaki M. (2020). Identification of Turkey Meat and Processed Products Using Near Infrared Spectroscopy. Food Contr. 107, 106816. doi: 10.1016/j.foodcont.2019.106816
Bekkar M., Djemaa H. K., Alitouche T. A. (2013). Evaluation Measures for Models Assessment Over Imbalanced Data Sets. J. Inf. Eng. Appl. 3 (10), 27–38.
Brown M. R. (2011). Rapid Compositional Analysis of Oysters Using Visible-Near Infrared Reflectance Spectroscopy. Aquaculture. 317 (1–4), 233–239. doi: 10.1016/j.aquaculture.2011.04.017
Caramês ET dos S., Piacentini K. C., Alves L. T., Pallone J. A. L., Rocha L de O., Spectroscopy N. I. R. (2020). And Chemometric Tools to Identify High Content of Deoxynivalenol in Barley. Food Additive. Contamin.: Part A. 37 (9), 1542–1552. doi: 10.1080/19440049.2020.1778189
Chakrabarti S., Chowdhury S., Nath S., Murmu P., Dey D. (2020). Near-Infrared Spectroscopy: A Non-Invasive Tool for Quality Evaluation of Seafood. Sci. Arch 1 (3), 3141. doi: 10.47587/SA.2020.1310
Chen X., Liu K., Cai J., Zhu D., Chen H. (2015). Identification of Heavy Metal-Contaminated Tegillarca Granosa Using Infrared Spectroscopy. Anal. Methods 7 (5), 2172–2181. doi: 10.1039/C4AY02396J
Chen G., Zhang X., Wu Z., Su J., Cai G. (2021). An Efficient Tea Quality Classification Algorithm Based on Near Infrared Spectroscopy and Random Forest. J. Food Proc. Eng. 44 (1), e13604. doi: 10.1111/jfpe.13604
Cintă Pinzaru S., Müller Cs, Tódor I. S., Glamuzina B., Chis V. (2016). NIR-Raman Spectrum and DFT Calculations of Okadaic Acid DSP Marine Biotoxin Microprobe: Raman Spectrum of Okadaic Acid DSP Biotoxin. J. Raman. Spectrosc. 47 (6), 636–642. doi: 10.1002/jrs.4870
Costa R. (2019). Advances and Current Challenges in Marine Biotoxins Monitoring. JMSE 7 (9), 302. doi: 10.3390/jmse7090302
Ding S., Zhao X., Zhang J., Zhang X., Xue Y. (2019). A Review on Multi-Class TWSVM. Artif. Intell. Rev. 52 (2), 775–801. doi: 10.1007/s10462-017-9586-y
Eberhart B. T., Moore L., Harrington N., Adams N., Borchert J., Trainer V. (2013). Screening Tests for the Rapid Detection of Diarrhetic Shellfish Toxins in Washington State. Mar. Drugs 11 (10), 3718–3734. doi: 10.3390/md11103718
Esquerre C., Gowen A. A., Burger J., Downey G., O’Donnell C. P. (2012). Suppressing Sample Morphology Effects in Near Infrared Spectral Imaging Using Chemometric Data Pre-Treatments. Chemomet. Intell. Lab. Syst. 117, 129–137. doi: 10.1016/j.chemolab.2012.02.006
Gerssen A., Pol-Hofstad I. E., Poelman M., Mulder P. P. J., Van den Top H. J., De Boer J. (2010). Marine Toxins: Chemistry, Toxicity, Occurrence and Detection, With Special Reference to the Dutch Situation. Toxins 2 (4), 878–904. doi: 10.3390/toxins2040878
Ghidini S., Varrà M. O., Zanardi E. (2019). Approaching Authenticity Issues in Fish and Seafood Products by Qualitative Spectroscopy and Chemometrics. Molecules 24 (9), 1812. doi: 10.3390/molecules24091812
Guévélou E., Carnegie R. B., Whitefleet-Smith L., Small J. M., Allen S. K. (2021). Near Infrared Reflectance Spectroscopy to Quantify Perkinsus Marinus Infecting Crassostrea Virginica. Aquaculture 533, 736063. doi: 10.1016/j.aquaculture.2020.736063
Gu Q., Zhu L., Cai Z. (2009). “Evaluation Measures of the Classification Performance of Imbalanced Data Sets”, in Computational Intelligence and Intelligent Systems, vol. 51. (Berlin, Heidelberg: Springer Berlin Heidelberg), 461–471. Available at: http://link.springer.com/10.1007/978-3-642-04962-0_53. Communications in Computer and Information Science.
Hoyos-Osorio J., Alvarez-Meza A., Daza-Santacoloma G., Orozco-Gutierrez A., Castellanos-Dominguez G. (2021). Relevant Information Undersampling to Support Imbalanced Data Classification. Neurocomputing 436, 136–146. doi: 10.1016/j.neucom.2021.01.033
Huai Q. Y., Gao C. L., Miao J. L., Yao H. L., Wang Z. L. (2013). Fast Detection of Saxitoxin Using Laser Tweezers Surface Enhanced Raman Spectroscopy. Anal. Methods 5 (23), 6870–6873. doi: 10.1039/c3ay41504j
Huang H., Wei X., Zhou Y. (2018). Twin Support Vector Machines: A Survey. Neurocomputing 300, 34–43. doi: 10.1016/j.neucom.2018.01.093
Jayadeva, Khemchandani R., Chandra S. (2007). Twin Support Vector Machines for Pattern Classification. IEEE Trans. Pattern Anal. Mach. Intell. 29 (5), 905–910. doi: 10.1109/TPAMI.2007.1068
Jimenez-Castaño C., Alvarez-Meza A., Orozco-Gutierrez A. (2020). Enhanced Automatic Twin Support Vector Machine for Imbalanced Data Classification. Pattern Recognit. 107, 107442. doi: 10.1016/j.patcog.2020.107442
Li X., Li Z., Chen J., Shi Q., Zhang R., Wang S., et al. (2014). Detection, Occurrence and Monthly Variations of Typical Lipophilic Marine Toxins Associated With Diarrhetic Shellfish Poisoning in the Coastal Seawater of Qingdao City, China. Chemosphere 111, 560–567. doi: 10.1016/j.chemosphere.2014.05.006
Liu M. (2010). Fingerprint Classification Based on Adaboost Learning From Singularity Features. Pattern Recognit. 43 (3), 1062–1070. doi: 10.1016/j.patcog.2009.08.011
Liu Y., Wu T., Yang J., Tan K., Wang S. (2019). Hyperspectral Band Selection for Soybean Classification Based on Information Measure in FRS Theory. Biosyst. Engineer. 178, 219–232. doi: 10.1016/j.biosystemseng.2018.12.002
Liu Y., Xu L., Zeng S., Qiao F., Jiang W., Xu Z. (2022). Rapid Detection of Mussels Contaminated by Heavy Metals Using Near-Infrared Reflectance Spectroscopy and a Constrained Difference Extreme Learning Machine. Spectrochim. Acta Part A.: Mol. Biomolecul. Spectrosc. 269, 120776. doi: 10.1016/j.saa.2021.120776
Li A., Yu R., Li J., Tang X., Wang Y., Yan T., et al. (2006). Protein Phosphatase Inhibition Assay for Detection of Diarrhetic Shellfish Poison in Oyster. Chin. J. Anal. Chem. 34 (3), 283–287. doi: 10.1016/S1872-2040(06)60014-5
Lopes M., Amorim A., Calado C., Reis Costa P. (2018). Determination of Cell Abundances and Paralytic Shellfish Toxins in Cultures of the Dinoflagellate Gymnodinium Catenatum by Fourier Transform Near Infrared Spectroscopy. JMSE 6 (4), 147. doi: 10.3390/jmse6040147
Madigan T., Kiermeier A., Carragher J., de Barros Lopes M., Cozzolino D. (2013). The Use of Rapid Instrumental Methods to Assess Freshness of Half Shell Pacific Oysters, Crassostrea Gigas: A Feasibility Study. Innovat. Food Sci. Emerg. Technol. 19, 204–209. doi: 10.1016/j.ifset.2013.04.005
Mamani-Linares L. W., Gallo C., Alomar D. (2012). Identification of Cattle, Llama and Horse Meat by Near Infrared Reflectance or Transflectance Spectroscopy. Meat. Sci. 90 (2), 378–385. doi: 10.1016/j.meatsci.2011.08.002
McCarron P., Kilcoyne J., Hess P. (2008). Effects of Cooking and Heat Treatment on Concentration and Tissue Distribution of Okadaic Acid and Dinophysistoxin-2 in Mussels (Mytilus Edulis). Toxicon 51 (6), 1081–1089. doi: 10.1016/j.toxicon.2008.01.009
Mishra P., Passos D. (2021). A Synergistic Use of Chemometrics and Deep Learning Improved the Predictive Performance of Near-Infrared Spectroscopy Models for Dry Matter Prediction in Mango Fruit. Chemomet. Intell. Lab. Syst. 212, 104287. doi: 10.1016/j.chemolab.2021.104287
Murlidhar B. R., Nguyen H., Rostami J., Bui X., Armaghani D. J., Ragam P., et al. (2021). Prediction of Flyrock Distance Induced by Mine Blasting Using a Novel Harris Hawks Optimization- Based Multi-Layer Perceptron Neural Network. J. Rock. Mech. Geotech. Engineer. 13 (6), 1413–1427. doi: 10.1016/j.jrmge.2021.08.005
Pinto R., Acosta V., Segnini M. I., Brito L., Martínez G. (2015). Temporal Variations of Heavy Metals Levels in Perna Viridis, on the Chacopata-Bocaripo Lagoon Axis, Sucre State, Venezuela. Mar. Poll. Bull. 91 (2), 418–423. doi: 10.1016/j.marpolbul.2014.09.059
Prassopoulou E., Katikou P., Georgantelis D., Kyritsakis A. (2009). Detection of Okadaic Acid and Related Esters in Mussels During Diarrhetic Shellfish Poisoning (DSP) Episodes in Greece Using the Mouse Bioassay, the PP2A Inhibition Assay and HPLC With Fluorimetric Detection. Toxicon. 53 (2), 214–227. doi: 10.1016/j.toxicon.2008.11.003
Qian Y., Wang Q., Cheng H., Liang J., Dang C. (2015). Fuzzy-Rough Feature Selection Accelerator. Fuzzy. Sets. Syst. 258, 61–78. doi: 10.1016/j.fss.2014.04.029
Shao Y. H., Chen W. J., Zhang J. J., Wang Z., Deng N. Y. (2014). An Efficient Weighted Lagrangian Twin Support Vector Machine for Imbalanced Data Classification. Pattern Recognit. 47 (9), 3158–3167. doi: 10.1016/j.patcog.2014.03.008
Tao F., Yao H., Zhu F., Hruska Z., Liu Y., Rajasekaran K., et al. (2019). A Rapid and Nondestructive Method for Simultaneous Determination of Aflatoxigenic Fungus and Aflatoxin Contamination on Corn Kernels. J. Agric. Food Chem. 67 (18), 5230–5239. doi: 10.1021/acs.jafc.9b01044
Tuncer F. D., Dogu D., Akdeniz E. (2021). Efficiency of Preprocessing Methods for Discrimination of Anatomically Similar Pine Species by NIR Spectroscopy. Wood Mater. Sci. Engineer. 1–10. doi: 10.1080/17480272.2021.2012821
Wang L., Wang X., Liu X., Wang Y., Ren X., Dong Y., et al. (2021). Fast Discrimination and Quantification Analysis of Curcumae Radix From Four Botanical Origins Using NIR Spectroscopy Coupled With Chemometrics Tools. Spectrochim. Acta Part A.: Mol. Biomolecul. Spectrosc. 254, 119626. doi: 10.1016/j.saa.2021.119626
Xiao W., Yang J., Fang H., Zhuang J., Ku Y. (2019). A Robust Classification Algorithm for Separation of Construction Waste Using NIR Hyperspectral System. Waste. Manag. 90, 1–9. doi: 10.1016/j.wasman.2019.04.036
Yuan K. K., Duan G. F., Liu Q. Y., Li H. Y., Yang W. D. (2021). Inhibition of Diarrheal Shellfish Toxins Accumulation in the Mussel Perna Viridis by Curcumin and Underlying Mechanisms. Toxins 13 (8), 578. doi: 10.3390/toxins13080578
Zhao D., Wang J., Jiang X., Zhen J., Miao J., Wang J., et al. (2022). Reflectance Spectroscopy for Assessing Heavy Metal Pollution Indices in Mangrove Sediments Using Xgboost Method and Physicochemical Properties. CATENA 211, 105967. doi: 10.1016/j.catena.2021.105967
Keywords: near-infrared spectroscopy, diarrhetic shellfish poisoning toxins, mussels (Mytilidae), waveband selection, twin support vector machines (TWSVM)
Citation: Liu Y, Qiao F, Xu L, Wang R, Jiang W and Xu Z (2022) Fast Detection of Diarrhetic Shellfish Poisoning Toxins in Mussels Using NIR Spectroscopy and Improved Twin Support Vector Machines. Front. Mar. Sci. 9:907378. doi: 10.3389/fmars.2022.907378
Received: 29 March 2022; Accepted: 26 April 2022;
Published: 09 June 2022.
Edited by:
Paulo João Vieira Vale, Portuguese Institute for Sea and Atmosphere (IPMA), PortugalReviewed by:
Hao Zhang, Henan Agricultural University, ChinaCopyright © 2022 Liu, Qiao, Xu, Wang, Jiang and Xu. This is an open-access article distributed under the terms of the Creative Commons Attribution License (CC BY). The use, distribution or reproduction in other forums is permitted, provided the original author(s) and the copyright owner(s) are credited and that the original publication in this journal is cited, in accordance with accepted academic practice. No use, distribution or reproduction is permitted which does not comply with these terms.
*Correspondence: Yao Liu, bGl1eWFvQGxpbmduYW4uZWR1LmNu
Disclaimer: All claims expressed in this article are solely those of the authors and do not necessarily represent those of their affiliated organizations, or those of the publisher, the editors and the reviewers. Any product that may be evaluated in this article or claim that may be made by its manufacturer is not guaranteed or endorsed by the publisher.
Research integrity at Frontiers
Learn more about the work of our research integrity team to safeguard the quality of each article we publish.