 Yineng Li
 Shaotian Li1,2
 Shiqiu Peng
 Fenghua Zhou
- 1State Key Laboratory of Tropical Oceanography, Key Laboratory of Science and Technology on Operational Oceanography, South China Sea Institute of Oceanology, Chinese Academy of Sciences, Guangzhou, China
- 2Southern Marine Science and Engineering Guangdong Laboratory (Guangzhou), Guangzhou, China
- 3Guangxi Key Laboratory of Marine Disaster in the Beibu Gulf, Beibu Gulf University, Qinzhou, China
An updated real-time Experimental Platform of Marine Environment Forecasting system for the North Indian Ocean, called EPMEF-NIO, is introduced in this study. The main changes of the updated system include the following: 1) aside from the eastern Indian Ocean (EIO), the western Indian Ocean (WIO) is added to the regions for weather, surge, and wave forecasts, and the horizontal resolutions for the two-domain weather forecast are increased from 24 and 8 km to 18 and 6 km; 2) a three-domain-nested wave forecast is added to the system with spatial resolutions of 1/3°, 1/12°, and 1/36° for the Indo-Pacific, EIO and WIO, and Sri Lanka and northern Arabian Sea regions, respectively; 3) the length of forecast time is increased from 72 to 120 h. The assessment based on substantial observations shows that the performance of the EPMEF-NIO in weather, wave, and storm surge forecasts is promising and robust, with comparable (or even better) forecast skills for typhoons and waves to some other official agencies or reanalysis. This is mainly attributed to some spectacular techniques employed in the system including the simplified scale-selective data assimilation scheme and the sophisticated dealing with the swell from southern Indian Ocean. Therefore, the EPMEF_NIO can provide a valuable information of the marine environment forecasts in the North Indian Ocean region.
Highlights
● An updated real-time forecasting system for marine environments in the North Indian Ocean (EPMEF_NIO) is introduced.
● Validated by the substantial observations, the performance of the updated EPMEF-NIO in weather and wave forecasts is promising and robust.
● The simplified Scale-Selective Data Assimilation scheme and the sophisticated dealing with the swell from southern Indian Ocean improve the forecast.
Introduction
A tropical cyclone (TC) is an area of low pressure that develops over tropical or subtropical ocean. TC is one of the most destructive natural disasters in the world (Alam et al., 2003). Although the TC number of 4–5 per year in the North Indian Ocean (NIO) only accounts for 5% of the total in the global ocean, the impact of TCs is much higher than that in other basins (Dube et al., 1997; Frank and Ritchie, 1999; Singh, 2010; Takahashi, 2011; Paliwal and Patwardhan, 2013; Mohapatra et al., 2014; Rajasekhar et al., 2014; Wahiduzzaman et al., 2020). The coastal regions of NIO are affected by TCs during pre-monsoon (April and May) and post-monsoon (October to December) seasons, causing storm surges, extreme waves, heavy rains, and strong winds. The annual frequency of TCs over the Bay of Bengal (BOB) and Arabian Sea (AS) has a ratio of 4:1 (Singh et al., 2001; Singh and Singh, 2007). Therefore, the frequency and severity of extreme waves and surges are found to be higher in the eastern NIO compared to its western region. These extreme waves and surges are formed as extremely serious hazards along the east coast of India, Bangladesh, Myanmar, and Sri Lanka in the BOB (Webster, 2008; Wahiduzzaman et al., 2017; Wahiduzzaman and Yeasmin, 2019a; Wahiduzzaman and Yeasmin, 2019b).
To date, the major atmospheric and marine environment forecasting agencies are using atmospheric and oceanic numerical models to produce numerical forecasting products for TCs, waves, and storm surges. Although the TC track forecast has been steadily improving for decades, which is attributed to improved numerical technology, advanced data assimilation algorithms, new observation systems, improved physical parameterization, and increased computing resources, large uncertainties still exist when the forecast period is longer than 48 h. The TC forecast involves several key feature predictions including the track, intensity, associated extreme waves, storm surges, and rainfall (Chaudhuri and De Sarkar, 2008). Since damage and the property lost depend to a large extent on the track and intensity of TCs, predicting these two characteristics is considered to be the most important (Emanuel, 2003; Elsner et al., 2008).
Since 2010, the South China Sea Institute of Oceanology, Chinese Academy of Sciences has carried out the Eastern Indian Ocean Scientific cruises from March to May of every year. In response to the needs of safety in navigation and scientific activities, we developed the Marine Environment Forecasting Experimental Platform for the Eastern Indian Ocean (EPMEF_EIO) based on the “Experimental Platform of Marine Environment Forecasting for the South China Sea,” which started its operation from the autumn of 2010 (Peng et al., 2015; Li et al., 2018). From the spring of 2018, EPMEF_EIO had been replaced by a new version called EPMEF_NIO (EPMEF for NIO), which is running automatically 4 times a day. The main changes of the new version include the following: 1) aside from the eastern Indian Ocean (EIO), the western Indian Ocean (WIO) is added to the regions for weather, surge, and wave forecasts, and the horizontal resolutions for the two nesting domains of weather forecast are increased from 24 and 8 km to 18 and 6 km, respectively; 2) a three-domain-nested wave forecast is added to the system with spatial resolutions of 1/3°, 1/12°, and 1/36° for the outer (the Indo-Pacific regions), middle (the EIO and WIO regions), and inner (the Sri Lanka and northern AS regions) domains, respectively; 3) the length of forecast time is increased from 72 to 120 h. To assess the performance of this new forecast system, a validation against available observations and a set of sensitivity experiments investigating the effect of simplified scale-selective data assimilation (SSDA) scheme and swell from the southern Indian Ocean are conducted in this study.
The rest of this paper is organized as follows. In Section 2, the description of the EPMEF_NIO and the data used for validation in this study are briefly introduced. Section 3 presents the results of validations for wind, TC track, intensity, ocean wave, and storm surge forecasts. Section 4 shows the results of sensitivity experiments for including the simplified SSDA scheme and swell from the southern Indian Ocean. Conclusions are given in Section 5.
A Brief Description of EPMEF_IO and the Validation Data
A Brief Description of EPMEF_NIO
EPMEF-NIO includes two main forecast regions, i.e., the eastern and western NIO (EIO/WIO, Figure 1). The atmospheric model is based on the Weather Research and Forecasting Model (WRF) of Version 3.9, which uses the nesting technology to achieve the “dynamic downscaling” (Lo et al., 2008; Skamarock et al., 2008; Zhang et al., 2009). The initial and boundary conditions are from the National Centers for Environmental Prediction 6-hourly Global Forecast System (NCEP-GFS) with a resolution of 1° × 1° released by the National Oceanic and Atmospheric Administration (NOAA). The sea surface temperature (SST) used in WRF is based on the daily real-time global sea surface temperature (RTG_SST) analysis data provided by the National Centers for Environmental Prediction/Marine Modeling and Analysis Branch (NCEP/MMAB). The horizontal resolutions for the outer (d01) and inner (d02) domains of WRF for both EIO and WIO are 18 and 6 km (Figure 1), providing 120 h weather forecasting results for the EIO/WIO and Sri Lanka/northern AS regions, respectively. Both domains have 32 vertical levels. The Ferrier microphysics scheme (Ferrier et al., 2002), the Kain–Fritsch cumulus scheme (Kain and Fritsch, 1990; Kain and Fritsch, 1993), the Yonsei University planetary boundary layer scheme (Hong et al., 2006), and the Dudhia shortwave (Dudhia, 1989) and rapid radiative transfer model (RRTM) longwave (Mlawer et al., 1997) radiation schemes are used for all domains.
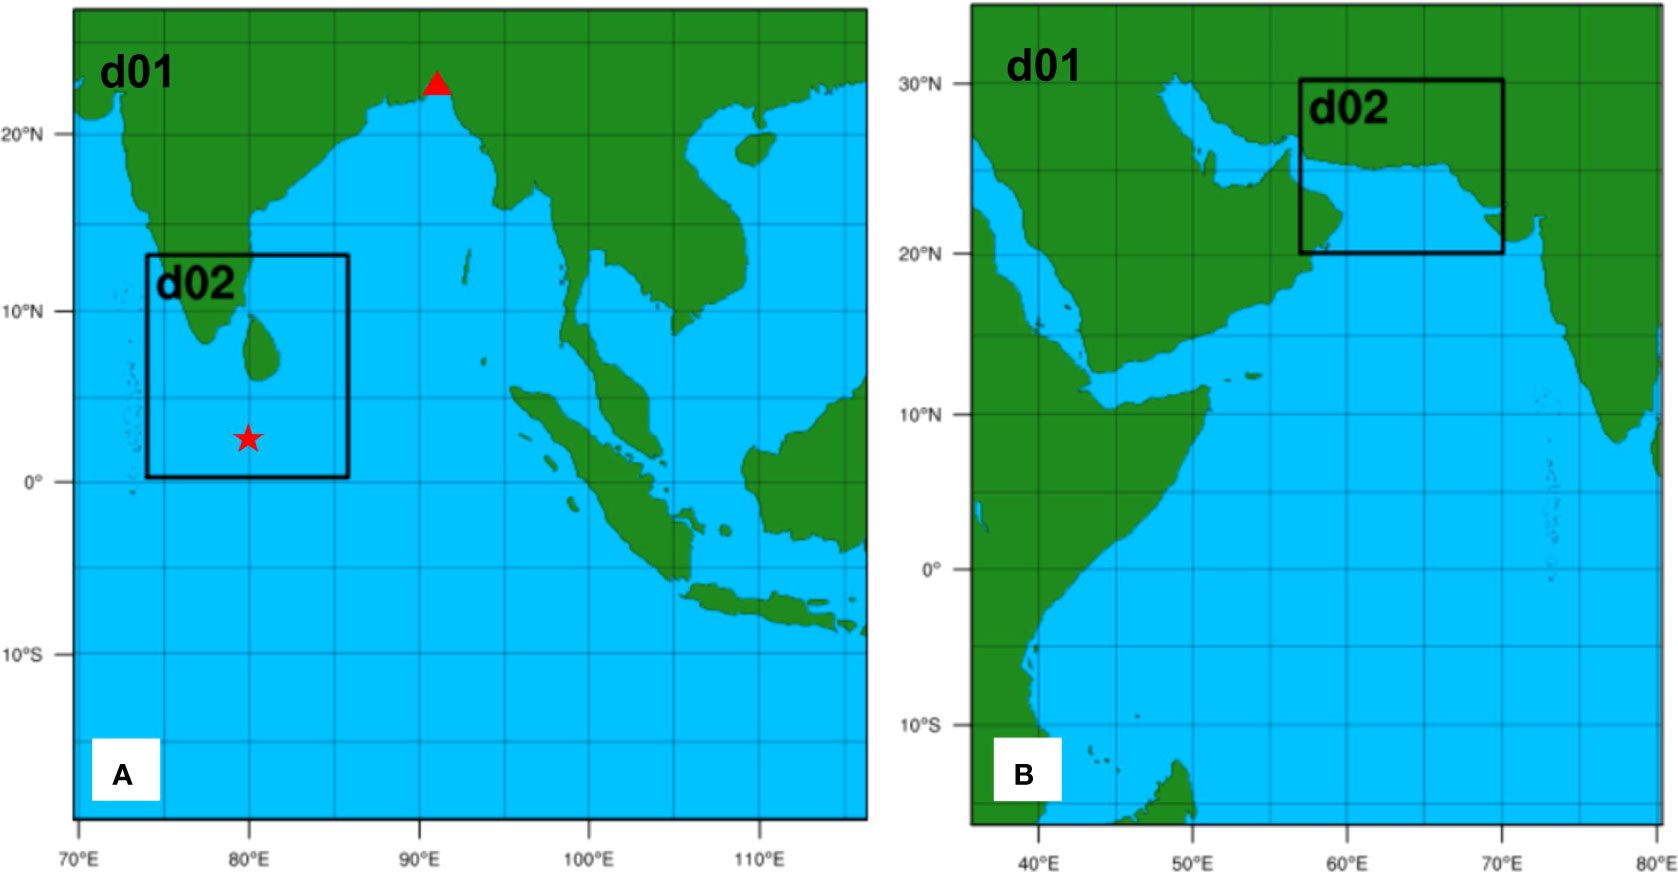
Figure 1 Domains of the atmospheric model for the (A) eastern Indian Ocean (EIO) and (B) western Indian Ocean (WIO). The star and triangle are the locations of buoy observation and tide-gauge station Chittagong, respectively.
A simplified version of the SSDA scheme has been added to the atmospheric model. The SSDA scheme has been proved to be effective in improving the typhoon track forecasting skills in the South China Sea through reducing the forecast errors of a large-scale wind field (Peng et al., 2010; Lai et al., 2014; Peng et al., 2015; Zhu et al., 2020). Unlike the original SSDA scheme of Peng et al. (2010), which needs to separate the wind fields of the global and regional models into large- and small-scale components using a digital filter, the simplified version of the SSDA scheme just extracts the steering flows from global and regional models, respectively. The steering flow of regional model is then replaced with that of the global model, while the small-scale information of the regional model is retained. The formula is as follows:
where is the regional model wind field before (after) the implementation of the simplified SSDA scheme and is the steering flows of the regional model (global model NCEP-GFS). The simplified SSDA scheme is implemented every 24 h during the integration, adjusting the steering flow of the regional model to that of the global model periodically.
The 2002 version of the Princeton Ocean Model (POM) is used for the storm surge forecast (Blumberg and Mellor, 1987; Mellor, 2004), which is forced by the 10 m wind field and sea surface pressure field provided by the outer domain of WRF (WRF_D01). The tidal harmonic constants from the Oregon State University Tidal Prediction Software (OTPS) are used to generate the tidal boundary (Egbert and Erofeeva, 2002). The 120 h storm surge forecast covers the EIO region (E75°-100°, S2° -N24° with a resolution of 1/12°) and the WIO region (E38°-75°, S3°-N28° with a resolution of 1/12°), which provides the open boundary conditions for the regions around Sri Lanka (E77°-E83°, N3°-N11° with a resolution of 1/36°) and the northern AS region (NAS, E59°-E65.5°, N20°-N26° with a resolution of 1/36°), respectively. The WAVEWATCH III model version 5.16 is used for the ocean wave forecast, which was developed at the US National Centers for Environmental Prediction (NOAA/NCEP) in the spirit of the third- generation wave model “WAve Modeling” (WAM) model (Komen et al., 1994; Tolman et al., 2016). The model domains for ocean wave are also divided into the EIO and WIO parts, but the simulation area is larger than the storm surge model (Figure 2). There are three nesting domains in the wave model. The outer domain for the Indo-Pacific region (E20°-E162°, S61°-N44°, WW3_D01) with a resolution of 1/3° is driven by the forecasted winds from the NCEP-GFS, providing open boundary information for both the EIO and WIO domains. The 120 h ocean wave forecasts for EIO and WIO (WW3_D02) cover the regions of E75°-100°, S15°-N24°, E38°-76°, and S15°-N28° with a resolution of 1/12°, nested with sub-domains around Sri Lanka (E77°-E84°, N5°-N12°) and the NAS (E58°-E67°, N20°-N27°), with a resolution of 1/36° (Figure 2). The gridded bathymetric data used for the wave and storm surge models are the General Bathymetric Chart of the Oceans (GEBCO) dataset at 30 arc-second intervals (www.gebco.net). The outputs of wave and surge model at 1 h interval include the water level, surge, surface tidal currents, significant wave height (SWH), mean wave length (LMN), mean wave period (TMN), and mean wave direction (DIRMN). It should be noted that in the new version of EPMEF_NIO, the impact of swell from the southern Indian Ocean on the wave forecast has been taken into account through the boundary information from the Indo-Pacific regional model (WW3_D01).
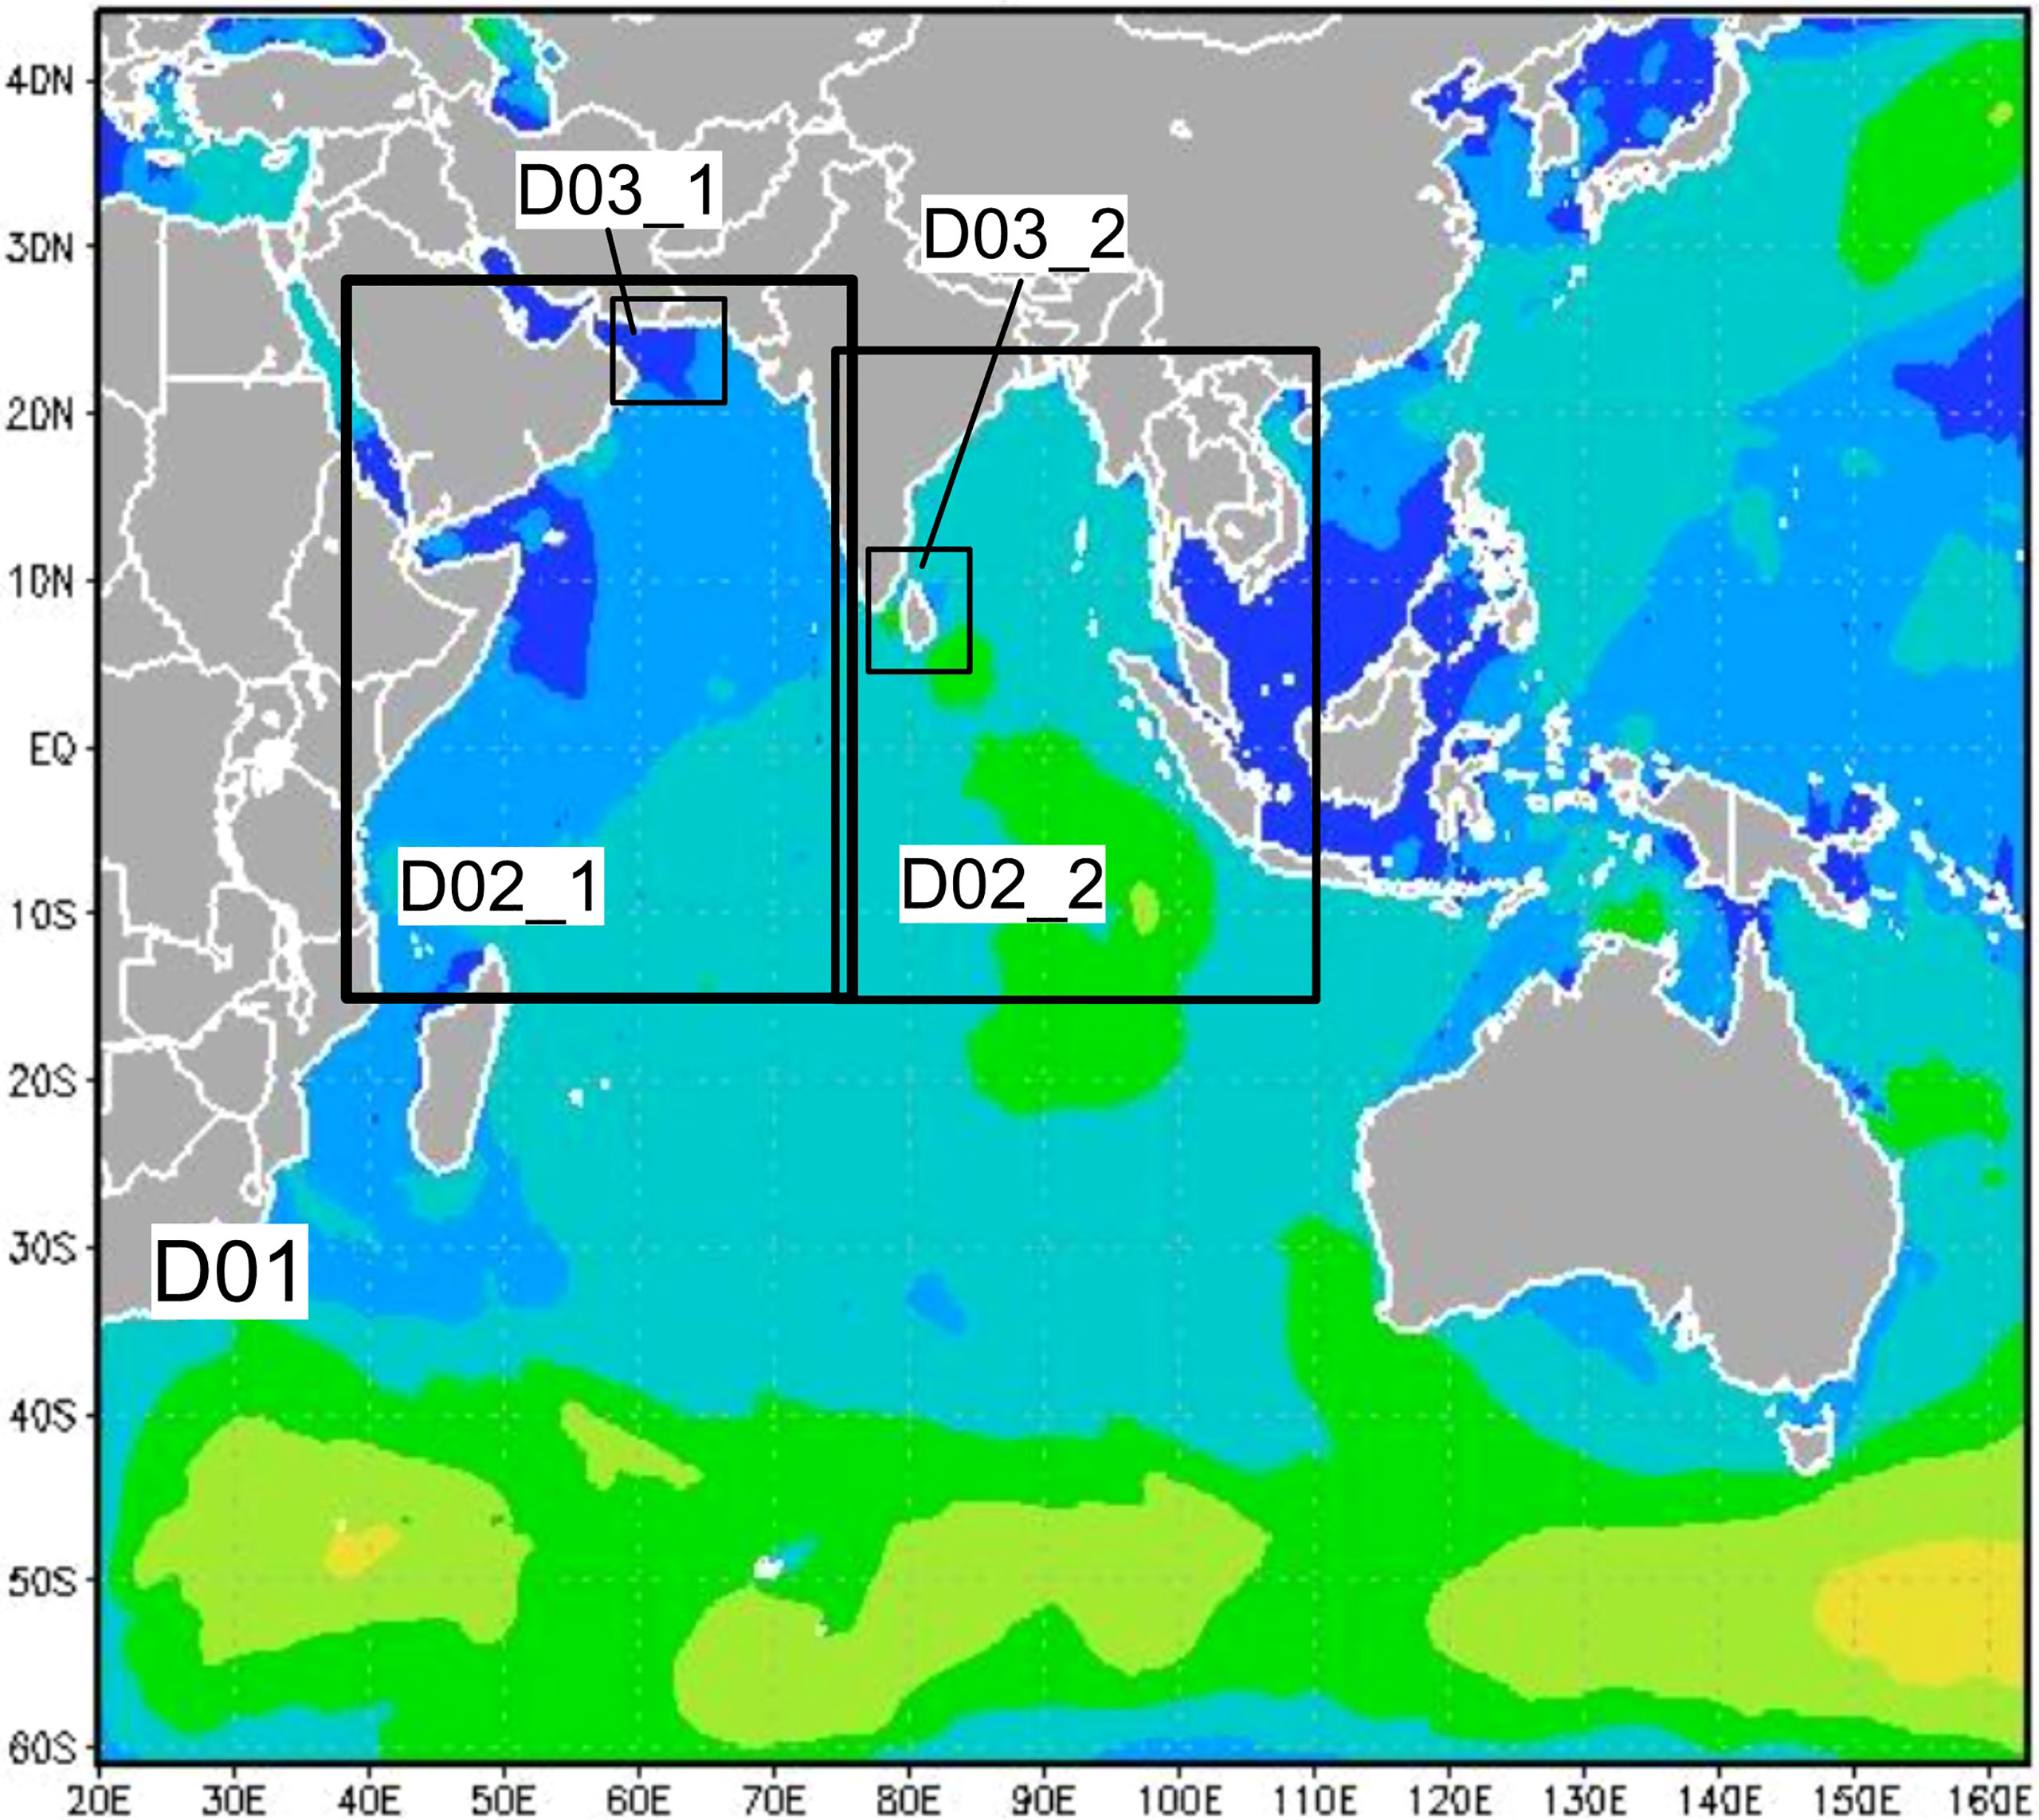
Figure 2 Nesting domains of the ocean wave model for the EIO and WIO.
The EPMEF_NIO is operationally run 4 times a day, providing 5-day real-time forecasts of atmospheric and oceanic variables for the NIO. All the processes, including the data downloading and pre-processing of the model input data, the post-processing of the model output data, figure plotting, and web-page displaying, are operated automatically (Figure 3). The forecasting results can be accessed online every day through the website http://epanf.scsio.ac.cn/yindu_sel.html.
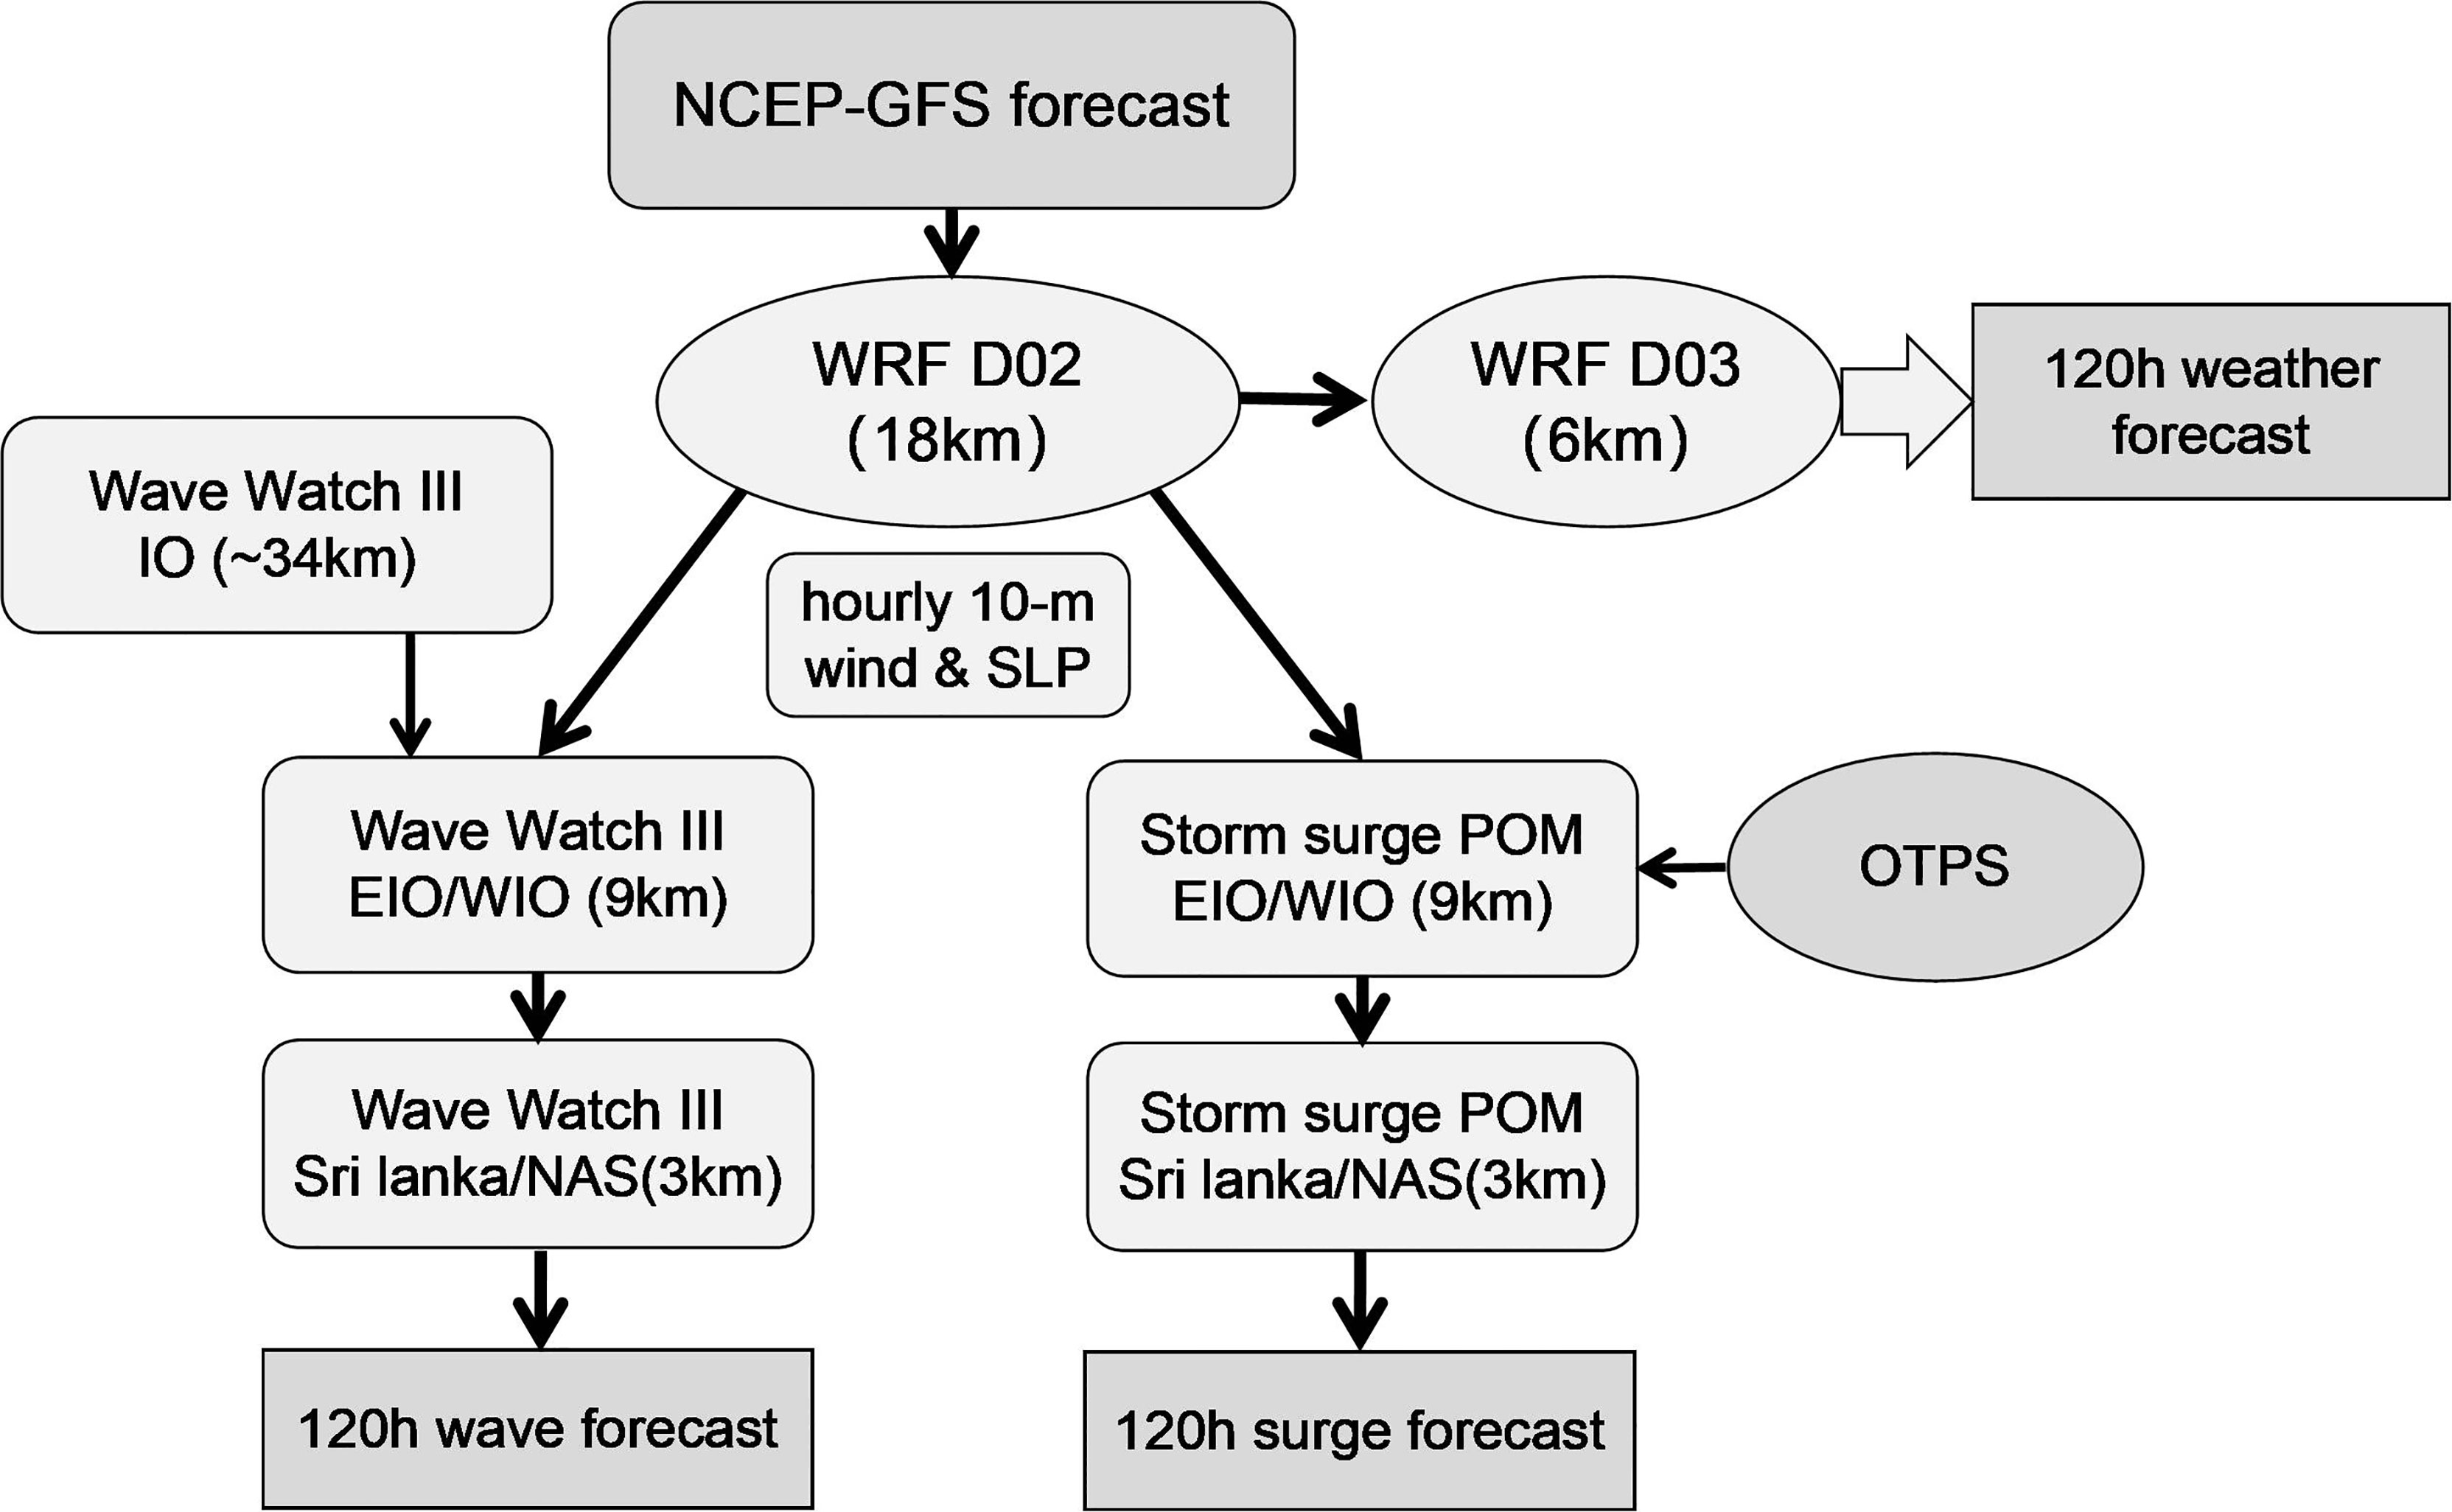
Figure 3 Flowchart of EPMEF-NIO. The National Centers for Environmental Prediction 6-hourly Global Forecast System (NCEP-GFS) from the National Oceanic and Atmospheric Administration (NOAA) and Oregon State University Tidal Prediction Software (OTPS) provide the global atmospheric and tidal information at the boundaries of EPMEF-NIO.
The Data Used for Validation
Four types of data were used to validate the forecasting results from EPMEF_NIO, including the TC Best track data from International Best Track Archive for Climate Stewardship (IBTrACS, https://www.ncei.noaa.gov/access/metadata/landing-page/bin/iso?id=gov.noaa.ncdc:C01552), the buoy data from the China–Sri Lanka Joint Science and Education Center (CSL-CER), China–France oceanography satellite (CFOSAT) data, and fifth-generation reanalysis data (ERA5) from the European Centre for Medium-Range Weather Forecasts (ECMWF; Hersbach et al., 2020). These data are mainly used for the validation of TC track and intensity, sea surface wind, and SWH.
The CSL-CER put a set of air–sea interface multi-parameter observation buoys in the Indian Ocean equatorial region (80°E, 2.5°N, 3,980 m depth, Figure 1A), which provided the observations of sea surface wind fields for nearly a month from April 27 to May 25, 2019. Moreover, simultaneous observations of global high-resolution wind and wave fields were obtained by the CFOSAT from 2018. The CFOSAT carries two radar instruments, including a wind scatterometer (SCAT) developed by the National Space Science Center (NSSC) of the Chinese Academy of Sciences and a wave spectrometer (Surface Wave Investigation and Monitoring, SWIM) provided by CNES (Xu et al., 2019; Hauser et al., 2020; Liu et al., 2020). The ERA5, which had been proven reliable with a substantial improvement compared to the ERA-Interim (Belmonte Rivas and Stofelen, 2019; Bruno et al., 2020), was adopted to compare with the forecasting results from the EPMEF_NIO. ERA5 is provided at hourly intervals and in horizontal resolutions of 0.25° for atmospheric variables and 0.5° for ocean surface waves (Hersbach et al., 2020).
We used the mean absolute bias (MAB) and the root mean squared error (RMSE) to quantify model forecasting skills with respect to buoy, CFOSAT, and the best track data:
and
where N is the total number of observations, is the value of model output, and is the value of observations.
Design of Sensitivity Experiments
Two sensitivity experiments, denoted as NOSSDA_WRF and NOBC_WW3, were carried out to investigate the effect of the simplified SSDA scheme on the TC track/intensity forecast and the impact of swell propagating from the boundaries on the wave forecast of the EIO and WIO, respectively. For comparison, we took the forecasting results from EPMEF_NIO during the period of August 2019 to August 2020 as a benchmark, denoted as CTRL (see Table 1). NOSSDA_WRF has the same model configuration, initial and boundary conditions as the atmospheric model WRF of EPMEF_NIO except that the simplified SSDA scheme is not included. NOBC_WW3 has the same model configuration, forcing and initial conditions as the wave model WW3 of EPMEF_NIO except that the boundary information regarding the swell propagating from the southern Indian Ocean is excluded.
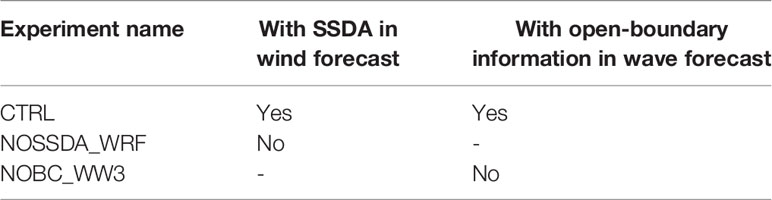
Table 1 The design of sensitivity experiments.
Validation of the Forecasts From the Updated EPMEF-NIO
Wind Forecast
We first validated the EPMEF_NIO sea surface wind forecast by comparing the output of the WRF inner domain model (WRF_D02) with the buoy observations from the CSL-CER. Figure 4 shows a comparison of 10 m wind speed between reanalysis/forecasts and observations for 0–24, 25–48, and 49–72 h, respectively. Compared with the RMSE of ERA5 (~1.75 m/s), the EPMEF_NIO has smaller RMSEs of wind speed with 1.44, 1.55, and 1.66 m/s for 0–24, 25–48, and 49–72 h forecast, respectively. In addition, the correlation coefficient between the EPMEF_NIO forecasts and observations is as high as 0.7, which is comparable to that between the ERA5 and observations. Therefore, the high-resolution weather forecast is reliable for the equatorial region.
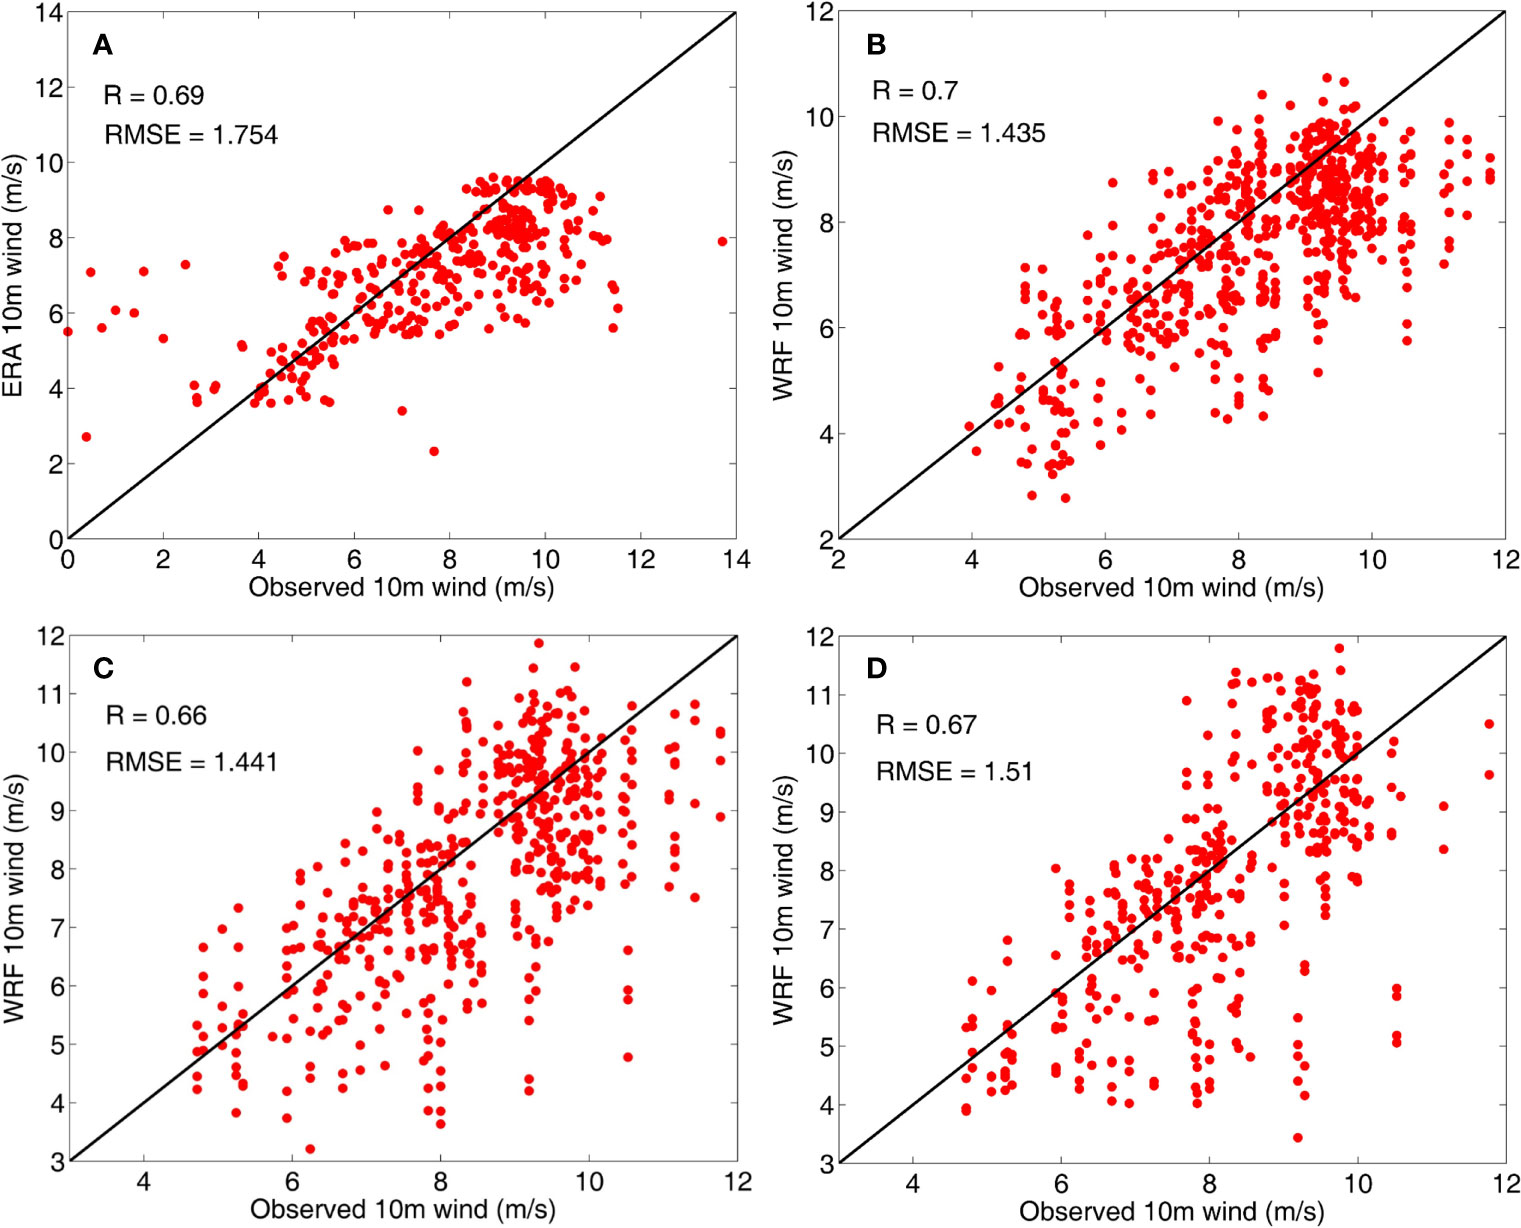
Figure 4 Scatter plot of 10 m wind from buoy observations (shown in Figure 1, unit: m s-1) and (A) reanalysis ERA5, (B) 0–24 h, (C) 25–48 h, and (D) 49–72 h forecasts of WRF-D02 in the EIO (see Figure 1A). R is the correlation coefficient, and RMSE is the root mean square error.
Since only 1-month buoy observations near the equator are available, the above validation results cannot fully represent the forecasting skills of the EPMEF_NIO in different seasons or different regions in the NIO. Therefore, we further compare the EPMEF_NIO forecasting results with the substantial CFOSAT wind data, which are available from August 2019 to August 2020 and has 662,754 observed points over the ocean. As shown in Figure 5, RMSEs for 0–24, 25–48, 49–72, 73–96, and 97–120 h in the EIO region are 1.69, 1.85, 1.91, 1.99, and 2.05 m/s, respectively, while the correlation coefficients are 0.8, 0.77, 0.75, 0.73, and 0.71, respectively. It can be also seen that the RMSEs do not increase significantly with the increase of the forecasting length. Specifically, the RMSE and correlation coefficient for 0–24 h forecast in the EIO are similar to those of the ERA5 reanalysis. For a 97–120 h forecast, RMSE is only slightly (approximately 0.5 m/s) higher than that of ERA5. Similar results are obtained for the forecasts in the WIO, with slightly larger RMSEs but a slightly higher correlation coefficient (Figure 6). These results indicate that the EPMEF_NIO has a good skill for a wind forecast.
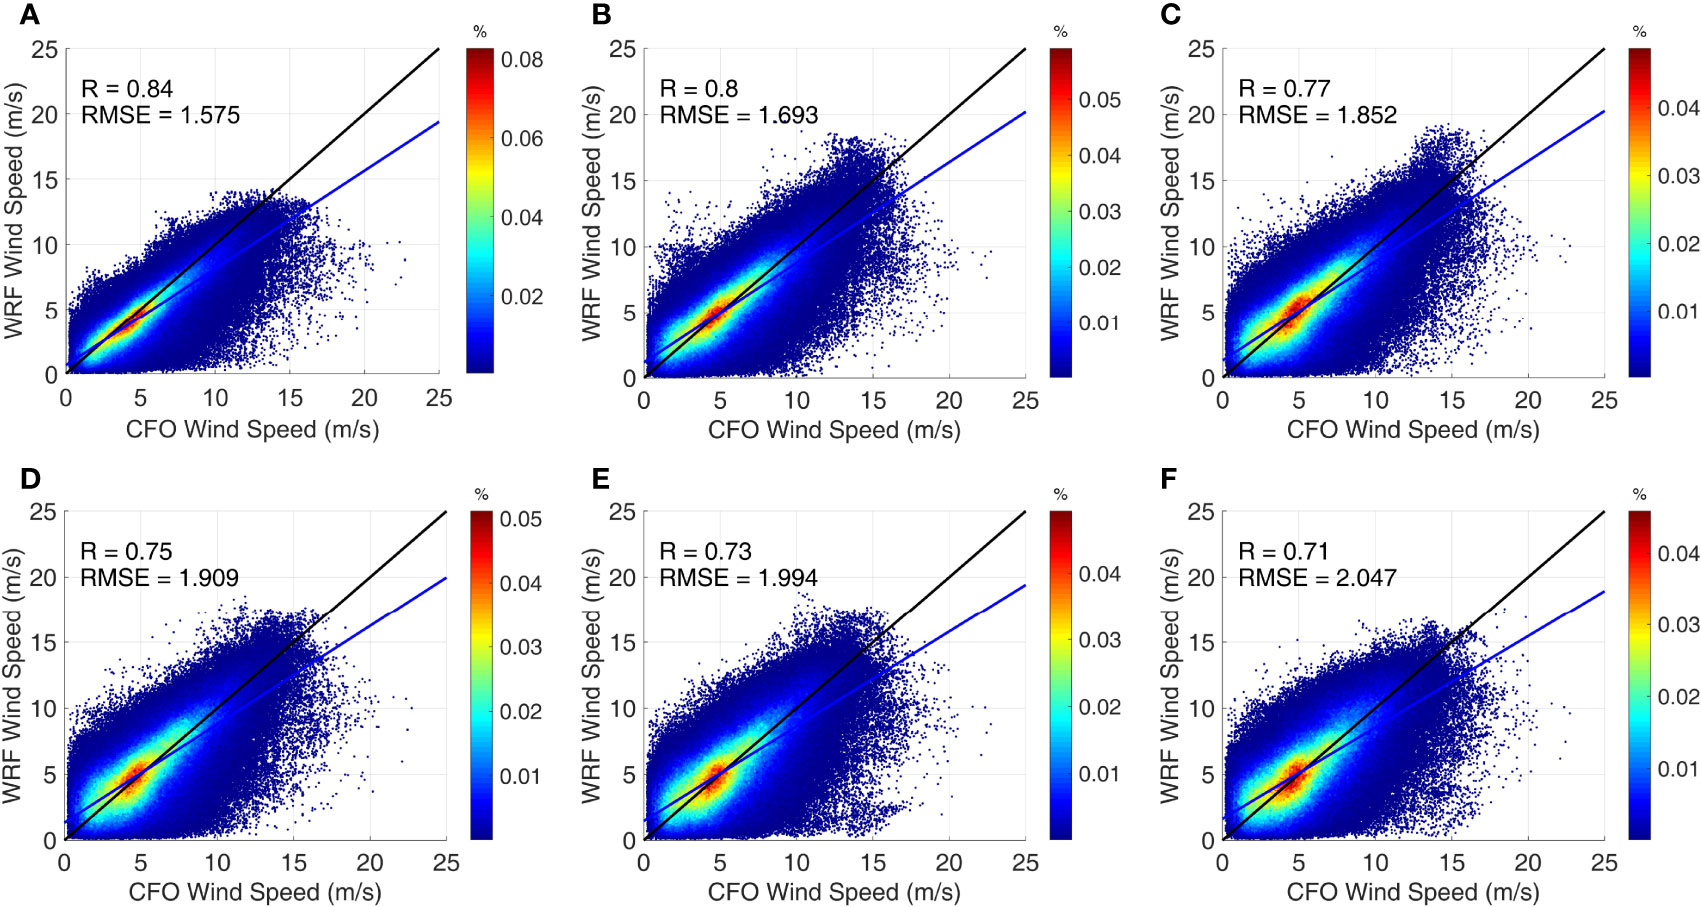
Figure 5 Scatter plot of 10 m wind from observations of CFOSAT (unit: m s-1) and (A) reanalysis of ERA5, (B) 0–24 h, (C) 25–48 h, (D) 49–72 h, (E) 73–96 h, and (F) 97–120 h forecasts of WRF-D01 in the EIO (see Figure 1A). R is the correlation coefficient, and RMSE is the root mean square error.
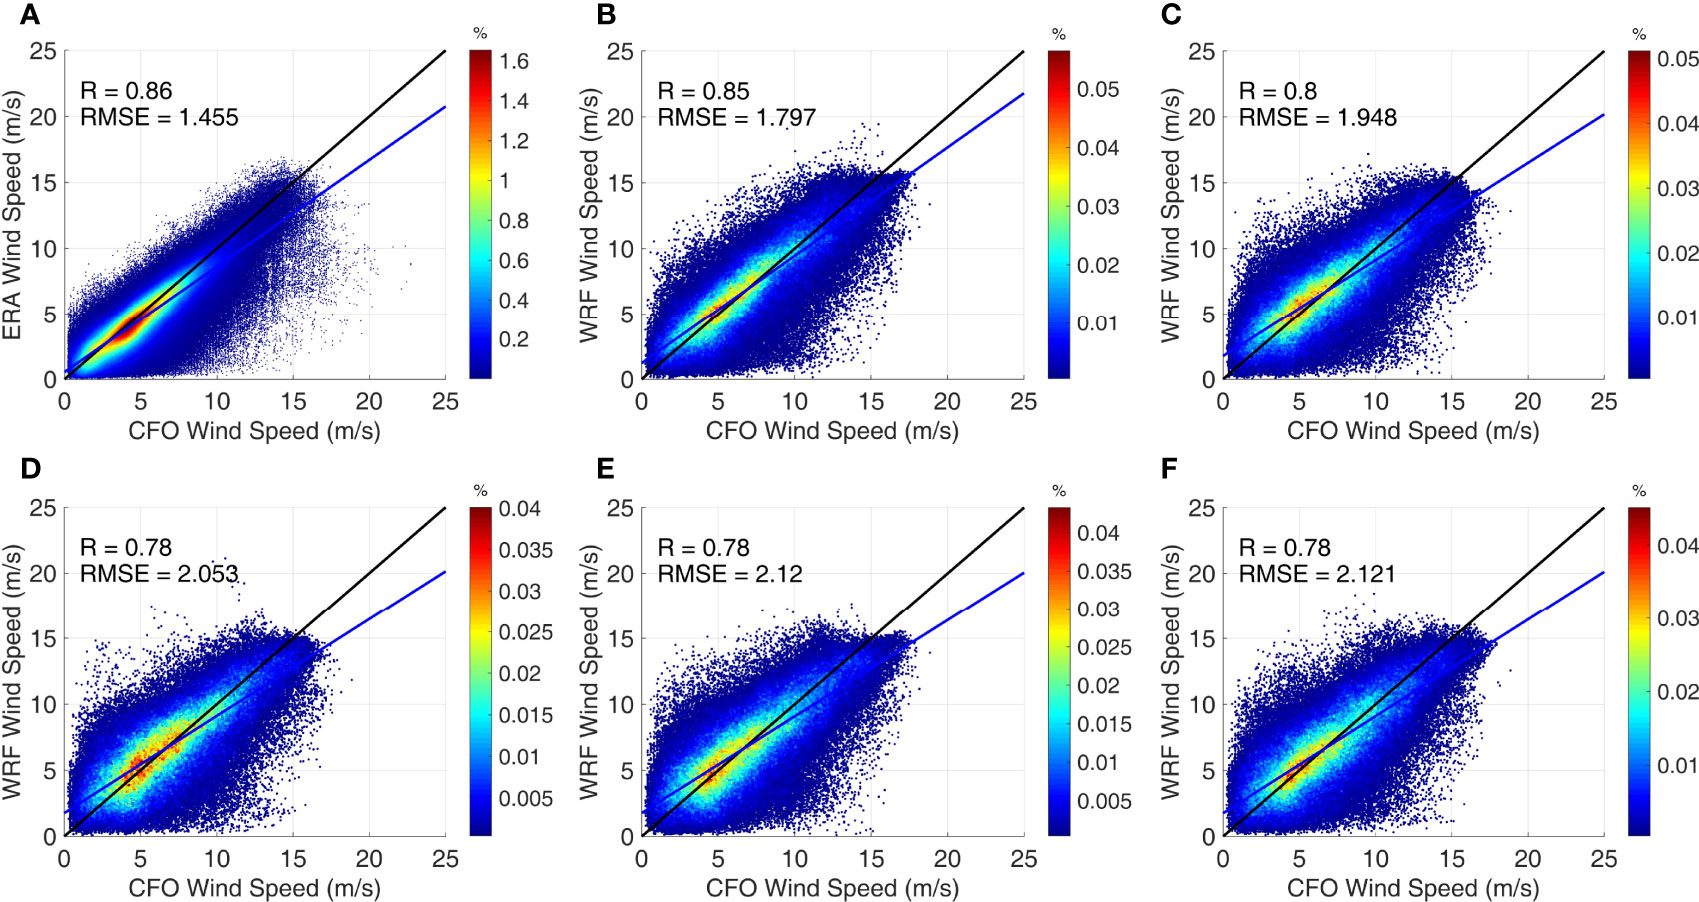
Figure 6 Scatter plot of 10 m wind from observations of CFOSAT (unit: m s-1) and (A) reanalysis of ERA5, (B) 0–24 h, (C) 25–48 h, (D) 49–72 h, (E) 73–96 h, and (F) 97–120 h forecasts of WRF-D01 in the WIO (see Figure 1B). R is the correlation coefficient, and RMSE is the root mean square error.
Tropical Cyclone Track and Intensity Forecast
There are a certain number of TCs in the EIO every year, posing a danger to the lives and property in the surrounding countries. We therefore validated the track forecast of 8 TCs (named as DAYE, TITLI, GAJA, PHETHAI, FANI, MATMO, AMPHAM, and NIVAR) in the EIO during 2018–2020. The track errors shown in Table 2 for the 25–48, 49–72, 73–96, and 97–120 h forecasts are 107.2, 141.9, 242.1, and 320.2 km, respectively. These track errors are significantly smaller than those of NCEP-GFS. The mean track errors for 0–24 and 25–48 h forecasts (83.1 and 107.2 km, respectively) are also smaller than those (95 and 140 km, respectively) of the Consortium for Small-scale Modelling (COSMO) proposed by Paul and Subrahamanyam (2021). In addition, the TC intensity forecasting skills in terms of the RMSE (or MAB) of the minimum sea-level pressure (MSLP) and maximum wind speed (MWS) for CTRL are much better than those for the NCEP-GFS, as shown in Table 2. Therefore, the EPMEF_NIO has a good skill for the TC track forecast in the NIO. This could be attributed to the following two factors: 1) the higher resolution than that of GFS is used and 2) a simplified SSDA scheme for adjusting the large-scale steering flow is implemented in the region model.
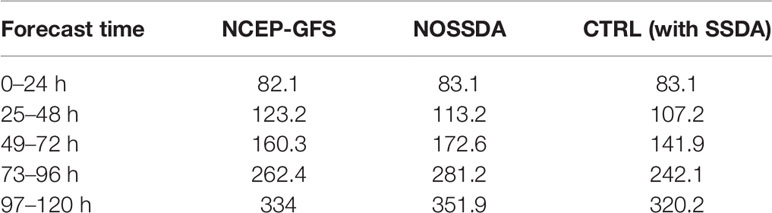
Table 2 The mean TC forecast track errors (unit: km) for the 8 tropical cyclones in the North Indian Ocean (NIO) during 2018–2020.
Significant Wave Height Forecast
Substantial observations from the CFOSAT with 42,587 points were used to validate the forecast of the SWH. The validation results for the EIO and WIO are shown in Figure 7. In the region of EIO (WIO), the RMSEs of forecasted SWH are between 0.33 and 0.41 m (0.27 and 0.37). In particular, the RMSEs of 24 h SWH forecast are comparable to (or even smaller than) that of ERA5 for the region of EIO (WIO). Moreover, the correlation coefficients of SWH between the forecast and observations are between 0.87 and 0.9 (0.94 and 0.97) for the region of EIO (WIO), which is only slightly smaller than that of the reanalysis. It should be noted that the reanalysis has a tendency to underestimate the SWHs at a higher wave condition (SWHs > 2 m), while the forecasted SWHs with a large value are comparable to the observations for both regions of the EIO and WIO. In addition, using the observed data from several in situ buoys, previous studies have shown that the RMSE of simulated or forecasted SWHs in the BOB region is approximately 0.3 m (Sabique et al., 2012; Sirisha et al., 2017). The intercomparison of operational wave forecasting systems against in situ observations in the NIO further shows the RMSEs of SWH are between 0.25 and 0.55 for the 0–5 days forecast (report shown in https://confluence.ecmwf.int/download/attachments/116958920/LCWFV_swh_report_12_autumn2020.pdf?version=1&modificationDate=1608106182061&api=v2). Therefore, the wave forecasting results of EMPEF_NIO are reliable.
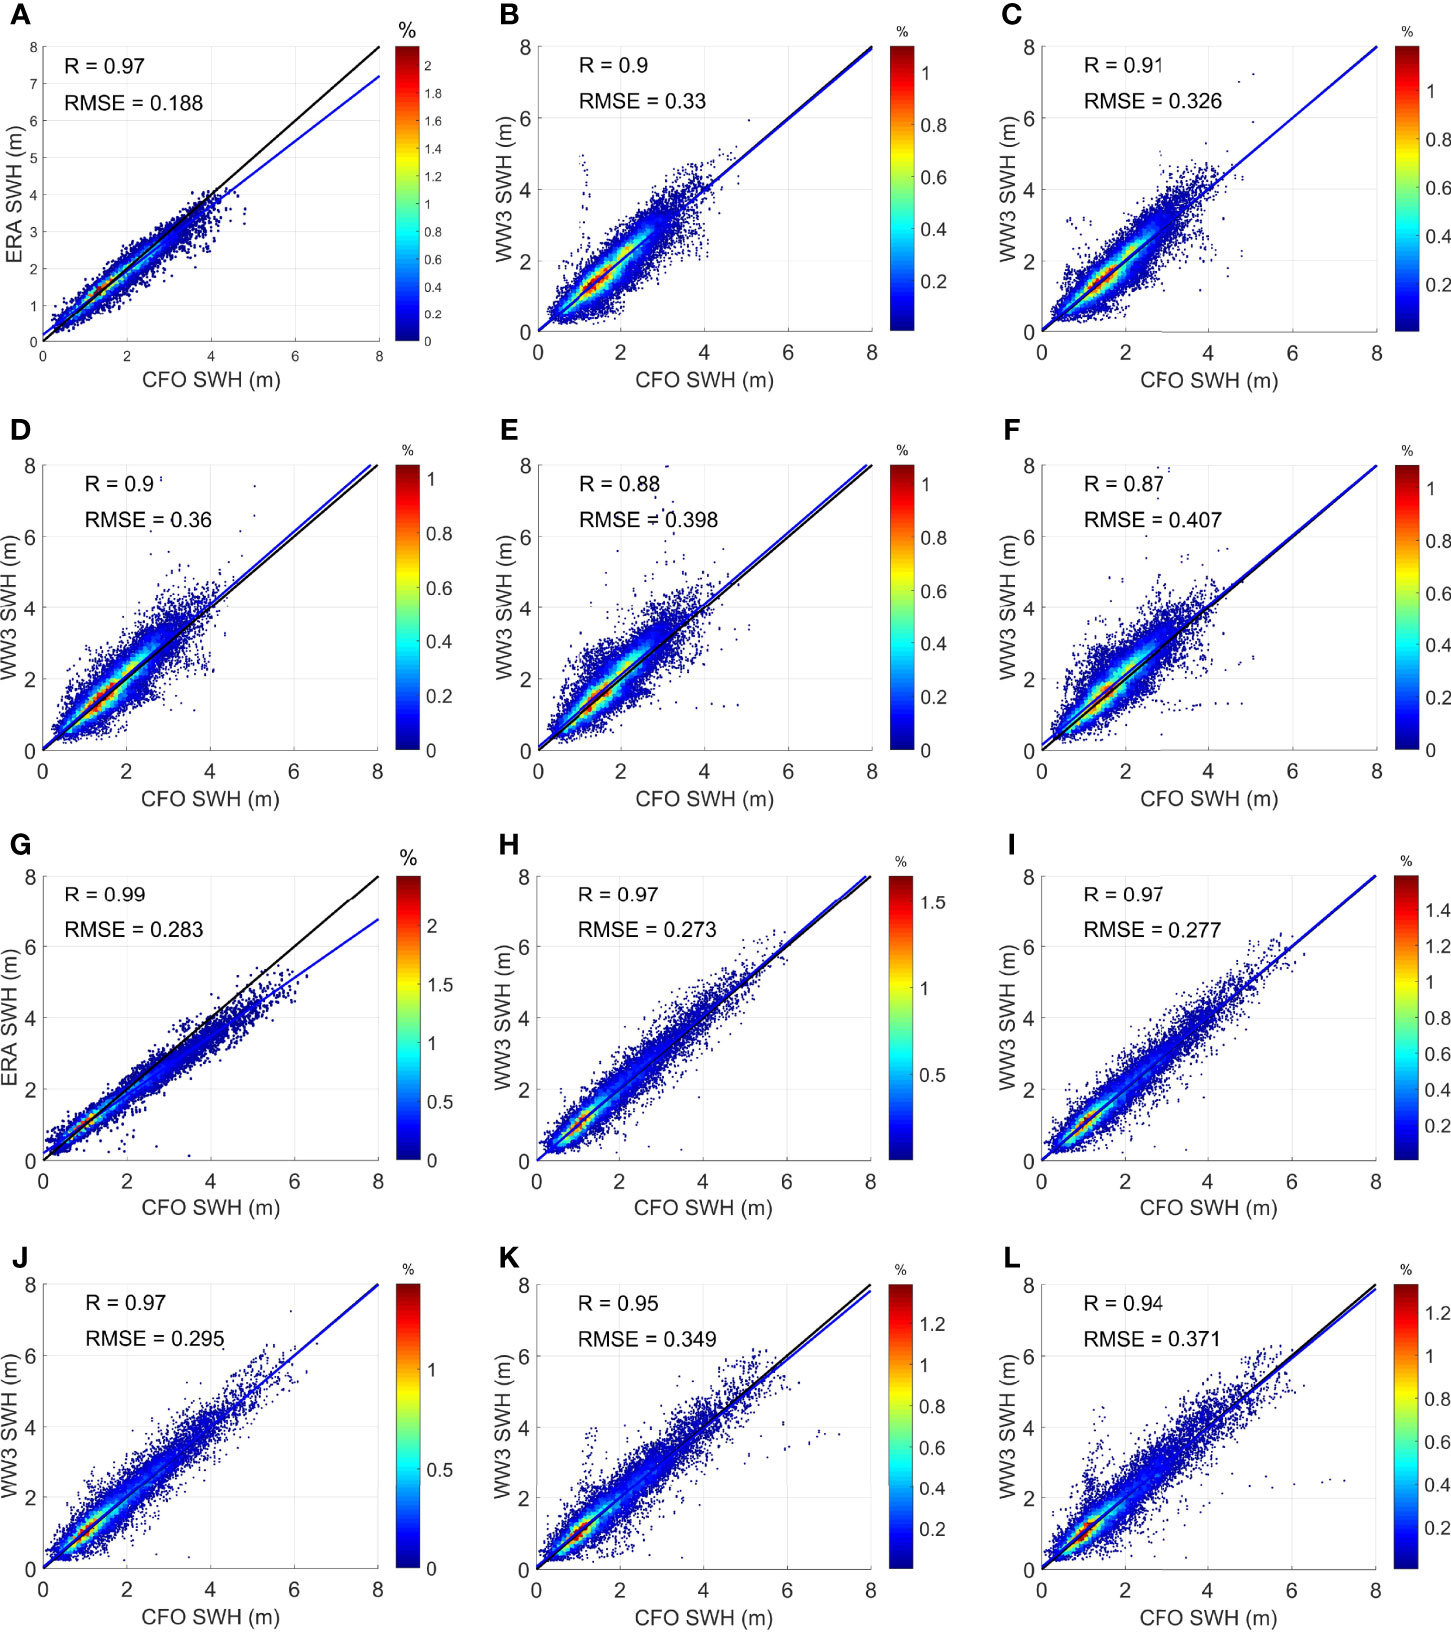
Figure 7 Scatter plot of significant wave height (SWH) from observations of CFOSAT (unit: m) and (A, G) reanalysis of ERA5, (B, H) 0–24 h, (C, I) 25–48 h, (D, J) 49–72 h, (E, K) 73–96 h, and (F, L) 97–120 h forecasts of (A–F) WW3-D02_2 in the EIO and (G–L) WW3-D02_1 in the WIO (see Figure 2). R is the correlation coefficient, and RMSE is the root mean square error.
Storm Surge Forecast
We have validated the water-level simulation of the old version of the system in 2018 (Li et al., 2018). For the validation of new version, we focused on the storm surge forecast in the EIO. We used the hourly water-level observations of the tide-gauge station Chittagong in the northern BOB to validate the tide and storm surge forecast. The hourly observation data are obtained from the University of Hawaii Sea Level Center (UHSLC, http://uhslc.soest.hawaii.edu). As shown in Figure 8, the forecasted water-level has a high correlation with the observations with a correlation coefficient of 0.993. The RMSEs of the water-level during the period of TCs FANI (2019) and AMPHAM (2020) are 0.168 and 0.165 m, respectively, which accounts for approximately 8.7% of the relative errors. In addition, the forecasted storm surge of FANI and AMPHAM can reproduce the surge peaks and variations of the two storms. Therefore, the system can provide a reliable storm surge forecast in the NIO.
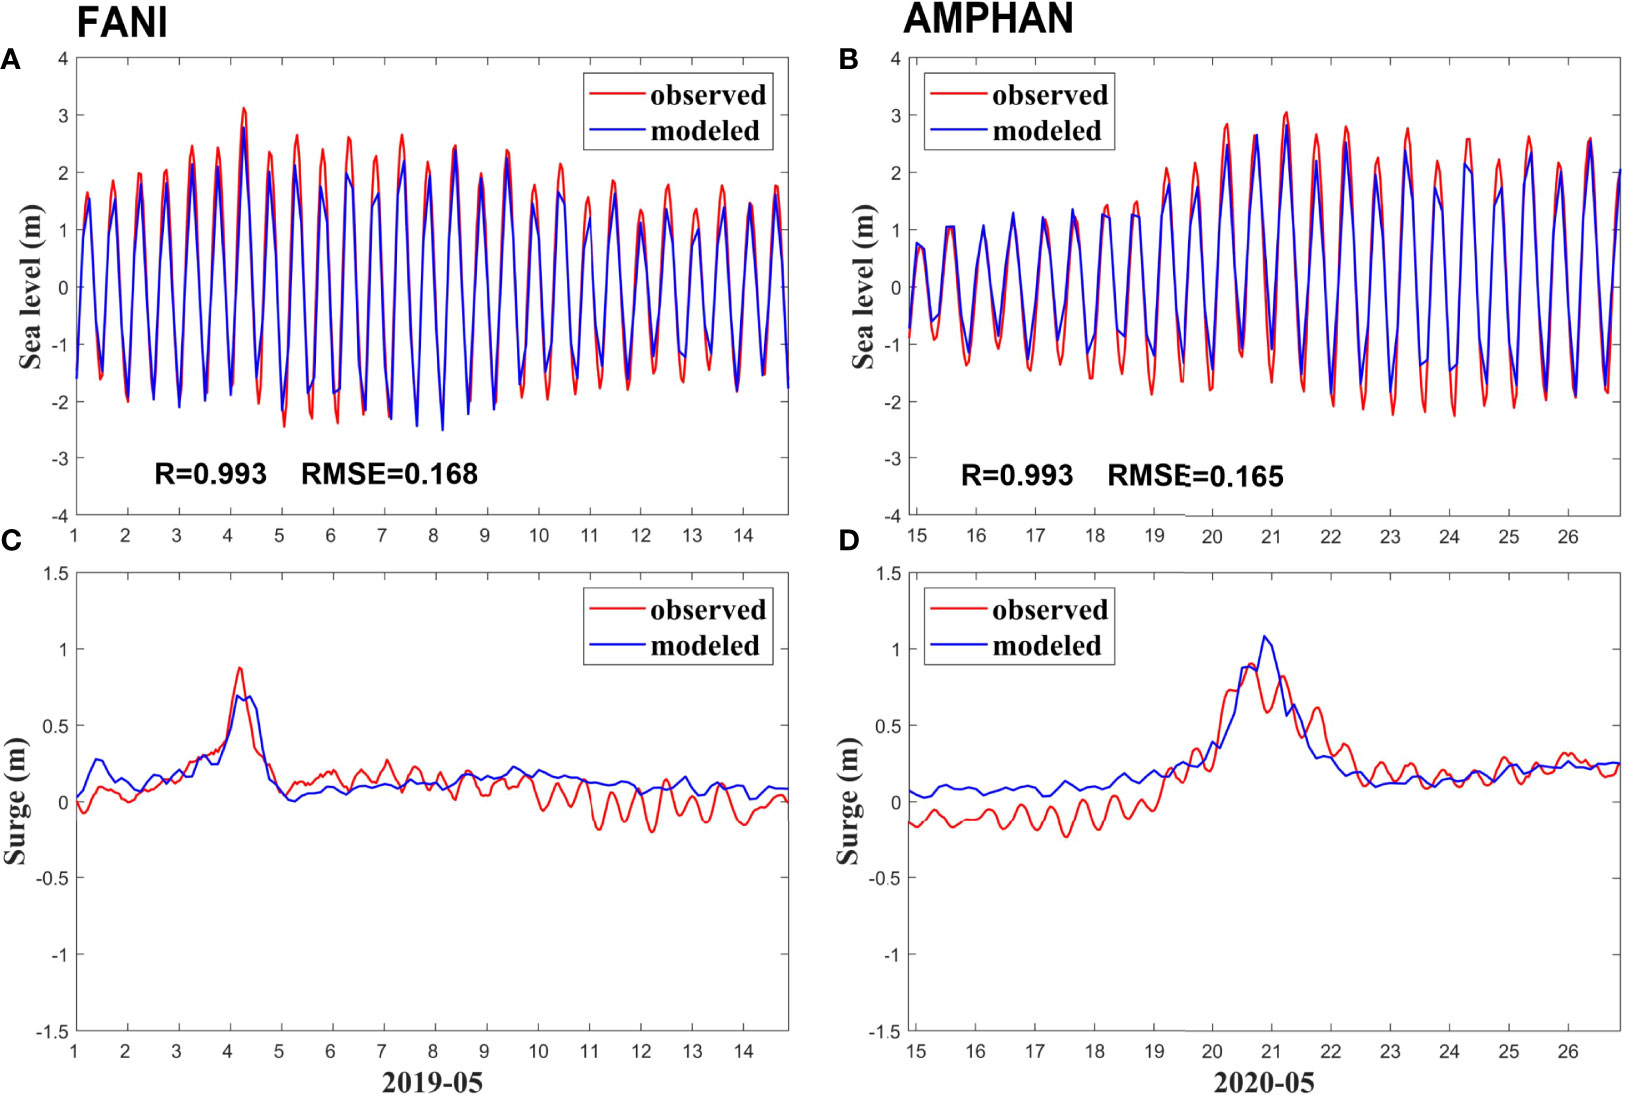
Figure 8 The time series of observed and modeled water level and storm surge at the Chittagong station (shown in Figure 1A) during the period of tropical cyclones FANI (2019) and AMPHAN (2020).
Results of Sensitivity Experiments
Improvement of Tropical Cyclone Track and Intensity Forecast by the Simplified Scale-Selective Data Assimilation Scheme
Tables 2, 3 show the error statistics for TC track and intensity forecast. As shown from Table 2, the errors of TC track forecasts for all forecasting periods are reduced with the inclusion of simplified SSDA. For the 72 h forecasts, the error reduction reaches 20%. It should be noted that the SSDA scheme is implemented every 24 h in the forecasting system, therefore, the 24 h forecasting results for NOSSDA and SSDA are exactly the same. Figure 9 further shows the track forecasts for the sensitivity experiments. It can be seen that the forecasted tracks by NOSSDA_WRF obviously deviate from the best tracks, and when the simplified SSDA is included in the model, the forecasted tracks are much closer to the best tracks. Such improvements in the TC track forecast are attributed to a better representation of large-scale steering flow in the regional model when the SSDA is included (Peng et al., 2010; Lai et al., 2014). Figure 10 shows the MSLP and MWS of the TCs during 2018–2020. In most cases, the NCEP-GFS underestimates the MSLP and MWS of the TCs due to the relatively coarse resolution of 1°×1°. For the weaker TCs (i.e., DAYEI and NIVAR), the NOSSDA_WRF with higher resolution overestimates the MSLP and MWS, and such overestimation is reduced when the simplified SSDA is included (CTRL). For strong or super TCs (i.e., TITLI, FANI, MATMO, and AMPHAN), the NOSSDA_WRF underestimates the MSLP and MWS, and similar results are obtained when the simplified SSDA is included (CTRL). As shown in Table 3, the TC intensity forecasting skills in terms of RMSE (or MAB) of MSLP and MWS for CTRL are comparable to (or even slightly better than) those for NOSSDA_WRF. Therefore, the simplified SSDA scheme can effectively improve the TC track forecast in the NIO region while maintaining the advantages of TC intensity forecast in the high-resolution regional model.
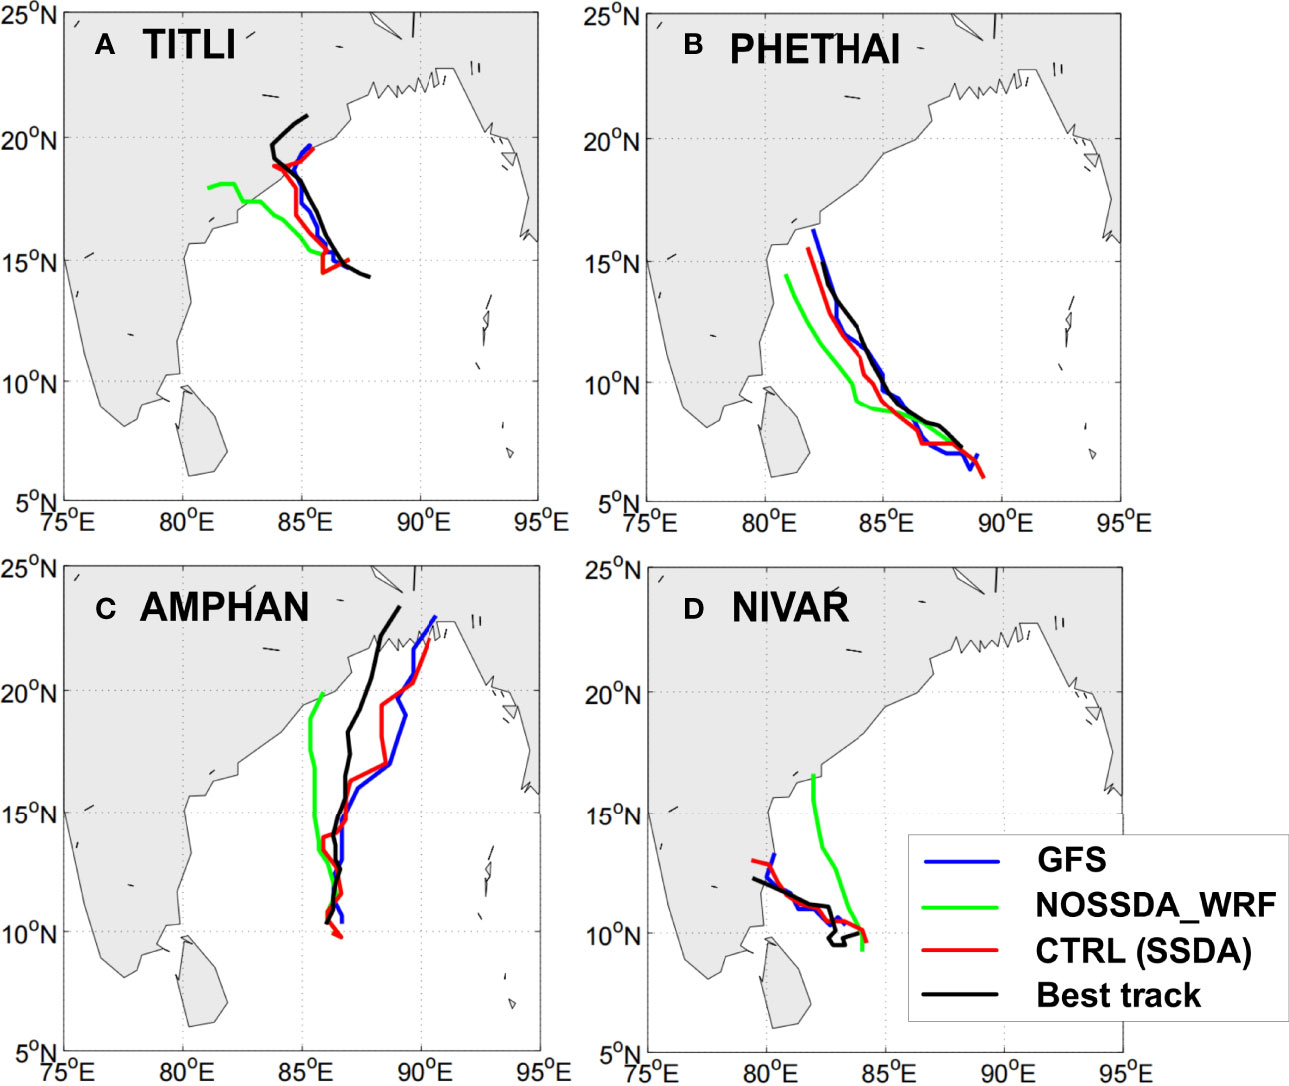
Figure 9 The TC tracks forecasted by GFS, NOSSDA_WRF, and CTRL (with SSDA), as well as the IBTrACS best track for (A) TITLI, (B) PHETHAI, (C) AMPHAN, and (D) NIVAR.
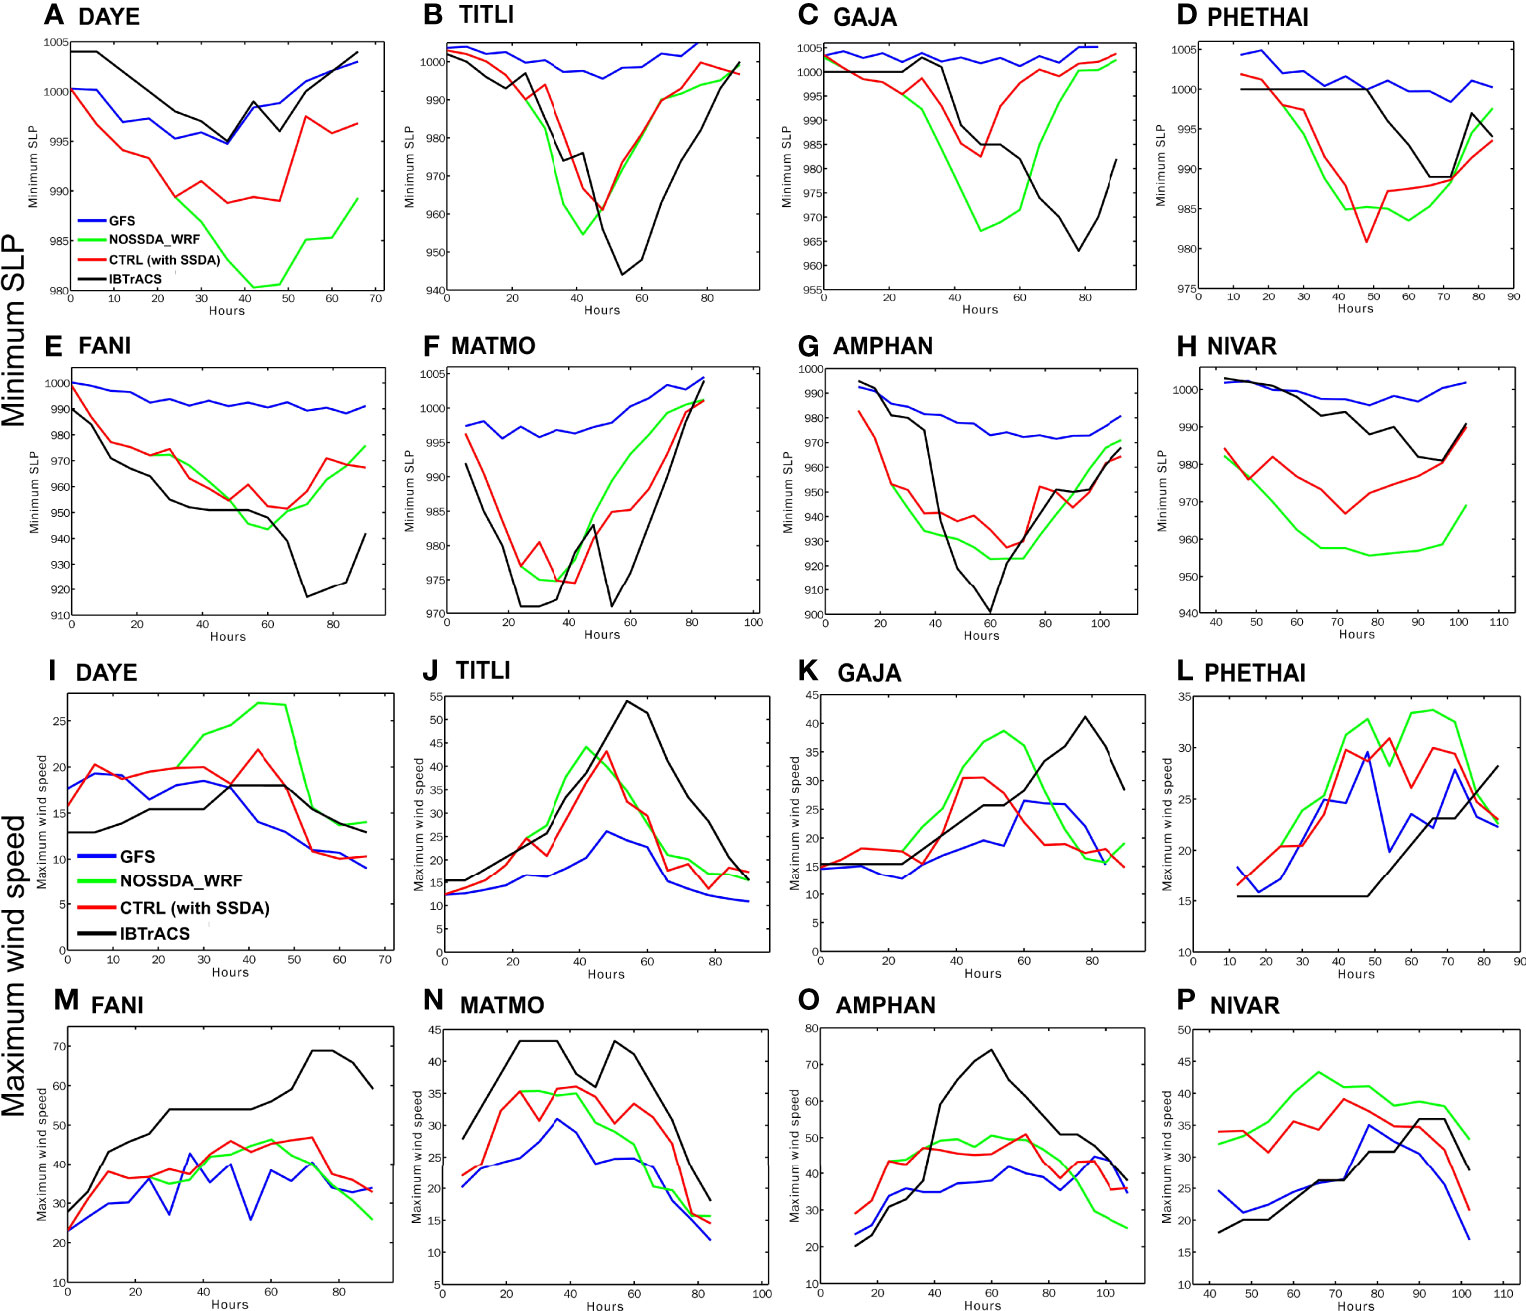
Figure 10 The minimum sea-level pressure (SLP, unit: hPa; panels A–H) and maximum wind speed (MWS, unit: knots; panels i-p) forecasted by GFS, NOSSDA_WRF, and CTRL (with SSDA), and obtained from IBTrACS Best track data for (A, I) DAYE, (B, J) TITLI, (C, K) GAJA, (D, L) PHETHAI, (E, M) FANI, (F, N) MATMO, (G, O) AMPHAN, and (H, P) NIVAR during 2018–2020.
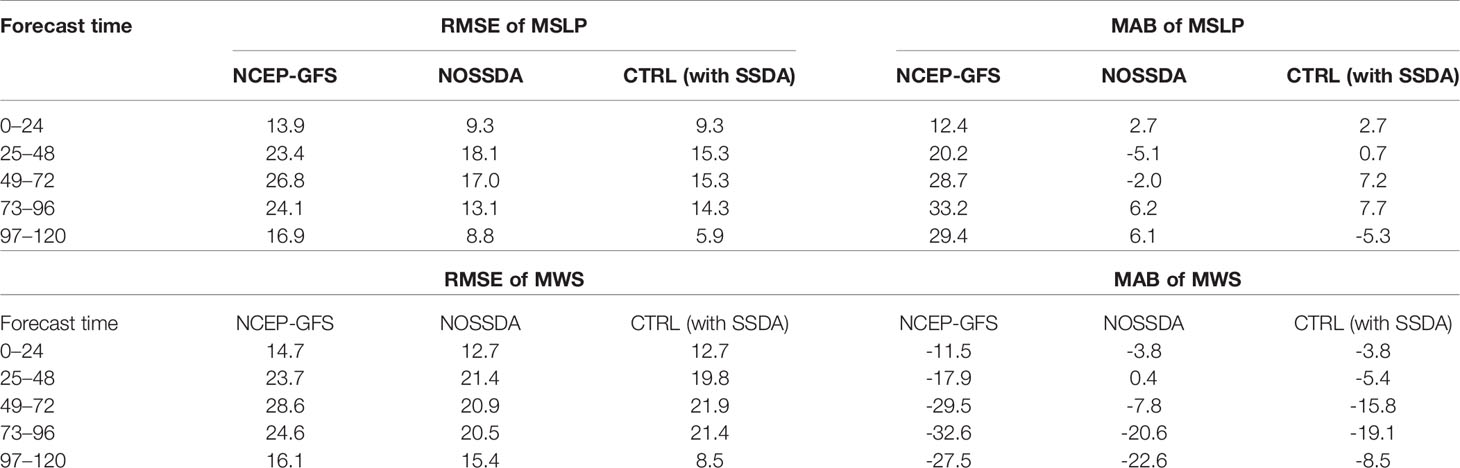
Table 3 The RMSE and MAB of the minimum sea-level pressure (MSLP, unit: hPa) and maximum wind speed (MWS, unit: knots) for the 8 tropical cyclones in the NIO during 2018–2020.
Impact of Swell From the Southern Indian Ocean on the Significant Wave Height Forecast in the Eastern Indian Ocean and Western Indian Ocean
Figure 11 shows the comparison between NOBC_WW3 and the CFOSAT observations. By comparing Figures 11A–C with Figures 7B, D, F, we can see that the model significantly underestimates the SWH in the EIO when the swell from the boundary is not included, with the RMSE of the SWH forecast increasing by 0.4 m or 100% and the correlation coefficient dropping from nearly 0.9 to approximately 0.65. The mean SWHs in the EIO in January, April, July, and October are shown in Figure 12. It can be seen that the SWH in the EIO significantly decreases when the swell information is excluded (NOBC_WW3) in the boundary throughout the year. In particular, in April when it is during the transition of monsoon, local wind-induced waves are weak and the swell propagating from the boundary dominates the wave height in most regions of the EIO. As a result, the SWH from NOBC_WW3 drops more than 70% in most regions of the EIO in April. In the WIO, the impact of swell propagating from the boundary on the SWH forecast is not as significant as that in the EIO. As shown in Figures 11D–F, 7H, J, L, only a slight increase (less than 0.08 m or 10%) of RMSE and nearly the same correlation coefficient are found when the swell information from the boundary is excluded, as compared to those of CTRL. Similar to that in the EIO, the impact of swell from boundaries on the SWH forecast in the WIO seasonally varies (Figure 12). The largest impact occurs in April due to the dominating role of the swell propagating from the boundary during the transition of monsoon (Figures 12J, N), while a very minor impact is found in January and July (Figures 12I, K, M, O). These results are consistent with those from Sabique et al. (2012) that the swells represent a significant portion of wave heights in the NIO and have more influence on the BOB than on the AS. However, since the interaction between the swells and wind waves is considered in the equatorial Indian Ocean and NIO in our study, the impact of the swell propagated from the southern Indian Ocean on the wave height is not as significant as that shown in Sabique et al. (2012), especially in the WIO region. It implies that the interaction between the swells and wind waves could suppress the influence of swell from the southern Indian Ocean. The above results indicate that, although the extent to which the impact of the swell propagating from the boundary on the SWH forecast is quite different in the EIO and the WIO, it is necessary to have a global or large-domain regional model to provide the boundary information of swell propagating from the southern Indian Ocean for an accurate SWH forecast in the NIO.
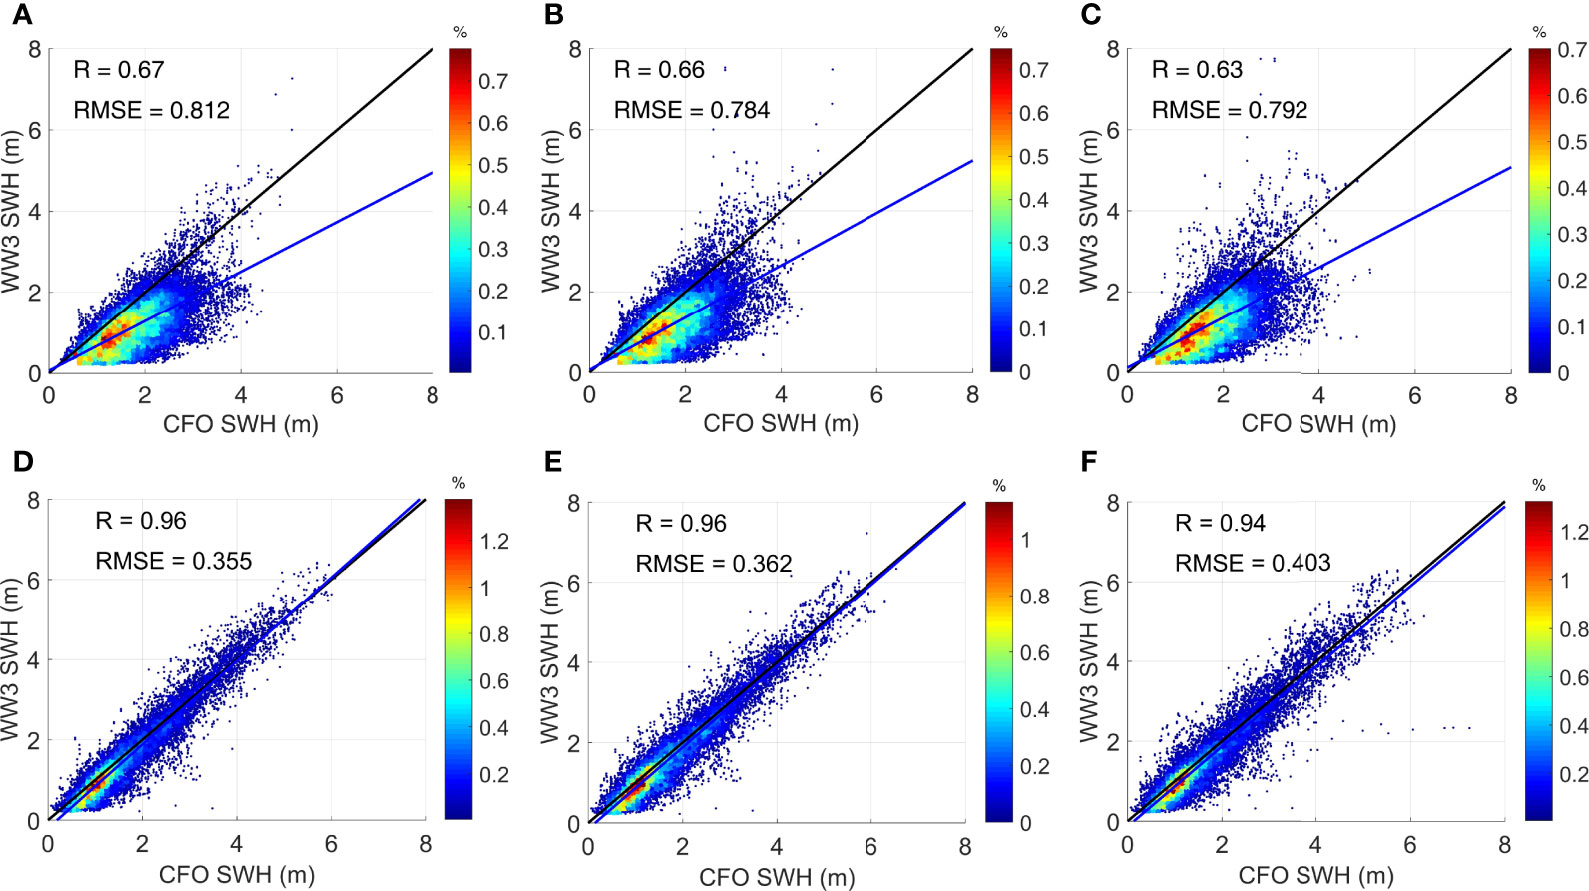
Figure 11 Scatter plot of significant wave height (SWH) from observations from CFOSAT (unit: m) and (A, D) 0–24 h, (B, E) 49–72 h, and (C, F) 97–120 h forecasts without swell propagating from boundary (NOBC_WW3) for the (A–C) EIO and (D–F) WIO. R is the correlation coefficient, and RMSE is the root mean square error.
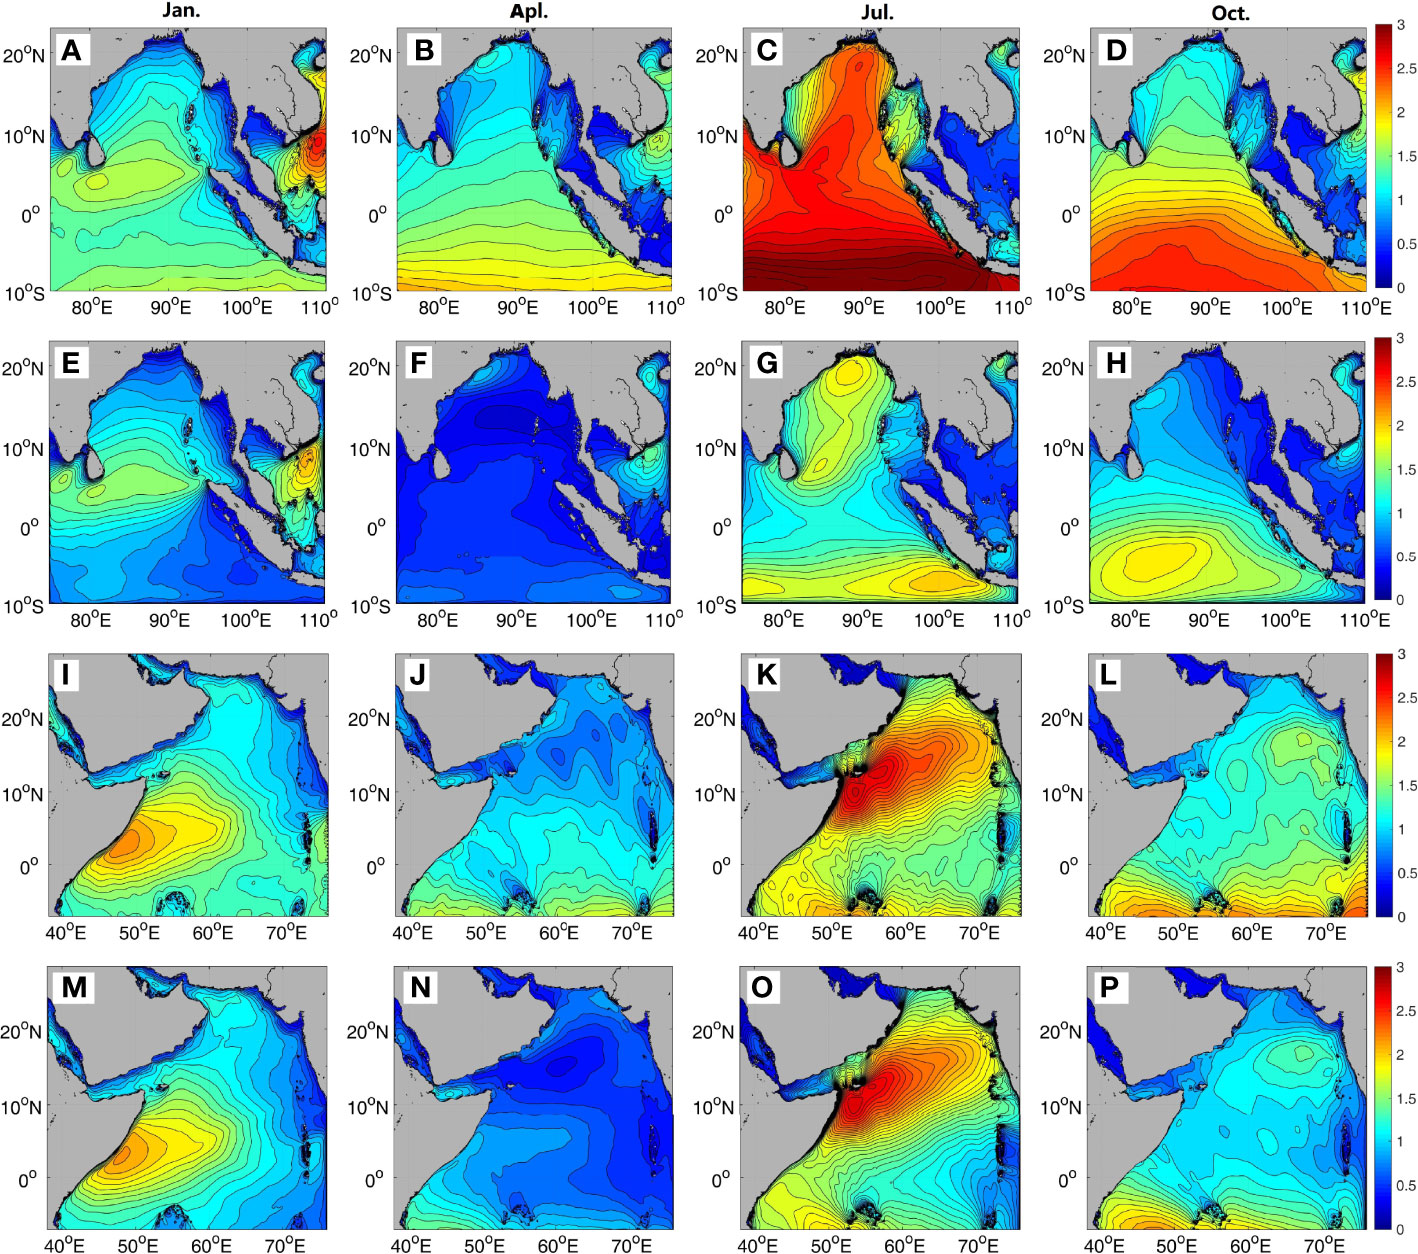
Figure 12 The mean significant wave height (SWH, unit: m) of the (A–H) EIO and (I–P) WIO in (A, E, I, M) January, (B, F, J, N) April, (C, G, K, O) July, and (D, H, L, P) October from (A–D, I–L) CTRL and (E–H, M–P) NOBC_WW3.
Conclusion
An updated real-time forecasting system for marine environments in the North Indian Ocean (called EPMEF-NIO) as well as its performance has been introduced in this study. The main changes of the updated system include the following: 1) the WIO is added to the regions for weather, surge and wave forecasts, and the horizontal resolution of the outer/inner domain for weather forecast is increased from 24 km/8 km to 18 km/6 km; 2) a three-domain-nested wave forecast is added to the system with spatial resolutions of 1/3°, 1/12°, and 1/36° for the Indo-Pacific region, the eastern and WIO regions, and the Sri Lanka and northern AS regions, respectively; 3) the length of forecast time is increased from 72 to 120 h. Since the spring of 2018, the system has been stably operating 4 times a day. A validation of the forecasting results against the observations indicates that
1. With higher model resolution than the ERA5 reanalysis, the updated EPMEF-NIO can produce a more accurate wind forecast than the ERA5 reanalysis in the equatorial region. Further validation against the substantial satellite wind data from the CFOSAT (with 662,754 observed points) shows that both the RMSE and correlation coefficient for 0–24 h wind forecast are comparable to those of the ERA5 reanalysis, and the RMSE for the 120 h wind forecast increases less than 20% in both the EIO and the WIO.
2. The simplified SSDA scheme adopted in the updated EPMEF-NIO can effectively improve the TC track forecasting skill in the NIO by adjusting the large-scale wind field of the high-resolution regional model to that of the low-resolution NCEP-GFS, while maintaining the small-scale features in the high-resolution regional model that are important for TC intensity forecast.
3. A validation against the substantial wave observations from the CFOSAT (with 42,587 observed points) shows that the 0–24 h SWH forecast is comparable to the ERA5 reanalysis, and the correlation coefficient for the 120 h forecast is as high as over 0.87 in both EIO and WIO. Results of sensitivity experiments further show that the swell propagating from the southern Indian Ocean has significant impact on the wave forecast in the EIO throughout the year, while it mainly affects the wave forecast in WIO in the seasons of monsoon transition.
The EPMEF_NIO can not only provide valuable reference for the relevant marine and meteorological forecasting agencies in countries around the NIO but also provide some practical clues for the improvement of the TC forecasting skill in the region. On the other hand, the EPMEF_NIO is still developing and improving. In the future, a regional air–sea coupling system will replace the current one-way coupling version. Moreover, a data assimilation system for temperature and salinity will be included in the EPMEF_NIO.
Data Availability Statement
The raw data supporting the conclusions of this article will be made available by the authors, without undue reservation.
Author Contributions
YL and SP designed the configuration of forecast system and the experiments. YL performed the experiments. YL, SL, and YZ did the analysis. YL wrote the manuscript and SP revised the manuscript. FZ and ST provided the observation data for model validation. All authors contributed to the article and approved the submitted version.
Funding
This work was jointly supported by the Strategic Priority Research Program of the Chinese Academy of Sciences (Grant No. XDA19060503 and XDA15020901), the Major Projects of the National Natural Science Foundation of China (Grant Nos. 41890851, U21A6001, 41931182, U20A20105), Key Special Project for Introduced Talents Team of Southern Marine Science and Engineering Guangdong Laboratory (Guangzhou, Grant No. GML2019ZD0303 and 2019BT02H594), the National Science Foundation of China (Grants No. 41776028), the Chinese Academy of Sciences (Grant No. ZDRW-XH-2019-2 and 133244KYSB20180029), and Guangxi Key Research Program (Grant No. AB18294047).
Conflict of Interest
The authors declare that the research was conducted in the absence of any commercial or financial relationships that could be construed as a potential conflict of interest.
Publisher’s Note
All claims expressed in this article are solely those of the authors and do not necessarily represent those of their affiliated organizations, or those of the publisher, the editors and the reviewers. Any product that may be evaluated in this article, or claim that may be made by its manufacturer, is not guaranteed or endorsed by the publisher.
Acknowledgments
We are grateful for access to the following freely available data: best track data available at https://www.ncei.noaa.gov/access/metadata/landing-page/bin/iso?id=gov.noaa.ncdc:C01552; ERA5 data of ECMWF available at https://cds.climate.copernicus.eu/cdsapp#!/dataset/reanalysis-era5-single-levels?tab=form.
References
Alam M., Hossain A., Shafee S. (2003). Frequency of Bay of Bengal Cyclonic Storms and Depressions Crossing Different Coastal Zones. Int. J. Climatol. 23, 1119–1125. doi: 10.1002/joc.927
Belmonte Rivas M., Stofelen A. (2019). Characterizing ERA-Interim and ERA5 Surface Wind Biases Using ASCAT. Ocean. Sci. 15, 831–852. doi: 10.5194/os-15-831-2019
Blumberg A. F., Mellor G. L. (1987). “A Description of a Threedimensional Coastal Ocean Circulation Model. Three-Dimensional Coastal Ocean Models,” in Coastal and Estuarine Studies Series, vol. 4 . Ed. Heaps N. (Washington, DC: Amer. Geophys. Union), 1–16.
Bruno M. F., Molfetta M. G., Totaro V., Mossa M. (2020). Performance Assessment of ERA5 Wave Data in a Swell Dominated Region. J. Mar. Sci. Eng. 8, 214–232. doi: 10.3390/jmse8030214
Chaudhuri S., De Sarkar A. (2008). Monthly Frequency Distribution of Severe Tropical Cyclones—A Statistical Approach. Asian J. Water Environ. Pollut. 5 (1), 1–6.
Dube S. K., Rao A. D., Sinha P. C., Murty T. S., Bahulayan N. (1997). Storm Surge in the Bay of Bengal and Arabian Sea: The Problem and its Prediction. Mausam 48, 283–304. doi: 10.54302/mausam.v48i2.4012
Dudhia J. (1989). Numerical Study of Convection Observed During the Winter Monsoon Experiment Using a Mesoscale Two-Dimensional Model. J. Atmos. Sci. 46, 3077–3107. doi: 10.1175/1520-0469(1989)046<3077:NSOCOD>2.0.CO;2
Egbert G. D., Erofeeva S. Y. (2002). Efficient Inverse Modeling of Barotropic Ocean Tides. J. Atmos. Ocean. Technol. 19 (2), 183–204. doi: 10.1175/1520-0426(2002)0192.0.CO;2
Elsner J. B., Kossin J. P., Jagger T. H. (2008). The Increasing Intensity of the Strongest Tropical Cyclones. Nature 455, 92–98. doi: 10.1038/nature07234
Emanuel K. (2003). Tropical Cyclones. Earth Planet. Sci. 31, 75–104. doi: 10.1146/annurev.earth.31.100901.141259
Ferrier B. S., Lin Y., Black T., Rogers E., DiMego G. (2002). “Implementation of a New Grid-Scale Cloud and Precipitation Scheme in the NCEP Eta Model,” in Preprints, 15th Conf. On Numerical Weather Prediction (San Antonio, TX: Amer. Meteor. Soc.), 280–283.
Frank W. M., Ritchie E. A. (1999). Effects of Environmental Flow Upon Tropical Cyclone Structure. Mon. Wea. Rev. 127, 2044–2061. doi: 10.1175/1520-0493(1999)127<2044:EOEFUT>2.0.CO;2
Hauser D., Tourain C., Hermozo L., Alraddawi D., Aouf L., Chapron B., et al. (2020). New Observations From the SWIM Radar On-Board CFOSAT: Instrument Validation and Ocean Wave Measurement Assessment. IEEE Trans. Geosci. Remote Sens. PP (99), 1–22. doi: 10.1109/TGRS.2020.2994372.
Hersbach H., Bell B., Berrisford P., Hirahara S., Horányi A., Muñoz-Sabater J., et al. (2020). The ERA5 Global Reanalysis. Q. J. R. Meteorol. Soc. 146, 1999–2049. doi: 10.1002/qj.3803
Hong S.-Y., Noh Y., Dudhia J. (2006). A New Vertical Diffusion Package With an Explicit Treatment of Entrainment Processes. Mon. Wea. Rev. 134, 2318–2341. doi: 10.1175/MWR3199.1
Kain J. S., Fritsch J. M. (1990). A One-Dimensional Entraining/Detraining Plume Model and its Application in Convective Parameterization. J. Atmos. Sci. 47, 2784–2802. doi: 10.1175/1520-0469(1990)047<2784:AODEPM>2.0.CO;2
Kain J. S., Fritsch J. M. (1993). “Convective Parameterization for Mesoscale Models: The Kain-Fritsch Scheme. The Representation of Cumulus Convection in Numerical Models”, in Meteorological Monograph. vol. 46. Eds. Emanuel K. A., Raymond D. J., Boston, MA: American Meteorological Society. 165–170.
Komen G. J., Cavaleri L., Donelan M., Hasselmann K., Hasselmann S., Janssen P. A. E. M. (1994). Dynamics and Modelling of Ocean Waves (Cambridge: Cambridge University Press), 532.
Lai Z., Hao S., Peng S., Liu B., Gu X., Qian Y. (2014). On Improving Tropical Cyclone Track Forecasts Using a Scale-Selective Data Assimilation Approach: A Case Study. Nat. Haz. 73 (3), 1353–1368. doi: 10.1007/s11069-014-1155-y
Li Y, Peng S, Zhou F, Zhu Y, Wang D, Kang Z. (2018). Preliminary Assessment of Real-time Forecasting System for Atmosphere and Storm Surge in East Indian Ocean. Journal of Nanjing University of Information Science and Technology (Natural Science Edition, in Chinese, 10 (3), 361–369.
Liu J., Lin W., Dong X., Lang S., Jiang X. (2020). First Results From the Rotating Fan Beam Scatterometer Onboard CFOSAT. IEEE Trans. Geosci. Remote Sens. PP (99), 1–14. doi: 10.1109/TGRS.2020.2990708
Lo J. C. F., Yang Z. L., Pielke R. A. Sr. (2008). Assessment of Three Dynamical Climate Downscaling Methods Using the Weather Research and Forecasting (WRF) Model. J. Geophys. Res. 113, D09112. doi: 10.1029/2007JD009216
Mellor G. L. (2004). “Users Guide for a Three-Dimensional, Primitive Equation, Numerical Ocean Model (June 2004 Version)”, in In Prog. In Atmos. And Ocean. Sci (Princeton, NJ: Princeton Univ), 1–56.
Mlawer E. J., Taubman S. J., Brown P. D., Iacono M. J., Clough S. A. (1997). Radiative Transfer for Inhomogeneous Atmosphere: RRTM, a Validated Correlated-K Model for the Longwave. J. Geophys. Res. 102 (D14), 16663–16682. doi: 10.1029/97JD00237
Mohapatra M., Bandyopadhyay B. K., Tyagi A., Mohanty U. C. (2014). “Status and Plans for Operational Tropical Cyclone Forecasting and Warning Systems in the North Indian Ocean Region,” in Monitoring and Prediction of Tropical Cyclones in the Indian Ocean and Climate Change. Eds. Mohanty U.C., Mohapatra M., Singh O.P., Bandyopadhyay B.K., Rathore L.S. Springer, Dordrecht.
Paliwal M., Patwardhan A. (2013). Identification of Clusters in Tropical Cyclone Tracks of North Indian Ocean. Nat. Haz. 68 (2), 645–656. doi: 10.1007/s11069-013-0641-y
Paul F. P., Subrahamanyam D. B. (2021). Prediction of Tropical Cyclone Trajectories Over the North Indian Ocean Using COSMO. Meteorol. Atmos. Phys. 133, 789–802. doi: 10.1007/s00703-021-00782-5
Peng S., Li Y., Gu X., Chen S., Wang D., Wang H., et al. (2015). A Real-Time Regional Forecasting System Established for the South China Sea and Its Performance in the Track Forecasts of Tropical Cyclones During 2011-13. Wea. Forecast. 30, 471–485. doi: 10.1175/WAF-D-14-00070.1
Peng S., Xie L., Liu B., Semazzi F. (2010). Application of Scale-Selective Data Assimilation to Regional Climate Modeling and Prediction. Mon. Wea. Rev. 138, 1307–1318. doi: 10.1175/2009MWR2974.1
Rajasekhar M., Kishtawal C. M., Prasad M. Y. S., Seshagiri Rao V., Rajeevan M. (2014). “Extended Range Tropical Cyclone Predictions for East Coast of India,” in ‘Monitoring and Prediction of Tropical Cyclones in the Indian Ocean and Climate Change. Eds. Mohanty U.C., Mohapatra M., Singh O.P., Bandyopadhyay B.K., Rathore L.S. Dordrecht: Springer.
Sabique L., Annapurnaiah K., Balakrishnan Nair T. M., Srinivas K. (2012). Contribution of Southern Indian Ocean Swells on the Wave Heights in the Northern Indian Ocean – A Modeling Study. J. Ocean. Eng. 43, 113–120. doi: 10.1016/j.oceaneng.2011.12.024
Samiksha S. V., Vethamony P., Aboobacker V. M., Rashmi R. (2012). Propagation of Atlantic Ocean Swells in the North Indian Ocean: A Case Study. Nat. Haz. Earth Syst. Sci. 12, 3605–3615. doi: 10.5194/nhess-12-3605-2012
Singh O. P. (2010). Tropical Cyclones: Trends, Forecasting and Mitigation. Nat. Anthropo. Disasters 256–274. doi: 10.1007/978-90-481-2498-5_12
Singh O. P., Khan T. M. A., Rahma M. S. (2001). Has the Frequency of Intense Tropical Cyclones Increased in the North Indian Ocean? Curr. Sci. 80 (4), 12–17.
Singh D., Singh V. (2007). Impact of Tropical Cyclone on Total Ozone Measured by TOMS-EP Over the Indian Region. Curr. Sci. 93 (4), 37–42.
Sirisha P., Sandhya K. G., Balakrishnan Nair T. M., Venkateswara Rao B. (2017). Evaluation of Wave Forecast in the North Indian Ocean During Extreme Conditions and Winter Monsoon. J. Opera. Oceanogr. 10 (1), 79–92. doi: 10.1080/1755876X.2016.1276424
Skamarock W. C., Klemp J. B., Dudhia J., Gill D. O., Barker D. M., Duda M. G., et al. (2008). A Description of the Advanced Research WRF Version 3. Available at: http://www.mmm.ucar.edu/wrf/users/docs/arw_v3.pdf.
Takahashi H. G. (2011). Long-Term Changes in Rainfall and Tropical Cyclone Activity Over South and Southeast Asia. Adv. Geosci. 30, 17–22. doi: 10.5194/adgeo-30-17-2011
Tolman H., Accensi M., Alves J.-H., Ardhuin F., Barbariol F., Benetazzo A., et al. (2016). User Manual and System Documentation of WAVEWATCH III (R) Version 5.16 College Park, MD, USA: Tech. Note 329, NOAA/NWS/NCEP/MMAB, 326 pp. + Appendices
Wahiduzzaman M., Oliver E. C. J., Wotherspoon S. J., Holbrook N. J. (2017). A Climatological Model of NIO Tropical Cyclone Genesis, Tracks and Landfall. Clim. Dyn. 49, 2585–2603. doi: 10.1007/s00382-016-3461-4
Wahiduzzaman M., Oliver E., Wotherspoon S., Luo J. J. (2020). Statistical Forecasting of Tropical Cyclones Over the North Indian Ocean and the Role of El Niño-Southern Oscillation. Clim. Dyn. 54 (2-3), 1571–1589. doi: 10.1007/s00382-019-05075-7
Wahiduzzaman M., Yeasmin A. (2019a). Statistical Forecasting of Tropical Cyclone Landfall Activities Over the North Indian Ocean Rim Countries. Atmos. Res. 227, 89–100. doi: 10.1016/j.atmosres.2019.04.034
Wahiduzzaman M., Yeasmin A. (2019b). A Kernel Density Estimation Approach of North Indian Ocean Tropical Cyclone Formation and Association With Convective Available Potential Energy and Equivalent Potential Temperature, Meteorog. Atmos. Phys., 132 (5), 603–612. doi: 10.1007/s00703-019-00711-7
Xu Y., Liu J., Xie L., Sun C., Liu J., Li J., et al (2019). China-France Oceanography Satellite (CFOSAT) Simultaneously Observes the Typhoon-Induced Wind and Wave Fields. Acta Oceanolog. Sinica-English Ed. 38 (11), 158–161. doi: 10.1007/s13131-019-1506-3
Zhang Y., Duliere V., Mote P., Salathe E. P. Jr. (2009). Evaluation of WRF and HadRM Mesoscale Climate Simulations Over the U.S. Pacific Northwest. J. Clim. 22, 5511–5526. doi: 10.1175/2009JCLI2875.1
Keywords: North Indian Ocean, weather forecast, wave forecast, storm surge, data assimilation, swell
Citation: Li Y, Li S, Peng S, Zhu Y, Zhou F and Tang S (2022) An Updated Real-Time Forecasting System for Marine Environments in the North Indian Ocean. Front. Mar. Sci. 9:907087. doi: 10.3389/fmars.2022.907087
Received: 29 March 2022; Accepted: 25 April 2022;
Published: 26 May 2022.
Edited by:
Lichuan Wu, Uppsala University, SwedenReviewed by:
George Varlas, Hellenic Centre for Marine Research (HCMR), GreeceXingru Feng, Institute of Oceanology (CAS), China
Copyright © 2022 Li, Li, Peng, Zhu, Zhou and Tang. This is an open-access article distributed under the terms of the Creative Commons Attribution License (CC BY). The use, distribution or reproduction in other forums is permitted, provided the original author(s) and the copyright owner(s) are credited and that the original publication in this journal is cited, in accordance with accepted academic practice. No use, distribution or reproduction is permitted which does not comply with these terms.
*Correspondence: Shiqiu Peng, c3BlbmdAc2NzaW8uYWMuY24=