
94% of researchers rate our articles as excellent or good
Learn more about the work of our research integrity team to safeguard the quality of each article we publish.
Find out more
ORIGINAL RESEARCH article
Front. Mar. Sci., 24 May 2022
Sec. Aquatic Physiology
Volume 9 - 2022 | https://doi.org/10.3389/fmars.2022.902595
 Haijun Wei1,2,3†
 Mingqiang Chen1,2,3†Zhenghua Deng1,2,3Jing Sun1,2,3
 Jingru Yang1,2,3Wang Zhao1,2,3Youning Li1,2,3
 Zhenhua Ma1,2,3
 Yu Wang1,2,3*Gang Yu1*
Acute salinity stress can impact many physiological processes of marine shellfish. The responses of Pinctada maxima to salinity stress, especially the osmotic pressure regulation and immune response, are of great significance to health. To investigate the molecular changes in response to acute salinity stress, the pearl oysters were transferred from 30 ppt (C) to 40 ppt (HS) and 20 ppt (LS) for 12 h, and the transcriptome analysis was conducted on the gills. Compared to the control, there were 6613 (3253 up-regulated and 3360 down-regulated) differentially expressed genes (DEGs), 4395 (2180 up-regulated and 2215 down-regulated) DEGs observed in HS and LS, respectively. The related molecular biological processes and potential functions were explored from enrichment analysis. A total of 332 KEGG pathways (including 1514 genes) and 308 KEGG pathways (including 731 genes) were enriched in C vs. HS and C vs. LS, respectively. In addition, there are 1559 DEGs shared by C vs. HS group and C vs. LS group, and the results of the KEGG function annotation showed that 7 DEGs were involved in membrane transport, and 34 DEGs were involved in the immune system. The correlation network for expression of genes shows that the expression of 3 genes was significantly correlated with each other in membrane transport, and there were significant correlations between the expression of 27 genes in immune response. The results of this study will be of great value in understanding the molecular basis of salinity stress adaptation in the pearl oyster P. maxima.
During their lifetime, marine bivalve mollusks are not only exposed to biotic stressors, but also affected by varied environment such as high fluctuation of light intensity, pH, water temperature, dissolved oxygen, and salinity. Salinity is an important ecological factor that has a profound impact on the survival, distribution, growth, and development of marine organisms (Pourmozaffar et al., 2019). It is predicated that the human activities and global warming will eventually lead to changes in the salinity of ocean water by the melt of glaciers and ice sheets (Velez et al., 2016a; Velez et al., 2016b). In addition, intertidal zone and coastal waters are vital marine areas for aquaculture, where organisms may be subjected to salinity stress due to the ebb and flow of the tide, and the severe weather (Coughlan et al., 2009; Chen et al., 2021). The osmotic pressure of most marine mollusks is similar to the seawater because they are osmotic conformers and lack the ability to regulate the osmotic pressure of the internal medium (Hochachka and Somero, 2002; Larsen et al., 2014). Marine mollusks can live in water with salinity ranging from 75-80 ppt to 4-5 ppt, and they can be divided into stenohalinity and eurysalinity (Hedgpeth et al., 1997). For the past few years, more and more attention has been paid to the effects of salinity changes on marine organisms. Many studies have shown that salinity changes have a great influence on the life activities, physiological processes, growth and development, molecular response, and metabolic physiology of shellfish (Ertl et al., 2019; Tanner et al., 2019; Zhang H. et al., 2020; Balogh and Byrne, 2021; Garçon et al., 2021; Li et al., 2021; Ni et al., 2021; Sun et al., 2021).
Osmoregulatory organs in marine organisms play an important role in maintaining osmotic pressure stability, such as gills can secrete ions in high salinity water and absorb ions in low salinity water (Cui et al., 2019). In addition, the tight closure of the shell to separate the external environment from the internal fluid could protect the shellfish from changes in salinity for a short time, and the free amino acid pool could help marine bivalves maintain the osmotic equilibrium (Solan and Whiteley, 2016). However, extreme fluctuations in salinity can cause damage and even death to marine mollusks (Vanessa et al., 2014; Gajbhiye and Khandeparker, 2017). Previous studies have shown that regulating ionic balance and osmotic pressure requires a large amount of energy in response to salinity stress (Li et al., 2014). In addition, there are many studies showing the effects of salinity stress on behavioral response, hemolymph chemistry and histopathological changes, and immune response of marine mollusks such as Ruditapes decussatus, Crassostrea gigas, C. virginica, Pteria penguin, and Venerupis corrugate (Knowles et al., 2014; Casas et al., 2018; Vasquez et al., 2020; Woodin et al., 2020; Zhang M. et al., 2020). However, the genes and pathways involved in salinity adaptation remain largely unknown, and more information is needed about the molecular effects of acute salinity stress on marine mollusks. RNA-seq based transcriptome is a transcriptomics technique used to analyze the structure and expression level of transcripts, which is profiling developed rapidly and has been widely used in aquatic animals for understanding the transcriptomic signatures to changes in the environment (Wang et al., 2018; Ertl et al., 2019; Jeffries et al., 2019). In addition, transcriptome analysis techniques have also been applied to determine the molecular response of marine mollusks in response to salinity stress, such as C. gigas (Zhao et al., 2012), C. hongkongensis (Xiao et al., 2018), C. virginica (Eierman and Hare, 2014), C. nippona (Gong et al., 2021), Ostrea lurida (Maynard et al., 2018), Saccostrea glomerata (Ertl et al., 2019), Sinonovacula constricta (Li et al., 2021), Cyclina sinensis (Ni et al., 2021), and R. philippinarum (Nie et al., 2020). However, there is still a blank about the transcriptomic signatures in response to acute salinity stress of pearl oyster P. maxima.
Pearl oyster Pinctada maxima is mainly distributed in the Indo-Pacific region, and it is known for producing large-sized pearls with high economic value (Liang et al., 2016). Previous studies have shown that P. maxima can tolerate a wide range of salinities, and the optimal growth salinity is 30 ppt (Taylor et al., 2004; Deng et al., 2013). In comparison with salinity 30 ppt, Taylor et al. (2004) pointed out that the growth of P. maxima was significantly depressed at a salinity of 25 ppt, 40 ppt, and 45 ppt, and the results of Deng et al. (2013) showed that the growth and survival rate of P. maxima larvae declined at the salinity of 27 ppt, 24 ppt, and 21 ppt. Furthermore, in recent years, the research about genetic diversity, pearl cultivation, larval reproduction, growth performance, shell materials, and disease have been documented in P. maxima (Lind et al., 2009; Nayfa and Zenger, 2016; Ompi et al., 2018; Anggraini et al., 2019; Hao et al., 2019; Wang et al., 2019a; Wullur et al., 2020; McDougall et al., 2021). Therefore, more information is needed on the effects of salinity stress on the P. maxima, as P. maxima is often cultured in offshore areas that are subject to fluctuating salinity.
Previous studies have shown that acute salinity stress can significantly affect the osmotic pressure and antioxidant system of marine shellfish (Casas et al., 2018; Zhang M. et al., 2020; Sun et al., 2021). In this study, biochemical indexes [Na+-K+ -ATPase, reduced glutathione (GSH), and glutathione peroxidase (GSH-Px)] at the control group (30 ppt), different time points (1 h, 3 h, 6 h, 12 h, 24 h, and 48 h) after being exposed to different environmental salinity (40 ppt and 20 ppt) were measured first to evaluate the effect of the acute salinity stress on P. maxima and determine the most suitable time point for transcriptomics analysis. Then, transcriptome analysis techniques were applied to determine the responsive genes and pathways in gills of pearl oyster P. maxima after acute salinity stress, aiming to better understand the transcriptomic signatures in response to acute salinity stress of pearl oyster P. maxima.
Pearl oysters P. maxima that were 2.5 years old with a comparable size (body mass of 114.11 ± 13.65 g and shell width of 22.08 ± 1.10 mm, n = 40) were collected from the cultured stock suspended in Weizhou Island of Beihai, China (109°06′N, 21°01′E). P. maxima was allowed to acclimatize to holding conditions in a cement tank (5000 L) with filtered seawater (salinity of 30 ppt, 21-22°C) for 7 days before the salinity exposure experiments. During the acclimation, the P. maxima was fed with Platymonas subcordiformis twice a day, and half seawater was replaced every day. The optimal salinity for growth is 30 ppt. and the growth of P. maxima was significantly depressed at low salinity and high salinity (Taylor et al., 2004). In this study, salinity 30 ppt (C) was served as the control group, and two salinity treatments were set at salinity 20 ppt (LS) and 40 ppt (HS), respectively. Salinity of experiment water was adjusted to the desired by mixing filtered seawater with sea salts or freshwater.
A total of 140 pearl oysters P. maxima were divided into three groups, 60 individuals were exposed to the acute low salinity of 20 ppt for 48 h, 60 individuals were exposed to the acute high salinity of 40 ppt for 48 h, and the remaining 20 individuals were kept at the acclimation tank as the control group (salinity of 30 ppt). Gills of 9 individuals were sampled into triplicate at the control group, different time points (1 h, 3 h, 6 h, 12 h, 24 h, and 48 h) after acute salinity stress, and stored at -80°C after freezing in liquid nitrogen for further analysis.
Biochemical indexes (Na+-K+ -ATPase, glutathione peroxidase, and reduced glutathione) of gills at control group and different time points (1 h, 3 h, 6 h, 12 h, 24 h, and 48 h) after acute salinity stress were measured with commercial kits from Abbkine Reagent Company and Nanjing Jiancheng Institute of Biological Engineering to evaluate the effect of the acute salinity stress on P. maxima and determine the most suitable time point for transcriptomics analysis (there should be significant differences among the control group, low salinity group, and high salinity group). The activities of Na+-K+ -ATPase (Item no. KTB1800) and glutathione peroxidase (Item no. KTB1640) were determined in accord with the instructions of kits from Abbkine Reagent Company. The total protein (Item no. A045-4-4) and reduced glutathione (Item no. A006-2-1) were determined according to the instructions of kits from Nanjing Jiancheng Institute of Biological Engineering.
In this study, the control group and the samples of 12 h after acute salinity stress were selected for transcriptomics analysis. Total RNA was extracted with the TRIzol Reagent (Invitrogen, US) according to the manufacturer’s instructions. RNA degradation and contamination were monitored on 1% agarose gels. RNA purity and concentration were checked using a NanoDrop2000 (Thermo, MA). RNA integrity number (RIN) was measured by Agilent2100 with RNA 6000 Nano kit (Agilent, CA). Only RNA samples with RIN, A260/A280, and A260/A230 > 8.0, 1.8, and 1.0, respectively, were used to create cDNA libraries for sequencing. Triplicate RNA samples (>5 μg each) of each group were used to construct RNA-seq libraries, and a total of 3 biological libraries were established.
The sequenced image signal from Illumina high throughput sequencing platform converts into text signal via CASAVA base-calling, and stores in FASTQ format as the raw data. Before analysis, low-quality reads and reads containing poly-N and adaptors from raw data have been removed by FASTP (Version 0.19.5, https://github.com/OpenGene/fastp) to obtain clean data. In addition, the Q20, Q30, and GC content of the clean data was calculated. For transcriptome research without reference genome, after obtaining high-quality RNA SEQ sequencing data, all sequencing reads were assembled from scratch to generate contigs and singletons by Trinity (Version v2.8.5). Based on the quantitative results of gene expression, the differentially expressed genes between the two groups were analyzed by deseq2, and the screening threshold was set as | log2 fold-change | ≥ 1 and p-adjust < 0.05. In addition, the RSEM software (version 1.3.1) was used for the principal components analysis (PCA).
The assembled transcripts were mapped using the databases Nr, Swiss-prot, Pfam, COG, GO, and KEGG to obtain differentially expressed genes’ function information. BLAST2GO software (version 2.5.0) was used to implement the GO enrichment analysis of the differentially expressed genes, and the statistical enrichment of DEGs in KEGG pathways were carried out by KOBAS software (version 2.1.1). GO terms and KEGG pathways with corrected p value <0.05 were considered significantly enriched by DEGs (Wei et al., 2019).
Nine typical DEGs and β-actin (reference gene) were randomly selected for quantitative real-time PCR (qRT-PCR) to verify the accuracy of the transcriptome and DGEs data, and the primers were designed using the Primer 5 (Table 1). RT-PCR was conducted using an RT-PCR system (Analytik Jena GmbH, Germany) with SYBR Green (Tiangen Biotech Co., Ltd., China), and the reaction conditions were referred to in Han et al. (2021). The 2–ΔΔCT method was used to calculate the relative expression levels of the DEGs.
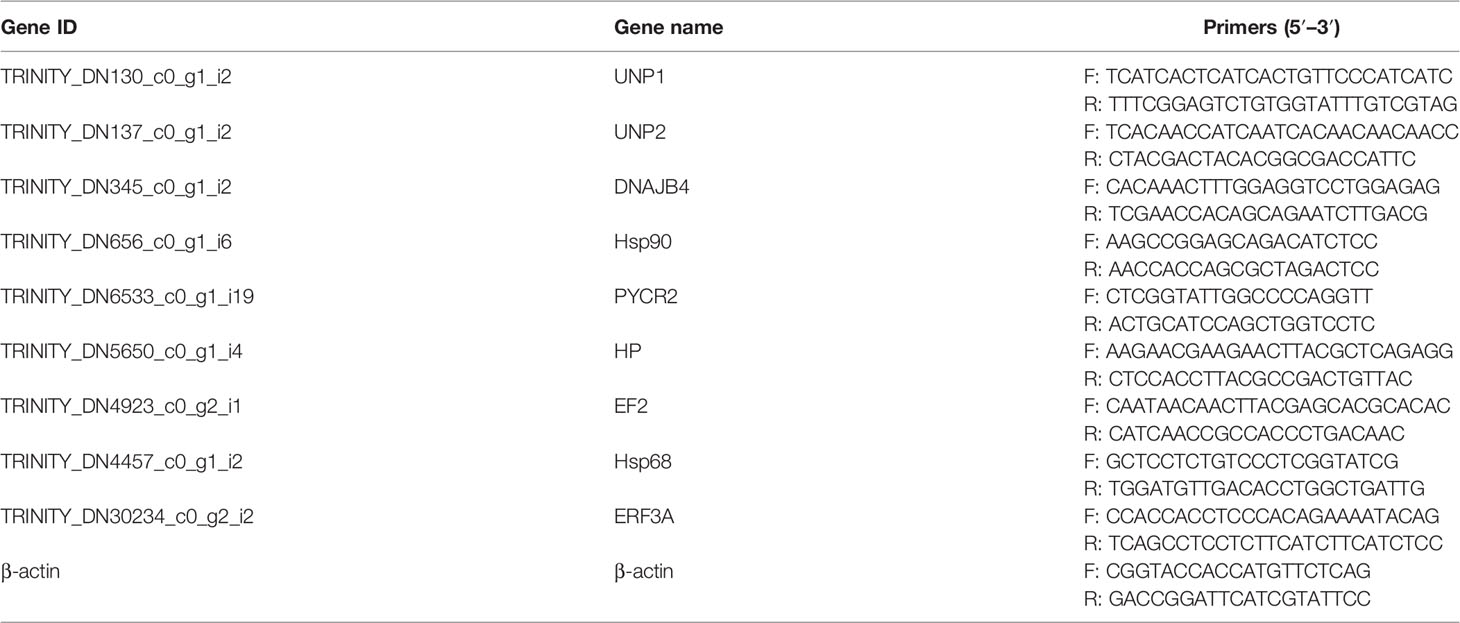
Table 1 Primer sequences of selected genes for quantitative real-time PCR.
The data were processed by Excel 2019 and expressed as mean ± standard deviation (SD), and the statistical significance was set at P < 0.05. Significant differences were analyzed by SPSS 18.0 (IBM SPSS Inc. Chicago, IL) software with one-way analysis of variance (ANOVA), followed by Tukey’s s-b multiple comparison tests.
The changes of Na+-K+ -ATPase, glutathione peroxidase, and reduced glutathione in P. maxima gill are shown in Figure 1. The maximum value of Na+-K+ -ATPase, glutathione peroxidase, and reduced glutathione were all found at 12 h after salinity stress of 40 ppt, while the minimum value of Na+-K+ -ATPase, glutathione peroxidase, and reduced glutathione were found at 1 h after salinity stress of 40 ppt, 24 h after salinity stress of 40 ppt, and 6 h after salinity stress of 20 ppt, respectively. The value of Na+-K+ -ATPase, glutathione peroxidase, and reduced glutathione in P. maxima gill significantly varies with different salinity stress and time point. Under normal circumstances, after 48 h salinity stress of 40 ppt, the value of the Na+-K+ -ATPase, glutathione peroxidase, and reduced glutathione stood at the same level as the control group, while the value of glutathione peroxidase and reduced glutathione after 48 h 20 ppt salinity stress were extremely higher than that of the control group.
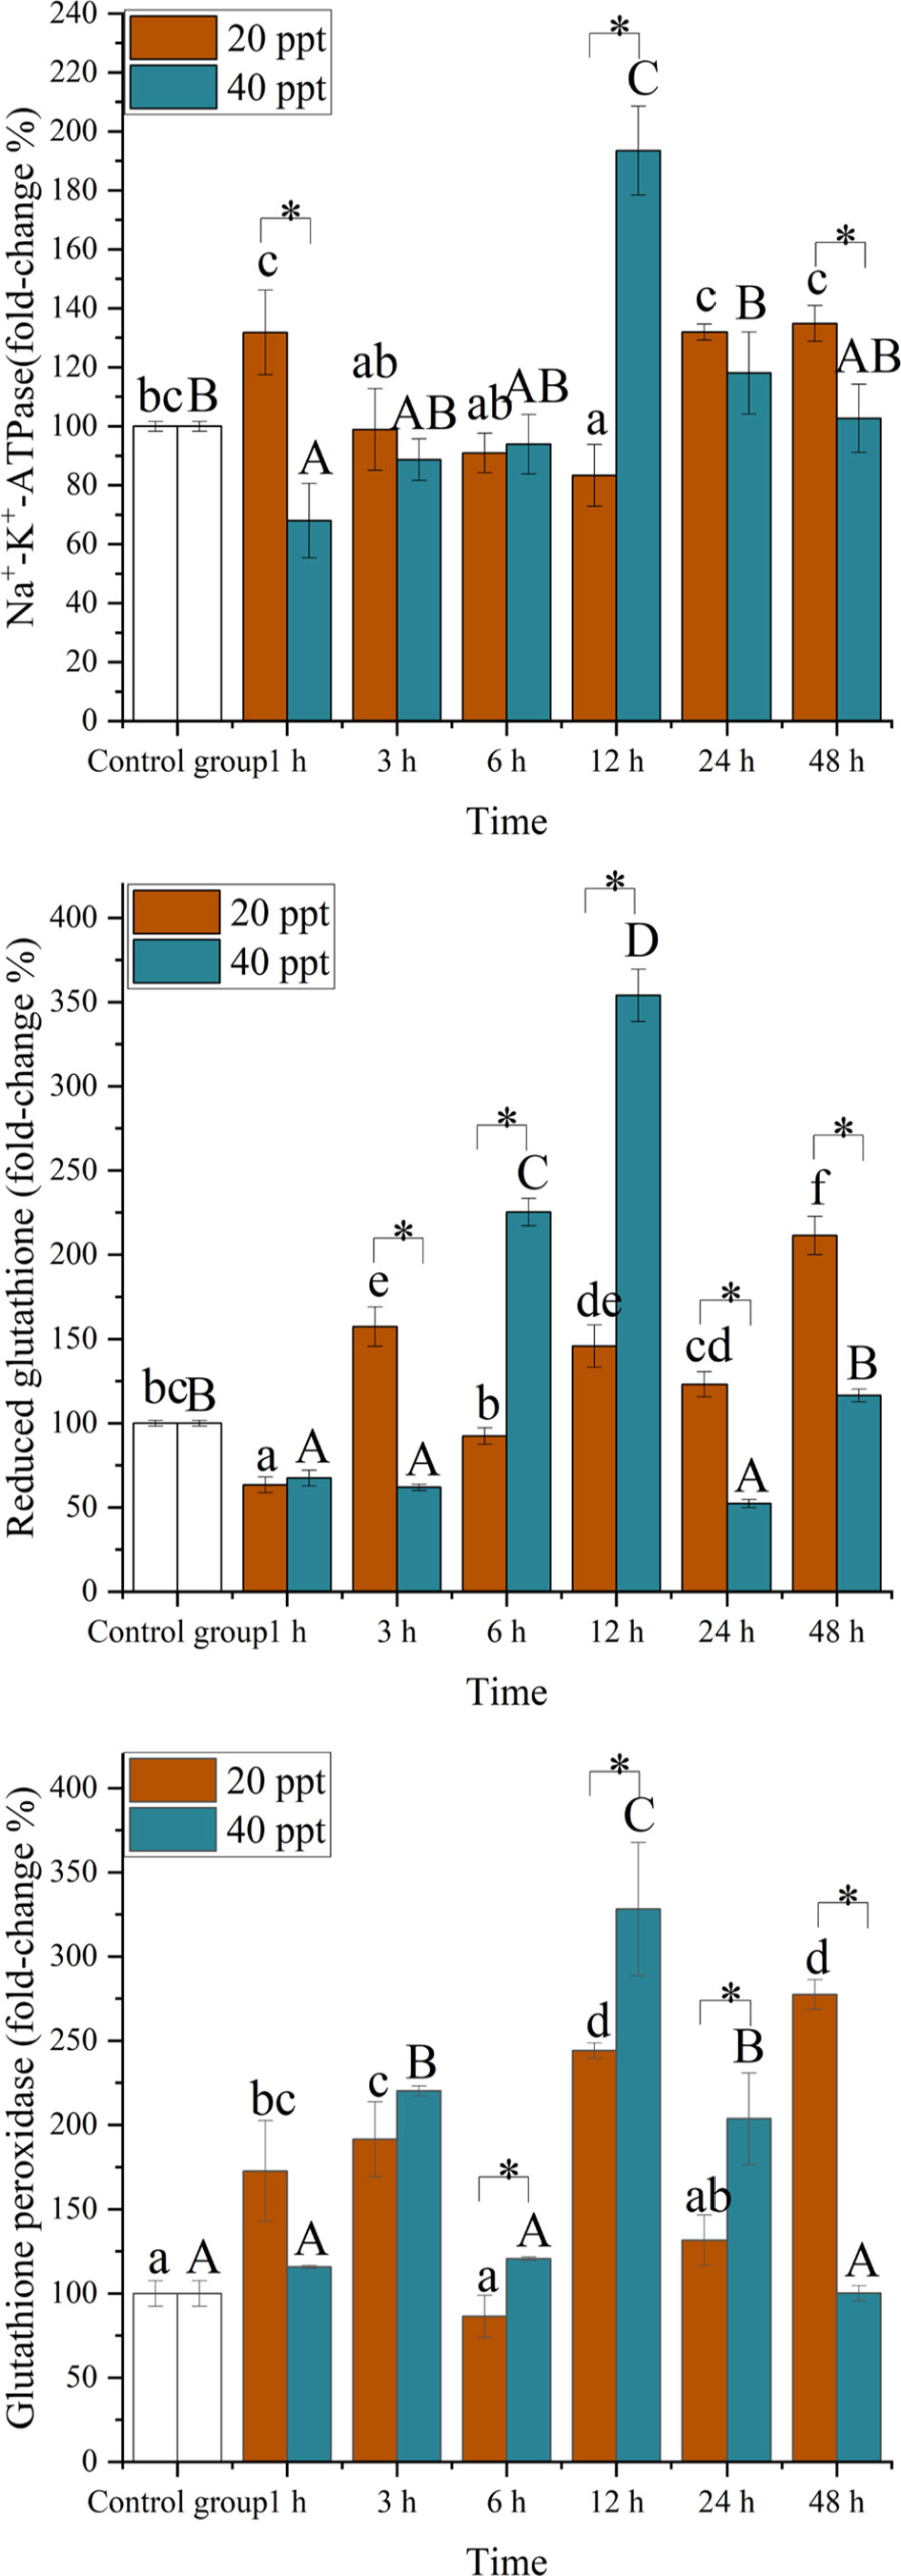
Figure 1 Effect of acute salinity stress on Na+-K+-ATPase, reduced glutathione, and glutathione peroxidase of Pinctada maxima. Data were expressed as mean ± SD (n = 3). Different lowercase letters (a–e) in the figure show significant differences (P < 0.05) among the salinity 20 ppt group, different capital letters (A–D) in the figure show significant differences (P < 0.05) among the salinity 40 ppt group, and * shows significant differences (P < 0.05) among treatment groups.
As there were significant differences in all three biochemical factors between any two groups of control group, the high salinity group (40 ppt) and the low salinity group (20 ppt) only at 12 h, samples of the control group, 12 h after salinity stress of 40 ppt and 20 ppt in triplicate were picked for transcriptomics analysis.
The description of the sequencing data is presented in Table 2. After preprocessing and removing the low-quality sequences, a total of 64.25 Gb of clean data were obtained, and the clean data of each sample were above 6.2 Gb. The Q20 and Q30 in all treatments were > 98% and 93%, respectively, and the GC was 40.81%-41.39%. After filtering, 74.16%-72.39% clean reads were successfully matched to the genomes of C. gigas, C. virginica, Pecten maximus, Mizuhopecten yessoensis, P. fucata, and other species within the NR database (ftp://ftp.ncbi.nlm.nih.gov/blast/db/).

Table 2 Statistics for transcriptome sequencing data from the Pinctada maxima gill.
The results of transcriptome expression analysis and functional annotation of the P. maxima gill are shown in Figure 2. The number of unigenes expressed in the control group (C), high salinity group (HS), and low salinity group (LS) were 33,419, 34,751, and 36,859, respectively, and there were 24,320 unigenes shared by each group (Figure 2A). The correlation coefficients between parallel samples were over 0.91, and the principal components analysis (PCA) revealed significant differences in metabolism of pearl oysters between the three groups (Figure 2B). Gene Ontology (GO) categorization of the unigenes in the gill transcriptome of P. maxima for all three major GO functional domains (biological processes, cellular components, and molecular function) are presented in Figure 2C. For biological processes, transcripts involved in cellular process (35.24%, GO:0009987) and metabolic process (26.11%, GO:0008152) were the most represented categories; for cellular component, transcripts involved in the membrane part (38.59%, GO:0044425) and the cell part (27.71%, GO:0044464) were highly represented, whereas, regarding molecular function, binding (48.62%, GO:0005488) was the most represented GO term, followed by catalytic activity (41.04%, GO:0003824).
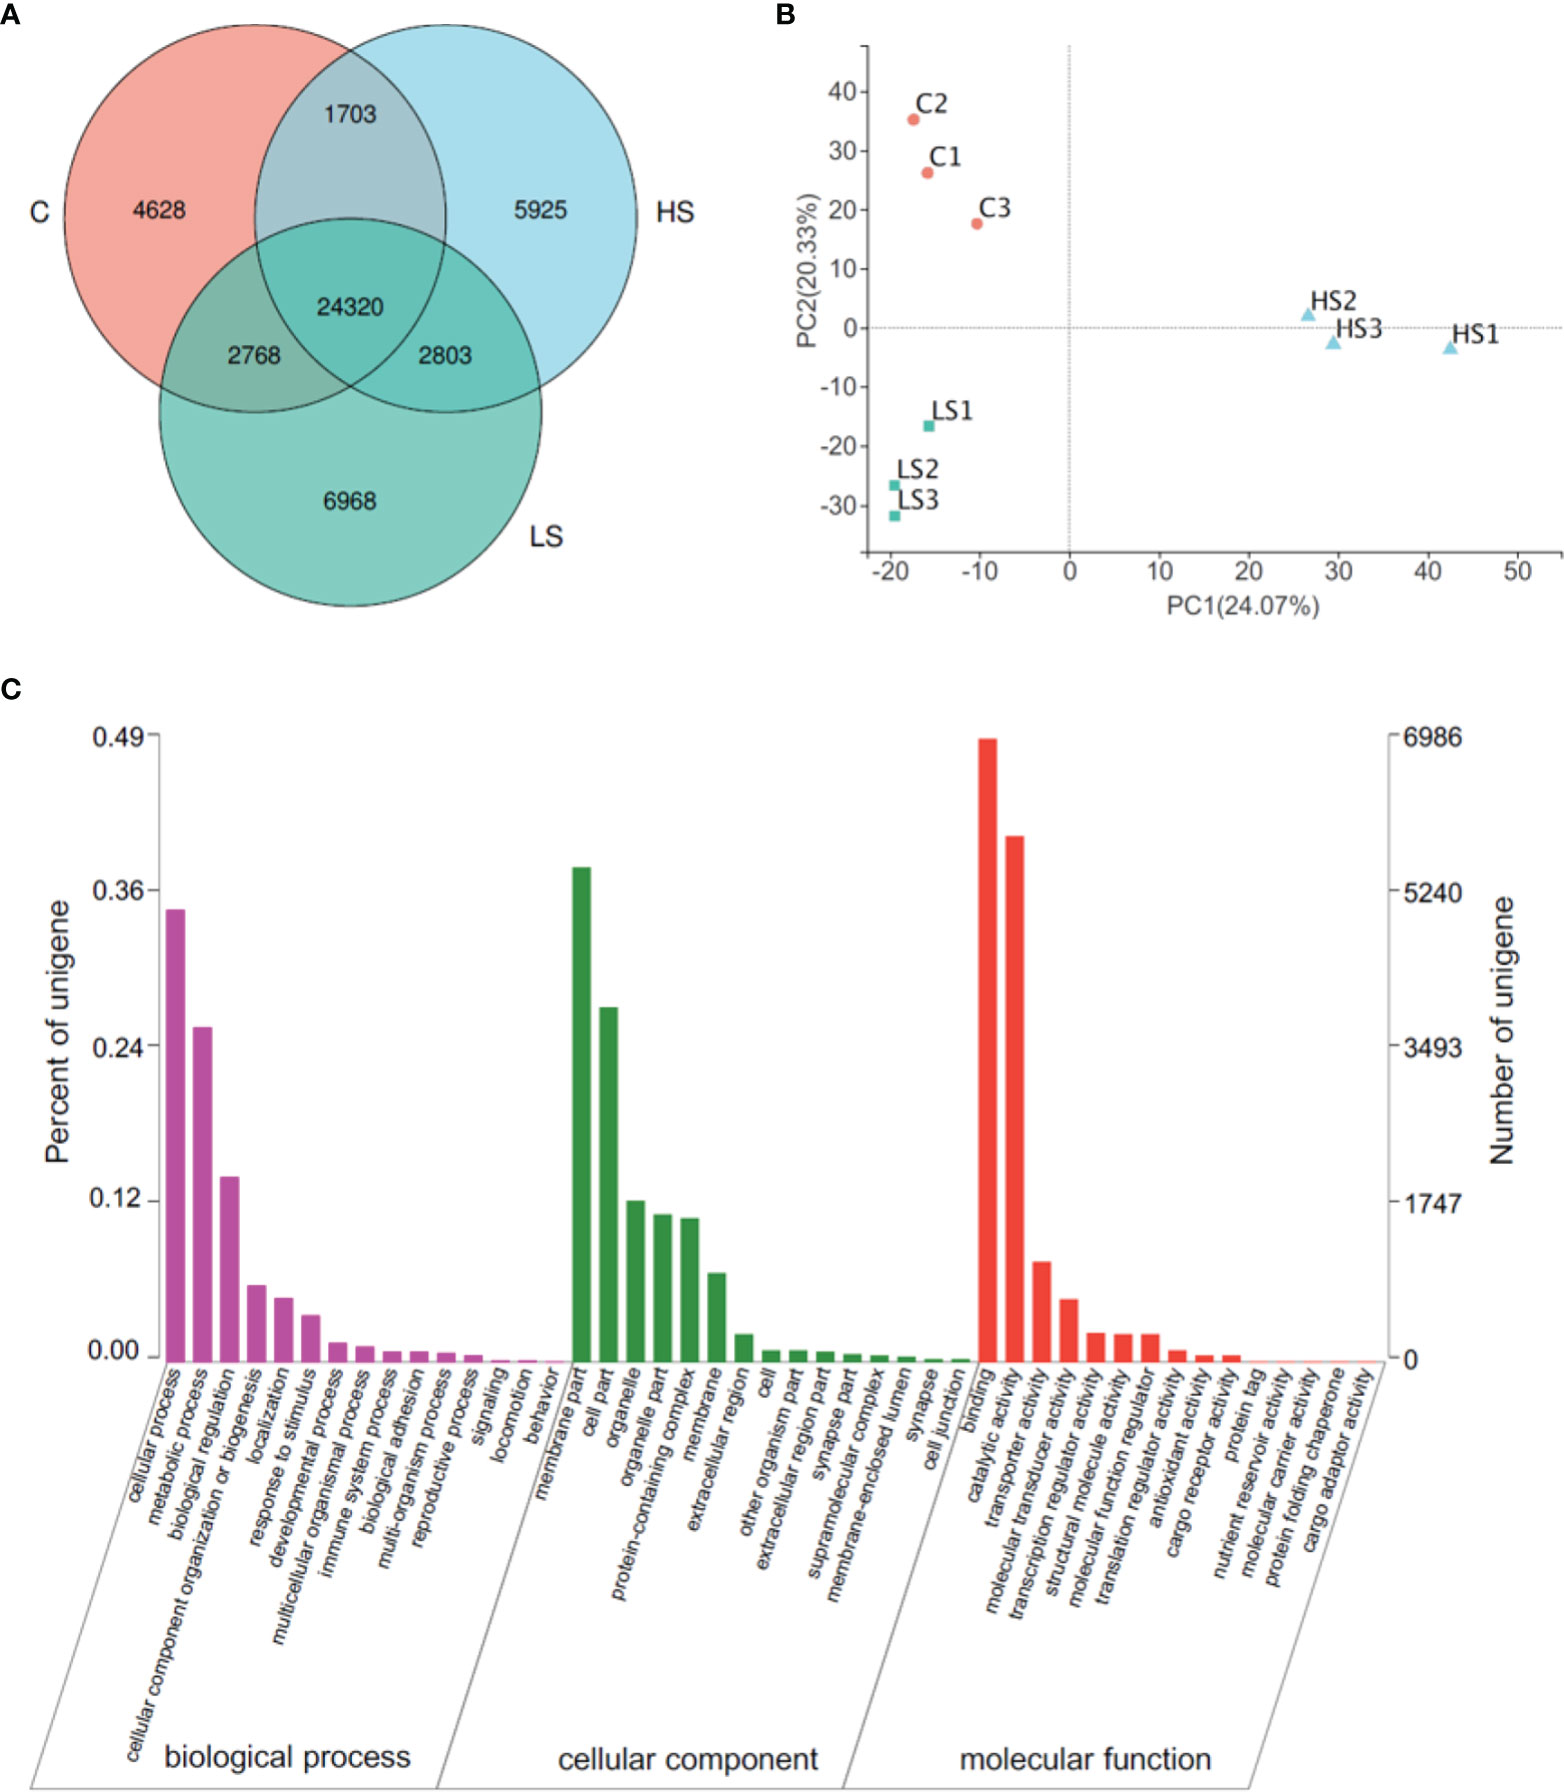
Figure 2 Transcriptome expression analysis and functional annotation of the Pinctada maxima gill. (A) Venn diagram between groups, (B) principal components analysis (PCA) of expression levels between samples, (C) Gene Ontology (GO) categorization of the unigenes in the gill transcriptome of Pinctada maxima. C, control group; HS, high salinity group; LS, low salinity group.
The results of the statistics and GO categorization of the DEGs between the control group, high salinity group, and low salinity group are shown in Figure 3. A total of 11,793 DEGs were obtained, and there were 6613 (3253 up-regulated genes and 3360 down-regulated genes) DEGs (Supplementary Table S1), 4395 (2180 up-regulated genes and 2215 down-regulated genes) DEGs (Supplementary Table S2), and 6836 (3280 up-regulated genes and 3556 down-regulated genes) DEGs for C vs. HS, C vs. LS, and LS vs. HS, respectively (Figures 3A, B). In C vs. LS and C vs. HS group, it is worth noting that the genes whose expression was most significantly decreased were neuroglian isoform X2 and inositol oxygenase, respectively; and the most significantly elevated genes were heat shock protein 68 and cysteine sulfinic acid decarboxylase, respectively (Supplementary Table S1 and Supplementary Table S2). C vs. HS and C vs. LS shared 1559 DEGs (contains 1480 genes with consistent regulatory trends, Supplementary Table S3), while C vs. HS, C vs. LS, and LS vs. HS shared 240 DEGs (Figure 3A). Figure 3C shows the GO categorization of the DEGs in C vs. HS, C vs. LS, and LS vs. HS. In C vs. HS, binding (12.72%, GO:0005488) and catalytic activity (41.04%, GO:0003824), membrane part (9.51%, GO:0044425) and cell part (27.71%, GO:0044464), and cellular process (8.54%, GO:0009987) and metabolic process (26.11%, GO:0008152) were the most represented GO terms for molecular function, biological processes, and cellular components, respectively. Coincidentally, the most represented GO terms in C vs. LS and LS v.s HS are exactly the same as in C vs. HS.

Figure 3 Statistics and GO categorization of the DEGs in the gill transcriptome of Pinctada maxima. (A) Venn diagram of the number of DEGs, (B) statistics for up/down-regulated DEGs, and (C) GO categorization of the DEGs. C, control group; HS, high salinity group; LS, low salinity group.
In C vs. HS, a total of 332 KEGG pathways were enriched, including 1514 genes. The first category with the largest number of pathways was ‘Organismal Systems’ (86) and ‘Human Diseases’ (86), followed by ‘Metabolism’ (83), ‘Environmental Information Processing’ (35), ‘Cellular Processes’ (22), and ‘Genetic Information Processing’ (20). In addition, 27 KEGG pathways were significantly (P < 0.05) enriched (Figure 4A), including ‘Metabolism’ (11, ‘Retinol metabolism’ as a representative), ‘Human Diseases’ (6, ‘Small cell lung cancer’ as a representative), ‘Organismal Systems’ (4, ‘Toll and Imd signaling pathway’ as a representaive), ‘Cellular Processes’ (4, ‘Apoptosis - multiple species’ as a representative), and ‘Environmental Information Processing’ (2, ‘NF-kappa B signaling pathway’ as a representative). The expression levels of most DEGs in the top 10 significantly enriched pathways (‘Small cell lung cancer’, ‘NF-kappa B signaling pathway’, ‘Platinum drug resistance’, ‘Retinol metabolism’, ‘Toxoplasmosis’, ‘Apoptosis - multiple species’, ‘TNF signaling pathway’, ‘Chemical carcinogenesis’, ‘Toll and Imd signaling pathway’, and ‘Peroxisome’) in C vs. HS were up-regulated (Figure 4B).
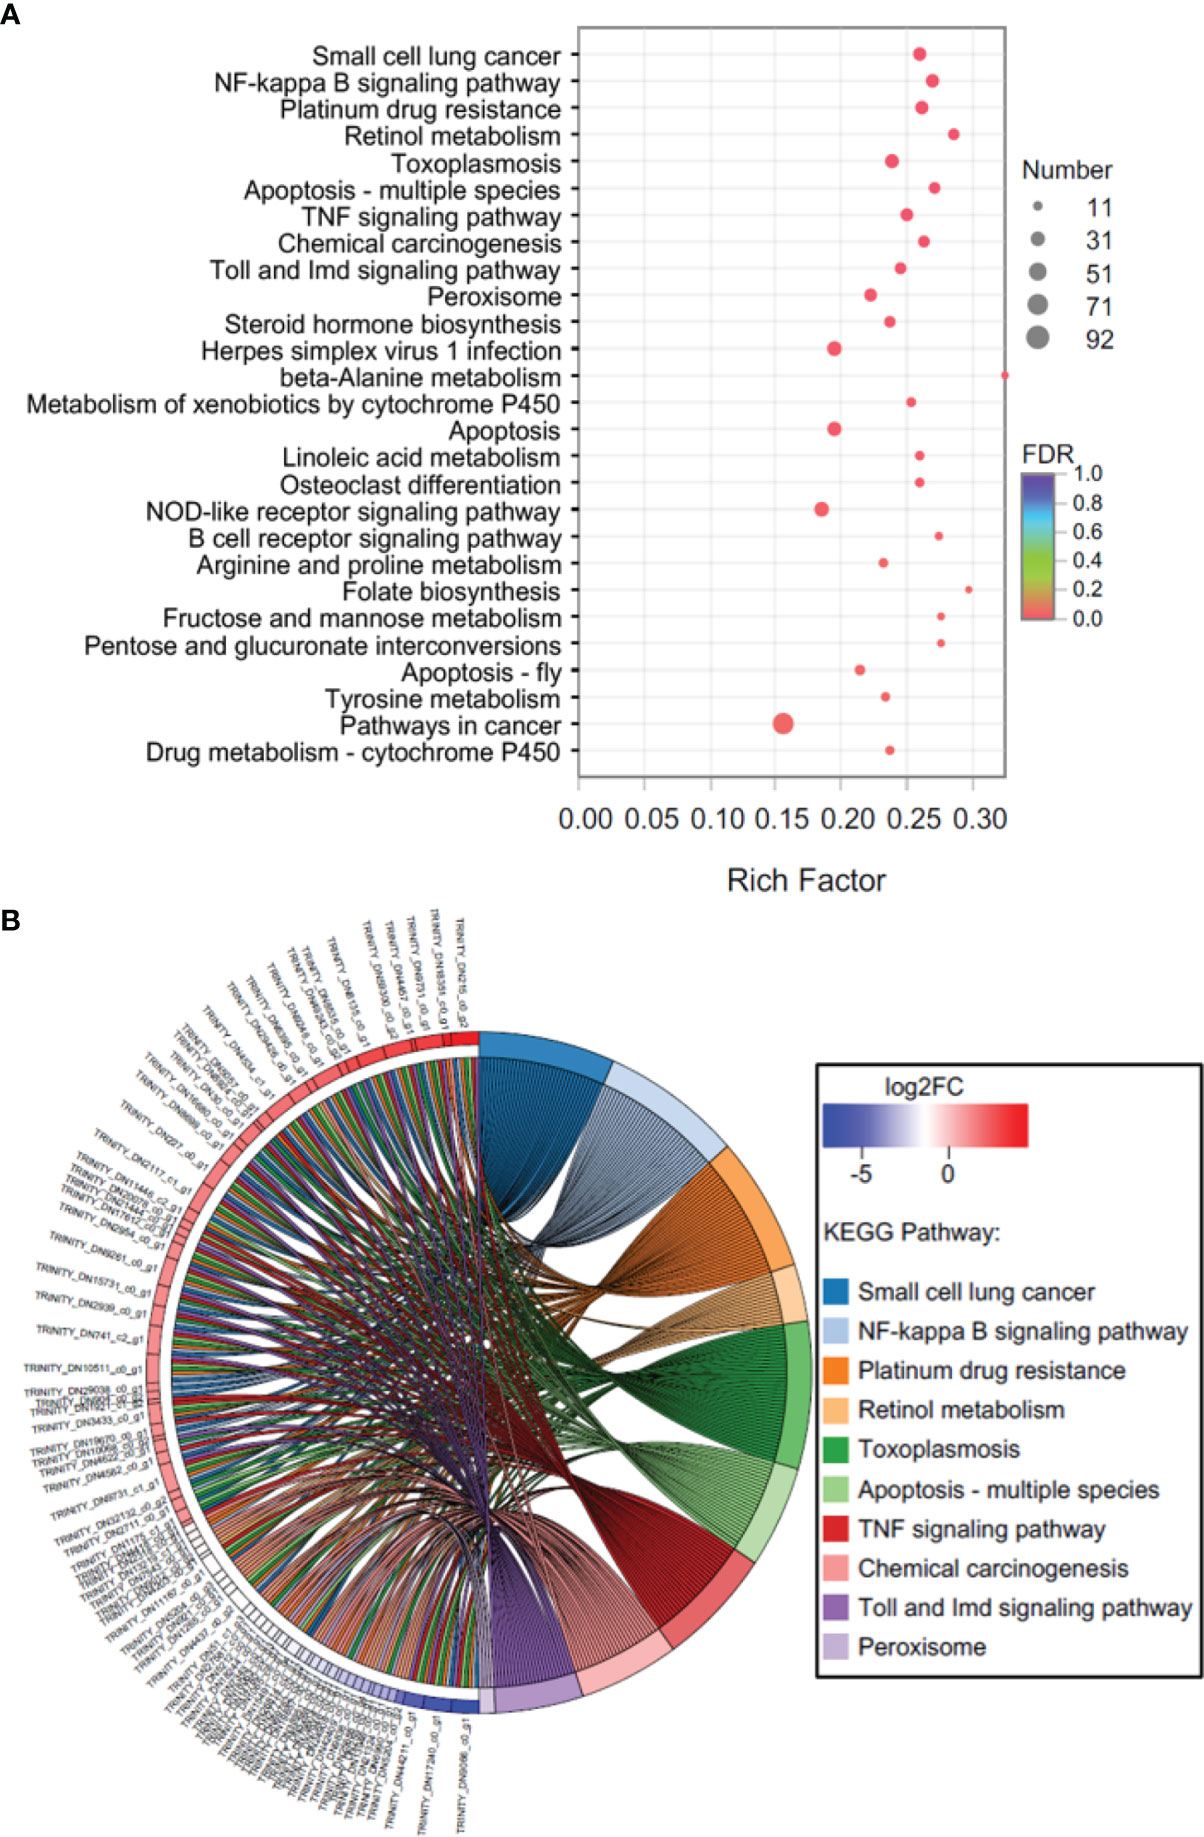
Figure 4 KEGG enrichment analysis of DEGs in C vs. HS. (A) Bubble diagram, (B) enrichment chord diagram.
In C vs. LS, a total of 308 KEGG pathways were enriched, including 731 genes. The first category with the largest number of pathways was ‘Organismal Systems’ (85), followed by ‘Human Diseases’ (84), ‘Metabolism’ (64), ‘Environmental Information Processing’ (34), ‘Cellular Processes’ (21), and ‘Genetic Information Processing’ (20). In addition, 27 KEGG pathways were significantly (P < 0.05) enriched (Figure 5A), including ‘Human Diseases’ (14, ‘MicroRNAs in cancer’ as a representative), ‘Organismal Systems’ (5, ‘Hematopoietic cell lineage’ as a representative), ‘Environmental Information Processing’ (4, ‘NF-kappa B signaling pathway’ as a representative), ‘Cellular Processes’ (3, ‘Cell cycle’ as a representative), and ‘Metabolism’ (1, ‘Retinol metabolism’ as a representative). The expression levels of most DEGs in the top 10 significantly enriched pathways (‘NF-kappa B signaling pathway’, ‘MicroRNAs in cancer’, ‘Cell cycle’, ‘Hematopoietic cell lineage’, ‘Pancreatic cancer’, ‘Inflammatory bowel disease (IBD)’, ‘Rheumatoid arthritis’, ‘Axon regeneration’, ‘Cell adhesion molecules (CAMs)’, and ‘Toxoplasmosis’) in C vs. LS were up-regulated (Figure 5B).
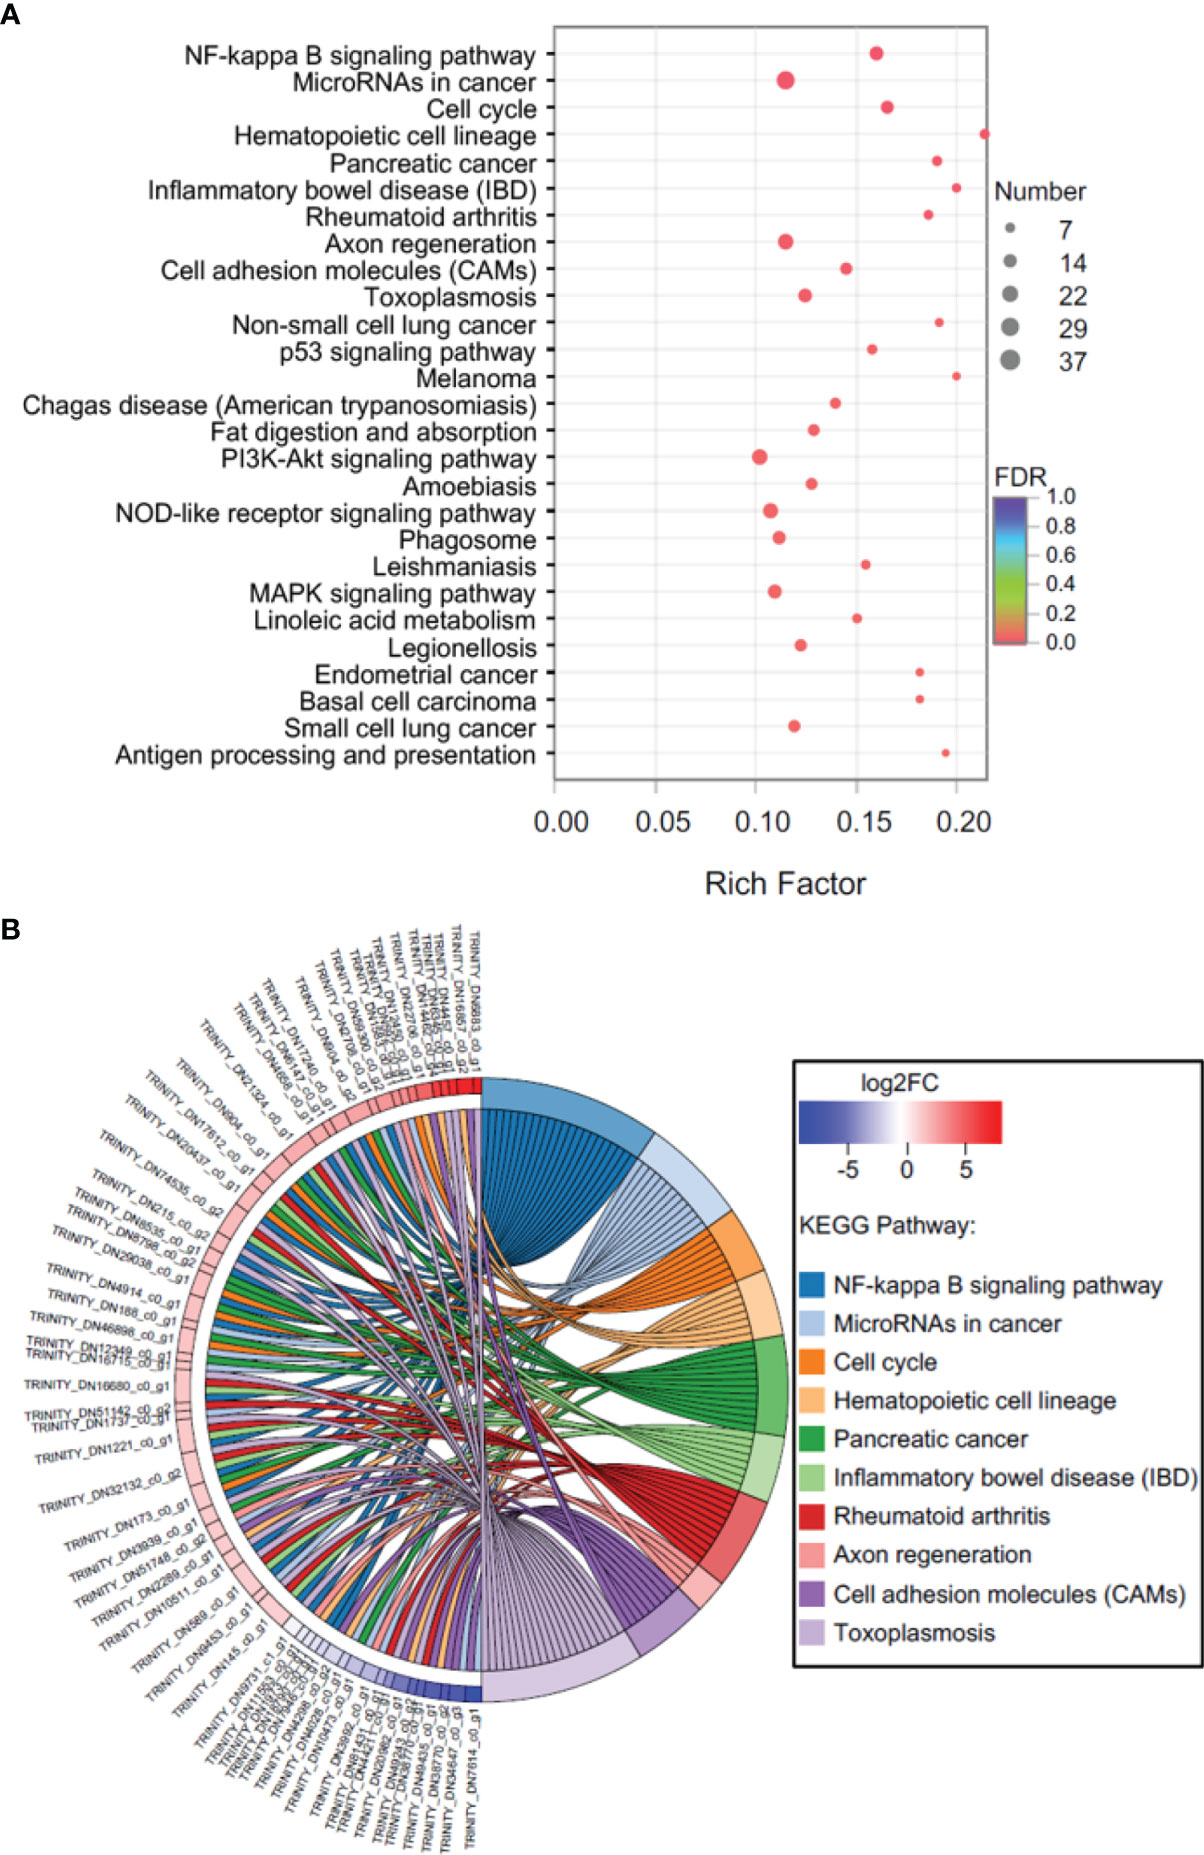
Figure 5 KEGG enrichment analysis of DEGs in C vs. LS. (A) Bubble diagram, (B) Enrichment chord diagram.
There were 1559 DEGs shared by the C vs. HS group and the C vs. LS group. The results of KEGG function annotation showed that 7 DEGs were involved in membrane transport, which includes 2 uncharacterized proteins and 5 function proteins (2 PLL, TTX1, ABCB1-3, and ABCB10) (Figure 6A). In addition, 34 DEGs were observed in the immune system, including 6 uncharacterized proteins and 28 function proteins (Figure 6A). The results of expression pattern clustering heat map analysis showed that salinity stress would down-regulate most membrane transport related genes, and only one up-regulated gene (ABCB10) was found under high salinity stress (Figure 6B). For the immune system related genes, there were 9 genes down-regulated both in the C vs. HS group and the C vs. LS group, 7 genes were up-regulated in the C vs. HS group, and 10 genes were up-regulated in the C vs. LS group (Figure 6B). The correlation network for expression of genes shows that the expression of 2 PLL was significantly correlated with the expression of ABCB1-3 in function genes of membrane transport (Figure 6C), and there were more than 10 genes related to QRFPR, pepN-L1, TLR2-1, HSP68, RHOU, MYD88-1, NOTCH2, CDC42, and Sli-l in function genes of the immune system (Figure 6D).
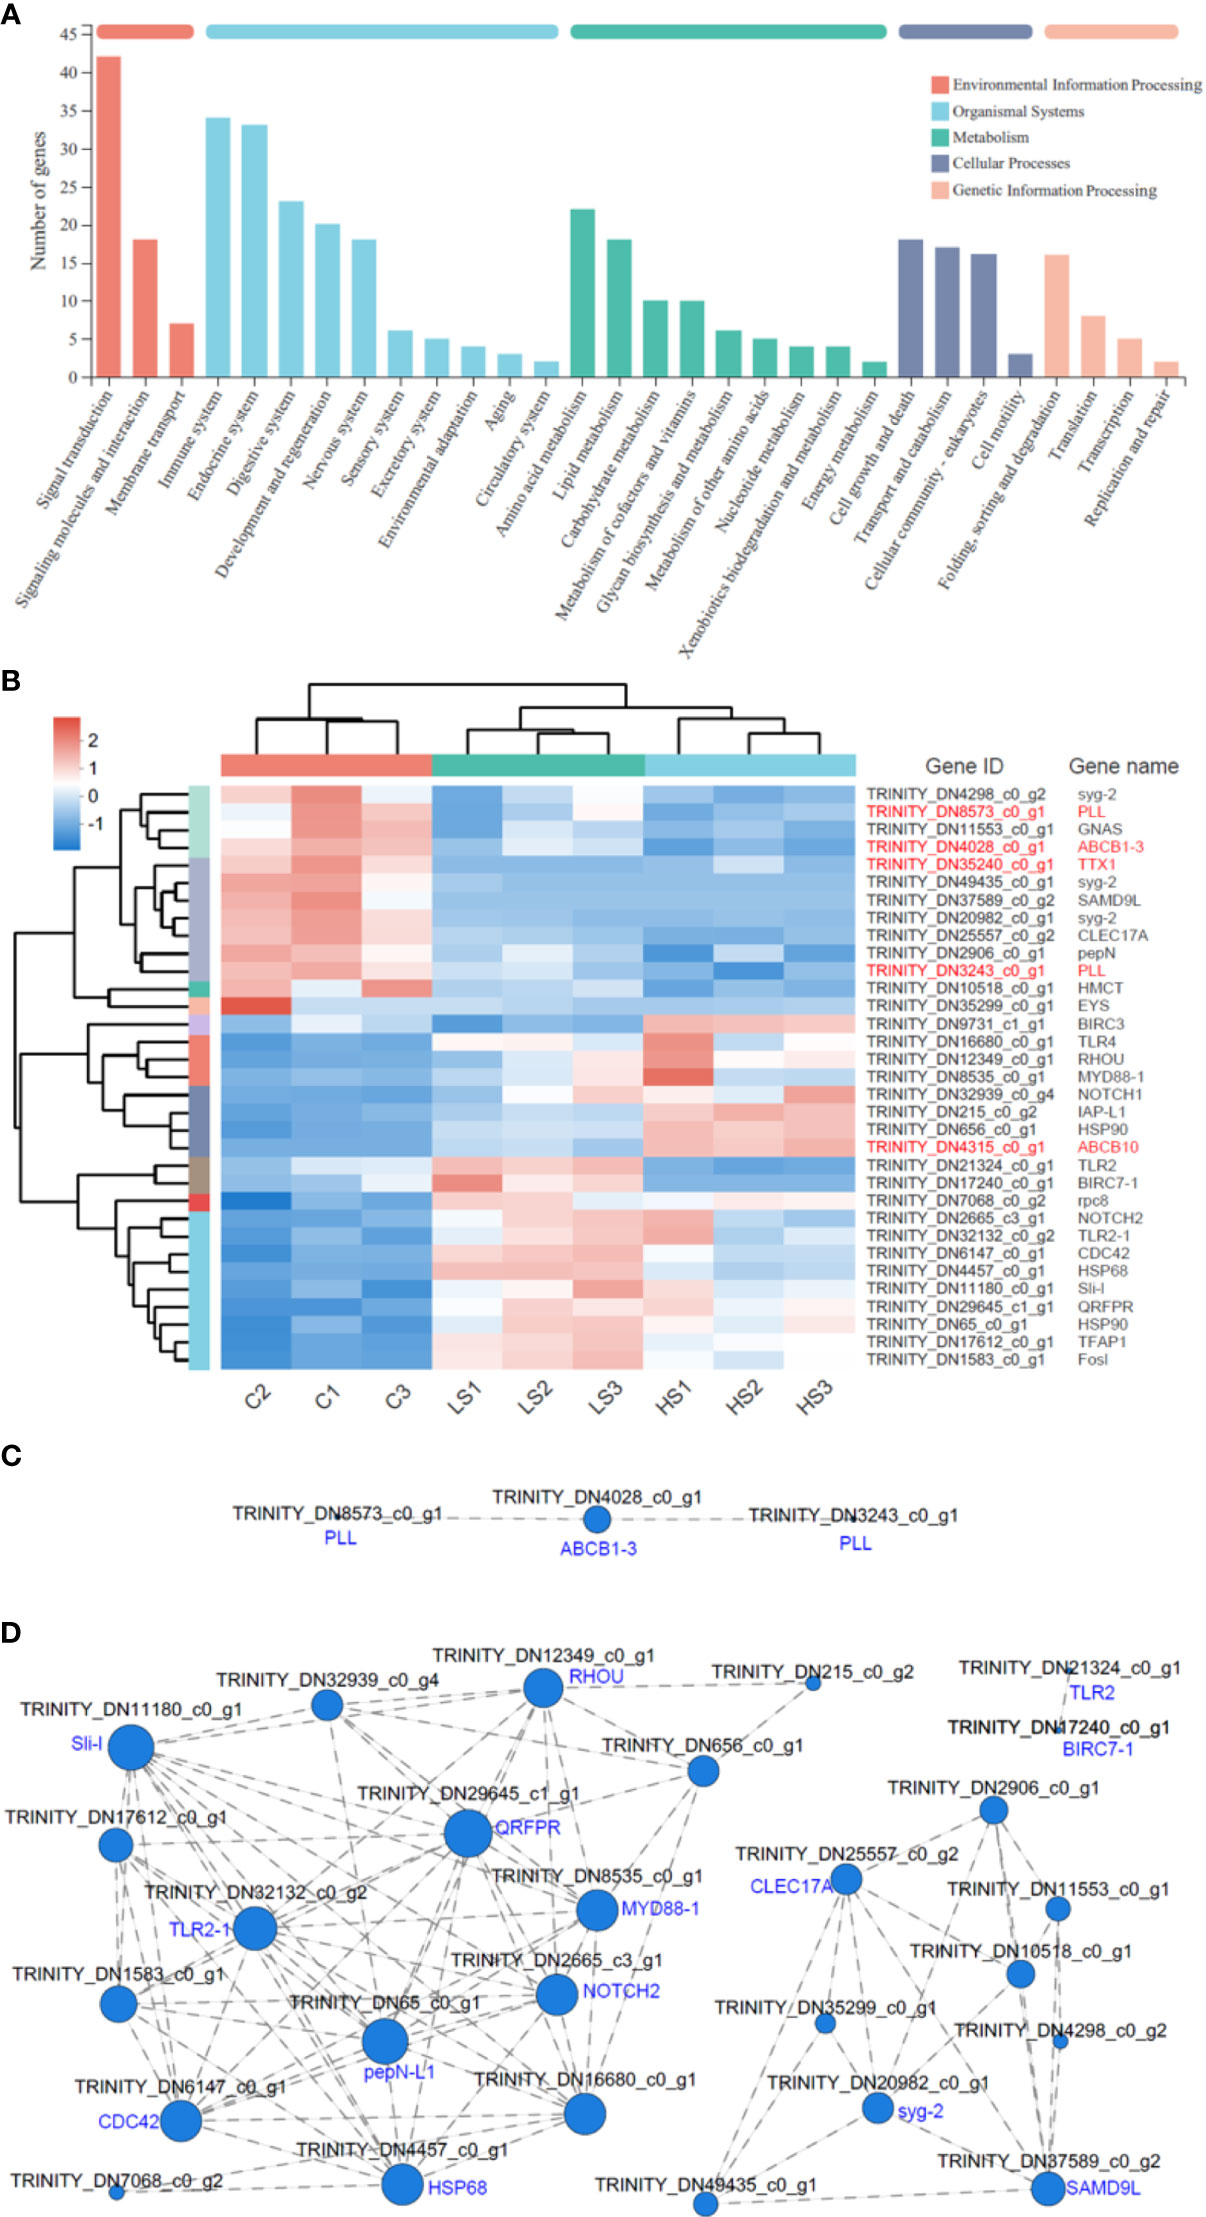
Figure 6 Clustering heat map analysis and the correlation network for expression pattern of genes in membrane transport and the immune system. (A) KEGG functional annotation of DEGs shared by C vs. LS and C vs. HS groups. (B) Expression pattern clustering heat map analysis of genes in membrane transport and the immune system (the red words show the genes involved in membrane transport). (C) Correlation network for expression of genes in membrane transport. (D) Correlation network for expression of genes in the immune system. In (C) and (D), the larger the gene node, the more genes that have expression correlation with the gene.
Figure 7 shows the results about the fold changes detected by qRT-PCR and RNA-Seq expression profiles of 9 randomly selected DEGs. The results showed that the variation trends of the 9 randomly selected DEGs from qRT-PCR were consistent with those determined by RNA-Seq, indicating that transcriptome data were accurate and reliable.
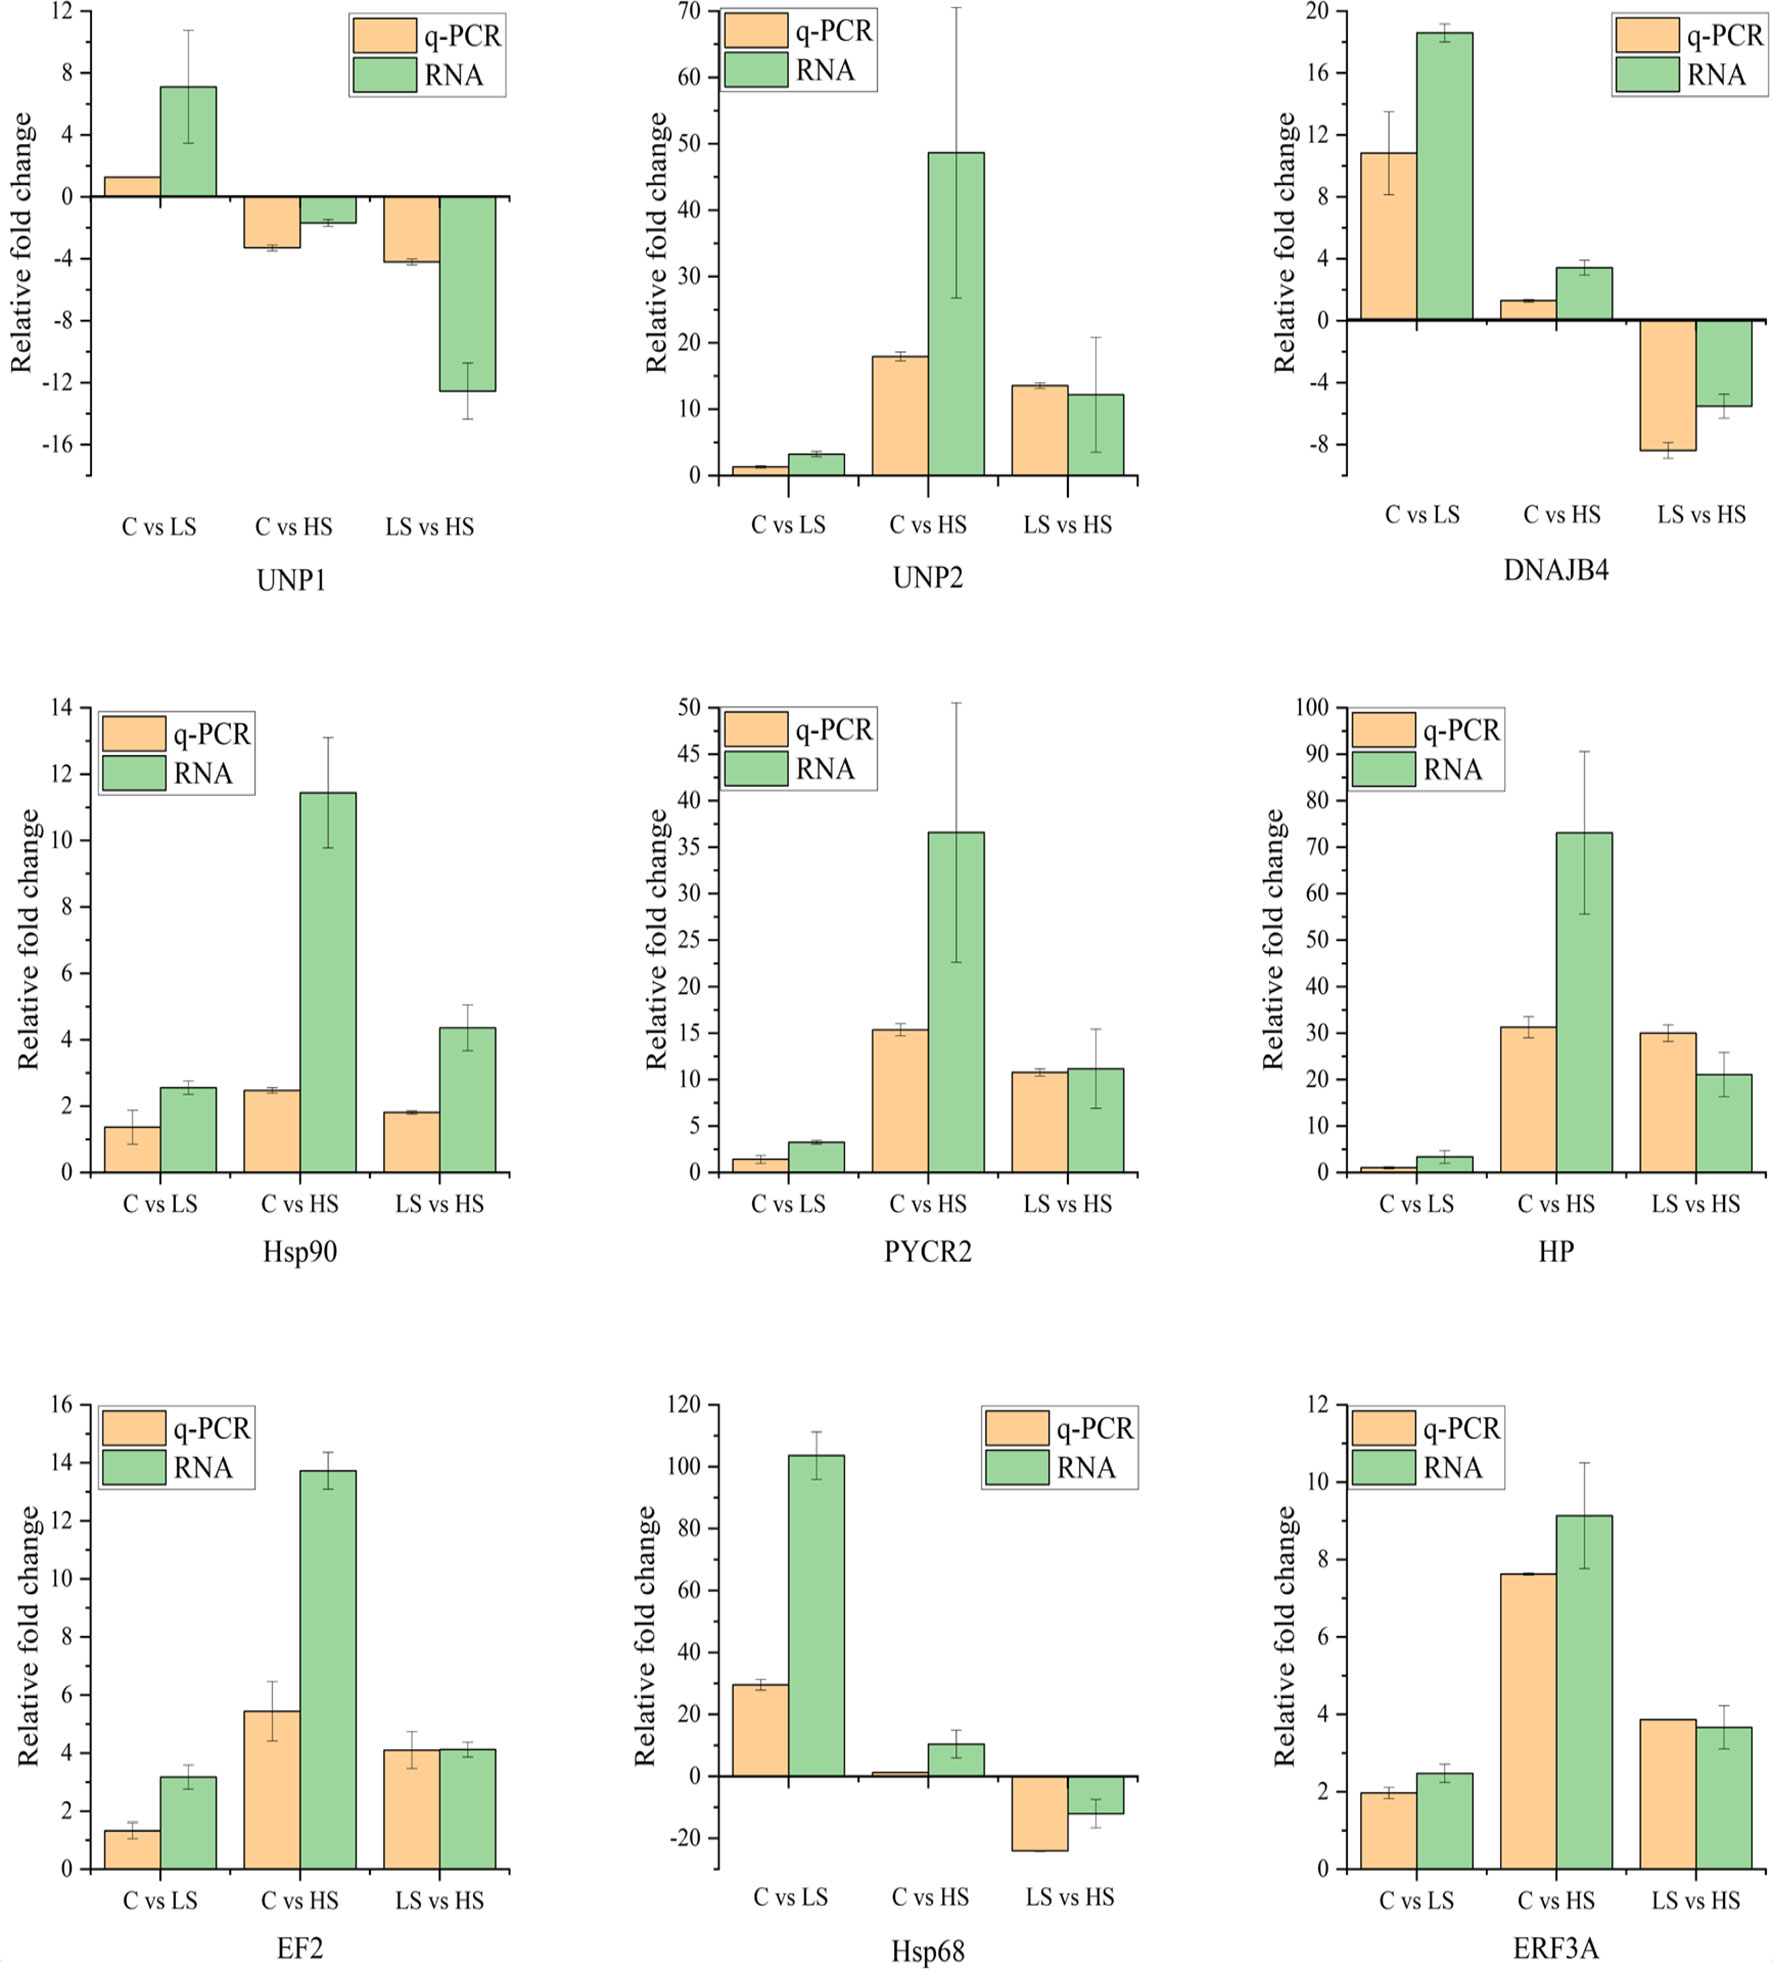
Figure 7 Verification of the selected 9 DEGs by quantitative real-time PCR as compared with RNA-seq data.
In this study, Na+-K+ -ATPase, reduced glutathione (GSH), and glutathione peroxidase (GSH-Px) were measured to evaluate the effect of the acute salinity stress on P. maxima and determine the most suitable time point for transcriptomics analysis. Na+-K+ -ATPase is critical for osmotic regulation, it is an ion channel that could use the energy generated by ATP hydrolysis to drive three Na+ outlets and two K+ intents to maintain membrane potential (Evans and Lambert, 2015; Abdel-Mohsen, 2016). GSH is a tripeptide α-amino acid that participates in the detoxification of hydrogen peroxide by various glutathione peroxidases to protect cells from oxidation, which is the most abundant antioxidant in aerobic cells. (Browne and Armstrong, 1998; Owen and Butterfield, 2010). GSH-Px is an important peroxidase that plays a key role in scavenging of free radicals and cell metabolism, and its main function is to catalyze the reduction of lipid peroxides, free hydrogen peroxide derivatives, and the generation of oxygen (Peña-Llopis et al., 2003; Brigelius-Floh´e and Maiorino, 2013). In this study, the highest value of Na+-K+ -ATPase, GSH, and GSH-Px appeared at 12 h after high salinity stress and then the value returned to the level of the control group at 48 h, while the highest value of Na+-K+ -ATPase, GSH, and GSH-Px appeared at 48 h after low salinity stress. This indicated that P. maxima is more adaptable to high salinity than low salinity and suggested that more attention should be paid to prevent P. maxima from the low salinity stress during the culture of P. maxima. In addition, the time point of 12 h after acute salinity stress was selected for transcriptomics analysis to clarify the transcriptome characteristics of pearl oyster P. maxima in response to acute salinity stress.
Many studies have shown that marine shellfish undergo a series of physiological reactions including signal transduction, osmoregulation, metabolism, immune response, etc. to response salinity changes, and maintain bodily homeostasis (Eierman and Hare, 2014; Gong et al., 2021; Ni et al., 2021). The changes in the salinity will influence the physiological process of marine shellfish, and the changes of osmoregulatory organ deserve special attention because osmotic regulation is related to the adaptation and survival of marine shellfish under salinity stress. In the present study, we analyzed the transcriptional changes of pearl oyster P. maxima under acute high-salinity and low-salinity stress in 12 h from the gill, a critical organ in the osmotic regulation system. The results of this study showed that there were 6613 DEGs and 4395 DEGs in C vs. HS and C vs. LS groups, respectively, and the results of the GO function annotation and KEGG pathway enrichment showed that the annotated DEGs and enriched pathways in C vs. HS group were more than those in the C vs. LS group. In addition, the expression levels of most DEGs in pathways were up-regulated in both the C vs. HS group and C vs. LS group. The above results indicated that there was significant difference in the transcriptional response of P. maxima between the high-salinity group and low-salinity group and advised that the transcriptional response of P. maxima in the high-salinity group was stronger than that in the low-salinity group. In this study, the transcriptional response of the gill of P. maxima under acute salinity stress was described in detail, and the changes of common DEGs in membrane transport and immune function were analyzed with emphasis. The results of this study can provide more ideas and inspiration for future research on the adaptability of pearl oysters to salinity stress. However, how the salinity change is adapted by pearl oyster through the coordination of various systems or organs throughout the whole body still needs further research.
Although most GO terms in the C vs. LS group are the same as the GO terms in the C vs. HS group, the response strategies of P. maxima with different salinity stress were significantly different. Many signaling pathways were observed in the C vs. HS group and the C vs. LS group. Strikingly, NF-kappa B signaling pathway and NOD-like receptor signaling pathway were the common significant enrichment up-regulated signaling pathways in the C vs. HS group and C vs. LS group. Those signaling pathways play a key role in cell response to external stimuli, mainly participation in pathogen recognition and immune response (Kleniewska et al., 2013; Wen et al., 2013). This indicated that both low-salinity stress and high-salinity stress would activate the immune response of P. maxima. In addition, the p53 signaling pathway which participates in differentiation and apoptosis was significant enrichment in the C vs. LS group (up-regulated). Instead, in the C vs. LS group, ‘TNF signaling pathway’ and ‘Toll and Imd signaling pathway’ which participate in inflammatory response and immune response were up-regulated and significant enrichment. The above results indicated that the low-salinity stress would cause greater damage to P. maxima, and P. maxima under high-salinity stress would respond by activating more immune responses.
It is reported that aquatic animals redistribute energy metabolism to regulate physiological homeostasis and cope with environmental stress (Petitjean et al., 2019; Morrell and Gobler, 2020). In aquatic organisms, adenosine-5′-triphosphate (ATP) is the main energy source of cells, which is provided by a series of metabolic pathways, including glycolysis, citrate cycle (TCA cycle), and the electron transport chain (Nelson and Cox, 2005). In this study, several up-regulated DEGs involved in the citrate cycle (TCA cycle) which is one of the most important energy metabolism pathways observed. For example, ATP-citrate synthase isoform X2 (ACLY) and isocitrate dehydrogenase [NADP] cytoplasmic-like (IDH1) were up-regulated in both the C vs. HS group and C vs. HS group. However, we also observed many down-regulated metabolic pathways in this study. For example, most DEGs involved in significantly enriched metabolic pathways like linoleic acid metabolism were down-regulated in both the C vs. HS group and C vs. HS group. Furthermore, DEGs involved in retinol metabolism, steroid hormone biosynthesis, beta-alanine metabolism, metabolism of xenobiotics by cytochrome P450, arginine and proline metabolism, folate biosynthesis, fructose and mannose metabolism, pentose and glucuronate interconversions, tyrosine metabolism, and drug metabolism - cytochrome P450 were down-regulated in the C vs. HS group. These down-regulated genes may substantially impact overall energy metabolism (Anni et al., 2016). This is because salinity stress may lead to the down-regulation of most genes involved in energy material metabolism pathways (Yang et al., 2019). Solan and Whiteley (2016) reported that shellfish would isolate the external environment and internal fluid by tightly closing the shell to provide short-time protection from stressful salinity. The behavior caused by salinity stress would lead to a decrease in the clearance rate of shellfish (Jahromi et al., 2020), resulting in an insufficient oxygen supply, which may be the main reason for the down regulation of the metabolic pathway. In addition, we also found that most genes in the digestive system were down-regulated in this study, which may be because shellfish close their shells, resulting in reduced food intake. Of course, these viewpoints need further experiments to demonstrate. In addition, in marine mollusks, proline and alanine are usually the important FAAs to promote the process of osmotic pressure regulation in cells (Hosoi et al., 2003), and the down-regulated DEGs involved in beta-alanine metabolism and arginine and proline metabolism may be to adapt to the high salinity of the aquatic environment.
Many aquatic animals had the adaptability to the salinity change of the aquatic environment (Kültz, 2005). the adaptive process, such as osmotic pressure regulation in gills is achieved by several ion transporters and ion transport channels, in which lots of genes are involved (Tseng and Hwang, 2008). In the present study, 7 (including 2 uncharacterized protein) common membrane transport-related DEGs were both observed in the C vs. HS group and C vs. LS group. Several DEGs are up-regulated in both the C vs. HS group and C vs. LS group. For example, ABAB10 were up-regulated, which encodes transporters and channel proteins that act as efflux pumps responsible for intracellular homeostasis (Fletcher et al., 2010). However, we also observed many down-regulated DEGs involved in membrane transport. For instance, ABCB1-3 and PLL were down-regulated in both the C vs. HS group and C vs. LS group, and the correlation network for expression of genes in membrane transport shows that the expression of 2 PLL was significantly correlated with the expression of ABCB1-3. These down-regulated DEGs shows that the membrane transport is decreased, and this further confirms that shellfish can isolate the external environment by closing their double shells. In addition, under salinity stress, shellfish may resist the change of salinity through other reactions, such as activating the immune system to regulate the stability of the internal environment (Ertl et al., 2019; Li et al., 2021; Ni et al., 2021).
In addition to their typical roles in osmotic pressure regulation and seawater filtration, gills are also the key organ of oyster innate immunity (Dautremepuits et al., 2009; Zhang et al., 2015). Pearl oyster P. maxima is an invertebrate metazoan, and its innate immunity is the only immunological defense mechanism (Hoffmann and Reichhart, 2002). In addition, phagocytosis by immune cells is the predominant mechanism of P. maxima defense (Ellis et al., 2011). In this study, we observed that immune response was elicited when pearl oyster P. maxima encountered hyper-salinity and hypo-salinity, and there were 34 (including 6 uncharacterized proteins) DEGs involved in the immune system shared by the C vs. HS group and the C vs. LS group. In addition, 27 DEGs of 28 function DEGs were found to have significant correlations with the other (P < 0.05), and there were more than 10 genes related to QRFPR, pepN-L1, TLR2-1, HSP68, RHOU, MYD88-1, NOTCH2, CDC42, and Sli-l. Significantly, QRFPR, TLR2-1, and NOTCH2 are upstream genes of Chemokine signaling pathway, P13K-Akt signaling pathway, and Notch signaling pathway, respectively, which have certain regulatory effects on many downstream genes of the pathway. This may be one of the reasons why QRFPR, TLR2-1, and NOTCH2 become key nodes in the expression network in this study. CDC42 and RHOU are both small GTPase of the Rho-subfamily. CDC42 is the canonical member of the family, and usually regulates many cell functions including cell migration, cell polarity, and cell proliferation (Jaffe and Hall, 2005). RHOU belongs to atypical Rho GTPase, previous studies have shown that RHOU could activate PAK1 and JNK1, and can induce filopodium formation and stress fiber dissolution (Saras et al., 2004; Ory et al., 2007; Brady et al., 2009). In this study, we observed that RHOU and CDC42 are simultaneously enriched in Ras signaling pathway and Chemokine signaling pathway for activating JNK and PAK1, respectively. In addition, QRFPR were also observed in Chemokine signaling pathway, and we also found that RHOU and CDC42 are simultaneously enriched in the T cell receptor signaling pathway and leukocyte transendothelial migration. Those results suggest that RHOU and CDC42 play a vital role in regulation of cell motility and morphology, regulation of actin cytoskeleton, phagocytosis, and inflammatory response of P. maxima under salinity change. MAPK signaling pathway is a signal transduction system for eukaryotic cells to mediate extracellular signals to intracellular responses, and MAPK families play a vital role in regulating complex cellular programs like apoptosis, transformation, development, differentiation, and proliferation (Yue and José, 2020). A plethora of studies have demonstrated that MAPK signaling pathway is important in response to osmoregulation, freezing, and anoxia (Cowan and Storey, 2003; Huang et al., 2009). In this study, RHOU, CDC42, HSP68, and MYD88-1 were up-regulated and enriched in the MAPK signaling pathway, indicating that the pathway was induced. Similar results were also found in the hemocyte of Litopenaeus vannamei under salinity change (Zhao et al., 2015). Heat shock proteins (HSPs) participate in a variety of immune responses and regulate apoptosis in response to environmental stress (Park et al., 2009; Wang et al., 2019b). Many studies have shown that the HSP family genes play a significant role in shellfish response to acute salinity stress (Meng et al., 2013; Hui et al., 2014). In the present study, other than MAPK signaling pathway, we also observed 9 HSP genes (including up-regulated HSP68) enriched in the endocytosis pathway. The main function of HSP68 is uncoating in clathrin-dependent endocytosis. It is noteworthy that RHOU and CDC42 were also enriched in the endocytosis pathway, and they play a critical role in regulating clathrin-independent endocytosis.
In the present study, P. maxima was exposed to acute salinity stress (high-salinity, or low-salinity) and their changes of physiological indexes and molecular response to the salinity stress examined with test kits and RNA-Seq. P. maxima is more adaptable to high salinity than low salinity, and this suggests that more attention should be paid to prevent P. maxima from the low salinity stress. Overall, our results provided large transcriptome data and revealed 11,793 DEGs related to adaption of salinity changes in P. maxima. These findings indicated that the adaptation of P. maxima to changes of salinity is a complex process involving multiple organs and genes, and acute salinity stress has a greater impact on genes involved in signaling pathways, metabolism, membrane transport, and immune system. The results of this study will be of great value in understanding the molecular basis of salinity changes adaptation in the pearl oyster.
The datasets presented in this study can be found in online repositories. The names of the repository/repositories and accession number(s) can be found below: NCBI SRA (accession: SRP365859).
The animal study was reviewed and approved by Animal Careand Use Committee of South China Sea Fisheries Research Institute, Chinese Academy of Fishery Sciences.
HW and MC conceived and designed the project and wrote the manuscript. ZD, YW, GY, and ZM cultured the pearl oyster and collected the samples. WZ, JS, JY, and YL carried out analysis and visualized data. All listed authors have read, edited, and approved the final manuscript.
This work was supported by Key Research and Development Plan Projects in Hainan (ZDYF2021XDNY132), Central Public-interest Scientific Institution Basal Research Fund, South China Sea Fisheries Research Institute, CAFS (NO.2020CY01), Sanya Agricultural Science and Technology Innovation Project (2019NK13), Central Public-interest Scientific Institution Basal Research Fund, CAFS (NO.2021XT02), National Key R&D Program of China (2019YFD0900905), Modern Fisheries Cooperation Projects in China and the Country around the South China Sea, and China Agriculture Research System of MOF and MARA.
The authors declare that the research was conducted in the absence of any commercial or financial relationships that could be construed as a potential conflict of interest.
All claims expressed in this article are solely those of the authors and do not necessarily represent those of their affiliated organizations, or those of the publisher, the editors and the reviewers. Any product that may be evaluated in this article, or claim that may be made by its manufacturer, is not guaranteed or endorsed by the publisher.
The Supplementary Material for this article can be found online at: https://www.frontiersin.org/articles/10.3389/fmars.2022.902595/full#supplementary-material
Supplementary Table 1 | A total of 6613 DEGs of P. maxima exposed to high salinity (40 ppt).
Supplementary Table 2 | A total of 4395 DEGs of P. maxima exposed to low salinity (20 ppt).
Supplementary Table 3 | A total of 1559 DEGs of P. maxima shared by C vs. HS and C vs. LS group.
Abdel-Mohsen H. (2016). Assessment of Respiratory and Ion Transport Potential of Penaeus Japonicus Gills in Response to Environmental Pollution. Mediter. Mar. Sci. 10, 5–18. doi: 10.12681/mms.118
Anggraini R. M., Supii A. L., Suparta G. B., Yusuf Y. (2019). The Effect of pH on the Characteristics of Carbonate Hydroxyapatite Based on Pearl Shell (Pinctada Maxima). Key Eng. Mater. 818, 44–49. doi: 10.4028/www.scientific.net/kem.818.44
Anni I. S. A., Bianchini A., Barcarolli I. F., Varela A. S., Robaldo R. B., Tesser M. B., et al. (2016). Salinity Influence on Growth, Osmoregulation and Energy Turnover in Juvenile Pompano Trachinotus Marginatus Cuvier 1832. Aquaculture 455, 63–72. doi: 10.1016/j.aquaculture.2016.01.010
Balogh R., Byrne M. (2021). Developing in the Intertidal: Effects of Salinity and Temperature on Development to the Pentameral Juvenile Seastar, Parvulastra Exigua. Mar. Biol. 168, 99. doi: 10.1007/s00227-021-03902-2
Brady D. C., Alan J. K., Madigan J. P., Fanning A. S., Cox A. D. (2009). The Transforming Rho Family GTPase Wrch-1 Disrupts Epithelial Cell Tight Junctions and Epithelial Morphogenesis. Mol. Cell. Biol. 29, 1035–1049. doi: 10.1128/MCB.00336-08
Brigelius-Floh´e R., Maiorino M. (2013). Glutathione Peroxidases. BBA-Gen. Subj. 1830, 3289–3303. doi: 10.1016/j.bbagen.2012.11.020
Browne R. W., Armstrong D. (1998). “Reduced Glutathione and Glutathione Disulfide,” in Free Radical and Antioxidant Protocols. Methods in Molecular Biology™, vol. 108. Ed. Armstrong D. (Totowa, NJ: Humana Press). doi: 10.1385/0-89603-472-0:347
Casas S. M., Lavaud R., La Peyre M. K., Comeau L. A., Filgueira R., La Peyre J. F. (2018). Quantifying Salinity and Season Effects on Eastern Oyster Clearance and Oxygen Consumption Rates. Mar. Biol. 165, 1–13. doi: 10.1007/s00227-018-3351-x
Chen Y., Ye B., Niu D., Li J. (2021). Changes in Metabolism and Immunity in Response to Acute Salinity Stress in Chinese Razor Clams From Different Regions. Aquacult. Rep. 19, 100624. doi: 10.1016/j.aqrep.2021.100624
Coughlan B. M., Moroney G. A., Pelt F.N.A.M.V., O’Brien N. M., Davenport J., O’Halloran J. (2009). The Effects of Salinity on the Manila Clam (Ruditapes Philippinarum) Using the Neutral Red Retention Assay With Adapted Physiological Saline Solutions. Mar. Pollut. Bull. 58, 1680–1684. doi: 10.1016/j.marpolbul.2009.06.020
Cowan K. J., Storey K. B. (2003). Mitogen-Activated Protein Kinases: New Signaling Pathways Functioning in Cellular Responses to Environmental Stress. J. Exp. Biol. 206, 1107–1115. doi: 10.1242/jeb.00220
Cui Q. J., Qiu L. H., Yang X. (2019). Transcriptome Profiling of the Low-Salinity Stress Responses in the Gills of the Juvenile Pseudopleuronectes Yokohamae. Comp. Biochem. Phys. D 32, e100612. doi: 10.1016/j.cbd.2019.100612
Dautremepuits C., Marcogliese D. J., Gendron A. D., Fournier M. (2009). Gill and Head Kidney Antioxidant Processes and Innate Immune System Responses of Yellow Perch (Perca Flavescens) Exposed to Different Contaminants in the St. Lawrence River, Canada. Sci. Total Environ. 407, 1055–1064. doi: 10.1016/j.scitotenv.2008.10.004
Deng Y., Fu S., Liang F., Du X., Xie S. (2013). Growth and Survival of Pearl Oyster Pinctada Maxima Spat Reared Under Different Environmental Conditions. J. Shellfish Res. 32, 675–679. doi: 10.2983/035.032.0308
Eierman L. E., Hare M. P. (2014). Transcriptomic Analysis of Candidate Osmoregulatory Genes in the Eastern Oyster Crassostrea Virginica. BMC Genomics 15, 503. doi: 10.1186/1471-2164-15-503
Ellis R. P., Parry H., Spicer J. I., Hutchinson T. H., Pipe R. K., Widdicombe S. (2011). Immunological Function in Marine Invertebrates: Responses to Environmental Perturbation. Fish Shellfish Immun. 30, 1209–1222. doi: 10.1016/j.fsi.2011.03.017
Ertl N. G., O'Connor W. A., Elizur A. (2019). Molecular Effects of a Variable Environment on Sydney Rock Oysters, Saccostrea Glomerata: Thermal and Low Salinity Stress, and Their Synergistic Effect. Mar. Genom. 43, 19–32. doi: 10.1016/j.margen.2018.10.003
Evans A. N., Lambert F. N. (2015). Na+/K+-ATPase α1 mRNA Expression in the Gill and Rectal Gland of the Atlantic Stingray, Dasyatis Sabina, Following Acclimation to Increased Salinity. BMC Res. Notes 8, 219. doi: 10.1186/s13104-015-1216-7
Fletcher J., Haber M., Henderson M., Norris M. D. (2010). ABC Transporters in Cancer: More Than Just Drug Efflux Pumps. Nat. Rev. Cancer 10, 147–156. doi: 10.1038/nrc2789
Gajbhiye D. S., Khandeparker L. (2017). Immune Response of the Short Neck Clam Paphia Malabarica to Salinity Stress Using Flow Cytometry. Mar. Environ. Res. 129, 14–23. doi: 10.1016/j.marenvres.2017.04.009
Garçon D. P., Leone F. A., Faleiros R. O., Pinto M. R., Moraes C. M., Fabri L. M., et al. (2021). Osmotic and Ionic Regulation, and Kinetic Characteristics of a Posterior Gill (Na+, K+)-ATPase From the Blue Crab Callinectes Danae on Acclimation to Salinity Challenge. Mar. Biol. 168, 79. doi: 10.1007/s00227-021-03882-3
Gong J., Li Q., Yu H., Liu S., Kong L. (2021). First De Novo Transcriptome Assembly of Iwagaki Oyster, Crassostrea Nippona, and Comparative Evolutionary Analysis of Salinity-Stress Response Genes in Crassostrea Oysters. Mar. Genom. 56, 100805. doi: 10.1016/j.margen.2020.100805
Han M., Fu Z., Yang R., Qin J. G., Ma Z. (2021). Temperature Significantly Regulates Gene Expressions of Vertebrae Chondrocytes and Osteoblasts in Juvenile Golden Pompano (Trachinotus Ovatus). Front. Mar. Sci. 8. doi: 10.3389/fmars.2021.668522
Hao R., Du X., Yang C., Deng Y., Zheng Z., Wang Q. (2019). Integrated Application of Transcriptomics and Metabolomics Provides Insights Into Unsynchronized Growth in Pearl Oyster Pinctada Fucata Martensii. Sci. Total Environ. 666, 46–56. doi: 10.1016/j.scitotenv.2019.02.221
Hedgpeth J. W., Berger V. J., Kharazova A. D. (1997). Mechanisms of Salinity Adaptations in Marine Molluscs. Hydrobiologia 355, 115–126. doi: 10.1007/978-94-017-1907-0_12
Hochachka P. W., Somero G. (2002). Biochemical Adaptation: Mechanism and Process in Physiological Evolution Vol. 206 (New York: Oxford Univ. Press), 212–213. doi: 10.1242/jeb.00099
Hoffmann J. A., Reichhart J. M. (2002). Drosophila Innate Immunity: An Evolutionary Perspective. Nat. Immunol. 3, 121–126. doi: 10.1038/ni0202-121
Hosoi M., Kubota S., Toyohara M., Toyohara H., Hayashi I. (2003). Effect of Salinity Change on Free Amino Acid Content in Pacific Oyster. Fish. Sci. 69, 395–400. doi: 10.1046/j.1444-2906.2003.00634.x
Huang G., Shi L. Z., Chi H. (2009). Regulation of JNK and P38 MAPK in the Immune System: Signal Integration, Propagation and Termination. Cytokine 48, 161–169. doi: 10.1016/j.cyto.2009.08.002
Hui M., Liu Y., Song C., Li Y., Shi G., Cui Z. (2014). Transcriptome Changes in Eriocheir Sinensis Megalopae After Desalination Provide Insights Into Osmoregulation and Stress Adaption in Larvae. PLoS One 9, e114187. doi: 10.1371/journal.pone.0114187
Jaffe A. B., Hall A. (2005). RHO GTPASES: Biochemistry and Biology. Annu. Rev. Cell Dev. Biol. 21, 247–269. doi: 10.1146/annurev.cellbio.21.020604.150721
Jahromi S. T., Pourmozaffar S., Rameshi H., Gozari M., Nahavandi R. (2020). Evaluation of Hemolymph Biochemical Properties, Clearance Rate, Bacterial Microbiota and Expression of HSP Genes of Gulf Pearl Oyster Pinctada Radiata in Response to Salinity Changes. Fish. Sci. 86, 1055–1065. doi: 10.1007/s12562-020-01459-5
Jeffries K. M., Connon R. E., Verhille C. E., Dabruzzi T. F., Britton M. T., Durbin-Johnson B. P., et al. (2019). Divergent Transcriptomic Signatures in Response to Salinity Exposure in Two Populations of an Estuarine Fish. Evol. Appl. 12, 1212–1226. doi: 10.1111/eva.12799
Kleniewska P., Piechota-Polanczyk A., Michalski L., Michalska M., Balcerczak E., Zebrowska M., et al. (2013). Influence of Block of NF-Kappa B Signaling Pathway on Oxidative Stress in the Liver Homogenates. Oxid. Med. Cell. Longev. 2013, 1–8. doi: 10.1155/2013/308358
Knowles G., Handlinger J., Jones B., Moltschaniwskyj N. (2014). Hemolymph Chemistry and Histopathological Changes in Pacific Oysters (Crassostrea Gigas) in Response to Low Salinity Stress. J. Invertebr. Pathol. 121, 78–84. doi: 10.1016/j.jip.2014.06.013
Kültz D. (2005). Molecular and Evolutionary Basis of the Cellular Stress Response. Annu. Rev. Physiol. 67, 225–257. doi: 10.1146/annurev.physiol.67.040403.103635
Larsen E. H., Deaton L. E., Onken H., O’Donnell M., Weihrauch D. (2014). Osmoregulation and Excretion. Compr. Physiol. 4, 405–573. doi: 10.1002/cphy.c130004
Li E., Wang S., Li C., Wang X., Chen K., Chen L. (2014). Transcriptome Sequencing Revealed the Genes and Pathways Involved in Salinity Stress of Chinese Mitten Crab, Eriocheir Sinensis. Physiol. Genomics. 46, 177–90. doi: 10.1152/physiolgenomics.00191.2013
Liang F., Xie S., Fu S., Li J., Deng Y. (2016). Growth Pattern and Biometric Relationship of Pearl Oyster Pinctada Maxima Cultured in Beibu Bay, China. J. Appl. Aquacult. 28, 110–18. doi: 10.1080/10454438.2016.1172535
Lind C. E., Evans B. S., Knauer J., Taylor J. J. U., Jerry D. R. (2009). Decreased Genetic Diversity and a Reduced Effective Population Size in Cultured Silver-Lipped Pearl Oysters (Pinctada Maxima). Aquaculture 286, 12–19. doi: 10.1016/j.aquaculture.2008.09.009
Li Y., Niu D., Wu Y., Dong Z., Li J. (2021). Integrated Analysis of Transcriptomic and Metabolomic Data to Evaluate Responses to Hypersalinity Stress in the Gill of the Razor Clam (Sinonovacula Constricta). Comp. Biochem. Phys. D 38, 100793. doi: 10.1016/j.cbd.2021.100793
Maynard A., Bible J. M., Pespeni M., Sanford E., Evans T. G. (2018). Transcriptomic Responses to Extreme Low Salinity Among Locally Adapted Populations of Olympia Oyster (Ostrea Lurida). Mol. Ecol. 27, 4225–4240. doi: 10.1111/mec.14863
McDougall C., Aguilera F., Shokoohmand A., Moase P., Degnan B. M. (2021). Pearl `Sac Gene Expression Profiles Associated With Pearl Attributes in the Silver-Lip Pearl Oyster, Pinctada Maxima. Front. Genet. 11. doi: 10.3389/fgene.2020.597459
Meng J., Zhu Q., Zhang L., Li C., Li L., She Z., et al. (2013). Genome and Transcriptome Analyses Provide Insight Into the Euryhaline Adaptation Mechanism of Crassostrea Gigas. PLoS One 8, e58563. doi: 10.1371/journal.pone.0058563
Morrell B. K., Gobler C. J. (2020). Negative Effects of Diurnal Changes in Acidification and Hypoxia on Early-Life Stage Estuarine Fishes. Diversity 12, 25–52. doi: 10.3390/d12010025
Nayfa M. G., Zenger K. R. (2016). Unravelling the Effects of Gene Flow and Selection in Highly Connected Populations of the Silver-Lip Pearl Oyster (Pinctada Maxima). Mar. Genom. 28, 99–106. doi: 10.1016/j.margen.2016.02.005
Nelson D. L., Cox M. M. (2005). Lehninger Principles of Biochemistry. 4th ed Vol. 33 (New York: W.H. Freeman and Company), 74–75. doi: 10.1002/bmb.2005.494033010419
Ni Q., Li W., Liang X., Liu J., Ge H., Dong Z. (2021). Gill Transcriptome Analysis Reveals the Molecular Response to the Acute Low-Salinity Stress in Cyclina Sinensis. Aquacult. Rep. 19, 100564. doi: 10.1016/j.aqrep.2020.100564
Nie H., Jiang K., Jiang L., Huo Z., Ding J., Yan X. (2020). Transcriptome Analysis Reveals the Pigmentation Related Genes in Four Different Shell Color Strains of the Manila Clam Ruditapes Philippinarum. Genomics. 112, 2011–20. doi: 10.1016/j.ygeno.2019.11.013
Ompi M., Kaligis F., Mandagi S., Jensen K. (2018). Effects of Artificial and Natural Materials Ropes as Substrates for Settling and Metamorphosis of Pediveliger Pearl Oyster, Pinctada Maxima (Jameson 1901). IOP Conf. Ser.: Earth Environ. Sci. 162, 12031. doi: 10.1088/1755-1315/162/1/012031
Ory S., Brazier H., Blangy A. (2007). Identification of a Bipartite Focal Adhesion Localization Signal in RhoU/Wrch-1, A Rho Family GTPase That Regulates Cell Adhesion and Migration. Biol. Cell 99, 701–716. doi: 10.1042/BC20070058
Owen J. B., Butterfield D. A. (2010). “Measurement of Oxidized/Reduced Glutathione Ratio,” in protein misfolding and cellular stress in disease and aging. Methods in Molecular Biology (Methods and Protocols), vol. 648 . Eds. Bross P., Gregersen N. (Totowa, NJ: Humana Press). doi: 10.1007/978-1-60761-756-3_18
Park K., Bang H. W., Park J., Kwak I. S. (2009). Ecotoxicological Multilevel-Evaluation of the Effects of Fenbendazole Exposure to Chironomus Riparius Larvae. Chemosphere 77, 359–367. doi: 10.1016/j.chemosphere.2009.07.019
Peña-Llopis S., Ferrando M. D., Peña J. B. (2003). Fish Tolerance to Organophosphate-Induced Oxidative Stress Is Dependent on the Glutathione Metabolism and Enhanced by N-Acetylcysteine. Aquatic. Toxicol. 65, 337–360. doi: 10.1016/s0166-445x(03)00148-6
Petitjean Q., Jean S., Gandar A., Cˆote J., Laffaille P., Jacquin L. (2019). Stress Responses in Fish: From Molecular to Evolutionary Processes. Sci. Total Environ. 684, 371–380. doi: 10.1016/j.scitotenv.2019.05.357
Pourmozaffar S., Tamadoni J. S., Rameshi H., Sadeghi A., Bagheri T., Behzadi S., et al. (2019). The Role of Salinity in Physiological Responses of Bivalves. Rev. Aquacult. 12, 1548–1566. doi: 10.1111/raq.12397
Saras J., Wollberg P., Aspenström P. (2004). Wrch1 Is a GTPase-Deficient Cdc42-Like Protein With Unusual Binding Characteristics and Cellular Effects. Exp. Cell Res. 299, 356–369. doi: 10.1016/j.yexcr.2004.05.029
Solan M., Whiteley N. M. (2016). Stressors in the Marine Environment: Physiological and Ecological Responses; Societal Implications. 1st edn (Oxford, UK: Oxford University Press).
Sun J., Chen M., Fu Z., Yang J., Zhou S., Yu G., et al. (2021). A Comparative Study on Low and High Salinity Tolerance of Two Strains of Pinctada Fucata. Front. Mar. Sci. 8. doi: 10.3389/fmars.2021.704907
Tanner R. L., Faye L. E., Stillman J. H. (2019). Temperature and Salinity Sensitivity of Respiration, Grazing, and Defecation Rates in the Estuarine Eelgrass Sea Hare, Phyllaplysia Taylori. Mar. Biol. 166, 109. doi: 10.1007/s00227-019-3559-4
Taylor J. J., Southgate P. C., Rose R. A. (2004). Effects of Salinity on Growth and Survival of Silver-Lip Pearl Oyster, Pinctada Maxima, Spat. J. Shellfish Res. 23, 375–377. doi: 10.1016/j.seares.2003.11.002
Tseng Y., Hwang P. (2008). Some Insights Into Energy Metabolism for Osmoregulation in Fish. Comp. Biochem. Phys. C 148, 419–429. doi: 10.1016/j.cbpc.2008.04.009
Vanessa C., Etelvina F., Ana M., Gil S., Pereira J. (2014). Tolerance of Venerupis Philippinarum to Salinity: Osmotic and Metabolic Aspects. Comp. Biochem. Physiol. A 171, 36–43. doi: 10.1016/j.cbpa.2014.02.009
Vasquez H. E., Xing Z., Zhan X., Gu Z., Wang A. (2020). Byssal Re-Attachment Behavior in the Winged Pearl Oyster Pteria Penguin in Response to Low Salinity Levels. J. World Aquac. Soc. 52, 457–65. doi: 10.1111/jwas.12744
Velez C., Figueira E., Soares A. M. V. M., Freitas R. (2016a). Combined Effects of Seawater Acidification and Salinity Changes in Ruditapes Philippinarum. Aquat. Toxicol. 176, 141–150. doi: 10.1016/j.aquatox.2016.04.016
Velez C., Figueira E., Soares A. M. V. M., Freitas R. (2016b). Native and Introduced Clams Biochemical Responses to Salinity and pH Changes. Sci. Total Environ. 566-567, 260–268. doi: 10.1016/j.scitotenv.2016.05.019
Wang Z., Liang F., Huang R., Deng Y., Li J. (2019a). Identification of the Differentially Expressed Genes of Pinctada Maxima Individuals With Different Sizes Through Transcriptome Analysis. Reg. Stud. Mar. Sci. 26, 1–7. doi: 10.1016/j.rsma.2019.100512
Wang H., Tang L., Wei H., Lu J., Mu C., Wang C. (2018). Transcriptomic Analysis of Adaptive Mechanisms in Response to Sudden Salinity Drop in the Mud Crab, Scylla Paramamosain. BMC Genomics 19, 1–12. doi: 10.1186/s12864-018-4803-x
Wang Z., Wang Z., Hao R., Li J., Deng Y. (2019b). Screening of Immune Related Genes of Yellow Colored Line of Pinctada Martensii After Nucleus Insertion Operation by Transcriptome Analysis. J. Guangdong Ocean Univ. 39, 9–16. doi: 10.3969/j.issn.1673-9159.2019.06.002
Wei C., Pan L., Zhang X., Xu L., Si L., Tong R., et al. (2019). Transcriptome Analysis of Hemocytes From the White Shrimp Litopenaeus Vannamei With the Injection of Dopamine. Fish Shellfish Immunol. 94, 497–509. doi: 10.1016/j.fsi.2019.09.043
Wen H., Miao E. A., Ting J. P. Y. (2013). Mechanisms of NOD-Like Receptor-Associated Inflammasome Activation. Immunity 39, 432–441. doi: 10.1016/j.immuni.2013.08.037
Woodin S. A., Wethey D. S., Olabarria C., Vázquez E., Domínguez R., Macho G., et al. (2020). Behavioral Responses of Three Venerid Bivalves to Fluctuating Salinity Stress. J. Exp. Mar. Biol. Ecol. 522, 151256. doi: 10.1016/j.jembe.2019.151256
Wullur S., Napitupulu H., Wantania L. L., Ginting E. L., Mamangkey N. G. F., Smolak R., et al. (2020). Molecular Identification of Bacteria Isolated From Culture Medium of the Gold-Lipped Pearl Oyster Pinctada Maxima Larvae. Biodiversitas 21, 5291–5297. doi: 10.13057/biodiv/d211133
Xiao S., Wong N. K., Li J., Lin Y., Zhang Y., Ma H., et al. (2018). Analysis of in Situ Transcriptomes Reveals Divergent Adaptive Response to Hyperand Hypo-Salinity in the Hong Kong Oyster, Crassostrea Hongkongensis. Front. Physiol. 9. doi: 10.3389/fphys.2018.01491
Yang W. K., Chao T. L., Chuang H. J. (2019). Gene Expression of Na+/K+-ATPase α-Isoforms and FXYD Proteins and Potential Modulatory Mechanisms in Euryhaline Milkfish Kidneys Upon Hypoosmotic Challenges. Aquaculture 504, 59–69. doi: 10.1016/j.aquaculture.2019.01.046
Yue J., José M. L. (2020). Understanding MAPK Signaling Pathways in Apoptosis. Int. J. Mol. Sci. 21, 2346. doi: 10.3390/ijms21072346
Zhang H., Hou J., Liu H., Zhu H., Xu G., Xu J. (2020). Adaptive Evolution of Low-Salinity Tolerance and Hypoosmotic Regulation in a Euryhaline Teleost, Takifugu Obscurus. Mar. Biol. 167, 90. doi: 10.1007/s00227-020-03705-x
Zhang M., Li L., Liu Y., Gao X. (2020). Effects of Sudden Drop in Salinity on Osmotic Pressure Regulation and Antioxidant Defense Mechanism of Scapharca Subcrenata. Front. Physiol. 11. doi: 10.3389/fphys.2020.00884
Zhang Y., Sun J., Mu H., Li J., Zhang Y., Xu F., et al. (2015). Proteomic Basis of Stress Responses in the Gills of the Pacific Oyster Crassostrea Gigas. J. Proteome Res. 14, 304–317. doi: 10.1021/pr500940s
Zhao Q., Pan L., Ren Q., Hu D. (2015). Digital Gene Expression Analysis in Hemocytes of the White Shrimp Litopenaeus Vannamei in Response to Low Salinity Stress. Fish Shellfish Immun. 42, 400–407. doi: 10.1016/j.fsi.2014.11.020
Keywords: bivalves, Pinctada maxima, molecular response, biochemical response, salinity
Citation: Wei H, Chen M, Deng Z, Sun J, Yang J, Zhao W, Li Y, Ma Z, Wang Y and Yu G (2022) Transcriptomic Signatures of Pearl Oyster Pinctada Maxima in Response to Acute Salinity Stress. Front. Mar. Sci. 9:902595. doi: 10.3389/fmars.2022.902595
Received: 23 March 2022; Accepted: 15 April 2022;
Published: 24 May 2022.
Edited by:
Fernando Diaz, Center for Scientific Research and Higher Education in Ensenada (CICESE), MexicoReviewed by:
Da Huo, Institute of Oceanology (CAS), ChinaCopyright © 2022 Wei, Chen, Deng, Sun, Yang, Zhao, Li, Ma, Wang and Yu. This is an open-access article distributed under the terms of the Creative Commons Attribution License (CC BY). The use, distribution or reproduction in other forums is permitted, provided the original author(s) and the copyright owner(s) are credited and that the original publication in this journal is cited, in accordance with accepted academic practice. No use, distribution or reproduction is permitted which does not comply with these terms.
*Correspondence: Yu Wang, d2ludGVycm9zZUAxNjMuY29t; Gang Yu, Z3l1MDkyOEAxNjMuY29t
†These authors have contributed equally to this work
Disclaimer: All claims expressed in this article are solely those of the authors and do not necessarily represent those of their affiliated organizations, or those of the publisher, the editors and the reviewers. Any product that may be evaluated in this article or claim that may be made by its manufacturer is not guaranteed or endorsed by the publisher.
Research integrity at Frontiers
Learn more about the work of our research integrity team to safeguard the quality of each article we publish.