 Albert Calbet
 Rodrigo Andrés Martínez
 Enric Saiz1
 Miquel Alcaraz
- 1Institut de Ciències del Mar, CSIC, Barcelona, Spain
- 2Instituto de Fomento Pesquero (IFOP), Puerto Montt, Chile
We exposed Gyrodinium dominans and two strains of Oxyrrhis marina to temperatures well above (25°C) and below (12°C) their maintenance temperature (18°C) to study the mechanisms controlling the overall physiological response to thermal stress. As variables, we measured growth, ingestion, and respiration rates (this latter with and without food). The growth rates of O. marina strains plotted as a function of temperature showed maximum values at the maintenance temperature, as expected in a typical unimodal functional response. However, G. dominans showed similar growth rates at 12 and 18°C, and even a marked decrease in growth rates at 25°C, happened to be not significant. G. dominans ingestion rates were not significantly different at all temperatures (although apparently decreased at 25°C), whereas both O. marina strains showed higher ingestion rates at 18°C. The respiration rates of G. dominans were unaffected by temperature, but those of O. marina strains increased with temperature. The specific dynamic action (respiration increase produced by feeding activity) ranged from 2 to 20% of the daily carbon ingestion for all organisms investigated. The calculated energetic budget indicated that the responses to temperature were diverse, even between in strains of the same species. G. dominans maintained similar growth at all temperatures by balancing metabolic gains and losses. In O. marina strains, on the other hand, the decrease in growth rates at the lowest temperature was driven mainly by reduced ingestion rates. However, increased respiration seemed the primary factor affecting the decrease in growth rates at the highest temperature. These results are discussed in the light of previous studies and on its suitability to understand the response of wild organisms to fluctuations in temperature.
Introduction
Temperature is a key variable affecting most physiological rates of all organisms (Huey and Kingsolver, 1989; Alcaraz et al., 2014; Sinclair et al., 2016). Thus, climate-driven distribution shifts of microplankton, copepod species, and fish have been related to their different thermal sensitivities (Helaouët and Beaugrand, 2007; Takasuka et al., 2008; Wilson et al., 2015). Usually, the changes in survival and physiological rates of an organism due to temperature are represented by a unimodal function (Huey and Kingsolver, 1989; Schulte et al., 2011; Alcaraz et al., 2014; Sinclair et al., 2016), commonly shaped by a progressive increase up to a peak (optimum temperature) from where the decline is more or less abrupt (Van Der Have, 2002; Angilletta, 2006; Sinclair et al., 2016). This graphical representation of the changes in an organism physiology with temperature is the result of the coupling/uncoupling among the different thermal sensitivities of key ecophysiological activities (e.g., feeding, respiration, assimilation, excretion, molting, growth; Alcaraz et al., 2014; Saiz et al., 2022). Thus, understanding how the uncoupling between physiological rates ultimately translates into growth and survival is crucial in predicting organisms’ responses to temperature (Pörtner, 2002; Pörtner and Farrell, 2008; Alcaraz et al., 2014).
For marine protozoans, while the effects of temperature on vital rates are well studied (Hansen et al., 1997; Montagnes et al., 2003; Rose and Caron, 2007), the subjacent processes behind this response are poorly investigated (Kimmance et al., 2006). Marine protozoans, also referred to as microzooplankton, are key components of the marine pelagic food webs because of their role as the main link between primary producers (daily consuming ca. 75% of the oceans’ overall phytoplankton primary production) and higher trophic levels (Calbet, 2001; Calbet and Saiz, 2005; Schmoker et al., 2013), and because their relevance as remineralizers of inorganic nutrients, supporting regenerated primary production (Ikeda et al., 1982; Alcaraz et al., 1994; Alcaraz et al., 1998). Because of these functions in the marine ecosystem, and considering the threat of global change, it is crucial to gather a deeper understanding of how temperature affects the different physiological rates. Only with a better knowledge of these processes we will be able to conduct accurate predictions about the performance, fate, and role in the ecosystem of the different species that assemble marine microzooplankton. In this respect, it will be under thermal stress where the different process rates, with different Arrhenius breakpoints (Alcaraz et al., 2014), may become uncoupled, resulting in overall detrimental effects on growth rates. We can hypothesize that the mechanisms acting at each side of the equilibrium temperature, at which species are adapted, may be different. Given the exponential nature of the relationship between temperature and respiration activity (Q10 concept; e.g., Caron et al., 1986; López-Urrutia et al., 2006) and the physiological upper bounds for ingestion (Aelion and Chisholm, 1985; Kimmance et al., 2006), we can hypothesize that respiration rates will mostly drive the resulting growth rates at high temperatures. At lower temperatures, on the other hand, both respiration and ingestion rates find zero at their lower bound, and it will be the different Q10 of both rates the ones depicting the overall growth response.
To demonstrate this hypothesis, we designed a series of experiments that simultaneously compared the physiological responses of three marine heterotrophic protozoans (Gyrodinium dominans, and two strains of Oxyrrhis marina originated from different locations) at their maintenance temperature (18°C) with those at 12 and 25°C. We chose these temperatures to be apart enough to theoretically show different physiological responses (Calbet and Saiz, 2022), being within reasonable limits of the temperature fluctuation likely experienced by the species in nature (Estrada et al., 1993; Calbet et al., 2015; Hobday et al., 2016; Oliver et al., 2018).
Methods
The Cultures
As experimental organisms we used one strain of Gyrodinium dominans isolated by H.H. Jakobsen in 1996 from the northern part of Øresund (Denmark; Hansen and Daugbjerg, 2004), one strain of Oxyrrhis marina MED isolated by A. Calbet off Barcelona coast (NW Mediterranean) in 1996, and one strain O. marina CRB (purchased from the SCCAP Denmark; code SCCAP-0592) that originates from the Great Bay Salt Pond in St Maarten (Dutch Caribbean). All were kept in autoclaved 0.2-µm filtered seawater with added trace metals and EDTA (0.003 mL of f/2 metal stock solution per liter of suspension, Guillard1975), at 18°C and 38 salinity, under dim light and fed with Rhodomonas salina. The strains that originated from places with different temperatures and salinity from our laboratory standard conditions (Mediterranean waters) had been gradually adjusted for months. The prey, R. salina strain K-0294 (RHO; range ESD: 6.3-6.5 µm), was obtained from the Scandinavian Culture Collection of Algae and Protozoa at the University of Copenhagen, and it has been growing in our laboratory for years. The prey were kept in f/2 medium (Guillard, 1975), under exponential growth conditions, at 18°C, 38 salinity, 100-200 µE m-2 s-1, and a light:dark cycle of 12h.
The Experimental Setup
We concurrently estimated the protozoan growth, ingestion, and respiration rates from the same incubation bottles incubated at 12, 18, and 25°C, being 18°C the maintenance temperature for all the cultures. Prior to the experiments, the grazers were kept in 2-4 L Pyrex glass bottles fed ad libitum with R. salina at their maintenance temperature (18°C). We calculated the amount of prey offered on the last day of feeding to be mostly depleted after 24h. Then, we gently concentrated the dinoflagellates by gravity filtration through a 3-µm polycarbonate filter to remove the excess of bacteria and detritus, re-suspended them in 0.2-µm filtered seawater, and pre-conditioned them (without food) for 24 hours to the experimental temperature (12, 18 and 25°C). All incubations were conducted in quadruplicate 130 mL Pyrex glass bottles, in darkness, at 16, 18, and 25°C (in temperature-controlled incubator baths), and lasted for 24 hours. Dinoflagellate density in the incubations was ca. 3000-4000 ind mL-1. In the treatments with food, R. salina was added at a concentration of ca. 100000 cells mL-1 to ensure saturated food conditions (Calbet et al., 2013). In parallel, we set suspensions only with the prey at the same concentration as the previous one (grazer + prey) to serve as controls for the growth of the algae. We added 10 mL of f/2 per liter of suspension (i.e., a final nutrient concentration equivalent to f/200) to override microzooplankton excretion effects on the algae. The concentrations and cellular volumes of prey and grazer were estimated with a Multisizer III particle counter. To calculate grazing rates and average prey concentrations, we used Frost’s equations (Frost, 1972), and per capita values were calculated using the average concentration of grazers in each replicate (Heinbokel, 1978). The corresponding volume to carbon (C) equivalence was obtained from Calbet et al. (2013), which provides elemental content/volume for the same strains in similar degree of starvation as in our treatments (Table 5 of Calbet et al., 2013).
Oxygen concentration was monitored using optical oxygen sensors (Oxygen Dipping Probe DP-PSt3, Presens®), at a measuring frequency of 15 min, with a setup similar to the one described in Almeda et al. (2011). The respiration activity of the three dinoflagellates was measured in the presence and in the absence of food. The previously described control bottles with only R. salina were used to account for changes in oxygen concentration due to the presence of prey alone, whereas an additional set of bottles filled with only 0.2 µm filtered seawater served as background control. In the case of both the prey and the grazers incubated alone in filtered seawater, oxygen consumption rates (μmol O2 d-1) were estimated as the slopes of the linear regression equations relating incubation time and dissolved oxygen concentration, after correcting for any changes in dissolved O2 observed in the extra bottles with only filtered seawater. Cell-specific respiration rates (µmol O2 cell-1 d-1) were then calculated by dividing the experimental oxygen consumption rates per bottle by the average cell concentration during the incubation.
In the case of the grazers incubated with prey, the oxygen consumption observed in the bottles resulted from the combined respiration of the grazers (heterotrophic dinoflagellates) and the prey. For this reason, before calculating the actual per capita consumption by the feeding dinoflagellates, we had to subtract the decline in oxygen concentration (incubations were in darkness) due to the presence of R. salina. To do so, we first determined the R. salina growth rates based on the initial and final cell concentrations using an exponential growth model; then, we estimated the average cell concentrations at each oxygen-measurement time interval. Next, we applied the cell-specific R. salina respiration rates from the incubations in filtered seawater to the actual R. salina concentration in the grazing bottles, estimated at each measuring time interval, and computed the expected oxygen concentration decrease in the incubations with feeding grazers due to the presence of R. salina. We then subtracted the oxygen consumption by R. salina from the time series of oxygen concentrations in the incubation bottles with the mixture of predator and prey, and estimated the oxygen respiration rates of the feeding dinoflagellates from the slope of changes in the remaining dissolved oxygen through time. The per capita respiration rate of the dinoflagellates under the presence of food was calculated taking into account the mean number of dinoflagellates incubated assuming exponential growth.
To calculate Q10 coefficients, we first conducted a simple linear regression analysis between the inverse of temperature (1/T, in Kelvin degrees) and the natural logarithm of the carbon-specific physiological rate (i.e., the Arrhenius plot). Then, the activation energy was calculated from the slopes of the linear fit as Ea = –slope x R, where R is the universal gas constant (8.3145 J mol-1 K-1). Finally, Q10 coefficients were calculated from Ea as Q10 = exp(Ea/R x 10/Tm2), where Tm is the mean for the range of temperatures over which the organisms have been exposed (i.e., between 12 and 25°C) (Raven and Geider, 1988).
The oxygen consumption rates were converted into C losses using a respiratory quotient of 0.97 (Omori and Ikeda, 1984). Gross-growth efficiency (GGE) was calculated as in Kiørboe et al. (1985), dividing the growth rates by the ingestion rates in specific C units and expressed as percentage. Assimilation efficiency (AE) was calculated as AE = 100 x (µC+RC)/IC (where µC and IC are the C-specific growth and ingestion rates, respectively, and RC is the respiratory carbon losses also expressed as C specific; Kiørboe et al., 1985). Specific dynamic action (SDA; the increase of respiration rates produced in the presence of food) was calculated as the difference between C-specific respiratory losses between feeding and non-feeding grazers, and expressed as % of C ingested daily.
Results
Growth and Ingestion Rates, and Gross-Growth Efficiency
The growth rates of G. dominans were not significantly different at any of the temperatures tested (ANOVA and Tukey’s test), although the rates dropped to less than half at 25°C (Figure 1A). O. marina MED showed growth rates higher at 18°C, and reduced at 12°C (albeit not significantly different from 18°C, Tukey’s test) and 25°C (p<0.01, Figure 1A). In the case of O. marina CRB, 12°C drastically decreased the growth rates to negative values (mortality); on the other hand, at 18°C the growth rates were reasonably high (more than one doubling per day), while they dropped significantly at 25°C (ANOVA, Tukey’s test, p<0.01; Figure 1A).
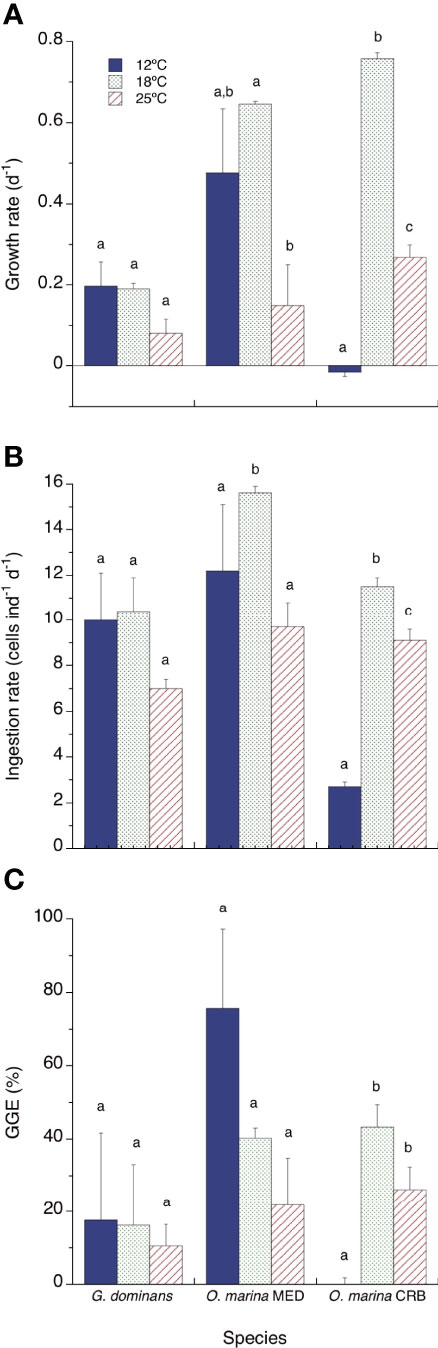
Figure 1 Growth rates (A, d-1), ingestion rates (B, cells ind-1 d-1) and growth gross efficiencies (C, GGE %) of the three protozoans investigated at 12, 18 and 25°C. Statistical differences (p<0.05) within each species are indicated by different letters. The error bars are SE. For GGE, the SE have been calculated using the square root formula for error propagation.
All the strains studied showed a similar pattern of ingestion rates, with peaks at 18°C and lower rates at 12 and 25°C (Figure 1B). However, only O. marina strains showed significant differences in ingestion rates between temperatures (ANOVA, Tukey’s tests, p<0.01). Regarding GGE, there was a tendency to be inversely related to temperature for G. dominans and O. marina MED, but it was not statistically significant due to the high associated error (Figure 1C). There were significant differences for O. marina CRB, between the GGE at 12°C (zero because of the lack of growth at this temperature) and the rest of the values at higher temperatures (ANOVA, Tukey’s tests, p<0.01; Figure 1C).
Respiratory Activity
The respiration rates of G. dominans were not significantly different at the temperatures investigated, neither for starved nor for fed organisms (Figure 2A; Two-way ANOVA, Tukey’s tests). However, respiration rates of this species with food were always significantly higher than those without food (Figure 2A; Two-way ANOVA, p< 0.001). O. marina MED respiration rates were significantly different between starved and fed organisms, and the rates at 12 and 18°C were different from those at 25°C, both in starving and fed treatments (Two-way ANOVA, Tukey’s test, p<0.001; Figure 2B). The respiration rates for starving and fed O. marina CRB were not statistically different (Two-way ANOVA; Figure 2B), and within treatment, the rates were different between 12 and 25°C and between 18 and 25°C (Tukey’s test, p<0.001; Figure 2C).
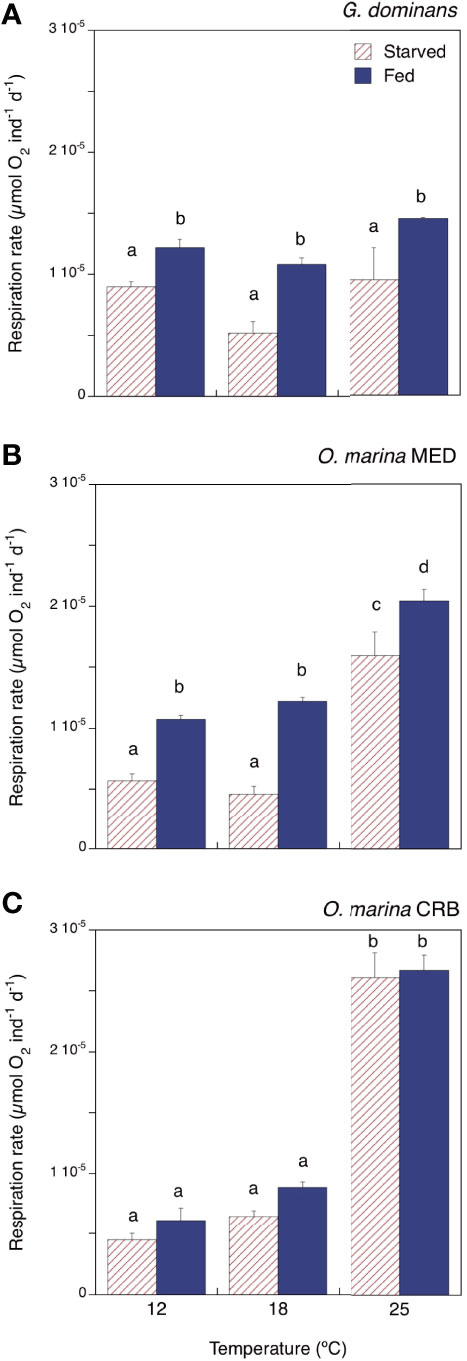
Figure 2 Respiration rates (µmol O2 ind-1 d-1) of starved and fed (A) G dominans, (B) O. marina MED, and (C) O. marina CRB at the different temperatures investigated. Statistical differences (p<0.05) within each species are indicated by different letters. The error bars are SE.
The respiratory activity of the grazers under starving conditions rendered 8 to 82% of the C biomass respired daily, the highest for O. marina CRB at 25°C and the lowest for O. marina MED at 12°C (Table 1). The metabolic cost associated with the feeding process (SDA) ranged from 2 to 20% of the C ingested, with the maximum for G. dominans at 25°C, and the minimum for O. marina CRB at the same temperature (Table 1). G. dominans showed an increase of SDA with temperature, whereas in O. marina strains this pattern was not evident. In the case of O. marina CRB, we provide SDA values in Table 1, even if the presence of food during the incubations did not significantly enhance respiratory activity. The Q10 values of the respiration rates between 12 and 25°C for starved and fed organisms are also provided in Table 1. G. dominans was the species showing the lowest Q10 coefficients; O. marina MED showed intermedium values, with Q10 higher for starved organisms than for fed ones (Table 1). Overall, the maximum Q10 found in the study corresponded to O. marina CRB starved, followed by fed organisms.
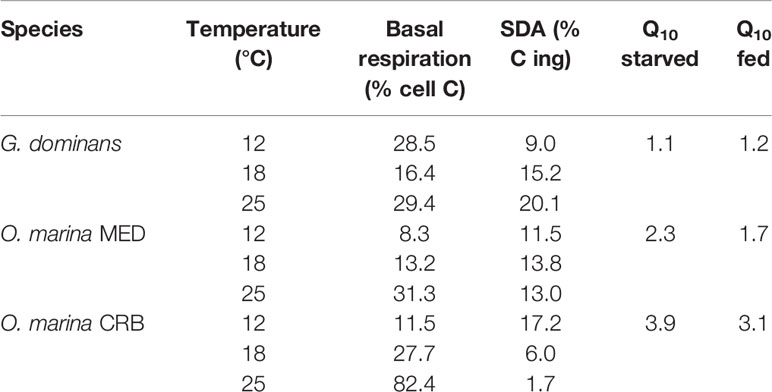
Table 1 Basal respiration of starved organisms as % of the cell carbon, specific dynamic action (SDA) as % of the carbon ingested, and Q10 for starved and fed organisms at the three temperatures investigated.
Energetic Budget
The allocation of the C ingested per organism and temperature is presented in Table 2. Approximately half of the C ingested (46-69%, depending on temperature) was assimilated by G. dominans. From the C biomass incorporated per day, roughly 2/3 were respired at 12 and 18°C (85% at 25°C), and 15-36% was converted into somatic growth at all temperatures (Table 2). O. marina MED assimilated nearly all C ingested at the highest and lowest temperatures (approx. 60% at 18°C; Table 2), incorporating an equivalent to about its biomass per day at 18°C and half of it at the highest and lowest temperatures. Only 25-35% of the C assimilated was respired at 12 and 18°C, and 73% at 25°C. The remaining C was allocated to growth (Table 2). Finally, the combination of ingestion rates and assimilation efficiencies of O. marina CRB resulted in daily C incorporations equivalent to, and even slightly more than, its C biomass at 18 and 25°C, but this quantity reduced to 16% of its biomass at 12°C. The low amount of C ingested at 12°C by this protozoan was respired completely, about 1/3 was respired at 18°C, and a about 82% at 25°C. The C used for growth was lower at 25°C compared to 18°C (Table 2).
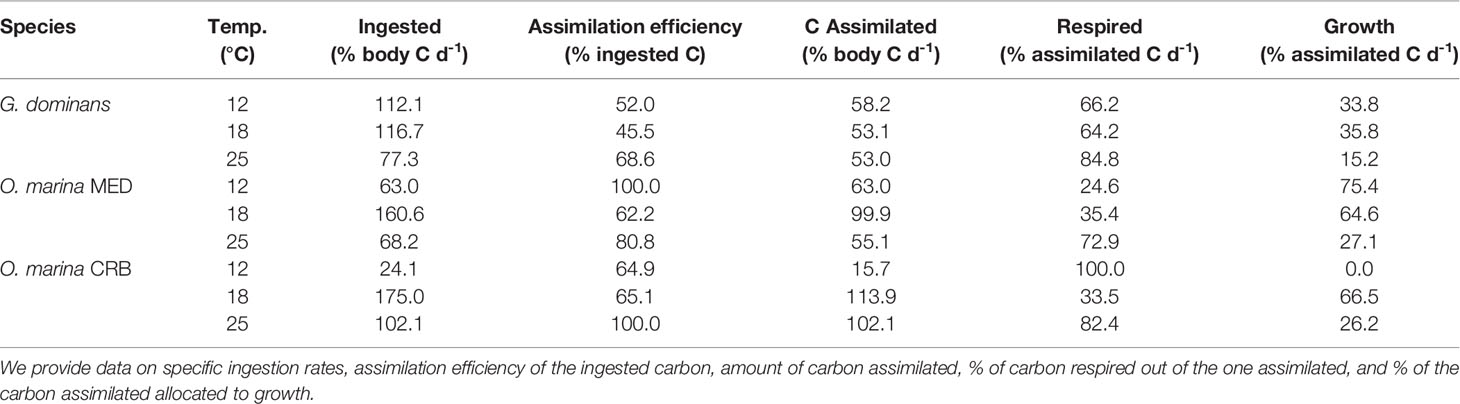
Table 2 Metabolic balance of the three protozoans studied at the three selected temperatures.
To stress the relative effects of temperature on the different physiological rates, we show in Figure 3 a graphical summary of the results presented in Figures 1, 2. This figure does not intend to report the effects of temperature on the different rates again, but to provide a snapshot of the magnitude and sign of the effects of low and high temperatures on the different physiological variables measured, compared to those at 18°C. This analysis will be instrumental to understand each variable’s weight in explaining the effects on growth rates due to temperature changes. G. dominans was the species showing the lowest effects of temperature, these being only evident (although not significant) at 25°C. O. marina CRB is the species showing larger variations in the different physiological rates with temperature variations, particularly at 25°C (Figure 3C). In general, ingestion rates are always negatively affected by higher and lower temperatures, compared to the control at 18°C, and respiration only clearly increases at 25°C (Figure 3). Regarding these two last variables, the effect of an increase of temperature on respiration rates is always more acute than that on ingestion rates for O. marina strains (Figures 3B, C); at the lowest temperature, the effect seems to be the opposite (Figures 3B, C). Finally, AEs are often increased when the temperature is higher and lower than 18°C.
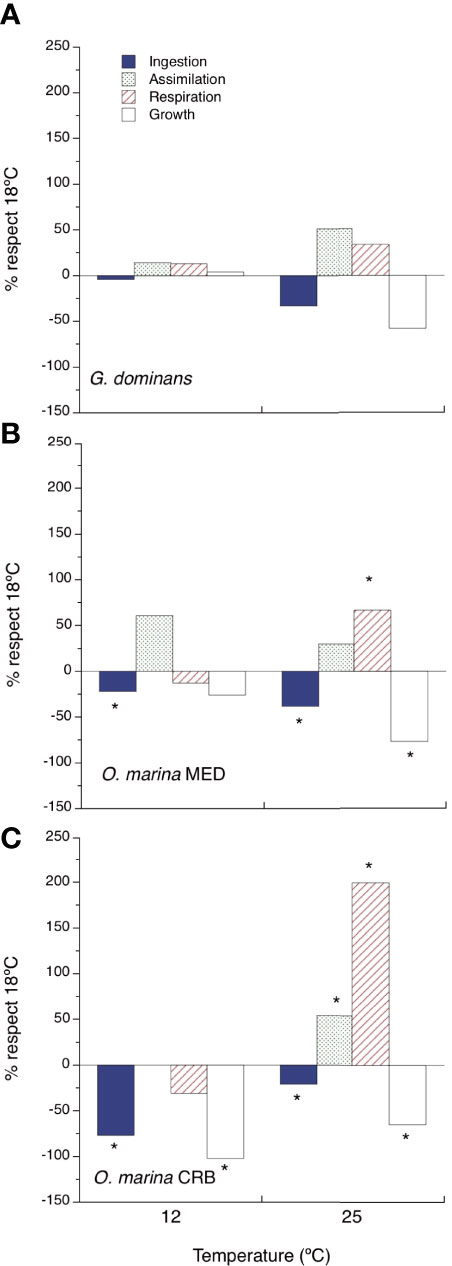
Figure 3 Relative effects of temperature on the metabolic balance. The figure shows the percentage of change respect to 18°C for different metabolic rates at 12 and 25°C. (A) G dominans, (B) O. marina MED, and (C) O. marina CRB. Asterisks indicate significant differences (p<0.05, ANOVA).
With knowledge of the different physiological parameters of all species pooled together, we attempted to find relationships between specific ingestion rates, respiration rates, and growth rates (d-1). We only found significant relationship for specific ingestion rates (ING) and growth rates (GR). The linear regression of this variable with growth rates explained 62% of the variance on growth rates (GR = 0.431 x ING - 0.126).
Discussion
Unveiling the Processes Behind Growth at Different Temperatures
The main objective of this work was to shed light on the different metabolic processes acting under temperature stress in marine protozoans. To do so, we chose some representative species and exposed them to temperatures above and below that of maintenance. Overall, it seems the direct effects of temperature on ingestion rates are the major driver of growth in the species tested, but a closer look at the effects of temperature on both sides of the maintenance temperature gives some clues on the actual mechanisms taking place there.
G. dominans was the species less responsive to temperature changes. This protozoan was able to balance the variations in ingestion rates by modifying the assimilation efficiency (AE) and kept the respiration relatively stable despite the variations of temperature, balancing the metabolic gains and losses to maintain roughly similar growth at all the temperatures. For the O. marina strains, the adverse effects of both higher and lower temperatures were too strong to be dampened by increasing AE. In these strains, the decrease in growth rates at the lowest temperature was driven mainly by reduced ingesta. However, increased respiration was the primary factor affecting growth rates at the highest temperature. Interestingly, the growth of the Caribbean strain of O. marina (CRB) was more impaired by lower temperatures, whereas the Mediterranean one (MED) was more affected by higher temperatures. Also, Calbet et al. (2013) stressed the phenotypic differences between these strains in terms of feeding rates, gross growth efficiency (GGE), and biochemical composition. Our results point towards deeply rooted adaptations at each environment inhabited by the different strains of O. marina that were not modified by the long-term conditioning to our laboratory conditions. It can, then, be concluded that diversity among strains, originating from different habitats, can be as significant as species themselves when responding to temperature changes. Several authors also reached a similar conclusion for other variables and found significant differences in behavior, toxic capacity, and biochemical composition among different strains of dinoflagellates (Loret et al., 2002; Adolf et al., 2008; Calbet et al., 2011).
One variable that we did not consider relevant when placing our hypotheses was AE. We had previous knowledge that AE depended on ingestion rates; higher ingestions tended to lower the AE and the other way around (Kiørboe et al., 1985; Straile, 1997; Schmoker et al., 2011). We did not expect this variable to depend on temperature (Rogerson, 1981; Caron et al., 1986). We should keep in mind, however, that if AE is not directly measured but calculated based on ingestion, respiration, and growth rates, and these rates are dependent on temperature, a relationship between AE and temperature could theoretically arise. This was not our case, likely because of the opposite effects of ingestion and respiration on growth.
Specific Dynamic Action (SDA) was another important variable of our study for which we did not find a relationship with temperature, except for G. dominans. It was surprising that this energetic expenditure was not related to feeding because, theoretically, it results from feeding activity (Kiørboe et al., 1985). However, given the large number of physiological processes involved in the SDA energetic budget: feeding, digestion, absorption, biomass formation, etc. (Krebs and Allison, 1964; Bayne and Scullard, 1977; Tandler and Beamish, 1979), all of them with its particular response to temperature, it may well be any relationship between SDA and ingestion rates being masked by the effects of temperature. Actually, Kiørboe et al. (1985) suggested for marine copepods that SDA is largely related to biosynthesis and transport, and that other processes, such as feeding, gut activity, amino acid oxidation, and excretion are of minor importance. SDA, therefore, represents the ‘cost of growth’ rather than the ‘cost of feeding’.
Previous Studies and a Caution Note on the Use of Biomass for Calculations
To our knowledge, there is no previous report including the many physiological rates for several protozoan species at various temperatures shown here. However, there are references to particular data to compare with ours. For instance, Calbet et al. (2013) reported comparable growth, grazing, and respiration rates at 18°C for the same species studied here. Likewise, they found similar AEs and GGEs. On the other hand, on a latter study with the same species adapted to 16, 19, and 22°C, Calbet and Saiz (2022) found slightly higher growth and ingestion rates. Schmoker et al. (2011) calculated the metabolic balance of G. dominans at 17°C under different food conditions. The growth, ingestion, and respiration rates found in that study were somehow higher than ours, but their estimated GGEs and AEs are within the range found here. Kimmance et al. (2006) exposed O. marina to different concentrations of prey (Isochrysis galbana) and temperatures. For well-fed organisms, they observed a bell-shaped response for specific growth rates, although with maximum around 25°C; this maximum shifted towards lower temperatures when food was not so abundant. Overall, their reported specific growth and ingestion rates were slightly higher than ours. Finally, the Q10 values we report for respiration are within the average for marine protozoa (Verity, 1985; Caron et al., 1986). We did not find literature on SDA of protozoans, but our data fit well within the limits found for ectotherms (Kiørboe et al., 1985; Secor, 2009).
When comparing our results with previous reports, we should consider the distinct methodologies, strains, and previous history of the organisms used in the different experiments, which may introduce variability and explain some of the differences between studies. Therefore, perfect matches are not expected. Another source of variability between studies is found in the biomass assessment. For such purpose, it is common to use previously published volume-to-C relationships (e.g., Menden-Deuer and Lessard, 2000) or even simply take the average C contents per organism from other studies. As stated in the methods section, our calculations on metabolic budgets are based on volumetric conversion factors obtained for the same strains in our laboratory (Calbet et al., 2013). The selection of the conversion factors will undoubtedly affect the final data. Therefore, it is always advisable to conduct specific elemental content analyses for each particular experiment. We must be aware, however, of another important aspect seldom considered that relates to the C-conversion factors. Protozoans that show a certain degree of body plasticity tend to increase their volume when feeding (Calbet et al., 2013). This augmentation of the cellular volume could be misinterpreted as growth, but in fact it is produced by an accumulation of undigested prey in the cell vacuoles and not by an actual increase in the biomass of the grazer. For growth calculations, then, it is important to avoid using the volume of fed organisms, and rely only on cell abundance. If conversion to biomass is required, our advice is to use the biomass of the protozoans that have had time to empty the cell vacuoles (Calbet et al., 2013; Calbet and Saiz, 2022).
Concluding Remarks: Are Our Results of Any Ecological or Predictive Use?
We have shown how the response of the different physiological rates to temperature is species- and strain-dependent. Despite so, some overall conclusions can be reached. It seems temperature-mediated effects on ingestion rates are relatively well translated into growth in marine protozooplankton. In this regard, ingestion rates seem to be driving the growth rates at lower-than-equilibrium temperatures. However, respiration rates appeared largely uncoupled at higher temperatures and are likely an important factor responsible for the observed decrease in growth rates.
Notwithstanding the effect we observed of high temperatures on the performance of protozooplankton, it is important to stress that our intention was not to address the effects of climate change on physiological rates of this group of organisms. For such purpose, long-term adaptations and narrower ranges of temperatures are advised (Calbet and Saiz, 2022). We limited our study to a narrow range of temperatures that the organisms could naturally experience. Oscillations of 5-6°C below and above a given temperature can be found in nature. For one side, in temperate and tropical seas, the differences between upper and lower layers of the thermocline can encompass (and surpass) such thermal gradient (Estrada et al., 1993; Calbet et al., 2015); vertical water masses displacements, eddies, and even vertical migration in some species may produce, then, these thermal exposures in short periods. Moreover, temperature rises of 1-5°C and durations of at least five consecutive days are expected during heatwave episodes (Hobday et al., 2016; Oliver et al., 2018). In the Mediterranean Sea, the increases are exceptionally high, 2-4°C, and are expected to increase in amplitude along with the water temperature rise due to climate change (Oliver et al., 2019). Therefore, even if not our original intention, the data presented in this study may help answering particular questions about the future effects of climate change on marine planktonic ecosystems.
Data Availability Statement
Publicly available datasets were analyzed in this study. This data can be found here: https://doi.org/10.20350/digitalCSIC/14561.
Author Contributions
AC and RM contributed to the conception and design of the study. RM conducted the experiments. All the authors contributed to the data analysis and interpretation of the results. AC wrote the manuscript and all the authors contributed to the manuscript revision. All authors contributed to the article and approved the submitted version.
Funding
This research was funded by Grant PID2020-118645RB-I00 by Ministerio de Ciencia e innovación (MCIN)/AEI/10.13039/501100011033 and by “ERDF A way of making Europe”. The open access publication fee was partially covered by the CSIC Open Access Publication Support Initiative through its Unit of Information Resources for Research (URICI). It is a contribution of the Marine Zooplankton Ecology Group (2017 SGR 87). With the institutional support of the ’Severo Ochoa Centre of Excellence’ accreditation (CEX2019-000928-S).
Conflict of Interest
The authors declare that the research was conducted in the absence of any commercial or financial relationships that could be construed as a potential conflict of interest.
Publisher’s Note
All claims expressed in this article are solely those of the authors and do not necessarily represent those of their affiliated organizations, or those of the publisher, the editors and the reviewers. Any product that may be evaluated in this article, or claim that may be made by its manufacturer, is not guaranteed or endorsed by the publisher.
Acknowledgments
We thank Dr. H. H. Jakobsen for providing the strain of G. dominans, and the reviewers for greatly improving the manuscript with their comments.
References
Adolf J. E., Bachvaroff T., Place A. R. (2008). Can Cryptophyte Abundance Trigger Toxic Karlodinium Veneficum Blooms in Eutrophic Estuaries? Harmful Algae 8 (1), 119–128. doi: 10.1016/j.hal.2008.08.003
Aelion C. M., Chisholm S. W. (1985). Effect of Temperature on Growth and Ingestion Rates of Favella Sp. J. Plankton Res. 7 (6), 821–830. doi: 10.1093/plankt/7.6.821
Alcaraz M., Felipe J., Grote U., Arashkevich E., Nikishina A. (2014). Life in a Warming Ocean: Thermal Thresholds and Metabolic Balance of Arctic Zooplankton. J. Plankton Res. 36, 3–10. doi: 10.1093/plankt/fbt111
Alcaraz M., Saiz E., Estrada M. (1994). Excretion of Ammonia by Zooplankton and its Potential Contribution to Nitrogen Requeriments for Primary Production in the Catalan Sea (NW Mediterranean). Mar. Biol. 119, 69–76. doi: 10.1007/BF00350108
Alcaraz M., Saiz E., Fernandez J. A., Trepat I., Figueiras F., Calbet A., et al. (1998). Antarctic Zooplankton Metabolism: Carbon Requirements and Ammonium Excretion of Salps and Crustacean Zooplankton in the Vicinity of the Bransfield Strait During January 1994. J. Mar. Syst. 17, 347–359. doi: 10.1016/S0924-7963(98)00048-7
Almeda R., Alcaraz M., Calbet A., Saiz E. (2011). Metabolic Rates and Carbon Budget of Early Developmental Stages of the Marine Cyclopoid Copepod Oithona Davisae. Limnol. Oceanogr. 56 (1), 403–414. doi: 10.4319/lo.2011.56.1.0403
Angilletta M. J. (2006). Estimating and Comparing Thermal Performance Curves. J. Therm. Biol. 31 (7), 541–545. doi: 10.1016/j.jtherbio.2006.06.002
Bayne B. L., Scullard C. (1977). An Apparent Specific Dynamic Action of Mytilus Edulis. J. Mar. Biol. 57, 371–378. doi: 10.1017/S0025315400021810
Calbet A. (2001). Mesozooplankton Grazing Effect on Primary Production: A Global Comparative Analysis in Marine Ecosystems. Limnol. Oceanogr. 46 (7), 1824–1830. doi: 10.4319/lo.2001.46.7.1824
Calbet A., Agersted M. D., Kaartvedt S., Mohl M., Moller E. F., Enghoff-Poulsen S., et al. (2015). Heterogeneous Distribution of Plankton Within the Mixed Layer and its Implications for Bloom Formation in Tropical Seas. Sci. Rep. 5, 11240. doi: 10.1038/srep11240
Calbet A., Bertos M., Fuentes-Grunewald C., Alacid E., Figueroa R., Renom B., et al. (2011). Intraspecific Variability in Karlodinium Veneficum: Growth Rates, Mixotrophy, and Lipid Composition. Harmful Algae 10 (6), 654–667. doi: 10.1016/j.hal.2011.05.001
Calbet A., Isari S., Martínez R. A., Saiz E., Garrido S., Peters J., et al. (2013). Adaptations to Feast and Famine in Different Strains of the Marine Heterotrophic Dinoflagellates Gyrodinium Dominans and Oxyrrhis Marina. Mar. Ecol. Prog. Ser. 483, 67–84. doi: 10.3354/meps10291
Calbet A., Saiz E. (2005). The Ciliate-Copepod Link in Marine Ecosystems. Aquat. Microb. Ecol. 38 (2), 157–167. doi: 10.3354/ame038157
Calbet A., Saiz E. (2022). Thermal Acclimation and Adaptation in Marine Protozooplankton and Mixoplankton. Front. Microbiol. 13. doi: 10.3389/fmicb.2022.832810
Caron D. A., Goldman J. C., Dennett M. R. (1986). Effect of Temperature on Growth, Respiration, and Nutrient Regeneration by an Omnivorous Microflagellate. Appl. Environ. Microb. 52 (6), 1340–1347. doi: 10.1128/aem.52.6.1340-1347.1986
Estrada M., Marrasé C., Latasa M., Berdalet E., Delgado M., Riera T. (1993). Variability of Deep Chlorophyll Maximum Characteristics in the Northwestern Mediterranean. Mar. Ecol. Prog. Ser. 92, 289–300. doi: 10.3354/meps092289
Frost B. W. (1972). Effects of Size and Concentration of Food Particles on the Feeding Behavior of the Marine Planktonic Copepod Calanus Pacificus. Limnol. Oceanography 17, 805–815. doi: 10.4319/lo.1972.17.6.0805
Guillard R. R. L. (1975). “Culture of Phytoplankton for Feeding Marine Invertebrates,” in Culture of Marine Invertebrate Animals. Eds. Smith W. L., Chanley M. H. (New York: Plenum Press), 29–60.
Hansen P. J., Bjornsen P. K., Hansen B. W. (1997). Zooplankton Grazing and Growth: Scaling Within the 2-2,000- Mu M Body Size Range. Limnol. Oceanogr. 42 (4), 687–704. doi: 10.4319/lo.1997.42.4.0687
Hansen G., Daugbjerg N. (2004). Ultrastructure of Gyrodinium Spirale, the Type Species of Gyrodinium (dinophyceae), Including a Phylogeny of G. dominans, G. rubrum and G. spirale Deduced From Partial LSU rDNA Sequences. Protist 155, 271–294.
Heinbokel J. F. (1978). Studies on the Functional Role of Tintinnids in He Southern California Bight. II. Grazing Rates of Field Populations. Mar. Biol. 47, 191–197. doi: 10.1007/BF00395639
Helaouët P., Beaugrand G. (2007). Macroecology of Calanus finmarchicus and C-helgolandicus in the North Atlantic Ocean and Adjacent Seas. Mar. Ecol. Prog. Ser. 345, 147–165.
Hobday A. J., Alexander L. V., Perkins S. E., Smale D. A., Straub S. C., Oliver E. C. J., et al. (2016). A Hierarchical Approach to Defining Marine Heatwaves. Prog. Oceanogr. 141, 227–238. doi: 10.1016/j.pocean.2015.12.014
Huey R. B., Kingsolver J. G. (1989). Evolution of Thermal Sensitivity of Ectotherm Performance. Trends Ecol. Evol. 4, 131–135. doi: 10.1016/0169-5347(89)90211-5
Ikeda T., Carleton J. H., Mitchell A. W., Dixon P. (1982). Ammonia and Phosphate Excretion by Zooplankton From the Inshore Waters of the Great Barrier Reef. 2. Their in Situ Contributions to Nutrient Regeneration. Aust. J. Mar. Freshwater Res. 33 (4), 683–698. doi: 10.1071/MF9820683
Kiørboe T., Mohlenberg F., Hamburger K. (1985). Bioenergetics of the Planktonic Copepod Acartia Tonsa: Relation Between Feeding, Egg Production and Respiration and Composition of Specific Dynamic Action. Mar. Ecol. Prog. Ser. 26, 85–97. doi: 10.3354/meps026085
Kimmance S., Atkinson D., Montagnes D. J. S. (2006). Do Temperature-Food Interactions Matter? Responses of Production and its Components in the Model Heterotrophic Flagellate Oxyrrhis Marina. Aquat. Microb. Ecol. 42, 63–73. doi: 10.3354/ame042063
Krebs H. A., Allison J. B. (1964). “The Metabolic Fate of Amino Acids,” in Mammalian Protein Metabolism. Ed. Munro H. N. (London: Academic Press), 125–176.
López-Urrutia A., San Martin E., Harris R. P., Irigoien X. (2006). Scaling the Metabolic Balance of the Oceans. Proc. Natl. Acad. Sci. U. S. A. 103 (23), 8739–8744. doi: 10.1073/pnas.0601137103
Loret P., Tengs T., Villareal T. A., Singler H., Richardson B., McGuire P., et al. (2002). No Difference Found in Ribosomal DNA Sequences From Physiologically Diverse Clones of Karenia Brevis (Dinophyceae) From the Gulf of Mexico. J. Plankton Res. 24 (7), 735–739. doi: 10.1093/plankt/24.7.735
Menden-Deuer S., Lessard E. J. (2000). Carbon to Volume Relationships for Dinoflagellates, Diatoms, and Other Protist Plankton. Limnol. Oceanogr. 45 (3), 569–579. doi: 10.4319/lo.2000.45.3.0569
Montagnes D. J. S., Kimmance S. A., Atkinson D. (2003). Using Q10: Can Growth Rates Increase Linearly With Temperature? Aquat. Microb. Ecol. 32 (3), 307–313. doi: 10.3354/ame032307
Oliver E. C. J., Burrows M. T., Donat M. G., Sen Gupta A., Alexander L. V., Perkins-Kirkpatrick S. E., et al. (2019). Projected Marine Heatwaves in the 21st Century and the Potential for Ecological Impact. Front. Mar. Scien. 6. doi: 10.3389/fmars.2019.00734
Oliver E. C. J., Donat M. G., Burrows M. T., Moore P. J., Smale D. A., Alexander L. V., et al. (2018). Longer and More Frequent Marine Heatwaves Over the Past Century. Nat. Commun. 9 (1), 1324. doi: 10.1038/s41467-018-03732-9
Omori M., Ikeda T. (1984). Methods in Marine Zooplankton Ecology (New York: John Wiley and Sons: New York).
Pörtner H. O. (2002). Climate Variations and the Physiological Basis of Temperature Dependent Biogeography: Systemic to Molecular Hierarchy of Thermal Tolerance in Animals. Comp. Biochem. Physiol. 132, 739–761. doi: 10.1016/S1095-6433(02)00045-4
Pörtner H. O., Farrell A. P. (2008). Physiology and Climate Change. Science 322, 690–692. doi: 10.1126/science.1163156
Raven J. A., Geider R. J. (1988). Temperature and Algal Growth. New Phytol. 110, 441–461. doi: 10.1111/j.1469-8137.1988.tb00282.x
Rogerson A. (1981). The Ecological Energetics of Amoeba Proteus (Protozoa). Hydrobiologia 85 (2), 117. doi: 10.1007/BF00006621
Rose J. M., Caron D. A. (2007). Does Low Temperature Constrain the Growth Rates of Heterotrophic Protists? Evidence and Implications for Algal Blooms in Cold Waters. Limnol. Oceanogr. 52 (2), 886–895. doi: 10.4319/lo.2007.52.2.0886
Saiz E., Griffell K., Olivares M., Solé M., Theodorou I., Calbet A. (2022). Reduction in Thermal Stress of Marine Copepods After Physiological Acclimation. J. Plankton Res. doi: 10.1093/plankt/fbac017
Schmoker C., Hernéndez-León S., Calbet A. (2013). Microzooplankton Grazing in the Oceans: Impacts, Data Variability, Knowledge Gaps and Future Directions. J. Plankton Res. 35 (4), 691–706. doi: 10.1093/plankt/fbt023
Schmoker C., Thor P., Hernández-León S., Hansen B. W. (2011). Feeding, Growth and Metabolism of the Marine Heterotrophic Dinoflagellate Gyrodinium Dominans. Aquat. Microb. Ecol. 65 (1), 65–73. doi: 10.3354/ame01533
Schulte P. M., Healy T. M., Fangue N. A. (2011). Thermal Performance Curves, Phenotypic Plasticity, and the Time Scales of Temperature Exposure. Integr. Comp. Biol. 51, 691–702.
Secor S. M. (2009). Specific Dynamic Action: A Review of the Postprandial Metabolic Response. J. Comp. Physiol. B. 179 (1), 1–56. doi: 10.1007/s00360-008-0283-7
Sinclair B. J., Marshall K. E., Sewell M. A., Levesque D. L., Willett C. S., Slotsbo S., et al. (2016). Can We Predict Ectotherm Responses to Climate Change Using Thermal Performance Curves and Body Temperatures? Ecol. Lett. 19 (11), 1372–1385. doi: 10.1111/ele.12686
Straile D. (1997). Gross Growth Efficiencies of Protozoan and Metazoan Zooplankton and Their Dependence on Food Concentration, Predator-Prey Weight Ratio, and Taxonomic Group. Limnol. Oceanogr. 42 (6), 1375–1385. doi: 10.4319/lo.1997.42.6.1375
Takasuka A., Oozeki Y., Kubota H. (2008). Multi-Species Regime Shifts Reflected in Spawning Temperature Optima of Small Pelagic Fish in the Western North Pacific. Mar. Ecol. Prog. Ser. 360, 211–217. doi: 10.3354/meps07407
Tandler A., Beamish F. W. H. (1979). Mechanical and Biochemical Components of Apparent Specific Dynamic Action in Large Mouth Bass. Muopterus Salmoides Lacépède. J. Fish Biol. 14, 343–350. doi: 10.1111/j.1095-8649.1979.tb03529.x
Verity P. G. (1985). Grazing, Respiration, Excretion and Growth Rates of Tintinnids. Limnol. Oceanogr. 30, 1268–1282. doi: 10.4319/lo.1985.30.6.1268
Keywords: growth, grazing, respiration, specific dynamic action, energetic budget, temperature, Gyrodinium dominans, Oxyrrhis marina
Citation: Calbet A, Martínez RA, Saiz E and Alcaraz M (2022) Effects of Temperature on the Bioenergetics of the Marine Protozoans Gyrodinium dominans and Oxyrrhis marina. Front. Mar. Sci. 9:901096. doi: 10.3389/fmars.2022.901096
Received: 21 March 2022; Accepted: 09 May 2022;
Published: 03 June 2022.
Edited by:
Jun Sun, China University of Geosciences Wuhan, ChinaReviewed by:
Andrew J. Irwin, Dalhousie University, CanadaSe Hyeon Jang, Chonnam National University, South Korea
Wonho Yih, Kunsan National University, South Korea
Copyright © 2022 Calbet, Martínez, Saiz and Alcaraz. This is an open-access article distributed under the terms of the Creative Commons Attribution License (CC BY). The use, distribution or reproduction in other forums is permitted, provided the original author(s) and the copyright owner(s) are credited and that the original publication in this journal is cited, in accordance with accepted academic practice. No use, distribution or reproduction is permitted which does not comply with these terms.
*Correspondence: Albert Calbet, YWNhbGJldEBpY20uY3NpYy5lcw==
†Deceased