 Chengjie Xie
 Baoshan Cui
 Zhonghua Ning1,2
 Tian Xie
95% of researchers rate our articles as excellent or good
Learn more about the work of our research integrity team to safeguard the quality of each article we publish.
Find out more
ORIGINAL RESEARCH article
Front. Mar. Sci. , 12 May 2022
Sec. Coastal Ocean Processes
Volume 9 - 2022 | https://doi.org/10.3389/fmars.2022.899671
This article is part of the Research Topic Linking Hydrological and Biological Connectivity to the Restoration and Management of Coastal Ecosystems View all 7 articles
River deltas are formed by the interaction of connecting water and sediment, and they are among the most economically and ecologically valuable ecosystems on Earth. Because of their special locations, together with direct and indirect human interference, river deltas are expected to be more vulnerable and fragmented. The increasing fragmentation of deltas is largely due to longitudinal hydrological connectivity disruption caused by human activities. However, the dynamics of longitudinal connectivity are unknown, especially in the Yellow River Delta (YRD), which has been subjected to heavy reclamation in recent years. In this study, we divided the whole YRD into three subregions, the erosion zone, the oilfield zone and the deposition zone, and then we used indicators to explore the spatiotemporal variation in hydrological connectivity on the whole scale and on the zonal scale of the delta during 1984-2018 in the YRD. We found that the variation in longitudinal hydrological connectivity was closely related to the geometry of the tidal channel networks, and that the changes in longitudinal hydrological connectivity varied with research scales. A weak increasing trend of connectivity was found on the whole scale of the delta during the past three decades. A decreasing trend of connectivity was found in both the erosion zone and the oilfield zone. In the deposition zone, however, the connectivity degree was enhanced. Furthermore, we also identified the key impaired area and relatively stable area of hydrological connectivity in the YRD and implied that the key impaired area may be a priority restoration zone of the impaired hydrological connectivity zone. Our study provides useful scientific guidance for the subsequent restoration of damaged wetlands.
River deltas are one of the most important and vulnerable regions on Earth (Kirwan and Megonigal, 2013; Nienhuis et al., 2020). On the one hand, they are diverse ecosystems that provide valuable ecological services for flood protection, carbon sequestration and biodiversity (Hoitink et al., 2020; Van de Giesen, 2020). Millions of migratory birds fly via river deltas to the Arctic for breeding (Gu et al., 2021). On the other hand, they contain a great deal of natural resources, such as oil and gas that greatly stimulate the local economy, and house approximately 40% of the global population (Firth et al., 2016). The concentration of population and the artificial structures obstruct the longitudinal dynamics of hydrological connectivity that control the material exchange and energy transportation between estuaries and tidal zones. The impaired hydrological connectivity induced river deltas to become increasingly fragile and fragmented (Strain et al., 2018), and gravely jeopardized deltaic ecosystem function and sustainability (Hoitink et al., 2020). Understanding the longitudinal dynamics of hydrological connectivity in river deltas is essential for our comprehension of the degeneration mechanism and ecological functions of deltaic ecosystems for restoration and protection (Jaramillo et al., 2018).
Hydrological connectivity refers to the transfer of water, sediment, nutrients and organisms within or between the elements of the hydrologic cycle (Pringle, 2001; Bracken et al., 2013). It is useful for understanding the surface process that governs landscape formation and evolution (Sendrowski and Passalacqua, 2017; Wright et al., 2018). Generally, it includes three features: structural connectivity, functional connectivity and process connectivity (Ruddell and Kumar, 2009; Passalacqua, 2017; Sendrowski and Passalacqua, 2017). Structural connectivity refers to the spatial continuity or physical links of landscape units, such as lakes, rivers and other wetland waterbodies; functional connectivity refers to the material flow generated in those physical links or landscape units, including connected water, nutrients or sediment transfer among those landscape units (Wainwright et al., 2011; Bracken et al., 2013). Process connectivity refers to the flow of information from a physical driver (e.g. discharge, tides) to its outward manifestation (e.g. water levels) (Larsen et al., 2012; Sendrowski and Passalacqua, 2017). These three features of hydrological connectivity are tightly interwoven (Lopez-Vicente et al., 2017; Wohl et al., 2018) because structural connectivity controls the pathway of functional connectivity, and functional connectivity modifies the structural connectivity by series of interactions between hydrodynamics and sediment for a long time (Wainwright et al., 2011; Keesstra et al., 2018). As a result, there exists a feedback mechanism between the structural connectivity and functional connectivity (Poeppl et al., 2017). Meanwhile, process connectivity is affected by both structural connectivity and functional connectivity (Sendrowski and Passalacqua, 2017). In the spatial dimension, hydrological connectivity has three dimensions: longitudinal connectivity (from the headwater of a river to its estuary, or from the headwater of a tidal channel to its outlet), lateral connectivity (from river channel to its floodplain) and vertical connectivity (from surfacewater to groundwater) (Pringle, 2001; Singh et al., 2021). In recent years, research on the dynamics of longitudinal connectivity has become heated because the construction of dams or artificial structures obstructs the connectivity between upstream and downstream reaches (Castello and Macedo, 2016).
In river deltas, longitudinal hydrological connectivity based on tidal channel networks controls the frequency and degree of nourishing intertidal zones with sediment and nutrients (Hiatt and Passalacqua, 2015; Tejedor et al., 2016). The health and service functions of intertidal ecosystems are closely linked to the longitudinal dynamics of hydrological connectivity. Research has shown that the amount of deltaic wetland loss was attributed to the obstruction of hydrological connectivity between estuaries and the interior (Xie et al., 2020a). Therefore, assessing the longitudinal dynamics of hydrological connectivity is helpful for understanding the degradation mechanism and restoration potential of river delta systems (Larsen et al., 2012). In recent years, several methods have been developed to evaluate hydrological connectivity (Singh and Sinha, 2018; Tejedor et al., 2018; Wright et al., 2018; Liu et al., 2020). Among these methods, network analysis based on graph theory has been applied and validated. It is a widely used approach for hydrological connectivity research in delta systems (Tejedor et al., 2015; Passalacqua, 2017; Dong et al., 2020). Based on graph theory, hydrological connectivity is considered as a network constituted by a series of nodes and links (Heckmann et al., 2015). These links can represent the magnitude and direction of fluxes between nodes (Pearson et al., 2020). Information related to nodes and links can be summarized into an adjacency matrix, and element of adjacency matrix represents the presence or absence of a link between two nodes, respectively. We can also weight the adjacency matrix, named the weighted adjacency matrix, and the weights indicate the strength of connectivity (Tejedor et al., 2015). More information about the introduction of graph theory can be found in the paper published by Newman (2003).
The tidal channel network, a ubiquitous geomorphic landscape in river deltas, is an important pathway of hydrological connectivity between estuaries and interiors (Kearney and Fagherazzi, 2016). However, under the double drivers of sea level rise and anthropogenic activities, the geometry of the tidal channel network has changed significantly (Jarriel et al., 2020). This phenomenon is particularly prominent in the Yellow River Delta (YRD), the largest delta in China (Xie et al., 2020b; Gong et al., 2021). Research has shown that reclamation is the key factor that controls the evolutionary pattern of tidal channel networks (Chen et al., 2020; Liu et al., 2020). When the proportion of reclamation exceeds a certain threshold, the count, length and fractal dimension of tidal networks decrease sharply, and the developmental paradigms of channel networks shift from complexity to simplification (Xie et al., 2020b). Another example in the Yangtze River Delta, which influenced by large-scale reclamation showed that tidal networks experienced an obvious trend of degradation and extinction, and the fractal dimension of tidal creek networks decreased from 1.26 to 1.13 (Shi et al., 2016). Nevertheless, information about how the longitudinal dynamics of hydrological connectivity vary with the morphology of tidal channel networks is unknown. Although research on the connectivity of tidal channel networks in the YRD has published, these studies revealed regional information about connectivity (Yu et al., 2018; Li et al., 2020), in particular, they have not identified the key areas of changing hydrological connectivity, and the spatiotemporal variation in critical nodes and key pathways of hydrological connectivity are unclear. Therefore, we analysed the longitudinal variation in hydrological connectivity on a landscape scale, discerned the critically impaired zones and acquired integrated information of hydrological connectivity in the YRD.
In this study, we utilized the vector files of annual tidal channel networks that were extracted from the former studies (Xie et al., 2020b) to analyze the dynamics of hydrological connectivity during 1984 to 2018 in the YRD. Here, we mainly addressed (1) how longitudinal hydrological connectivity varied during the past 35 years, (2) how the key nodes and links of hydrological connectivity changed over the past three decades, and (3) what the critical area of damaged hydrological connectivity was and how to identify it. Knowing these answers is important for improving our comprehension of the changing trend of hydrological connectivity and will contribute to discerning the prior restoration area of hydrological connectivity in the YRD.
The YRD is located at the south of Bohai Bay and at the west of Laizhou Bay, China (Figure 1). It is formed by sediment deposition carried from the Yellow River into the estuary. Due to the artificial avulsion of the Yellow River Estuary from Shenxiangou to Diaokou to Qingbacha, large areas of new wetlands were created, and a number of tidal channels were formed. Recently, because of mariculture and oilfield exploitation, a lot of wetlands have been reclaimed, resulting in the decline of natural wetlands and biodiversity. Therefore, the Yellow River Estuary Nature Reserve and the Diaokou River Nature Reserve were established in 1992 to protect the deltaic wetlands for maintaining the biodiversity of the ecosystems. However, the rest of the area outside of the Nature Reserve is continuously subjected to human influence, and these anthropogenic activities have a considerable effect on the evolution of tidal networks (Xie et al., 2020b). For a deep understanding of the longitudinal variation in hydrological connectivity, we divided the whole delta into three subregions: the erosion zone in the north, the oilfield zone in the northeast and the deposition zone in the south of the YRD. Then, we explored the spatiotemporal changes in longitudinal hydrological connectivity on the two scales in the YRD.
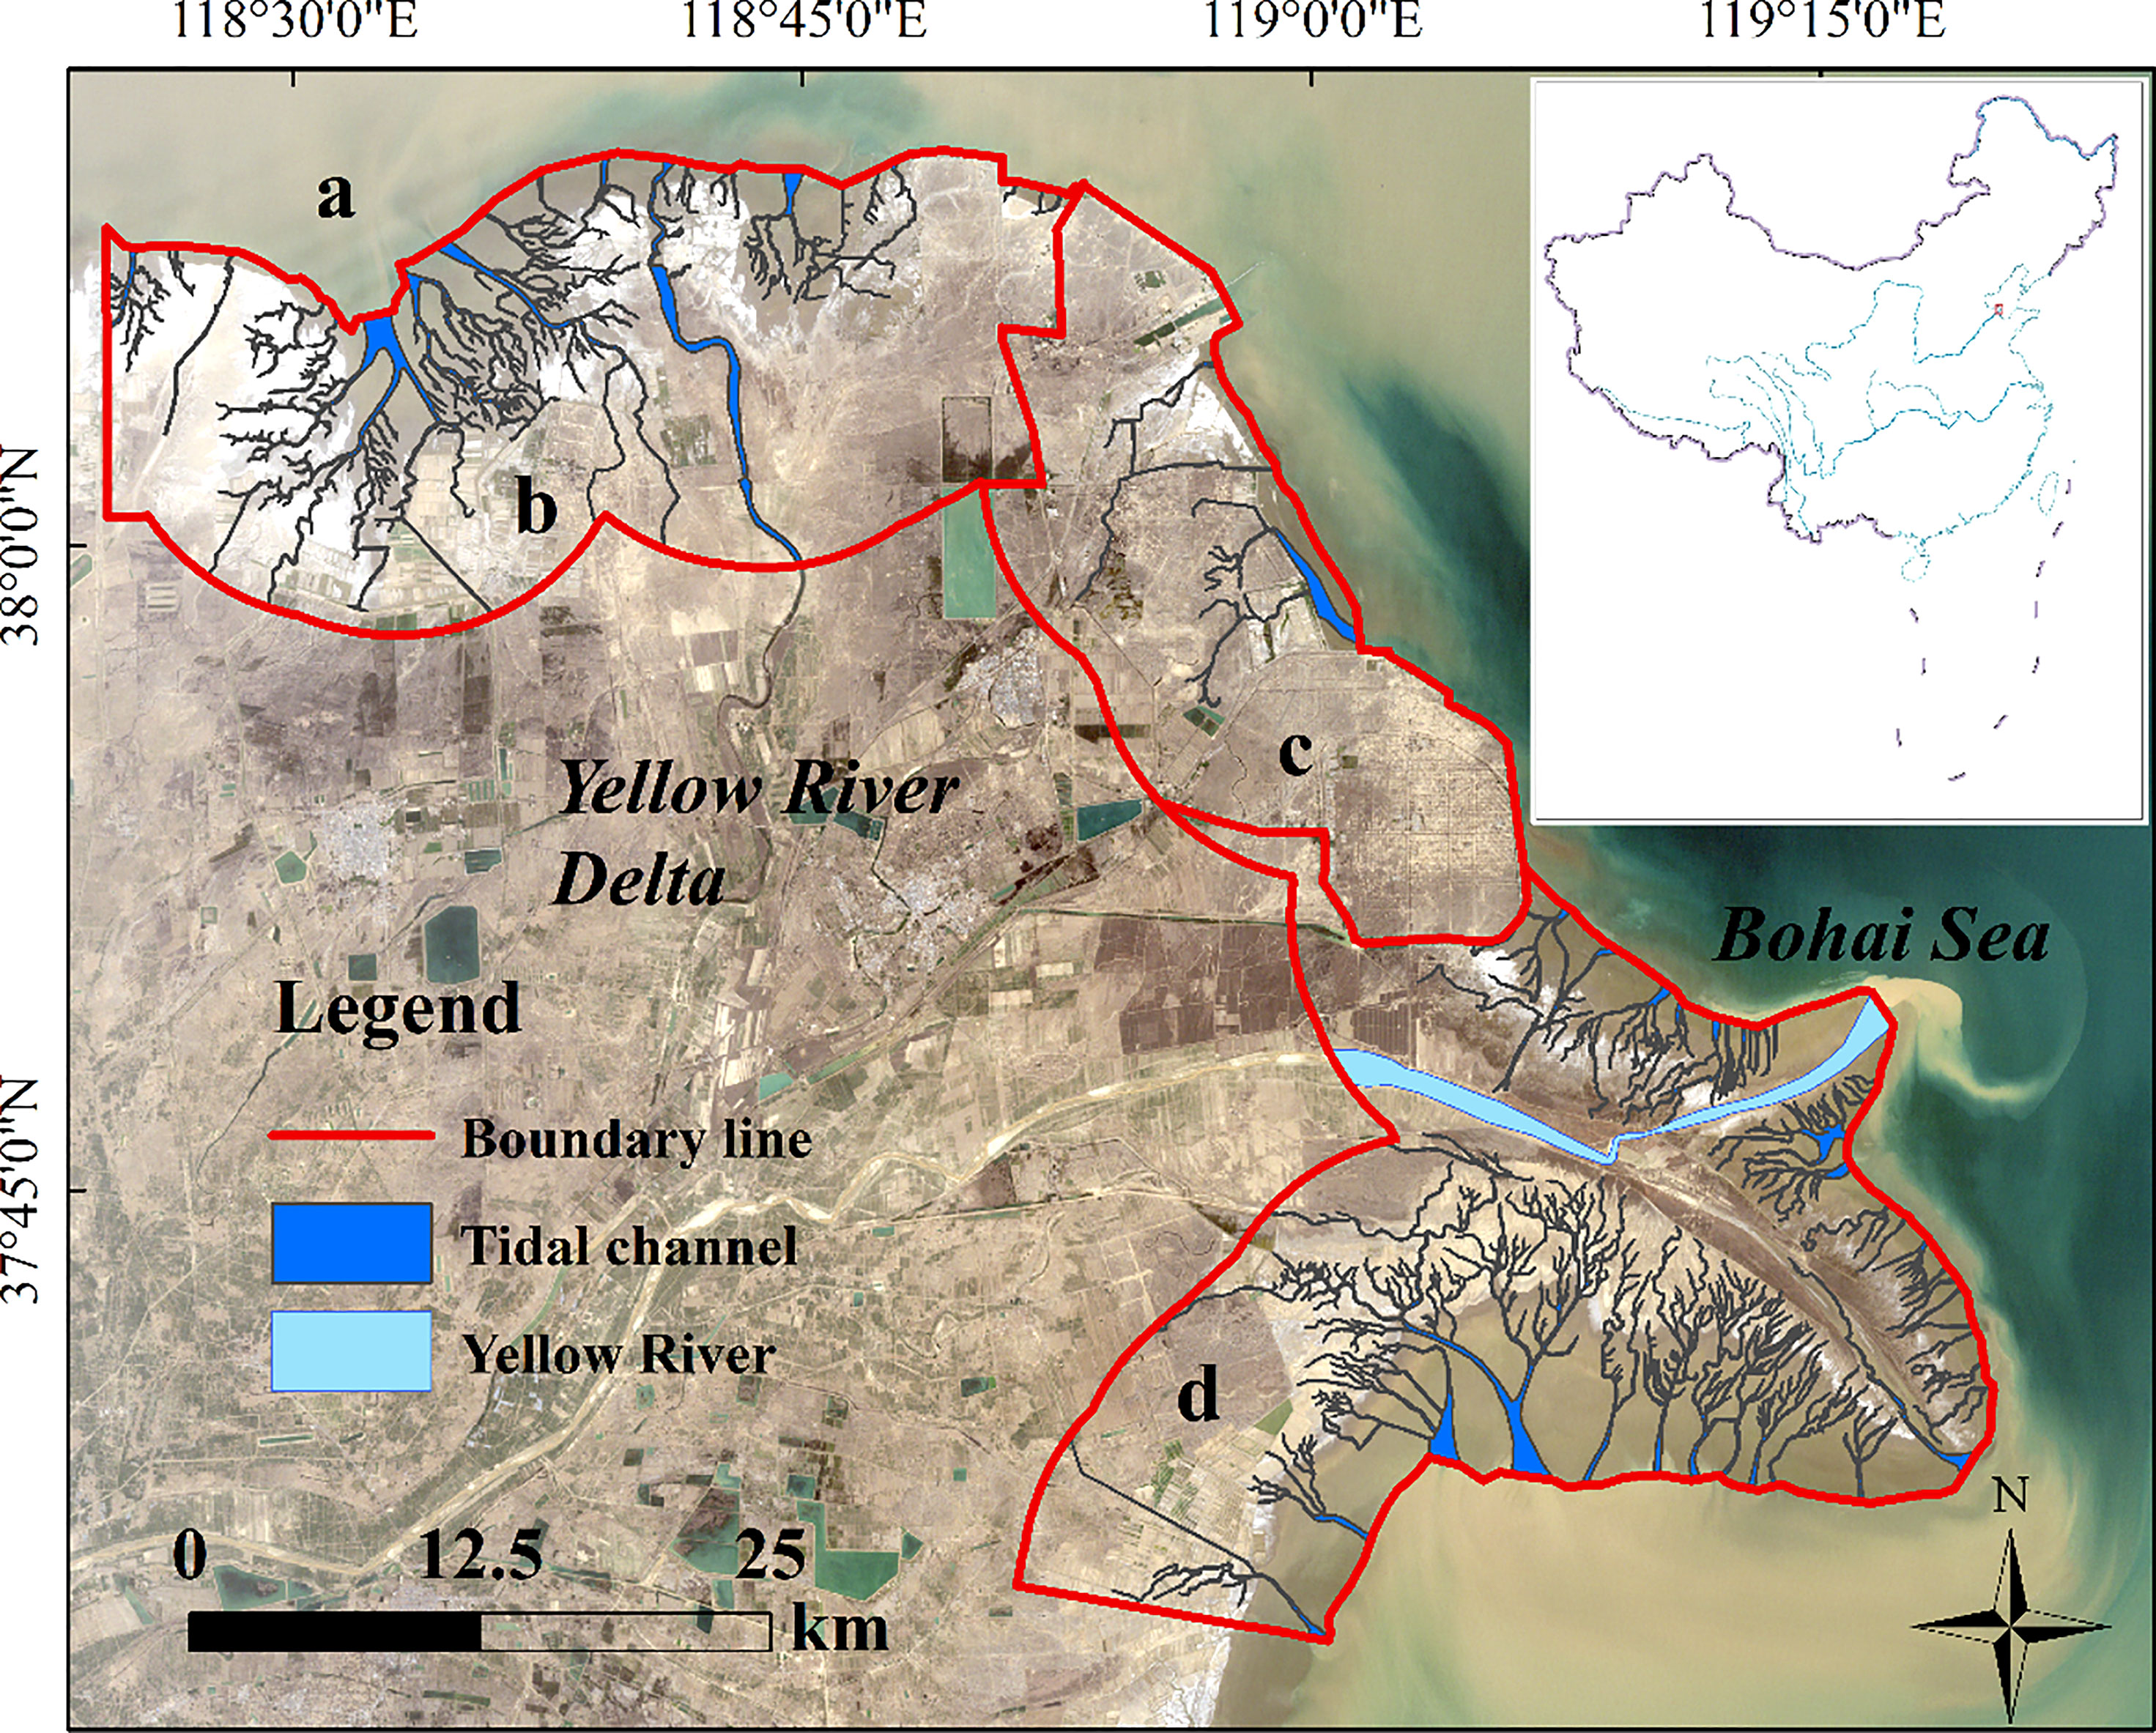
Figure 1 Landsat image (TM5) of the study area in April 8th, 2000 (A represent the whole scale of delta, B–D represent the erosion zone, oilfield zone and deposition zone respectively).
Based on graph theory, the tidal channel networks were conceptualized as nodes and links, and then we constructed the adjacency matrix of nodes and edges according to whether there was an edge between nodes. The adjacency matrix can store the information about the nodes and links, and we can apply this information to explore the longitudinal variation in hydrological connection in the YRD.
A graph (G) is a data structure that comprises a series of nodes and links (Figure 2). In the tidal channel network, the nodes can be the vertices of tidal channels or their confluences, and the links can be the edges of channels. The information about the spatial relationship of nodes and links can be stored in an adjacency matrix (A(G)), so the adjacency matrix is a representation of graph digitization. The element (aij) of A(G) can be given as follows:
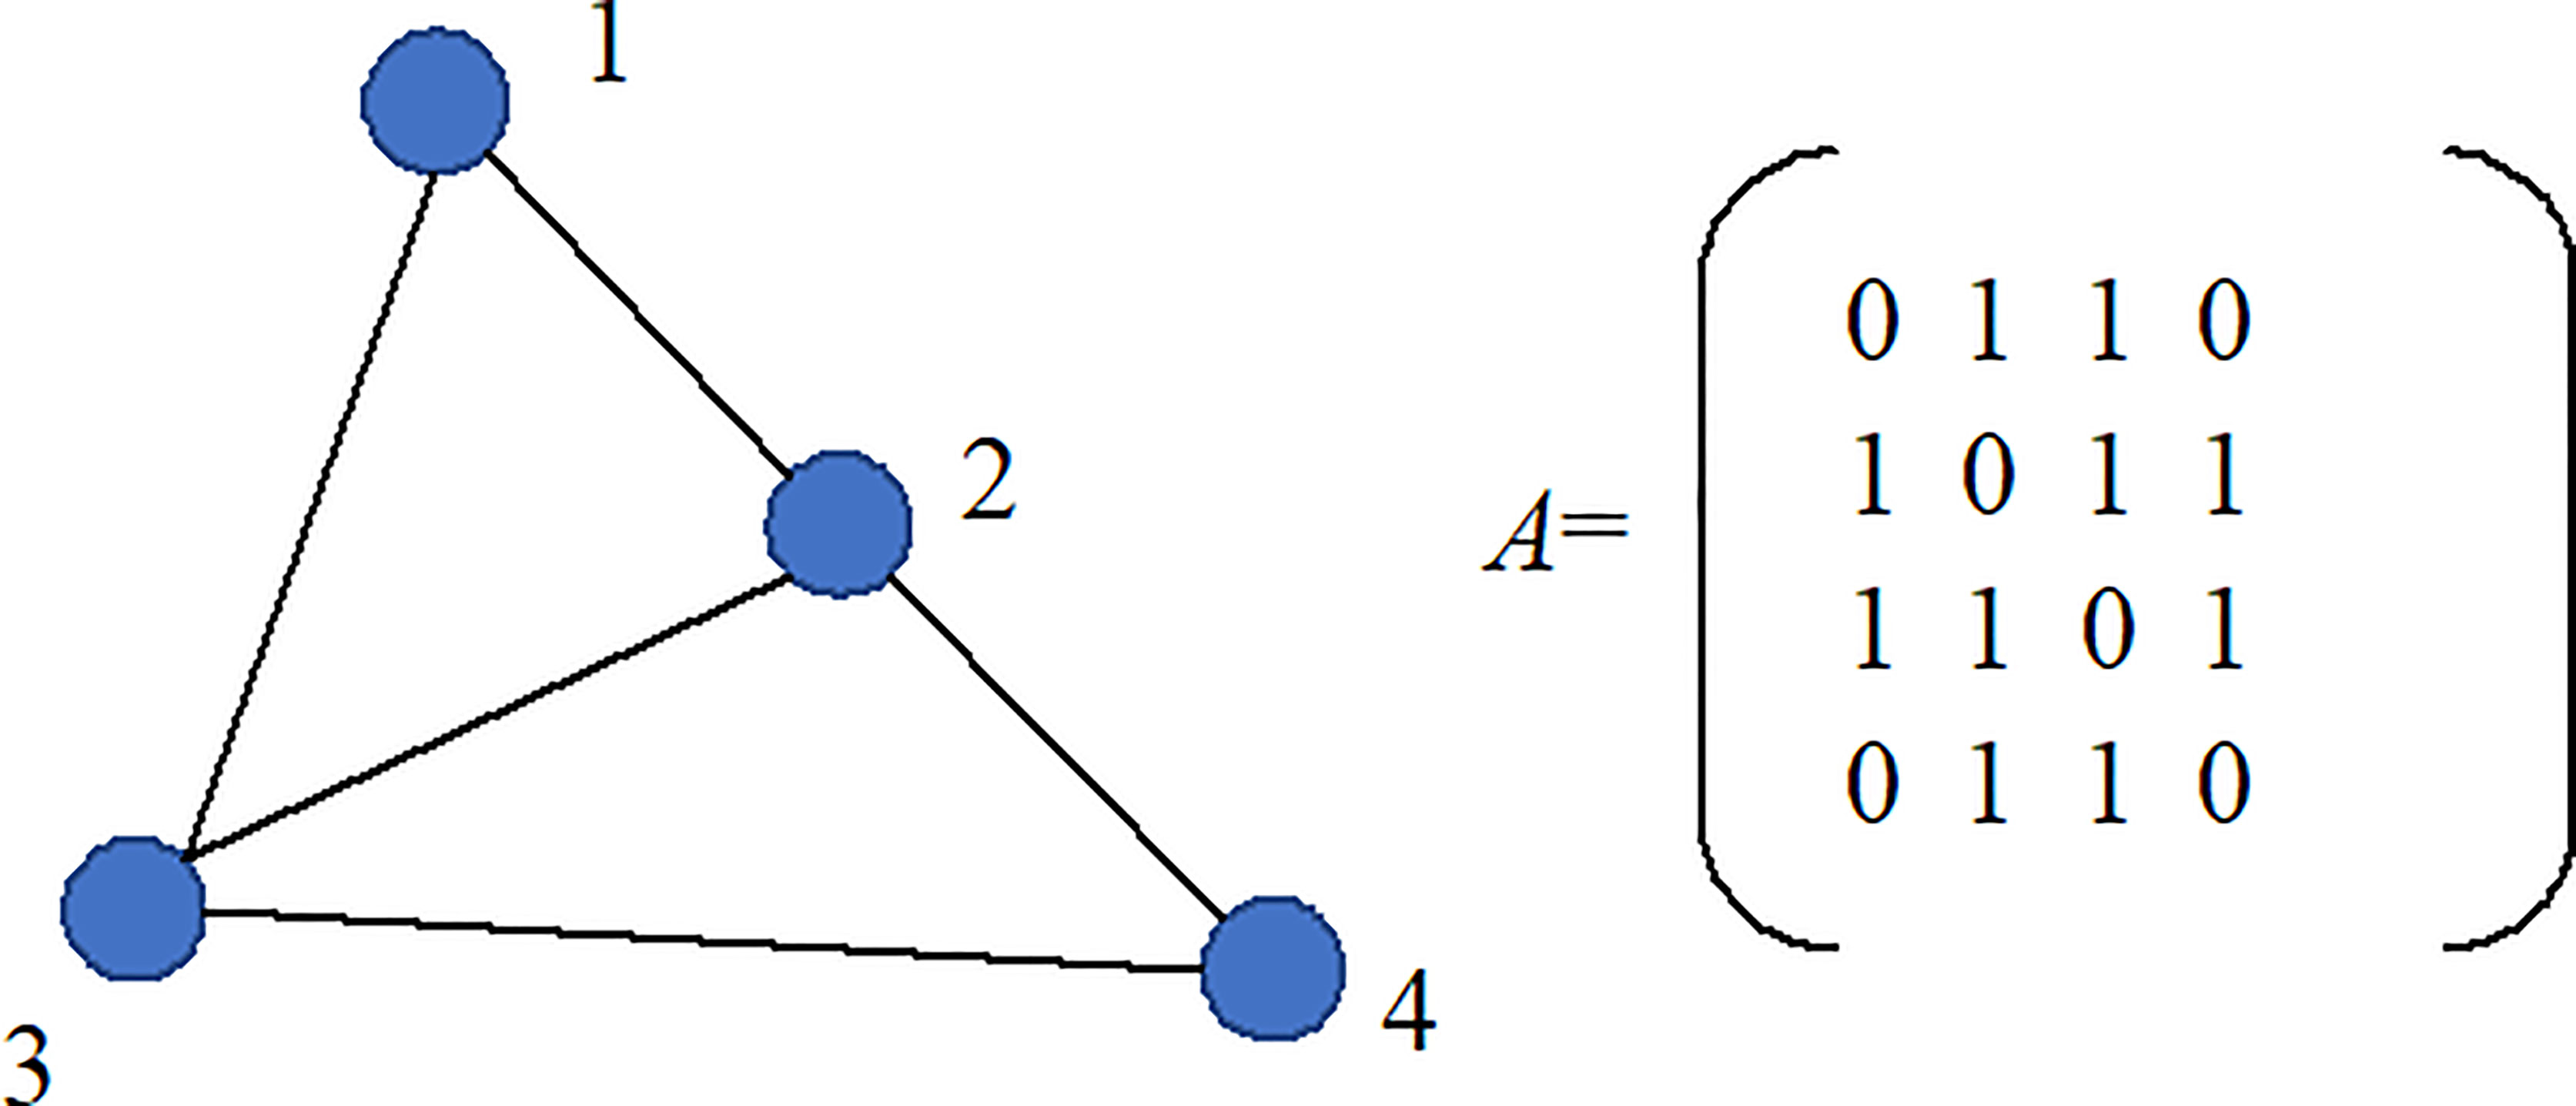
Figure 2 Sketch of a graph and its adjacency matrix.
Here, the annual tidal channel networks are generalized as graphs, the vertices and intersectional points of tidal networks are defined as nodes, and the pathways of tidal channels are defined as links. Meanwhile, each graph creates an adjacency matrix. Finally, total 35 adjacency matrices were formed.
Four descriptive indices are used to characterize the longitudinal dynamics of hydrological connectivity (Pascual-Hortal and Saura, 2006), there are as follows:
NC: number of components. A higher NC indicates lower connectivity.
where n is the number of nodes in the tidal channel network, and nlij is the number of links between node i and node j. The higher H is, the higher the connectivity is.
where NC is the number of components, ci is the total component attribution, and Al is the maximum landscape attribution. The higher the LCP is, the better the longitudinal hydrological connectivity is.
where n is the number of nodes in the tidal channel network, ai and aj are the attributes of node i and node j, respectively. nlij is the number of links between node i and node j, and Al is the maximum landscape attribution. A higher IIC corresponds to a higher longitudinal hydrological connectivity.
We used dIn and dIl to describe the importance of nodes and links, respectively. Their calculation process is as follows:
where I is the total connectivity when the original nodes (or links) exist in the tidal channel network, and Iremove is the rest of the total connectivity when a single node or link in the tidal channel network is removed. A higher dIn (dIl) indicates that this node or link plays a greater role in maintaining the connectivity of the tidal channel network (Baranyi et al., 2011). Here, we used these two indices to identify the key impaired area of hydrological connectivity.
We used the variation of nodes and links as the agency of geometric changes in the tidal channel networks. The variation in nodes showed similar trends with links variation on the whole scale and the zonal scale, but the variation in nodes or links showed different trends at different scales (Figure 3). On the whole scale of the delta, the trends of nodes and links have showed different phase features in the past three decades. Before 2000, they showed an increasing trend, and they showed decreasing trend after 2000. Compared to 1984, the number of nodes and links net increased by approximately 85% in 2000. On the zonal scale, the number of nodes and links in the deposition zone represented a net increasing trend; however, a net decreasing trend was found in both the erosion zone and the oilfield zone.
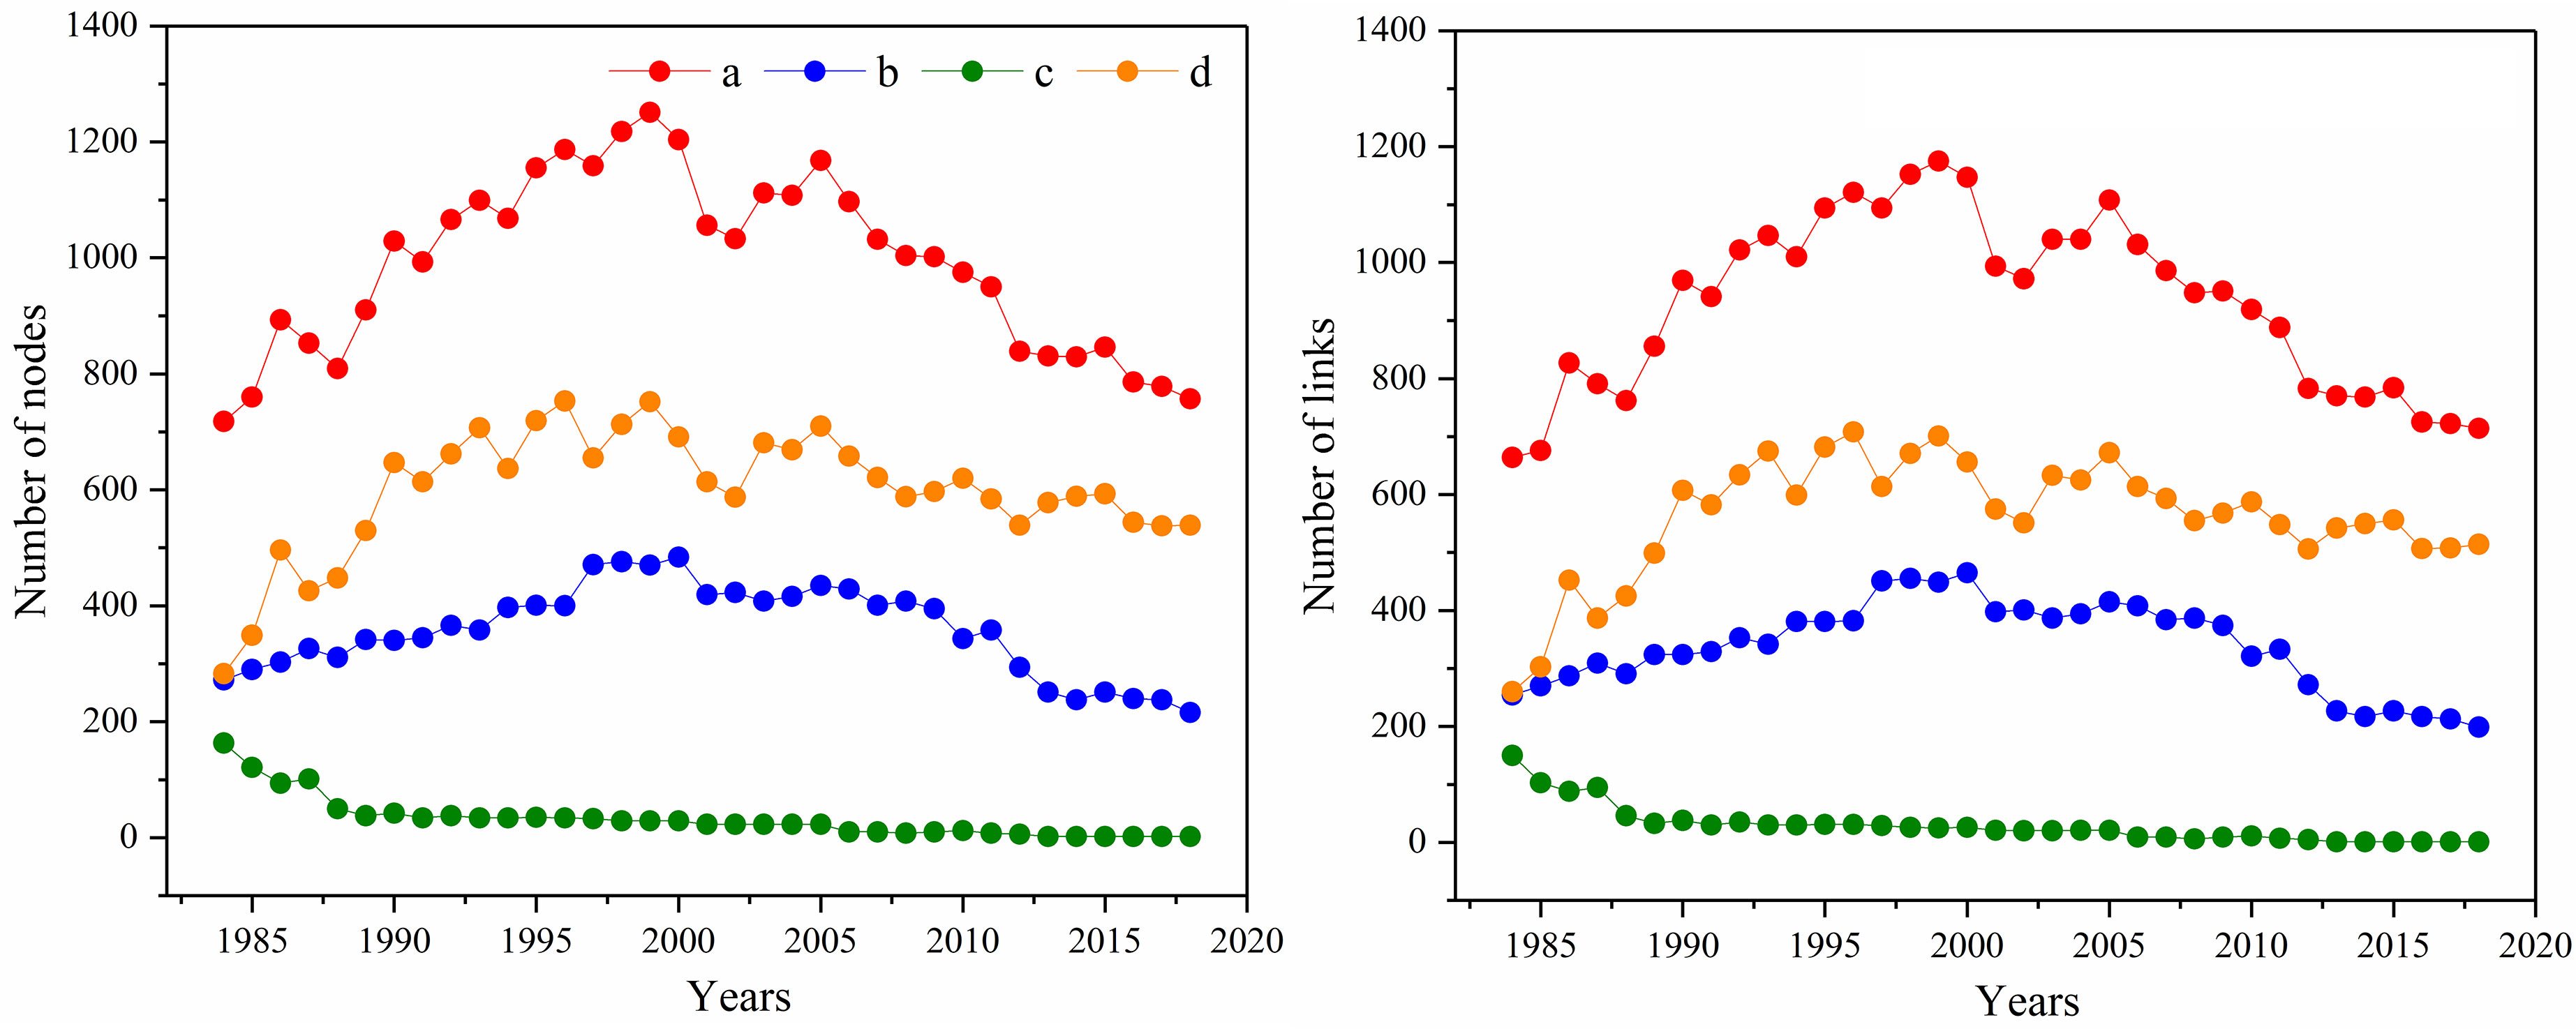
Figure 3 Nodes and links dynamic during 1984-2018 (a represent the whole scale, b, c and d represent erosion zone, oilfield zone and deposition zone respectively).
The index of NC has showed a slight declining trend on the whole delta scale during the past three decades, indicating that the degree of connectivity increased weakly. Meanwhile, the indices of H, LCP and IIC showed similar trends on the whole scale of the delta. Before 2000, they increased rapidly over time, indicating that the longitudinal hydrological connectivity in the YRD increased rapidly before 2000. After 2000, the three connectivity indices decreased, indicating that the degree of connectivity declined from 2000 to 2018. On the zonal scale, the four indices in the erosion zone showed a trend similar to that on the whole scale, indicating that longitudinal hydrological connectivity in the erosion zone restricted the improvement of the integral connectivity degree on the whole delta. The NC in the erosion zone showed a weakly increasing trend, indicating that a declining tendency of connectivity was found in the erosion zone. This result can be verified with the other three indices: the H, LCP and IIC indices which declined overall during 1984-2018, although an increasing trend was found before 2000. In the oilfield zone, the connectivity indices were almost close to 0, indicating that this zone had a very low connectivity degree (Figure 4).
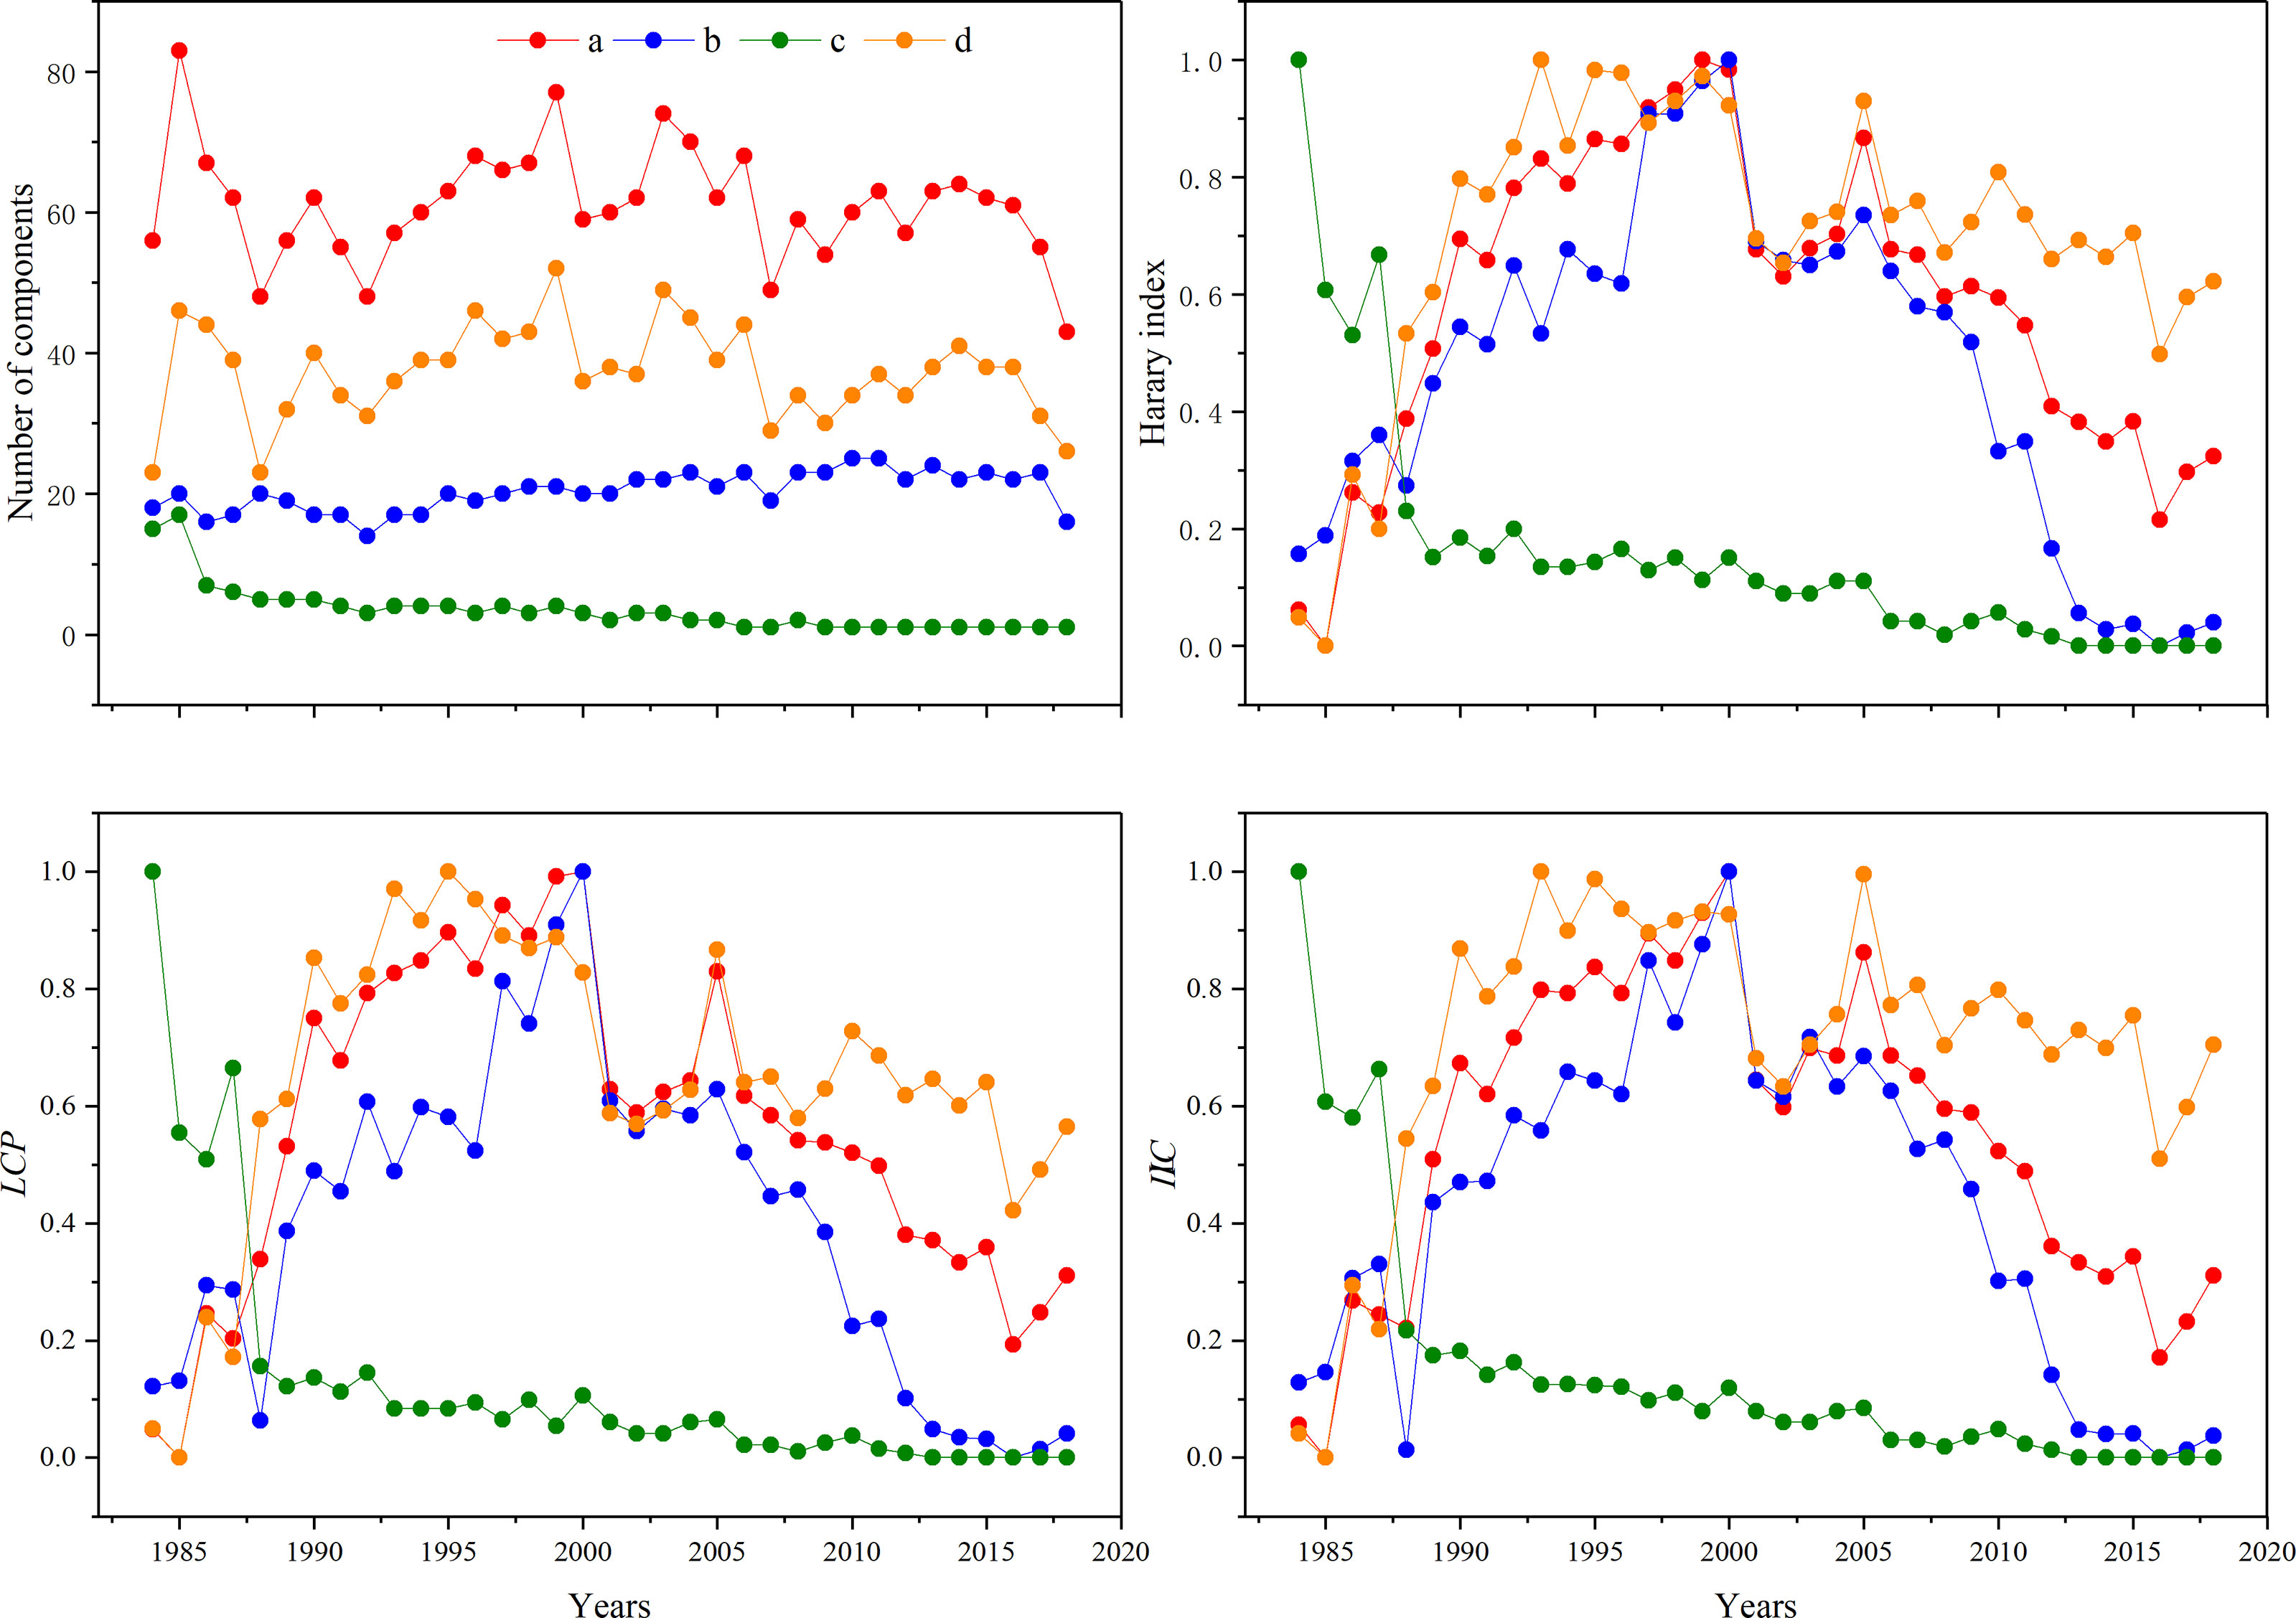
Figure 4 Connectivity indices dynamics in the YRD (a represent the whole scale, b, c and d represent erosion zone, oilfield zone and deposition zone respectively).
To identify the relationship between the geometry of the tidal channel networks and the longitudinal hydrological connectivity, we chose one of the connectivity index (IIC) and explored the link between node count and IIC. As showed in Figure 5, the significant positive correlation was found between the number of node and the IIC. The minimum value of fitted coefficient was also greater than 0.85, indicating that there existed a significant lineal relationship between the geometry of the tidal channel networks and the connectivity. The degree of longitudinal connectivity increased with the node count, indicating that the tidal channel networks with less number of nodes had lower connectivity degree.
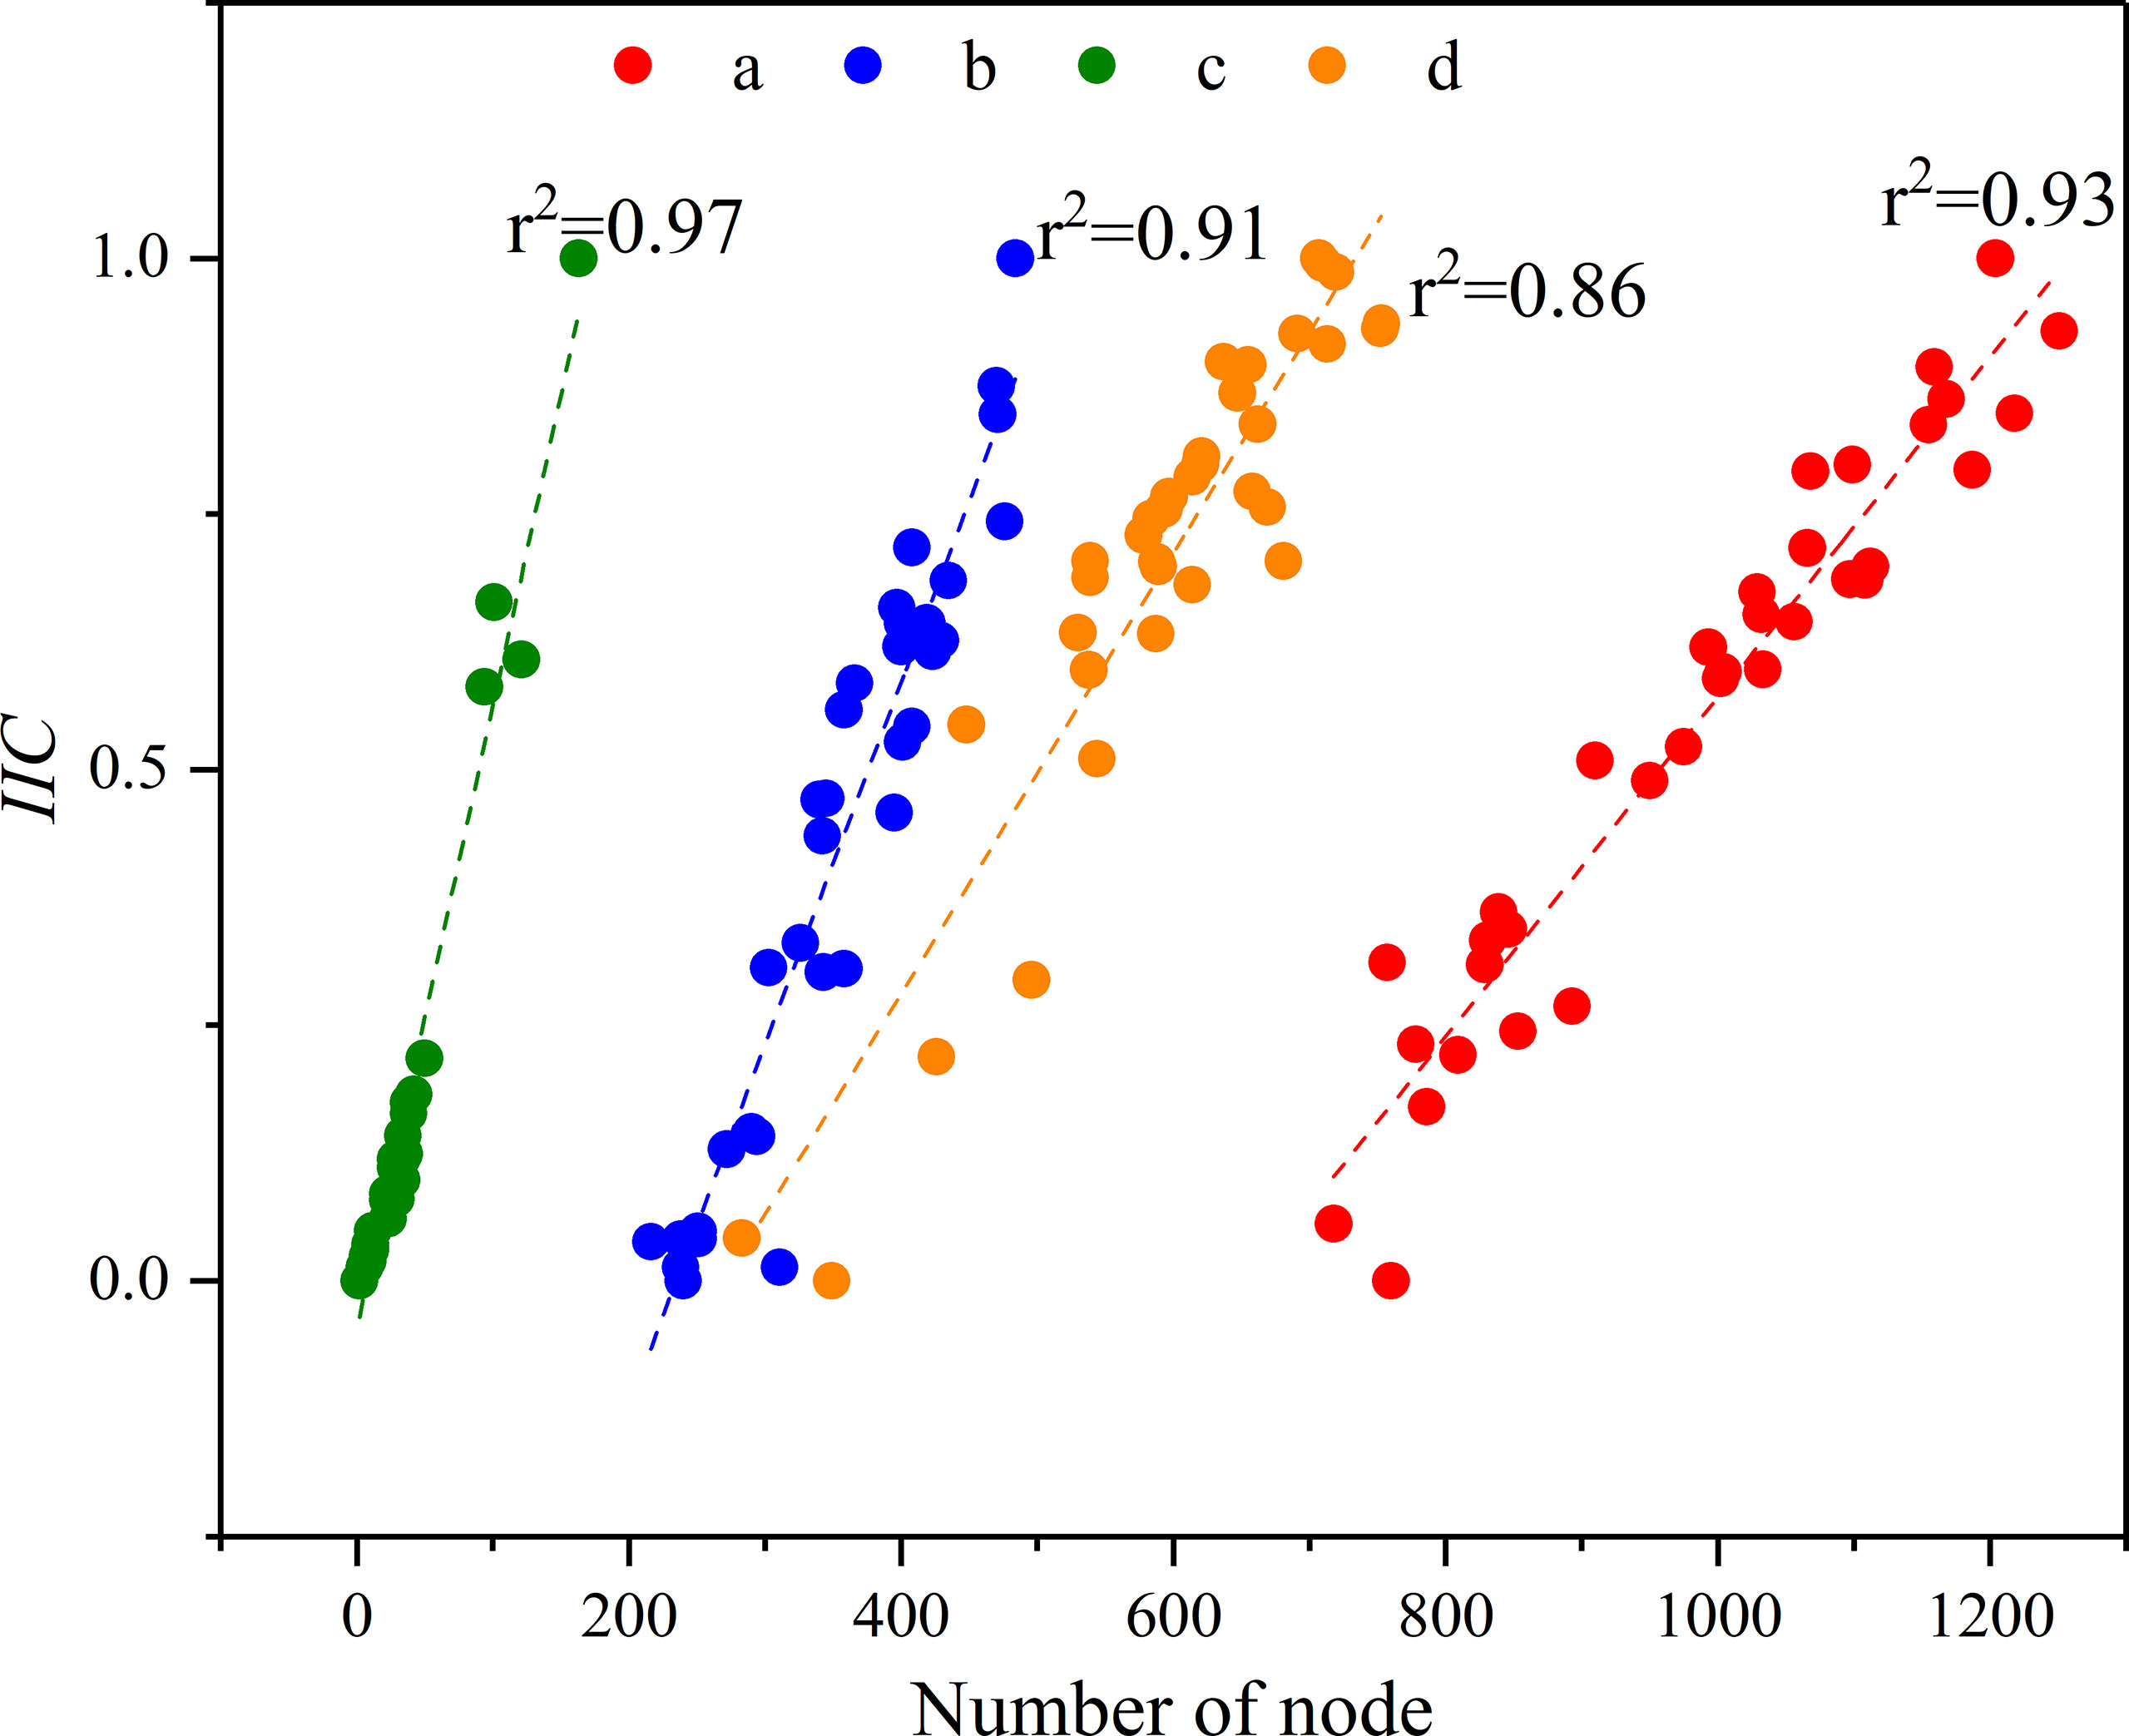
Figure 5 The relationship between the geometry of the tidal channel networks and the longitudinal hydrological connectivity (a represent the whole scale, b, c and d represent erosion zone, oilfield zone and deposition zone respectively).
Using node (or link) removal process, we can explore the importance of nodes and links in maintaining hydrological connectivity. After calculating the importance of nodes and links, we applied the Manual Breaks method to classify the importance of nodes and links into five categories, the classification maps in 1984, 2001 and 2018 were shown in Figure 6. Annual classification maps of the importance of nodes and links were shown in Figures S1, S2, respectively. It was clearly found that the nodes and links with higher importance distributed in the erosion zone and deposition zone in 1984 and 2001; however, this pattern was changed in 2018. The nodes and links of higher importance were only located in the deposition zone. In 1984, some more important nodes and links were found in the oilfield zone; nevertheless, in the following years, they disappeared. The disappearance of these nodes and links in the erosion zone and oilfield zone indicated that the nodes and links in these two zones have played a decreasing role in maintaining longitudinal hydrological connectivity on the whole scale of the delta over the past three decades.

Figure 6 Spatial arrangement of importance of nodes and links in 1984, 2001 and 2018 in the YRD.
Furthermore, we defined the nodes (or links) with the importance value greater than 0.2 as the key nodes (or links). The variation of the number of key nodes (links) were showed in Figure 7. The number of critical nodes (or links) decreased in the past three decades, compared to the amount in 1984, the number of key nodes (or links) in 2018 reduced roughly half on the whole delta. In 2000, the amount of key nodes in the erosion zone peaked (about 50), however, the key nodes were almost disappeared in 2018. On the contrary, the amount of key nodes (or links) in the deposition zone was relatively stable. There were about 30 key nodes (or links) in each year.
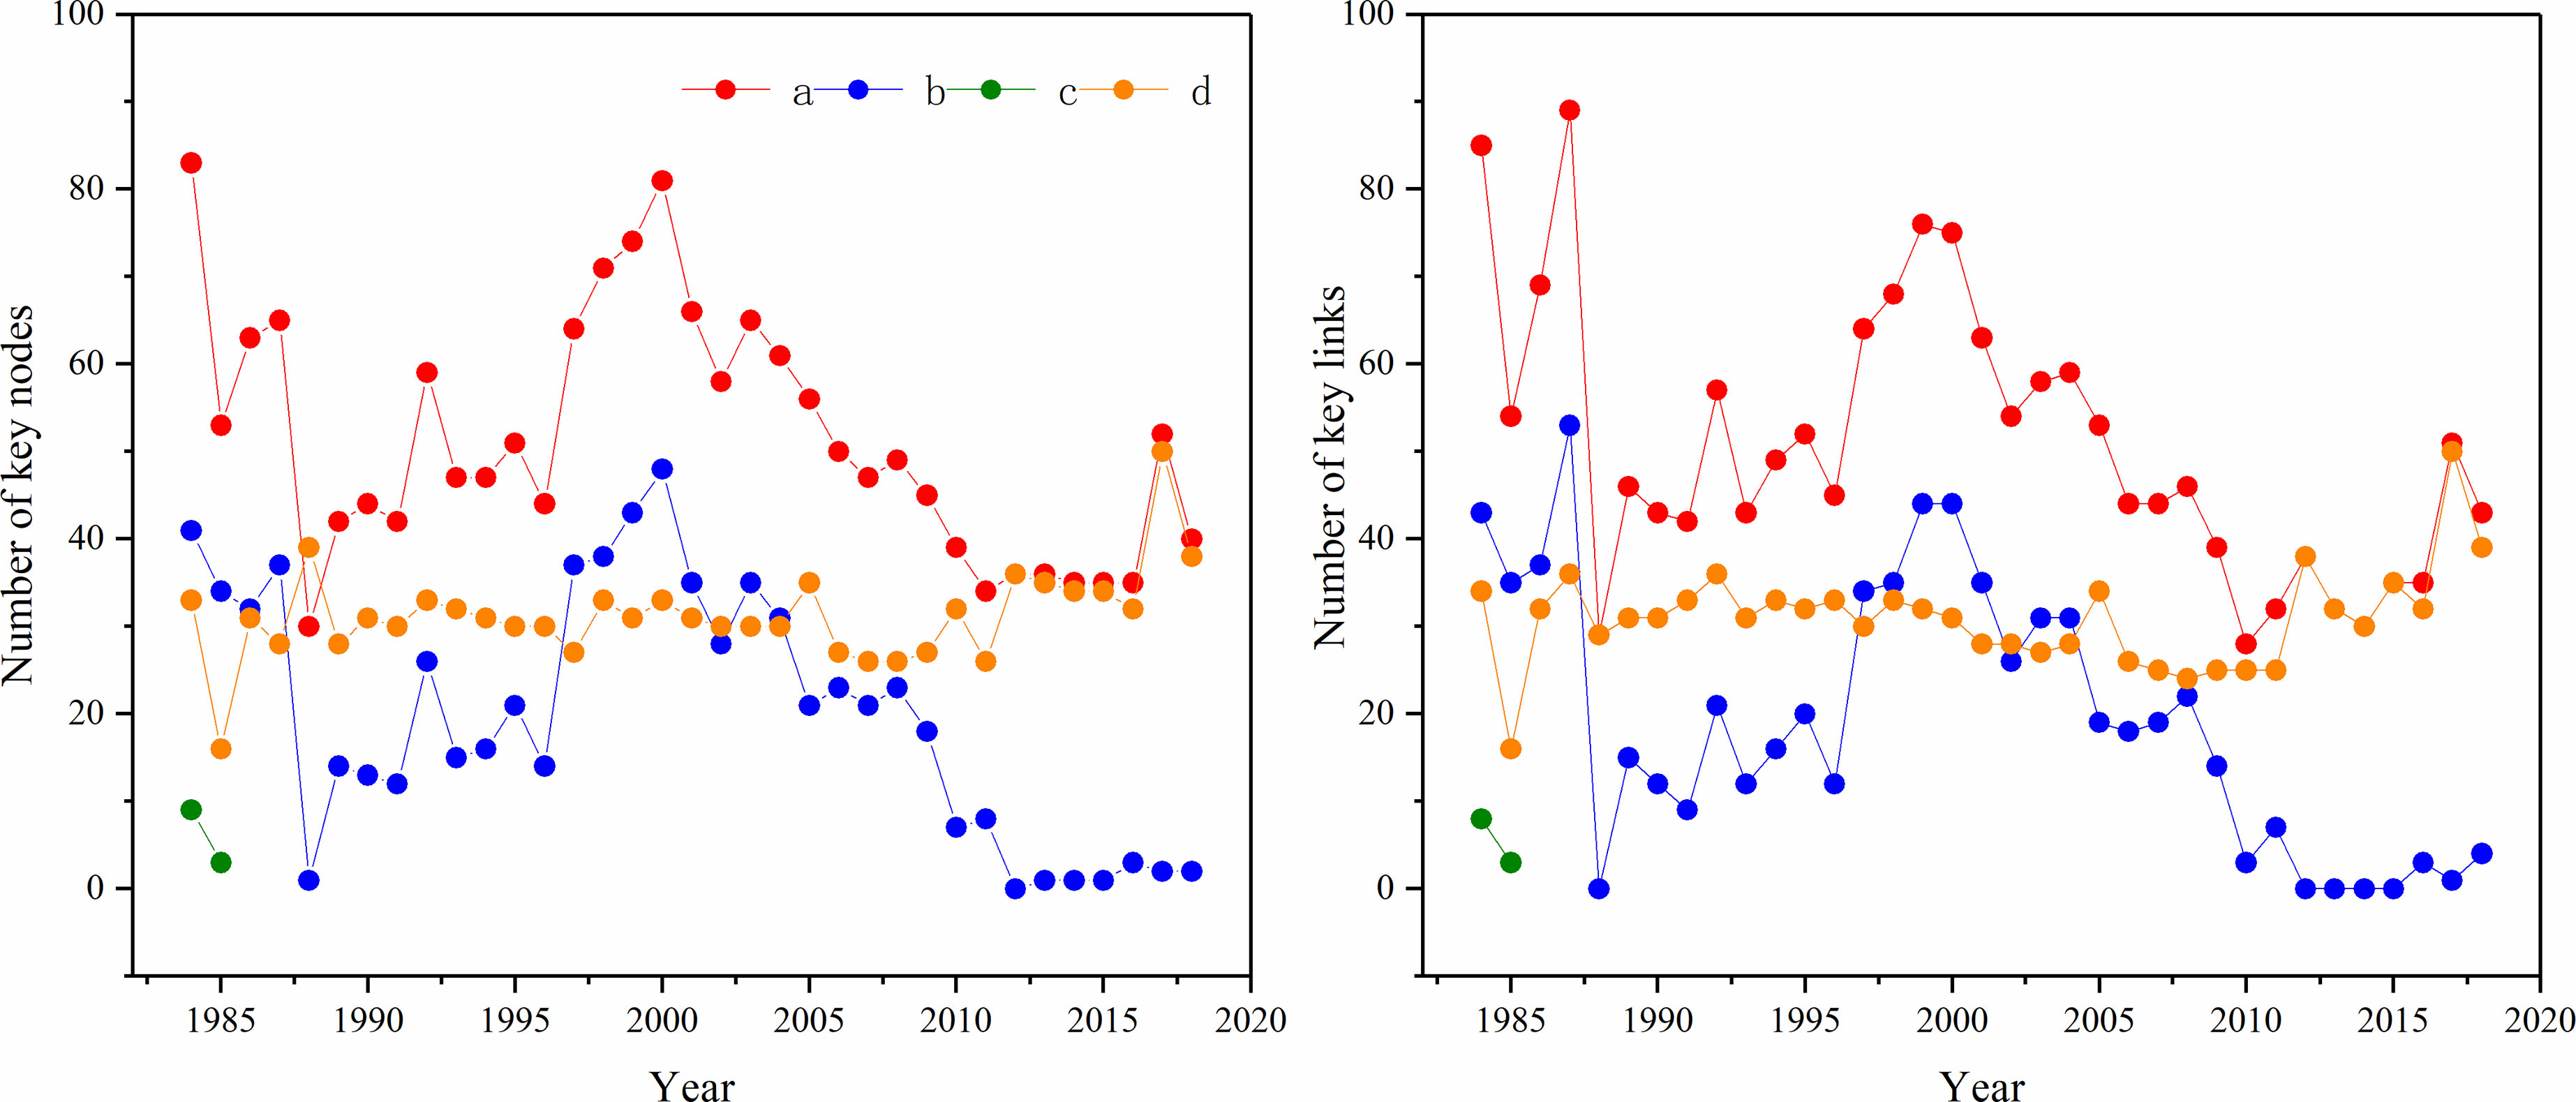
Figure 7 Variation in the number of keynodes (or links) during 1984-2018 in the YRD (a represent the whole scale, b, c and d represent erosion zone, oilfield zone and deposition zone respectively).
From the variation in the number of key nodes (or links), we could easily identify the damaged area and dynamic stable area of longitudinal hydrological connectivity in the YRD. The impaired zone and dynamic stable area were distributed in the erosion zone and the deposition zone, respectively. Furthermore, we found that the critical impaired zone and relatively stable zone of the longitudinal hydrological connectivity were distributed in two large tidal channel networks. We extracted them separately for a better comparison, as plotted in Figure 8. The geometry of the tidal channel networks in the critical impaired zone changed considerably between 1984 and 2018, the main change was the reduction of branches. In contrast, the branches of the tidal channel network in the dynamic stable zone did not change substantially.
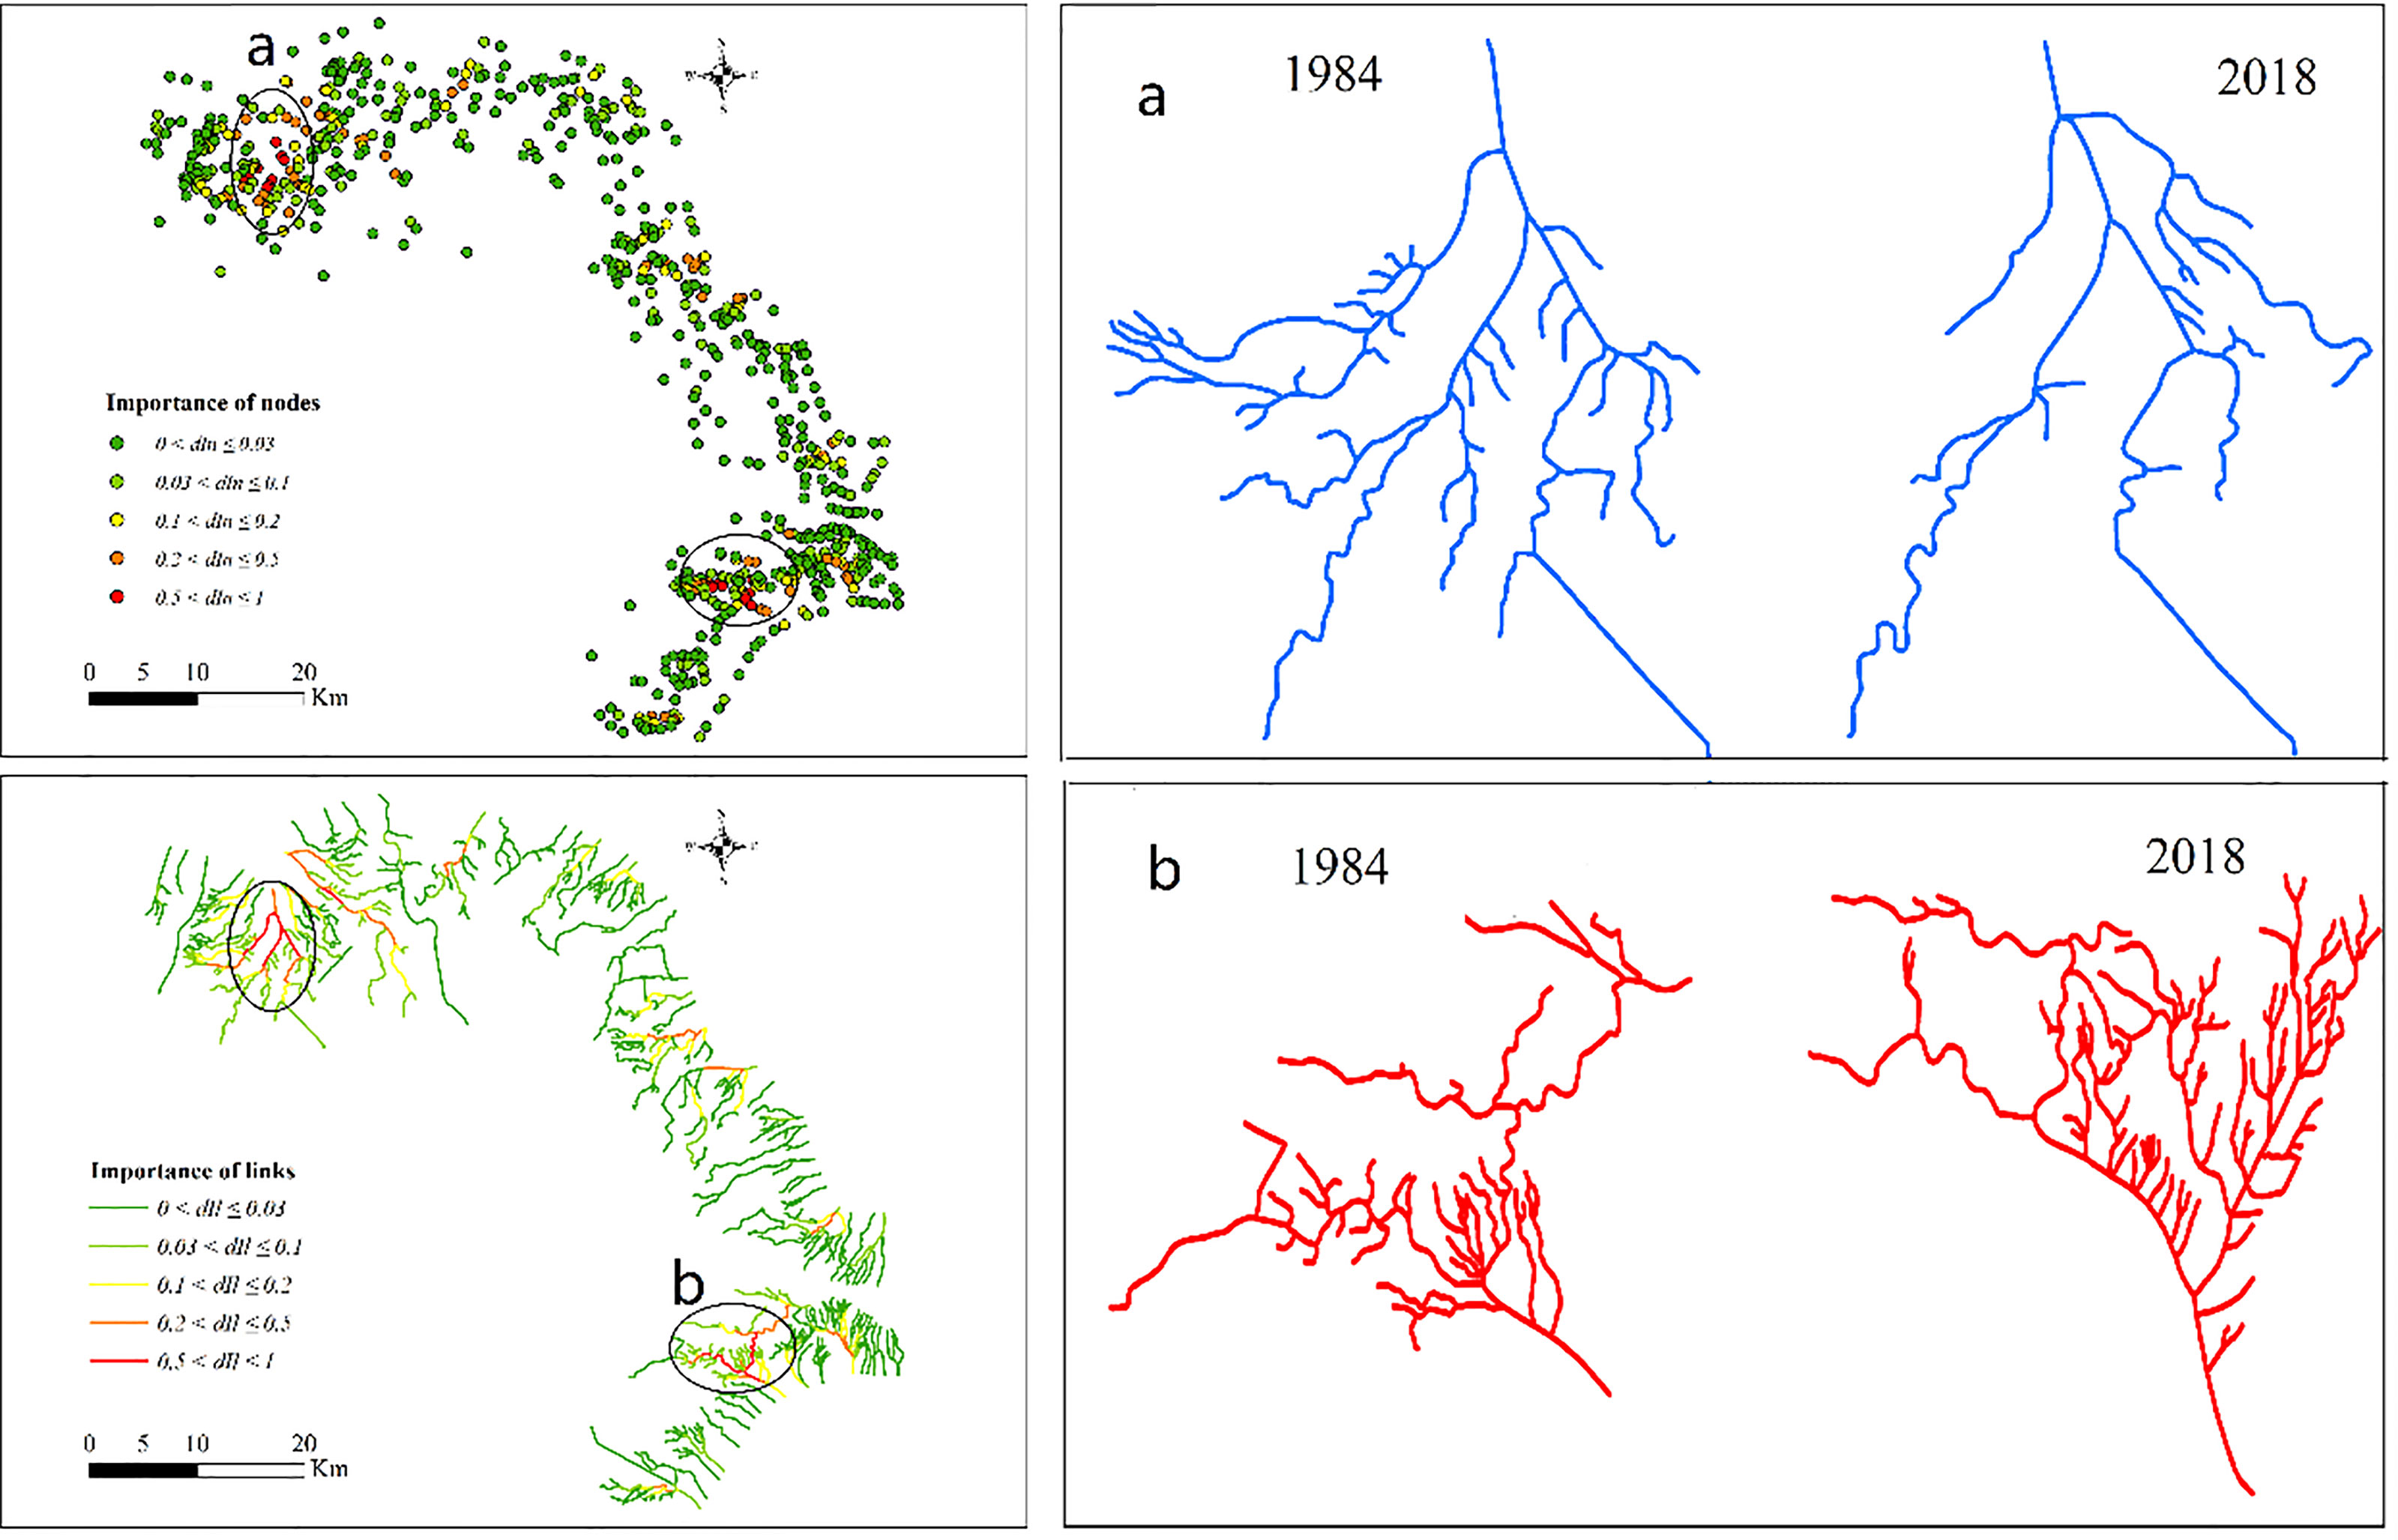
Figure 8 Critical impaired zone (A) and dynamic stable zone (B) of longitudinal hydrological connectivity in the YRD.
To further explore the structure dynamic in two different states of longitudinal connectivity, we analysed the spatiotemporal variation in outlet count and the relationship between the outlets count and importance of links. As showed in Figure 9, two clearly stages were found in both critical impaired zone and dynamic stable zone, an increasing stage and a decreasing stage. However, the number of outlets in the dynamic stable zone was significantly larger than that in the critical impaired zone. The index of importance of links can partly represent the state of longitudinal hydrological connectivity. We found that there existed a threshold relation between the outlet count and importance of links. When the number of outlets reached 70, the importance of links approached stability. This result provided us a possible method which we could restore the impaired hydrological connectivity by adding the number of outlets in the tidal channel networks.
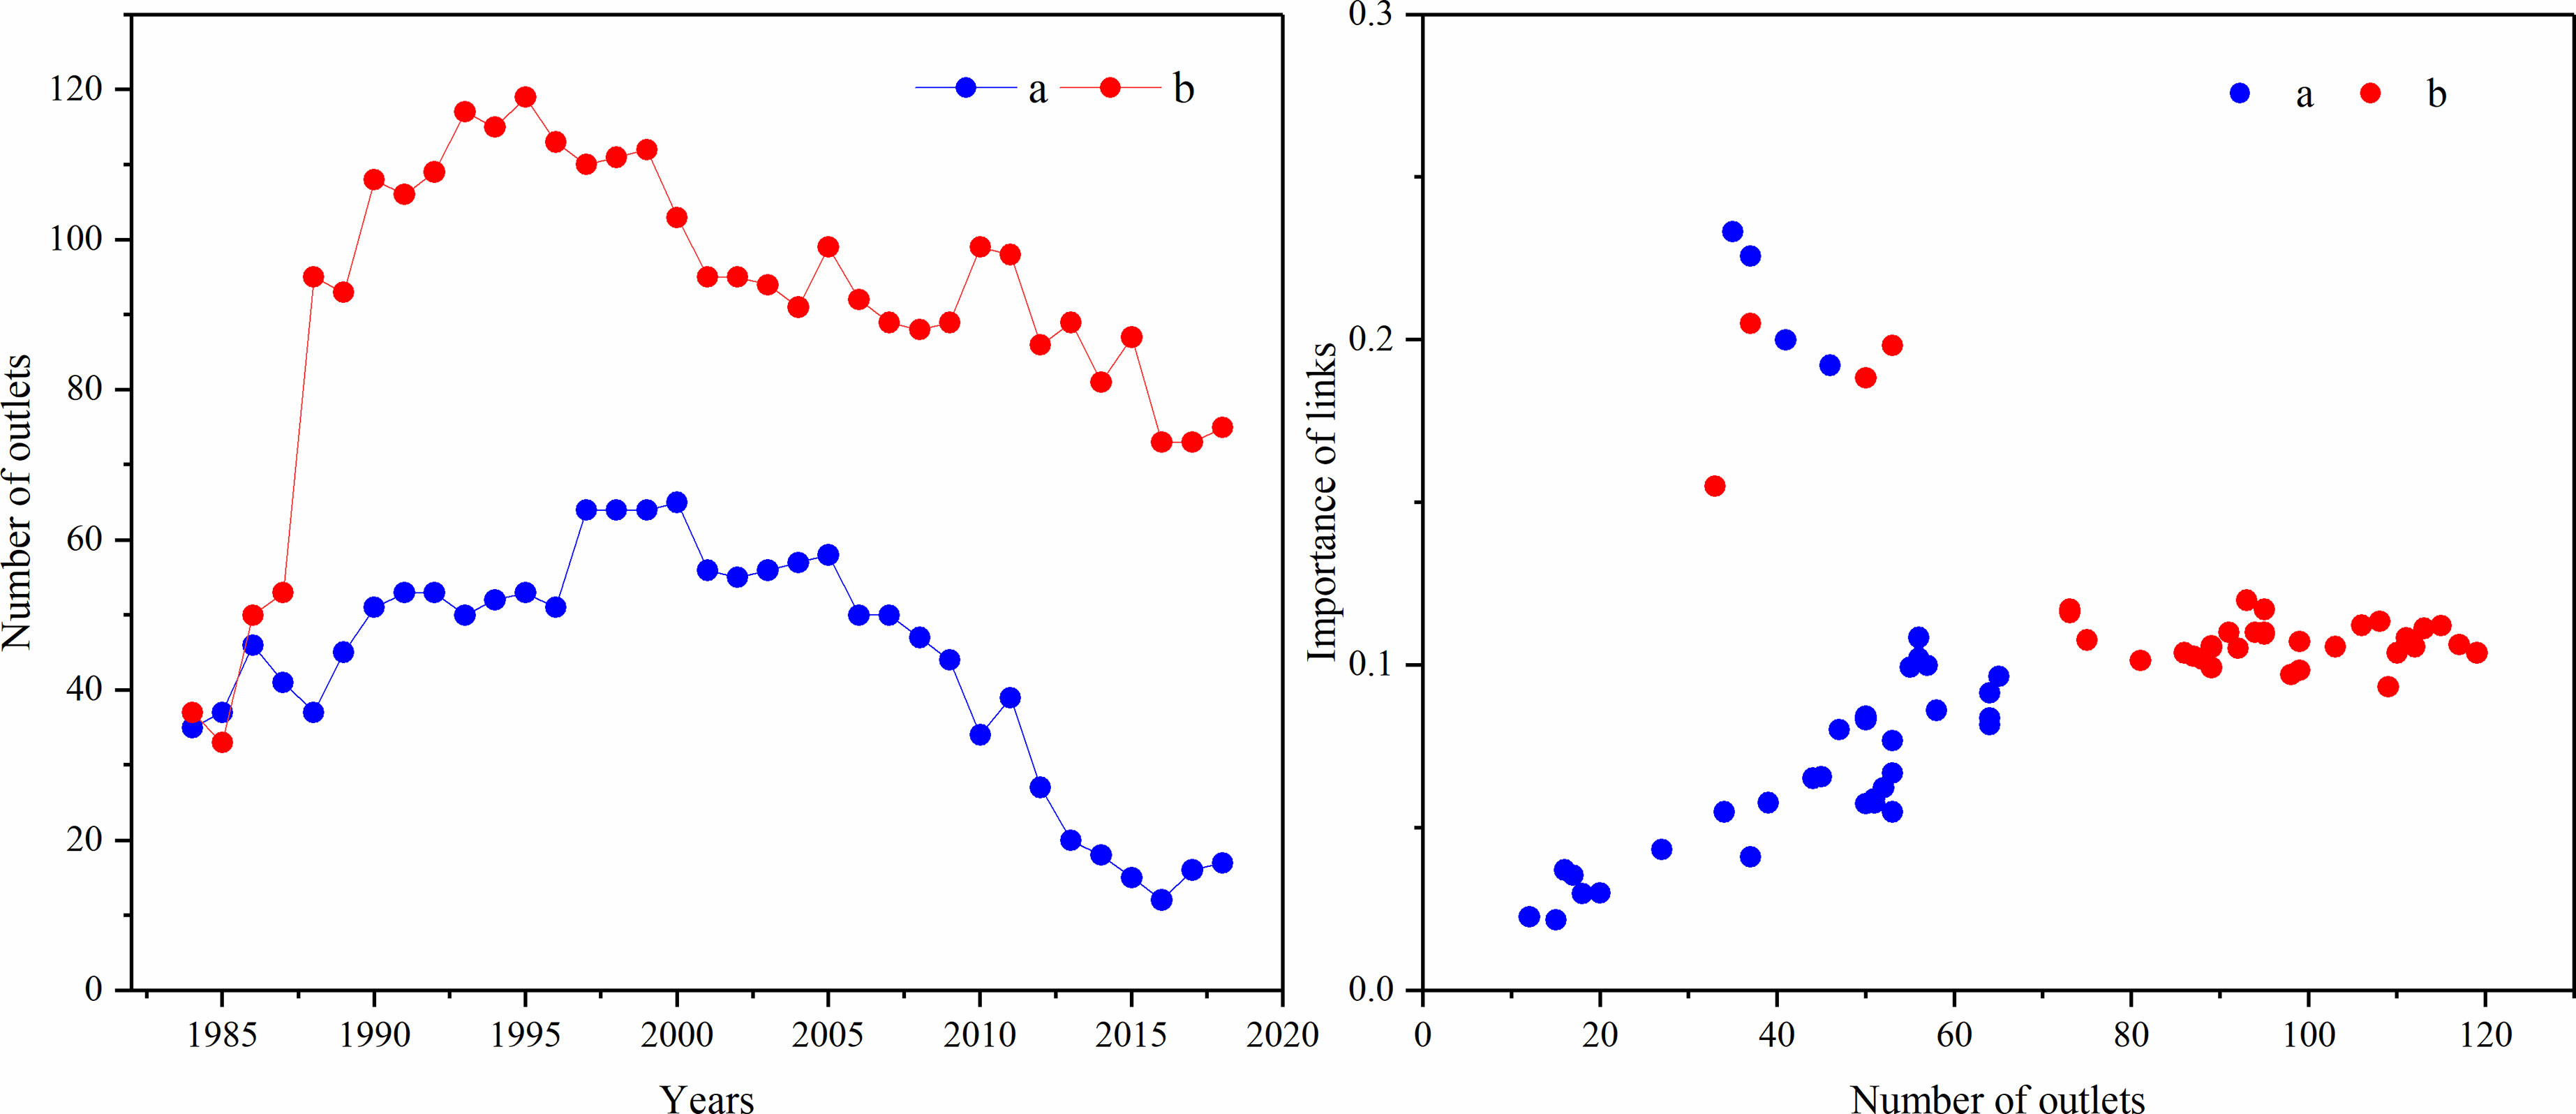
Figure 9 Number of outlets and the relationship between outlets and importance of links in maintaining hydrological connectivity in the YRD (a and b represent critical impaired zone and stable zone respectively).
Longitudinal hydrological connectivity is used to assess the transport potential of materials or organisms between landscape units. It can easily be characterized by the nodes and links with their attribution (Tejedor et al., 2015). Therefore, some indicators based on nodes and links have been developed to calculate the hydrological connectivity in river networks or tidal channel networks, such as the indices of α, β and γ (Cui et al., 2009; Deng et al., 2018; Yu et al., 2018). These indices were much useful to depict the structural connectivity of river networks, the higher value of these indicators meant higher connectivity degree. However, these indices were invalid for assessing regional connectivity where many uncrossed channel networks evolve. For example, the range of the index of α is 0 ≤ α ≤ 1, but in the river delta, its value may be negative. In addition, they cannot identify the key nodes or links that needed for maintaining and improving the current status of hydrological connectivity, and thus, they are not effective indices for evaluating the integral hydrological connectivity in river delta systems.
Here, we introduced connectivity indices that were originally developed in landscape ecology to assess the longitudinal dynamics of hydrological connectivity in the YRD. These indices, NC, H, LCP and IIC, can not only analyse the hydrological connectivity of a single channel network, but also analyze the regional hydrological connectivity that contains many uncrossed channel networks. Moreover, these indices introduce the concept of the importance of nodes and links and can identify them in the channel networks. Each index (NC, H, LCP and IIC) has a corresponding importance value. In the present study, we adopted the importance value of the IIC, as it is an integral index of connectivity that can precisely calculate the connectivity degree on the whole scale or zonal scale of the delta. However, the main disadvantage of these indicators is that they can only reflect the degree of structural connectivity of the tidal channel networks, which is one of the two types of hydrological connectivity. Functional connectivity, which is the other important type of connectivity (Bracken et al., 2013) is equally important. Therefore, these indicators should be improved to reflect their functional properties in the future.
Recently, a larger number of tidal flats have been reclaimed in deltas. For example, in the Yangtze River Delta, some tidal flats have disappeared due to reclamation since 1980 (Zhao et al., 2020). Another example in the YRD, about 60% of tidal flats were reclaimed in 2018 (Xie et al., 2020b). The mass disappearance of tidal flats inevitably changed the spatial arrangement of tidal channel networks (Xie et al., 2020b), which in turn changed the longitudinal hydrological connectivity of the channel network. In the present study, compared to 1984, the number of nodes and links in 2018 slightly increased on the whole scale of the delta, although a clear increasing trend and a decreasing trend were found during this period. This result is because the counts of tidal channel networks experienced an increasing trend and a decreasing trend during 1984-2018 (Xie et al., 2020b). The change in tidal channel networks unavoidably caused the nodes and links to change. On the zonal scale, the counts of nodes and links in the erosion zone increased before 2000 and decreased after 2000, which was mainly due to the complex development of channel networks before 2000, and the simplistic evolution of them after 2000. This phenomenon could be verified by research which showed the fractal dimension of tidal channel networks increased before 2001 (Huang and Fan, 2004), and decreased after 2001 (Xie et al., 2020b). The fractal dimension is one of the most important indicators that can be used as a measure of the complexity of tidal channel networks (Schwarz et al., 2016). In the deposition zone, the nodes and links increased at the initial stage and maintained dynamic stability in the following stage, which was also closely related to its geomorphic evolution.
The connectivity indices showed a similar trend with the nodes and links regardless of research scales except for the NC; this result was because nodes and links were the structural units of hydrological connectivity, and these indicators were calculated based on the relationships between the nodes and links. The number of nodes and links influenced the degree of hydrological connectivity. A large number of nodes and links meant a stronger longitudinal hydrological connectivity (Deng et al., 2018). In the present study, the degree of longitudinal connectivity showed a weak increasing trend on the whole delta in the research period, including a clear increasing period and a significant decreasing stage. In the former stage, tidal channel networks evolved complicatedly. Although reclamation had persisted for years, it did not have a significant influence on the development of channel networks. In the latter period, reclamation exceeded a certain proportion and thus caused tidal channel networks to develop towards the reverse (Xie et al., 2020b). Increasing simplistic channel networks resulted in a decreasing degree of connectivity. On the zonal scale, longitudinal hydrological connectivity in the erosion zone exhibited a net declining trend during 1984-2018, including an enhanced stage from 1984-2000 and a weakened stage from 2000-2018. These characteristics were also closely linked to the geomorphologic variation in the channel network in this area. Li et al. (2020) showed that the degree of hydrological connectivity in the erosion zone increased significantly in 2010-2015, which seems to conflict with our results. This outcome was mainly because the research area in Li’s paper included only a small part of our erosion zone where the tidal channel networks evolved naturally due to less human interference. This result further implied that we should be cautious about making strong conclusions as different research scales might result in different outcomes.
River delta wetlands are diverse ecosystems and have become hot spot regions for both ecological and socioeconomic research (Van de Giesen, 2020). However, many of the deltaic wetland are expected to accelerate loss due to anthropogenic activities (Blackwell et al., 2020), such as in the Mississippi Delta and Indus Delta (Liviu et al., 2014). The loss of deltaic wetlands is mainly attributed to the interruption of hydrological connectivity between tidal flats and tidal creeks. Therefore, hydrological connectivity repair is widely used for delta wetland restoration. Nevertheless, not all areas with impaired hydrological connectivity need to be repaired, as the restoration of hydrological connections in some areas will not obviously improve overall ecosystem function, and the cost also needs to be considered. Similar to the river network systems that exist in critical source areas (Lane et al., 2009) and critical nodes (Sarker et al., 2019), tidal channel systems also have critical areas. Thus, identifying the key damaged area and restoring them may be more effective for ecosystem functional improvement. In the present work, we identified the key impaired areas of longitudinal connectivity and proposed the possible repair measures. Therefore, we can adopt the approaches and prioritize the hydrological connectivity restoration of this area in future repair projects.
This study was intended to explore the spatiotemporal variation in longitudinal hydrological connectivity in the YRD. Based on graph theory, we generalized annual tidal channel networks into nodes and links and constructed the adjacency matrices according to their spatial relationships. The adjacency matrix contained the information related to nodes and links and could be used to develop connectivity indices. Four indicators were used to analyse the longitudinal connectivity dynamics on the whole scale of the delta and on the zonal scale of the delta. Our study indicated that the change in hydrological connectivity varied with scales. On the whole delta scale, the degree of connectivity showed a weak increasing trend between 1984 and 2018, containing a clear increasing stage and a marked declining stage. On the zonal scale an increased period and a decreased period were found in the erosion zone and an increased stage and a relatively stable phase were found in the deposition zone. The variation in longitudinal hydrological connectivity was closely linked to the morphological changes in the tidal channel networks. In addition, our study further identified the key damaged area and the relatively stable zone of longitudinal connectivity respectively, and proposed the feasible restoration approach for hydrological connectivity repair. The discovery of these two critical areas and possible restoration measure can provides guidance for site selection for future hydrological connectivity restoration.
The raw data supporting the conclusions of this article will be made available by the authors, without undue reservation.
CX, investigation, conceptualization,formal analysis, and writing -original draft. TX, review and editing.BC, ZN and SY, designing, reviewing and editing and revisingthe manuscript.All authors contributed to thearticle and approved the submitted version.
This work was supported by the Key Project of National Natural Science Foundation of China (No. U2243208 & U1901212), and the Youth Program of National Natural Science Foundation of China (No. 51909006).
The authors declare that the research was conducted in the absence of any commercial or financial relationships that could be construed as a potential conflict of interest.
All claims expressed in this article are solely those of the authors and do not necessarily represent those of their affiliated organizations, or those of the publisher, the editors and the reviewers. Any product that may be evaluated in this article, or claim that may be made by its manufacturer, is not guaranteed or endorsed by the publisher.
The Supplementary Material for this article can be found online at: https://www.frontiersin.org/articles/10.3389/fmars.2022.899671/full#supplementary-material
Baranyi G., Saura S., Podani J., Jordán F. (2011). Contribution of Habitat Patches to Network Connectivity: Redundancy and Uniqueness of Topological Indices. Ecol. Indic. 11 (5), 1301–1310. doi: 10.1016/j.ecolind.2011.02.003
Blackwell E., Shirzaei M., Ojha C., Werth S. (2020). Tracking California’s Sinking Coast From Space: Implications for Relative Sea-Level Rise. Sci. Adv. 6 (31), eaba4551. doi: 10.1126/sciadv.aba4551
Bracken L. J., Wainwright J., Ali G. A., Tetzlaff D., Smith M. W., Reaney S. M., et al. (2013). Concepts of Hydrological Connectivity: Research Approaches, Pathways and Future Agendas. Earth. Sci. Rev. 119, 17–34. doi: 10.1016/j.earscirev.2013.02.001
Castello L., Macedo M. N. (2016). Large-Scale Degradation of Amazonian Freshwater Ecosystems. Global. Change Biol. 22 (3), 990–1007. doi: 10.1111/gcb.13173
Chen L., Zhou Z., Xu F., Jimenez M., Tao J., Zhang C. (2020). Simulating the Impacts of Land Reclamation and De-Reclamation on the Morphodynamics of Tidal Networks. Anthrop. Coast. 3 (1), 30–42. doi: 10.1139/anc-2019-0010
Cui B., Wang C., Tao W., You Z. (2009). River Channel Network Design for Drought and Flood Control: A Case Study of Xiaoqinghe River Basin, Jinan City, China. J. Environ. Manage. 90 (11), 3675–3686. doi: 10.1016/j.jenvman.2009.07.010
Deng X. J., Xu Y. P., Han L. F. (2018). Impacts of Human Activities on the Structural and Functional Connectivity of a River Network in the Taihu Plain. Land. Degrad. Dev. 29 (8), 2575–2588. doi: 10.1002/ldr.3008
Dong T. Y., Nittrouer J. A., McElroy B., Il'icheva E., Pavlov M., Ma H., et al. (2020). Predicting Water and Sediment Partitioning in a Delta Channel Network Under Varying Discharge Conditions. Water Resour. Res. 56 (11), 1–21. doi: 10.1029/2020wr027199
Firth L. B., Browne K. A., Knights A. M., Hawkins S. J., Nash R. (2016). Eco-Engineered Rock Pools: A Concrete Solution to Biodiversity Loss and Urban Sprawl in the Marine Environment. Environ. Res. Lett. 11 (9), 94015. doi: 10.1088/1748-9326/11/9/094015
Gong Z., Mou K., Wang Q., Qiu H., Zhang C., Zhou D. (2021). Parameterizing the Yellow River Delta Tidal Creek Morphology Using Automated Extraction From Remote Sensing Images. Sci. Total. Environ. 769, 144572. doi: 10.1016/j.scitotenv.2020.144572
Gu Z., Pan S., Lin Z., Hu L., Dai X., Chang J., et al. (2021). Climate-Driven Flyway Changes and Memory-Based Long-Distance Migration. Nature 591 (7849), 259–264. doi: 10.1038/s41586-021-03265-0
Heckmann T., Schwanghart W., Phillips J. D. (2015). Graph Theory—Recent Developments of its Application in Geomorphology. Geomorphology 243, 130–146. doi: 10.1016/j.geomorph.2014.12.024
Hiatt M., Passalacqua P. (2015). Hydrological Connectivity in River Deltas: The First-Order Importance of Channel-Island Exchange. Water Resour. Res. 51 (4), 2264–2282. doi: 10.1002/2014wr016149
Hoitink A. J. F., Nittrouer J. A., Passalacqua P., Shaw J. B., Langendoen E. J., Huismans Y., et al. (2020). Resilience of River Deltas in the Anthropocene. J. Geophys. Res. Earth. Surf. 125 (3), 1–24. doi: 10.1029/2019jf005201
Huang H., Fan H. (2004). Change Detection of Tidal Flats and Tidal Creeks in the Yellow River Delta Using Landsat TM/ETM+Images. Acta Geog. Sin. 59 (5), 723–730. doi: 10.11821/xb200405010
Jaramillo F., Brown I., Castellazzi P., Espinosa L., Guittard A., Hong S.-H., et al. (2018). Assessment of Hydrologic Connectivity in an Ungauged Wetland With InSAR Observations. Environ. Res. Lett. 13, 024003. doi: 10.1088/1748-9326/aa9d23
Jarriel T., Isikdogan L. F., Bovik A., Passalacqua P. (2020). System Wide Channel Network Analysis Reveals Hotspots of Morphological Change in Anthropogenically Modified Regions of the Ganges Delta. Sci. Rep. 10 (1), 12823. doi: 10.1038/s41598-020-69688-3
Kearney W. S., Fagherazzi S. (2016). Salt Marsh Vegetation Promotes Efficient Tidal Channel Networks. Nat. Commun. 7, 12287. doi: 10.1038/ncomms12287
Keesstra S., Nunes J. P., Saco P., Parsons T., Poeppl R., Masselink R., et al. (2018). The Way Forward: Can Connectivity be Useful to Design Better Measuring and Modelling Schemes for Water and Sediment Dynamics? Sci. Total. Environ. 644, 1557–1572. doi: 10.1016/j.scitotenv.2018.06.342
Kirwan M. L., Megonigal J. P. (2013). Tidal Wetland Stability in the Face of Human Impacts and Sea-Level Rise. Nature 504 (7478), 53–60. doi: 10.1038/nature12856
Lane S. N., Reaney S. M., Heathwaite A. L. (2009). Representation of Landscape Hydrological Connectivity Using a Topographically Driven Surface Flow Index. Water Resour. Res. 45 (8), W08423. doi: 10.1029/2008wr007336
Larsen L. G., Choi J., Nungesser M. K., Harvey J. W. (2012). Directional Connectivity in Hydrology and Ecology. Ecol. Appl. 22 (8), 2204–2220. doi: 10.1890/11-1948.1
Li D., Xie T., Ma X., Cui B., Wu X., Che C., et al. (2020). Temporal and Spatial Pattern Evolution of Hydrological Connectivity of the Old Track of Yellow River in Diaokouhe From 1985 to 2015. Environ. Ecol. 2 (1), 10–16.
Liu Y. A., Cong P. F., Li J., Wei B. Q., Dai J., Cheng W. H. (2020). A Morphological Analysis of Tidal Creek in the Yellow River Delta Based on Remote Sensing. Mar. Environ. Sci. 39 (03), 393–398. doi: 10.13634/j.cnki.mes.2020.03.011
Liu J., Engel B. A., Zhang G., Wang Y., Wu Y., Zhang M., et al. (2020). Hydrological Connectivity: One of the Driving Factors of Plant Communities in the Yellow River Delta. Ecol. Indic. 112, 106150. doi: 10.1016/j.ecolind.2020.106150
Liviu G., James S., Stefan C., John D. (2014). Climate Change: Protect the World's Deltas. Nature 516 (7529), 31–33. doi: 10.1038/516031a
Lopez-Vicente M., Nadal-Romero E., Cammeraat E. L. H. (2017). Hydrological Connectivity Does Change Over 70 Years of Abandonment and Afforestation in the Spanish Pyrenees. Land. Degrad. Dev. 28 (4), 1298–1310. doi: 10.1002/ldr.2531
Newman M. E. J. (2003). The Structure and Function of Complex Networks. Siam. Rev. 45 (2), 167–256. doi: 10.1137/s003614450342480
Nienhuis J. H., Ashton A. D., Edmonds D. A., Hoitink A. J. F., Kettner A. J., Rowland J. C., et al. (2020). Global-Scale Human Impact on Delta Morphology has Led to Net Land Area Gain. Nature 577 (7791), 514–518. doi: 10.1038/s41586-019-1905-9
Pascual-Hortal L., Saura S. (2006). Comparison and Development of New Graph-Based Landscape Connectivity Indices: Towards the Priorization of Habitat Patches and Corridors for Conservation. Landsc. Ecol. 21 (7), 959–967. doi: 10.1007/s10980-006-0013-z
Passalacqua P. (2017). The Delta Connectome: A Network-Based Framework for Studying Connectivity in River Deltas. Geomorphology 277, 50–62. doi: 10.1016/j.geomorph.2016.04.001
Pearson S. G., Prooijen B. C., Elias E. P. L., Vitousek S., Wang Z. B. (2020). Sediment Connectivity: A Framework for Analyzing Coastal Sediment Transport Pathways. J. Geophys. Res. Earth. Surf. 125 (10), 1–25. doi: 10.1029/2020jf005595
Poeppl R. E., Keesstra S. D., Maroulis J. (2017). A Conceptual Connectivity Framework for Understanding Geomorphic Change in Human-Impacted Fluvial Systems. Geomorphology 277, 237–250. doi: 10.1016/j.geomorph.2016.07.033
Pringle C. M. (2001). Hydrologic Connectivity and the Management of Biological Reserves: A Global Perspective. Ecol. Appl. 11 (4), 981–998. doi: 10.1890/1051-0761
Ruddell B. L., Kumar P. (2009). Ecohydrologic Process Networks: 1. Identification. Water Resour. Res. 45 (3), w03419. doi: 10.1029/2008wr007279
Sarker S., Veremyev A., Boginski V., Singh A. (2019). Critical Nodes in River Networks. Sci. Rep. 9, 11178. doi: 10.1038/s41598-019-47292-4
Schwarz C., Ysebaert T., Vandenbruwaene W., Temmerman S., Zhang L. Q., Herman P. M. J. (2016). On the Potential of Plant Species Invasion Influencing Bio-Geomorphologic Landscape Formation in Salt Marshes. Earth. Surf. Process. Landf. 41 (14), 2047–2057. doi: 10.1002/esp.3971
Sendrowski A., Passalacqua P. (2017). Process Connectivity in a Naturally Prograding River Delta. Water Resour. Res. 53 (3), 1841–1863. doi: 10.1002/2016wr019768
Shi H., Shen Y., Kang M. (2016). Rapid Response of Tidal Creek Network Patterns to the Reclamation on the Cetral Jiangsu Coast. Haiyang. Xuebao. 38 (01), 106–115. doi: 10.3969/j.issn.0253-4193.2016.01.010
Singh M., Sinha R. (2018). Evaluating Dynamic Hydrological Connectivity of a Floodplain Wetland in North Bihar, India Using Geostatistical Methods. Sci. Total. Environ. 651 (Pt 2), 2473–2488. doi: 10.1016/j.scitotenv.2018.10.139
Singh M., Sinha R., Tandon S. K. (2021). Geomorphic Connectivity and its Application for Understanding Landscape Complexities: A Focus on the Hydro-Geomorphic Systems of India. Earth. Surf. Process. Landf. 46 (1), 110–130. doi: 10.1002/esp.4945
Strain E. M. A., Olabarria C., Mayer-Pinto M., Cumbo V., Morris R. L., Bugnot A. B., et al. (2018). Eco-Engineering Urban Infrastructure for Marine and Coastal Biodiversity: Which Interventions Have the Greatest Ecological Benefit? J. Appl. Ecol. 55 (1), 426–441. doi: 10.1111/1365-2664.12961
Tejedor A., Longjas A., Caldwell R., Edmonds D. A., Zaliapin I., Foufoula-Georgiou E. (2016). Quantifying the Signature of Sediment Composition on the Topologic and Dynamic Complexity of River Delta Channel Networks and Inferences Toward Delta Classification. Geophys. Res. Lett. 43 (7), 3280–3287. doi: 10.1002/2016gl068210
Tejedor A., Longjas A., Passalacqua P., Moreno Y., Foufoula-Georgiou E. (2018). Multiplex Networks: A Framework for Studying Multiprocess Multiscale Connectivity via Coupled-Network Theory With an Application to River Deltas. Geophys. Res. Lett. 45 (18), 9681–9689. doi: 10.1029/2018gl078355
Tejedor A., Longjas A., Zaliapin I., Foufoula-Georgiou E. (2015). Delta Channel Networks: 1. A Graph-Theoretic Approach for Studying Connectivity and Steady State Transport on Deltaic Surfaces. Water Resour. Res. 51 (6), 3998–4018. doi: 10.1002/2014wr016577
Van de Giesen N. (2020). Human Activities Have Changed the Shapes of River Deltas. Nature 577, 473. doi: 10.1038/d41586-020-00047-y
Wainwright J., Turnbull L., Ibrahim T. G., Lexartza-Artza I., Thornton S. F., Brazier R. E. (2011). Linking Environmental Regimes, Space and Time: Interpretations of Structural and Functional Connectivity. Geomorphology 126 (3-4), 387–404. doi: 10.1016/j.geomorph.2010.07.027
Wohl E., Brierley G., Cadol D., Coulthard T. J., Covino T., Fryirs K. A., et al. (2018). Connectivity as an Emergent Property of Geomorphic Systems. Earth. Surf. Process. Landf. 44 (1), 4–26. doi: 10.1002/esp.4434
Wright K., Hiatt M., Passalacqua P. (2018). Hydrological Connectivity in Vegetated River Deltas: The Importance of Patchiness Below a Threshold. Geophys. Res. Lett. 45, 79183. doi: 10.1029/2018gl079183
Xie C., Cui B., Xie T., Yu S., Liu Z., Chen C., et al. (2020a). Hydrological Connectivity Dynamics of Tidal Flat Systems Impacted by Severe Reclamation in the Yellow River Delta. Sci. Total. Environ. 739, 139860. doi: 10.1016/j.scitotenv.2020.139860
Xie C., Cui B., Xie T., Yu S., Liu Z., Wang Q., et al. (2020b). Reclamation Shifts the Evolutionary Paradigms of Tidal Channel Networks in the Yellow River Delta, China. Sci. Total. Environ. 742, 140585. doi: 10.1016/j.scitotenv.2020.140585
Yu X., Zhang Z., Xue Z., Song X., Zhang H., Wu H. (2018). Morphological Characteristics and Connectivity of Tidal Channels in the Yellow River Delta for 7 Periods Since 1989. Wetl. Sci. 16 (04), 517–523. doi: 10.13248/j.cnki.wetlandsci.2018.04.010
Keywords: longitudinal connectivity, structural connection, tidal channel networks, spatiotemporal change, coastal wetlands
Citation: Xie C, Cui B, Ning Z, Yu S and Xie T (2022) Longitudinal Dynamics of Hydrological Connectivity in the Yellow River Delta, China. Front. Mar. Sci. 9:899671. doi: 10.3389/fmars.2022.899671
Received: 19 March 2022; Accepted: 20 April 2022;
Published: 12 May 2022.
Edited by:
Zeng Zhou, Hohai University, ChinaReviewed by:
Zhenchang Zhu, Guangdong University of Technology, ChinaCopyright © 2022 Xie, Cui, Ning, Yu and Xie. This is an open-access article distributed under the terms of the Creative Commons Attribution License (CC BY). The use, distribution or reproduction in other forums is permitted, provided the original author(s) and the copyright owner(s) are credited and that the original publication in this journal is cited, in accordance with accepted academic practice. No use, distribution or reproduction is permitted which does not comply with these terms.
*Correspondence: Baoshan Cui, Y3VpYnNAYm51LmVkdS5jbg==; Tian Xie, dGlhbnhpZUBibnUuZWR1LmNu
Disclaimer: All claims expressed in this article are solely those of the authors and do not necessarily represent those of their affiliated organizations, or those of the publisher, the editors and the reviewers. Any product that may be evaluated in this article or claim that may be made by its manufacturer is not guaranteed or endorsed by the publisher.
Research integrity at Frontiers
Learn more about the work of our research integrity team to safeguard the quality of each article we publish.