 Deepti M. Patel
 Monica F. Brinchmann
 Anna Hanssen
 Martin H. Iversen
95% of researchers rate our articles as excellent or good
Learn more about the work of our research integrity team to safeguard the quality of each article we publish.
Find out more
ORIGINAL RESEARCH article
Front. Mar. Sci. , 17 May 2022
Sec. Marine Biotechnology and Bioproducts
Volume 9 - 2022 | https://doi.org/10.3389/fmars.2022.891451
This article is part of the Research Topic High Throughput Omics Technologies for Understanding Molecular Stress Response and Devising Mitigation Actions View all 8 articles
Lumpfish (Cyclopterus lumpus L) is a North Atlantic species harvested for its roe and increasingly used as a cleanerfish in Atlantic salmon (Salmo salar L.) farming to remove salmon louse (Lepeophtheirus salmonis). In aquaculture, the health and welfare of fish depends on optimal levels of several biotic and abiotic factors. Crowding, a common abiotic stress factor in aquaculture practice, can affect the welfare and survival of fish. In this study, lumpfish was exposed to crowding stress daily at random timepoints for one month (stress group) or no crowding (control group). Blood and skin were sampled weekly for physiological parameter analysis and proteomics, respectively. Adrenocorticotropic hormone (ACTH) stimulation and dexamethasone (DEX) suppression test were conducted at the sampling timepoints. Gel-based proteomics coupled with liquid chromatography and tandem mass spectrometry (LC-MS/MS) was used to identify protein changes in skin tissues of lumpfish under crowding. The results indicated that the stress group showed signs of allostatic overload type 2 (chronic stress) due to oversensitivity to ACTH, and a reduced negative feedback system with increased baseline levels of cortisol. These chronic changes in the endocrine system promoted changes in secondary and tertiary stress responses as reduced osmoregulatory capacity and stunted growth, after 14 days of stress and onward. Calmodulin, guanine nucleotide binding protein subunit beta 2, glutathione-S-transferase Mu 3, fatty acid binding protein, heat shock cognate 70 kDa protein, keratin, histone H4 and 14-3-3 alpha/beta showed protein spot intensity changes compared with controls in lumpfish skin at one or several time points during the one month period of crowding stress. The differentially expressed proteins are related to several metabolic pathways and are involved in stress and immune responses. Overall, the study shows that lumpfish can suffer from chronic stress with possible dire consequences for the animal welfare.
The cleanerfish lumpfish, is kept in sea pens together with Atlantic salmon and is exposed to stressors due to management practices such as crowding. Crowding is known to affect Atlantic salmon’s physiological status and disease resistance, alter the immune response of the organism, and reduce its capacity to fight against diseases (Iversen and Eliassen, 2014; Abdel-Tawwab et al., 2019; Petitjean et al., 2019; Delfosse et al., 2021). As a response to any stressful event animals releases cortisol to the bloodstream under the influence of the hypothalamus-pituitary-interrenal (HPI) axis. This initiates a series of physiological cascades that influences growth, metabolism, osmoregulation, respiratory and immune functions (Iwama, 1998).
Every year almost 50 million cleaner fish are reported as loss in Norwegian aquaculture. This is unfortunately a minimum number estimate (Stranden, 2020). In a lumpfish study there was a 27% loss in 4 months (Geitung et al., 2020) and 45% loss was reported in a national Norwegian survey among Atlantic salmon farms (Stien et al., 2020). By using an operational index of welfare, 29% of lumpfish was shown to have suboptimal welfare (Gutierrez Rabadan et al., 2021). To ensure good welfare, increased knowledge of the biology of lumpfish is needed, including knowledge of its capacity to handle stressful events.
Measurement of plasma cortisol is a common method to assess stress levels in most vertebrates including fish (Ellis et al., 2012; Thang et al., 2017). Stress is defined as a condition in which the “dynamic equilibrium” of an organism, called homeostasis, is threatened or disturbed as a result of the actions of internal or external stimuli, commonly defined as stressors (Selye, 1950; Selye, 1973; Wendelaar Bonga, 1997; Varsamos et al., 2006; Wendelaar Bonga, 2011). The concept of allostasis has been introduced to complement the concept of stress, and more precisely, to describe the role of primary mediators (e.g. glucocorticosteroids) in response to a stressor, and thus considered allostasis to be “the ability to achieve stability through change.” (McEwen, 1998; McEwen and Wingfield, 2003; Goymann and Wingfield, 2004; McEwen, 2005; Wingfield, 2005). This is a process that supports homeostasis, —i.e physiological parameters that are essential for life, and are affected by changes in environment and/or life history stages. Activation of an allostatic response through the HPI axis, results in increased levels of catecholamines and cortisol in the blood (Wendelaar Bonga, 2011), this is part of the primary stress response. HPI activation is initiated through a cascade of endocrine signals where the release of corticotropin-releasing factor (CRF) from the hypothalamus stimulates the release of adrenocorticotropin hormone (ACTH) from cells in the distal part of the pituitary gland. ACTH is the major stimulant for the synthesis and release of cortisol in the head kidney of fish. Cortisol released in the blood will again function as a negative feedback, stopping the release of CRF and ACTH, thus reducing plasma cortisol back to normal resting levels (Mommsen et al., 1999; Wendelaar Bonga, 2011).
However, even if information on stress tolerance is important in a welfare optimization frame, as far as we know no scientific study has been published on the allostatic load and dynamics of the HPI-axis in lumpfish subjected to a long-term crowding (chronic) stressor. Thus, in this study we assess the primary stress response in context to the corticotropic axis and its influence on secondary and tertiary stress responses in lumpfish subjected to chronic stress, as well as the physiological stress responses at the molecular level. Secondary stress responses resulting from the changes in endocrine signals, in particular cortisol, classically include changes in metabolism (e.g glucose and lactate levels), changes in osmoregulation (changes in osmolality and ion levels) and changes in immune and physiological defense mechanisms (e. g. heat shock proteins and immune relevant proteins). If the stress continues, tertiary stress responses (whole animal changes) such as immune suppression, changes in growth, behavior and swimming capacity (Barton, 2002).
Stress response is a very complex process that involves several molecular factors. In brief, the response initiates with a sensor that senses the danger signals from the stressors, and relay it to the effectors, that starts the complex signaling pathway to overcome the stress effect (Smith and Workman, 2012). Studies on involved proteins/genes could boost the knowledge on understanding the stress response. Proteomics has been used to study the effect of environmental stressors such as the effect of osmotic stress on serum proteome of tilapia (Oreochromis niloticus) (Kumar et al., 2009), effect of hypoxia on the serum proteome of juvenile Eurasian perch (Perca fluviatilis) (Douxfils et al., 2012), effect of microcystin-LR on the liver proteome of medaka (Oryzias latipes) (Karim et al., 2011), changes in skin mucus proteome in chronically stressed gilthead seabream (Sparus aurata) (Cordero et al., 2016; Pérez-Sánchez et al., 2017), changes in blood plasma and muscle proteome of Atlantic salmon under crowding stress (Veiseth-Kent et al., 2010), changes in plasma proteome of gilthead seabream after crowding, netting and hypoxia (Raposo de Magalhães et al., 2020) and effect of crowding stress on physiological state and flesh quality of a crustacean, chinese shrimp (Feneropenaeus chinensis) (Zhang et al., 2014). These studies suggested the involvement of several genes/proteins in stress responses in fish exposed to stressors. Some of the proteins identified are heat shock proteins, apolipoproteins, lectins, complements factors, several antimicrobial proteins, enzymes and acute phase proteins (Ni et al., 2014; Cordero et al., 2016; Pérez-Sánchez et al., 2017; Raposo de Magalhães et al., 2020).
However, very little has been explored in terms of change in the skin proteome of teleosts under prolonged crowding stress. Skin is the largest and outermost organ in fish. It serves several biological functions such as osmoregulation, mechanical protection, primary line of defense against pathogens and external stressors (Esteban, 2012).
The aim of this study is to monitor the stress response of lumpfish after repeated crowding and identify proteomics changes in lumpfish (Cyclopterus lumpus) skin, that have a potential to contribute to better understanding of fish welfare and health management.
Arctic Cleaner Fish AS, Stamsund, Norway, provided the fish used in the study. The fish arrived as newly hatched fry and were maintained at Mørkvedbukta Research Station, Nord University, Bodø, Norway at 8 ± 0.4°C and oxygen level 85 ± 3% O2 saturation. The lumpfish were acclimatized for one month before the start of the experiment. The fish were start fed with Gemma micro feed (50-400 μm, dry pellet, Skretting AS, Norway) and later fed with Amber Neptun ST pellet 1 μm- 4 µm, (Skretting AS, Norway) depending on the size of lumpfish. Lumpfish of an average weight of 52.7 g (± 15.1) were acclimated for a period of one month prior the start of experiment.
The stress experiment was approved by the local responsible laboratory animal science specialist under the surveillance of the Norwegian Animal Research Authority (NARA), Norway and was approved by the Norwegian Food Safety Authority (in the FOTS system) registered by the Authority with approval number 7293/15.
Approximately 300 lumpfish were divided in two tanks (1 m3) supplied with seawater from 250 m depth (34 ppt). Fish were divided into two groups; control and stressed (150 fish per tank), the density of fish was 10.5 kg/m3. The stressed group experienced daily crowding stress (260 kg/m3) for a month by lowering the water level till the dorsal fin was exposed and refilling the tank again. It took 6.45 min to drain the water and 14-15 min to refill summing up to approximately 21 min of exposure to the stressor. The stressor was applied randomly every day between 8 am to 4 pm, to ensure that lumpfish did not acclimate to the stressor. The control group did not experience any stress. The fish were anaesthetized with metomidate solution (5 mg/l, Aquacalm, Syndel, USA) and killed with a blow to the head before sampling. Blood samples for analysis of plasma cortisol, lactate, glucose, osmolality, chloride and magnesium were obtained from the caudal vein prior to the start of the experiment (pre-stress), and after 7, 14, 21, 28 days of stress. Six fish from control and six fish form stressed fish were sampled at each timepoint (n=6). Blood was sampled with heparinized syringes on Monday mornings at 8 am, ensuring at least 18 hours of rest after the last exposure to a stressor. Blood was centrifuged at 5000 rpm (3250 g) for 5 min, plasma was removed and stored in cryo tubes at -22°C until analyses were performed. Skin samples (from the dorsal part, near the operculum above the lateral line) were collected on days 7, 14, 21, 28 from stress or control fish for proteomics (n=6) and gene expression (n=5) analysis, samples from each fish were analyzed without pooling. Tissue was flash frozen in liquid nitrogen and stored at -80°C. Lumpfish has very little mucus (from fish of ~700 g scraping the whole surface yields only about 95 µg protein, unpublished data), hence, skin samples (~5 mm2) were sampled without steps to remove mucus.
Plasma cortisol concentrations was measured by a radioimmunoassay (RIA) technique as described by Iversen et al. (1998). Plasma osmolality measured using Wescor 5500 osmo-meter (Wescor®) and chloride levels in Sherwood Chloride Analyzer 926 (Sherwood Scientific Inc. USA). Magnesium (Mg2+) was analysed by a fluidtest® Mg-XB (Biocon®, Germany) adapted for plate count reader. Samples below the detection limit were given a value corresponding to the tests sensitivity, which was 0.4 mmol L-1 (mM). Lactate and glucose were measured in whole blood immediately after taking the sample using Lactate Pro™ (Arkray KDK, Kyoto, Japan) and Freestyle Freedom Lite (Abbott Diabetes Care Ltd., Oxon, UK), respectively. Levels of lactate and glucose below detection limit were assigned a value corresponding to the sensor’s minimal sensitivity, which was 0.8 mM (lactate) and 1.1 mM (glucose). Use of transportable instruments for measuring of glucose and lactate, give equivalent results to established laboratory techniques (Wells and Pankhurst, 1999).
Stimulation (adrenocorticotropic hormone) and suppression (dexamethasone) test was conducted in accordance to Pottinger and Carrick (2001), with some minor modifications. Briefly, on pre-stress, 7, 14, 21 and 28 days after start of the experiment 12 fish per group (a total of 24 fish per time point), were netted from their respective tanks, then anaesthetized (as described in section 2.2), and injected intraperitoneally with 1 mg kg-1 dexamethasone (Sigma-Aldrich) in ethanol: phosphate-buffered saline (PBS; 1:3; 1µg µL-l). Finally, they were transferred to two holding tanks (0.5 m3). After 24 h the fish were netted, anaesthetized, and 6 fish from each group was either given an intraperitoneal injection of 0.5 mL kg-1 adrenocorticotropic hormone (ACTH fragment 1-24; Sigma-Aldrich in PBS at 45 µg m L-1) or 0.5 mL kg-1 PBS, to measure the function of the negative feedback system. The ACTH and PBS groups were kept separate by a wall inserted into two different holding tanks. Two hours after the ACTH/PBS administration, the fish were netted, anaesthetized and blood was sampled, plasma isolated and stored as above (section 2.2).
Modified specific growth rate (SGR) was calculated utilizing the following equation:
An average overall SGR was calculated for the experimental period (28 days) for all experimental groups.
Skin tissues were thawed and homogenized under liquid nitrogen using pestle and mortar. Homogenized samples were dissolved in phosphate buffered saline (Sigma Aldrich, USA) containing (0.1%) protease inhibitor cocktail as per manufacturer’s protocol (GE Healthcare, USA). Proteins were extracted and 2DE analysis was performed following the protocol mentioned elsewhere (Patel and Brinchmann, 2017). In short: For each sample 80 µg protein was loaded in a 17 cm (pH-3–10), IPG strips (immobilized pH gradient, Bio-Rad, USA) by rehydration. Rehydrated strips were subjected to iso-electric focusing in Bio-Rad Protean IEF cell, using three steps of slow ramping at a constant temperature of 20°C to a total volt hours of 60,000 at a maximum of 10,000 V. The focused IPG strips were reduced with DTT and alkylated with iodoacetamide and then loaded on 12.5% polyacrylamide gels in the Bio-Rad Protean IIxii system (USA). The gels were run at constant current, 20 mA/gel, for 15 min and then 6 mA/gel overnight (approx. 16 h), in the morning the current was increased to 15 mA/gel till the dye front reached the bottom of the gel. The voltage limit was 250 V throughout the run. Following the manufacturers protocol gels were stained with Sypro® Ruby Protein gel stain, Life technologies, USA, and images made using ChemiDoc™ XRS system (Bio-Rad). PDQuest software (BioRad, USA) was used to analyse 2D gel images and find differentially expressed spots with a cut off of minimum 1.5-fold change and p-value <0.05 (see further section 2.9). Spots were excised and analysed by LC- MS/MS at the University of Tromsø, Norway.
Excised spots from 2D gels were subjected to in-gel reduction (DTT), alkylation (iodoacetamide), and tryptic digestion using 6 ng/μl trypsin (V511A; Promega). Peptide mixtures in 0.1% formic acid were loaded onto a nanoACQUITY UltraPerformance LC (Waters), containing a 5 μm Symmetry C18 Trap column (180 μm × 20 mm; Waters) in front of a 1.7 μm BEH130 C18 analytical column (100 μm × 100 mm; Waters). Peptides were separated with a gradient of 5–95% acetonitrile, 0.1% formic acid, with a flow of 0.4 μl min−1 eluted to a Q-TOF Ultima mass spectrometer (Micromass/Waters). The run was done in data dependent tandem mass spectrophotometry (MC/MC) mode, and peak lists generated from MS/MS by Mascot Distiller Workstation.
The files obtained from mass spectrometry analysis were blasted in MASCOT (http://www.matrixscience.com/) for protein identity. The specifications used were maximum 1 missed cleavage, fixed carbamidomethyl (C) modification, variable oxidation (M) modification, 100 ppm peptide tolerance, 0.1 Da MS/MS tolerance, monoisotopic, 2+ and 3+ peptide charge and enzyme trypsin. The amino acid sequences were mapped against protein database SwissProt (556196 sequences; 199341870 residues, 06.12.2017) and NCBInr (135744157 sequences; 49805139192 residues, 06.12.2017) restricting the search to Actinopterygii (5307 sequences in SwissProt, 2069668 sequences in NCBI as on 06.12.2017). The gene ontology terms were retrieved from UniProt KB.
We performed real time quantitative PCR (Bustin et al., 2009) of the hspa8 gene to assess the mRNA expression level locally in skin. RNA was extracted using Omega Bio-tek® EZNA Total RNA extraction kit using the manufacturer’s protocol. The RNA integrity was assessed by viewing intact 18S and 28S bands on 1% agarose gel. The quantification was performed in Qubit Fluorometer using Qubit RNA BR assay (Thermo Scientific, USA). The reverse transcription was done using Quantitect Reverse Transcription kit (Qiagen, Germany) using 100 ng of extracted total RNA as input material. The complementary DNA (cDNA) was 5 times diluted and real time PCR was performed on Lightcycler® 96 instrument (Roche, Switzerland) using Sybr green chemistry (Fast start Universal SYBR green, Roche, Switzerland). Fourty five cycles of PCR were run following a preincubation (95°C for 10 min), two step amplification (95°C for 10 s, 60°C for 30 s), and melting (95°C for 10 s, 65°C for 60 s, 95°C for 1 s). A threefold serially diluted cDNA (prepared from pooled RNA) was used to obtained the standard curve for calculation of PCR efficiency (Table 1). The formula used for calculation of PCR efficiency was E = 10^(-1/slope) (Pfaffl, 2001). Beta actin (β- actin) and glyceraldehyde-3-phosphate dehydrogenase (gapdh) were used as reference genes in the study. Primers used in this study were from a previous study on lumpfish (Patel et al., 2019) (Table 2). All plates were run with no template control, positive control (pooled cDNA from all samples) and no reverse transcriptase control. The stability of reference genes were estimated using excel based tool Bestkeeper (Pfaffl et al., 2004). We used the 2−ΔΔCt method for calculation of hspa8 expression (Livak and Schmittgen, 2001).
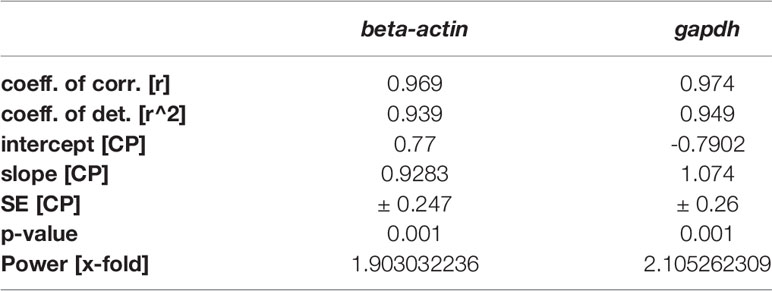
Table 1 Bestkeeper analysis for stability of reference genes.
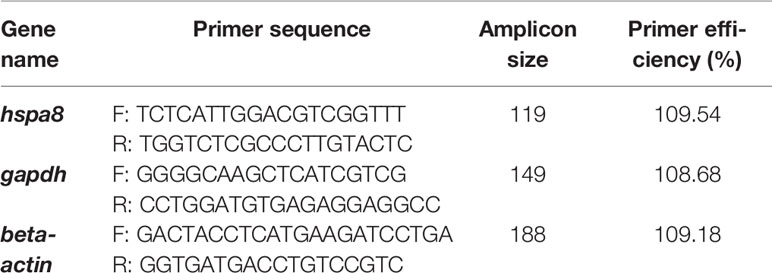
Table 2 Primers used in this study.
The data sets were tested for normality using a Kolmogorov-Smirnov test, and for homogeneity of variance using a Levene test. A one-way ANOVA test was performed at each sampling time in regard for the physiological parameters to test for differences between the test groups and within the groups (Sokal and Rohlf, 1987). If the F-values were significant, a Bonferroni post hoc test was used to determine which groups differed. A Kruskal-Wallis ANOVA (non-parametric) and a Mann-Whitney U-test with a Bonferroni-adjusted significance level were used when requirements for parametric statistics were not met.
Spot intensities from each protein as well as gene expression data from the stressed group were compared with the control group on days 7, 14, 21, and 28, using unpaired t-test. Mann Whitney U test was performed wherever data did not show normal distribution. A one-way ANOVA test was thereafter performed to find the expression trend of spots in the stressed group and control group. Tukey HSD (Honest Significant Difference) test was used for post hoc analysis (p<0.05, n = 6). A Kruskal-Wallis ANOVA (non-parametric) and a Mann-Whitney U-test with a Bonferroni-adjusted significance level were used when requirements for parametric statistics were not met. Significant differences were established at 0.05 levels. Results are given as means ± standard error (SE). Significant differences were established at p<0.05.
The resting levels of plasma cortisol in the no-stress (control) group did not change during the experimental period (Figure 1). The resting plasma cortisol increased in the daily stress group and was significantly elevated compared with pre-stress and control groups at the same sampling time at 21 (25.3 ± 10.1 nM) and 28 (22.5 ± 14.1 nM) days after start of the experiment.
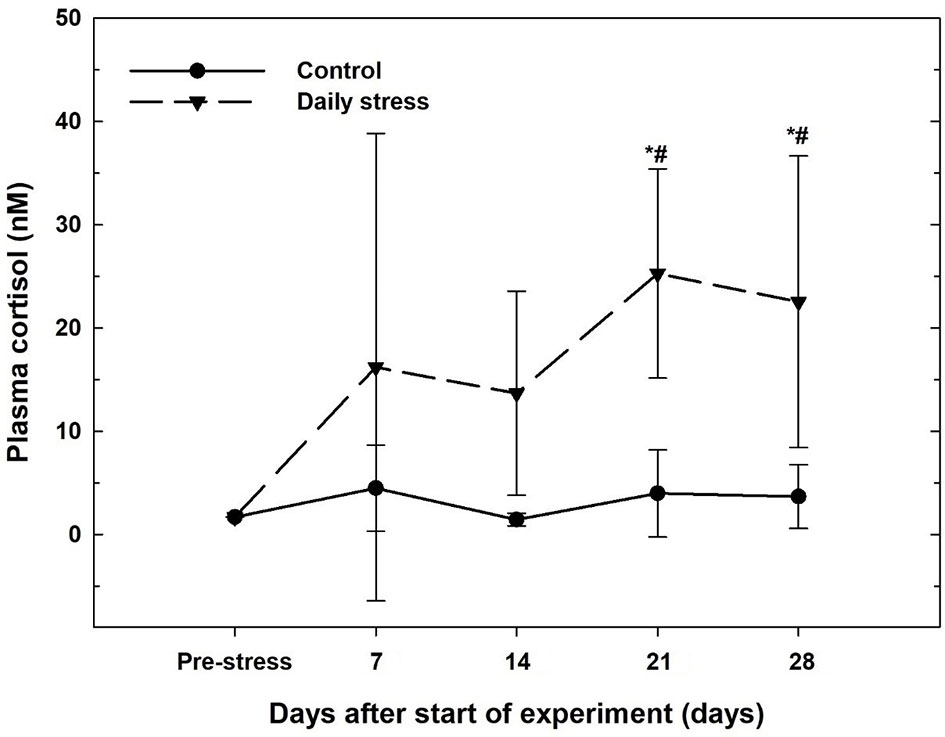
Figure 1 Plasma cortisol levels (mean ± SD, n = 6) in the control group (filled circles) and daily stress group (filled triangles) in lumpfish during the 28 day trial. # indicates significant difference between groups at the same sampling day at 95% confidence level, * indicates significant difference from the pre-stress level at 95% confidence level.
Plasma osmolality pre-stress was 354.83 ± 23.79 mOsm kg-1. There were no significant differences between experimental groups and pre-stress values at 7, 14 and 21 days. At day 28 the stress group plasma osmolality was 391.67 ± 37.59mOsm kg-1, significantly higher than plasma osmolality levels pre-stress and significantly higher than the control group at day 28 (Figure 2A).
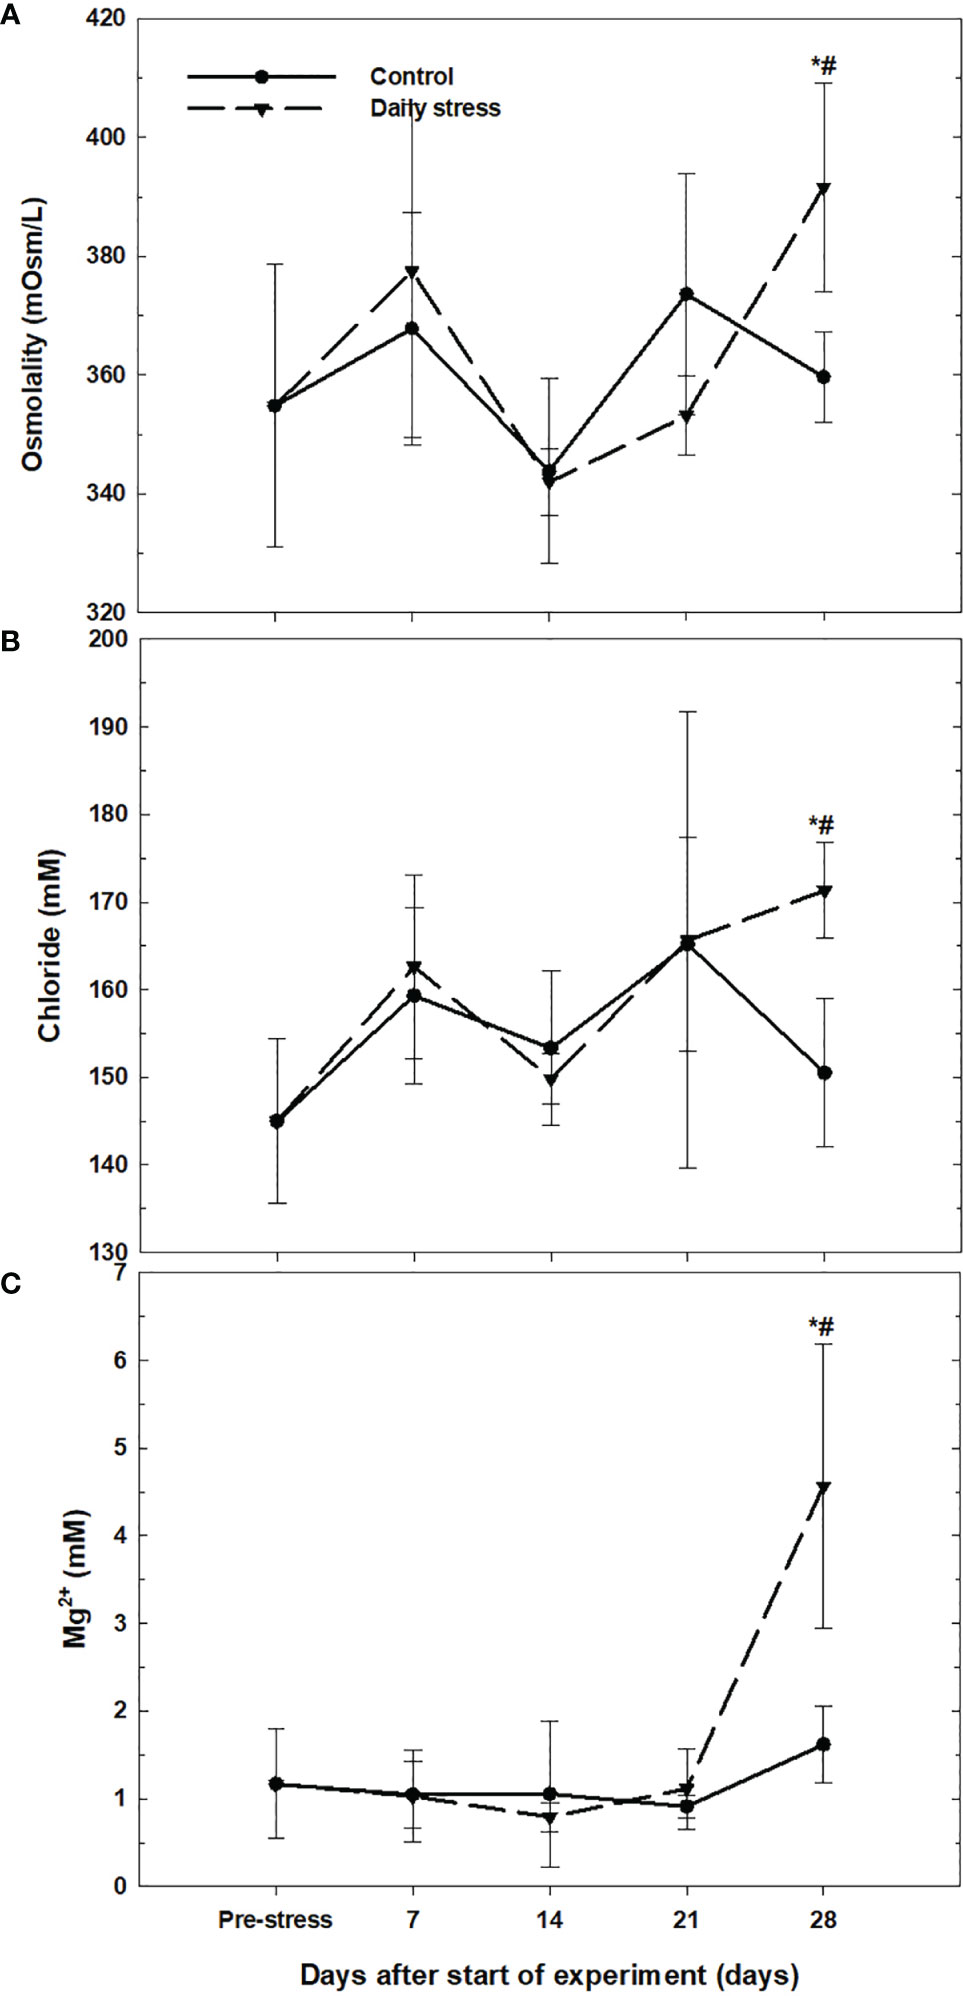
Figure 2 (A) Plasma osmolality (mean ± SD, n = 6) in the control group (filled circles) and daily stress group (filled triangles) in lumpfish during the 28 day trial. (B) Plasma chloride (mean ± SD, n = 6) in the control group (filled circles) and daily stress group (filled triangles) in lumpfish during the 28 day trial. (C) Plasma magnesium (mean ± SD, n = 6) in the control group (filled circles) and daily stress group (filled triangles) in lumpfish during the 28 days trial. # indicates significant difference between groups at the same sampling day at 95% confidence level, * indicates significant difference from the pre-stress level at 95% confidence level.
Average concentration of plasma chloride at pre-stress levels were 145 ± 9.38 mM. There were no significant differences between the experimental groups and pre-stress values at 7, 14 and 21 days. At day 28 the stress group plasma chloride concentration was 171. 33 ± 22.44 mM, significantly higher than the control group at day 28 and pre-stress levels (Figure 2B).
For plasma magnesium there were no significant differences between experimental groups and pre-stress values at 7, 14 and 21 days. At day 28 the stress group plasma magnesium concentration was 4.57 ± 1.62 mM, significantly higher than the control group and pre-stress levels (Figure 2C).
The initial mean glucose levels in the pre-stressed group ranged between 0.7 to 2.1 mM with an average of 1.60 ± 0.59 mM for both groups. The highest glucose levels were detected in the control group at day 14 at 2.97 mM (± 1.78). There were no significant differences between the sampling groups, neither at the same sampling time or compared to pre-stress levels (results not shown).
The average concentration of plasma lactate in the pre-stress group was 0.77 ± 0.08 mM before the start of the experiment. However, plasma lactate was not measurable (lover than the detection limit) by the Lactate Pro™ instrument in any of the experimental groups or at any sampling time.
Overall, this indicates that after the increase in cortisol at 21 days, secondary stress response can be observed at 28 days as reduced osmoregulatory capacity in the daily stressed lumpfish. Whilst, no recruitment of glucose (from glycogen in liver or muscles) was evident and lactate levels were not increased.
Skin of lumpfish from the crowding stress experiment was analyzed using two-dimensional gel electrophoresis followed by mass spectrometry analysis (Figure 3). Eight spots showed differential intensity between the groups (p<0.05) (circles in Figure 3). The proteins in the spots were identified as calmodulin, fatty acid binding protein, 14-3-3 alpha/beta, heat shock cognate 70 kDa protein, glutathione-S-transferase Mu 3, guanine nucleotide binding protein subunit beta 2, histone H4 and keratin (Table 3). Spot intensities for all groups at all timepoints are shown in Figure 4. The spot intensity of spot 1, calmodulin, was higher than the control at 14 and 21 days. Intensity of spot 2, fatty acid binding protein, increase throughout the experiment and was significantly higher that the control at the same times points at 21 and 28 days. Spot intensity of spot 3, 14-3-3-alpha/beta was lower than the control at 7 and 14 days. Heat shock cognate 70 kD, spot 4, showed reduced spot intensity compared with control for all timepoints studied. Spot 5, glutation-S-transferase, showed higher spot intensity at 21 days compared with control, the same was found for spot 6, guanine nucleotide binding protein. Spot 7, histone H4 showed a reduced spot intensity at 28 days compared with control. Spot 8, keratin, showed an increased spot intensity compared to control at 21 days and a reduced intensity compared with control at 28 days.
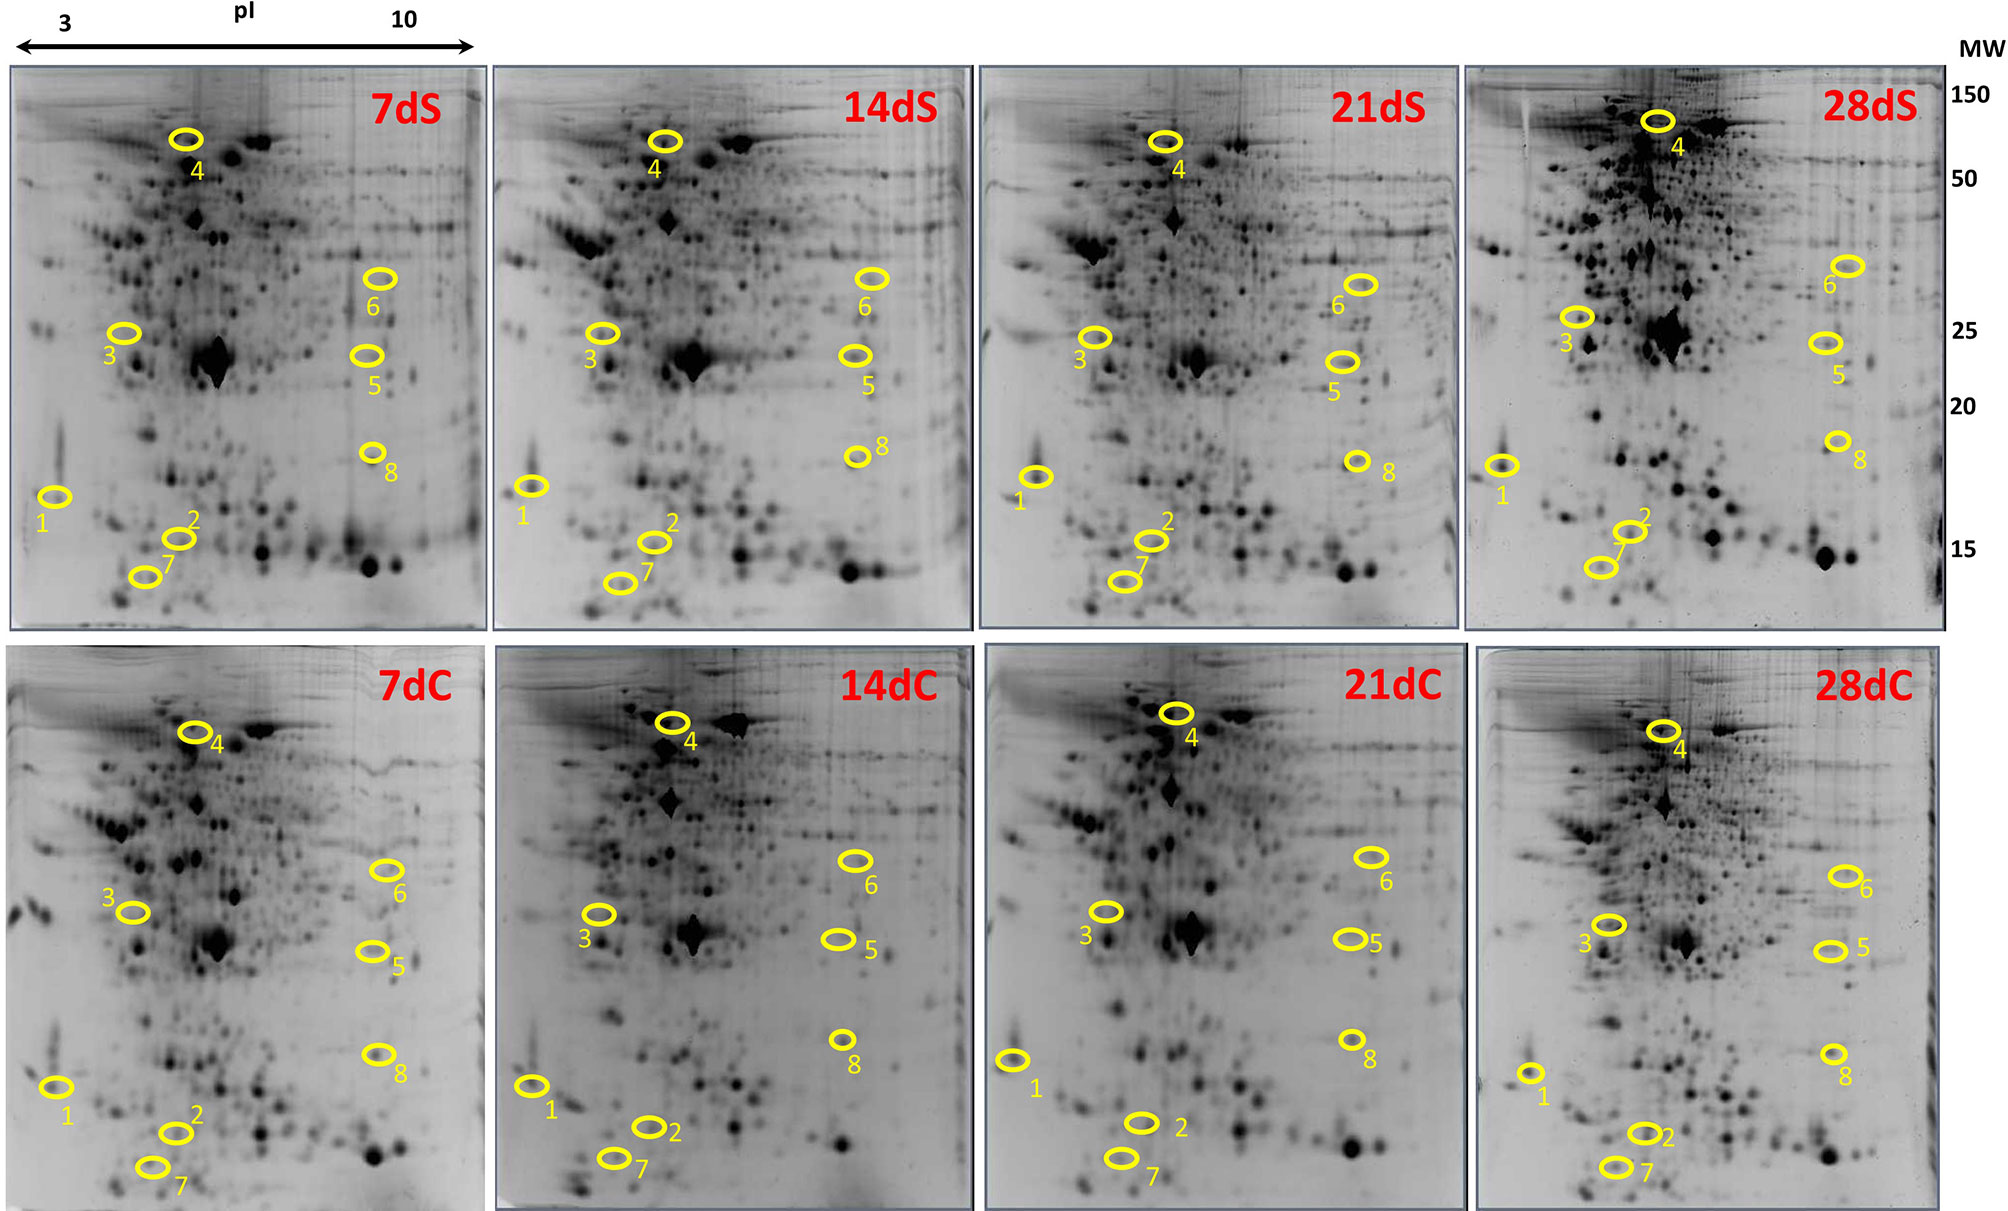
Figure 3 Gel images from control and stressed groups showing differentially expressed proteins. Polyacrylamide gel (12.5%) images from 7, 14, 21, 28 days showing identified proteins from stressed and control fish. C stands for control and S stands for stressed group. Each gel represents proteins from one fish. Protein spots differentially expressed are encircled in yellow and denoted by numbers. 1- calmodulin, 2- fatty acid binding protein, 3- 14-3-3 alpha/beta, 4- heat shock cognate 70, 5- glutathione-S- transferase, 6- guanine nucleotide binding protein, 7- histone H4 and 8- keratin. Molecular weight (MW) measured in kDa.
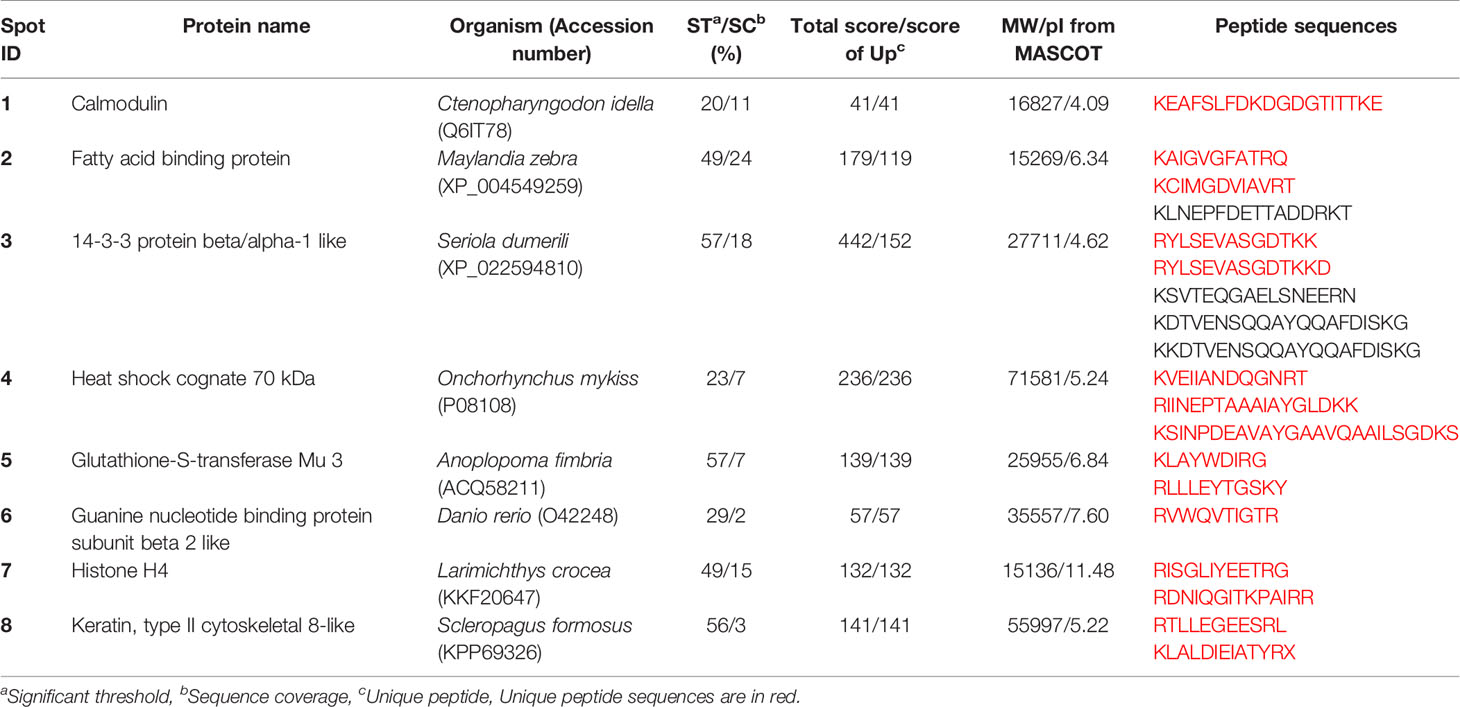
Table 3 Differentially expressed proteins from skin of lumpfish under crowding stress.
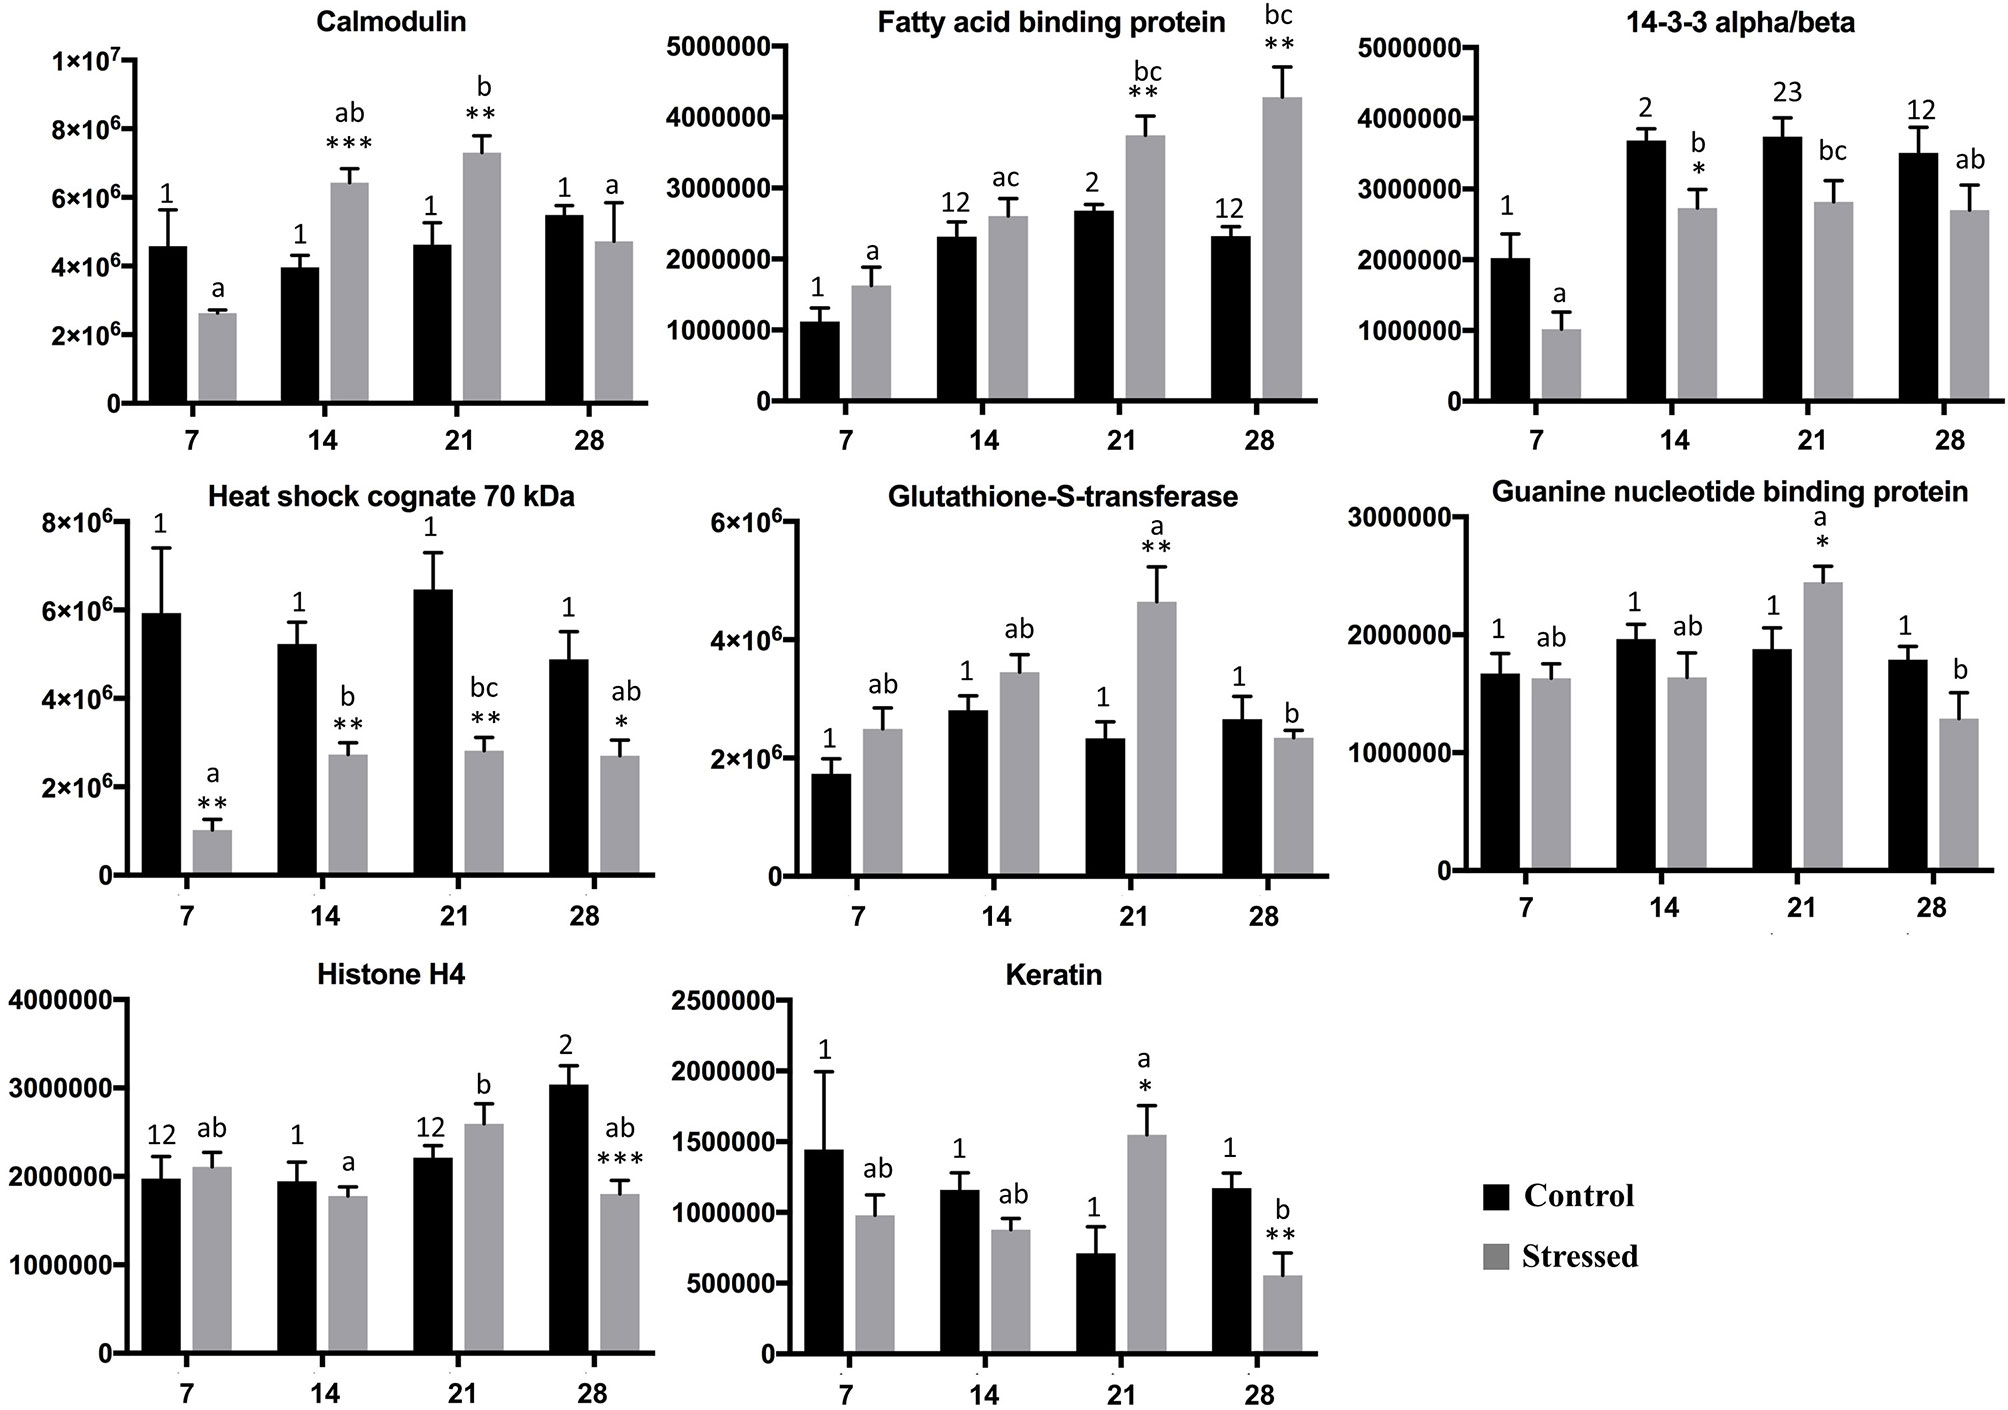
Figure 4 Protein spot intensities of identified proteins in control and stressed group. Protein spot intensities given by PDQuest (Y-axis) during the course of the experiment measured on day 7, 14, 21, and 28 (X-axis). Error bar shows error of mean (p < 0.05, n = 6). Letters signifies the difference in expression between the stressed group and number signifies the difference in expression between the control group along the course of experiment at different time points (One way Annova and Tukey HSD post hoc analysis; Kruskal Walli’s test and Dunn’s test for nonparametric data). The same number/letters shows no difference and different number/letters indicates a difference. Asterisk shows the comparison between the control and stressed fish at each time point (unpaired t-test for data that showed normal distribution and Mann Whitney U test for data that did not show normal distribution).
The most consistent change in spot intensity was found for spot 4, heat shock cognate 70 kD, which were lower in stress groups that control groups at all time points. In 2D gels proteins can be found in several spots since post-translational modifications of proteins such as phosphorylation, alkylation, methylation and cleavages will move proteins in the gels in the pI axis (X-axis) if charge is modified and in the kD-axis (Y-axis) if size is modified. A change in spot intensity does therefore not necessarily represent a change in amount of total protein, but rather modification of the protein.
Gene ontology terms for these proteins were retrieved from their zebrafish or human orthologues from UniProtKB database. The analysis showed that the differentially expressed proteins are involved in phagocytosis and engulfment (GO:0006911), calcium ion binding (GO:0005509), transport of molecules (GO:0006810), metabolic process (GO:0008152), regulation of protein localization (GO:0032880), keratinization (GO:0031424), chaperoning activity (GO:0061684), nucleosome activity (GO:0006334) and extrinsic apoptotic signaling pathway (GO:0097191).
Since hsc70 was the only protein that showed consistent lower spot intensity in all time points, the corresponding gene was selected for gene expression analysis. qPCR analysis of hspa8, the gene coding for heat shock cognate 70, was done (Figure 5). The expression levels of hspa8 gene shown are relative to the geometric mean of two reference genes beta-actin and gapdh. Both the reference genes showed stable expression with a p value of 0.001 and correlation coefficient value (r) 0.0969 (beta-actin) and 0.974 (gapdh) (Table 1). Therefore the geometric means of both reference genes were used for the analysis of the hspa8 gene expression. The hspa8 gene expression in the stressed group was significantly higher than the control on day 7, but did not show significant differences on days 14, 21 and 28. The stressed group on day 7 was also significantly higher than the stressed group of day 28, where the hspa8 gene expression had returned to the control group level. The control groups did not show any significant changes throughout the trial period (Figure 5).
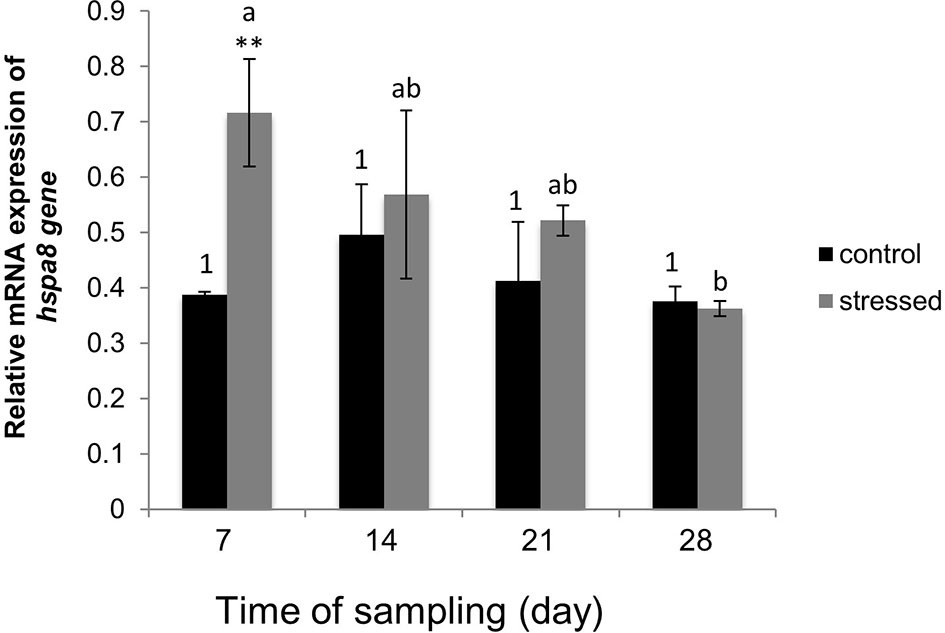
Figure 5 Relative mRNA expression of hspa8 gene. The expression is relative to the geometric mean of two reference genes beta-actin and gapdh (glyceraldehyde 3-phosphate dehydrogenase). Asterisk denote a significant difference between the control and stressed group on day 7. The letters refers to the changes in expression between the stressed group on day 7 till 28. The number shows difference in expression between the control groups on day 7 till 28. The same letters and number means no change and different ltters and numbers indicate significant differences. Error bar shows error of the mean, n = 5, p < 0.05. Details about statistical analysis are mentioned in the statistic description in the Materials and Methods.
During prolonged stress the growth of animals can be affected. The average weight of lumpfish before the start of experiment was 52.7 ± 15.1 g. The average weight of the control group fish increased significantly compared to the pre-stress group and were higher than daily stress groups at 21 and 28 days. Control group fish weights were 152.3 ± 96.6 g and 150.1 ± 93.9g at day 21 and 28 (Figure 6A).
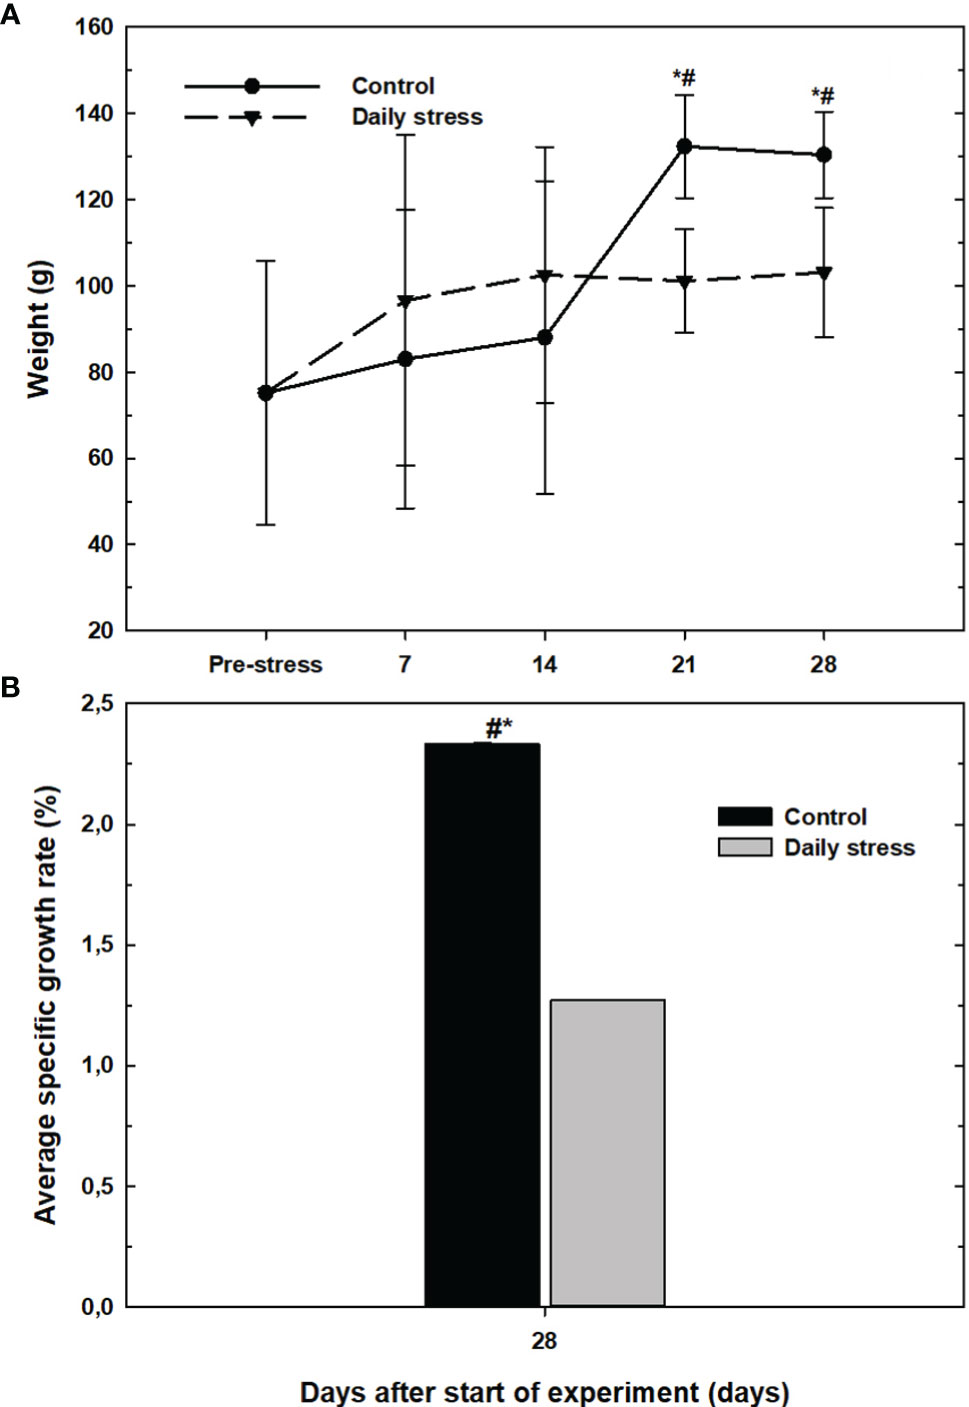
Figure 6 (A) The body weight (mean ± SD, n=18) in the control group (filled circles) and daily stress group (filled triangles) in lumpfish during 28 day trial. (B) The overall specific growth rate (%) at the end of experiment (from day 0-28) in the control group (black bars) and daily stress group (grey bars) (n=18). # indicates significant difference between groups at the same sampling day at 95% confidence level, * indicates significant difference from the pre-stress level at 95% confidence level.
Figure 6B shows the difference in modified average specific growth rate (SGR). The overall SGR in the control group was significantly higher at the end of the experiment (2.33 ± 0.01%) compared to the stress group (1.27 ± 0.02%). Overall, the stress group showed inhibited growth compared with the control group.
To test the sensitivity and negative feedback response of the HPI-axis dexamethasone was injected to block natural ACTH release from the anterior pituitary.
At day 28 stressed lumpfish injected with ACTH (that stimulate cortisol release from the kidney), had a significantly higher plasma cortisol level than in the ACTH-injected pre-stress group and control group at 28 days (Figure 7A). The stressed group, hence show an increased sensitivity to ACTH at 28 days.
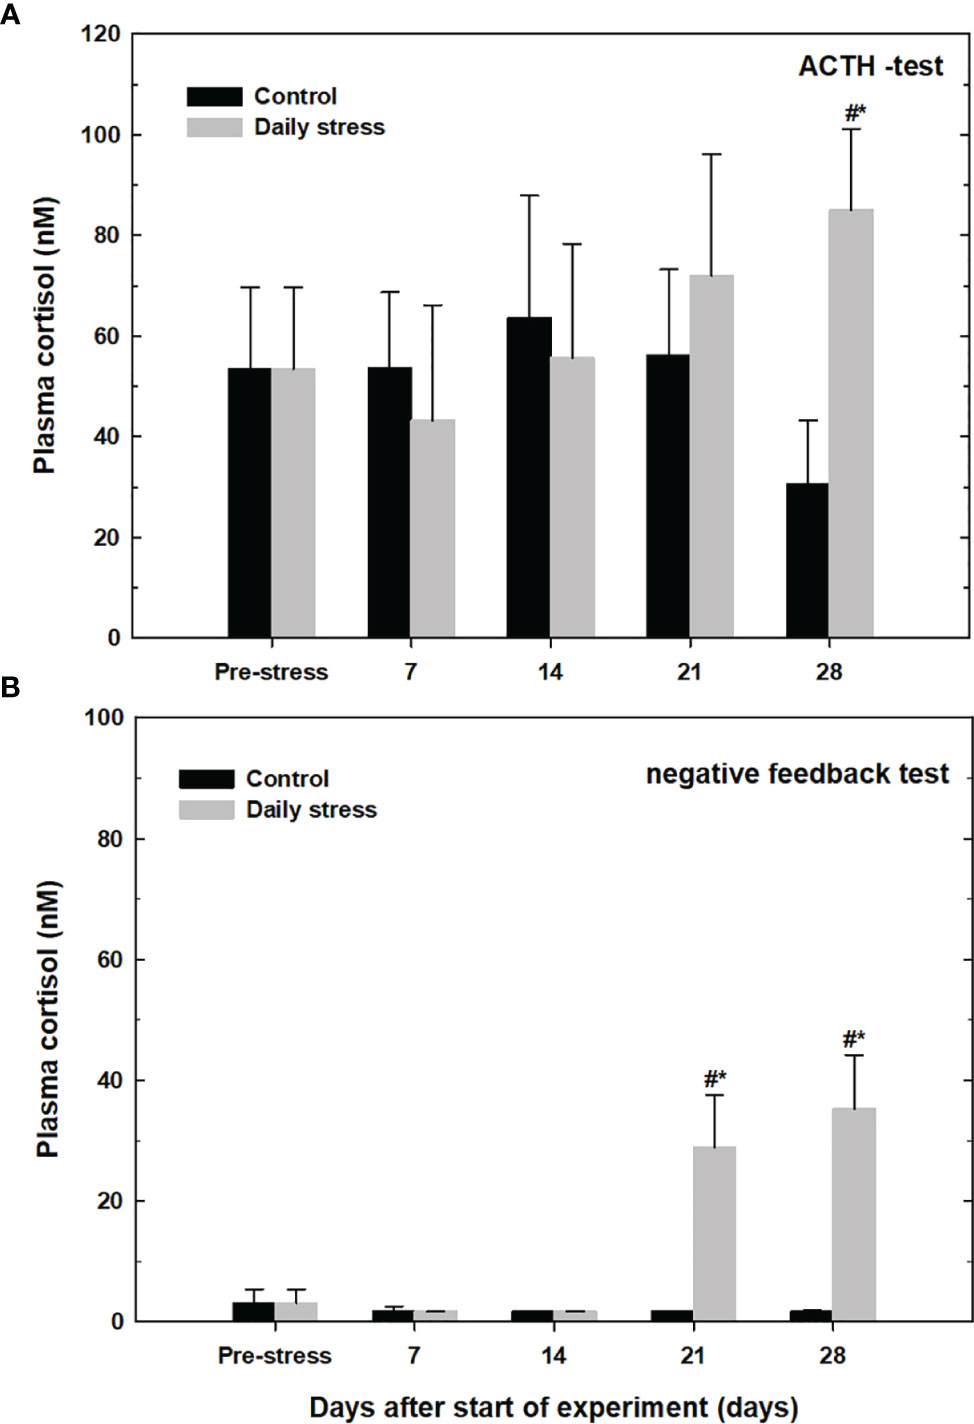
Figure 7 Plasma cortisol levels (mean ± SD, n=12) in the control group (black bars) and daily stress group (grey bars) in lumpfish during 28 days of exposure (n=12) following intraperitoneal injection with either (A) adrenocorticotropic hormone (ACTH 45 µg mL-1, 0.5 mL kg-1) or (B) negative sensitivity test; phosphate buffered saline (PBS; 0.5 mL kg-1). All fish were injected 24 h earlier with dexamethasone (DEX; 1 mg kg-1 in ethanol: PBS; 1:3; 1 µg L-1). # indicates significant difference between groups at the same sampling day at 95% confidence level, * indicates significant difference from the pre-stress level at 95% confidence level.
Figure 7B shows the average plasma cortisol levels in lumpfish first injected with dexamethasone and then with phosphate buffer saline. A significantly higher level of cortisol was seen in the daily stressed group comparison to pre-stress levels and control group after 21 and after 28 days, in stressed groups at 21 and 28 days cortisol levels were 28.98 ± 8.6 nM and 35.27 ± 8.95 nM, respectively.
With the growth in use of lumpfish as cleanerfish, increasing concern for the welfare of the species has arisen as mortality and disease outbreak have started to increase in later years (Iversen et al., 2015; Treasurer et al., 2018; Stien et al., 2020). One possible reason for this is the increased stress load the fish experience during common aquaculture practice such as grading, cleaning, vaccination and transport (Barton, 2002; Iversen et al., 2005; Iversen et al., 2009; Iversen and Eliassen, 2014; Treasurer et al., 2018). It is essential to understand the physiology of the fish and its response to stress and if the immune barriers of the fish, such as skin (Brinchmann, 2016), is affected by stress.
Pre-stress levels of cortisol in lumpfish were low and within the level that is generally considered representative for unstressed fish (Barton and Iwama, 1991). Similar resting levels of cortisol in lumpfish were previously observed (Jørgensen et al., 2017; Treasurer et al., 2018). Resting levels of plasma cortisol in the daily stressed lumpfish was not significantly different from pre-stress levels at 7 and 14 days. The stress response is a natural reaction which promotes increased survival. Cortisol levels increase after exposure to short time stressor(s) (Hvas et al., 2018; Treasurer et al., 2018), and return to resting levels after 12 hours in lumpfish (Treasurer et al., 2018). The prolonged elevated level of resting plasma cortisol from day 21 onwards in the fish exposed to daily stressors in the current study, indicates an allostatic overload type 2 on the HPI axis. Long time stress can be maladaptive and malicious for fish due to changes in the sensitivity of the HPI axis (Pickering and Pottinger, 1989; Mommsen et al., 1999; Øverli et al., 2002; Iversen and Eliassen, 2014).
It is commonly seen that stress increases the levels of plasma glucose and lactate (Moon and Foster, 1995; Iversen et al., 2003), and increased glucose is a commonly used indicator of secondary stress response (Mommsen et al., 1999; Cook, 2012), observed for salmonids and other species (Barton, 2000; Barcellos et al., 2001; O’Connor et al., 2011). However, in the present study there were no significant changes in glucose levels. This is in accordance with several other studies, where a lack of correlation between plasma cortisol and glucose levels were found (Barton et al., 1988; Mommsen et al., 1999; Cook, 2012; Hvas et al., 2018). The conflicting results could be due to differences in experimental setup and/or species differences. It could also be due to the fact that plasma glucose in carnivorous fish can fluctuate a lot more than in mammals, so it may not be used as the only indicator of metabolic status or stress (Mommsen et al., 1999).
Elevation of lactate concentrations often observed immediately after stress is likely due to muscle glycolysis (Moon and Foster, 1995), where lactate is the end product of glucose metabolism during anaerobe glycolysis (Olsen et al., 1995). The average concentration of lactate in blood of lumpfish from the control group was 0.77 mM (± 0.08) before the start of experiment. However, plasma lactate was not above the detection limit of the Lactate Pro™ instrument in any experimental groups or sampling time point. In Atlantic salmon, Atlantic cod and ballan wrasse on the other hand elevated levels of lactate after crowding stress are observed (Iversen et al., 2015). These species show active fight or flight reaction during stress, resulting in high muscle activity. This escape reflex relies on hindbrain neurons, Mauthner cells (Bierman et al., 2009). In contrast, species like Atlantic halibut and lumpfish seek shelter or hide during severe stress, and thus, produce very low or no muscle lactate (Hvas et al., 2018; Treasurer et al., 2018). Lumpfish seems to lack Mauthner neurons (Hale, 2000).
Release of cortisol has a direct influence on osmolality, chloride and magnesium, and one can use increase of these parameters as an indication of secondary stress responses (Wendelaar Bonga, 1997; Veiseth et al., 2006; Björnsson et al., 2011; Wendelaar Bonga, 2011). The only significant difference in plasma osmolality and chloride levels compared to pre-stress in the present study was detected on day 28. There was no positive correlation between plasma cortisol and the levels of plasma osmolality and chloride in the earlier timepoints, in agreement with another lumpfish study (Hvas et al., 2018). A plausible explanation is induction of a compensatory response on the cell level. When fish cells are exposed to hypotonic environment the cells rapidly swell but will return to its original volume, by eliminating cellular osmolytes and hence water. This regulatory mechanism is termed regulatory volume decrease (RVD). Fish in seawater, on the other hand, will work against shrinking of cells (as an effect of elevated plasma osmolality), thus minimizing the effect of the stressor (Trischitta et al., 2005). However, when stress is prolonged (chronic) the fish will not be able to keep up this compensatory response as all reserve energy has been depleted. The exhaustion of the compensatory responses can explain the significant increase in both osmolality and plasma chloride in stressed group at the end of the experiment.
To prevent dehydration because of osmotic water loss, marine teleosts must drink seawater and eliminate divalent ions as magnesium and sulphate. Redding and Schreck (1983) state that uptake and excretion of magnesium (Mg2+) happens in guts and kidneys. In the well-studied species of teleost, Atlantic salmon, total magnesium concentration in plasma will not be higher than 2 nM (Bijvelds et al., 2001). The concentration of Mg2+ during our experiment was significantly higher at the end of the experiment in the daily stress group compared to the control group. Hence, lumpfish show abilities to cope with some secondary effects of stress in the short time perspective, however every day stress and accumulation of plasma cortisol seems to have a negative impact on the stress coping mechanism in the longer run.
Fish have evolved mechanisms to cope with stress, where a series of proteins and genes are involved in the stress response to combat the unpleasant condition. Proteomic methods can help to identify potential stress markers for a wide range of stressors. 2D gel based proteomics along with homology search to identify the differentially changed proteins is a suitable technique to study effects of stress in non-model species with relatively little genomic information available in public databases (Junqueira et al., 2008) like lumpfish. The changes in physiological parameters observed in this study could modulate molecular mechanisms in lumpfish. The skin is a barrier between the fish interior and the marine environment, and is a mucosal surface that serves an important role in the innate immune system of fish.
The aim of the proteomic analysis, hence was to study the response of the skin proteome of the cold-water marine lumpfish under chronic crowding stress. Analysis of the effect of prolonged crowding stress on the skin of lumpfish using two-dimensional gel and mass spectrometry based approaches, identified eight differentially expressed protein spots.
Spot 1 was identified as calmodulin and significantly increased in expression level in the stressed fish compared to unstressed ones on days 14 and 21 (Figure 4). Calmodulin is a highly conserved multifunctional calcium binding protein, with a role in various biological processes such as inflammation, apoptosis, autophagy, immune and stress response (Berchtold and Villalobo, 2014; Li et al., 2014). This protein was over-expressed in notothenoid fish of Antarctica exposed to cold stress (Yang et al., 2013). Intensity changes in protein spot 1, calmodulin, in stressed fish suggests that calmodulin dependent signaling pathways might be initiated as a stress response.
Spot 2, fatty acid binding protein heart-like, was significantly upregulated on days 21 and 28 in the stressed group compared to the control (Figure 4). This protein is involved in energy metabolism by transportation of lipid, and changes in it could serve to meet the increased energy requirement due to stress. Interestingly, inhibition of fatty acid binding protein and resulting peroxisome proliferator-activated receptor α downregulation in zebrafish liver gave increased oxidative stress (Zhang et al., 2016). This suggest that changes in fatty acid binding protein levels or activity (post-translational modifications) could be important for direct stress mitigation. However, fatty acid binding protein has also been found to increase inflammation (Hui et al., 2010) and to be highly expressed in inflammatory diseases (Milner et al., 2009; Yeung et al., 2009).
Spot 3, 14-3-3-alpha/beta, had a lower intensity in the stress group at day 7 and 14. The 14-3-3 protein family are well known as scaffold proteins in signaling pathways and as such influence numerous cellular processes (Tzivion et al., 2001). This protein has been identified in four spots in skin mucus of lumpfish (Patel and Brinchmann, 2017), in four spots in Atlantic cod (Rajan et al., 2011), in two spots in mucus of European sea bass (Dicentrarchus labrax) (Cordero et al., 2015). A 14-3-3 alpha/beta spot’s intensity decreased in skin mucus after wounding in gilthead seabream (Sparus aurata) (Cordero et al., 2017). In brain of stressed fingerling of rainbow trout, the expression of several 14-3-3 genes was increased (Koskinen et al., 2004). This result cannot be directly compared with our result as it is on the gene level and in brain, not skin. In turbot (Scophthalmus maximus) subjected to low salt stress, an increase in gene expression of a 14-3-3 was found, which subsequently decreased during the stress period (Liu et al., 2020). In the present study sampling of skin tissue was done once a week, hence a possible early peak in 14-3-3 spot intensity would not be detected. Silencing of 14-3-3 by RNA interference influenced the osmoregulation in turbot, suggesting an important role for 14-3-3 in osmoregulation (Liu et al., 2020), potentially linking 14-3-3 modulation to secondary stress responses in osmolality, chloride and magnesium.
Spot 4, heat shock cognate 70 kDa protein, is also known as heat shock cognate 71kDa or hsp73 (Stricher et al., 2013). Heat shock proteins/genes are expressed in fish exposed to stressors such as temperature, salinity, crowding, pathogenic infections, chemicals and toxins (Boone and Vijayan, 2002; Ming et al., 2010; Ellison et al., 2017). It was previously found in skin mucus of lumpfish (Patel and Brinchmann, 2017). Hsc70 is a multifunctional protein involved in inflammation, infection, autophagy, chaperoning activity, protein folding and protein degradation (Stricher et al., 2013). A short term crowding stress of 24 hours in Wuchang bream (Megalobrama amblycephala) showed initial downregulation of hsc70 mRNA in the liver and then upregulation possibly to maintain homeostasis (Ming et al., 2010). In the present study the hsc70 protein spot in the stressed group showed a consistent lower intensity compared to the control groups at all time points. Lower intensity of the hsc70 spot in all time points in this study could represent lower protein amount due to the long period of exposure to crowding, where the fish could not regain the homeostasis. This would be in agreement with the physiological data that showed that the stressed group after 14 days showed signs of allostatic overload type 2 (chronical stress). Alternatively the spot represents one of several heat shock cognate 70 spots, with a post-translational modification that is changed during stress.
Spot 5 was glutathione-S-transferase Mu 3 protein. It is an enzyme from the large glutathione-S-transferase (GST) family with detoxification in electrophiles as its primary function. In many organisms expression of GSTs has been observed due to oxidative stress (Cho et al., 2001). Glutathione-S-transferase Mu in mice can modulate the stress activated signaling by suppressing the expression of apoptosis signal regulating kinase that serves as defense against oxidative stress (Cho et al., 2001). Spot 5 had higher intensity on day 21 and a significant difference was observed between day 21 and day 28 in the stressed group.
Spot 6, guanine nucleotide binding protein (G-protein), showed increased intensity at 21 days. G-proteins are well known signaling pathway components among others involved in G-protein coupled receptor signaling. A guanine nucleotide binding protein was found in skin mucus of lumpfish (Patel and Brinchmann, 2017). In zebrafish (Danio rerio) brain guanine nucleotide binding protein was modulated after ethanol stress. Since there are a large number of G-proteins in cells, further research is needed to further characterize the spot 6 G-protein, and its possible role in stress signaling pathways.
Spot 7 was identified as histone H4 protein. The primary function of histone proteins is in DNA condensing in the nucleosome complex, but histones also have antimicrobial functions (Robinette et al., 1998). The nucleosome core complex contains the major histone proteins (H2A, H2B, H3 and H4) and several non-histone proteins as well as H1 are associated with it for DNA packaging. Under stressful conditions the DNA packaging might get affected, as part of regulation of gene expression, and chromatin proteins can get up-or downregulated and/or modified compared to non- stressed individuals (Rando, 2012; Smith and Workman, 2012). In channel catfish skin the expression levels of histone like proteins (HLP) were suppressed in stressed (overcrowding and high ammonia levels) fish compared to unstressed fish from week 1 till week 4 of the experiment (Robinette et al., 1998; Robinette and Noga, 2001). In our study, the lumpfish skin showed a steady intensity of spot 7, histone H4 in both stressed and unstressed fish till day 21. On day 28 the stressed fish showed a significant drop in the spot 7 intensity (histone H4) compared to the unstressed, control, fish. This change could influence gene expression, but also the role of histones as antimicrobial proteins, as long term exposure to stress impairs the immune system of organisms (Tort, 2011).
Spot 8 was keratin type-II cytoskeletal 8 like protein, and had higher spot intensity on day 21 and then lower intensity on day 28 in lumpfish skin after crowding. This protein was found to be downregulated in skin mucus of stressed (random light flashes, shaking of tanks, random sounds, moving objects into water, water reverse flow in random order for 30 min three times per day for 21 days) gilthead sea bream (Pérez-Sánchez et al., 2017). Keratins are important structural proteins in skin and has roles in phagocytosis, cell shape determination and stress responses. Keratin performs these functions by its highly dynamic scaffolding activity (Magin et al., 2007). A study on human suggested that keratin could, in addition to its structural role, protect the tissue from injury by removing the stress activated kinases by acting as a phosphate sponge (Ku and Omary, 2006). Keratin has also been shown to have antimicrobial activity (Molle et al., 2008). In the current study, we speculate that, the higher spot intensity of keratin on day 21 could be to remove the stress induced kinases, but as the crowding still continued after 21 days, the fish could not recover from the long exposure to stress and the keratin spot intensity was reduced on day 28 compared to day 21 (Figure 4). Gel based proteomics picks up changes in proteins, including post-translational changes, hence the change in spot intensity does not clearly imply changes in protein levels, and hence the interpretation of the changes seen are not clear at the moment.
In conclusion, we identified protein spots that showed modulated spot intensities in response to crowding stress. Gene ontology analysis showed the involvement of the identified proteins in metabolic pathways, binding, protein regulation, phagocytosis and engulfment. Among all the expressed proteins hsc70 could be a potential stress marker in skin for crowding stress as it had lover spot intensity at all time points compared to the non-stressed group. However, further work is needed to determine if changes in protein amount and/or protein modifications are responsible for the drop in intensity of the hsc70 spot observed. Further research on pathway analysis of the identified proteins would add to the existing knowledge of stress responses in fish.
The expression level of hspa8 gene did not correlate with the protein expression levels of heat shock cognate 70kDa. Gene expression was upregulated at day 7 and was not significantly different from the control group at other time points. It is well known that mRNA levels (gene expression) and protein levels does not always correlate, as seen e.g. in yeast, Saccharomyces cerevisiae (MacKay et al., 2004). 2D gels separate post-translationally modified version of the same protein, hence any given protein will be present in several spots and changes in intensity of a spot does only mean that the spot changes, and not necessarily protein amount. For example an addition of one to several phosphate groups will distribute a protein on several spots. This might not be enough to give increased spot density in these several spots, but the disappearance of non-phosphorylated protein will be large enough to be observed.
When stress affect the organism’s and population’s growth, disease resistance and mortality, one often denotes it as a tertiary stress response (Wendelaar Bonga, 1997; Wendelaar Bonga, 2011). To establish homeostasis during and after a stressor the organism must direct all energy to important task such as locomotion and respiration. As long as the danger exists, other physical tasks such as growth or reproduction will not be prioritized (Wendelaar Bonga, 1997; Wendelaar Bonga, 2011).
Lumpfish in the stressed group showed stunted growth and did not increase in weight after 14 days, which signify a tertiary stress response. The control group, on the other hand, showed a steady rise in average weight throughout the experiment, and its weight was significantly higher than the stress group at the same time points after 21 and 28 days. The modified average specific growth rate showed a similar negative trend. An effect of plasma cortisol on growth has been shown in gold fish (Carassius auratus) (Bernier et al., 2004), Atlantic cod (Gadus morhua) (Staurnes et al., 1994) and Atlantic salmon (Pickering, 1990). In addition, Bernier (2004) noticed that, the specific growth rate was lower in the stressed group both in comparison to the control group and to the pre-stress situation, in accordance with the present study.
To detect chronical stress (allostatic overload type 2) one can use the dexamethasone test to assess HPI axis sensitivity and the feedback loop. Dexamethasone will block the release of ACTH from the pituitary, hence block the stress response (Wilens et al., 1984). Daily stressed lumpfish after 28 days showed oversensitivity to the weight-adjusted dose of ACTH compared to the control group, hence stressed fish had a significantly higher level of plasma cortisol compared to control fish after ACTH stimulation. The inhibition test using dexamethasone to inhibit ACTH release followed by PBS injection showed relatively high cortisol levels, hence the negative feedback mechanism in lumpfish are reduced, implying a chronical stress situation.
Historically, the DEX test has been used to detect HPI axis changes in melancholic patients (Wilens et al., 1984; Banki et al., 1986; Kumar et al., 1986). Even though studies on ACTH sensitivity in animals are not very numerous, those which has been conducted supports the notion that chronic stressed animals show changes in HPI axis activity and sensitivity (Friend et al., 1985; Mormede et al., 2007; Iversen and Eliassen, 2014).
There are few studies on chronic stress of fish, combining the baseline levels of plasma cortisol, sensitivity of the interrenal cells (ACTH), and the efficiency of the negative feedback by corticosteroids (DEX). Lack of similar studies and unclear definitions of acute/chronic stress makes it difficult to draw precise conclusions, and to generalize results from different fish species. However, in lumpfish (this study), Atlantic salmon (Iversen and Eliassen, 2014) and rainbow trout (Oncorhynchus mykiss) (Pottinger and Carrick, 2001) an oversensitive HPI-axis with reduced negative feedback system and elevated baseline levels of plasma cortisol seems to indicate a chronic stressed fish (allostatic overload type 2) with high potential to compromise the animal welfare of the species.
In the current study lumpfish, exposed to repeated stress, showed sign of primary, secondary and tertiary stress responses. After three weeks and onward there were changes on the endocrine level, i.e. cortisol does not return to resting levels (measured in the morning after a minimum a 18 hrs after the stressor). After four weeks secondary stress response was observed as changes in osmoregulation (plasma osmolality and ion level changes) as well as changes in molecular parameters (proteins and gene expression). The molecular parameters changes were clearest for hsc70 which showed decreased spot intensity at all time points, as well as increased gene expression at day 7. Whole body changes (tertiary stress response) were also found, that is impaired growth, HPI-axis oversensitivity and impaired feedback mechanism. The chronic stress (allostatic overload type 2) can have possible dire consequences for the animal welfare and possible lead to increased disease susceptibility.
The original contributions presented in the study are publicly available. The data can be found here: MassIVE MSV000089157, doi:10.25345/C54T6F69Q.
The animal stress experiment was approved by the local responsible laboratory animal science specialist under the surveillance of the Norwegian Animal Research Authority (NARA), Norway and was approved by the Norwegian Food Safety Authority (in the FOTS system) registered by the Authority with approval number 7293/15.
MI and MB secured the financing, conceived the study and designed the experimental set up for wet lab, physiological and proteomics analysis of fish under chronic stress. DP and AH sampled the tissues and performed the practical work. All authors contributed to data analysis and to writing and/or editing of the manuscript.
Nord University, Bodø, Norway (project number 310041-110) and The Norwegian Seafood Research Fund – FHF (project number 901136, Rensvel) are acknowledged for funding the study.
The authors declare that the research was conducted in the absence of any commercial or financial relationships that could be construed as a potential conflict of interest.
All claims expressed in this article are solely those of the authors and do not necessarily represent those of their affiliated organizations, or those of the publisher, the editors and the reviewers. Any product that may be evaluated in this article, or claim that may be made by its manufacturer, is not guaranteed or endorsed by the publisher.
The authors are thankful to the staff of Mørkvedbukta research station, Nord University, Bodø for helping to conduct the stress experiment, and technical staff in the dry lab, Nord University, Bodø for help in sampling and guidance in laboratory applications. Parts of this paper is published online in a master thesis (Hanssen, 2016).
Abdel-Tawwab M., Monier M. N., Hoseinifar S. H., Faggio C. (2019). Fish Response to Hypoxia Stress: Growth, Physiological, and Immunological Biomarkers. Fish. Physiol. Biochem. 45 (3), 997–1013. doi: 10.1007/s10695-019-00614-9
Banki C. M., Arato M., Papp Z., Rihmer Z., Kovacs Z. (1986). Associations Among Dexamethasone Non-Suppression and TRH-induced Hormonal Responses: Increased Specificity for Melancholia? Psychoneuroendocrinology 11 (2), 205–211. doi: 10.1016/0306-4530(86)90055-7
Barcellos L. J. G., Woehl V. M., Wassermann G. F., Quevedo R. M., Ittzes I., Krieger M. H. (2001). Plasma Levels of Cortisol and Glucose in Response to Capture and Tank Transference in Rhamdia Quelen (Quoy and Gaimard), A South American Catfish. Aquacul. Res. 32 (2), 121–123. doi: 10.1046/j.1365-2109.2001.00539.x
Barton B. A. (2000). Salmonid Fishes Differ in Their Cortisol and Glucose Responses to Handling and Transport Stress. North Am. J. Aquacul. 62 (1), 12–18. doi: 10.1577/1548-8454(2000)062<0012:SFDITC>2.0.CO;2
Barton B. A. (2002). Stress in Fishes: A Diversity of Responses With Particular Reference to Changes in Circulating Corticosteroids. Integr. Comp. Biol. 42 (3), 517–525. doi: 10.1093/icb/42.3.517
Barton B. A., Iwama G. K. (1991). Physiological Changes in Fish From Stress in Aquaculture With Emphasis on the Response and Effects of Corticosteriods. Annu. Rev. Fish. Dis. 1, 3–26. doi: 10.1016/0959-8030(91)90019-G
Barton B. A., Schreck C. B., Fowler L. G. (1988). Fasting and Diet Content Affect Stress-Induced Changes in Plasma-Glucose and Cortisol in Juvenile Chinook Salmon. Prog. Fish-Cult. 50 (1), 16–22. doi: 10.1577/1548-8640(1988)050<0016:FADCAS>2.3.CO;2
Berchtold M. W., Villalobo A. (2014). The Many Faces of Calmodulin in Cell Proliferation, Programmed Cell Death, Autophagy, and Cancer. Biochim. Biophys. Acta (BBA) - Mol. Cell Res. 1843 (2), 398–435. doi: 10.1016/j.bbamcr.2013.10.021
Bernier N. J., Bedard N., Peter R. E. (2004) Effects of Cortisol on Food Intake, Growth, and Forebrain Neuropeptide Y and Corticotropin-Releasing Factor Gene Expression in Goldfish. Gen. Comp. Endocrinol. 135 (2), 230–40. doi: 10.1016/j.ygcen.2003.09.016
Bierman H. S., Zottoli S. J., Hale M. E. (2009). Evolution of the Mauthner Axon Cap. Brain. Behav. Evol. 73 (3), 174–187. doi: 10.1159/000222562
Bijvelds M. J. C., Kolar Z. I., Flik G. (2001). Electrodiffusive Magnesium Transport Across the Intestinal Brush Border Membrane of Tilapia (Oreochromis Mossambicus). Eur. J. Biochem. 268 (10), 2867–2872. doi: 10.1046/j.1432-1327.2001.02170.x
Björnsson B. T., Stefansson S. O., McCormick S. D. (2011). Environmental Endocrinology of Salmon Smoltification. Gen. Comp. Endocrinol. 170 (2), 290–298. doi: 10.1016/j.ygcen.2010.07.003
Boone A. N., Vijayan M. M. (2002). Constitutive Heat Shock Protein 70 (HSC70) Expression in Rainbow Trout Hepatocytes: Effect of Heat Shock and Heavy Metal Exposure. Comp. Biochem. Physiol. Part C.: Toxicol. Pharmacol. 132 (2), 223–233. doi: 10.1016/S1532-0456(02)00066-2
Brinchmann M. F. (2016). Immune Relevant Molecules Identified in the Skin Mucus of Fish Using -Omics Technologies. Mol. Biosyst. 12 (7), 2056–2063. doi: 10.1039/c5mb00890e
Bustin S. A., Benes V., Garson J. A., Hellemans J., Huggett J., Kubista M., et al. (2009). The MIQE Guidelines: Minimum Information for Publication of Quantitative Real-Time PCR Experiments. Clin. Chem. 55 (4), 611–622. doi: 10.1074/jbc.M005561200
Cook N. J. (2012). Review: Minimally Invasive Sampling Media and the Measurement of Corticosteroids as Biomarkers of Stress in Animals. Can. J. Anim. Sci. 92 (3), 227–259. doi: 10.4141/cjas2012-045
Cho S. -G, Lee Y. H., Park H. -S., Ryoo K., Kang K. W., Park J., et al. (2001) Glutathione S-Transferase mu Modulates the Stress-Activated Signals by Suppressing Apoptosis Signal-Regulating Kinase 1. J. Biol. Chem. 276, 12749—12755. doi: 10.1074/jbc.M005561200
Cordero H., Brinchmann M. F., Cuesta A., Esteban M. A. (2017). Chronic Wounds Alter the Proteome Profile in Skin Mucus of Farmed Gilthead Seabream. BMC Genomics 18 (1), 939. doi: 10.1186/s12864-017-4349-3
Cordero H., Brinchmann M. F., Cuesta A., Meseguer J., Esteban M. A. (2015). Skin Mucus Proteome Map of European Sea Bass (Dicentrarchus Labrax). Proteomics 15 (23-24), 4007–4020. doi: 10.1002/pmic.201500120
Cordero H., Morcillo P., Cuesta A., Brinchmann M. F., Esteban M. A. (2016). Differential Proteome Profile of Skin Mucus of Gilthead Seabream (Sparus Aurata) After Probiotic Intake and/or Overcrowding Stress. J. Proteomics 132, 41–50. doi: 10.1016/j.jprot.2015.11.017
Delfosse C., Pageat P., Lafont-Lecuelle C., Asproni P., Chabaud C., Cozzi A., et al. (2021). Effect of Handling and Crowding on the Susceptibility of Atlantic Salmon (Salmo Salar L.) to Lepeophtheirus Salmonis (Krøyer) Copepodids. J. Fish. Dis. 44 (3), 327–336. doi: 10.1111/jfd.13286
Douxfils J., Deprez M., Mandiki S. N. M., Milla S., Henrotte E., Mathieu C., et al. (2012). Physiological and Proteomic Responses to Single and Repeated Hypoxia in Juvenile Eurasian Perch Under Domestication – Clues to Physiological Acclimation and Humoral Immune Modulations. Fish. Shellfish. Immunol. 33 (5), 1112–1122. doi: 10.1016/j.fsi.2012.08.013
Ellison M. A., Ferrier M. D., Carney S. L. (2017). Salinity Stress Results in Differential Hsp70 Expression in the Exaiptasia Pallida and Symbiodinium Symbiosis. Mar. Environ. Res. 132 (Supplement C), 63–67. doi: 10.1016/j.marenvres.2017.10.006
Ellis T., Yildiz H. Y., López-Olmeda J., Spedicato M. T., Tort L., Øverli Ø., et al. (2012). Cortisol and Finfish Welfare. Fish. Physiol. Biochem. 38 (1), 163–188. doi: 10.1007/s10695-011-9568-y
Esteban M. A. (2012). An Overview of the Immunological Defenses in Fish Skin. ISRN. Immunol. 2012, 1–29. doi: 10.5402/2012/853470
Friend T. H., Dellmeier G. R., Gbur E. E. (1985). Comparison of Four Methods of Calf Confinement. I. Physiology. J. Anim. Sci. 60, 1095–1101. doi: 10.2527/jas1985.6051095x
Geitung L., Wright D. W., Oppedal F., Stien L. H., Vågseth T., Madaro A. (2020). Cleaner Fish Growth, Welfare and Survival in Atlantic Salmon Sea Cages During an Autumn-Winter Production. Aquaculture 528, 735623. doi: 10.1016/j.aquaculture.2020.735623
Goymann W., Wingfield J. C. (2004). Allostatic Load, Social Status and Stress Hormones: The Costs of Social Status Matter. Anim. Behav. 67, 591–602. doi: 10.1016/j.anbehav.2003.08.007
Gutierrez Rabadan C., Spreadbury C., Consuegra S., Garcia de Leaniz C. (2021). Development, Validation and Testing of an Operational Welfare Score Index for Farmed Lumpfish Cyclopterus Lumpus L. Aquaculture 531, 735777. doi: 10.1016/j.aquaculture.2020.735777
Hale M. (2000). Startle Responses of Fish Without Mauthner Neurons: Escape Behavior of the Lumpfish (Cyclopterus Lumpus). Biol. Bull. 199 (2), 180–182. doi: 10.2307/1542886
Hanssen A. J. (2016). The Effect of Long-Term Stress on Basal Levels of Plasma Cortisol and Hypothalamic-Pituitary-Interrenal (HPI) Axis in Lumpsucker (Cyclopterus Lumpus) (Bodø, Norway: Master Thesis Nord University).
Hui X., Li H., Zhou Z., Lam K. S. L., Xiao Y., Wu D., et al. (2010). Adipocyte Fatty Acid-Binding Protein Modulates Inflammatory Responses in Macrophages Through a Positive Feedback Loop Involving C-Jun NH(2)-terminal Kinases and Activator Protein-1. J. Biol. Chem. 285 (14), 10273–10280. doi: 10.1074/jbc.M109.097907
Hvas M., Folkedal O., Imsland A., Oppedal F. (2018). Metabolic Rates, Swimming Capabilities, Thermal Niche and Stress Response of the Lumpfish, Cyclopterus Lumpus. Biol. Open 7 (9), bio036079. doi: 10.1242/bio.036079
Iversen M. H., Eliassen R. A. (2014). The Effect of Allostatic Load on Hypothalamic-Pituitary-Interrenal (HPI) Axis Before and After Secondary Vaccination in Atlantic Salmon Postsmolts (Salmo Salar L.). Fish. Physiol. Biochem. 40 (2), 527–538. doi: 10.1007/s10695-013-9863-x
Iversen M., Eliassen R. A., Finstad B. (2009). Potential Benefit of Clove Oil Sedation on Animal Welfare During Salmon Smolt, Salmo Salar L. Transport and Transfer to Sea. Aquacul. Res. 40 (2), 233–241. doi: 10.1111/j.1365-2109.2008.02091.x
Iversen M., Finstad B., McKinley R. S., Eliassen R. A. (2003). The Efficacy of Metomidate, Clove Oil, Aqui-S (TM) and Benzoak (R) as Anaesthetics in Atlantic Salmon (Salmo Salar L.) Smolts, and Their Potential Stress-Reducing Capacity. Aquaculture 221 (1-4), 549–566. doi: 10.1016/S0044-8486(03)00111-X
Iversen M., Finstad B., McKinley R. S., Eliassen R. A., Carlsen K. T., Evjen T. (2005). Stress Responses in Atlantic Salmon (Salmo Salar L.) Smolts During Commercial Well Boat Transports, and Effects on Survival After Transfer to Sea. Aquaculture 243 (1-4), 373–382. doi: 10.1016/j.aquaculture.2004.10.019
Iversen M., Finstad B., Nilssen K. J. (1998). Recovery From Loading and Transport Stress in Atlantic Salmon (Salmo Salar L.) Smolts. Aquaculture 168 (1–4), 387–394. doi: 10.1016/S0044-8486(98)00364-0
Iversen M. H., Jakobsen R., Eliassen R. (2015). “Stress; En Viktig Bidragsyter Til Svinn I Sjø,” in Bergen, Norway Norsk Fiskeoppdrett.
Iwama G. K. (1998). Stress in Fish. Ann. New York. Acad. Sci. 851 (1), 304–310. doi: 10.1111/j.1749-6632.1998.tb09005.x
Jørgensen E. H., Haatuft A., Puvanendran V., Mortensen A. (2017). Effects of Reduced Water Exchange Rate and Oxygen Saturation on Growth and Stress Indicators of Juvenile Lumpfish (Cyclopterus Lumpus L.) in Aquaculture. Aquaculture 474, 26–33. doi: 10.1016/j.aquaculture.2017.03.019
Junqueira M., Spirin V., Balbuena T. S., Thomas H., Adzhubei I., Sunyaev S., et al. (2008). Protein Identification Pipeline for the Homology Driven Proteomics. J. Proteomics 71 (3), 346–356. doi: 10.1016/j.jprot.2008.07.003
Karim M., Puiseux-Dao S., Edery M. (2011). Toxins and Stress in Fish: Proteomic Analyses and Response Network. Toxicon 57 (7), 959–969. doi: 10.1016/j.toxicon.2011.03.018
Koskinen H., Krasnov A., Rexroad C., Gorodilov Y., Afanasyev S., Mölsä H. (2004). The 14-3-3 Proteins in the Teleost Fish Rainbow Trout (Oncorhynchus Mykiss). J. Exp. Biol. 207 (19), 3361–3368. doi: 10.1242/jeb.01165
Kumar A., Alcser K., Grunhaus L., Greden J. F. (1986). Relationships of the Dexamethasone Suppression Test to Clinical Severity and Degree of Melancholia. Biol. Psychiatry 21 (5-6), 436–444. doi: 10.1016/0006-3223(86)90185-X
Kumar V. B., Jiang I.-F., Yang H.-H., Weng C.-F. (2009). Effects of Serum on Phagocytic Activity and Proteomic Analysis of Tilapia (Oreochromis Mossambicus) Serum After Acute Osmotic Stress. Fish. Shellfish. Immunol. 26 (5), 760–767. doi: 10.1016/j.fsi.2009.03.005
Ku N.-O., Omary M. B. (2006). A Disease- and Phosphorylation-Related Nonmechanical Function for Keratin 8. J. Cell Biol. 174 (1), 115–125. doi: 10.1083/jcb.200602146
Li S., Jia Z., Li X., Geng X., Sun J. (2014). Calmodulin is a Stress and Immune Response Gene in Chinese Mitten Crab Eriocheir Sinensis. Fish. Shellfish. Immunol. 40 (1), 120–128. doi: 10.1016/j.fsi.2014.06.027
Liu Z., Zhang J., Ma A., Wang X., Sun Z., Cui W., et al. (2020). Molecular Characterization, Expression Analysis of 14-3-3 Beta/Alpha and the Effect of RNA Interference on Ion Transporter Protein Na+-K+-ATPase, Na+–H+-Exchanger and CFTR in Turbot (Scophthalmus Maximus). Comp. Biochem. Physiol. Part B.: Biochem. Mol. Biol. 246-247, 110458. doi: 10.1016/j.cbpb.2020.110458
Livak K. J., Schmittgen T. D. (2001). Analysis of Relative Gene Expression Data Using Real-Time Quantitative PCR and the 2–ΔΔCT Method. Methods 25 (4), 402–408. doi: 10.1006/meth.2001.1262
MacKay V. L., Li X., Flory M. R., Turcott E., Law G. L., Serikawa K. A., et al. (2004). Gene Expression Analyzed by High-Resolution State Array Analysis and Quantitative Proteomics: Response of Yeast to Mating Pheromone. Mol. Cell. Proteomics 3 (5), 478–489. doi: 10.1074/mcp.M300129-MCP200
Magin T. M., Vijayaraj P., Leube R. E. (2007). Structural and Regulatory Functions of Keratins. Exp. Cell Res. 313 (10), 2021–2032. doi: 10.1016/j.yexcr.2007.03.005
McEwen B. S. (1998). “Stress, Adaptation, and Disease - Allostasis and Allostatic Load,” in Ann N Y Acad Sci., vol. 840.
McEwen B. S. (2005). Stressed or Stressed Out: What Is the Difference? J. Psychiatry Neurosci. 30 (5), 315–318.
McEwen B. S., Wingfield J. C. (2003). The Concept of Allostasis in Biology and Biomedicine. Hormone. Behav. 43 (1), 2–15. doi: 10.1016/s0018-506x(02)00024-7
Milner K.-L., van der Poorten D., Xu A., Bugianesi E., Kench J. G., Lam K. S. L., et al. (2009). Adipocyte Fatty Acid Binding Protein Levels Relate to Inflammation and Fibrosis in Nonalcoholic Fatty Liver Disease. Hepatology 49 (6), 1926–1934. doi: 10.1002/hep.22896
Ming J., Xie J., Xu P., Liu W., Ge X., Liu B., et al. (2010). Molecular Cloning and Expression of Two HSP70 Genes in the Wuchang Bream (Megalobrama Amblycephala Yih). Fish. Shellfish. Immunol. 28 (3), 407–418. doi: 10.1016/j.fsi.2009.11.018
Molle V., Campagna S., Bessin Y., Ebran N., Saint N., Molle G. (2008). First Evidence of the Pore-Forming Properties of a Keratin From Skin Mucus of Rainbow Trout (Oncorhynchus Mykiss, Formerly Salmo Gairdneri). Biochem. J. 411 (1), 33. doi: 10.1042/BJ20070801
Mommsen T. P., Vijayan M. M., Moon T. W. (1999). Cortisol in Teleosts: Dynamics, Mechanisms of Action, and Metabolic Regulation. Rev. Fish. Biol. Fish. 9 (3), 211–268. doi: 10.1023/A:1008924418720
Moon T. W., Foster G. D. (1995). “Tissue Carbohydrate Metabolism, Gluconeogenesis and Hormonal and Environmental Influences,” in Metabolic and Adaptational Biochemistry. Eds. Hochachka P. W., Mommsen T. P. (Amsterdam, Netherlands: Elsevier), 65–100.
Mormede P., Andanson S., Auperin B., Beerda B., Guemene D., Malmkvist J., et al. (2007). Exploration of the Hypothalamic-Pituitary-Adrenal Function as a Tool to Evaluate Animal Welfare. Physiol. Behav. 92 (3), 317–339. doi: 10.1016/j.physbeh.2006.12.003
Ni M., Wen H., Li J., Chi M., Ren Y., Song Z., et al. (2014). Two HSPs Gene From Juvenile Amur Sturgeon (Acipenser Schrenckii): Cloning, Characterization and Expression Pattern to Crowding and Hypoxia Stress. Fish. Physiol. Biochem. 40 (6), 1801–1816. doi: 10.1007/s10695-014-9969-9
O’Connor E. A., Pottinger T. G., Sneddon L. U. (2011). The Effects of Acute and Chronic Hypoxia on Cortisol, Glucose and Lactate Concentrations in Different Populations of Three-Spined Stickleback. Fish. Physiol. Biochem. 37 (3), 461–469. doi: 10.1007/s10695-010-9447-y
Olsen Y. A., Einarsdottir I. E., Nilssen K. J. (1995). Metomidate Anaesthesia in Atlantic Salmon, Salmo Salar, Prevents Plasma Cortisol Increase During Stress. Aquaculture 134, 155–168. doi: 10.1016/0044-8486(95)00008-P
Øverli Ø., Pottinger T. G., Carrick T. R., Øverli E., Winberg S. (2002). Differences in Behaviour Between Rainbow Trout Selected for High- and Low-Stress Responsiveness. J. Exp. Biol. 205 (3), 391–395. doi: 10.1242/jeb.205.3.391
Patel D. M., Bhide K., Bhide M., Iversen M. H., Brinchmann M. F. (2019). Proteomic and Structural Differences in Lumpfish Skin Among the Dorsal, Caudal and Ventral Regions. Sci. Rep. 9 (1), 6990. doi: 10.1038/s41598-019-43396-z
Patel D. M., Brinchmann M. F. (2017). Skin Mucus Proteins of Lumpsucker (Cyclopterus Lumpus). Biochem. Biophys. Rep. 9, 217–225. doi: 10.1016/j.bbrep.2016.12.016
Pérez-Sánchez J., Terova G., Simó-Mirabet P., Rimoldi S., Folkedal O., Calduch-Giner J. A., et al. (2017). Skin Mucus of Gilthead Sea Bream (Sparus Aurata L.). Protein Mapping and Regulation in Chronically Stressed Fish. Front. Physiol. 8. doi: 10.3389/fphys.2017.00034
Petitjean Q., Jean S., Gandar A., Côte J., Laffaille P., Jacquin L. (2019). Stress Responses in Fish: From Molecular to Evolutionary Processes. Sci. Total. Environ. 684, 371–380. doi: 10.1016/j.scitotenv.2019.05.357
Pfaffl M. W. (2001). A New Mathematical Model for Relative Quantification in Real-Time RT–PCR. Nucleic Acids Res. 29 (9), e45–e45. doi: 10.1093/nar/29.9.e45
Pfaffl M. W., Tichopad A., Prgomet C., Neuvians T. P. (2004). Determination of Stable Housekeeping Genes, Differentially Regulated Target Genes and Sample Integrity: BestKeeper – Excel-based Tool Using Pair-Wise Correlations. Biotechnol. Lett. 26 (6), 509–515. doi: 10.1023/B:BILE.0000019559.84305.47
Pickering A. D. (1990). Stress and the Supppression of Somatic Growth in Teleost Fish. Prog. Comp. Endocrinol. 342, 473–479.
Pickering A. D., Pottinger T. G. (1989). Stress Responses and Disease Resistance in Salmonid Fish: Effects of Chronic Elevation of Plasma Cortisol. Fish. Physiol. Biochem. 7 (1-6), 253–258. doi: 10.1007/bf00004714
Pottinger T. G., Carrick T. R. (2001). ACTH Does Not Mediate Divergent Stress Responsiveness in Rainbow Trout. Comp. Biochem. Physiol. A-Molecu. Integr. Physiol. 129 (2-3), 399–404. doi: 10.1016/s1095-6433(00)00357-3
Rajan B., Fernandes J. M. O., Caipang C. M. A., Kiron V., Rombout J. H. W. M., Brinchmann M. F. (2011). Proteome Reference Map of the Skin Mucus of Atlantic Cod (Gadus Morhua) Revealing Immune Competent Molecules. Fish. Shellfish. Immunol. 31 (2), 224–231. doi: 10.1016/j.fsi.2011.05.006
Rando O. J. (2012). Combinatorial Complexity in Chromatin Structure and Function: Revisiting the Histone Code. Curr. Opin. Genet. Dev. 22 (2), 148–155. doi: 10.1016/j.gde.2012.02.013
Raposo de Magalhães C., Schrama D., Farinha A. P., Revets D., Kuehn A., Planchon S., et al. (2020). Protein Changes as Robust Signatures of Fish Chronic Stress: A Proteomics Approach to Fish Welfare Research. BMC Genomics 21 (1), 309. doi: 10.1186/s12864-020-6728-4
Redding M. J., Schreck C. B. (1983). Influence of Ambient Salinity on Osmoregulation and Cortisol Concentration in Yearling Coho Salmon During Stress. Trans. Am. Fish. Soc. 112 (6), 800–807. doi: 10.1577/1548-8659(1983)112<800:IOASOO>2.0.CO;2
Robinette D. W., Noga E. J. (2001). Histone-Like Protein: A Novel Method for Measuring Stress in Fish. Dis. Aquat. Organ. 44 (2), 97–107. doi: 10.3354/dao044097
Robinette D., Wada S., Arroll T., Levy M. G., Miller W. L., Noga E. J. (1998). Antimicrobial Activity in the Skin of the Channel Catfish Ictalurus Punctatus: Characterization of Broad-Spectrum Histone-Like Antimicrobial Proteins. Cell. Mol. Life Sci. CMLS0 54 (5), 467–475. doi: 10.1007/s000180050175
Selye H. (1950). Stress and the General Adaptation Syndrome. Br. Med. J. 1 (4667), 1383–1392. doi: 10.1136/bmj.1.4667.1383
Selye H. (1973). Homeostasis and Heterostasis. Perspect. Biol. Med. 16, 441–445. doi: 10.1007/978-1-4684-2145-3_2
Smith K. T., Workman J. L. (2012). Chromatin Proteins: Key Responders to Stress. PloS Biol. 10 (7), e1001371. doi: 10.1371/journal.pbio.1001371
Staurnes M., Sigholt T., Pedersen H. P., Rustad T. (1994). Physiological Effects of Simulated High-Density Transport of Atlantic Cod (Gadus Morhua). Aquaculture 119 (4), 381–391. doi: 10.1016/0044-8486(94)90302-6
Stien L., Størkersen K., Gåsnes S. (2020). Analysis of Mortality Data From Survey on Cleaner Fish. Rapp. Fra. Havforskn. 6, 1–33.
Stranden A. L. (2020). “Hvert År Dør 50 Millioner Rensefisk I Norske Oppdrettsanlegg,” in Forskningno, Oslo, Norway. Available at: https://forskning.no/fisk-fiskehelse-fiskesykdommer/hvert-ar-dor-50-millioner-rensefisk-i-norske-oppdrettsanlegg/1627630.
Stricher F., Macri C., Ruff M., Muller S. (2013). HSPA8/HSC70 Chaperone Protein: Structure, Function and Chemical Targeting. Autophagy 9 (12), 1937–1954. doi: 10.4161/auto.26448
Thang N. Q., Phuong N. T. K., Van Tan L. (2017). Endocrine Stress Response in Oreochromis Sp. From Exposure to Waterborne Cadmium: The Plasma Cortisol Analysis. Toxicolog. Environ. Chem. 99 (2), 285–293. doi: 10.1080/02772248.2016.1172583
Tort L. (2011). Stress and Immune Modulation in Fish. Dev. Comp. Immunol. 35 (12), 1366–1375. doi: 10.1016/j.dci.2011.07.002
Treasurer J., Noble C., Puvanendran V., Planellas S. R., Iversen M. H. (2018). “Cleaner Fish Welfare,” in Cleaner Fish biology and Aquaculture Applications, 5M Publishing. Sheffield, UK, 281–312.
Trischitta F., Denaro M. G., Faggio C. (2005). Cell Volume Regulation Following Hypotonic Stress in the Intestine of the Eel, Anguilla Anguilla, is Ca2+-Dependent. Comp. Biochem. Physiol. B-Biochem. Mol. Biol. 140 (3), 359–367. doi: 10.1016/j.cbpc.2004.10.011
Tzivion G., Shen Y. H., Zhu J. (2001). 14-3-3 Proteins; Bringing New Definitions to Scaffolding. Oncogene 20 (44), 6331–6338. doi: 10.1038/sj.onc.1204777
Varsamos S., Flik G., Pepin J. F., Bonga S. E. W., Breuil G. (2006). Husbandry Stress During Early Life Stages Affects the Stress Response and Health Status of Juvenile Sea Bass, Dicentrarchus Labrax. Fish. Shellfish. Immunol. 20 (1), 83–96. doi: 10.1016/j.fsi.2005.04.005
Veiseth E., Fjæra S. O., Bjerkeng B., Skjervold P. O. (2006). Accelerated Recovery of Atlantic Salmon (Salmo Salar) From Effects of Crowding by Swimming. Comp. Biochem. Physiol. B-Biochem. Mol. Biol. 144 (3), 351–358. doi: 10.1016/j.cbpb.2006.03.009
Veiseth-Kent E., Grove H., Færgestad E. M., Fjæra S. O. (2010). Changes in Muscle and Blood Plasma Proteomes of Atlantic Salmon (Salmo Salar) Induced by Crowding. Aquaculture 309 (1–4), 272–279. doi: 10.1016/j.aquaculture.2010.09.028
Wells R. M. G., Pankhurst N. W. (1999). Evaluation of Simple Instruments for the Measurement of Blood Glucose and Lactate, and Plasma Protein as Stress Indicators in Fish. J. World Aquac. Soc. 2, 276–284. doi: 10.1111/j.1749-7345.1999.tb00876.x
Wendelaar Bonga S. E. W. (1997). The Stress Response in Fish. Physiol. Rev. 77 (3), 591–625. doi: 10.1152/physrev.1997.77.3.591
Wendelaar Bonga S. E. (2011). “Hormon Response to Stress,” in Encyclopedia of Fish Physiology. Ed. Anthony P. F. (San Diego: Academic Press), 1515–1523.
Wilens T. E., Ritchie J. C., Carroll B. J. (1984). Comparison of Plasma Cortisol and Corticosterone in the Dexamethasone Suppression Test for Melancholia. Psychoneuroendocrinology 9 (1), 45–55. doi: 10.1016/0306-4530(84)90021-0
Wingfield J. C. (2005). The Concept of Allostasis: Coping With a Capricious Environment. J. Mammalog. 86 (2), 248–254. doi: 10.1644/BHE-004.1
Yang N., Peng C., Cheng D., Huang Q., Xu G., Gao F., et al. (2013). The Over-Expression of Calmodulin From Antarctic Notothenioid Fish Increases Cold Tolerance in Tobacco. Gene 521 (1), 32–37. doi: 10.1016/j.gene.2013.03.048
Yeung D. C. Y., Xu A., Tso A. W. K., Chow W. S., Wat N. M. S., Fong C. H. Y., et al. (2009). Circulating Levels of Adipocyte and Epidermal Fatty Acid–Binding Proteins in Relation to Nephropathy Staging and Macrovascular Complications in Type 2 Diabetic Patients. Diabetes Care 32 (1), 132–134. doi: 10.2337/dc08-1333
Zhang S., Fu L., Wang Y., Lin J. (2014). Alterations of Protein Expression in Response to Crowding in the Chinese Shrimp (Fenneropenaeus Chinensis). Aquaculture 428–429, 135–140. doi: 10.1016/j.aquaculture.2014.03.001
Zhang Y., Liu K., Hassan H. M., Guo H., Ding P., Han L., et al. (2016). Liver Fatty Acid Binding Protein Deficiency Provokes Oxidative Stress, Inflammation, and Apoptosis-Mediated Hepatotoxicity Induced by Pyrazinamide in Zebrafish Larvae. Antimicro. Agents Chemother. 60 (12), 7347–7356. doi: 10.1128/AAC.01693-16
Keywords: lumpfish (Cyclopterus lumpus L.), chronic stress, allostatic load, welfare, crowding, proteomics, heat shock (stress) proteins, cortisol
Citation: Patel DM, Brinchmann MF, Hanssen A and Iversen MH (2022) Changes in the Skin Proteome and Signs of Allostatic Overload Type 2, Chronic Stress, in Response to Repeated Overcrowding of Lumpfish (Cyclopterus lumpus L.). Front. Mar. Sci. 9:891451. doi: 10.3389/fmars.2022.891451
Received: 07 March 2022; Accepted: 18 April 2022;
Published: 17 May 2022.
Edited by:
Arabinda Mahanty, National Rice Research Institute (ICAR), IndiaReviewed by:
Tandrima Mitra, KIIT University, IndiaCopyright © 2022 Patel, Brinchmann, Hanssen and Iversen. This is an open-access article distributed under the terms of the Creative Commons Attribution License (CC BY). The use, distribution or reproduction in other forums is permitted, provided the original author(s) and the copyright owner(s) are credited and that the original publication in this journal is cited, in accordance with accepted academic practice. No use, distribution or reproduction is permitted which does not comply with these terms.
*Correspondence: Monica F. Brinchmann, bW9uaWNhLmYuYnJpbmNobWFubkBub3JkLm5v; Martin H. Iversen, bWFydGluLmguaXZlcnNlbkBub3JkLm5v
†These authors share first authorship
Disclaimer: All claims expressed in this article are solely those of the authors and do not necessarily represent those of their affiliated organizations, or those of the publisher, the editors and the reviewers. Any product that may be evaluated in this article or claim that may be made by its manufacturer is not guaranteed or endorsed by the publisher.
Research integrity at Frontiers
Learn more about the work of our research integrity team to safeguard the quality of each article we publish.