 Lisheng Wu
 Jianlong Li
 Feng Tong
 Jiajun Zhang
 Miaomiao Li
 Shaoxiong Ding
- 1State Key Laboratory of Marine Environmental Science, College of Ocean and Earth Sciences, Xiamen University, Xiamen, China
- 2Function Laboratory for Marine Fisheries Science and Food Production Processes, Qingdao National Laboratory for Marine Science and Technology, Qingdao, China
- 3State Key Laboratory of Marine Resource Utilization in South China Sea, Hainan University, Haikou, China
- 4Department of Marine Sciences, College of Marine Sciences, Hainan University, Haikou, China
- 5Fujian Provincial Fishery Technical Extension Center, Fuzhou, China
Environmental DNA (eDNA) is a promising tool for rapid and noninvasive biomonitoring and resource assessment. Broadly, two main PCR-based strategies of biodiversity monitoring can be deployed for eDNA analysis. The first one consists of targeting single species using standard PCR, real-time quantitative PCR (qPCR), or droplet digital PCR (ddPCR). The second strategy aims to simultaneously detect multiple species relying on High-Throughput Sequencing (i.e. eDNA metabarcoding). The aim of this study was to further explore a convenient and feasible method to correctly assess fishery resources using eDNA technology for large yellow croaker (Larimichthys crocea). Two eDNA methods (metabarcoding and qPCR) were used to investigate the biomass and distribution of large yellow croaker in the autumn and spring seasons in the central and southern regions of the East China Sea, and these results were compared with the results of a bottom trawling fishery survey. The results suggested that the designed NADH2-specific primers and developed real-time qPCR method were more applicable and reliable. The variation in the eDNA concentration of large yellow croakers coincided well with that of a real capture survey in the East China Sea. The difference in eDNA concentration between the surface and bottom water samples reflected the distribution characteristics in the water layer related to the life history of L. crocea in the two seasons. The developed methods based on eDNA technology and real-time qPCR could not only be used to evaluate the resource distribution but could also contribute to estimating the life history and migration route of large yellow croaker.
1 Introduction
As one of the most important marine economic fish in China, before the 1980s, the large yellow croaker Larimichthys crocea was the most abundant resource in the East China Sea fishery for a long time, but overfishing greatly reduced the population, and the artificial release enhancement strategy implemented since 2000 has not yet shown a significant effect (China Fisheries Statistical Yearbook, 1956-2019). Due to the scarcity of wild L. crocea resources in the East China Sea, when using traditional survey techniques and methods to investigate fishery resources, the random error of the survey results is too large to accurately assess the fish standing stock, and the distribution and migratory paths of L. crocea in the East China Sea are difficult to accurately judge, which poses a problem for officials regarding how to conserve and restore wild L. crocea resources in the East China Sea. Concurrently, because traditional morphological identification also requires professional and experienced staff and considerable manpower, financial resources and time, it is difficult to track the trajectory of L. crocea resources over time. Therefore, establishing a convenient and accurate fishery survey method is of great significance to the survey of L. crocea fishery resources, biomass evaluation, fishery biodiversity research and species protection.
Environmental DNA (eDNA) is obtained directly from environments (e.g., ice, sediments or water) without first isolating any target organisms. The advent and application of eDNA-based strategies has revolutionized the method of biomonitoring and resource assessment, as it is not only possible to simultaneously identify multiple targets in mixed samples through eDNA metabarcoding, which can be used for biodiversity assessments of fish (Thomsen et al., 2012; Zhang, 2015; Sato et al., 2018; García-Machado et al., 2022; Saenz-Agudelo et al., 2022), but it can also help with single-target species quantitative assessment when performed with real-time qPCR technology (Takahara et al., 2013; Yamamoto et al., 2016; Baldigo et al., 2017; Li et al., 2019; Postaire et al., 2020; Wang et al., 2021). Wang et al. (2021) developed a pair of species-specific primers based on mitochondrial 12S rRNA and a L. crocea-specific TaqMan probe to investigate the distribution and abundance of L. crocea in the East China Sea in the spring of 2019, but it is unfortunate that they carried out the research only in a single season and did not compare their molecular results with traditional fishery survey results.
To further explore the use of eDNA technology for L. crocea monitoring, in this study, two eDNA strategies were used to investigate the biomass and distribution of L. crocea in two seasons (autumn and spring) in the central and southern waters of the East China Sea, and these results were compared with the results of a bottom trawling fishery survey. First, the eDNA abundance of L. crocea was detected in the surface and bottom water samples from 10 survey stations in two cruises by eDNA metabarcoding technology. Concomitantly, we designed and developed a pair of L. crocea specific primers, and real-time qPCR was used with this primer pair to detect the eDNA concentration of L. crocea in the surface and bottom water samples of 11 stations on two cruises. Our results can not only provide new technical means for resource evaluation in the East China Sea but also obtain information on the dispersal and migration paths of L. crocea at different developmental stages, thus providing important guidance for the formulation of management policies and release enhancement of this important fish species.
2 Material And Methods
2.1 Fishery Resources Survey
Two cruises were carried out in the East China Sea from November 16 to December 5, 2018 (hereafter referred to as “autumn 2018”) and April 6 to 25, 2019 (hereafter referred to as “spring 2019”), covering the northern part of the Taiwan Strait to the south of the Yangtze River Estuary, with a total of 24 sites (Figure 1). The average depth of sampling sites was 79.53 ± 23.81 m. In autumn 2018, the average temperature of surface water and bottom water was 22.07 ± 1.20 °C and 19.90 ± 2.06 °C, respectively. The average salinity of surface water and bottom water were 33.35 ± 1.31 and 34.05 ± 0.86, respectively. In spring 2019, the average temperature of surface water and bottom water were 19.67 ± 2.62 °C and 19.27 ± 1.37 °C, respectively. The average salinity of surface water and bottom water were 33.14 ± 1.93 and 34.29 ± 0.63, respectively.
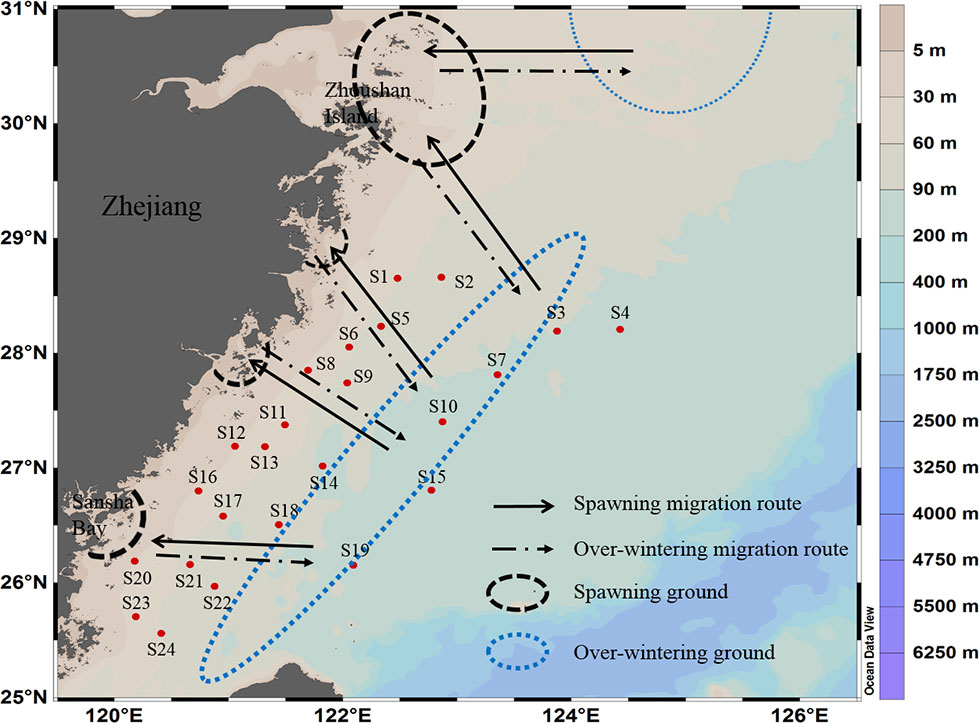
Figure 1 Map of survey sites of Larimichthys crocea. The spawning ground, overwintering ground, and migration route of L. crocea in the East China Sea, modified from Wang et al. (2021).
Fishery resource surveys were conducted by a single commercial trawler through bottom trawling. The trawl net was 157 m long in total, with an 80-m-long net wing, a 50-m-long body panel, and a 27-m-long cod-end; the mesh size of the cod-end was 10 mm. During the fishing survey, at every site, the trawl net was dragged for 1 h at a speed of 2-3 kn. Trawl catches were selected in situ, stored on ice in the refrigerator, and then transferred back to the land laboratory for identification and body weight measurement.
2.2 Field Sampling Sites for eDNA
Water samples for eDNA analysis were collected at 18 sites of the 24 fishing sampling sites during two cruises (autumn 2018 and spring 2019) in the East China Sea (Figure 1 and Table 1). There were 10 sites and 11 sites for eDNA metabarcoding and real-time qPCR analysis, respectively (Table 1).
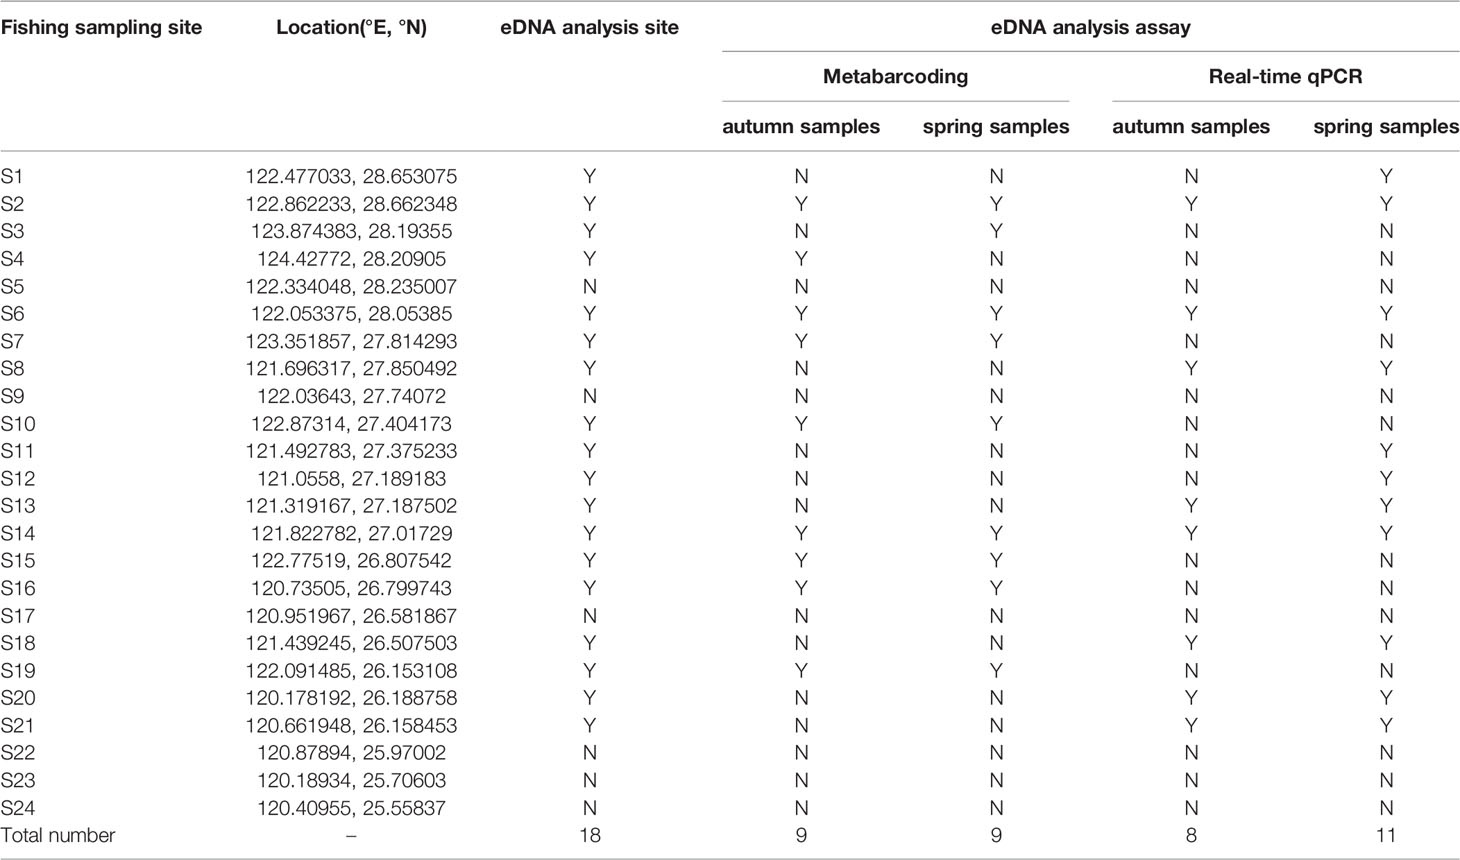
Table 1 Sampling sites of Larimichthys crocea in the East China Sea.
2.3 Water Sampling for eDNA
The surface and bottom water samples were collected at each sampling site. The surface water samples were collected in sterile wide mouth bottles at a depth of 0.5 m below the sea surface, and the bottom water samples were collected with a water sampler at a depth of 1 m upon the seafloor. After sampling at each station, the water sampler was washed with 10% v/v sodium hypochlorite solution, washed with pure water, and then moistened with seawater at the next station for sampling.
Water samples were filtered using a vacuum pump. A total of 1.5 L of water from each sample was filtered onto 47-mm glass fiber with a pore size of 0.7 µm (each sampling water layer at each sampling site was replicated three times). All filters were preserved by freezing in liquid nitrogen and transferred to the laboratory, where the samples were stored at –80°C until further eDNA extraction. Filter funnels were washed with distilled water, soaked in a 10% v/v sodium hypochlorite solution, and washed with distilled water before and after each sample was filtered. New gloves were changed for different sample. For each sampling cruise, one sampling blank and one filtration blank (2 L deionized water) were filtered before sample filtration to test for possible contamination at the sampling and filtration stages. The sampling blank consists of 2 L sampling bottle filled with ultra-purified water (Milli-Q). It was opened once in the field and then kept and processed alongside other water samples. To avoid exogenous DNA contamination, all centrifuge tubes, tweezers, scissors and other experimental apparatuses were sterilized under UV light in a PCR workstation over 30 minutes before filtration.
2.4 Bioinformatics Analyses With the Metabarcoding Method
All preserved filters were sent to the BGI Qingdao Research Institute for eDNA extraction, and metabarcoding library construction was performed with the MiFish 12S primers (Miya et al., 2015). The sampling blank, filtration blank and PCR negatives were not pooled in the final library since there were no target bands under the 2% agarose gel. The final purified library was sequenced on the BGI-500 high-throughput sequencing platform with paired-end sequencing.
Raw data from high-throughput sequencing have been submitted to NCBI (BioProject: PRJNA811428). The raw data were filtered to eliminate adapter contamination and reads of low quality (below Q20), and then paired-end reads were combined with tags based on overlaps using FLASH. Subsequently, the tags were clustered into operational taxonomic units (OTUs) using USEARCH with a 97% threshold, and all tags were mapped to the representative sequence to obtain the OTU abundance table. The taxonomic assignment of OTU sequences was mapped to the nt database downloaded from NCBI (https://www.ncbi.nlm.nih.gov/) and MitoFish (http://mitofish.aori.u-tokyo.ac.jp/) by using the BLASTn tool. OTU sequences were assigned to a species if there was ≥98% sequence identity, and those OTUs identified as L. crocea were picked up, and their abundance was obtained.
2.5 Bioinformatics and Statistical Analyses of the Real-Time qPCR Method
2.5.1 eDNA Extraction and Specific Primer Design
Total eDNA was extracted from filters using a DNeasy Blood & Tissue Kit (Qiagen) following the manufacturer’s instructions with slight modifications. A pair of specific primers of the L. crocea was designed manually using Primer Premier 5.0 with mitochondrial DNA (mtDNA) sequences of the Sciaenidae fish species downloaded from NCBI. The primer pair (Lacro-ND2-F: 5’-ACCATCTGACTCCCTGAAGTTTTAC-3’ and Lacro-ND2-R: 5’-AAGCGTAGCATAATAAGAAGGGTCG-3’) was designed to amplify a 139-bp fragment of the mtDNA NADH2 gene.
2.5.2 Specificity Validation of Real-Time qPCR Primers
Once the specific primer pair was designed, we first validated their specificity using Primer-BLAST and then tested them via PCR by amplifying the target fragment of other species known to co-occur in the survey areas. The reaction system and reaction solutions were optimized. Next, we tested the specificity with the closely related species of L. crocea under the same family Sciaenidae or the representative species of other orders which also distributed in the survey area by real-time qPCR. The species used in the common PCR were as follows: L. crocea (Sciaenidae), L. polyactis (Sciaenidae), Collichthys lucidus (Sciaenidae), Chrysochir aureus (Sciaenidae), Pampus argenteus (Stromateidae), Miichthys miiuy (Sciaenidae), Trachiocephalus myops (Synodontidae), Parargyrops edita (Sparidae), Telatrygon zugei (Dasyatidae), Ateleopus japonicus (Ateleopodidae) and Rhinobatos schlegelii (Rhinobatidae).
2.5.3 Standard Curve Construction
The amplified products of DNA of L. crocea were assessed by electrophoresis, running the products through a 1.5% agarose gel, and then visualized under a UV light platform. Next, the products were excised and purified using a SanPrep Column DNA Gel Extraction Kit (Sangon Biotech, Shanghai, China) following the manufacturer’s protocol, and then the amplified products were cloned into the pMD-19T Vector (TAKARA) for plasmid standard preparation. The plasmid standards were extracted using an Endofree Plasmid Mini Kit (CWBIO, China), subjected to serial dilution (1×10⁷-1×10² copies/μL) and then used as a template in real-time qPCR to establish the standard curve to validate the specificity of the specific primers and the applicability of the reaction system.
2.5.4 Real-Time qPCR
Real-time qPCR was conducted on a ABI QuantStudio 6 Flex (Thermo) using TB Green Premix DimerEraser (2×) (TAKARA) as follows. The amplification reaction was performed in a total volume of 20 μL, which consisted of 10 μL of TB Green Premix DimerEraser (2×), 0.6 μL of each primer (10 μM), 0.4 μL ROX Reference Dye II (50×), 2 μL of eDNA template and 6.4 μL of PCR-grade water. The PCR was started with an initial denaturing step of 95°C for 30 s, followed by 50 cycles of 95°C for 5 s, 57°C for 30 s, and 72°C for 30 s. The final melting curve step consisted of 95°C for 15 s and 60°C for 60 s, followed by 95°C for 15 s. A negative control was also conducted in the real-time qPCR, and all samples were assayed in triplicate. The eDNA concentrations was calculated as copies/μL based on the standard curves.
2.6 Data Analysis
Biological measurements were performed on the L. crocea caught at each survey site. After metabarcoding sequencing, the average eDNA abundance for each water sample across three sampling replicates was calculated based on the OTUs noted for L. crocea. After quantitative amplification by species-specific primers (NADH2), the eDNA concentrations of L. crocea were determined for each water sample. Spearman’s rank correlation coefficient was used to calculate correlations between the capture biomass and eDNA abundance/concentration of L. crocea. The difference of eDNA concentration between different sampling layers was tested by paired t test. The linear correlation between eDNA concentration and Ct value from real-time qPCR was investigated for the standard curves. All statistical analyses were performed using R software version 4.0.3. The statistical significance level of this study is set at 0.05.
The sampling stations and spatial distribution of L. crocea were visualized with Ocean Data view 4 software.
3 Results
3.1 Catches of L. crocea
In 17 out of the 24 fishing survey sites across two season cruises, L. crocea was caught. In autumn 2018, there were catches of L. crocea at 13 sites, the weight of the captured individuals (i.e., the capture biomass) ranged from 36.3-17556.7 g, and the number of individuals ranged from 1-244; in spring 2019, there were catches of L. crocea in only 9 sites, the weight of the captured individuals ranged from 32.2-783.8 g, and the number of individuals ranged from 1-14 (Table 2).
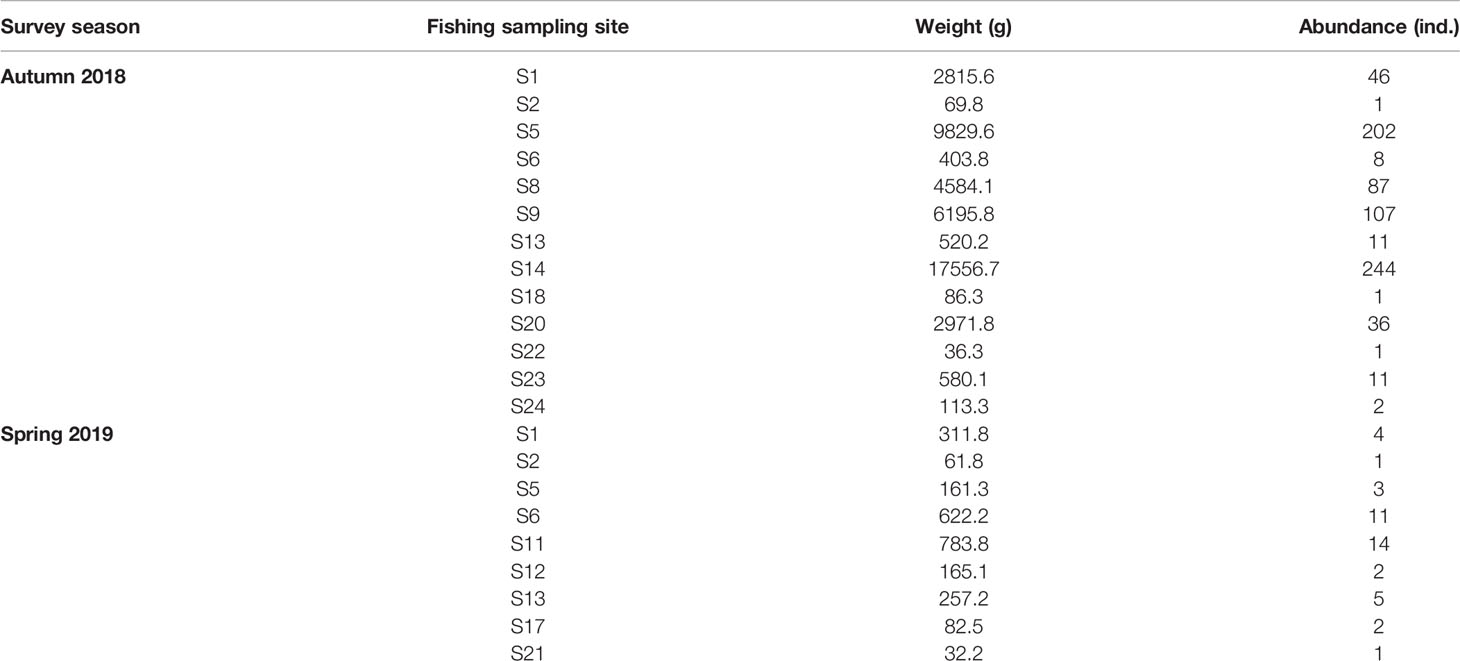
Table 2 Catches of Larimichthys crocea in fishing survey sites.
3.2 Sequencing Outputs of Metabarcoding
After metabarcoding sequencing of a total of 105 samples from 9 sites of two cruises in the East China Sea, the number of effective sequences ranged from 8 665-2 777 881 (mean ± SD=312151.8 ± 376124.2), while the number of high-quality sequences (above Q20) ranged from 8 449-2 703 779 (mean ± SD=302540.8 ± 366270.2) (Tables S1, S2).
Based on the difference threshold of 3%, 749 OTUs were finally obtained from all sequences. After removing the OTUs noted for nontarget species, 591 OTUs were identified as fish taxa. The species of OTUs notated by nonfish sequences mainly included Homo sapiens, Gallus gallus, and Ovis aries, among others (Table S3).
3.3 Distribution Pattern of L. crocea Based on OTU Abundance
There were some differences in the horizontal distribution of OTU abundance of L. crocea between the two seasons.
In autumn 2018, high OTU abundance occurred in the middle of the survey area in terms of surface samples (i.e., S6 and S15; Figure 2A). However, high OTU abundance occurred in the south of the survey area in terms of bottom samples (i.e., S19; Figure 2B). Taking into account the average reads between the surface samples and bottom samples, the OTU abundance of S10, S14, S15 and S19 was higher than that of the other survey areas (the abundance of L. crocea was above 1000; Figure 2C). This phenomenon coincided with the “hot” fishing areas (Figure 2D; between latitudes 26°00′ N and 28°30′ N and between longitudes 121°30′ E and 122°30′ E).
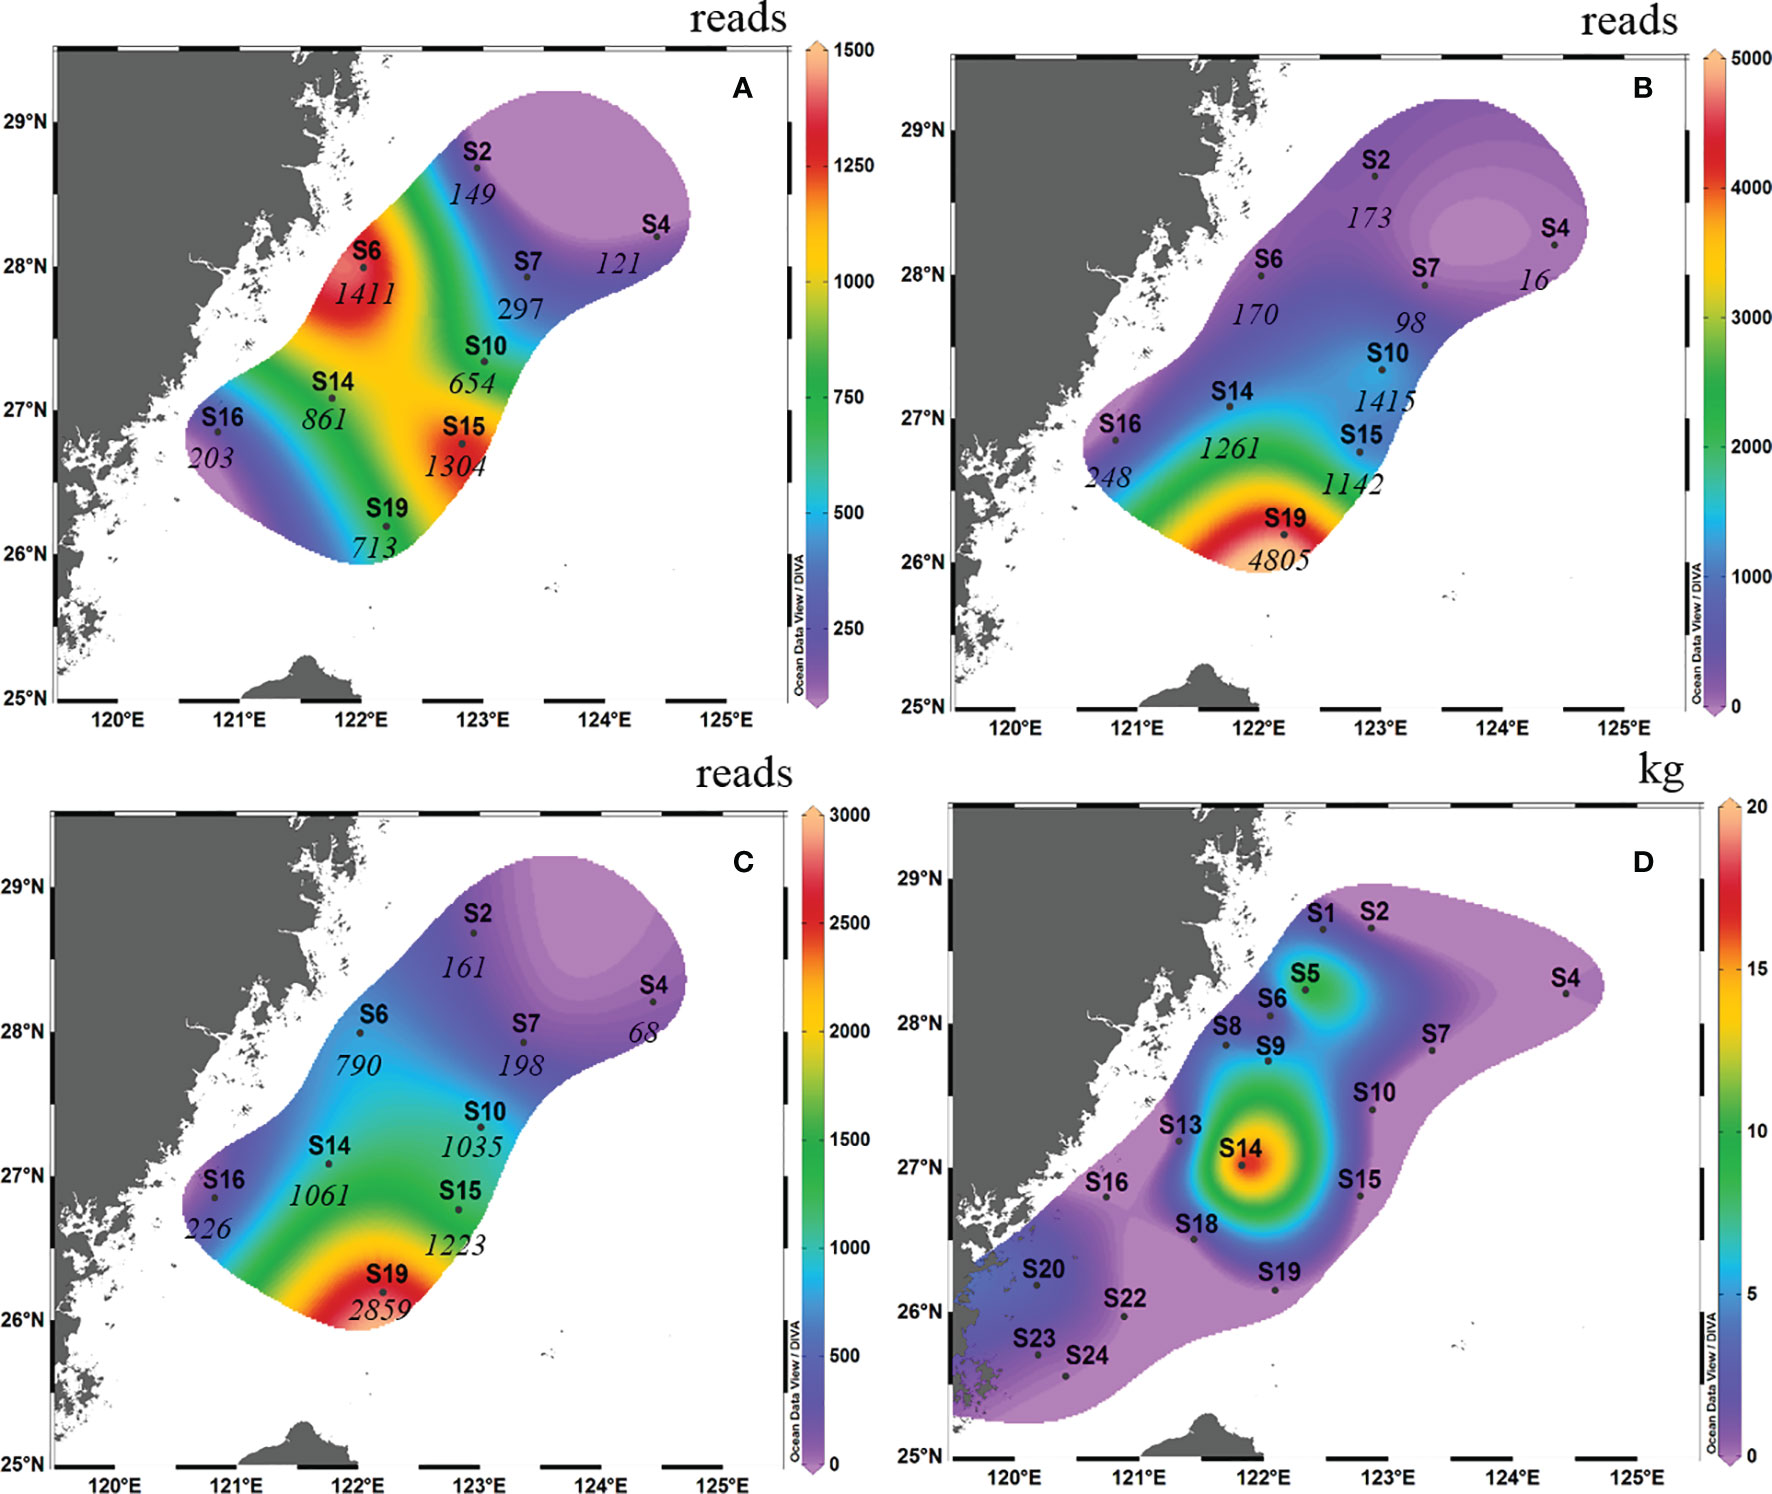
Figure 2 Contour map of Larimichthys crocea in the East China Sea in autumn 2018 based on metabarcoding analysis from surface samples (A), bottom samples (B) and the average abundance between surface samples and bottom samples (C), and based on capture biomass from fishing surveys (D). The italicized numbers indicate the OTU abundance of L. crocea.
In spring 2019, high OTU abundance occurred in the northwest of the survey area in terms of surface samples (i.e., S6 and S2; Figure 3A). However, high OTU abundance occurred in the northern survey area in terms of bottom samples (i.e., S2 and S3; Figure 3B). Taking into account the average reads between the surface samples and bottom samples, the OTU abundance of S6 and S2 was higher than that of the other survey areas (the abundance of L. crocea was above 600; Figure 3C). This phenomenon coincided with the “hot” fishing areas (Figure 3D; between latitudes 27°00′ N and 29°00′ N and between longitudes 121°00′ E and 123°00′ E).
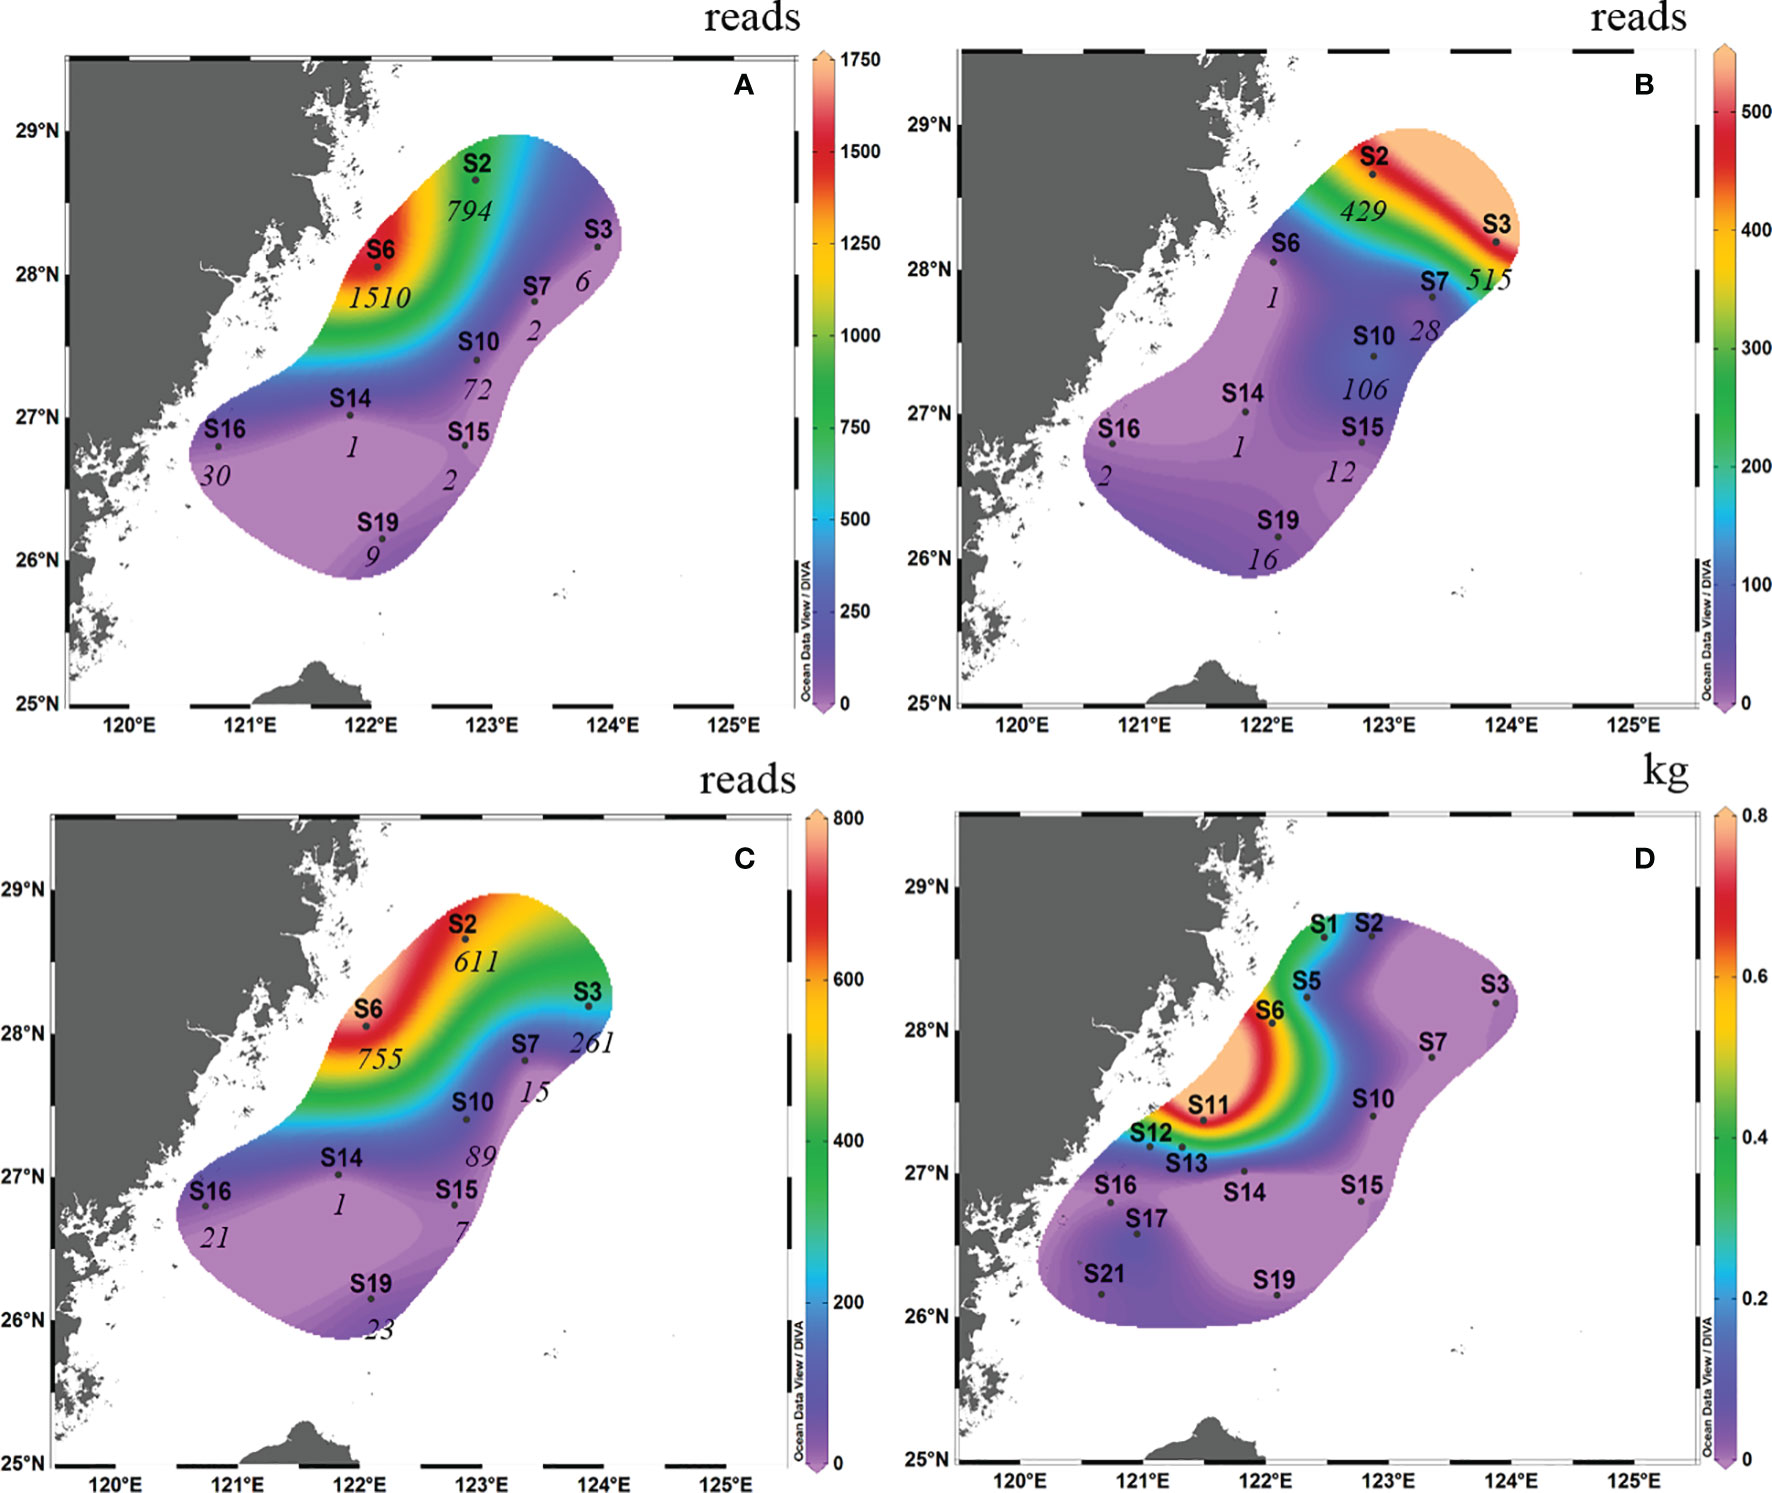
Figure 3 Contour map of Larimichthys crocea in the East China Sea in spring 2019 based on metabarcoding analysis from surface samples (A), bottom samples (B) and the average abundance between surface samples and bottom samples (C), and based on capture biomass from fishing surveys (D). The italicized numbers indicate the OTU abundance of L. crocea.
3.4 Relationship Between OTU Abundance and Capture Biomass of L. crocea
Comparing the OTU abundance with catches of L. crocea, we found that in autumn 2018, several sites with high OTU abundance, such as S6 and S10, also had a high capture biomass, albeit with some exceptions. For example, at S19 and S15, which had the highest and second highest OTU abundances, respectively, no L. crocea were caught. Therefore, there was no significant Spearman rank correlation between them (Spearman rs=0.270, p = 0.278). The same result was found in spring 2019; for example, S6 and S2, which had the highest OTU abundance, had the highest catches of L. crocea, while S3, which had the third highest OTU abundance, had no catches.
3.5 Primer Specificity Test and Real-Time qPCR Results
The designed pair of NADH2-specific primers showed high sensitivity and specificity and could specifically amplify only the target species (i.e., L. crocea), with no amplification products for other species and no primer dimer and nonspecific amplification (Figure S1).
The amplification curve and melting curve of real-time qPCR showed single amplification products, and the designed specific primers had good specificity for the L. crocea of the two cruises (Figures S2, S3).
After quantitative amplification by species-specific primers (NADH2), eDNA concentrations of L. crocea were calculated for each water sample in two cruises according to the standard curves:
eDNA concentration = -2.9213x + 37.29 (R2 = 0.9932, in autumn 2018);
eDNA concentration = -3.0266x + 37.894 (R2 = 0.99, in spring 2019).
In autumn 2018, the detection rate of eDNA of L. crocea in surface water samples from eight sites was 100%, and that in the bottom water sample was 87.5%, with the exception of S21 (Figure 4B). The eDNA concentrations ranged from 0.40-11.64 copies/μL (mean ± SD=4.87 ± 3.95 copies/μL), with no amplification in the negative control. In spring 2019, the detection rate of L. crocea in the surface water sample was 90.9% (10 out of 11 sites), with the exception of S21 (Figure 5A), and that in the bottom water sample was 100%. The eDNA concentrations ranged from 2.31-805.53 copies/μL (mean ± SD=137.46 ± 257.91 copies/μL), with no amplification in the negative control.
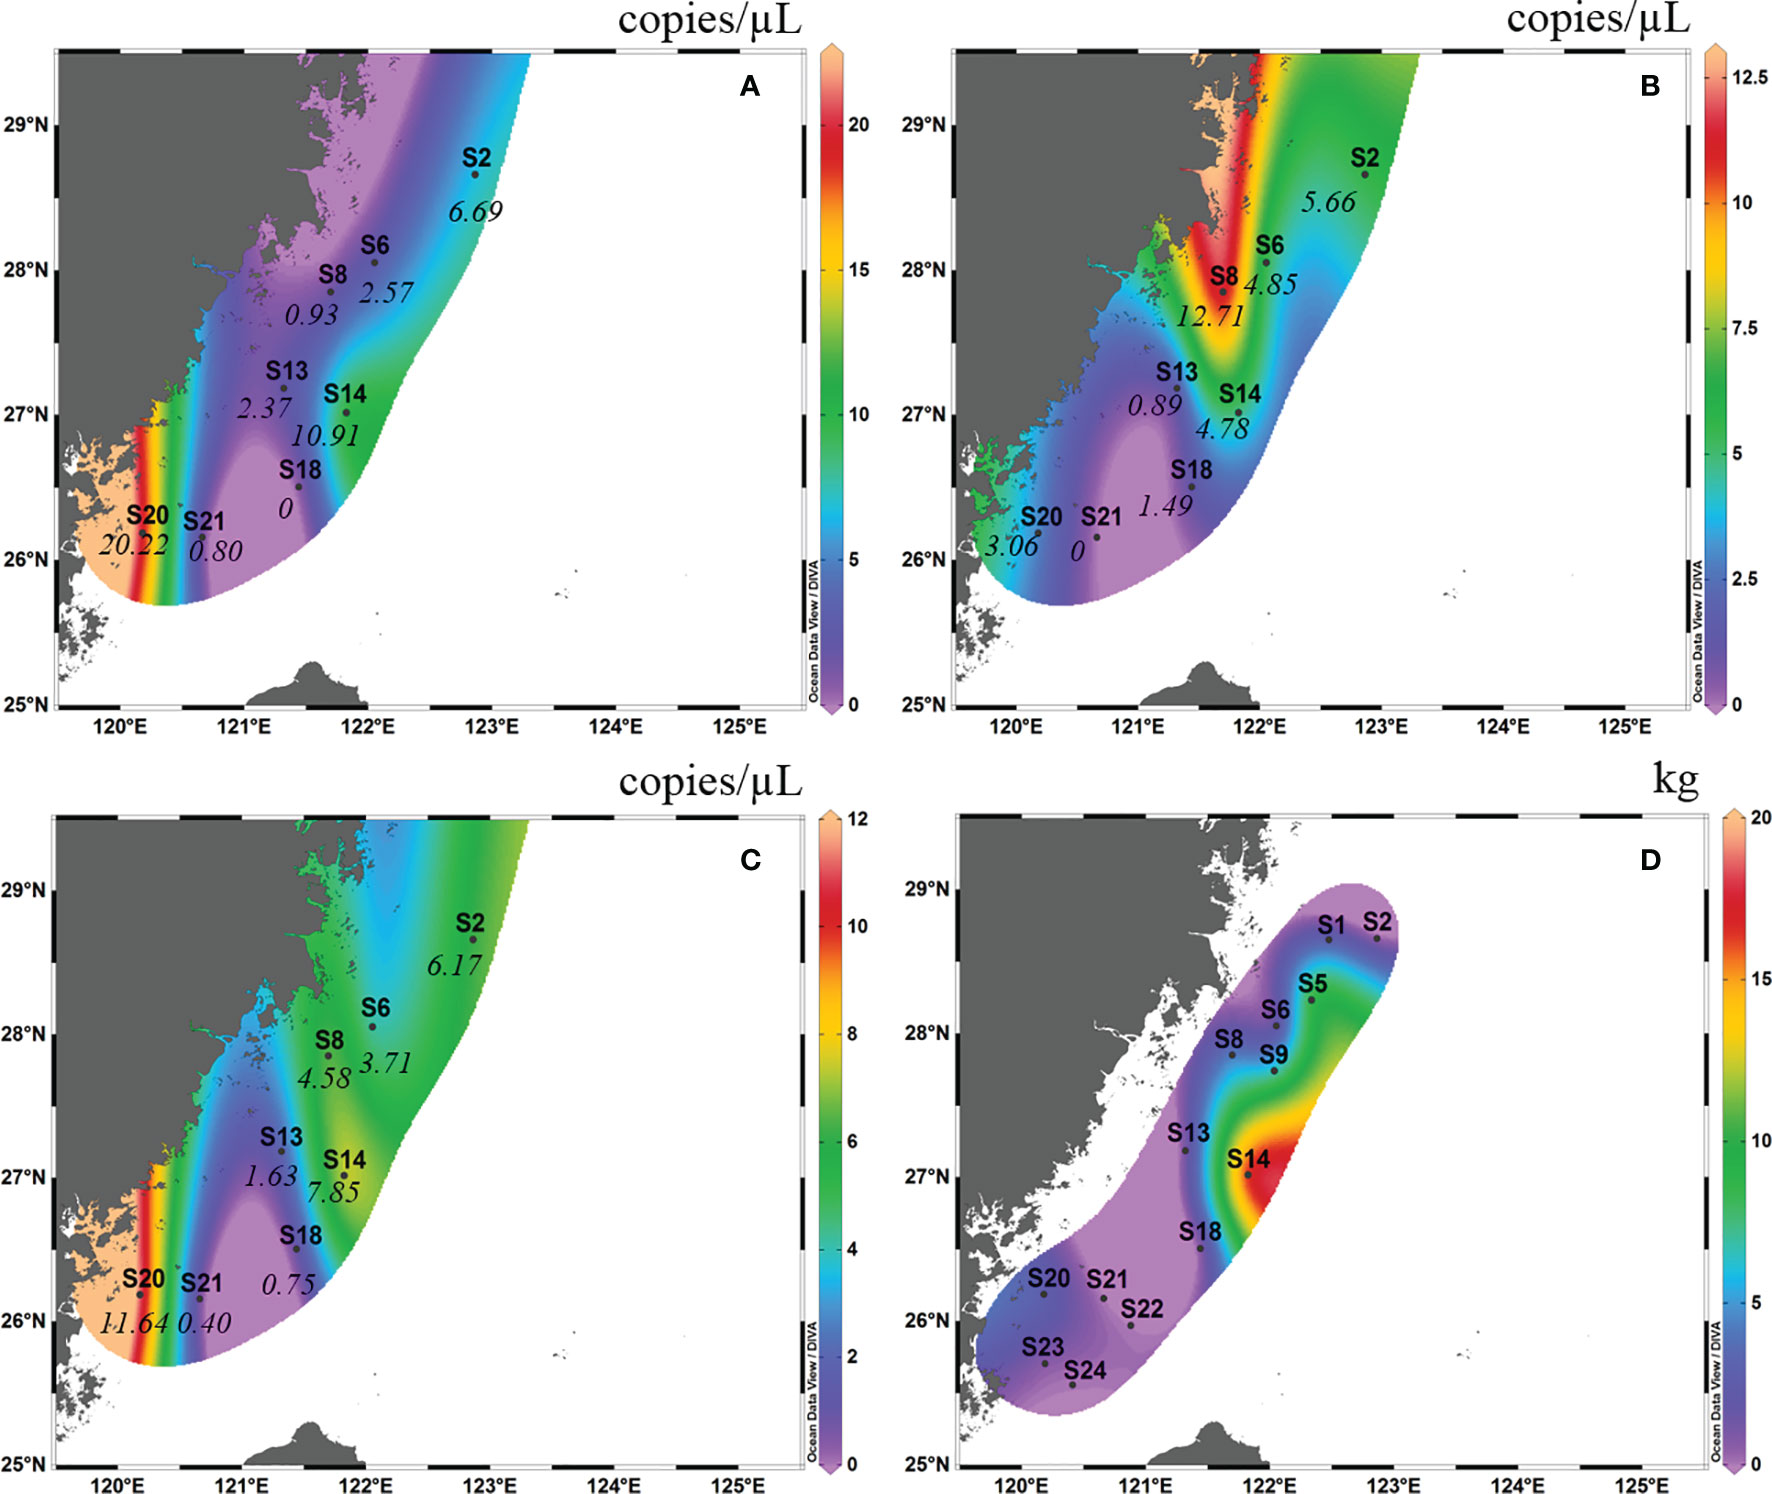
Figure 4 Contour map of Larimichthys crocea in the East China Sea in autumn 2018 based on eDNA concentration of real-time qPCR analysis from surface samples (A), bottom samples (B) and the average between surface samples and bottom samples (C), and based on capture biomass from the fishing survey (D). The italicized numbers indicate the eDNA concentrations of L. crocea.
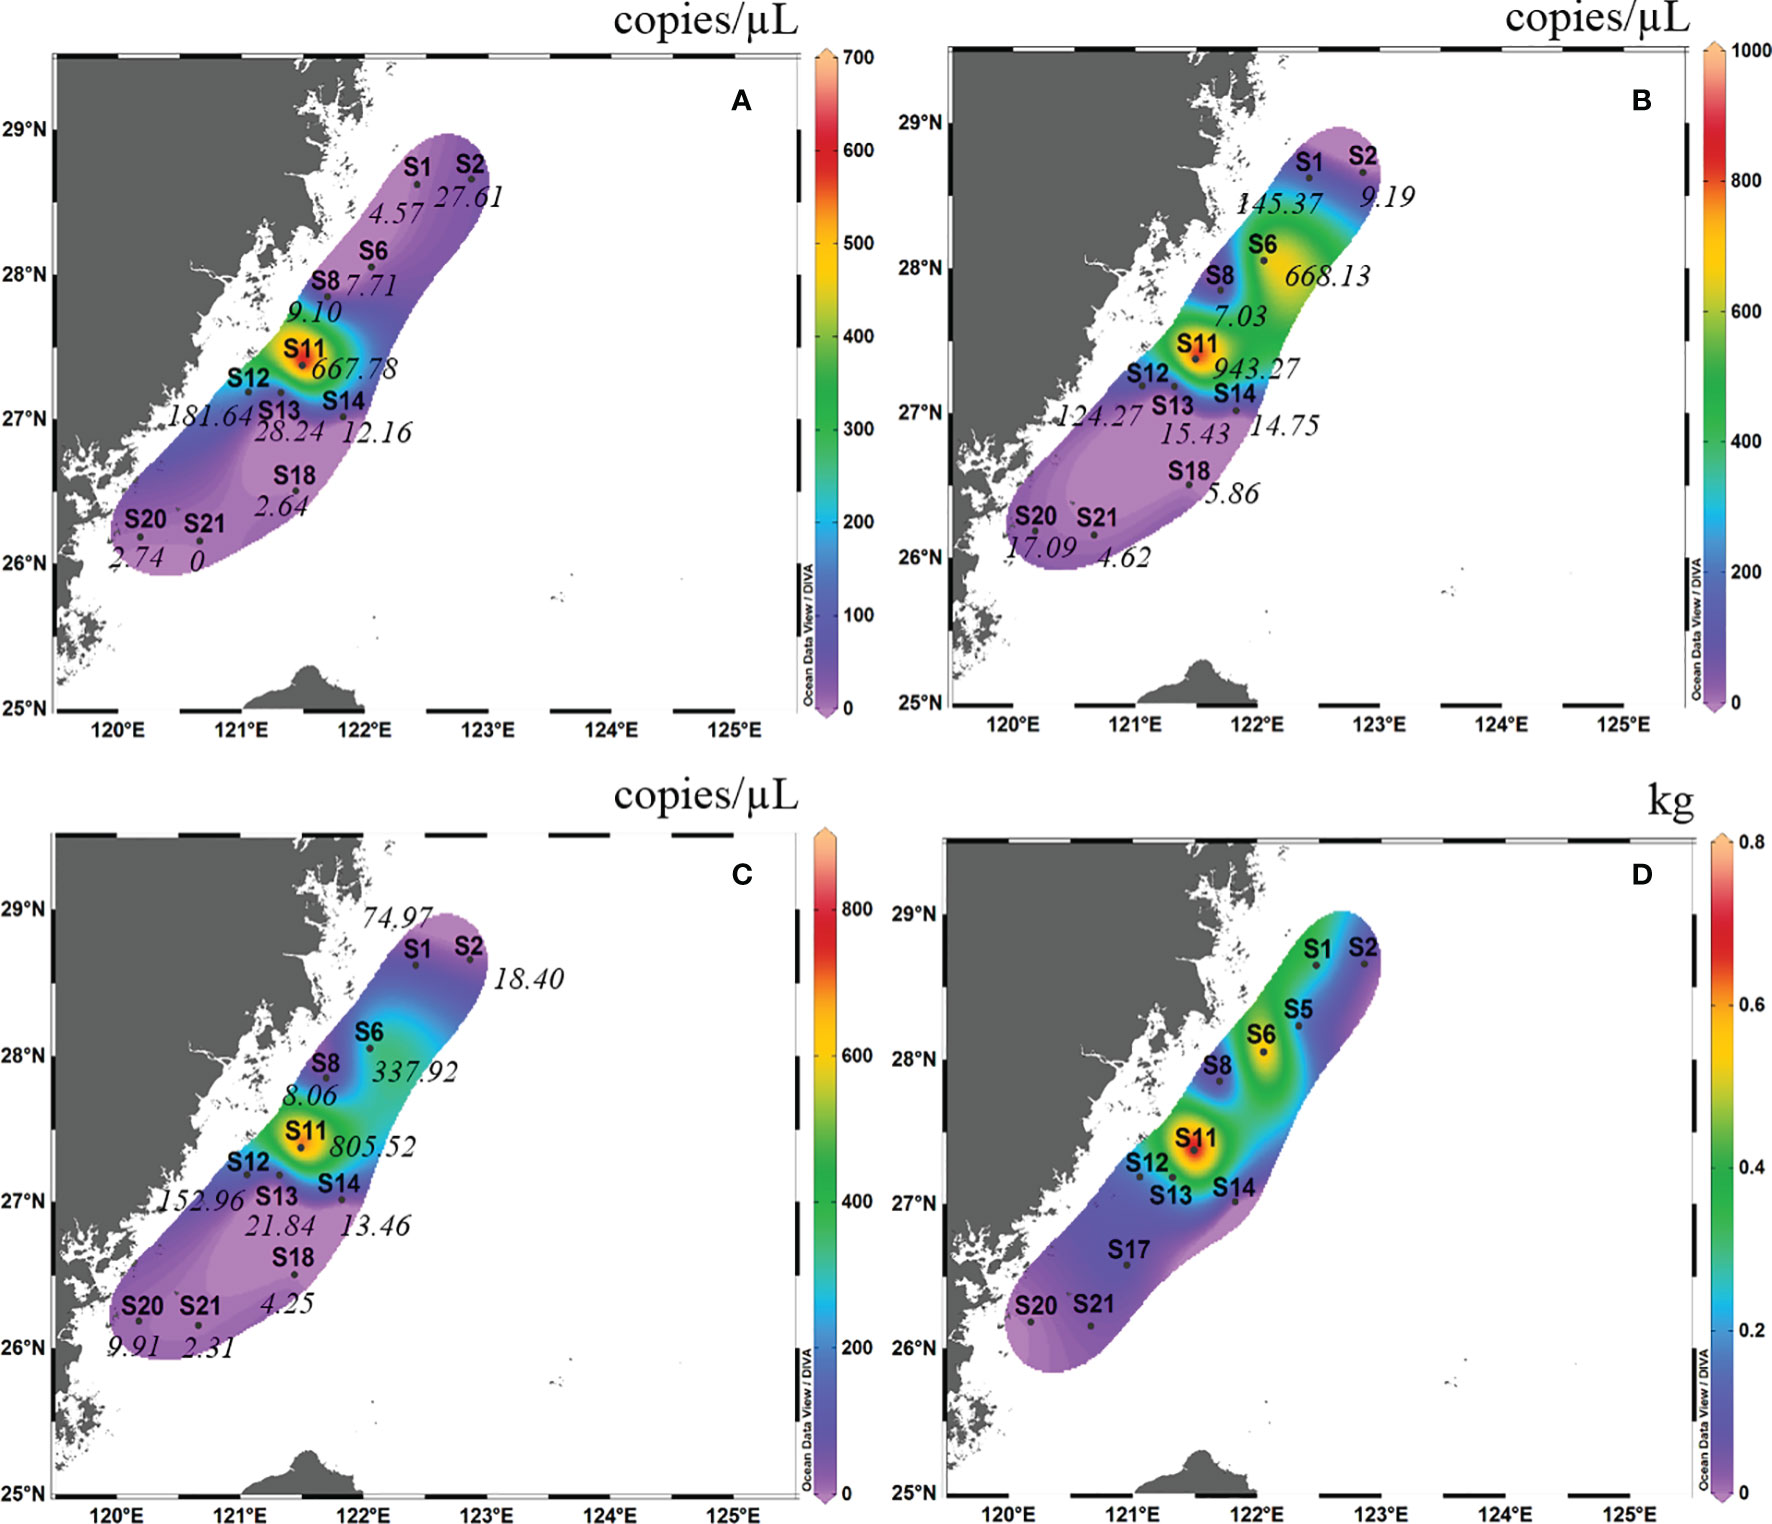
Figure 5 Contour map of Larimichthys crocea in the East China Sea in spring 2019 based on eDNA concentration of real-time qPCR analysis from surface samples (A), bottom samples (B) and the average between surface samples and bottom samples (C), and based on capture biomass from fishing surveys (D). The italicized numbers indicate the eDNA concentrations of L. crocea.
3.6 Distribution Pattern in the Surface and Bottom Layers of L. crocea Based on the Real-Time qPCR Method
In autumn 2018, in the surface layer, high eDNA concentrations occurred at S20 (26°00′ N, 120°00′ E) and S14 (27°00′ N, 121°00′ E), and the concentrations at the other sites were low (Figure 4A). In the bottom layer, the highest eDNA concentrations occurred at S8 (27°50′ N, 121°40′ E), S6 (28°00′ N, 122°00′ E), S14 and S2 (28°30′ N, 123°00′ E) (Figure 4B). Considering the mean of the surface and bottom samples, high eDNA concentrations occurred at S20, S14 and S2 (Figure 4C). The high fishing area was between latitudes 26°00′ N and 28°00′ N and between longitudes 121°30′ E and 122°30′ E (this area included S6, S8, S13, S14 and S18). This high fishing area overlapped with the distribution of high eDNA concentrations in the bottom layer (Figure 4D).
In spring 2019, in the surface layer, the high eDNA concentrations occurred mainly between latitudes 26°30′ N and 28°00′ N and between longitudes 120°30′ E and 121°30′E (this area included S11, S12, S13, and S14) (Figure 5A). In the bottom layer, the highest eDNA concentrations occurred mainly between latitudes 27°00′ N and 28°30′ N and between longitudes 121°00′ E and 122°30′ E (this area included S1, S6, S11, and S12) (Figure 5B). Considering the mean of the surface and bottom samples, the high eDNA concentration distribution almost coincided with that of the bottom layer (Figure 5C). The high fishing area was between latitudes 27°00′ N and 29°00′ N and between longitudes 121°00′ E and 123°00′ E (this area included S6 and S11). This high fishing area largely overlapped with the distribution of high eDNA concentrations in the bottom layer and the mean values of the surface and bottom samples (Figure 5D).
3.7 Relationship Between eDNA Concentration and Capture Biomass of L. crocea
In autumn 2018, the site with the highest mean eDNA concentration (surface and bottom) of L. crocea was S20, followed by S14 and S8. The site with the highest capture biomass of L. crocea in this cruise was S14, followed by S8 and S20. There was a significant Spearman rank correlation between mean eDNA concentration and capture biomass (Spearman rs=0.76, p = 0.037). In spring 2019, the site with the highest mean eDNA concentration (surface and bottom) of L. crocea was S11, followed by S6 and S12. The site with the highest capture biomass of L. crocea in spring 2019 was also S11, followed by S6 and S1. There was also a significant Spearman rank correlation between mean eDNA concentration and capture biomass (Spearman rs=0.74, p = 0.013).
4 Discussion
4.1 Distribution Pattern of L. crocea Based on OTU Abundance
This study is the first attempt to use eDNA metabarcoding technology to evaluate the resources of L. crocea in the central and southern regions of the East China Sea. The survey area of this study includes the “three grounds and one route” (i.e., spawning ground, feeding ground, overwintering ground, and migration route) of L. crocea (see Figure 1). On an annual basis, from October to February, L. crocea migrates to the mid-southern East China Sea for overwintering, and from February to June, L. crocea migrates for spawning from the overwintering ground toward the nearshore (Xu & Chen, 2013). In the autumn survey cruise of this study, high OTU abundance was detected at three sites, S6, S15 and S19, which were in or near the overwintering ground offshore of Fujian and Zhejiang Provinces. Thus, the overwintering L. crocea in November and December might account for the high values at those sites. In the spring survey cruise of this study, high OTU abundance was detected near two sites, S2 and S6, which were located near the feeding ground and the spawning ground, respectively. Thus, these overwintering and feeding L. crocea might account for the high OTU values at those sites, and they began to migrate toward the spawning grounds in March and April.
To valid the accuracy of the eDNA metabarcoding technology, the OTU abundance obtained by metabarcoding sequencing was compared with the actual catches from trawling. There were overlap between the two datasets. However, it should be pointed out that there was no significant rank correlation between them. The main reason for this finding might be that the fishing survey activities were accidental and random, so the real resources of L. crocea were probably biased. The eDNA metabarcoding technology method is more sensitive than the traditional fishing survey method. The eDNA released by L. crocea could spread to other regions, carried by the current. Thus, L. crocea OTU could also be detected in some sites where L. crocea were not caught.
It is worth noting that OTU abundance was obtained by metabarcoding sequencing, and the merit of the method is its universality and low specificity. There is, in addition, some contamination and errors in the sequencing process, so the fish resource assessment might be biased (Takahara et al., 2012). Furthermore, only a few sites have L. crocea fishing records in metabarcoding survey sites due to the contingency and randomness of fishing activities, so an effective analysis of the relationship between fishing capture biomass and OTU abundance is unlikely. To further improve the accuracy of species abundance assessment, in this study, we designed a pair of L. crocea specific primers and combined them with real-time qPCR technology to determine and analyze the eDNA concentration at these sites. The results showed that the specific primers designed in this study had good specificity and good sensitivity for L. crocea with the lowest detection limit of 0.34 copies/μL.
4.2 Distribution Pattern of L. crocea Based on eDNA Concentration
There was a significant positive rank correlation between the actual capture biomass and the eDNA concentration of L. crocea at each site during the two cruises (Spearman rs=0.76, p=0.037, autumn 2018; Spearman rs=0.74, p=0.013, spring 2019), and it was much better than the relationship between the capture and OTU abundance obtained from metabarcoding sequencing (Spearman rs =0.270, p=0.278, autumn 2018). To a certain extent, the results indicated that the eDNA concentration of L. crocea measured by real-time qPCR could more accurately reflected the resource distribution of L. crocea.
Previous studies have shown a stratification pattern in the distribution of eDNA in the water environment (Yamamoto et al., 2016; Andruszkiewicz et al., 2017; Lacoursière-Roussel et al., 2018; Lawson Handley et al., 2019), and this stratification is related to the life history stages and migration of species (Turner et al., 2015). L. crocea prefers different water depths during different life stages or seasons (Chen, 1997). In turn, we found some difference in eDNA concentration between the surface and bottom water layers, which was also not the same between the two seasons. In autumn 2018, when all sampling stations were considered, there was no significant difference in eDNA concentrations between the two layers (paired t test, p > 0.05). However, at five sites (S2, S13, S14, S20, and S21) out of eight, the eDNA concentration was significantly higher in surface water than in bottom water (p = 0.02), while at the other three sites (S6, S8, and S18), the eDNA concentration in bottom water was higher. These five sites (S2, S13, S14, S20, and S21) are located in the adjacent sea area between the overwintering grounds and spawning grounds (Figure 1), which is the main feeding ground for L. crocea before overwintering. Thus, we thought that the higher eDNA concentration in surface water might be attributed to L. crocea preying on small pelagic fish in the surface water column. In addition, sites S6, S8, and S18 were located near the overwintering ground and migration route (Figure 1). Thus, we thought that those adults crossing through the bottom migration route toward the overwintering ground might account for the higher eDNA concentration in bottom water.
In the spring cruise of 2019, when all sampling stations were considered, there was also no significant difference in eDNA concentrations between the two layers (paired t test, p > 0.05). The eDNA concentrations were high both in surface and bottom waters at two sites, S11 and S12; higher in surface waters than in bottom waters at three sites, S2, S8, and S13; and lower in surface waters than in bottom waters at six sites (S1, S6, S14, S18, S20, and S21). The spring survey cruise time (April 2019) was the major spawning month of L. crocea. The three sites (S2, S8, and S13) with higher eDNA in surface water were located near the spawning ground (Figure 1), thus many eggs, ichthyoplankton, and juveniles drifting under the Taiwan warm current and Huanghai sea coastal current of L. crocea might account for the high values. Since L. crocea eggs are pelagic and new-hatching ichthyoplankton and juveniles have not been capable of actively swimming through the water, they will drift with currents. Additionally, sites S1, S5, S14, S18, and S21 were located near the overwintering ground and spawning migration route (Figure 1). Thus, we thought that the overwintering adults that migrated toward the spawning grounds might account for the higher eDNA concentration in the bottom water.
Wang et al. (2021) developed species-specific primers (12S) and TaqMan probes combined with real-time qPCR to investigate the horizontal and vertical distribution of eDNA in L. crocea in the East China Sea (26°00′ N-32°30′ N, 120°30′ E-126°00′ E). The study demonstrated the robustness of the eDNA approach in investigating and monitoring natural resources of marine fish. However, further verification and exploration of the relationship between catches and the eDNA concentration of L. crocea are lacking. In our study, we developed a species-specific primer (NADH2), investigated the distribution in the middle-southern part of the East China Sea (25°00′ N-29°00′ N, 120°00′ E-124°00′ E) in two seasons, and explored the relationship between catches and the eDNA concentration of L. crocea. Our results suggested that the designed NADH2-specific primers and developed real-time qPCR method were applicable and reliable. The variation in the eDNA concentration of L. crocea coincided well with that of a real capture survey in the East China Sea.
In summary, the developed method based on eDNA technology could not only be used to evaluate the resource distribution but could also contribute to estimating the life history and migration route of L. crocea. Furthermore, the method would benefit the long-term assessment of stocking and other strategies in fisheries enhancement.
Data Availability Statement
The datasets presented in this study can be found in online repositories. The names of the repository/repositories and accession number(s) can be found below: NCBI [accession: PRJNA811428].
Ethics Statement
The animal study was reviewed and approved by the Animal Research and Ethics Committee of the College of Ocean and Earth Sciences, Xiamen University.
Author Contributions
SD and LW designed the research. LW, JL, FT, and SD wrote the manuscript and performed the data analyses. FT, JZ, and ML performed the research. SD, LW and JL revised the manuscript. All authors contributed to the article preparation and approved the submission.
Funding
This work was supported by the National Key Research and Development Program of China (Grant No. 2018YFC1406301 and 2018YFC1406306).
Conflict of Interest
The authors declare that the research was conducted in the absence of any commercial or financial relationships that could be construed as a potential conflict of interest.
Publisher’s Note
All claims expressed in this article are solely those of the authors and do not necessarily represent those of their affiliated organizations, or those of the publisher, the editors and the reviewers. Any product that may be evaluated in this article, or claim that may be made by its manufacturer, is not guaranteed or endorsed by the publisher.
Acknowledgments
The authors thank Junkai Ma for sample collection, and Hai Li, Huan Wang, Heqian Zhang for their good suggestions on laboratory work.
Supplementary Material
The Supplementary Material for this article can be found online at: https://www.frontiersin.org/articles/10.3389/fmars.2022.890756/full#supplementary-material
References
Andruszkiewicz E. A., Starks H. A., Chavez F. P., Sassoubre L. M., Block B. A., Boehm A. B. (2017). Biomonitoring of Marine Vertebrates in Monterey Bay Using eDNA Metabarcoding. PloS One 12 (4), e0176343. doi: 10.1371/journal.pone.0176343
Baldigo B. P., Sporn L. A., George S. D., Ball J. A. (2017). Efficacy of Environmental DNA to Detect and Quantify Brook Trout Populations in Headwater Streams of the Adirondack Mountains, New York. T Am. FISH Soc. 1461), 99–111. doi: 10.1080/00028487.2016.1243578
García-Machado E., Laporte M., Normandeau E., Hernández C., Côté G., Paradis Y., et al. (2022). Fish Community Shifts Along a Strong Fluvial Environmental Gradient Revealed by eDNA Metabarcoding. Environ. DNA 4, 117–134. doi: 10.1002/edn3.221
Lacoursière-Roussel A., Howland K., Normandeau E., Grey E. K., Archambault P., Deiner K., et al. (2018). eDNA Metabarcoding as a New Surveillance Approach for Coastal Arctic Biodiversity. Ecol. Evol. 8, 7763–7777. doi: 10.1002/ece3.4213
Lawson Handley L., Read D. S., Winfield I. J., Kimbell H., Johnson H., Li J., et al. (2019). Temporal and Spatial Variation in Distribution of Fish Environmental DNA in England’s Largest Lake. Environ. DNA 1, 26–39. doi: 10.1002/edn3.5
Li M., Shan X. J., Wang W. J., Lv D., Dai F. Q., Ding X. S., et al. (2019). Establishment and Optimization of Environmental DNA Detection Techniques for Assessment of Fenneropenaeus chinensis Biomass. Prog. Fishery Sci. 40 (1), 12–19. doi: 10.19663/j.issn2095-9869.20180620001
Miya M., Sato Y., Fukunaga T., Sado T., Poulsen J. Y., Sato K., et al. (2015). MiFish, a Set of Universal PCR Primers for Metabarcoding Environmental DNA From Fishes: Detection of More Than 230 Subtropical Marine Species. R. Soc Open Sci. 2 (7), 150088. doi: 10.1098/rsos.150088
Postaire B. D., Bakker J., Gardiner J., Wiley T. R., Chapman D. D. (2020). Environmental DNA Detection Tracks Established Seasonal Occurrence of Blacktip Sharks (Carcharhinus limbatus) in a Semi-Enclosed Subtropical Bay. Sci. Rep. 10, 11847. doi: 10.1038/s41598-020-68843-0
Saenz-Agudelo P., Delrieu-Trottin E., DiBattista J. D., Martínez-Rincon D., Morales-González S., Pontigo F., et al. (2022). Monitoring Vertebrate Biodiversity of a Protected Coastal Wetland Using eDNA Metabarcoding. Environ. DNA 4, 77–92. doi: 10.1002/edn3.200
Sato Y., Miya M., Fukunaga T., Sado T., Iwasaki W. (2018). MitoFish and MiFish Pipeline: A Mitochondrial Genome Database of Fish With an Analysis Pipeline for Environmental DNA Metabarcoding. Mol. Biol. Evol. 35, 1553–1555. doi: 10.1093/molbev/msy074
Takahara T., Minamoto T., Doi H. (2013). Using Environmental DNA to Estimate the Distribution of an Invasive Fish Species in Ponds. PloS One 8, e56584. doi: 10.1371/journal.pone.0056584
Takahara T., Minamoto T., Yamanaka H., Doi H., Kawabata Z. (2012). Estimation of Fish Biomass Using Environmental DNA. PloS One 7 (4), e35868. doi: 10.1371/journal.pone.0035868
Thomsen P. F., Kielgast J., Iversen L. L., Møller P. R., Rasmussen M., Willerslev E. (2012). Detection of a Diverse Marine Fish Fauna Using Environmental DNA From Seawater Samples. PloS One 7, e41732. doi: 10.1371/journal.pone.0041732
Turner C. R., Uy K. L., Everhart R. C. (2015). Fish Environmental DNA Is More Concentrated in Aquatic Sediments Than Surface Water. Biol. Conserv. 183, 93–102. doi: 10.1016/j.biocon.2014.11.017
Wang X., Lu G., Zhao L., Du X., Gao T. (2021). Assessment of Fishery Resources Using Environmental DNA: The Large Yellow Croaker (Larimichthys crocea) in the East China Sea. Fsh Res. 235, 105813. doi: 10.1016/j.fishres.2020.105813
Xu Z. L., Chen J. J. (2013). Analysis of Migratory Route of Larimichthys Crocea in the East China Sea and Yellow Sea. J. Fish China 35 (003), 429–437. doi: 10.3724/SP.J.1231.2011.17099
Yamamoto S., Kenji M., Keiichi F., Kohji T., Hideki S., Hiroaki M., et al. (2016). Environmental DNA as a ‘Snapshot’ of Fish Distribution: A Case Study of Japanese Jack Mackerel in Maizuru Bay, Sea of Japan. PloS One 11, e0149786c. doi: 10.1371/journal.pone.0149786
Keywords: large yellow croaker, Larimichthys crocea, eDNA, fisheries resource assessment, real-time qPCR, metabarcoding
Citation: Wu L, Li J, Tong F, Zhang J, Li M and Ding S (2022) Resource Assessment of Larimichthys crocea in the East China Sea Based on eDNA Analysis. Front. Mar. Sci. 9:890756. doi: 10.3389/fmars.2022.890756
Received: 06 March 2022; Accepted: 24 March 2022;
Published: 19 April 2022.
Edited by:
Hui Zhang, Chinese Academy of Sciences (CAS), ChinaReviewed by:
Qiang Lin, Chinese Academy of Sciences, ChinaWei-Kuang Wang, Feng Chia University, Taiwan
Copyright © 2022 Wu, Li, Tong, Zhang, Li and Ding. This is an open-access article distributed under the terms of the Creative Commons Attribution License (CC BY). The use, distribution or reproduction in other forums is permitted, provided the original author(s) and the copyright owner(s) are credited and that the original publication in this journal is cited, in accordance with accepted academic practice. No use, distribution or reproduction is permitted which does not comply with these terms.
*Correspondence: Shaoxiong Ding, c3hkaW5nQHhtdS5lZHUuY24=
†These authors have contributed equally to this work