- 1Univ Rouen Normandie, Univ Caen Normandie, CNRS, M2C, UMR 6143, Rouen, France
- 2Laboratorio de Ingeniería y Procesos Costeros, Instituto de Ingeniería, Universidad Nacional Autónoma de México, Sisal, Mexico
- 3Laboratorio Nacional de Resiliencia Costera (LANRESC), Laboratorios Nacionales CONACYT, Sisal, Mexico
- 4Univ Caen Normandie, Univ Rouen Normandie, CNRS, M2C, UMR 6143, Caen, France
- 5Escuela Nacional Estudio Superiores, Universidad Nacional Autónoma de México, Mérida, Mexico
- 6Laboratorio de Análisis Espacial de Zonas Costeras (COSTALAB), Unidad Multidisciplinaria de Docencia e Investigación-Sisal, Facultad de Ciencias, Universidad Nacional Autónoma de México, Sierra Papacal, Mexico
Beach width, dune height, and vegetation coverage are key parameters to assess beach resistance and resilience to storms. However, coastal development often causes beach ecosystem degradation due to poor coastal management. We propose a Coastal Resilience Index from Remote Sensors (CRIfRS) for urbanized coasts based on aerial photogrammetry. The study area, located along a 7.8 km stretch of coast on a barrier island, is characterized by persistent alongshore sediment transport and the presence of coastal structures and beach-front houses. Contrary to previous studies, we focus on anthropogenic perturbations (coastal urbanization and coastal structures), instead of hydrodynamic conditions (storms), since erosion in this region is mainly associated with alongshore sediment transport gradients induced by coastal structures. Thus, the CRIfRS is based on the relation of three indicators that affect the beach functionality for coastal protection: beach width, coastal structure influence area, and vegetation coverage. The CRIfRS was divided into five categories: Very Low resilience (VL), Low resilience (L), Medium resilience (M), High resilience (H), and Very High resilience (VH). The CRIfRS presented an important spatial and temporal variability due to changing environmental conditions and the deployment of new coastal structures. For the study period, the percentage of the coast within the VL and L resilience classification increased, whereas the percentage of the coast classified as M, H, and VH resilience decreased. During the winter storm season, the resilience increased mainly due to the cross-shore transport whilst during mean wave conditions (i.e., sea-breeze conditions) the long-shore transport becomes more persistent and thus the coastal structures play an important role interrupting the sediment flux. Additionally, the CRIfRS trajectory shows an overall increase of the L resilience and an overall decrease of the H resilience values. This study highlights the important role of anthropogenic perturbations on the assessment of coastal resilience for highly urbanized coasts. The CRIfRS can help to improve the coastal management by assessing the coastal protection capability of beaches considering both natural and anthropogenic factors.
Introduction
Barrier islands are highly dynamic and are constantly modified due to different forcing agents (Kombiadou et al., 2019; Velasquez-Montoya et al., 2021). During low energy season, the beach width and dune volume increase and during high energy season or extreme events the vegetated sand dunes act as natural barriers (Aubrey, 1979; Feagin et al., 2019). Although the barriers can erode to some extent, they prevent further erosion of the coast. This cycle is affected by human action when infrastructure is built, without the proper knowledge of sediment transport dynamics, on top of the sand dunes or in the nearshore to try to mitigate chronic erosion, disregarding the natural beach cycle (Jiménez et al., 2011). Furthermore, this natural cycle will be affected in future scenarios with increasing storm activity (Emanuel, 2005; Ojeda et al., 2017) and sea level rise (Warrick et al., 1990; Devoy, 2021) associated with climate change. This is particularly important on barrier islands (Irish et al., 2010).
The northern Yucatan coast is fronted with a series of low-lying barrier islands which historically have supported small communities until the settlement of the town of Progreso, the main Yucatan port, and its subsequent train connection in 1881 (Meyer-Arendt, 2001). By the mid-1900s the construction of a road boomed the establishment of housing along the coastal fringe and by 1940 a major port had been finished, causing some erosion on its downdrift side. Beach house construction often removed the primary dune and vegetation. In the late 60s and early 70s a series of shelter harbors (small ports mainly used for minor vessels) were built along the Northern Yucatan coast, resulting in an accelerated erosion on the down-drift side of each port (Franklin et al., 2021). As a result, a series of uncontrolled strategies have been implemented to this day, which range from private homeowners illegally building rock and-timber groins -locally known as espolones or escolleras- (Tereszkiewicz et al., 2018) to government plans that include the construction and the removal of structures (Medellín et al., 2015) and the deployment of geotextile tubes filled with sand near the shoreline (Torres-Freyermuth et al., 2019). Assessments of coastal vulnerability of the Yucatan coast based on beach-dune characteristics and coastal hazards (erosion and flooding) have been addressed in previous studies (Mendoza et al., 2013; Cuevas-Jiménez et al., 2016; Mendoza et al., 2016). These studies represent the beach conditions for a given time and hence do not capture the seasonal variability. Moreover, neither of these studies considered the important role that coastal structures have on controlling shoreline stability.
In 2017 the Yucatan government deployed two detached breakwaters made of geotextiles filled with sand as a mitigation measure against beach erosion. High-resolution Real Time Kinematics Differential Global Positioning System (RTK-DGPS) beach surveys were conducted in the vicinity of these coastal structures, revealing a significant negative downdrift effect (Torres-Freyermuth et al., 2019). Moreover, this beach erosion triggered illegally built structures in downdrift areas. The latter implies that the coastal landscape is continuously changing due to human interventions and hence the beach monitoring using traditional RTK-GPS is insufficient. Recent studies have evaluated the use of Unmanned Aerial Vehicles (UAVs) in coastal monitoring (Gonçalves and Henriques, 2015; Turner et al., 2016; Clark, 2017; Franklin et al., 2021). Among other advantages are the low cost of operation and the extent of the surveyed area. Furthermore, UAVs permit the simultaneous collection of additional information regarding urban expansion, vegetation coverage, and the presence of coastal structures. Despite numerous interventions, few studies in this area allow quantitative evaluation of the beach resilience i.e., its capacity to cope with disturbances induced by factors such as extreme events or human impacts, by adapting whilst maintaining their essential functions (Masselink and Lazarus, 2019).
Resilience has an extensive variety of definitions and uses. However, most definitions concur that resilience is the capability of a system to absorb, recover, and adapt to an external perturbation (Zodrow et al., 2020). The term was originally coined in engineering and further developed in ecology (Masselink and Lazarus, 2019). Its use in coastal sciences is more recent and has been mostly based on the physical response of beaches to natural (e.g., storms) and anthropogenic (e.g. coastal structures) disturbances like extreme wave conditions (Angnuureng et al., 2017; Medellín et al., 2018). Dong et al. (2018) proposed the use of beach and dune morphometrics and storm hazards (flooding and erosion) to obtain a Coastal Resilience Index (CRI). This methodology was employed in this region by Torres-Freyermuth et al. (2021) to investigate beach resilience of a 2-km stretch of coast using high-resolution beach profiles and numerical modelling results finding the important role of coastal structures on controlling beach resilience in this region. However, in this study we focus on the beach resilience due to anthropogenic perturbations (i.e., urbanization and coastal structures). The beach system plays a key function as a protection agent and a key element of the beach system is the beach width. In the case of urbanized coastal systems, it is unlikely to start with a non-perturbed case and hence coastal resilience can be assessed by analyzing the spatial and temporal evolution. Thus, to determine the resilience of a coastal system, it is required to have knowledge about the evolution of their key indicators over time. The trajectory describes the temporal changes in response to (natural and anthropogenic) perturbations of the resilience index. Piégay et al. (2020) propose a classification of the trajectories in terms of the equilibrium state (i.e., static equilibrium, dynamic equilibrium, meta-static dynamic equilibrium). The trajectory of a system is a key element that allow us to analyze and describe the capability to resist, adapt, and recover from a given perturbation. Hence, a more frequent assessment of the beach state allows us to capture the beach response to shocks occurring at different temporal scales and hence a better understanding of beach resilience.
In this work, we used UAV-derived data to survey the location and number of structures, the beach width, and the presence of vegetation along a 7.8 km stretch of coast during a fourteen-month period (six surveys from October 2016 to December 2017). The aim of this work is to develop indicators related to these three parameters and employ them to derive a Coastal Resilience Index from Remote Sensors (CRIfRS) applied to the study area and characterize its temporal evolution during the study period. The outline of this paper is the following. First, the study area is described in Section 2. The beach monitoring program conducted at the study site, the characteristics of the different coastal indicators, and the integration of the index are described in Section 3. The results of the spatio-temporal variability are presented in Section 4. A discussion on the CRIfRS is included in Section 5 followed by the concluding remarks in Section 6.
Study area
The study area is located on a barrier island in the northern Yucatan Peninsula, Mexico (Figure 1). The beach is composed of carbonaceus medium sand (0.3 mm) backed by a low sandy dune in some sectors, often highly degraded due to human interventions and to the presence of beach houses along the coast. The study was conducted along a 7.8-kilometer stretch of highly urbanized coast located in the Progreso area (21° 09′ 56.20′′ N, 90° 02′′ 26.44′′ W; 807320 m E, 2343344 m N, UTM Zone 16 N coordinate system). The coast is characterized by a diurnal micro-tidal regime with a 0.75 m spring tidal range (Valle-Levinson et al., 2011) and a seasonal variation in the mean sea level which can reach up to 0.30 m (Zavala-Hidalgo et al., 2003). Sea breezes are highly energetic and although they occur all year long, they are more frequent and stronger during springtime (Figueroa-Espinoza et al., 2014). Central American Cold Surge (CACS) events take place throughout the fall and winter months (Kurczyn et al., 2021) and Tropical Cyclones (TC) take place from June to November although TCs less often make a landfall in this coast due to its orientation facing the North.
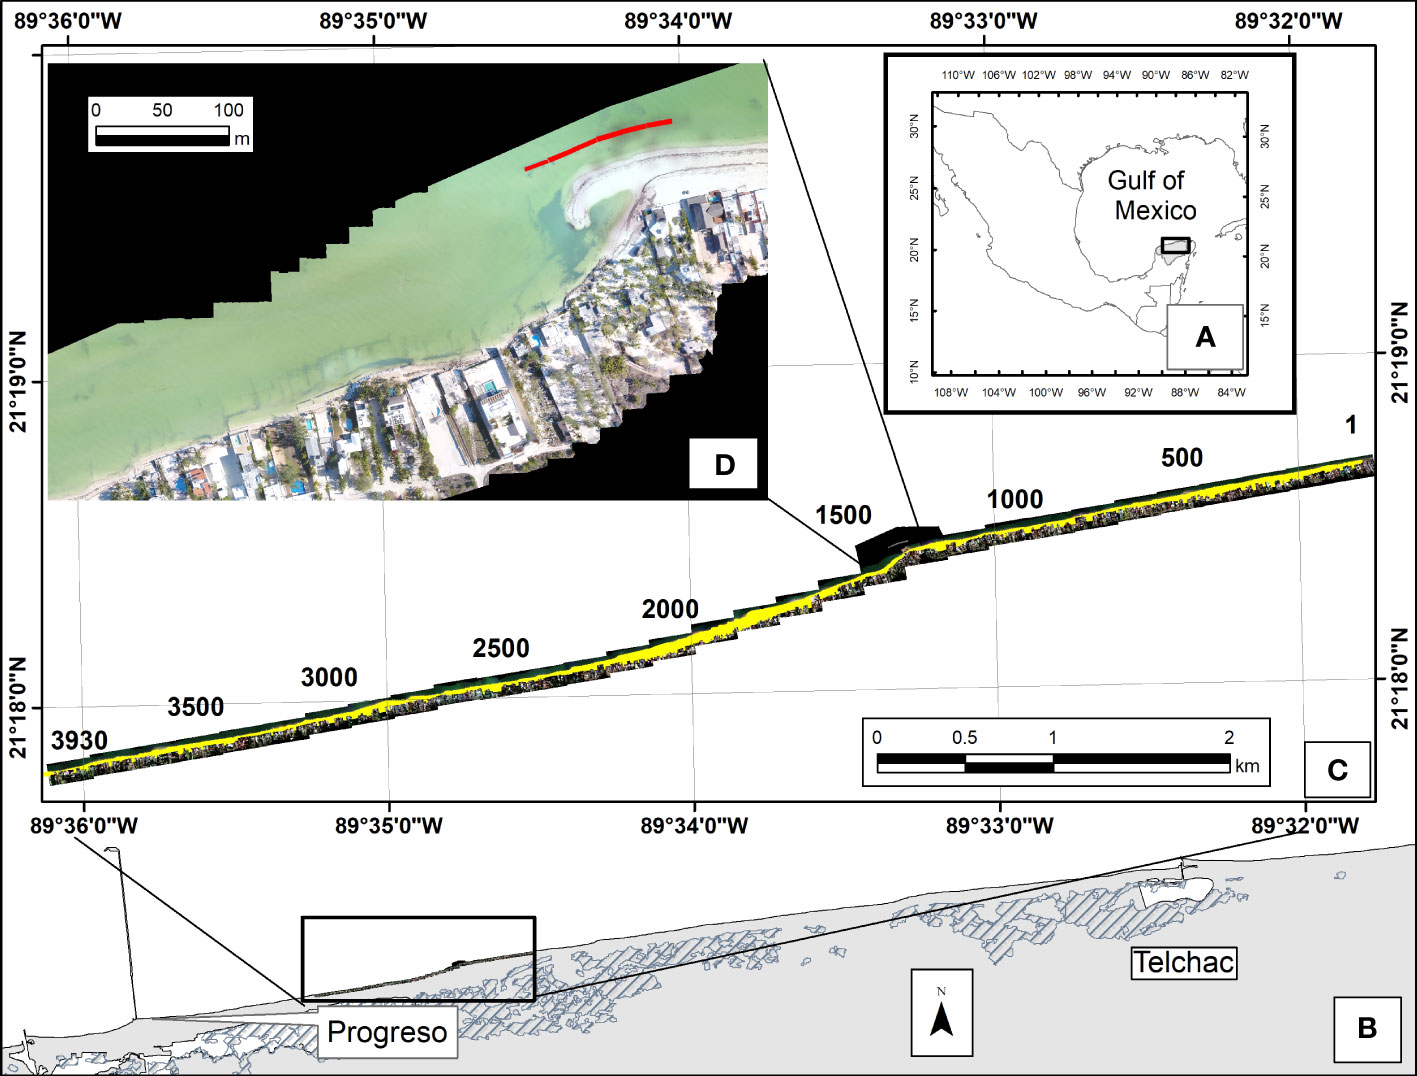
Figure 1 Study area location: (A) the beach stretch placed in the northern Yucatan Peninsula in the Gulf of Mexico; (B) between the ports of Progreso and Telchac. (C) the 7.8 km stretch was divided into 2-m transects numbered from east to west totaling 3930 transects. (D) detail of the Punta San Miguel with coastal structures (groins and geo textiles), infrastructure in the back part of the beach and vegetation coverage. The red line denotes the 120-m long low-crested detached breakwater made of geo textile tubes filled with sand.
The prevailing wave conditions are driven by local sea breezes and CACS events. During sea breeze periods low energy waves approach from the NE causing a strong westward direction (Torres-Freyermuth et al., 2017) with a net sediment transport of 20,000–80,000 m3/year along the northern Yucatan coast (Appendini et al., 2012). CACS events produce high energy NNW swell which is dissipated by the wide (200 km) and shallow (1 to 1000 slope) continental shelf (Enriquez et al., 2010). In CACS conditions the alongshore circulation is towards the East with significant sediment transport towards the coast (Briggs et al., 2020).
Materials and methods
Data acquisition
Six UAV flights were conducted over a 14-month period (October, and December 2016 July, September, October, and December 2017) in order to acquire images and construct ortho-mosaics of the area (Table 1). Flights were performed by trained operators using a fixed wing C-Astral Bramor UAV flying at an altitude of 120 m, following the Mexican Secretariat of Communications and Transport (SCT) legal requirements valid at the time of the study. The UAV was equipped with a Micasense RedEdge multispectral camera (red, green, blue, red-edge, and near-infrared) placed underneath to obtain images at a 90° angle from the ground. The camera was programmed to ensure that the images were obtained with an 80% overlap. Before the first flight, 67 Ground Control Points (GCPs) were placed on a zig-zag pattern along the study area. The GCPs were georeferenced with RTK-DGPS using the UTM Zone 16 N coordinate system.
Data analysis
The obtained images were processed with the Pix4DMapper (version 4.3.x) software to construct ortho-mosaics. The process was performed in three basic steps: initial processing, point cloud, and mesh generation, Digital Surface Model (DSM), and ortho-mosaics construction. The GCPs were used to georeference all the images to the UTM Zone 16 N coordinate system. A spatial resolution of 8 cm with an average error (X, Y, Z) between 7 and 15 cm was obtained. The ortho-mosaics were exported into a Geographic Information System (GIS).
In the GIS, a baseline parallel to the coastline was defined for the entire 7.8-km study region. Transects perpendicular to the baseline were automatically created with a 2-meter spacing and a 100 m length. This initial length was reduced using the intersection of each transect with a second, manually-digitized baseline: the line corresponding to the first structure landward (Figure 2). Transects were numbered from East to West, totaling 3930 transects (Figure 1C). The CRIfRS was then calculated for each transect based on three indicators: beach width, vegetation coverage, and presence/proximity of man-made structures. The evaluation of the three indicators was performed for each flight. The selection of the limits of goodness for each of the indicators was based on field observations from previous studies and will be further discussed herein.
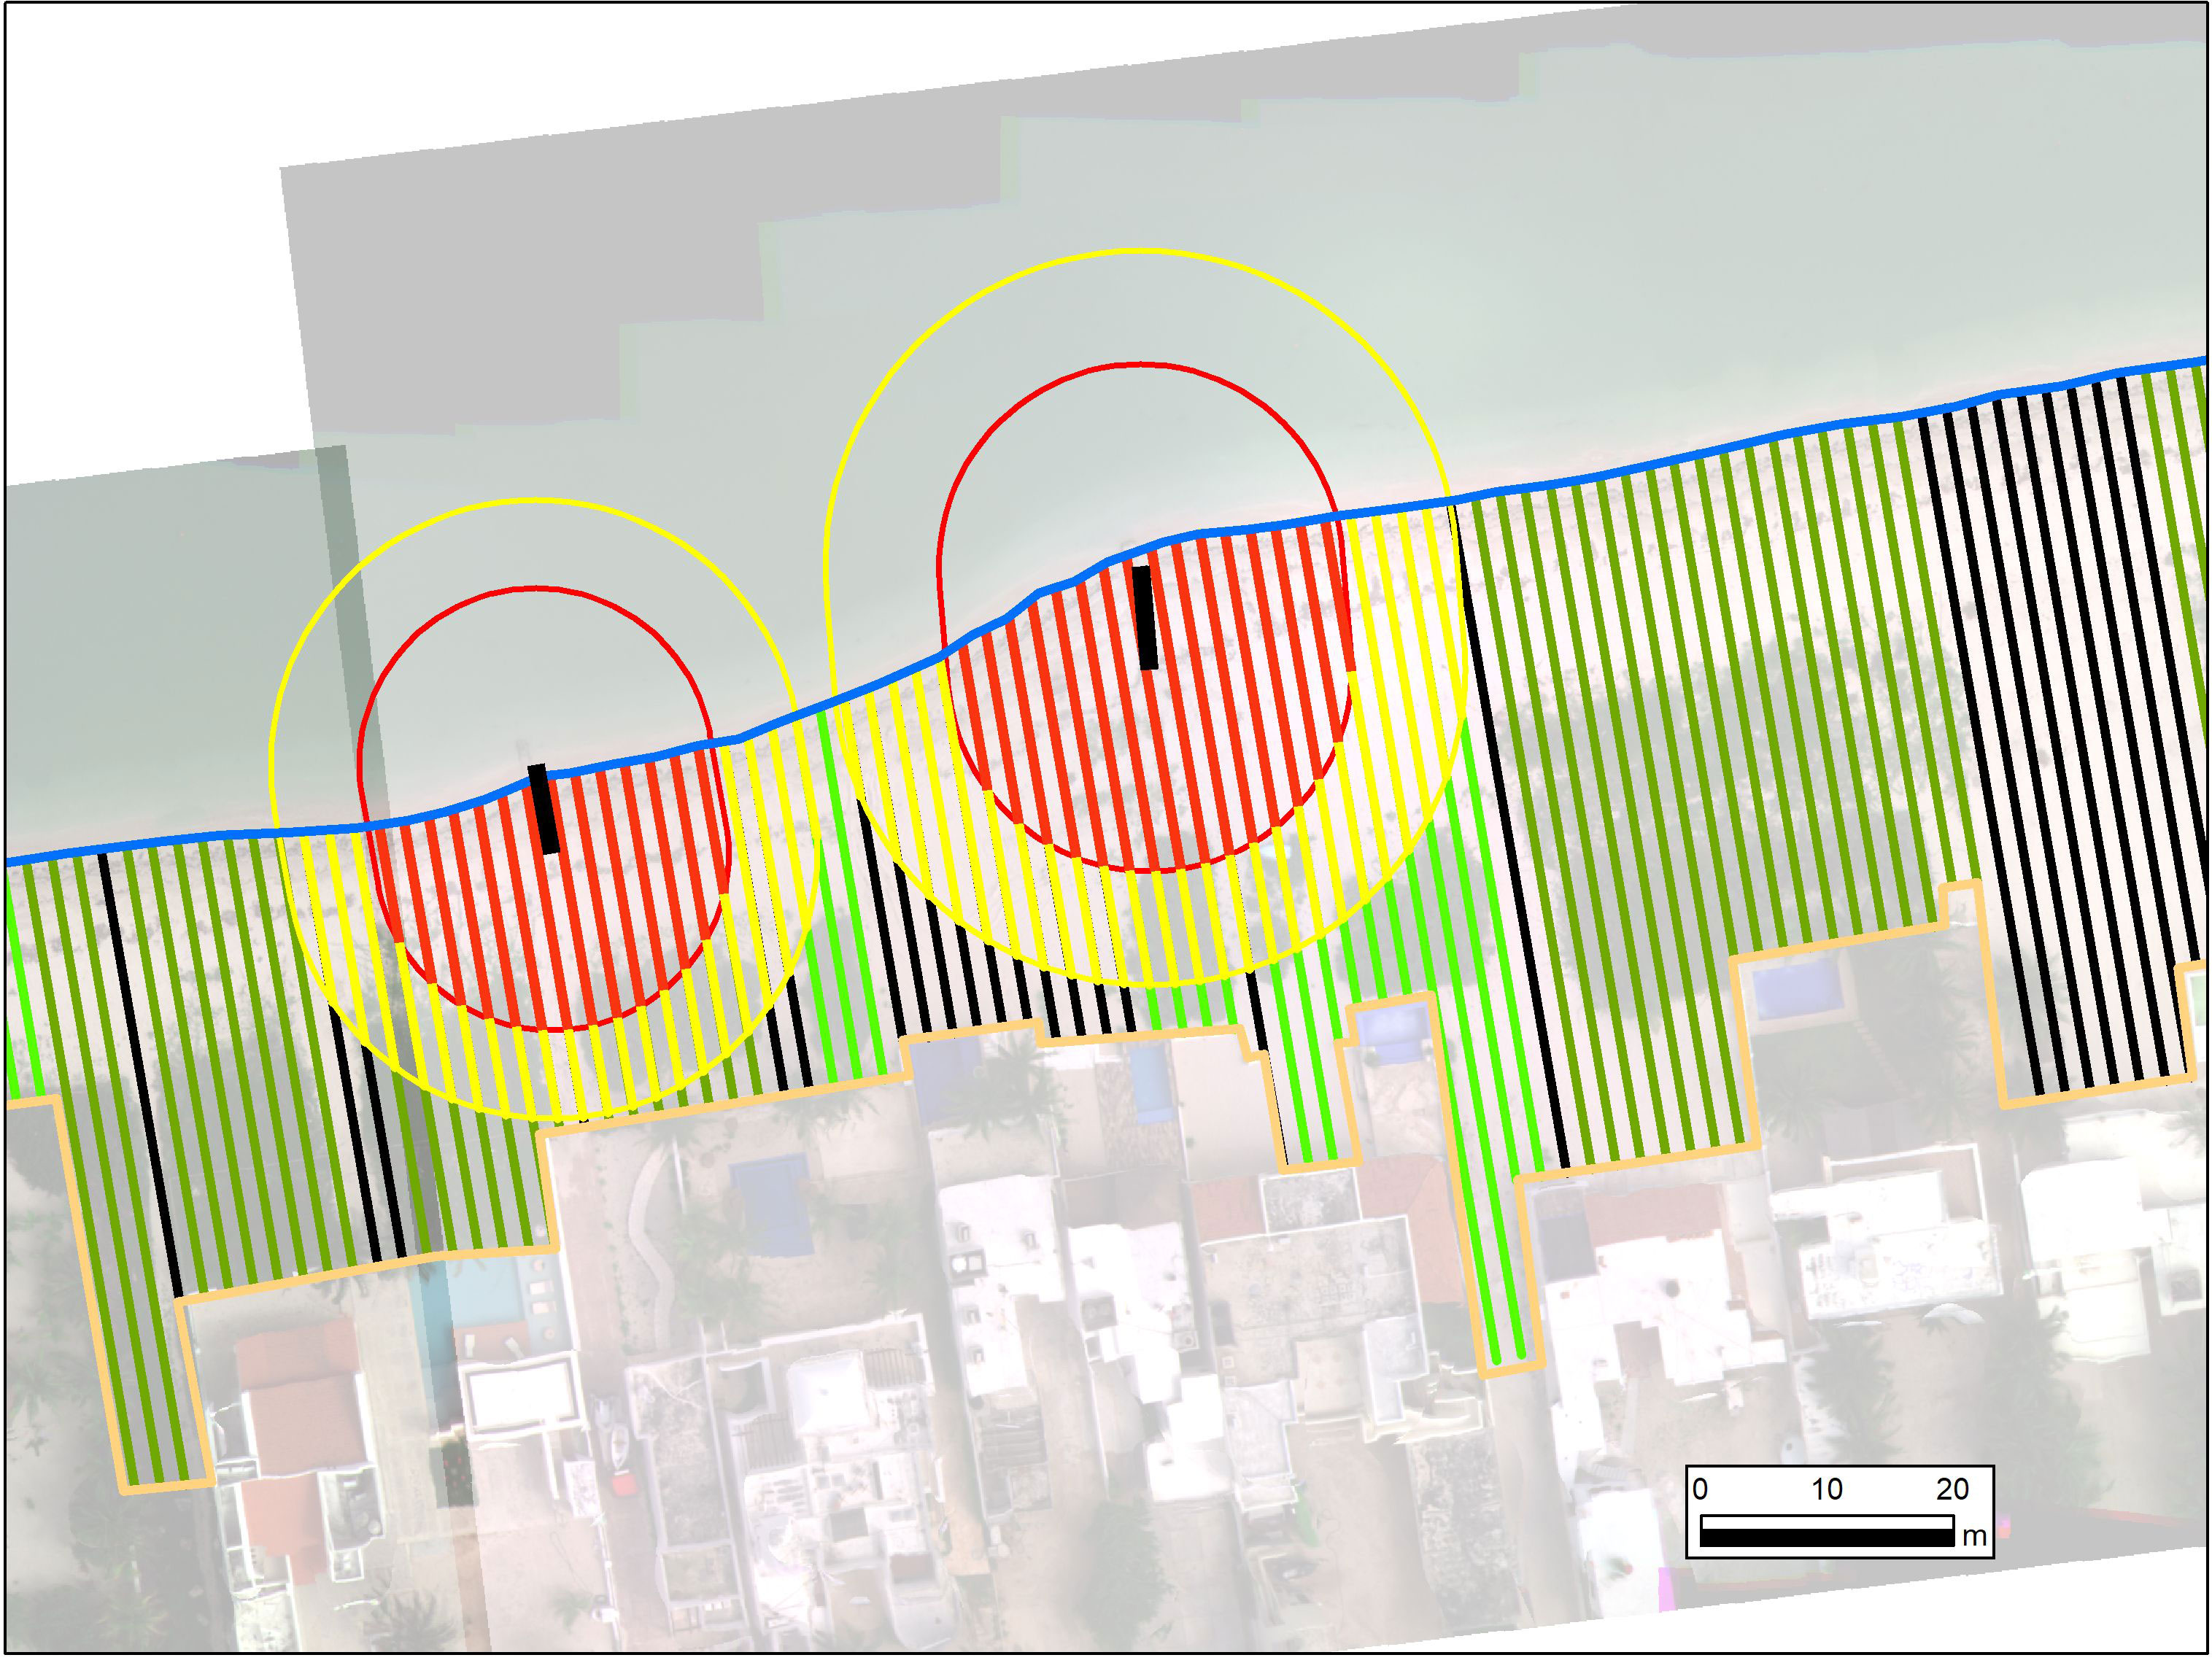
Figure 2 Example of the three selected indicators. The beach width indicator is the horizontal distance marked between the shoreline -blue line- and the first infrastructure landward -orange line. The vegetation coverage indicator is marked for each transect in colors: black transect denotes absence of vegetation, light green transects denote partially vegetated transects and dark green transects denotes transects with a high vegetation coverage. The coastal infrastructure indicator is marked with red transects which are within the direct zone of influence of the infrastructure, while the yellow transects are in the indirect zone of influence.
Beach width indicator
The beach provides protection against storms by adjusting its shape to dissipate the wave energy more efficiently. However, such capability depends not only on the availability of sediment but also on the constraints of the hinterland of the beach (e.g., sea wall, houses). Thus, the beach width (BW) is a common indicator used in previous studies (Mendoza et al., 2013; Cuevas-Jiménez et al., 2016) to establish a buffering zone. The BW was determined as the horizontal distance between the shoreline and the baseline corresponding to the first structure landward (Figure 2). As previously mentioned, this baseline was digitized manually along the landward part of the study area based on the first UAV flight, and its position did not change during the study period (i.e., no new houses or sea walls were built or removed).
The shoreline position was defined for each transect and each survey as the beach profile intersection with the mean water level. It was determined by the instantaneous wet-dry interface (e.g., Ruiz-Beltran et al., 2019) and, therefore, its position depended on the wave conditions and the tidal level during the image acquisition. The flights were conducted during calm wave conditions (Figure 3A; also, half hourly images in a nearby location can be obtained from http://tepeu.sisal.unam.mx), and therefore no wave corrections were required to the shoreline dataset. To adjust the differences in tidal level during each survey, the shoreline positions were corrected for the measured tidal level at the moment of the survey (Figure 3B), considering a mean beach slope of 0.1 for the study area. According to the five-year high-resolution survey accomplished by (Medellín and Torres-Freyermuth, 2021), the beach slope in the region varies between 0.05 and 0.15. To have an idea of the possible errors introduced by assuming a constant beach slope of 0.1, the tidal correction of the BW was repeated for each case considering the extreme slope values (i.e., 0.05, 0.15). Table 1 displays the tide correction applied for each survey considering a 0.1 slope.
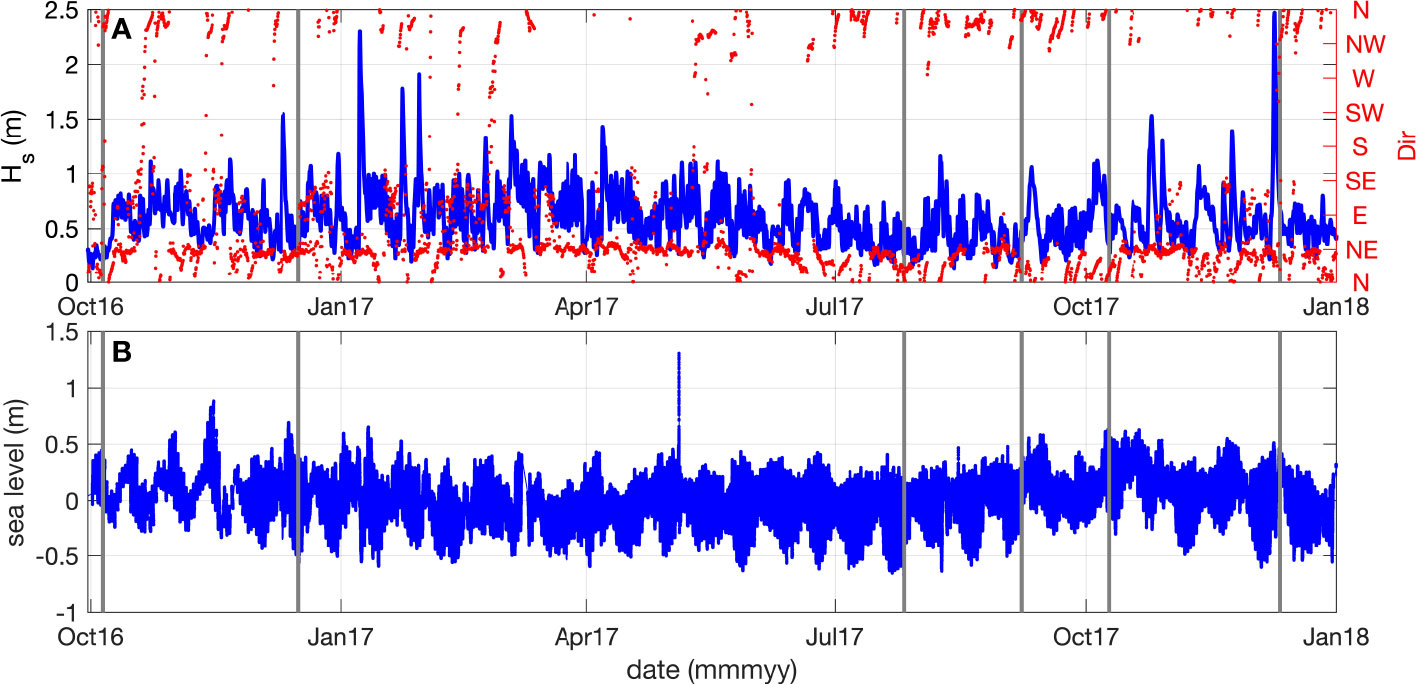
Figure 3 Wave and tide conditions in the study area: (A) significant wave height -blue line- and mean wave direction -red dots-; (B) sea level. Grey lines denote the dates of the UAV flights.
A previous study in the region by Torres-Freyermuth et al. (2021), found that 10 m beach recession was associated to storms that are typically exceeded once a year, while the maximum shoreline recession found was close to 20 m associated with a storm sequence. Taking these results into account, a three-level BW classification was implemented considering a Highly Impacted beach will present a width of less than 10 m, an Impacted beach will have values between 10 and 20 m, and a Conserved beach will have values higher than 20 m (Table 2).
Vegetation coverage indicator
Vegetation coverage (VC) in the beach systems has been proven to increase their protective capacity, reducing erosion by attenuating wave energy (Kindermann and Gormally, 2013; Feagin et al., 2019). The seasonal change of the covered area is also important, given that high energy storms might deplete the vegetated dune which might not recover for several seasons, thus losing its protective capacity (Maximiliano-Cordova et al., 2021). On the other hand, if a mild winter season did not have major wave events, the VC might have grown, thus increasing the protection capacity. In this sense, the VC was assessed, for each of the sampled flights along the transects, by manually dividing into three categories: absence of vegetation, partially vegetated, and fully vegetated. Initially, the limits for the categories were based on satellite resolution, to make the results compatible with Sentinel 2 images, with a pixel resolution of 10 m, the extension of the vegetation patch required to be larger than 10 m in the alongshore and cross-shore directions. However, following this criterion the VC was biased by the BW as the study site presents regions where the beach width does not reach a 10-m value (up to 21% of the transects in some cases). For this reason, the limits were finally set as: absence of vegetation (VC = Highly Impacted), was assigned when the area presented no vegetation along the selected transect. Partially vegetated (VC = Impacted), was assigned when the VC was found forming clusters smaller than 10 m alongshore and 5 m cross-shore. Fully vegetated (VC = Conserved), was assigned to clusters of vegetation with larger dimensions than the previous level (Table 2). An example of this classification can be seen in Figure 2.
Coastal structures indicator
Anthropogenic interventions play an important role in beach morphodynamics in this area. The deployment of unauthorized structures to try to mitigate erosion is a common practice and therefore there is no official record to be incorporated in formal analysis. The persistent littoral transport and significant downdrift effects associated with coastal structures (CS) in this area suggest the importance of CS for determining beach resilience. Thus, high-spatial and temporal resolution monitoring allows for tracking the number and type of CS along the study area.
The main materials used for these structures are rocks, sacks filled with sand or debris, geotextiles, a combination of wood and rocks, and concrete groins. The importance of these attributes resides in the longevity of the structures and their permeability. Sacks or geotextiles are usually deployed for a short period, they are easily torn and are usually left at the beach, ending as another source of microplastic contamination (Bai et al., 2022). Rock or concrete groins are more resistant and are deployed as a long-lasting solution.
For each survey, the location and length of coastal structures were digitized. The impact of the structure was evaluated in terms of its permeability (they were classified as permeable or impermeable) and in terms of their capability to cause a visible effect on the shoreline at the moment of the survey (actual or relict). Relict structures were considered when no visible effect on the coastline were found or when the entire structure was buried. Depending on these characteristics, a direct and indirect zone of influence were defined. In the case of impermeable structures, the direct zone was established as twice the length of the structure and the indirect zone as three times the length of the structure. In the case of permeable and relict structures, the direct zone was half the length of the structure and the indirect zone was equal to the length of the structure. The values for this indicator were assigned as Highly Impacted to transects within the direct influence zone, a value of Impacted to transects within the indirect influence zone and, a value of Conserved to transects that were located out of any influence zone (Table 2 and see example of this classification in Figure 2). The criteria to determine the influence area of CS was based on the work by Medellín et al. (2018) in the area, which employed field observations to calibrate a numerical model. The numerical model showed that, for typical sea breeze conditions, the area of influence of a 10-m impermeable groin was approximately 2.5 times its length. We decided to use the three- and two-times length criteria for the impermeable groins and decrease the values for the permeable cases as less impact would be expected.
Coastal resilience index from remote sensors
The CRIfRS helps to evaluate the loss of the beach functionality to provide coastal protection due to anthropogenic perturbations. The beach functionality for coastal protection is site specific and hence threshold values need to be determined at each coastal site. Here, we employed threshold values for the study area obtained from previous studies based on numerical models and field observations. This index is focused on the coastal protection functionality provided by the beach system. However, the index implicitly considers the conservation of habitats for key species such as the sea turtle (Eretmochelys imbricate and Chelonia mydas) that is highly correlated with the beach width.
The CRIfRS is constructed considering the relation of the three indicators that denote the relative resilience of the coast due to the seasonal variation: the BW, the presence of CS, and changes in VC. Every transect is assigned a three-level value (0, 1 or 2) for each of the three indicators (Table 2). Then, the CRIfRS is calculated using a ratio scale normalization (Equation 1),
where BW = beach width, VC = vegetation coverage, CS = coastal structures. The CRIfRS is divided into a five-classification structure according to the 20, 40, 60, and 80 quantile cumulative percentage, analogously to Thieler and Hammar-Klose (1999).
Mitigation measures often considers the deployment of coastal structures. However, it is well known that groins will cause negative downdrift effects if the net littoral transport is significant. The study site is characterized by the presence of hundreds of non-authorized coastal structures that exacerbated the beach erosion. Moreover, beach houses often remove the foredune vegetation. Beach width and vegetation coverage are key elements to provide coastal protection. Therefore, coastal management tools that provide spatio-temporal information on beach resilience are valuable for decision making regarding removal of structures and the implementation of engineering solutions.
Results
Beach width
Figure 4 shows the progression of the percentage of transects for the three categories of the beach indicator along the 14-month period of study. The highest percentage of transects were in the Conserved category (BW >20 m). The temporal evolution of the percentage of transects within this category shows an increase between October and December 2016 followed by a maintained decrease until October 2017 and a break in the decreasing trend between October 2017 and December 2017, instead of the pronounced increase found in the previous year. The temporal evolution of the percentage of transects within the Impacted (10 m< BW< 20 m) and Highly Impacted (BW< 10 m) categories were a mirror reflection of the evolution of the Conserved transects. The results suggest a differentiated seasonality of BW depending on the degree of conservation. The Conserved areas increase their beach width during winter storms and decrease during sea-breeze conditions. This is consistent with the natural shoreline dynamics in the study area where the main erosion occurs during sea-breeze conditions, associated with gradients in alongshore sediment transport (Medellín and Torres-Freyermuth, 2021).
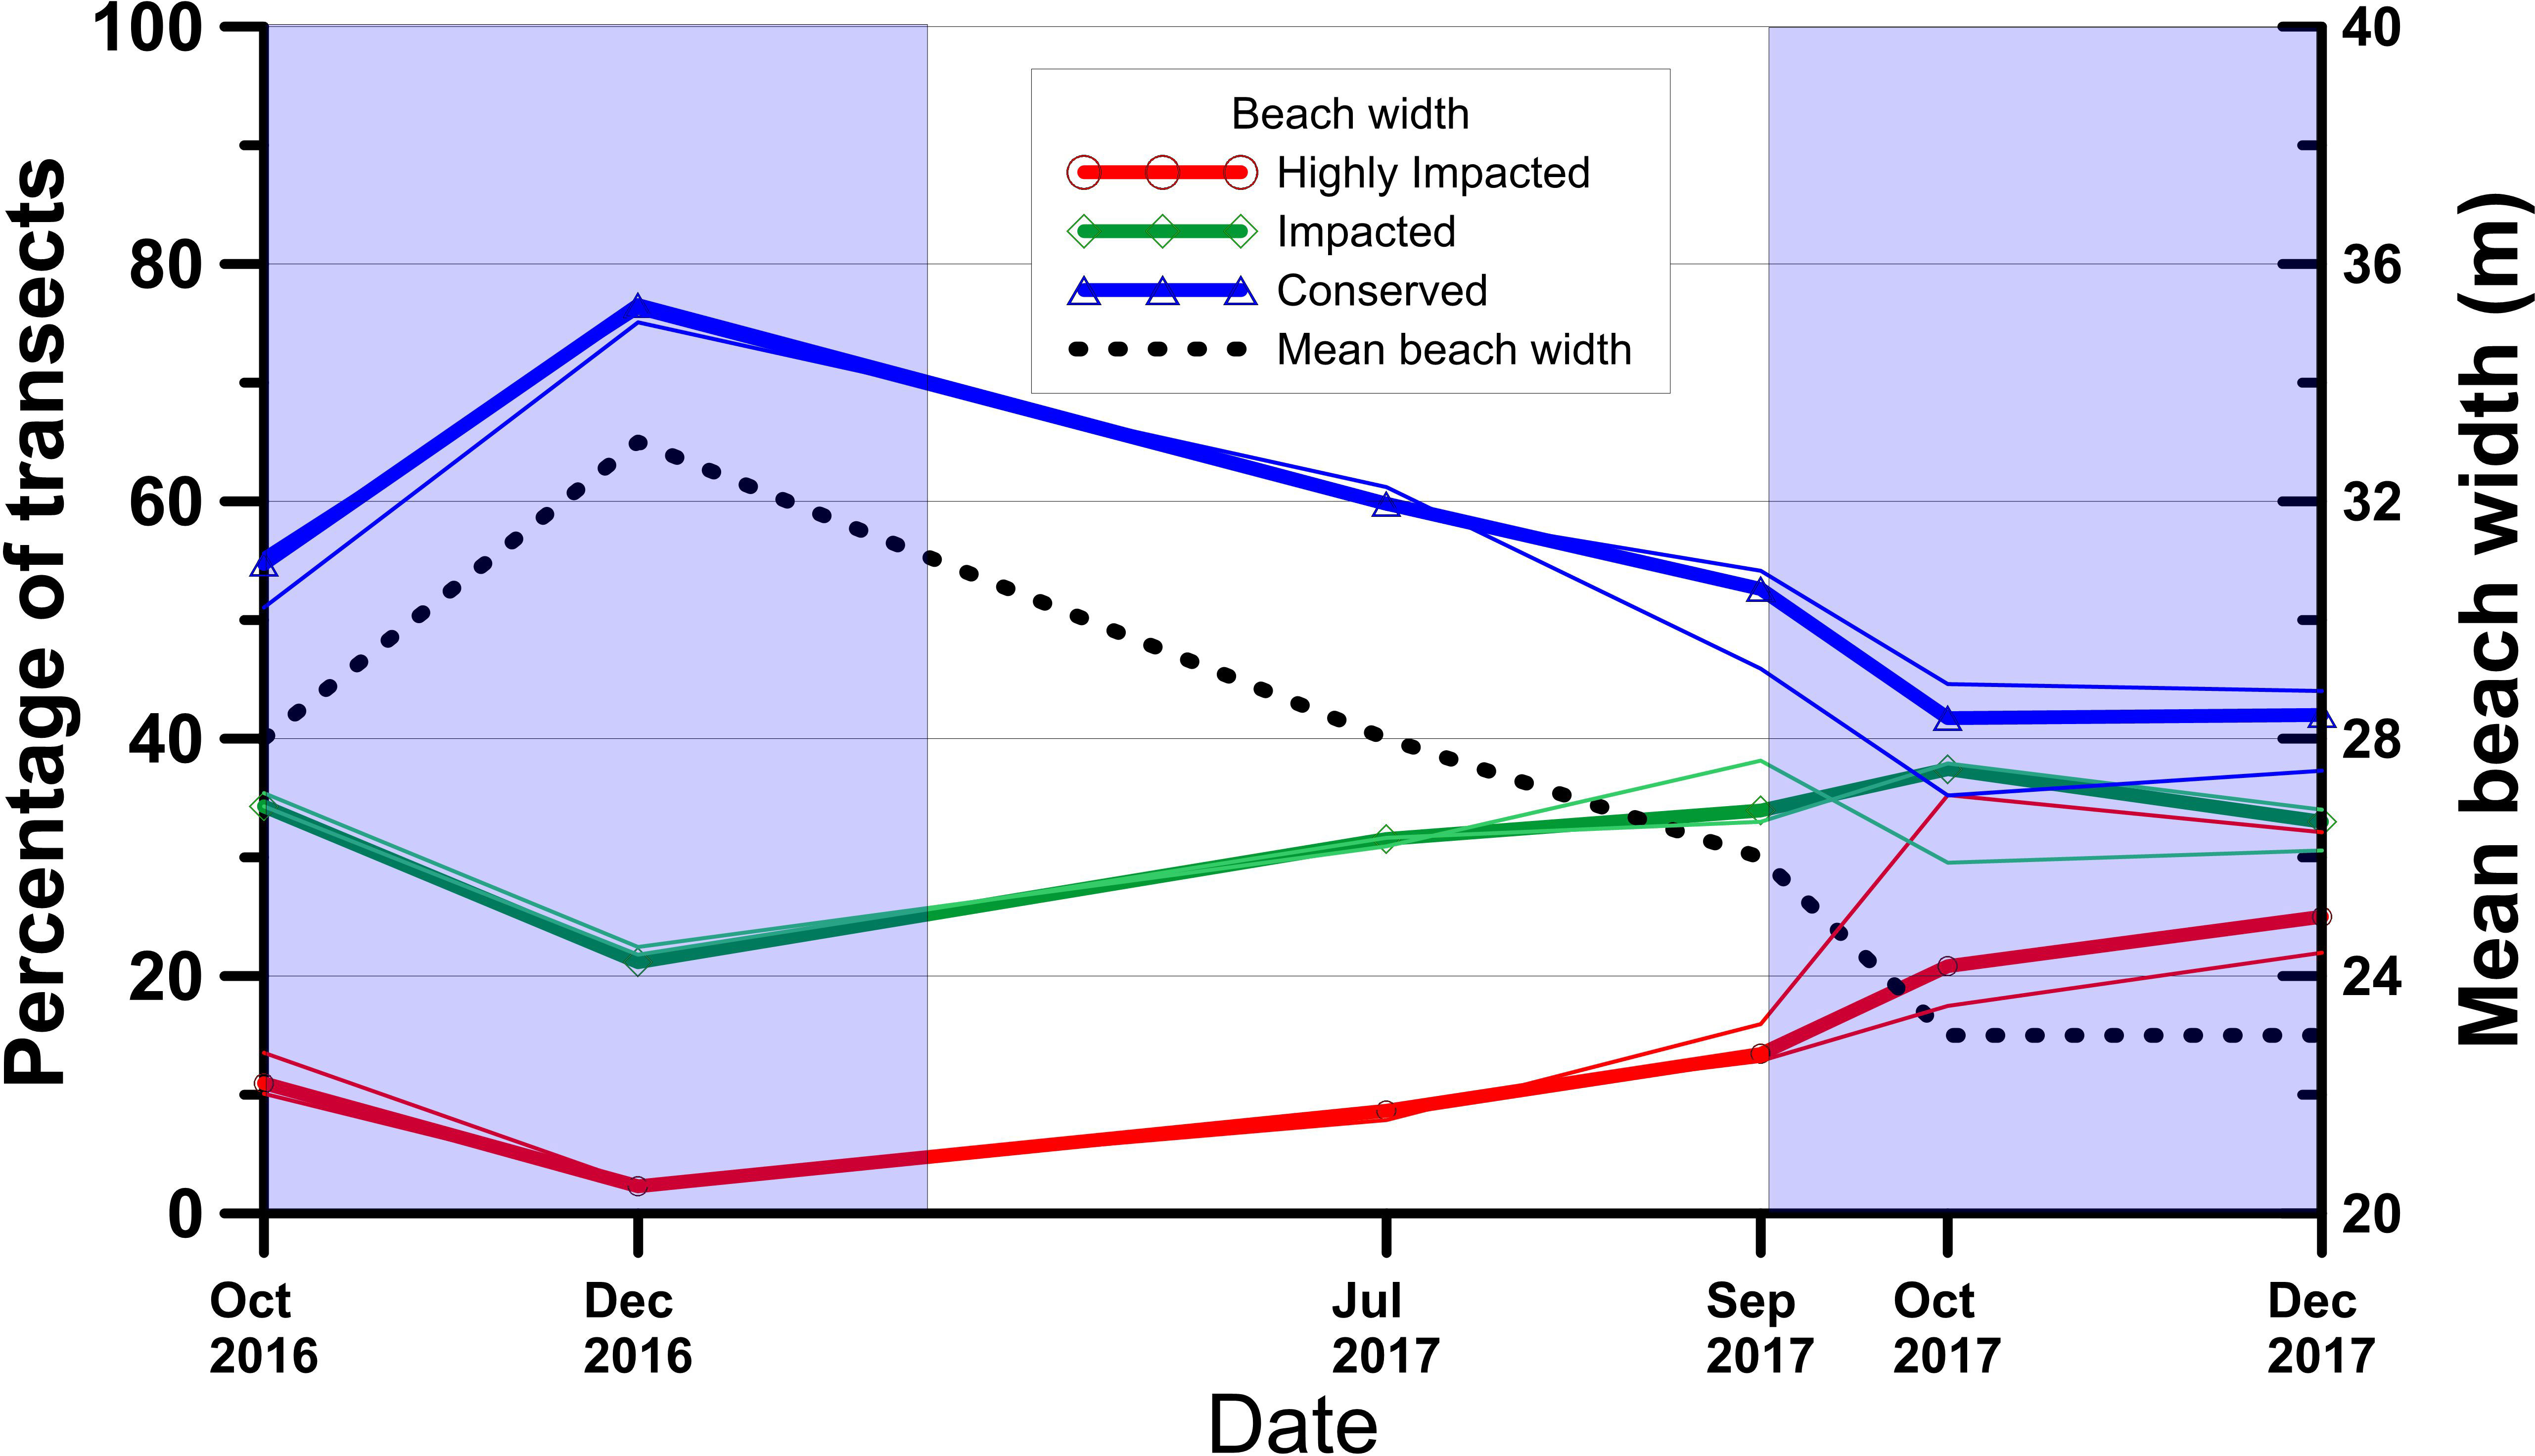
Figure 4 Progression of the beach width indicator presented as the percentage of transects belonging to each of the three different categories (red line - Highly Impacted class, green line - Impacted class and blue line - Conserved class) and the mean beach width for all the transects (black dotted line) along the 14 months of study. Blue shaded areas correspond to Nortes season and white areas correspond to sea breeze dominating conditions.
In order to correct for the effect of the selection of a fixed beach slope of 0.1 on the calculation of beach width, the potential error associated with using the extreme slope values of 0.05 and 0.15, respectively, are also presented in Figure 4. The histogram and the lines within the bars indicate the percentage of transects falling within each category of the BW indicator in case of selecting the different beach slopes for the tide correction (i.e., initially the shoreline position change associated to each slope was calculated and then the BW indicator was classified using the thresholds given in Table 2). As expected, the largest differences are associated to i) the selection of the 0.05 slope, which represents a higher horizontal difference related to the 0.10 slope than that of the 0.15 slope; and ii) to the cases when the tide conditions were afar from the mean tide level.
Vegetation coverage
This indicator was the one that presented the least variability. Approximately half of the study site presented an absence of vegetation (Highly Impacted transects) with a sustained increase during the study period. The Impacted category (which represents around 2.1 km) presented a decrease from 31% to 25% of the transects. Figure 5 suggests that such variability can be explained by the transformation from Impacted to Highly Impacted. On the other hand, the Conserved category remained around 20% of the transects with a small amount of seasonal variability (Figure 5).
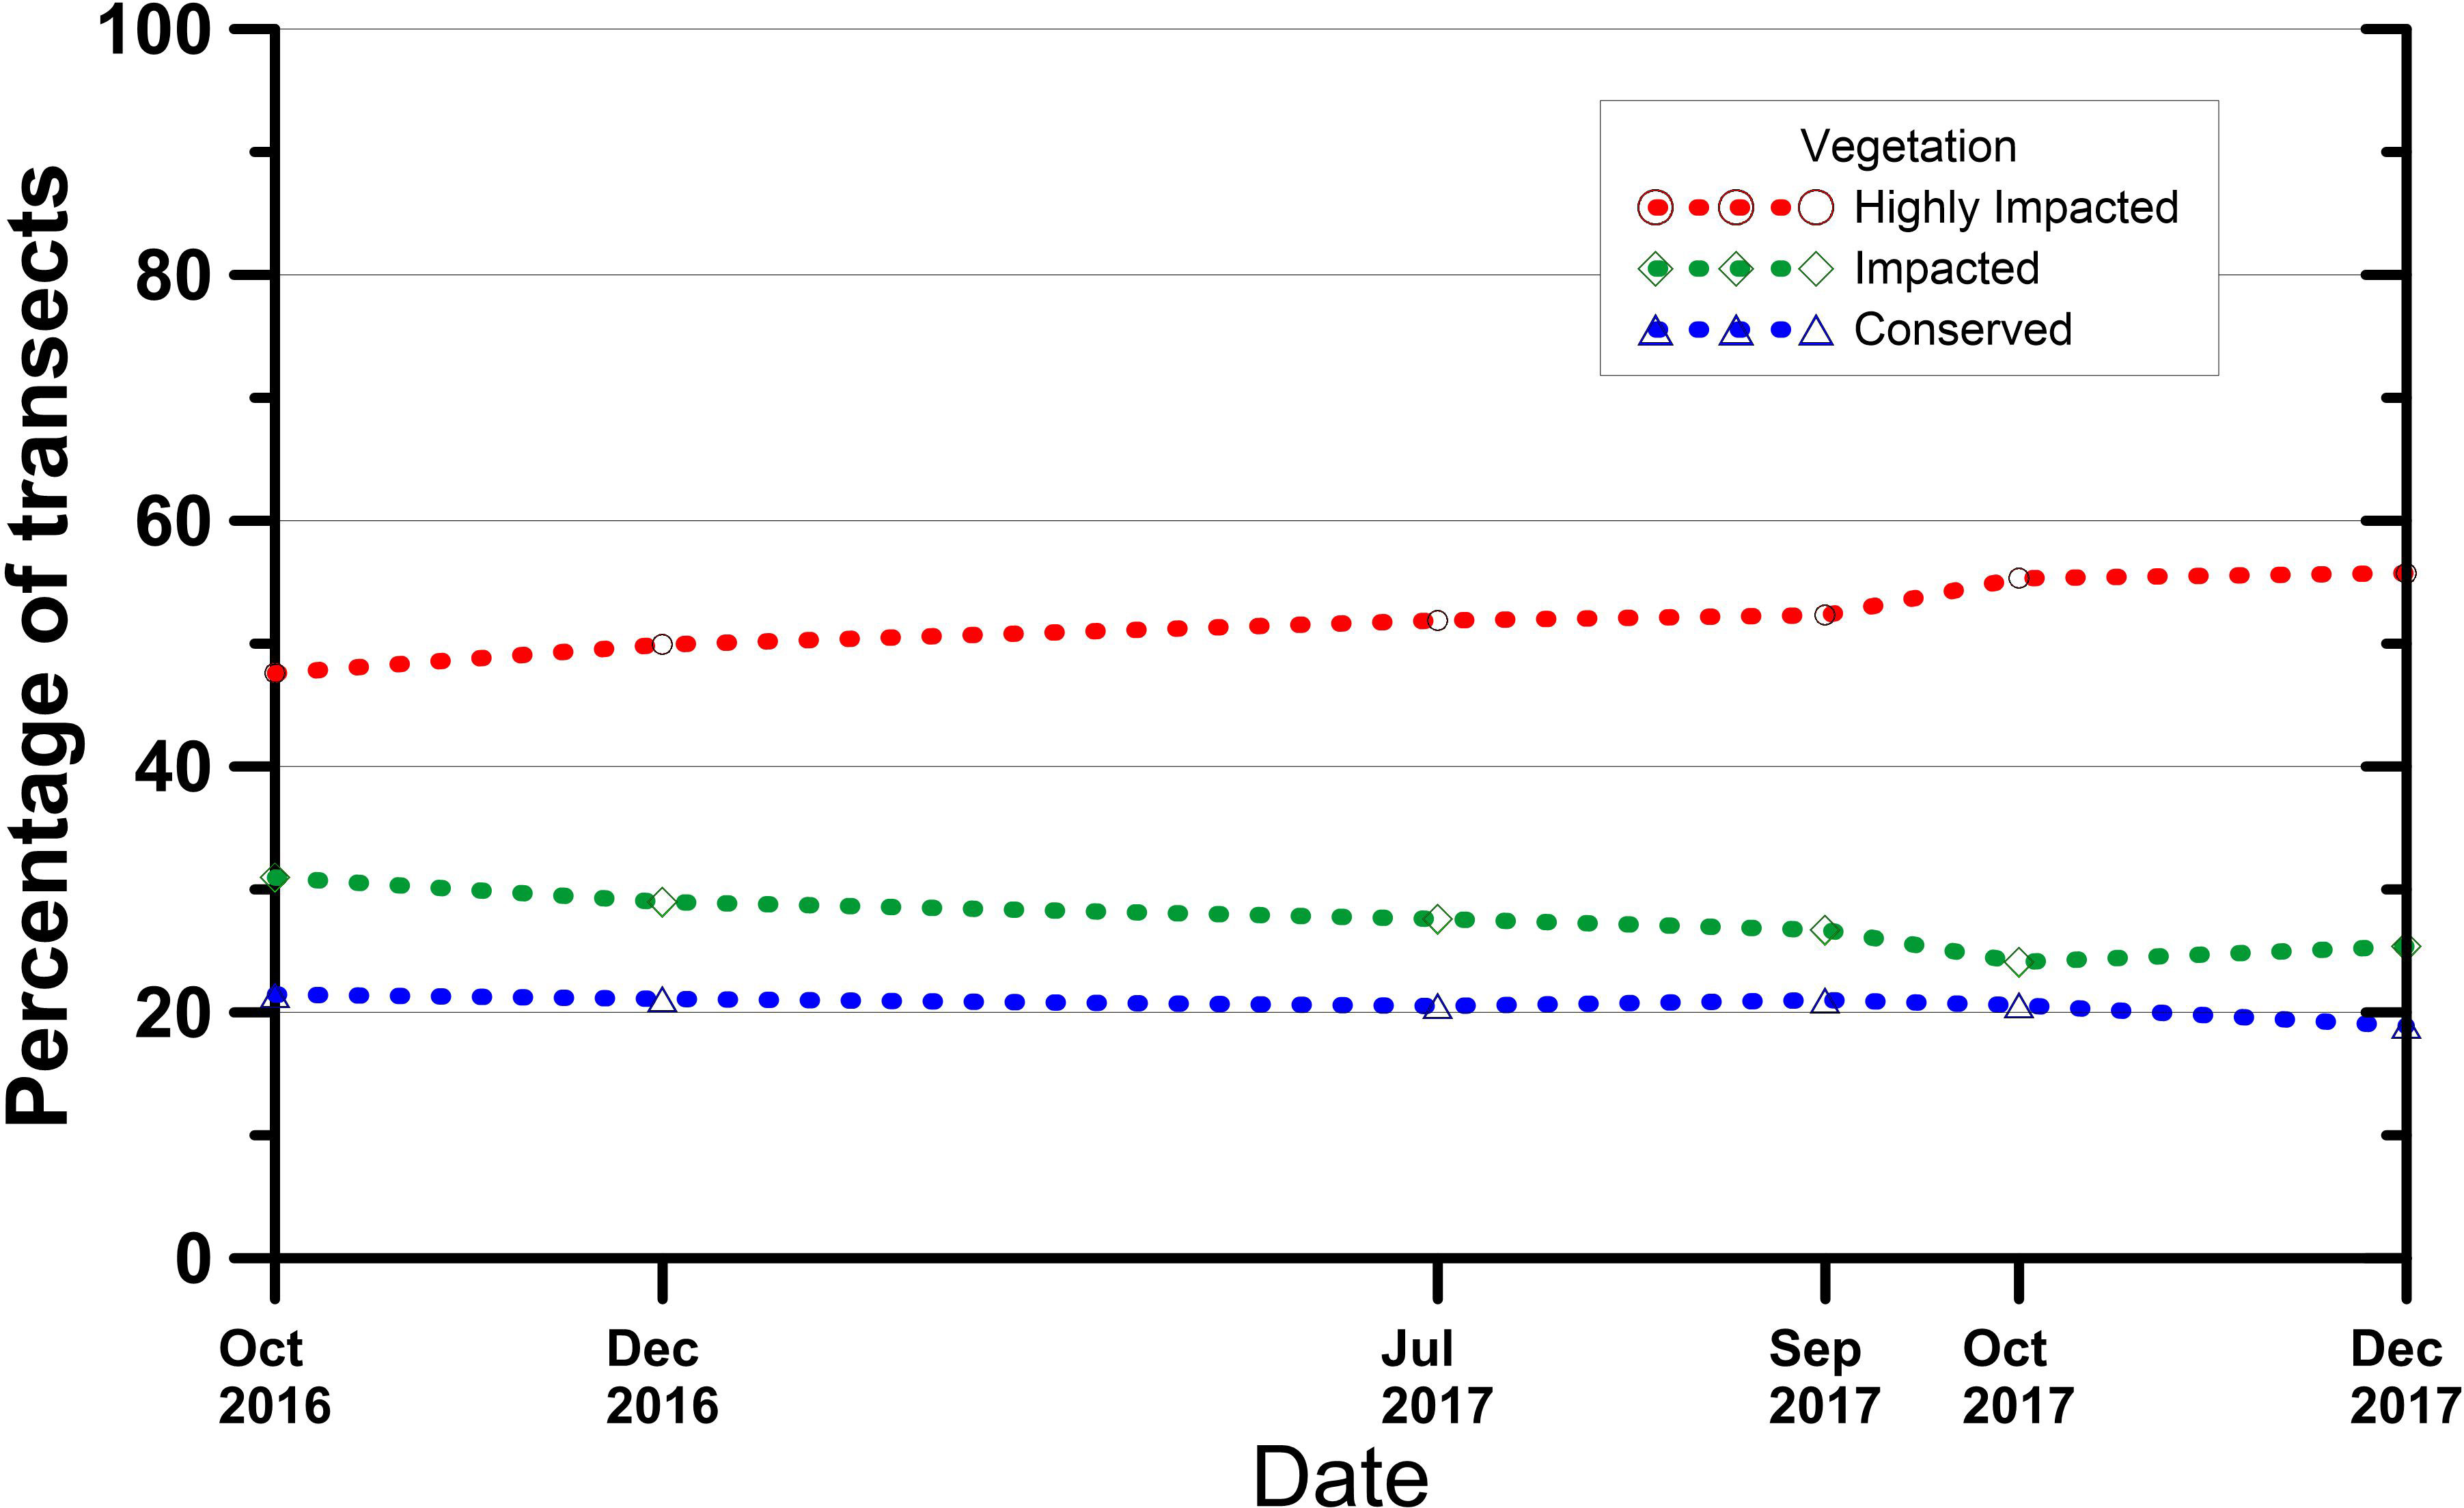
Figure 5 Progression of the vegetation coverage expressed in percentage of transects for the three different categories along the 14 months of study. In dotted red line the Highly Impacted class, in dotted green line the Impacted class and in dotted blue line the Conserved class.
Coastal structures
Figure 6 presents the temporal evolution of the CS impact, expressed as the percentage of transects influenced by CS for the three different categories along the 14 months of study. Overall, the highest percentage of the coast was within the Highly Impacted class, which started with 47% of the transects and increased by July 2017 to 61% and remained near this level for the rest of the study. This abrupt change was a consequence of the deployment of new CS which changed in number from 170 to 281 (Figure 8). The Impacted class remained between 13 and 14%. The Conserved class was a clear result of the construction of new structures, presenting a value of 40% for the first two months, decreasing to 25% by July 2017, and remaining at this value for the rest of the study. This is consistent with the variation of the Highly Impacted class.
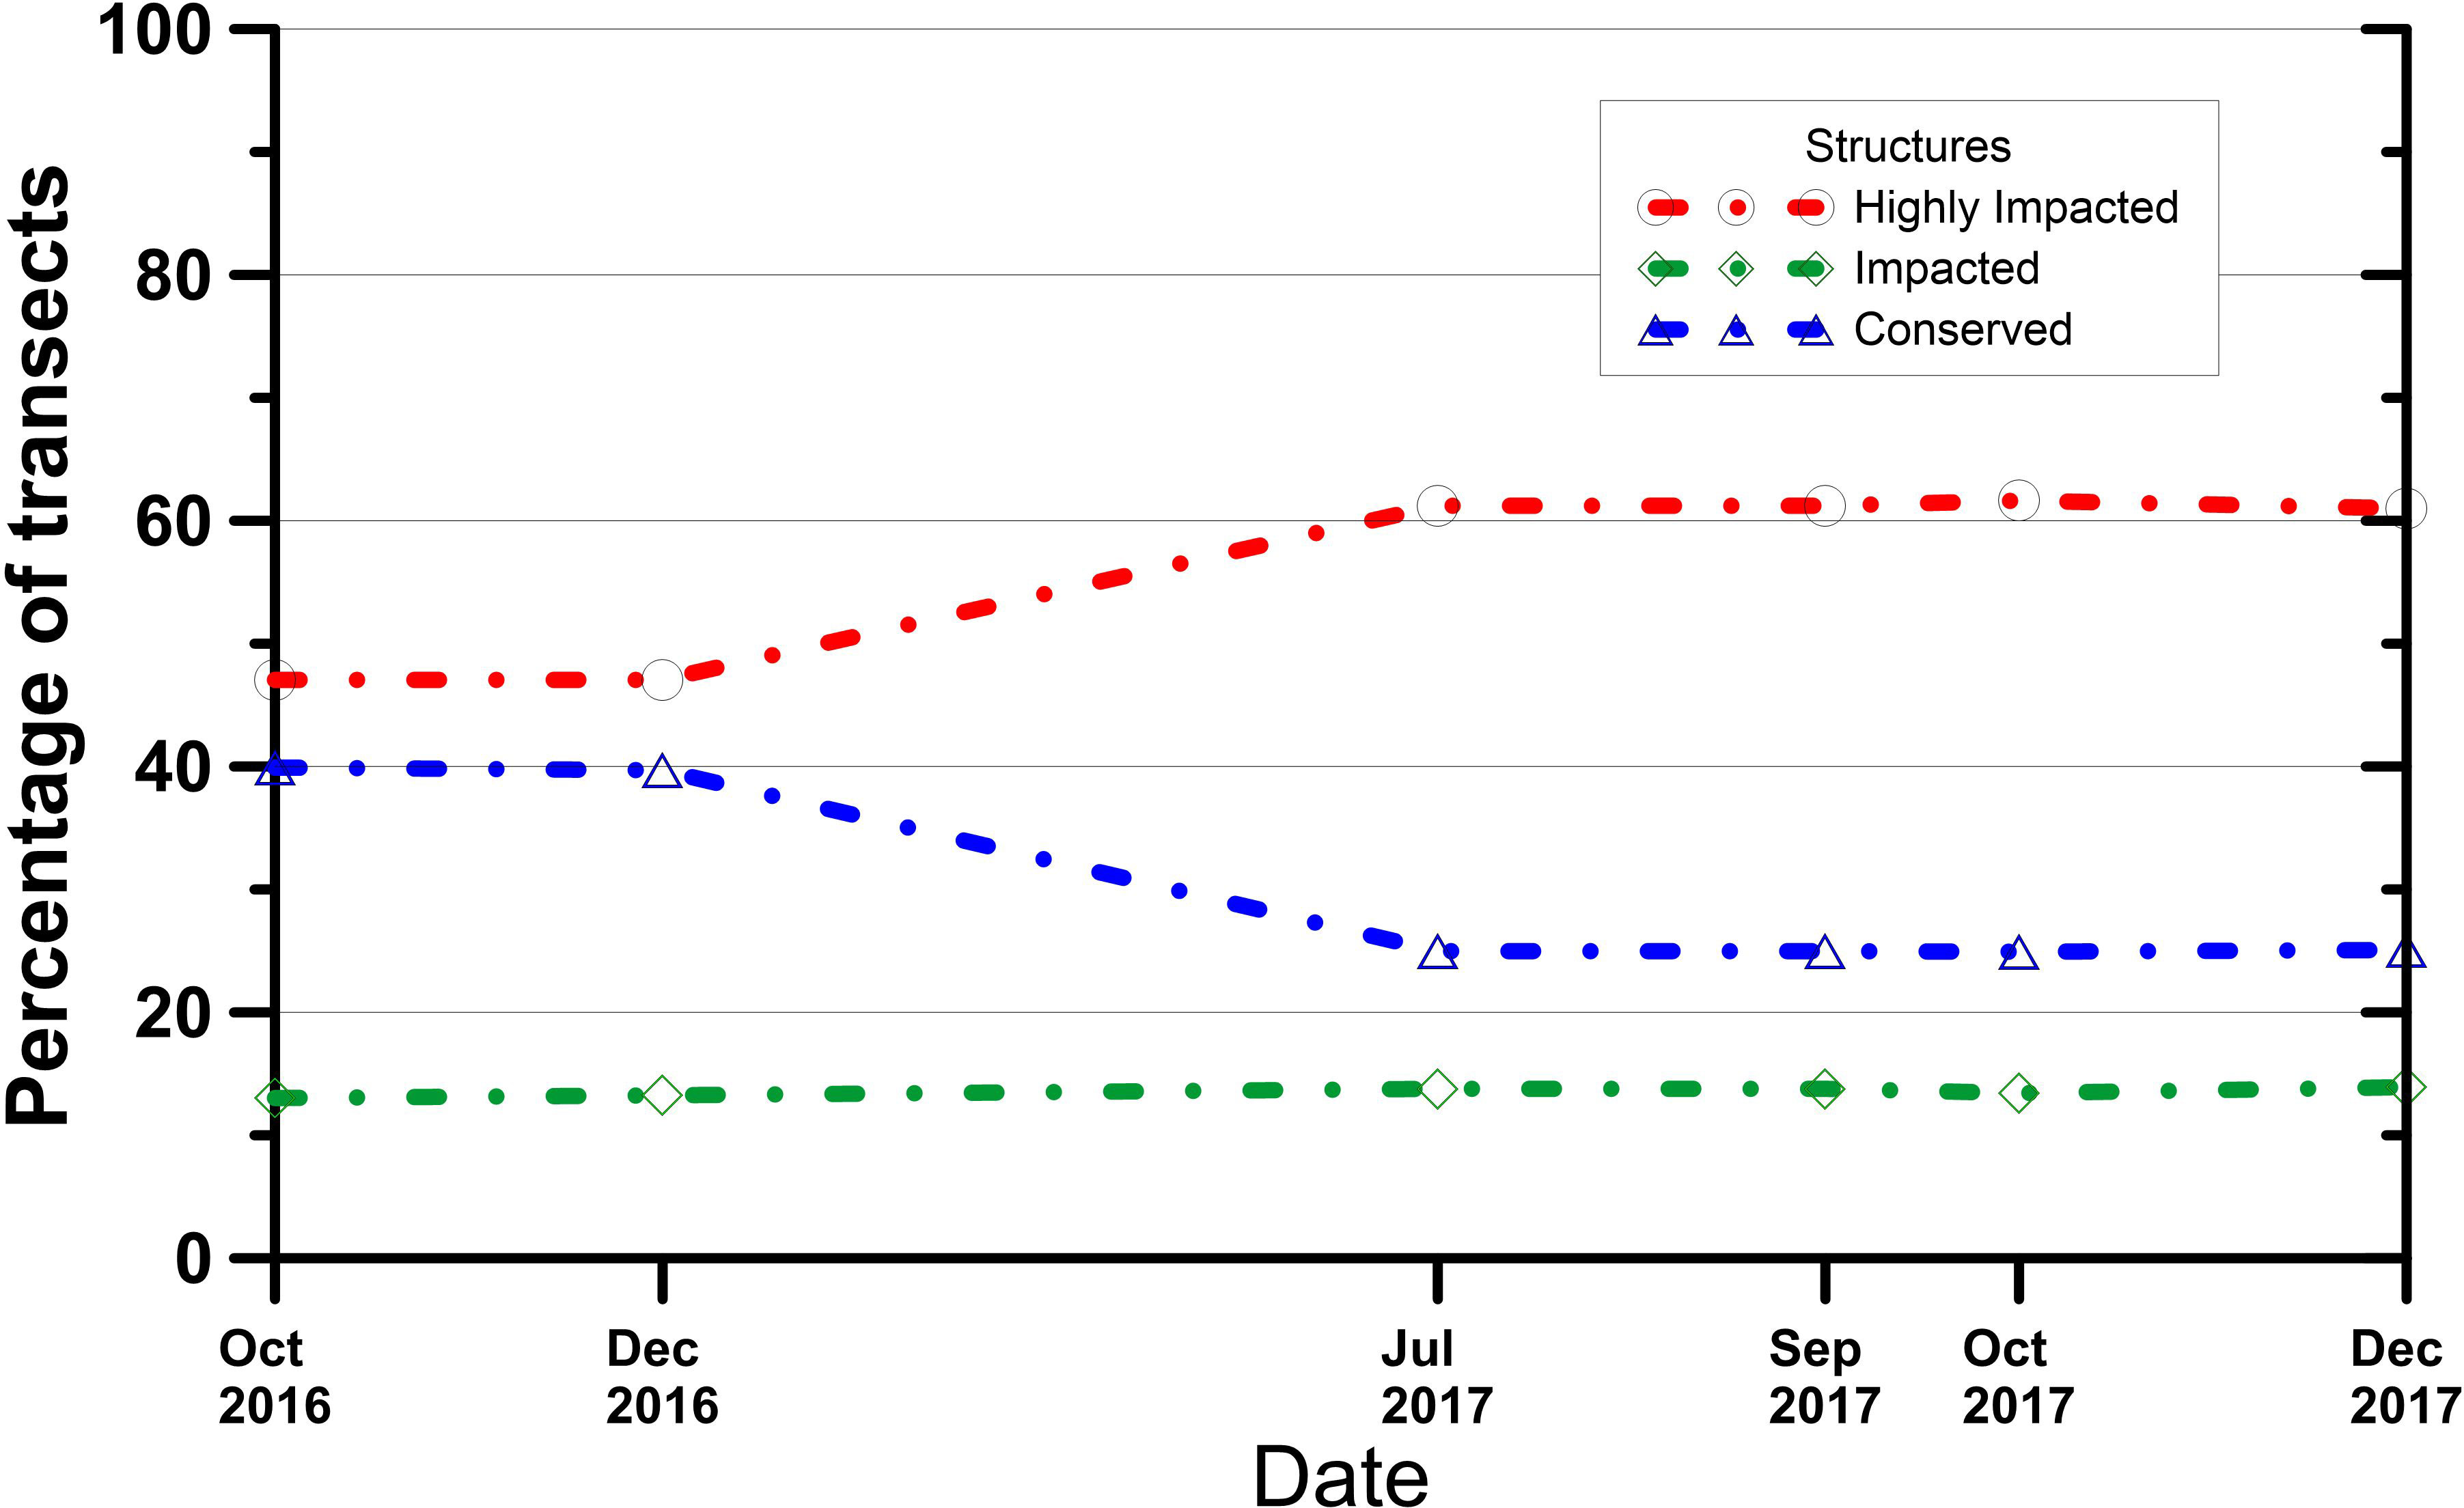
Figure 6 Temporal evolution of the Coastal Structure Indicator expressed as the percentage of transects within each of the three different categories along the 14 months of study.
Coastal resilience index from remote sensors
Considering the previous three-level classification of the indicators and the results from the six evaluated surveys, we obtained the histograms of the frequency of occurrence and the cumulative percentage to obtain the final classification. Following the 20, 40, 60, and 80 quantile cumulative percentages, values lower than 0.6 were considered Very Low (VL) resilience; those between 0.6 - 0.9 were considered Low (L) resilience; values between 0.9 - 1.1 were considered Medium (M) resilience; those between 1.1 - 1.2 were considered High (H) resilience; and values > 1.2 were considered Very High (VH) resilience (Figure 7).
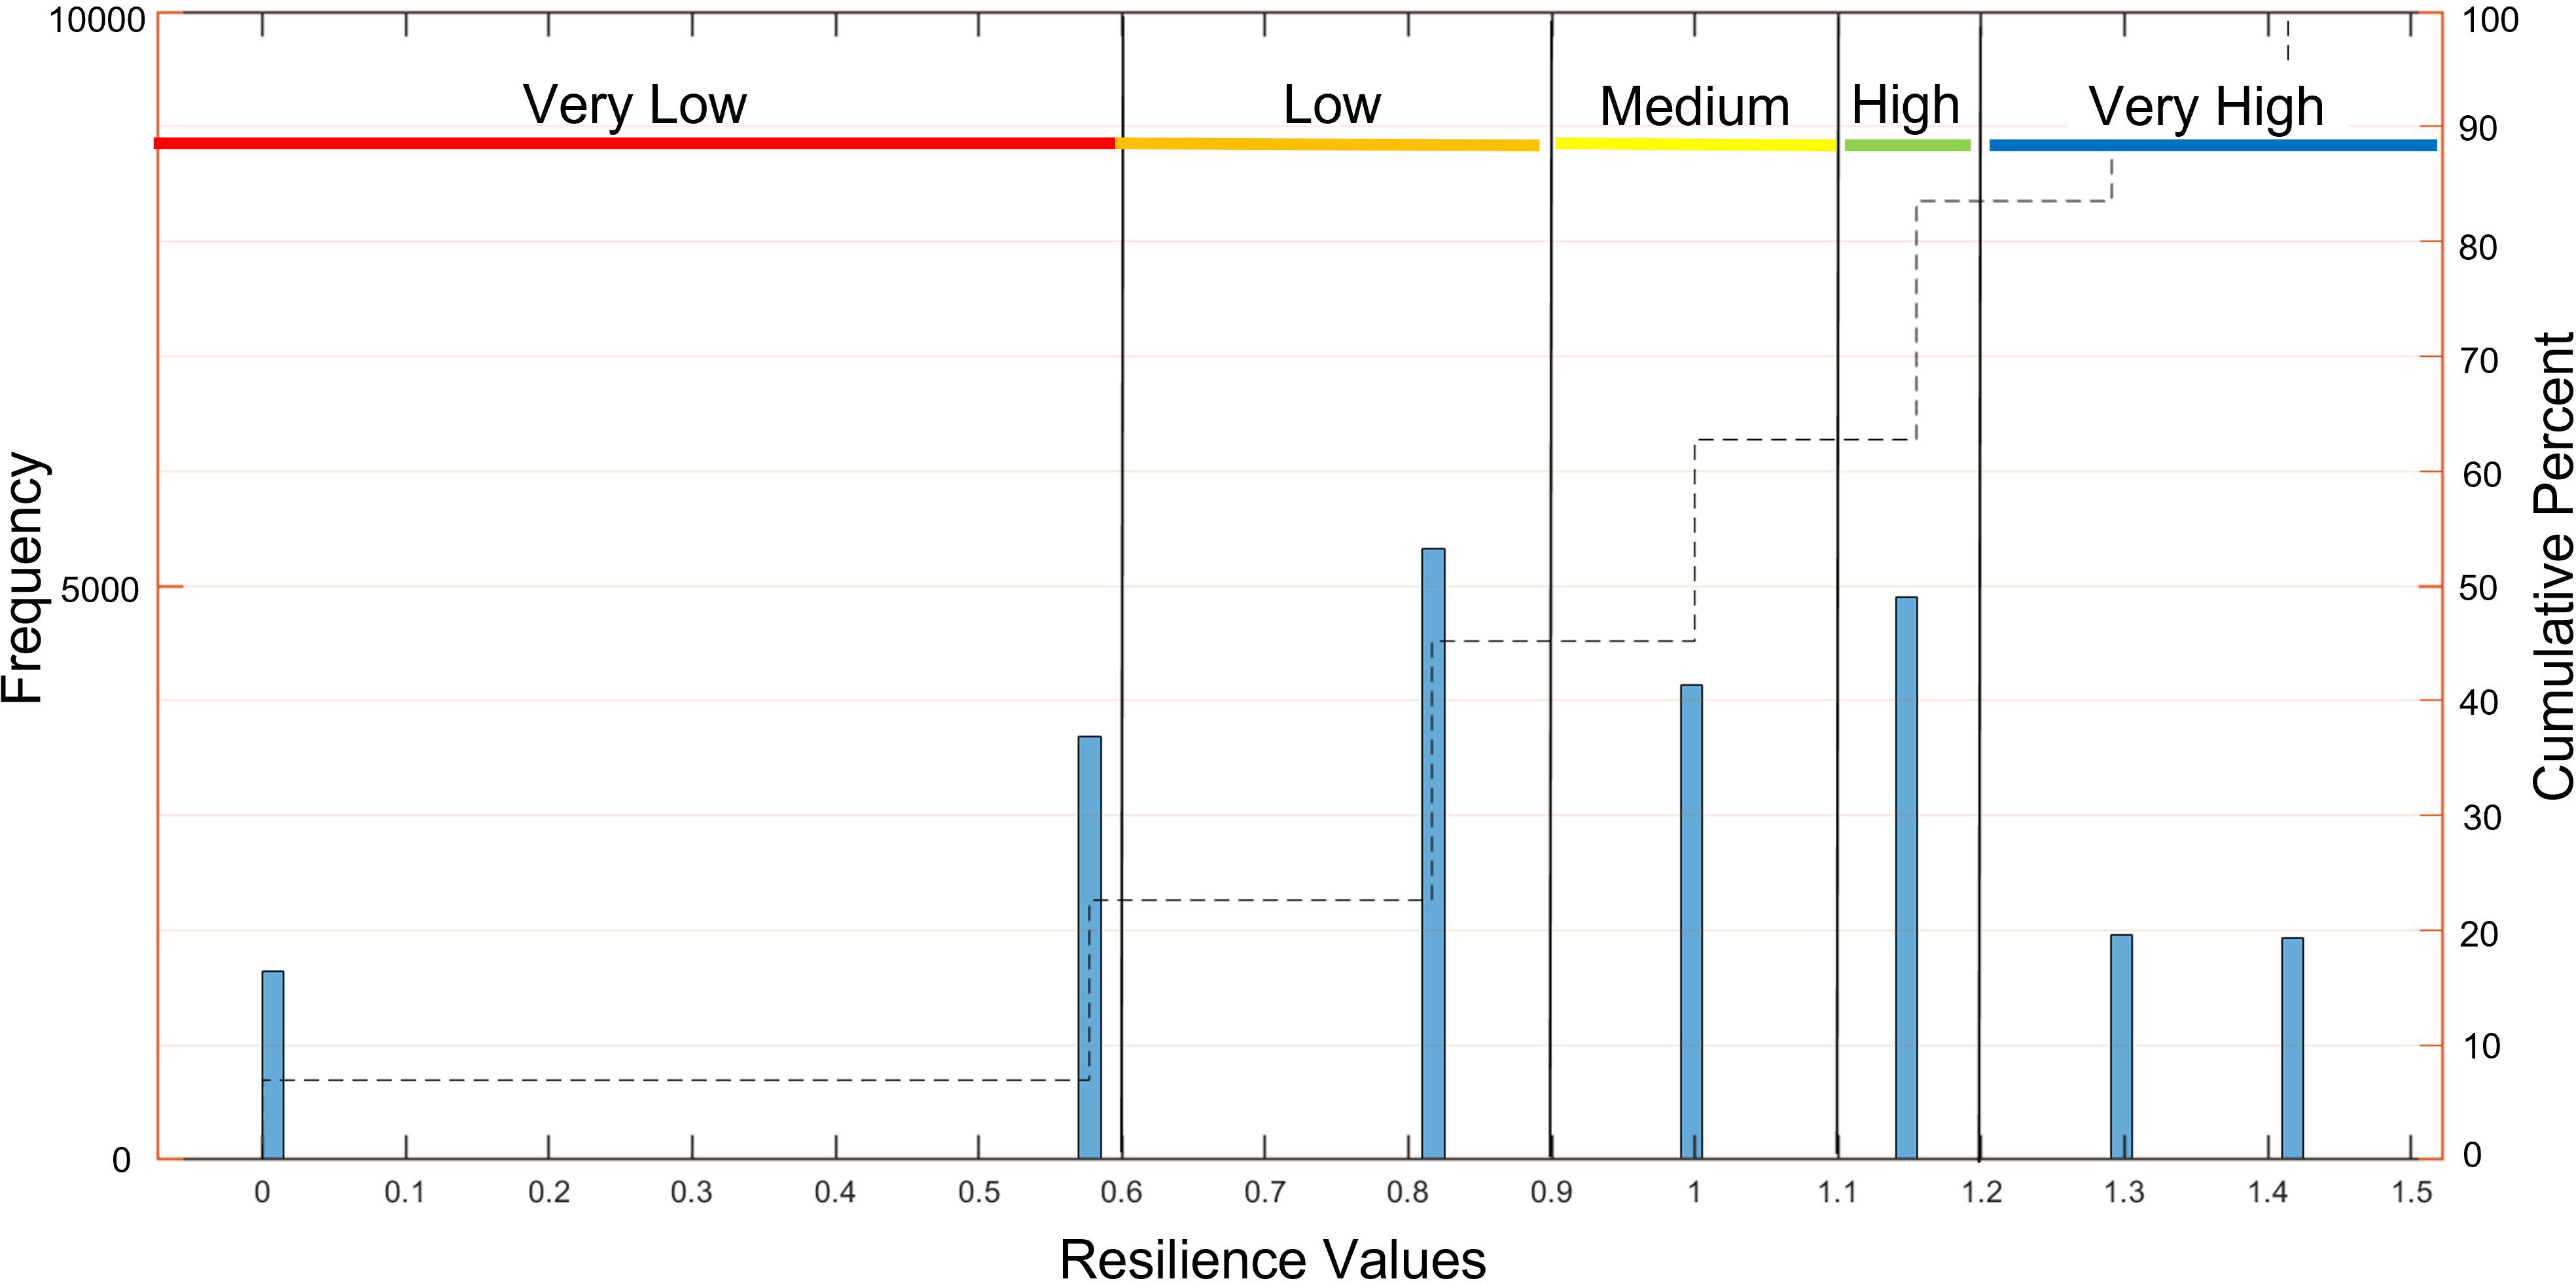
Figure 7 Frequency of occurrence expressed in histograms and cumulative percent of the CVIfRS values for the Yucatan coast. Color lines show the range between categories, Very Low (red), Low (orange), Medium (yellow). High (green) and Very High (blue).
The evolution of the CRIfRS during the first three months of the study (October-December 2016) shows that the percentage of transects within the VL and L classification decreased (from 1.2 km to 0.7 km of beach corresponding to transects with VL values, and from 1.7 km to 1.2 km of beach corresponding to transects with L values) whilst the M, VH, and H classifications increased (from 1.2 km to 1.5 km, 1.6 km to 1.9 km, and 1.4 km to 1.6 km, respectively). These variations were due to the increase of the BW (Figure 4) while no significant changes occurred in the VC and the CS. Subsequently during the following ten months corresponding to the next three surveys (July, September, and October) the VL, and L values increased up to 2.2 km and 1.6 km, respectively, whereas the M, H, and VH values consistently decreased down to 1 km, 1.1 km, and 0.9 km correspondingly. This was caused by the increase of the total number of structures (a 165% increase) and the general decrease of BW (Figure 4). On December 2017, half of the surveyed beach had VL and L resilience, 1.1 km of the beach presented M resilience, 1.4 km of the transects were labeled as H, whilst the lowest number of transects (1 km) corresponded to the VH resilience value (Figure 8).
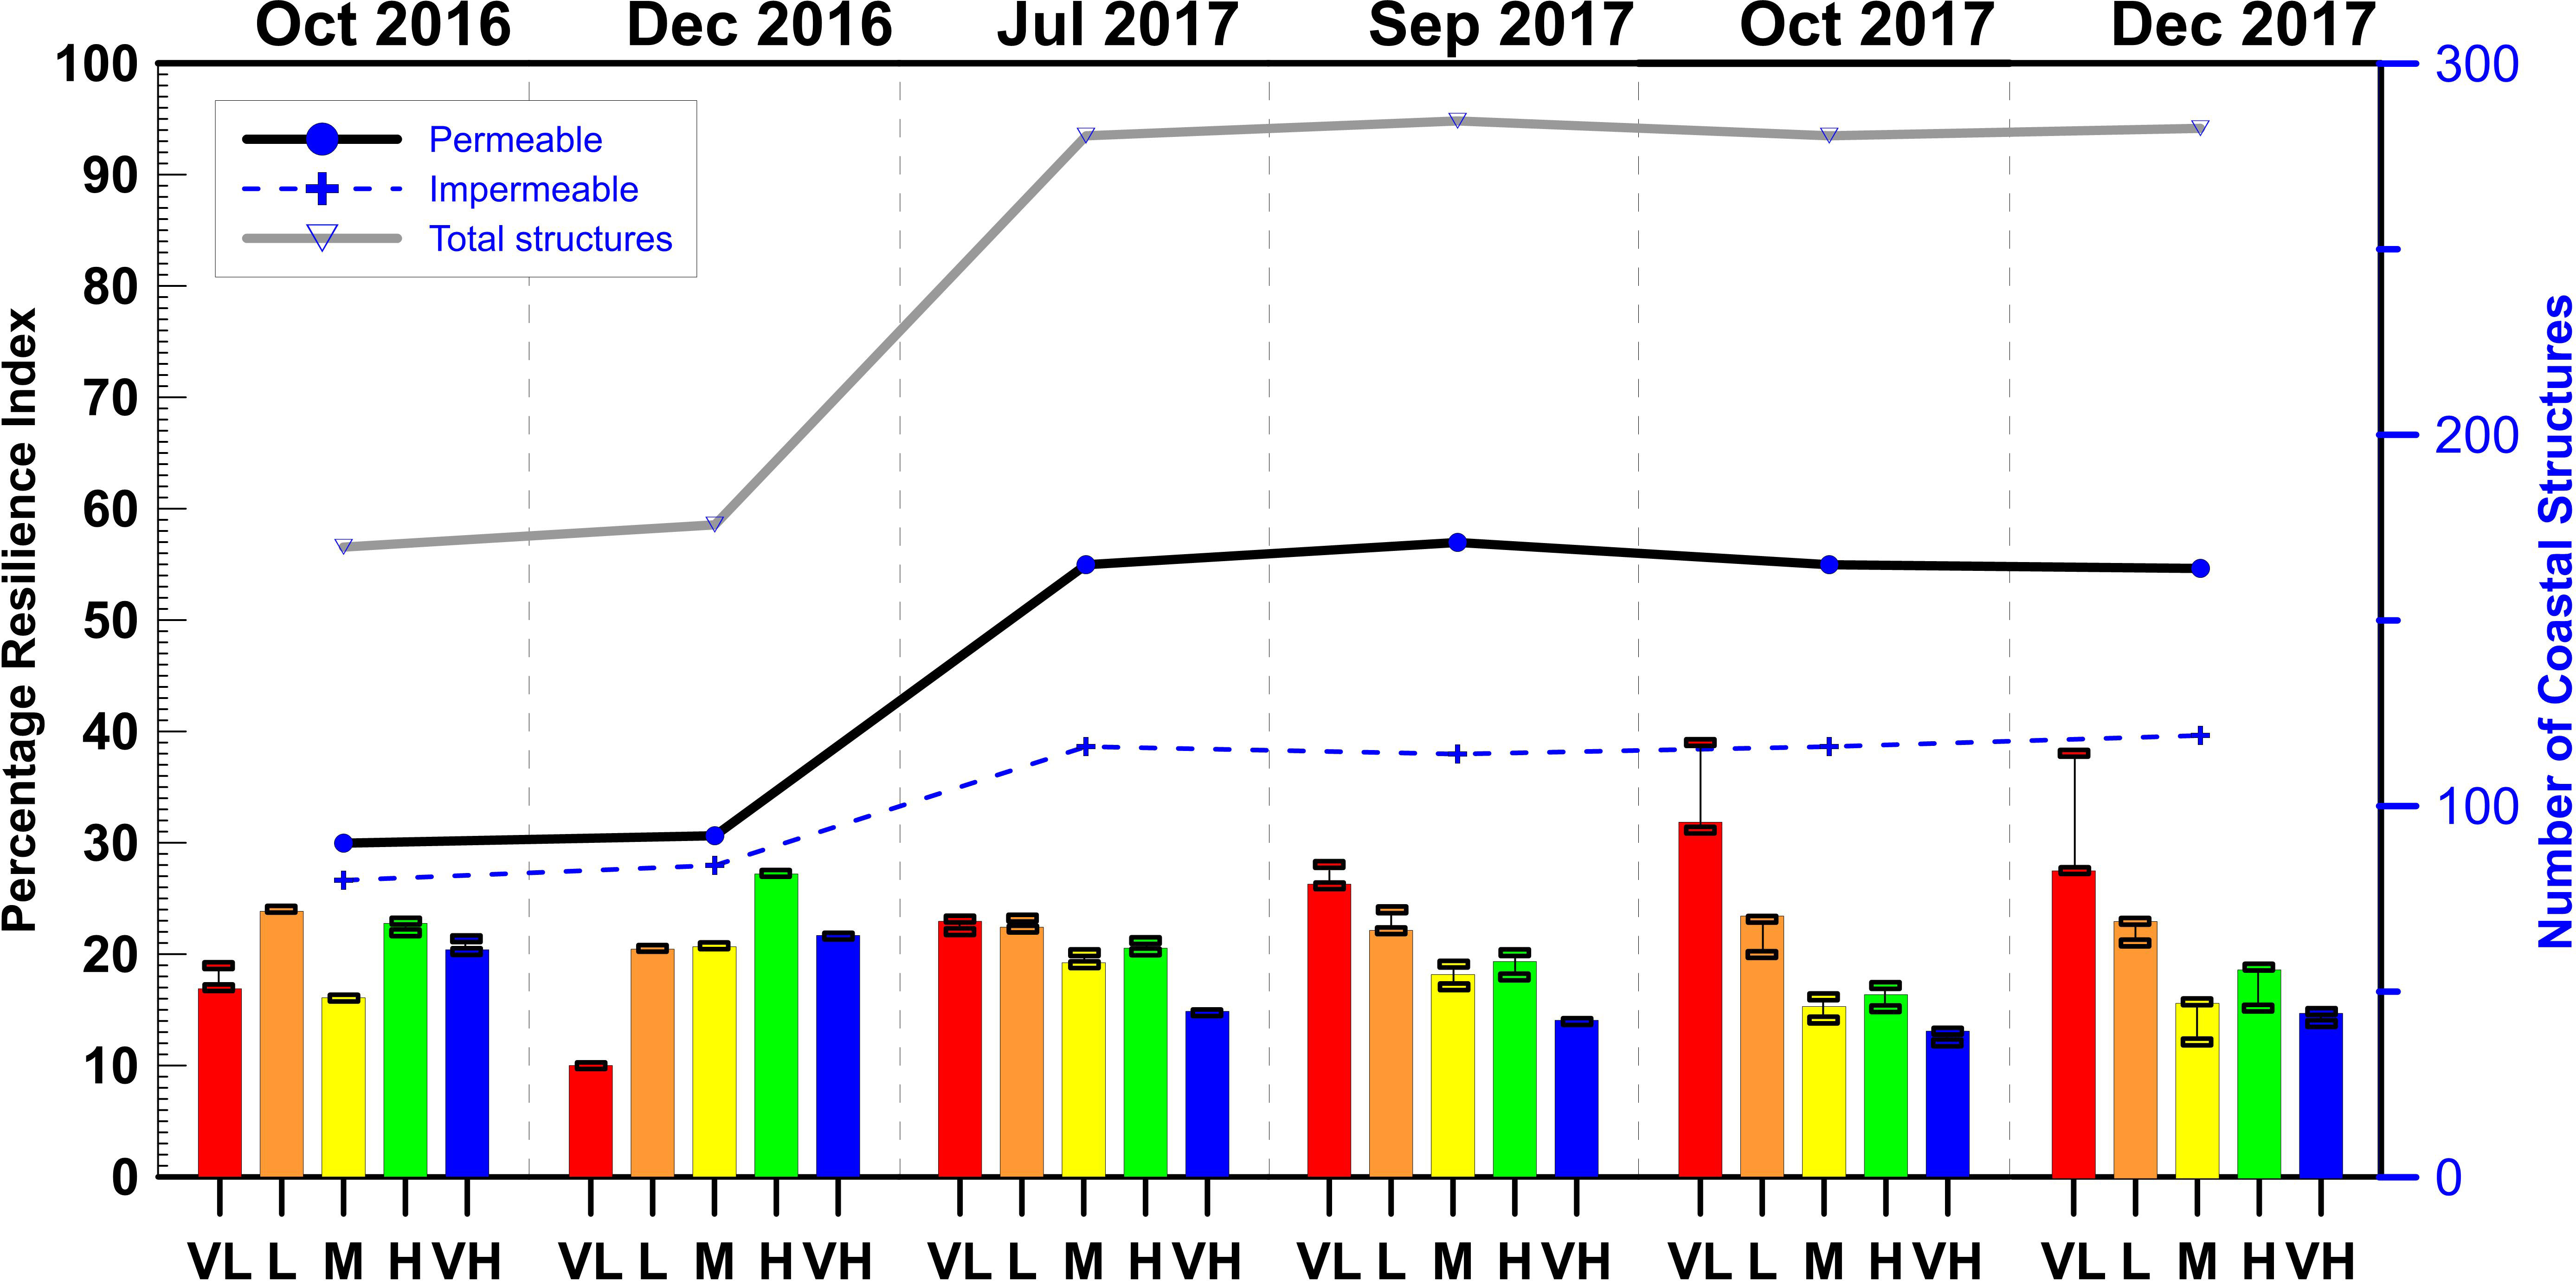
Figure 8 Histogram representing the percentage of transects within each category of the Coastal Resilience Index (VL: Very Low in red, L: Low in orange, M: Medium in yellow, H: High in green and VH: Very High in blue). Bar lines represent the variability range related to the selection of beach slope using the 0.05 and 0.15 values. Lines (right axis) represent the evolution of the number of coastal structures at each surveyed date within the study area. The gray line represents the total number of coastal structures, the black line represents the number of permeable structures, and the blue dotted line represents the number of impermeable structures.
Application to Punta San Miguel case
The previously presented results show the evolution of the CRIfRS at a medium spatial scale (regional scale). The high-resolution of the results permits to analyze in detail any specific stretch of coast. As an example, the local case of Punta San Miguel (located 10.5 km east of Progreso port in Figure 1) is presented (local scale). The 0.9-km stretch of coast (Figure 9) was subjected during the study period to the deployment of a series of geotextile detached breakwaters designed to stabilize a coast section. We analyze, from an initial non-perturbed condition, the sequence of variations of the CRIfRS estimates following the perturbation due to the geotextile structure (Figure 9).
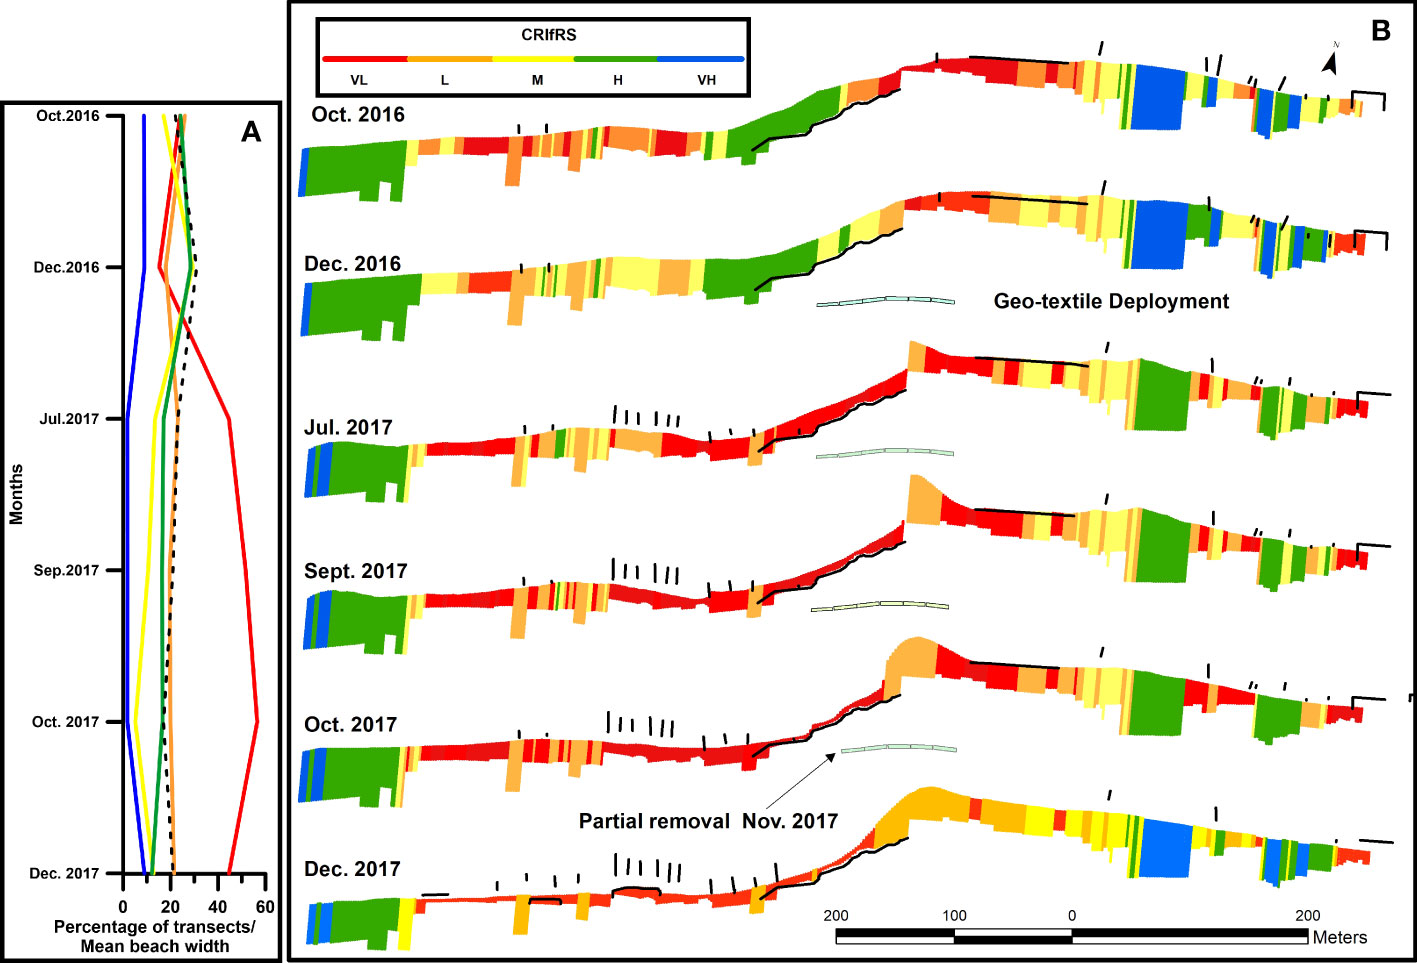
Figure 9 (A) CRIfRS assessment for Punta San Miguel, expressed as the percentage of transects for the five different categories (Very Low in red, Low in orange, Medium in yellow, High in green and Very High in blue) and mean beach width value (dashed black line) along the study period (B). Spatial distribution of the CRIfRS along the study period with the deployment of structures (black lines) and the geo-textile structure -July 2017- and partial removal of the western section -November 2017- (right panel).
In October 2016, the VL, L, M, and H categories presented percentage values between 24 and 26 whilst VH had 9% of the transects. In December 2016, the VL and L values decreased, the M and H values increased while the VH percentage remained constant. This change was mainly due to the increase of the BW (Figure 9A). In July 2017 a geo-textile structure had been fully deployed consisting of six 20-m sections separated to form two detached breakwaters. The structure caused a BW increase concentrated only in the eastern section of the structure, while a downdrift erosion occurred in the western area (Torres-Freyermuth et al., 2019). Moreover, unauthorized CS were deployed by the home-owners to mitigate the downdrift erosion effect. These changes caused a significant increase in the VL percentage and a slight increase in the L values, while the rest of the classes decreased. The percentage values remained constant until October 2017 except for the M values which decreased, while the VL increased to more than half of the San Miguel area (57%). The downdrift beach loss initiated the removal of a western 20 m section of the geo-textile structure in November 2017, which was reflected on the December 2017 survey with an evident VL decrease and VH and M increase. Comparison of December 2016 and December 2017 shows that Very Low and Low resilience values increased from 33% to almost 70% illustrating the complexity of implementing erosion mitigation measures in this region.
Discussion
The presented results show the evolution of the CRIfRS during a 14-month period instead of a fixed-image of the CRIfRS. This allows improved understanding of the importance of the different factors affecting beach resilience over time. The knowledge of the temporal evolution, or trajectory, of the key indicators is a fundamental component to assess beach resilience.
Limitations of the CRIfRS
From the three indicators used, the BW presented the highest variability. The increase of the percentage of transects classified as Conserved from October 2016 to December 2016, as well as the break of the previously decreasing trend from October 2017 to December 2017, may be due to the increased importance of cross-shore sediment transport and to seasonal changes of mean sea level that contribute to onshore sediment transport during those months (Medellín and Torres-Freyermuth, 2021). The difference found in the percentages of conserved BW transects from October 2017 to December 2017 with respect to the same months of 2016, might be related to a storm event that took place on December 9th, just before the December 2017 survey (Figure 3A). The short time lapse between the event and the beach survey probably did not allow for the expected natural recovery of the system in the days following the event. On the other hand, during prevailing sea-breeze conditions which occur all year long but are more persistent during springtime, the alongshore transport becomes more important and hence the downdrift effect of coastal structures becomes larger, accreting the beach updrift of the structure but eroding it downdrift.
Regarding the VC indicator, the slight changes observed during the study period are related to the urbanized character of the study area. Figure 10 shows three examples of the configuration of this stretch of coast to confirm its anthropic character: the largest beach sections that are not backed by man-made structures correspond to sections of< 50 m of alongshore extension. In the study area, the largest changes in vegetation were related to repopulation/removal of beach vegetation by human actions rather than natural cycles as the growth of vegetation patches during the study period did not reach the required 5x10 m extension. This is related to the specific studied case, a region with a large anthropogenic influence. However, vegetation can play a key role in other settings where natural cycles in vegetation growth are more evident; in those regions this indicator might be responsible for an added seasonal signal that would have a higher weight in the CRIfRS. In the case of the Yucatan Peninsula, the vegetation follows a natural seasonal cycle related to the hydrodynamics that is not clearly represented in our data set. It has been documented that the effect of storms in the foredune vegetation might be evident even a year after the occurrence of the storm (Gallego-Fernández et al., 2020). Therefore, the VC indicator should be considered as a primary element for coastal management due to the slow recovery rate of the vegetation and its important role on sediment stabilization (Hesp et al., 2011).
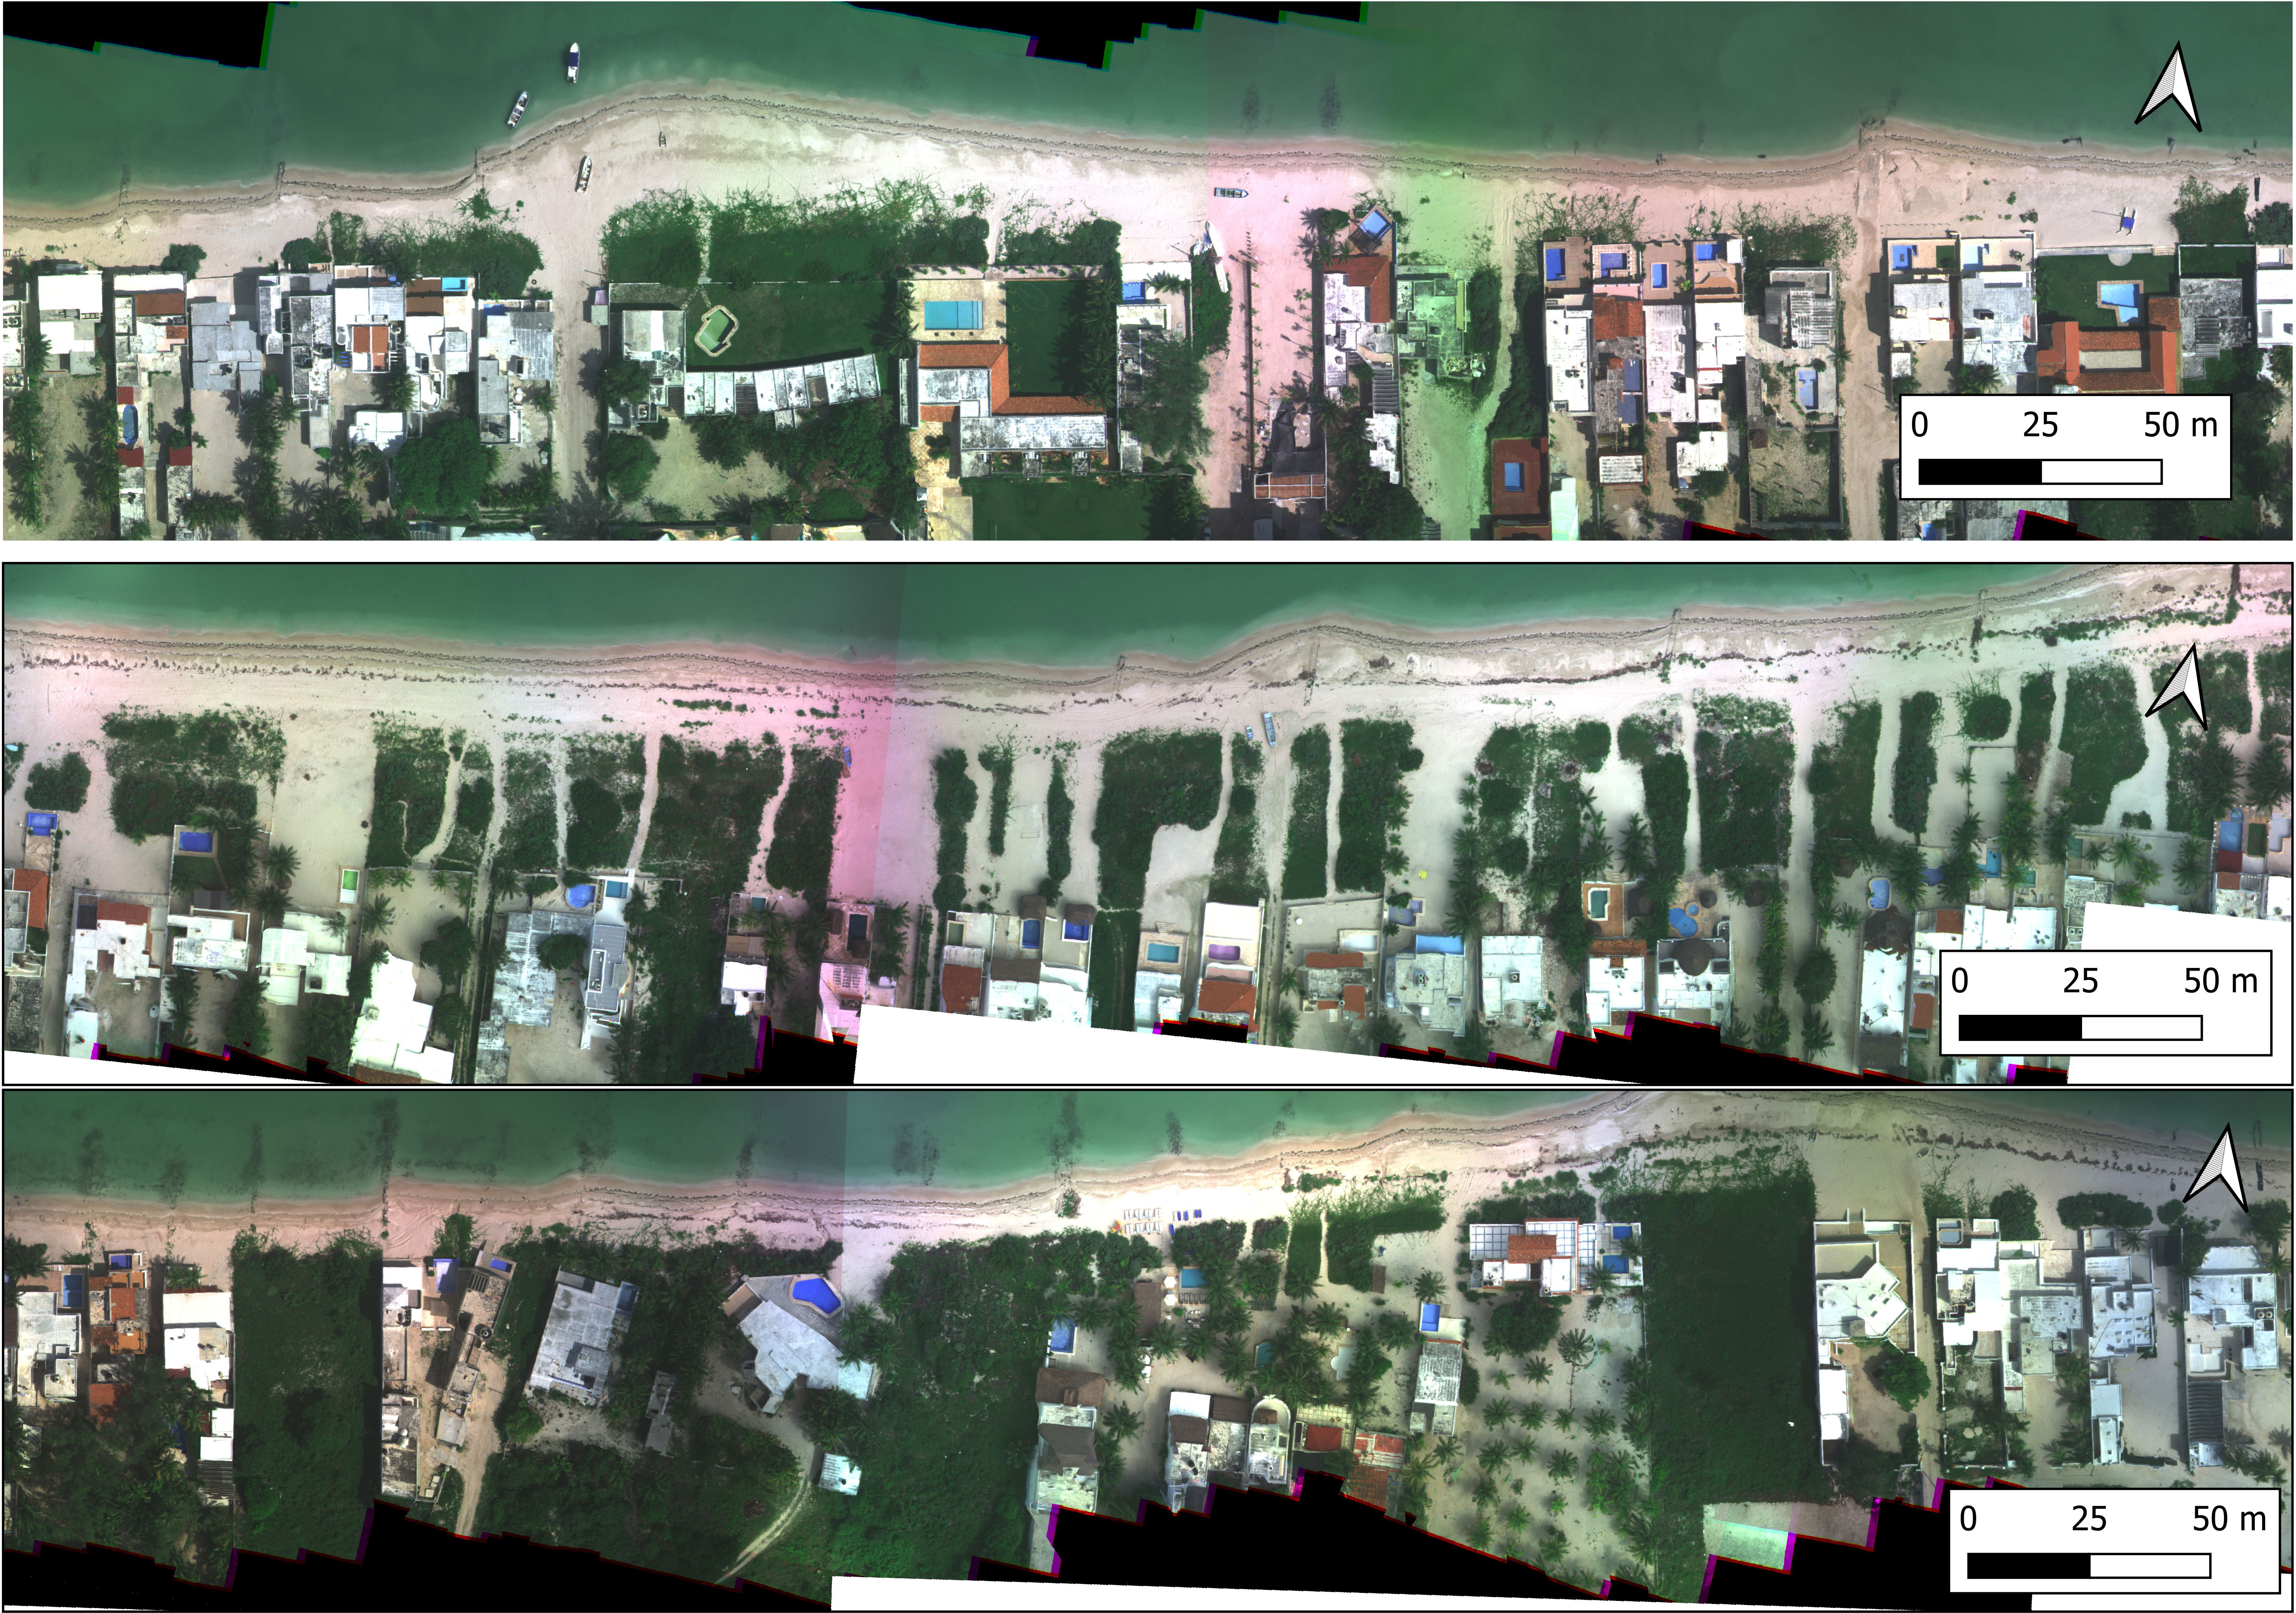
Figure 10 Examples of the heavily urbanized character, and low vegetation coverage, of the study area.
In the case of the CS indicator, this work considers that coastal structures have a negative effect on beach resilience, which might not be the case in other study regions. Our decision was based on the fragility and the short-lived character of the structures. The sections of beach protected by these types of rock and timber dykes, sacks full of sand or debris, or geotextiles filled with sand are prone to their destruction (which is a common practice among downdrift neighbors) or their removal during governmental campaigns to manage illegal structures. In the coastal region of Yucatan, local stakeholders consider the infrastructure development as one of the main threats to the ecosystem services provided by the beach (Mendoza-González et al., 2021).
The combination of these three indicators lead to the CRIfRS. The possible errors associated with the CRIfRS are twofold: firstly, the CRIfRS value classification (from VH to VL values) will depend on the definition of individual thresholds for each of the three indicators. In this sense, a previous knowledge of the studied region is imperative for the definition of the thresholds, because the selection of these thresholds imply “a transcendental management decision” as stated by Cuevas-Jiménez et al. (2016). Secondly, within the evaluation of each indicator there will be associated errors that may add up in the final results. In the studied case, the main source of error to the authors knowledge was related to the different tide level during each survey. To account for these, the shoreline was corrected to a mean tide level using a 0.1 beach slope. According to a previous study (Medellín and Torres-Freyermuth, 2021), values of beach slope within the region range from 0.05 to 0.15. Therefore, an estimation of the inaccuracy due to beach slope was attained by recalculating the BW and the associated CRIfRS for these extreme slopes; results are presented in Figures 4, 8. In both cases, the BW and the CRIfRS, the differences associated to the selection of the beach slope have an effect proportional to the absolute value of the tide during the survey and, therefore, they reached the highest values during the last surveys (October 2017 and December 2017). The asymmetry found in these results is related to the different slope using a maximum change of eleven percentage points while the majority remained beneath three percentage points.
Impact of the removal of coastal structures
The case of Punta San Miguel presented in Section 4.5, allows for an initial evaluation of the performance of interventions on a local scale and highlights how inadequate is the use of CS in the study area. The evolution of the morphology of Punta San Miguel following the deployment of the geotextiles have been well document by Torres-Freyermuth et al. (2019) using high-resolution RTK-DGPS surveys and UAV images. However, a major drawback in the aforementioned study is the lack of information regarding the construction of additional coastal structures (besides the geotextile breakwater) during the studied period. The local study presented in this paper provides further information on the degradation of the beach system, showing the appearance of a series of new structures after the deployment of the geotextile. The new structures corresponded to both, relict structures that emerged after the deployment of the geotextiles due to the shoreline retreat and new structures that were deployed at the beach to overcome erosion. Furthermore, contrary to the previous study, the local study allows the delimitation of the down-drift region highly affected by the intervention which extended more than 400 m.
This breakwater caused a succession of cumulative negative effects in terms of erosion (1 km downdrift) that not only caused damages to homes but triggered the deployment of additional coastal structures (Figure 9B). Although this study finished in December 2017, relative beach change can be estimated for the following years through satellite images from Sentinel-2 (Figure 11). The spatial and temporal variability of the relative beach change confirm the high impact of the structure and how the geotextile destruction (removal) allows the sediment accumulation to propagate as a wave pulse travelling along the coast at a velocity of 230 m/year. The beach condition in the intervention area (>5500 m in Figure 11) becomes more critical after the project removal than before the structure’s deployment.
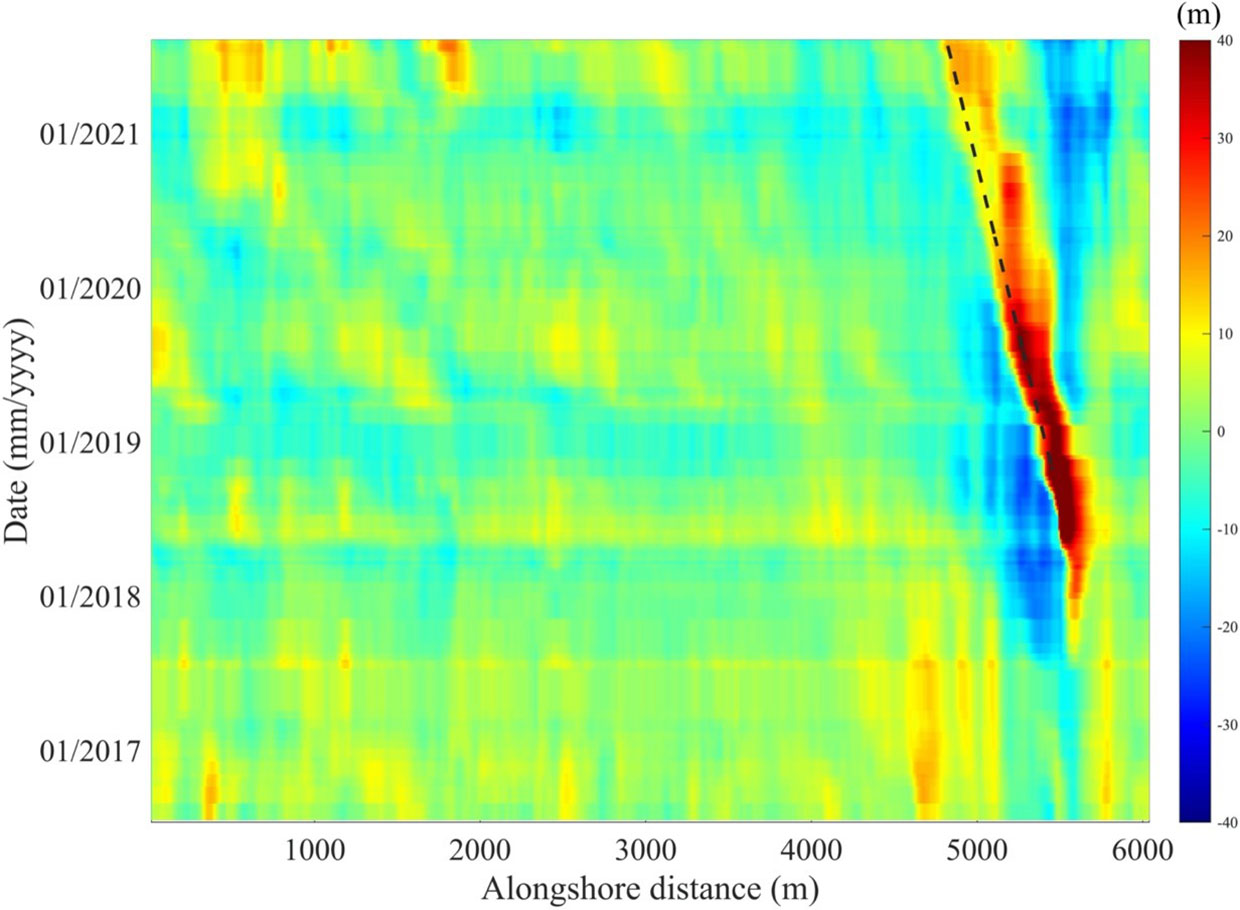
Figure 11 Spatial (alongshore) and temporal evolution of the relative beach width change, estimated from Sentinel-2, in the vicinity of the geotextile breakwater deployed in San Miguel. The dashed lined shows the sediment dispersion pattern after the breakwater destruction.
This study presents evidence that sand beach ecosystems have significant and meaningful value. When they are degraded or depleted, the cost of nourishing the beach or deploying protection structures aimed to protect the properties behind the beach might be greater than the cost of regenerating the dune ecosystem which is far more beneficial.
Conclusions
A coastal resilience index derived from data obtained exclusively from a UAV was defined and applied to a 7.8 km stretch of the Northern Yucatan coast. The evolution of the index was measured through the analysis of six georeferenced data sets spanning a 14-month period. The high-resolution procedure, implemented in this study with the selected 2-m spacing between transects, allows us to investigate the evolution of the CRIfRS at a regional and local scales.
At the regional scale, the percentage of the coast within the Very Low and Low resilience classification increased during the period of study, while those classified as Medium, High, and Very High resilience decreased. The CRIfRS presented an important seasonal variability. During the CACS event season, the resilience at the conserved beach transects increased mainly due to the on-shore sediment transport. During the sea breeze season, the mean wave climate is important for the coastal resilience evolution given that the longshore transport becomes a determining factor. Thus, the CS play a crucial role given the interruption they cause in the sediment transport.
At a local scale, the example of the evolution of the CRIfRS for the stretch of coast surrounding Punta San Miguel was presented. This stretch of coast was subject to a man-made intervention during the study period. This example shows the complexity of implementing mitigation measures in this region where both natural and human disturbances play an important role on beach resilience. In this case, a mitigation measure that was intended to increase coastal resilience, caused major negative impacts on the beach conditions in the short-term. Thus, this approach demonstrates to be suitable to assess the performance of coastal protection projects.
Anthropogenic perturbations play an important role in coastal dynamics in this area and hence a tool is required for assessing their evolution through time. In the study area, beach houses are often built at the foredune location and hence dunes and the associated vegetation are removed. Beach erosion mitigation strategies traditionally employed groins and (more recently) breakwaters that are not suitable for this area due to the net littoral transport. Therefore, the CRIfRS can help to improve decision making in the coastal zone by pointing out the evolution of erosion hot spots, the degradation of the coastal dunes, and the construction of coastal structures that alter the sediment transport. This is contrary to traditional approaches that only focus on increasing the beach width without considering the degree of human degradation and how it evolves in time. A possible solution for this particular region must consider the removal of coastal structures that interrupt the alongshore sediment transport, must ensure that no further illegal structures are built, and must conserve the dune vegetation. However, taking into account the strong influence of alongshore sediment transport in the region, a more sustainable approach will be based on systematic beach nourishment and the regular bypass of sediments accumulated in shelter harbors and the re-design of the shelter harbors to decrease the sediment impoundment (Franklin et al., 2021). The repopulation of vegetated areas in front of beach houses will improve the protective effect of the beach. In this manner, the improvement of the three indicators evaluated by the CRIfRS are ensured. CRIfRS might help to evaluate the evolution of this solution.
The presented methodology to evaluate the CRIfRS is applicable to other locations taking into account that its correct evaluation requires a certain knowledge of the study area that will be addressed mainly to select the threshold values for each of the indicators. In this analysis, digital photogrammetry was used to evaluate the evolution of beach resilience. This methodology can be implemented in future works through the use of UAVs or also using satellite imagery (e.g., Sentinel 2, Pléiades, Planetscope) which will allow monitoring shoreline change and structure deployment with a high temporal resolution. However, satellite images are a useful tool, still in this particular study the smaller structures (<10 m) cannot be resolved although we can see its effect. Therefore, it is important to use the combination of different platforms such as UAVs and satellites. Additionally, multispectral sensors might be able to facilitate the automatization of the vegetation density and change assessment.
Data availability statement
The raw data supporting the conclusions of this article will be made available by the authors, without undue reservation.
Author contributions
EM, AT-F, EO, and GM conceived the study; RR-N, EM, AT-F, EO, and GM obtained/processed the field data collection and participated in writing the first draft. EM, AT-F, EO, GM, RR-N, PS, and IT assisted in the discussion, analysis of the results, writing, and reviewing. All authors contributed to the article and approved the submitted version.
Funding
This work was supported by SEDUMA- UNAM #6605. CONACYT through projects Catedras-1146, INFR-2014-01-225561, the Laboratorio Nacional de Resiliencia Costera [299063], CB-284819 and TAMU-CONACYT 19-20-013. PAPIIT DGAPA UNAM (Project IA101422).
Acknowledgments
The authors would like to thank Gonzalo Martín for IT support. José López González, Juan Alberto Gómez, Johnny Valdez Iuit, and Carlos Cruz Vázquez for additional support in field work. María Fernanda Medina Navarrete helped with the ortho-mosaic construction.
Conflict of interest
The authors declare that the research was conducted in the absence of any commercial or financial relationships that could be construed as a potential conflict of interest.
Publisher’s note
All claims expressed in this article are solely those of the authors and do not necessarily represent those of their affiliated organizations, or those of the publisher, the editors and the reviewers. Any product that may be evaluated in this article, or claim that may be made by its manufacturer, is not guaranteed or endorsed by the publisher.
References
Angnuureng D. B., Almar R., Senechal N., Castelle B., Addo K. A., Marieu V., et al. (2017). Shoreline resilience to individual storms and storm clusters on a meso-macrotidal barred beach. Geomorphology 290, 265–276. doi: 10.1016/j.geomorph.2017.04.007
Appendini C., Salles P., Mendoza E., Lopez J., Torres-Freyermuth A. (2012). Longshore sediment transport on the northern coast of the Yucatan peninsula. J. Coast. Res. 28 (6), 1404–1417. doi: 10.2112/JCOASTRES-D-11-00162.1
Aubrey D. G. (1979). Seasonal patterns of onshore/offshore sediment movement. J. Geophysical Research: Oceans 84 (C10), 6347–6354. doi: 10.1029/JC084iC10p06347
Bai X., Li F., Ma L., Li C. (2022). Weathering of geotextiles under ultraviolet exposure: A neglected source of microfibers from coastal reclamation. Sci. Total Environ. 804, 150168. doi: 10.1016/j.scitotenv.2021.150168
Briggs T. R., Figlus J., Torres-Freyermuth A., Puleo J. A., Warren W., Alrushaid T. (2020). Variability in onshore sediment transport on a natural beach during a central American cold surge event. J. Coast. Res. 36 (3), 487–497. doi: 10.2112/JCOASTRES-D-19-00146.1
Clark A. (2017). Small unmanned aerial systems comparative analysis for the application to coastal erosion monitoring. GeoResJ 13, 175–185. doi: 10.1016/j.grj.2017.05.001
Cuevas-Jiménez A., Euán Ávila J. I., Villatoro Lacouture M. M., Silva Casarín R. (2016). Classification of beach erosion vulnerability on the Yucatan coast. Coast. Manage. 44 (4), 333–349. doi: 10.1080/08920753.2016.1155038
Devoy R. J. N. (2021). “Sea-Level rise: causes, impacts and scenarios for change,” in Reference module in earth systems and environmental sciences (Oxford: Academic Press, UK Elsevier).
Dong Z., Elko N., Robertson Q., Rosati J. (2018). Quantifying beach and dune resilience using the coastal resilience index. Coast. Eng. Proc. 1 (36), 1–8. doi: 10.9753/icce.v36.papers.30
Emanuel K. (2005). Increasing destructiveness of tropical cyclones over the past 30 years. Nature 436 (7051), 686–688. doi: 10.1038/nature03906
Enriquez C., Mariño-Tapia I. J., Herrera-Silveira J. A. (2010). Dispersion in the Yucatan coastal zone: Implications for red tide events. Continental Shelf Res. 30 (2), 127–137. doi: 10.1016/j.csr.2009.10.005
Feagin R. A., Furman M., Salgado K., Martinez M. L., Innocenti R. A., Eubanks K., et al. (2019). The role of beach and sand dune vegetation in mediating wave run up erosion. Estuarine Coast. Shelf Sci. 219, 97–106. doi: 10.1016/j.ecss.2019.01.018
Figueroa-Espinoza B., Salles P., Zavala-Hidalgo J. (2014). On the wind power potential in the northwest of the Yucatan peninsula in Mexico. Atmósfera 27 (1), 77–89. doi: 10.1016/S0187-6236(14)71102-6
Franklin G. L., Medellín G., Appendini C. M., Gómez J. A., Torres-Freyermuth A., López González J., et al. (2021). Impact of port development on the northern Yucatan peninsula coastline. Regional Stud. Mar. Sci. 45, 101835. doi: 10.1016/j.rsma.2021.101835
Gallego-Fernández J. B., Morales-Sánchez J. A., Martínez M. L., García-Franco J. G., Zunzunegui M. (2020). Recovery of beach-foredune vegetation after disturbance by storms. J. Coast. Res. 95 (sp1), 34–38. doi: 10.2112/SI95-007.1
Gonçalves J. A., Henriques R. (2015). UAV photogrammetry for topographic monitoring of coastal areas. ISPRS J. Photogrammetry Remote Sens. 104, 101–111. doi: 10.1016/j.isprsjprs.2015.02.009
Hesp P., Martínez M., da Silva G., Rodríguez N., Gutiérrez E., Humanes A., et al. (2011). Transgressive dunefield landforms and vegetation associations, doña juana, veracruz, Mexico. Earth Surf. Process. Landf. 36, 285–295. doi: 10.1002/esp.2035
Irish J. L., Frey A. E., Rosati J. D., Olivera F., Dunkin L. M., Kaihatu J. M., et al. (2010). Potential implications of global warming and barrier island degradation on future hurricane inundation, property damages, and population impacted. Ocean Coast. Manage. 53 (10), 645–657. doi: 10.1016/j.ocecoaman.2010.08.001
Jiménez J. A., Gracia V., Valdemoro H. I., Mendoza E. T., Sánchez-Arcilla A. (2011). Managing erosion-induced problems in NW Mediterranean urban beaches. Ocean Coast. Manage. 54 (12), 907–918. doi: 10.1016/j.ocecoaman.2011.05.003
Kindermann G., Gormally M. J. (2013). Stakeholder perceptions of recreational and management impacts on protected coastal dune systems: A comparison of three European countries. Land Use Policy 31, 472–485. doi: 10.1016/j.landusepol.2012.08.011
Kombiadou K., Matias A., Ferreira Ó., Carrasco A. R., Costas S., Plomaritis T. (2019). Impacts of human interventions on the evolution of the ria Formosa barrier island system (S. Portugal). Geomorphology 343, 129–144. doi: 10.1016/j.geomorph.2019.07.006
Kurczyn J. A., Appendini C. M., Beier E., Sosa-López A., López-González J., Posada-Vanegas G. (2021). Oceanic and atmospheric impact of central American cold surges (Nortes) in the gulf of Mexico. Int. J. Climatology 41 (S1), E1450–E1468. doi: 10.1002/joc.6779
Masselink G., Lazarus E. D. (2019). Defining coastal resilience. Water 11 (12), 2587. doi: 10.3390/w11122587
Maximiliano-Cordova C., Martínez M. L., Silva R., Hesp P. A., Guevara R., Landgrave R. (2021). Assessing the impact of a winter storm on the beach and dune systems and erosion mitigation by plants. Front. Mar. Sci. 8. doi: 10.3389/fmars.2021.734036
Medellín G., Mariño-Tapia I., Euán-Ávila J. (2015). The influence of a seawall on postnourishment evolution in a sea-breeze-dominated microtidal beach. J. Coast. Res. 31 (6), 1449–1458. doi: 10.2112/JCOASTRES-D-13-00194.1
Medellín G., Torres-Freyermuth A. (2021). Foredune formation and evolution on a prograding sea-breeze dominated beach. Continental Shelf Res. 226, 104495. doi: 10.1016/j.csr.2021.104495
Medellín G., Torres-Freyermuth A., Tomasicchio G. R., Francone A., Tereszkiewicz P. A., Lusito L., et al. (2018). Field and numerical study of resistance and resilience on a sea breeze dominated beach in Yucatan (Mexico). Water 10 (12), 1806. doi: 10.3390/w10121806
Mendoza-González G., Paredes-Chi A., Méndez-Funes D., Giraldo M., Torres-Irineo E., Arancibia E., et al. (2021). Perceptions and social values regarding the ecosystem services of beaches and coastal dunes in Yucatan, Mexico. Sustainability 13 (7), 359. doi: 10.3390/su13073592
Mendoza E. T., Ojeda E., Meyer-Arendt K. J., Salles P., Appendini C. M. (2016). “Assessing coastal vulnerability in Yucatan Mexico,” in Coastal management, (London: ICE publishing) 607–616.
Mendoza E. T., Trejo-Rangel M. A., Salles P., Appendini C. M., Gonzalez J. L., Torres-Freyermuth A. (2013). Storm characterization and coastal hazards in the Yucatan peninsula. J. Coast. Res. (SPEC. ISSUE 65), 790–795. doi: 10.2112/SI65-134.1
Meyer-Arendt K. J. (2001). Recreational development and shoreline modification along the north coast of Yucatan, Mexico. Tourism Geographies 3 (1), 87–104. doi: 10.1080/14616680010008720
Ojeda E., Appendini C. M., Mendoza E. T. (2017). Storm-wave trends in Mexican waters of the gulf of Mexico and Caribbean Sea. Nat. Hazards Earth Syst. Sci. 17 (8), 1305–1317. doi: 10.5194/nhess-17-1305-2017
Pieígay H., Chabot A., Le Lay Y.-F. (2020). Some comments about resilience: from ciclicity to trajectory, a shift in living and nonliving system theory. Geomorphology 367, 106527. doi: 10.1016/j.geomorph.2018.09.018
Ruiz-Beltran A. P., Astorga-Moar A., Salles P., Appendini C. M. (2019). Short-term shoreline trend detection patterns using SPOT-5 image fusion in the northwest of Yucatan, Mexico. Estuaries Coasts 42 (7), 1761–1773. doi: 10.1007/s12237-019-00573-7
Tereszkiewicz P., McKinney N., Meyer-Arendt K. J. (2018). Groins along the northern Yucatan coast. J. Coast. Res. 34 (4), 911–919. doi: 10.2112/JCOASTRES-D-17-00062.1
Thieler E. R., Hammar-Klose E. S. (1999). “National assessment of coastal vulnerability to sea-level rise: Preliminary results for the U.S. Atlantic coast,” in Open-file report. (United Sates of America: USGS) doi: 10.3133/ofr99593
Torres-Freyermuth A., Medellín G., Mendoza E. T., Ojeda E., Salles P. (2019). Morphodynamic response to low-crested detached breakwaters on a sea breeze-dominated coast. Water 11 (4), 635. doi: 10.3390/w11040635
Torres-Freyermuth A., Medellín G., Salles P. (2021). Human impact on the spatiotemporal evolution of beach resilience on the northwestern Yucatan coast. Front. Mar. Sci. 8 (111). doi: 10.3389/fmars.2021.637205
Torres-Freyermuth A., Puleo J. A., DiCosmo N., Allende-Arandía M. E., Chardón-Maldonado P., López J., et al. (2017). Nearshore circulation on a sea breeze dominated beach during intense wind events. Continental Shelf Res. 151, 40–52. doi: 10.1016/j.csr.2017.10.008
Turner I. L., Harley M. D., Drummond C. D. (2016). UAVs for coastal surveying. Coast. Eng. 114, 19–24. doi: 10.1016/j.coastaleng.2016.03.011
Valle-Levinson A., Mariño-Tapia I., Enriquez C., Waterhouse A. F. (2011). Tidal variability of salinity and velocity fields related to intense point-source submarine groundwater discharges into the coastal ocean. Limnology Oceanography 56 (4), 1213–1224. doi: 10.4319/lo.2011.56.4.1213
Velasquez-Montoya L., Sciaudone E. J., Harrison R. B., Overton M. (2021). Land cover changes on a barrier island: Yearly changes, storm effects, and recovery periods. Appl. Geogr. 135, 102557. doi: 10.1016/j.apgeog.2021.102557
Warrick R. A., Oerlemans J., Beaumont P., Braithwaite R. J., Drewry D. J., Gornitz V., et al. (1990). “Sea Level rise,” in Climate change (Cambridge, UK: Cambridge University Press), 257–282.
Zavala-Hidalgo J., Morey S. L., O'Brien J. J. (2003). Seasonal circulation on the western shelf of the gulf of Mexico using a high-resolution numerical model. J. Geophysical Research: Oceans 108 (C12), 1–19. doi: 10.1029/2003JC001879
Keywords: Beach resilience, UAVs flights, coastal structures, beach width, coastal vegetation
Citation: Mendoza ET, Torres-Freyermuth A, Ojeda E, Medellín G, Rioja-Nieto R, Salles P and Turki I (2022) Seasonal changes in beach resilience along an urbanized barrier island. Front. Mar. Sci. 9:889820. doi: 10.3389/fmars.2022.889820
Received: 04 March 2022; Accepted: 08 September 2022;
Published: 23 September 2022.
Edited by:
Felice D’Alessandro, University of Milan, ItalyReviewed by:
Robert V. Rohli, Louisiana State University, United StatesPatrick Biber, University of Southern Mississippi, United States
Copyright © 2022 Mendoza, Torres-Freyermuth, Ojeda, Medellín, Rioja-Nieto, Salles and Turki. This is an open-access article distributed under the terms of the Creative Commons Attribution License (CC BY). The use, distribution or reproduction in other forums is permitted, provided the original author(s) and the copyright owner(s) are credited and that the original publication in this journal is cited, in accordance with accepted academic practice. No use, distribution or reproduction is permitted which does not comply with these terms.
*Correspondence: Ernesto Tonatiuh Mendoza, ZXJuZXN0by50b25hdGl1aEB1bml2LXJvdWVuLmZy
 Ernesto Tonatiuh Mendoza
 Alec Torres-Freyermuth
 Elena Ojeda
 Gabriela Medellín
 Rodolfo Rioja-Nieto
 Paulo Salles
 Imen Turki1
