
95% of researchers rate our articles as excellent or good
Learn more about the work of our research integrity team to safeguard the quality of each article we publish.
Find out more
ORIGINAL RESEARCH article
Front. Mar. Sci. , 22 July 2022
Sec. Aquatic Physiology
Volume 9 - 2022 | https://doi.org/10.3389/fmars.2022.889778
This article is part of the Research Topic Nutritional Physiology of Aquacultured Species View all 12 articles
 Weiwen Zhou1*
 Kristin Hamre2Elvis Chikwati1
 Katerina Kousoulaki3
 Ingrid Lein4
 Gerd Marit Berge4
 Øystein Sæle2
 Trond M. Kortner1
 Åshild Krogdahl1
Cultivation of lumpfish (Cyclopterus lumpus) as lice cleaner fish for salmon is now expanding. For successful cultivation of a new species, understanding the basic biology of digestive functions is vital to facilitate and optimize diet formulation. This paper presents results from two experiments conducted to deepen our knowledge on lumpfish intestine physiology. Experiment 1 was a 42-day feeding trial in which lumpfish were fed twelve different diets in the following ranges of macronutrients: Protein 43-68%, lipid 4-17%, and carbohydrate 6-17%. Intestinal tissue, gut content and liver were sampled from 6 fish per tank. The results showed that with increasing lipid level and corresponding decrease in protein level, there was a linear decrease in several of the observed biomarkers, including activity of brush border membrane digestive enzymes, expression of genes related to nutrient digestion and transport, ion exchange, immune regulation, and cell remodeling. Increased intracellular accumulation of lipid (steatosis) was observed in gut and liver with increasing dietary lipid level. Fewer effects were observed for increased dietary carbohydrate and corresponding decreased protein level. Experiment 2 was a two-week feeding trial for estimation of macronutrient digestibility in which lumpfish were fed three diets, all containing 55% crude protein, with lipid to carbohydrate ratio of the low lipid diet of 7.5%/18.3%, the medium lipid diet of 13.8%/14.6%, and high lipid diet of 18.1%/9.5%. Fecal samples were collected as pooled samples per tank. These results showed that fatty acid digestibility’s increased as dietary lipid level increased. Of note, starch digestibility decreased greatly as starch level increased, whereas protein digestibility did not change as lipid or starch level varied. Taken together, the present studies indicated that increasing lipid level in the diet with corresponding decrease in protein level affects digestion, absorption, and immune responses in the lumpfish intestine. Variation in dietary carbohydrate to protein level showed less effects, possibly due to low starch digestibility which makes the variation in available carbohydrates much less than the variation in the analysed level of dietary carbohydrates.
Cultivation of lumpfish (Cyclopterus lumpus) expanded rapidly during the past decade, i.e. approximate 34 million individual fish for delousing of Atlantic salmon were produced in Norway in 2020 (statistics by Norwegian Directorate of Fisheries, 2021), and in Scotland the number of lumpfish produced was 6.6 million (Munro, 2020). For successful cultivation of a new species detailed knowledge of several physiological aspects is necessary, particularly regarding digestive physiology and nutrient requirement. Powell et al. stated that one third of lumpfish die of starvation within a few weeks in salmon cages (Powell et al., 2018), indicating supplementary feed is necessary for lumpfish after deployment. This may be associated with its feeding preference. Lumpfish is an opportunistic, omnivorous feeder that not only feed on sea lice after deployment (Powell et al., 2018). Naturally, lumpfish seem to predominantly prey on crustacean, followed by molluscs and small fish (Ingolfsson and Kristjansson, 2002; Imsland et al., 2015). A diet of high protein content seems to be optimal in terms of its natural preference. Although plant ingredient tolerance has been tested for lumpfish (Willora et al., 2020; Willora et al., 2021), studies investigating nutrient requirement of lumpfish are rare. No relevant scientific information is available currently for the feed producers. Present commercial diets seem to be produced based on knowledge from other fish species as well as experience generated from inhouse, unpublished trials and commercial production of lumpfish.
Present knowledge of digestive physiology in lumpfish is very limited. Zhukova and Stroganov (Zhukova and Stroganov, 2021) described the anatomical structure of the alimentary tract in lumpfish, with focus on esophagus and the stomach. The oesophagus is reported to be relatively short with a thick muscular wall whose thickness may increase more than two folds during contraction. The stomach was observed with well-developed gastric glands and distinguishably divided into cardiac, fundus, and pyloric parts. Intestinal length was estimated to be 1.2 times of the standard body length, and the histological structure found the same throughout its entire length. Some studies on lumpfish employed histopathological evaluation of intestine as an indicator of inflammatory responses after changes in diet composition or feeding strategy (Imsland et al., 2018; Imsland et al., 2019a; Imsland et al., 2019b). The observed responses, however, were mild or none.
The gut is primarily an organ for digestion and absorption of nutrients. For fish, it also serves as an important organ for osmoregulation (Grosell, 2006; Gregorio and Fuentes, 2018). As the intestinal epithelial surface is constantly exposed to the elements of the external environment, it therefore must also provide defence, which herein refers to the physical barrier and immune response, against alien components and organisms (Zhu et al., 2013; Garcia-Hernandez et al., 2017). Studies in other fish species have clearly demonstrated how diet composition can influence nearly all aspects of the intestine, i.e., digestion and absorption (Krogdahl et al., 1999; Silva et al., 2010; Gu et al., 2014), osmoregulation (Taylor and Grosell, 2006), physical barrier (Hu et al., 2016) and immune regulation (Krogdahl et al., 2015). The present study was therefore conducted to strengthen knowledge of effects of variation in macronutrient diet composition on gut function and thereby to gain information necessary for successful cultivation of lumpfish.
The results presented herein are based on investigation of samples collected in two feeding experiments. The main part of the results stems from a feeding experiment (E1) conducted to estimate optimal balance between protein, lipid, and carbohydrates in diets for lumpfish of 15-50 g, based on observations of growth and feed conversion ratio, physiological characteristics of the intestine, mucosal and systemic immune responses. Results regarding growth performance, with more than three times increase in weight, body composition, welfare scores, and systemic immune responses are published in the paper of Hamre et al. (Hamre et al., 2022) with the following conclusion: The best growth and welfare were obtained in fish fed a diet with 55% protein, 17% lipid and 6% carbohydrates. However, to meet the wish from farmers of reducing growth, diets for lumpfish weighing from 10-50 g body weight should contain approximately 55% protein, minimum 10% lipid and maximum 10% carbohydrate. The work presented in the former paper also stated that the latter composition would be suitable also for lumpfish of 1.7-10g.
The present study comprises results regarding characteristics of the intestinal tract based on samples from E1. However, as the E1 experiment did not give sufficient fecal sample material for estimation of nutrient digestibility, an additional experiment (E2) was conducted addressing specifically macronutrient digestibility, the results of which are also included in the present paper. In addition to the macronutrient digestibility analyses, the lumpfish intestine was characterized in detail by histomorphological evaluations, digestive enzyme activity and bile acid assays, as well as by expression profiling of genes involved in nutrient digestion and transport, ion exchange, immune regulation, and cell remodeling. Liver structure and function was also evaluated to provide information on nutrient turnover and integrated metabolism.
The feeding trials were conducted in accordance with Norwegian laws and regulations concerning experiments with live animals. Experiments were overseen by the Norwegian Food Safety Authority.
This experiment evaluated effects of diet composition on digestive functions in lumpfish with an initial body weight of 15 g growing to 50 g. The experiment was conducted based on a three-component mixture design (Cornell, 2011), set up with Design Expert ver. 8.0.4. (Stat-Ease Inc. MN, USA). As it is a special type of response surface methodology for experimental design, for which replicates are not necessary (Hamre et al., 2003; Hamre and Mangor-Jensen, 2006; Hamre et al., 2013), we set one tank for most diets. In total, twelve different diets were formulated and fed to fish in one tank for each one of 11 diets. The 12th diet was fed to fish in 3 tanks to obtain a measure of tank variation. The experimental diets were produced at the Aquafeed Technology Centre of Nofima in Bergen, Norway, in the same production series, using a Wenger TX-52 co-rotating twin-screw extruder with 150 kg/h capacity. The dietary oil was added in the different feed mixes prior to extrusion. The settings of the extruder were “normal”; i.e., the production can be upscaled to a feed factory (extruder settings considered: screw configuration (D), die opening (1.5 mm), knife speed (2671-3108 rpm), feed rate (110-150 kg/h), at the DDC the amount of added steam was 10-12 kg/h, and water 0.16-0.18 kg/min, and in the extruder there was added 0.24-0.45 kg/min water and no steam. The ingoing temperature of the feed mass in the extruder was 79-84°C and the outgoing 103-118°C. The produced pellets were air-dried in a carousel dryer (Model 200.2, Paul Klöckner GmbH, Nisteral, Germany) at 85°C for 10-12 min to a final moisture level between 6.36 and 8.26%. The size of the dried pellets was approx.: 1:5 − 1:7 × approx.: 2:3mm with bulk density between 443 and 582 g/L. Diet recipes and proximate composition are shown in Table 1 and Figure 1 illustrates the dietary design of experiment E1. The following ranges of macronutrients were covered: Protein 43-68%, lipid 4-17%, and carbohydrate 6-17%. For most observed biomarkers, samples from all treatments were investigated. For some, due to resource restrictions, it was possible to investigate only selected macronutrient combinations.

Table 1 Diet formulation and proximate composition for experiment 1 (E1).
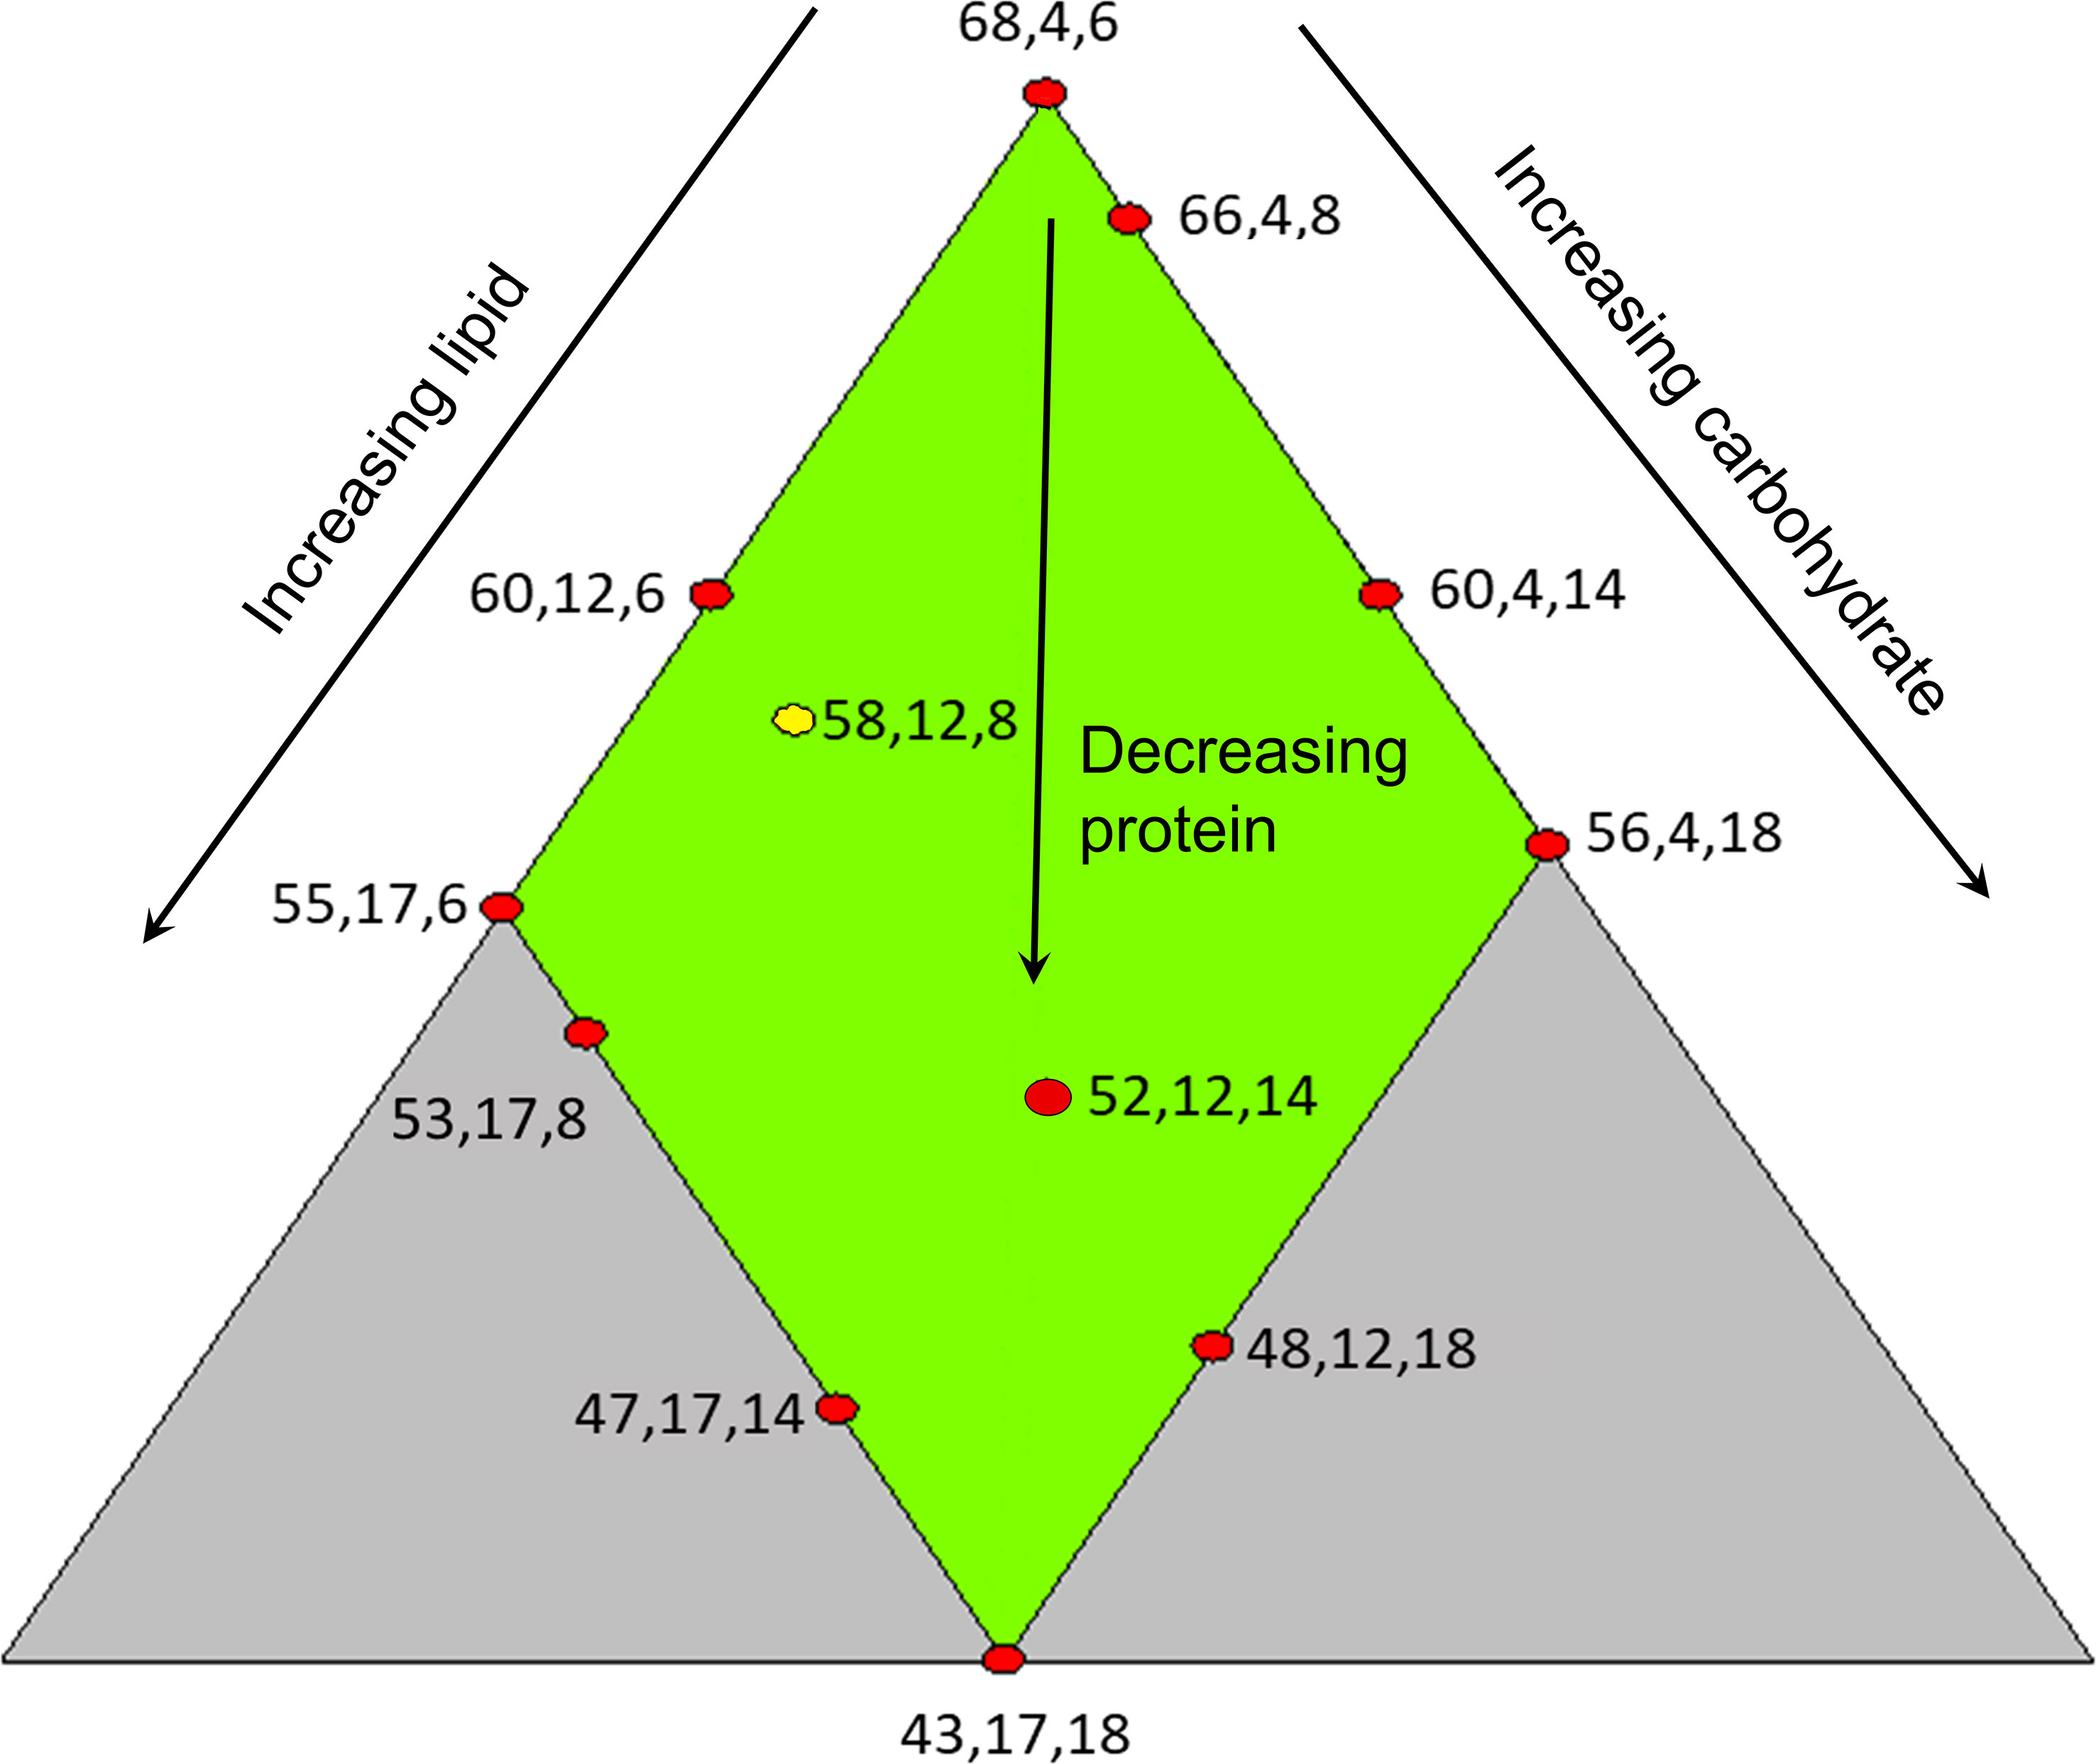
Figure 1 Illustration of feed design. Each feed is indicated with a red dot and numbers beside the dot presenting macronutrient composition in the following sequence, from left to right, level of crude protein, crude lipid and total carbohydrates. The yellow dot represents diet was fed to fish in three tanks.
Details of the experimental conditions are published in (Hamre et al., 2022). In brief, the fish were produced by a commercial hatchery and transported to Nofima’s research facility at Sunndalsøra, Norway. Fourteen 150 L conical tanks were used, each with 90 fish. Dead fish were removed daily, counted, and weighed. Feed was distributed continuously (15 sec feeding every 5 minutes) using small belt automatic feeders above each tank. The fish were fed to satiation, and the feed rations increased from 30 to 68 g/tank in tanks according to appetite. The fish were fed 1-1.6mm pellets until 20 g size and 1.6-2.3mm until the end of the experimental period. Due to the small pellet sizes, feed intake could not be recorded by our system. The temperature was set to a mean of 9.8°C (min 8.9°C, max 10.6°C). The water flow was set to 4 l/min and oxygen was adjusted to 80-100% by adding oxygen to the water holding tank when needed. Temperature was recorded daily, and oxygen was measured and adjusted 2-3 times per week. As the trial was run in a flow-through system, ammonia nitrogen and nitrate nitrogen were not recorded.
An additional experiment, E2, was conducted to gain knowledge on macronutrient digestibility. Starch digestibility was of particular interest as great variations have been observed between other species (Krogdahl et al., 2004). Feed formulations are shown in Table 2. The diets were formulated to contain 55% crude protein with low (Diet 1), medium (Diet 2) and high (Diet 3) levels of lipid, and with carbohydrate level of contrary variation to lipid level. The same ingredients were used for all three diets, and the different lipid and carbohydrate levels were balanced by differing the dietary inclusion levels of lipid and wheat meal, respectively. The diets were produced at Aquafeed Technology Centre of Nofima in Bergen, Norway. Each of the three diets were fed to fish in triplicate tanks for a period of 14 days.
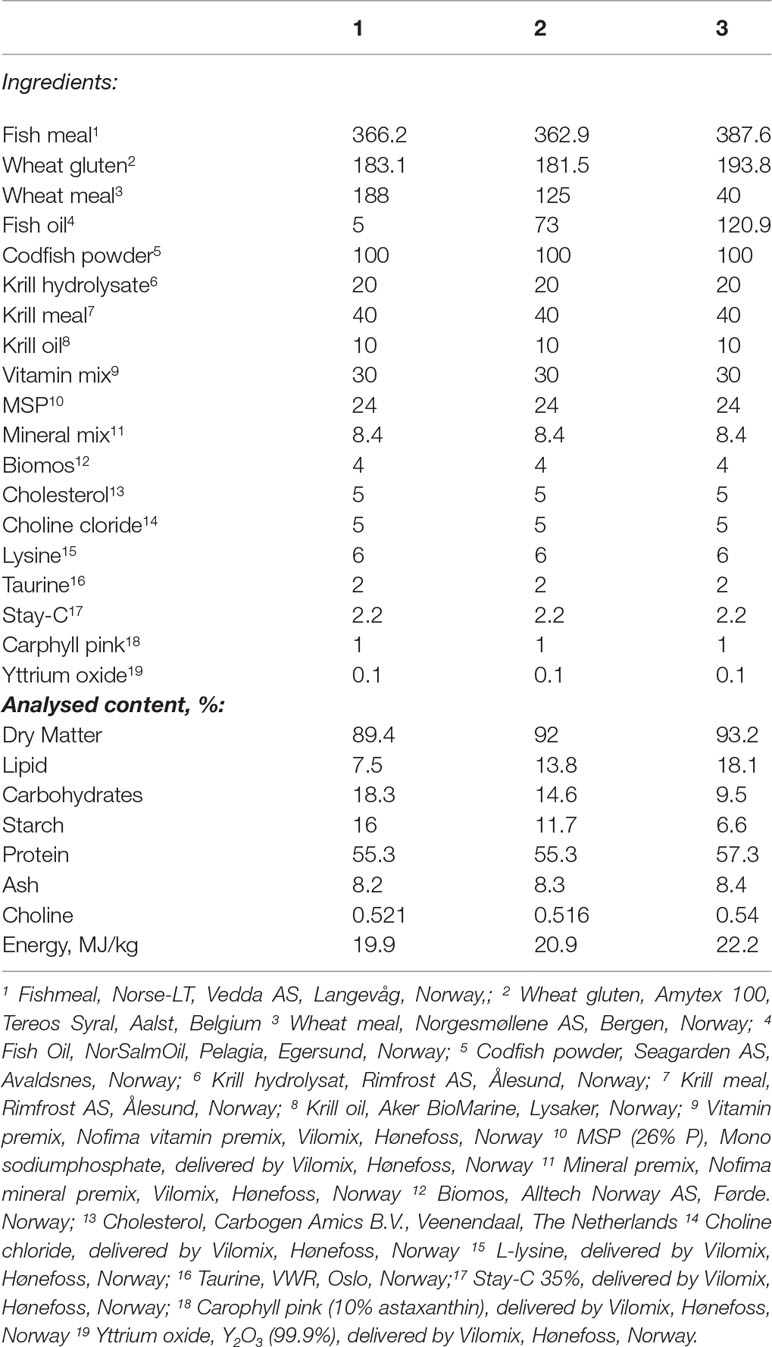
Table 2 Diet formulation and proximate composition for experiment 2 (E2), g/kg.
Lumpfish with an average body weight of around 100 g were distributed to 9 tanks, 100 individuals per tank, providing a biomass of around 10 kg in each tank. The tanks were cylindrical, with flat bottom and black inner surface, and an efficient water volume of 350 L. All tanks were equipped with automatic belt feeders for distribution of feed, and a separate light source mounted on each tank. Inlet water was run through a 10 μm filter and UV treated. Water flow was set at 12 L/min and oxygen saturation was kept within 80-100%. Average water temperature was 11.6°C (10.9-12.4°C).
The trial was terminated after 42 days. At termination of the experiment, 6 fish from each tank were sampled at random, weighed, and intestinal tissues collected for analyses. The intestine was cleaned of mesenteric fat and divided into three segments, i.e., pyloric intestine including the pyloric caeca (PI), mid intestine (MI) and distal intestine (DI) (See Supplementary Figure S1). Each segment was opened longitudinally. Limited by fish size, gut content was only collected from MI, where the amount was enough for analysis. The collected gut content of MI was snap frozen in liquid nitrogen and stored at -80°C before further processing and analysis of activity of digestive enzymes and concentration of bile salts. Samples of tissue from all sections, located in the middle of the sections were collected for RNA extraction (submerged in RNAlater solution, incubated at 4°C for 24 h and stored at -20°C) and histomorphological evaluation (fixed in 4% phosphate-buffered formaldehyde solution for 24 h and transferred to 70% ethanol for storage). The remaining tissue was collected for brush border digestive enzyme assessment, snap frozen in liquid nitrogen and stored at -80°C.
The trial was terminated after 14 days, when fecal samples were collected as pooled samples per tank. Because of the very short length of DI of lumpfish, it cannot be stripped for feces like salmonids, therefore fish were euthanized by an overdose of anesthetic (Tricaine mesylate, MS-222) and the total content of the DI was collected by dissecting the intestine.
The intestinal tissue samples were thawed and homogenized (1:20 w/v) in ice-cold 2 mM Tris/50 mM mannitol, pH 7.1, containing phenyl-methyl-sulphonyl fluoride (P-7626, Sigma, Norway) as serine protease inhibitor. The homogenates were sonicated, aliquoted and stored at -80°C until analysis.
Leucine aminopeptidase (LAP) and maltase were the brush border digestive enzymes assessed. The activity of LAP was measured employing the Sigma procedure no. 251 (Krogdahl et al., 2003). L-leucyl-b-naphthylamide is used as the substrate and is reacted with diluted homogenates at 37 °C for 1 h. The reaction is terminated by HCl. A subsequent color reaction is done by adding sodium nitrite, ammonium sulfate and N-(1-Naphthyl)ethylenediamine dihydrochloride in order at room temperature. A standard curve is made for calculation by measuring serial diluted 2-Naphthylamine. The color absorbance is read at 580nm. To measure maltase activity, the method described by Dahlqvist (Dahlqvist, 1970) was applied. Maltose is used as substrate and is reacted with diluted homogenates at 37 °C for 1 h. The reaction is terminated and colorized by TGO solution (mixture of Trizma buffer, detergent, o-dianisidine and peroxidase). A standard curve is made for calculation by measuring serial glucose dilution. The color absorbance is read at 480nm.
Activity of trypsin, amylase and lipase, and total bile salt level were measured in pooled freeze-dried content from MI. Trypsin activity was determined colorimetrically (Kakade et al., 1973). Benzoylarginine p-nitroanilide (Sigma no. B-4875, Sigma Chemical Co., St. Louis, MO) is used as substrate and is reacted to freeze-dried content solution at 37 °C for 10 min. The reaction is terminated by 30% acetic acid. The color absorbance is read at 410nm. Absorbance variance between sample and blank is defined as enzyme unit instead of international enzyme unit. Lipase activity was determined as described in (Brockman, 1981). 4-Nitrophenyl myristate (Sigma 70124, Sigma Chemical Co., St. Louis, MO) is used as substrate and the reaction temperature is 37 °C. The absorbance is read at 405nm every 30 sec for 7 times. The enzyme unit is defined as absorbance variance per minute. Amylase was determined as described by (Froystad et al., 2006), using a Randox amylase assay kit (AY3805, Randox Laboratories Ltd., Crumlin, UK). The kit employs Ethylidene PNPG7 method (Kruse-Jarres et al., 1989) for α-amylase measurement. Ethylidene-blocked p-nitrophenyl-maltoheptaoside is the substrate in the enzyme assay reagent and reaction temperature is 25°C. Absorbance is read at 405nm after 20, 30 and 40 min of reaction and the enzyme unit is defined as absorbance variance per minute. Bile salt level was determined using the enzyme cycling amplification/Thio – NAD method (Inverness Medical, Cheshire, UK) in the ADVIA®1650 Chemistry System (Siemens Healthcare Diagnostics Inc.) at the Central Laboratory of the Faculty of Veterinary Medicine, Norwegian University of Life Sciences, Oslo. The assay measures total 3αOH of cholic acid, whereas the reported results indicate the corresponding level of bile salt as taurocholate.
Total RNA was extracted from tissue samples of PI, MI, DI, and liver. (~20 mg) of all fish using Trizol reagent (PureLink™ RNA Mini Kit, Thermo Fisher Scientific). RNA was purified by an on-column DNase kit (PureLink™ DNase Set, Thermo Fisher Scientific) according to the manufacturer’s protocol. RNA purity and concentration were measured using the Epoch Microplate Spectrophotometer (BioTeK Instruments, Winooski, USA). The RNA integrity was verified by the 2100 Bioanalyzer (Agilent Technologies, Santa Clara, CA, USA) in combination with RNA Nano Chip (Agilent Technologies, Santa Clara, CA, USA). First-strand complementary DNA (cDNA) was synthesized using 1.0 μg RNA from two fish of the same tank, namely 0.5 μg RNA of each two fish were combined as a unit of RNA sample for cDNA synthesis. The reaction volume was 20 μl, including 4 μl mastermix of from the kit SuperScript™ IV VILO™ Master Mix (Thermo Fisher Scientific). Negative controls were performed in parallel by omitting RNA or enzyme.
Lumpfish mRNA sequences were derived from NCBI database. The selected genes include elongation factor 1-alpha (ef1a), beta-actin (bactin), hypoxanthine-guanine phosphoribosyltransferase 1 (hprt1), tubulin beta chain (tubb), sucrase-isomaltase (si), solute carrier family 27 member 4 (slc27a4), solute carrier family 15 member 1 (slc15a1), niemann-pick C1-like 1 (npc1l1), solute carrier family 12 member 1 (slc12a1), tight junction protein 1a (tjp1a1), occludin (occludin), cyclooxygenase-2 (cox2), immunogobulin M (igm), inhibitor of nuclear factor kappa B kinase subunit beta (ikbkb), complement component 5 (c5), chemokine (C-X-C motif) ligand 19 (cxcl19), tumor necrosis factor alpha (tnfa), nuclear factor kappa-light-chain-enhancer of activated B cells (nfkb), transcription factor p65 (rela), major histocompatibility complex II (MHCII), matrix metallopeptidase 13 (mmp13) and proliferating cell nuclear antigen (pcna). The selected genes cover the functions of disaccharide digestion (si), nutrient transport (slc27a4, slc15a1, npc1l1), ion-exchange (slc12a1), tight junction forming (tjp1a1, occludin), immune regulation (cox2, igm, ikbkb, c5, cxcl19, tnfa, nfkb, rela, MHCII, mmp13) and cell proliferation (pcna). Reference gene candidates include ef1a, tubb, hprt1 and bactin.
Primer information are shown in Supplementary Table S2. The qPCR primers were designed using the Primer-BLAST tool of NCBI. All primer pairs were first used in gradient reactions to determine optimal annealing temperatures. To confirm amplification specificity, the PCR products from each primer pair were subjected to melting curve analysis and visual inspection of the PCR products by agarose gel electrophoresis. PCR efficiency for each gene assay was determined using 2-fold serial dilutions of randomly pooled complementary DNA.
Expression of target genes were analyzed using the LightCycler 96 (Roche Diagnostics, Basel, Switzerland) with a 10-μl DNA amplification reaction. Each 10-μl DNA amplification reaction contained 2 μl PCR grade water, 2 μl of 1:10 diluted cDNA template, 5 μl LightCycler 480 SYBR Green I Master Mix (Roche Diagnostics) and 0.5 μl (10 μM) of each forward and reverse primer. Each sample was assayed in duplicate, including a no-template control. The three-step qPCR run included an enzyme activation step at 95°C (5 min), 40 cycles at 95°C (10 s), annealing temperature (10 s), and 72°C (15 s) and a melting curve step. The mean normalized expression of the target genes was calculated from raw Cq values (Muller et al., 2002). Reference genes selected was done in terms of its stability among different fish (Kortner et al., 2011). The chosen reference genes are: ef1a, tubb and hprt1 for PI and liver, ef1a, bactin and hprt1 for MI and tubb, bactin and hprt1 for DI.
The samples fixed for histological evaluation from all intestinal segments collected, i.e., PI, MI, and DI, were processed using standard histological methods and stained with hematoxylin and eosin (H&E). The histological sections were estimated to describe the general structure as well as assessing for any morphological changes in the intestinal mucosa such as inflammation. Since the relative weights (OSI) of intestinal sections and liver seemed to vary more specifically to dietary lipid content, histological examination was conducted for the six sampled fish fed the following four diets spanning from low to high lipid content: i.e., 6, 21, 28, and 38 g lipid/100g protein (Diet 1, 5, 3 and 12, respectively). The evaluated morphological characteristics included changes in cellularity of submucosa and lamina propria, enterocyte supranuclear vacuolization and numbers of intra-epithelial lymphocytes. The degree of changes was graded as normal, mild, moderate, marked and severe, and was scored from 0 to 4, respectively.
Samples of the feed and feces were analyzed at the Department of Animal and Aquacultural Sciences, Norwegian University of Life Sciences, Ås, Norway. Dry matter was determined by oven drying at 105°C, 16–18 h, to constant weight. Nitrogen was determined using the Kjeldahl method (Kjeltech Auto Analyser, Tecator, Höganäs, Sweden) (crude protein: N×6.25), fatty acid composition by FAME analysis (O’Fallon et al., 2007) in a Trace GC Ultra with auto injector (Thermo Scientific), and starch was measured as glucose after hydrolysis by α-amylase and amyloglucosidase, followed by glucose determination by the ‘Glut-DH method’. Yttrium was analyzed by dissolution of ashed samples with hydrochloric acid and nitric acid by heating, then dissolved in 5% nitric acid. Yttrium was then detected with an ICP-AEF, Optima 3000 V (Perkin Elmer, USA).
Organosomatic indices of the intestinal sections = tissue weight/body weight × 100.
Apparent digestibility coefficient (referred to as digestibility in the text) =
100 – 100 × (% nutrient in feces/% nutrient in diet) × (% Y2O3 in diet/% Y2O3 in feces)
Models describing the effects of macronutrient composition on the different responses were calculated using the software Design Expert ver. 8.0.4. (Stat-Ease Inc. MN, USA). Different models were fitted to the data and the recommended model with the best fit was chosen. When no model had a significant fit to the response data, only mean and standard deviation of the total dataset are given. Models and coefficients were considered significant at p < 0.05. Models where 0.05< p <0.1 were considered a trend and presented.
Differences in histological scores for the various evaluated morphological characteristics were analyzed using ordinal logistic regression. When score differences were only 2 levels, statistical significance was assessed using the Fisher exact test. Post hoc analysis for significant test results was conducted using the chi-square test (chisq.post.hoc function of Fifer package in R). Differences were considered significant at p < 0.05.
As the present study is among the very first studies investigating the physiology of the intestinal tract of lumpfish, some summary statements regarding the general characteristics are given: The average OSI of the three intestinal sections, PI, MI, and DI, was 2.1, 1.6, and 0.6% of body weight and they comprised 49, 38, and 13% of the intestinal weight, respectively. Of total LAP capacity, i.e., units per kg fish, 34, 50, and 16% were observed in PI, MI, and DI, respectively, and of maltase capacity, 48, 40, and 12%. Digestive enzyme activities in chyme, results only available from MI, were as follows: trypsin activity averaged 25 U/mg DM, amylase 2 U/mg DM, and lipase 0.27 U/mg DM. Bile salt concentration in chyme from MI was 49 mg/g DM. Average digestibility, as measured in collected feces, was for protein: 83%, sum of fatty acids: 95%, and starch: 64%.
In the following content we have chosen to present the results and comments as follows: For results showing linear relationship to the macronutrient levels, effects of decreasing protein level are presented first, in light of possible effects of protein deficiency at low dietary levels. Thereafter effects of increasing level of lipid are presented and finally effects of increasing level of carbohydrates. For results showing more complicated relationships, the comments are presented as found most suitable for the outcome of the data evaluation. Linear relationships were found for most of the observed variables, but for those explicitly mentioned in the text showing no relationship with diet macronutrient composition or following a model other than a linear one. To check model parameters, one can refer to Tables 3, 4, and Supplementary Tables S3, S4 listing the coefficients derived from the model equation.
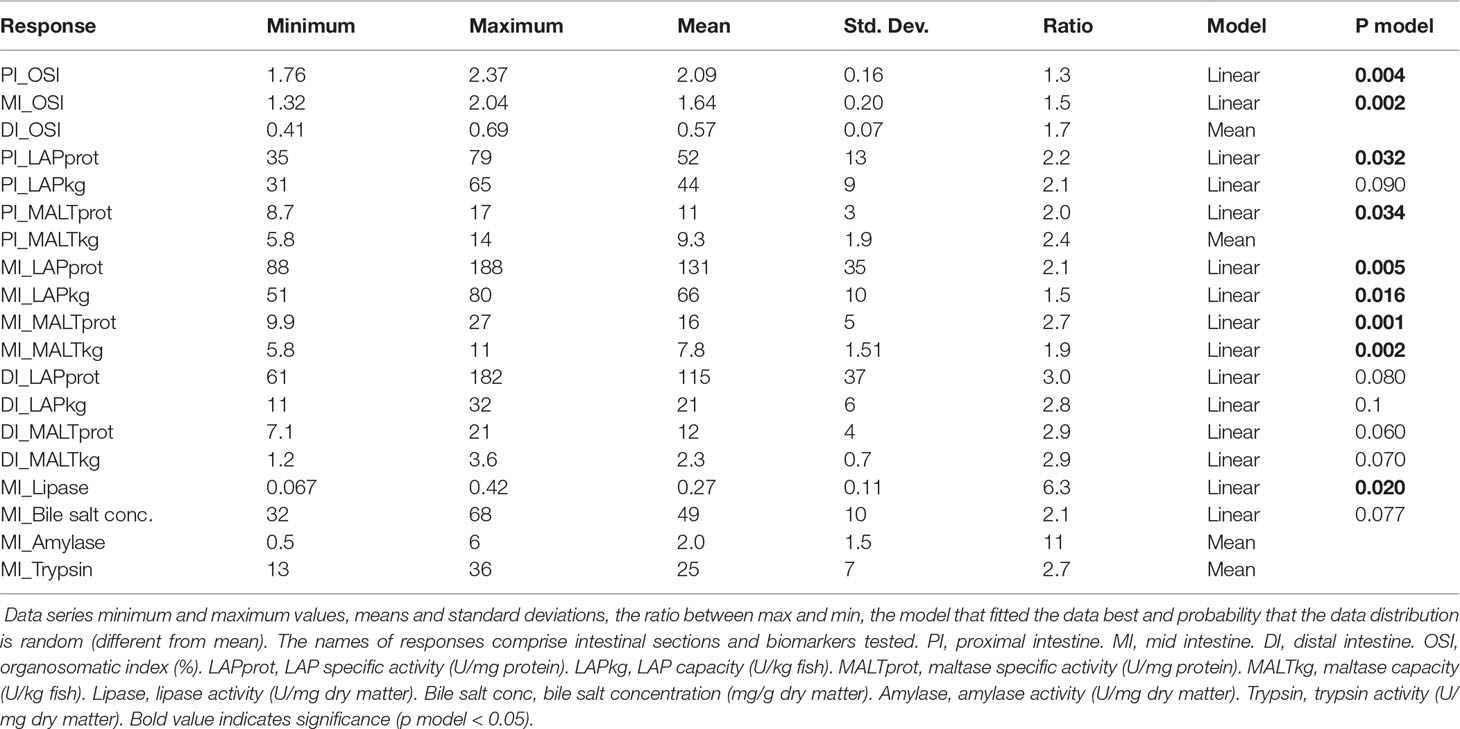
Table 3 Result summary: Organ indices and digestive enzymes.
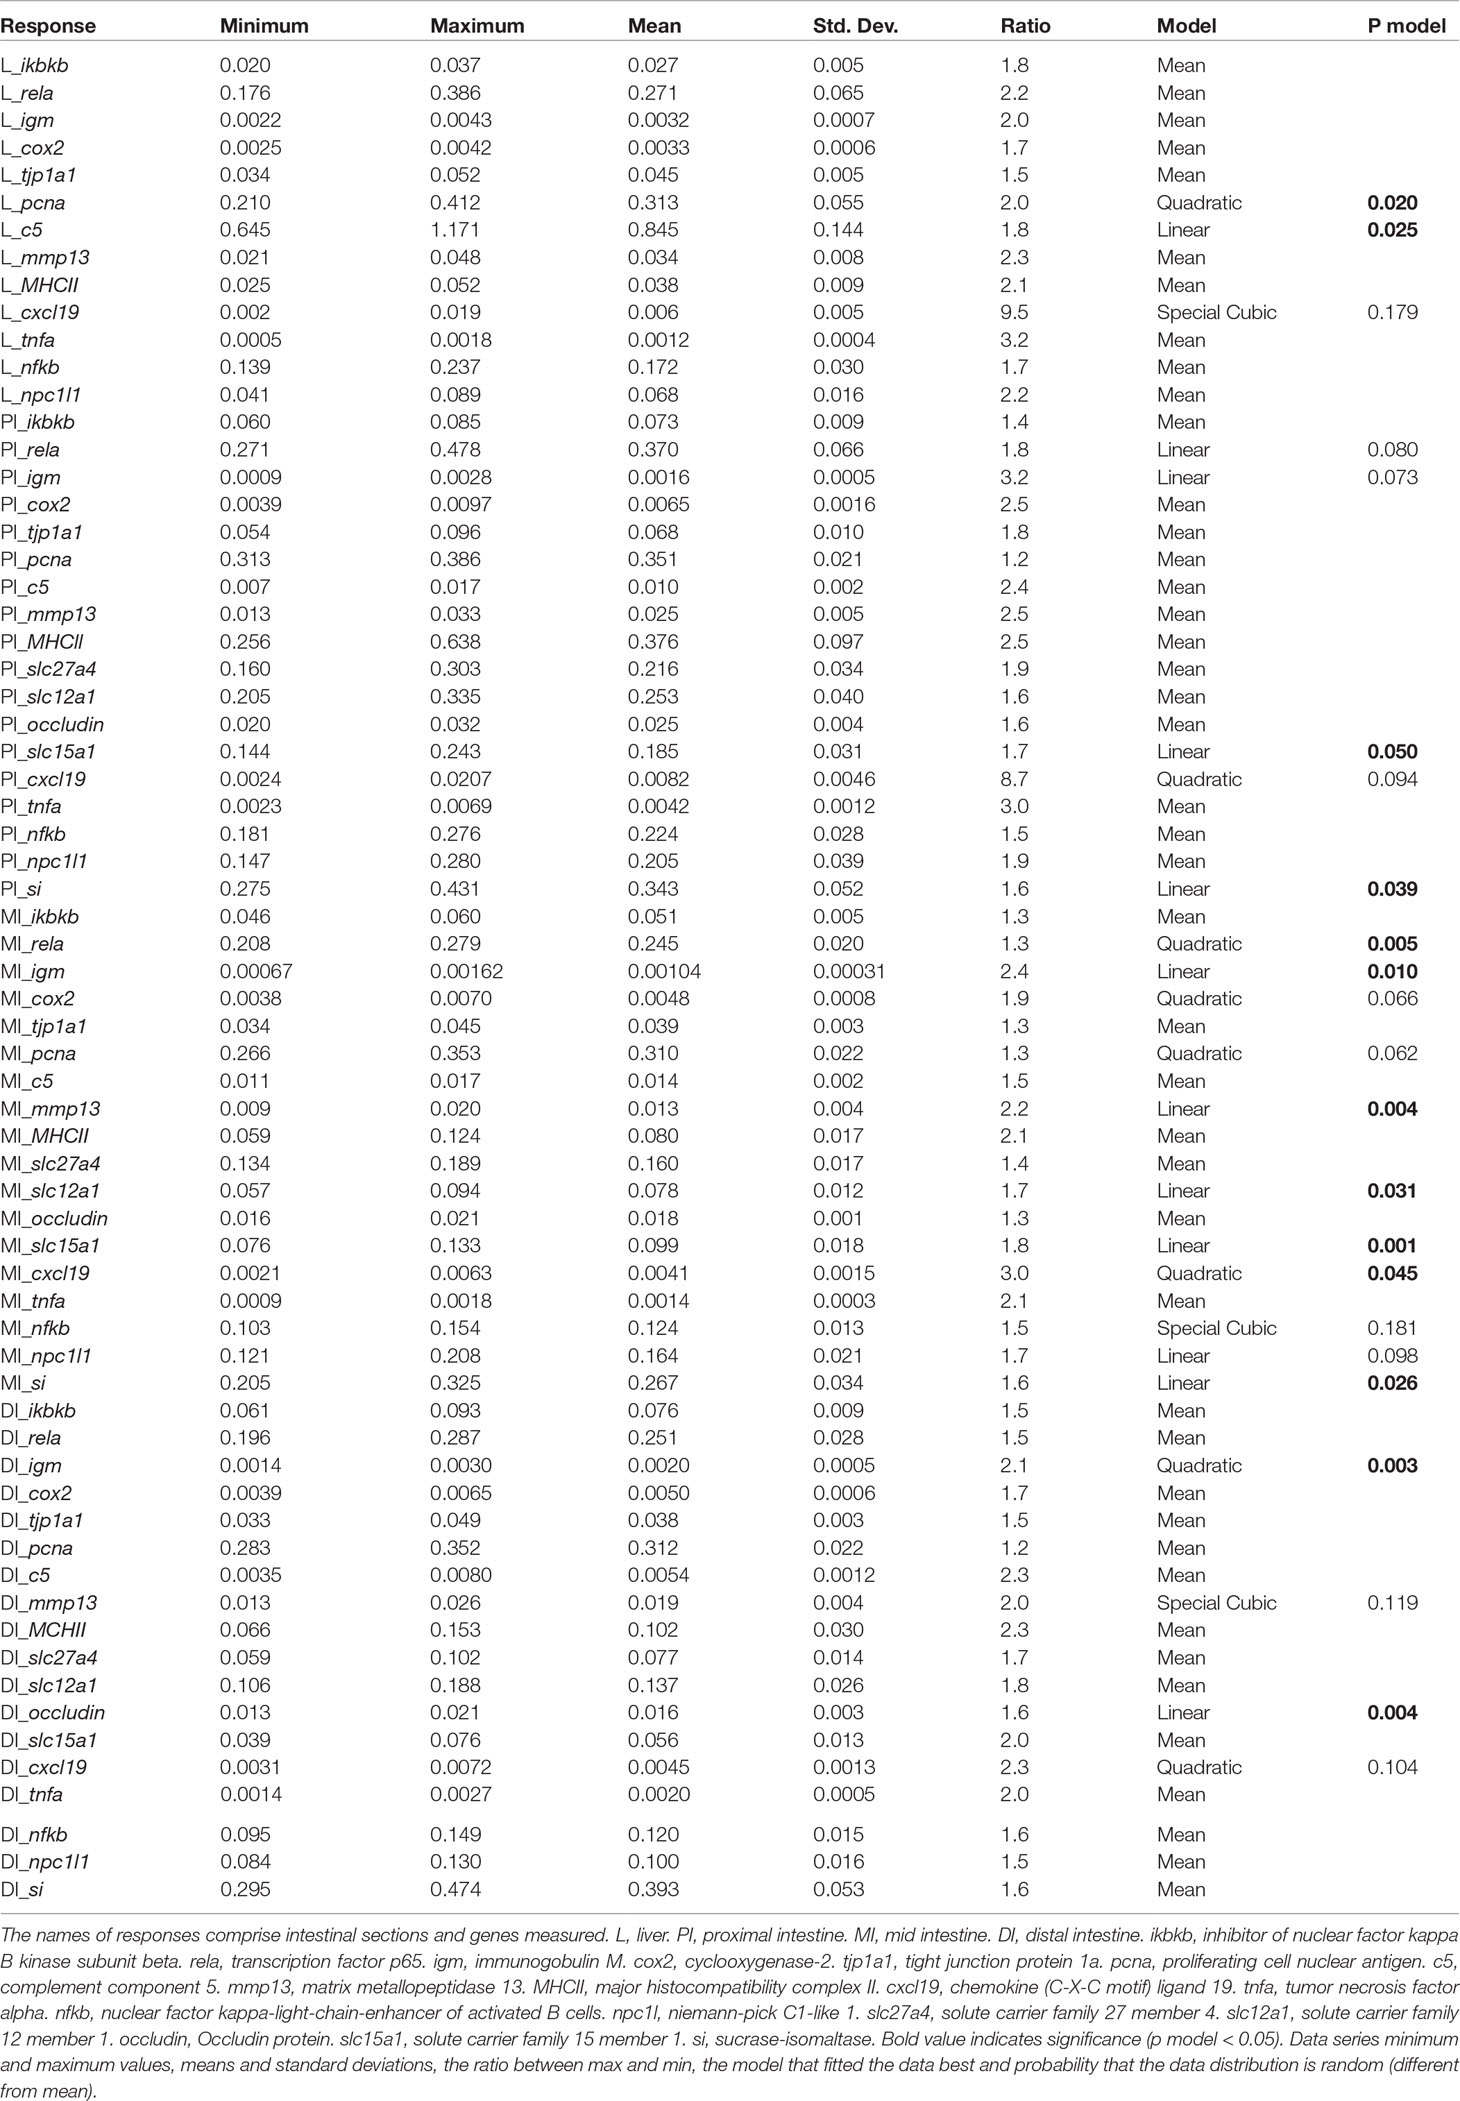
Table 4 Result summary: Expression of selected genes in liver and intestine.
Variation of diet composition significantly affected the intestinal weight of PI and MI (Figure 2 and Table 3). In PI, OSI increased with decreasing protein level, increased with increasing dietary lipid level, and had no response with carbohydrate variation. In MI, OSI increased with decreasing protein level, increased with increasing dietary lipid level, and increased with increasing carbohydrate level.
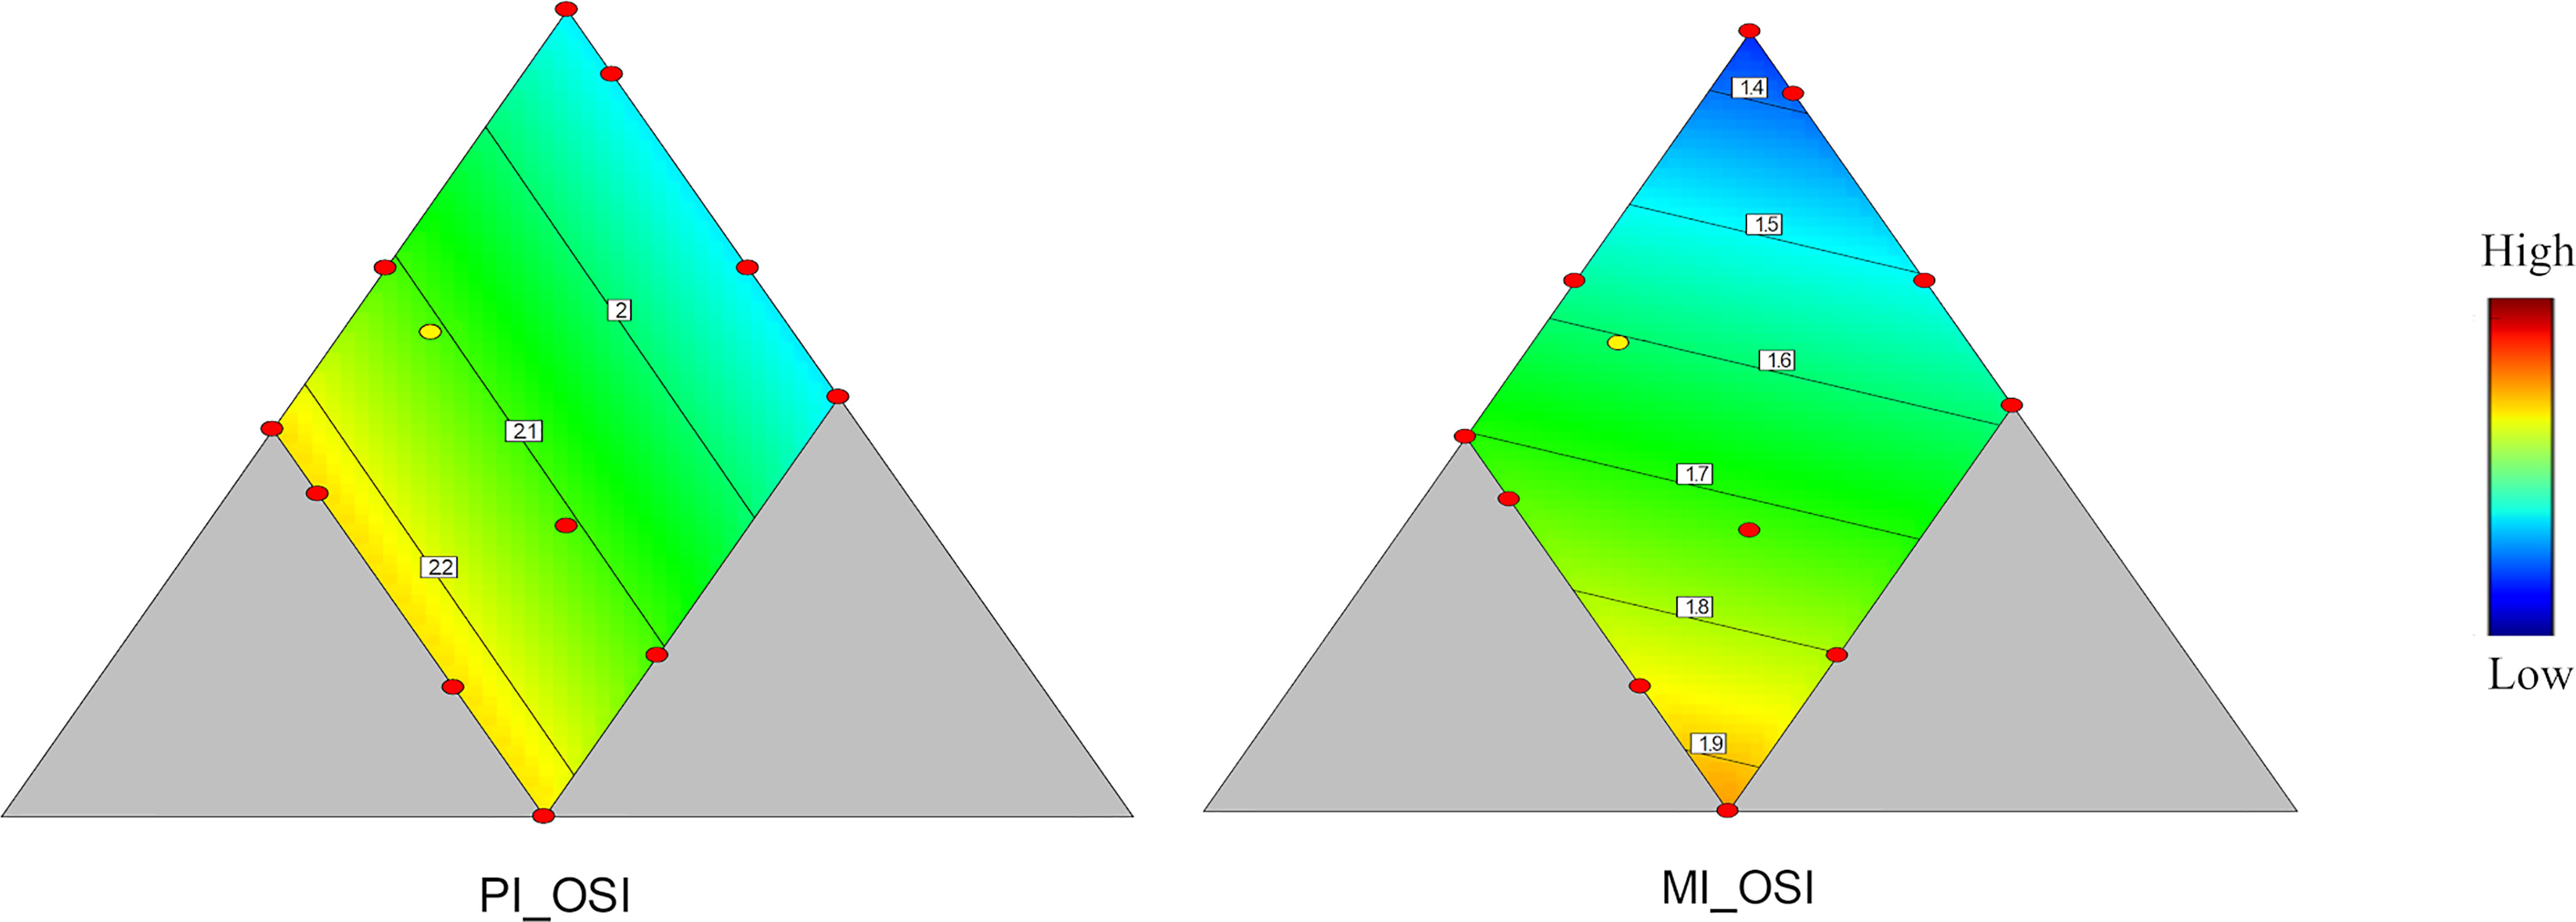
Figure 2 Organosomatic indices of PI and MI. Color scale from blue to red indicates value changes from low to high. The yellow dot represents diet was fed to three tanks. Macronutrient composition of each dot can refer to Figure 1.
Specific activity of both LAP and maltase was highest in MI, lowest in the PI, and intermediate in DI. Also, the value for LAP capacity, i.e., per kg of fish, was highest in the MI, whereas for maltase, the highest value was observed for PI. The DI showed the lowest capacity values for both LAP and maltase.
In PI, specific activity of LAP and maltase showed significant relationships with diet macronutrient composition (p = 0.032 and 0.034, Table 3 and Figure 3). The specific LAP and maltase activities (U/mg protein) decreased with decreasing protein level, decreased with increasing dietary lipid level and, to lesser extent, increased with increasing carbohydrate level. On the other hand, the enzyme capacity (U/kg fish) of LAP and maltase (p = 0.090 and p > 0.10, Table 3 and Figure 3) showed no significant correlations with diet macronutrient composition in this section.
In MI, both specific activity and capacity of LAP and maltase showed clear relationships with diet composition (p = 0.005, 0.016, 0.001 and 0.002, Table 3 and Figure 3), i.e., a decrease with decreasing protein level, a decrease with increasing dietary lipid level, and an increase with increasing carbohydrate level.In DI, there were no significant effects for either specific activity or capacity and the analysis by software cannot illustrate a clear trend neither (p = 0.080, 0.1, 0.060 and 0.070, Table 3).
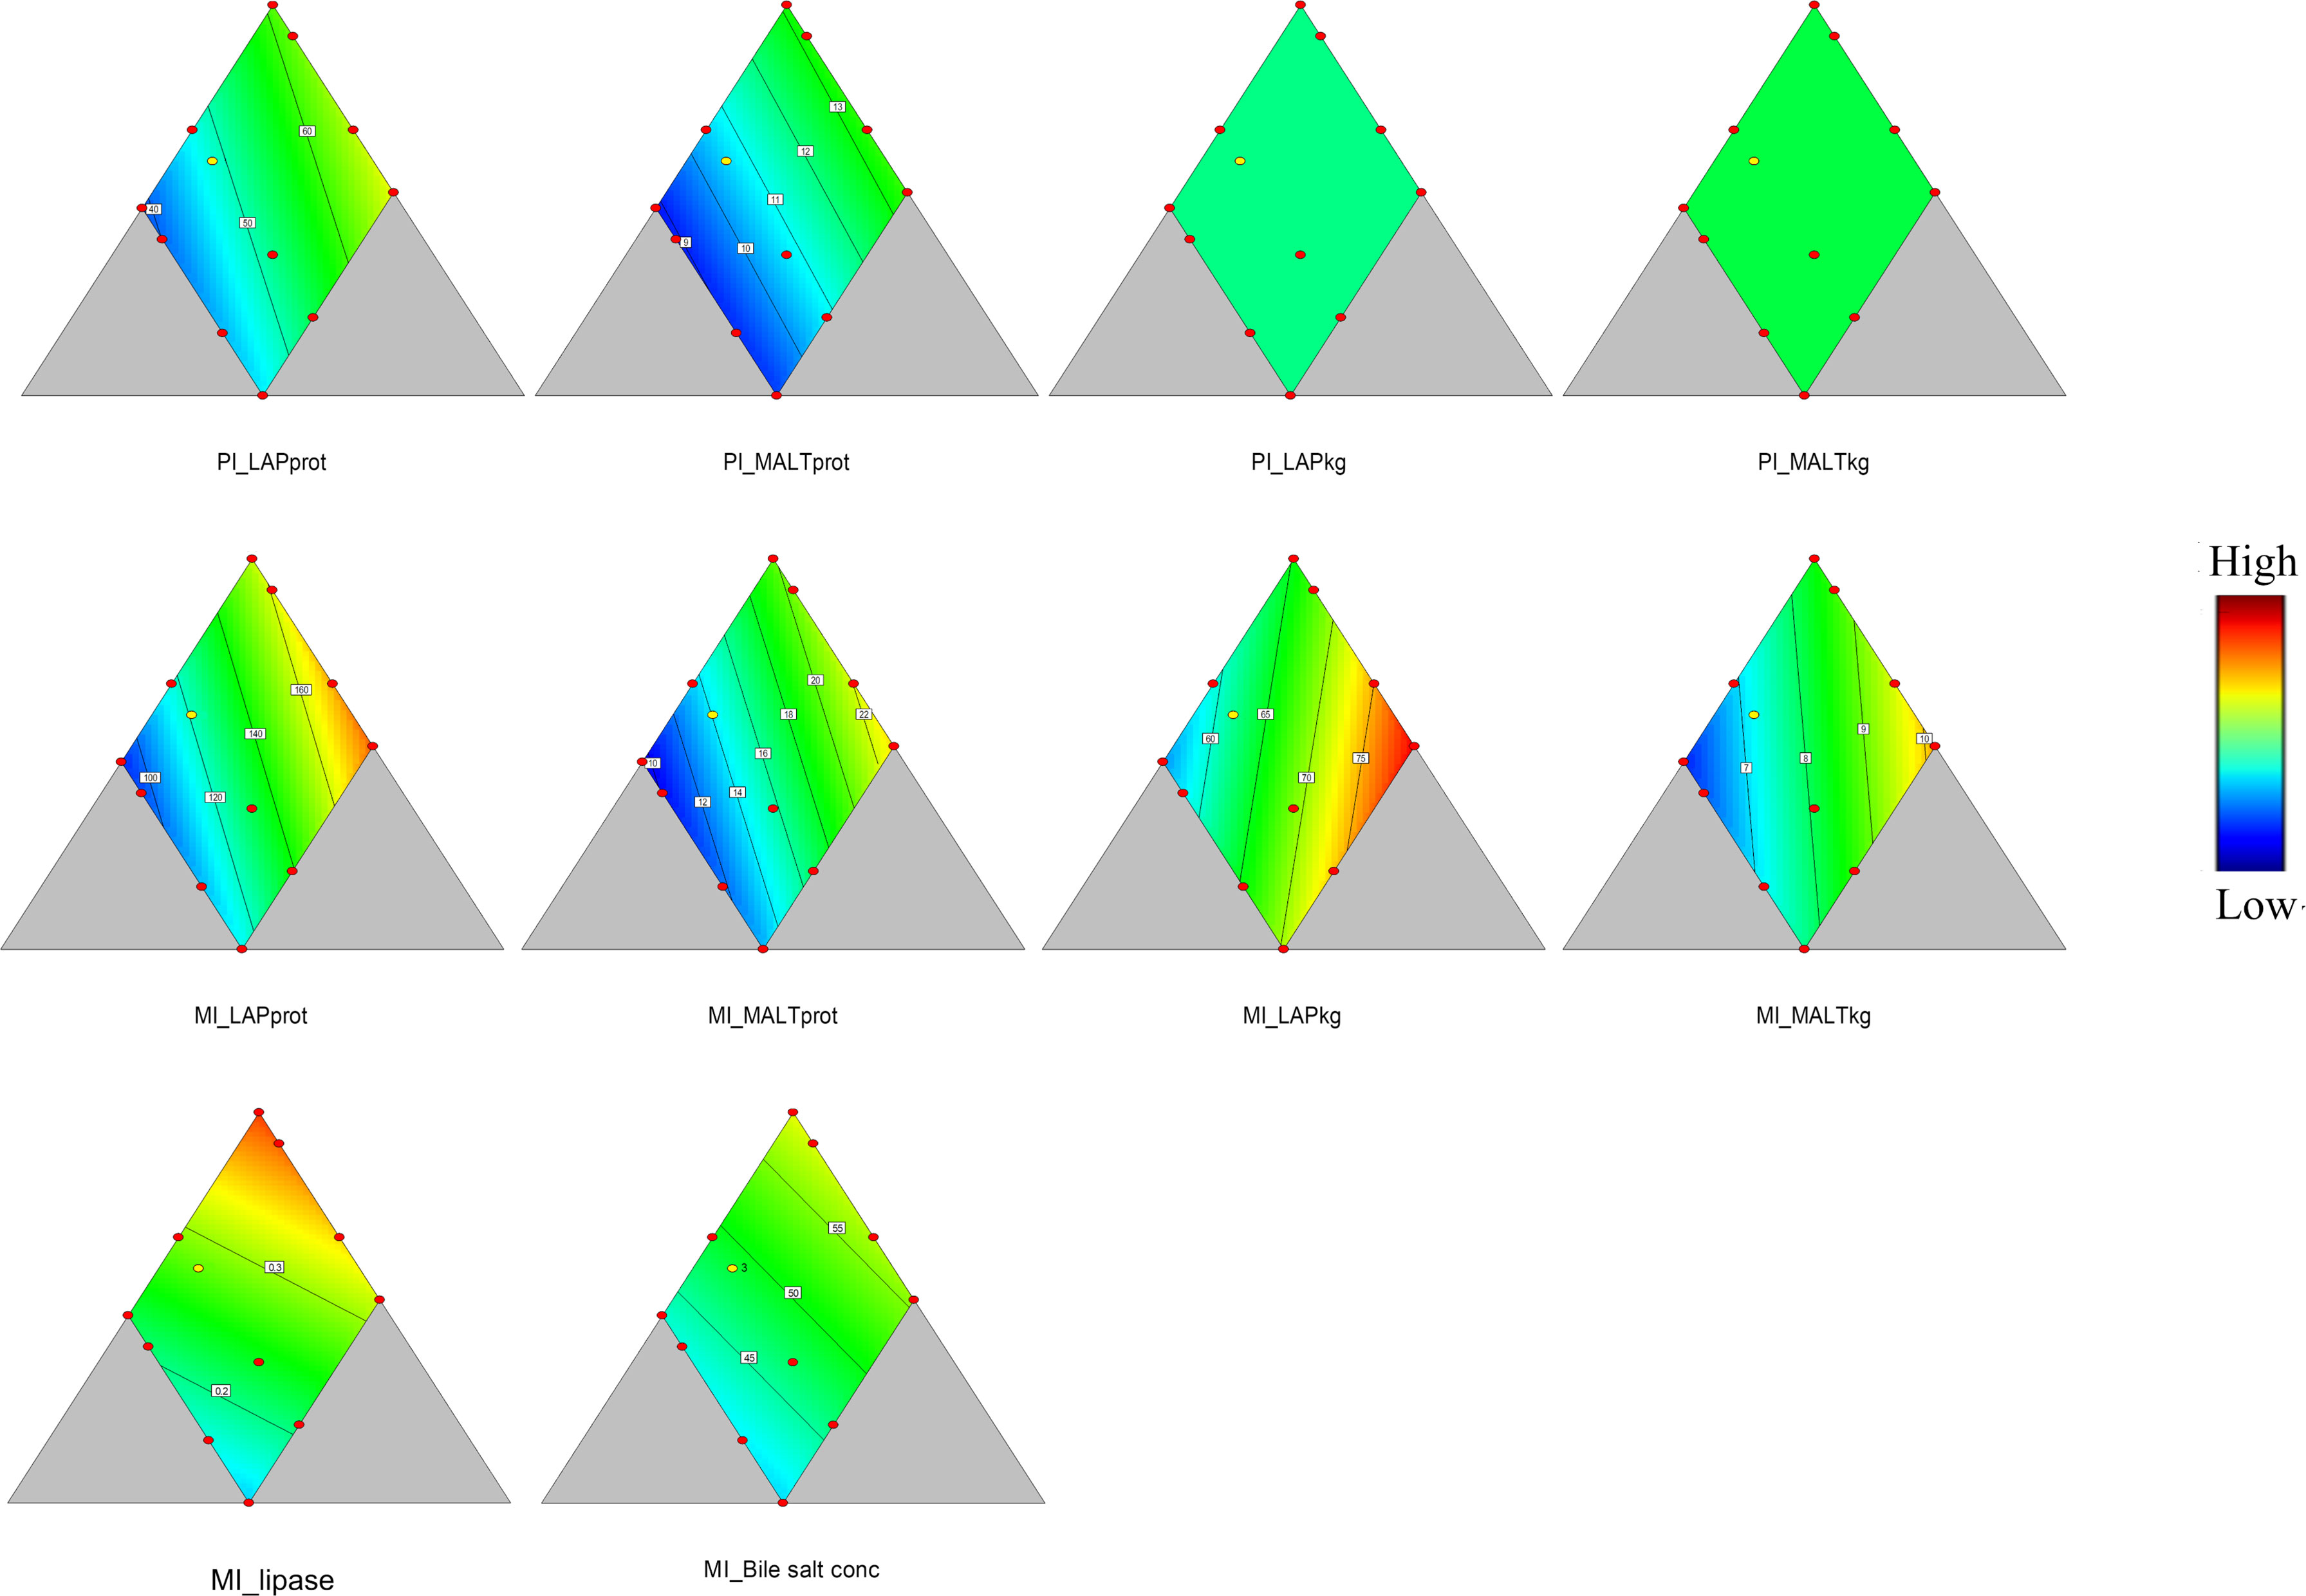
Figure 3 Leucine aminopeptidase (LAP) and maltase specific activity and capacity in proximal intestine (PI) and mid intestine (MI), and lipase activity (units/mg dry matter) and bile salt concentration (mg/g dry matter) in digesta from MI. LAPprot and MALTprot, LAP and maltase specific activity (units/mg protein). LAPkg and MALT kg, LAP and maltase capacity (units/kg fish). Lipase, lipase activity (units/mg dry matter). Bile salt conc, bile salt concentration (mg/g dry matter). Color scale from blue to red indicates value changes from low to high. The yellow dot represents diet was fed to three tanks. Macronutrient composition of each dot can refer to Figure 1.
Lipase activity in digesta from MI showed a significant, linear, relationship with dietary protein level, decreasing with decreasing protein level (p = 0.020, Table 3 and Figure 3). Lipase activity decreased with increasing lipid level as well as with increasing carbohydrate level. The trypsin and amylase activities in digesta from MI did not show significant relationships (p > 0.10, Table 3) with diet macronutrient composition. Bile salt concentration showed a tendency towards a similar response pattern as for the lipase (p = 0.077, Table 3 and Figure 3), i.e., decrease with decreasing protein, increase with increasing lipid and carbohydrate level.
In PI, si and slc15a1, coding for a disaccharidase and a peptide transporter, respectively, were the two genes showing significant responses to diet macronutrient composition (p = 0.039 and 0.050, respectively, Table 4 and Figure 4). Their relationships with diet composition were similar, i.e., decreasing in value with decreasing protein content, decreasing with increasing lipid level and increasing, although only slightly, with increasing carbohydrate. Expression of rela, igm and cxcl19, all involved in immune functions, tended to vary with diet composition (p = 0.080, 0.073 and 0.094, respectively, Table 4 and Figure 4). The trend observed for expression of rela was a decrease with decreasing protein level, decrease with increasing lipid level and increase with carbohydrate level, while igm expression decreased with decreasing protein level, decreased with increasing lipid level, but increased slightly with increasing carbohydrate level. The trend of cxcl19 expression fitted a quadratic model, where the minimum was at medium protein, high lipid, and low carbohydrate level, and the maximum was at medium protein and lipid level, and high carbohydrate.
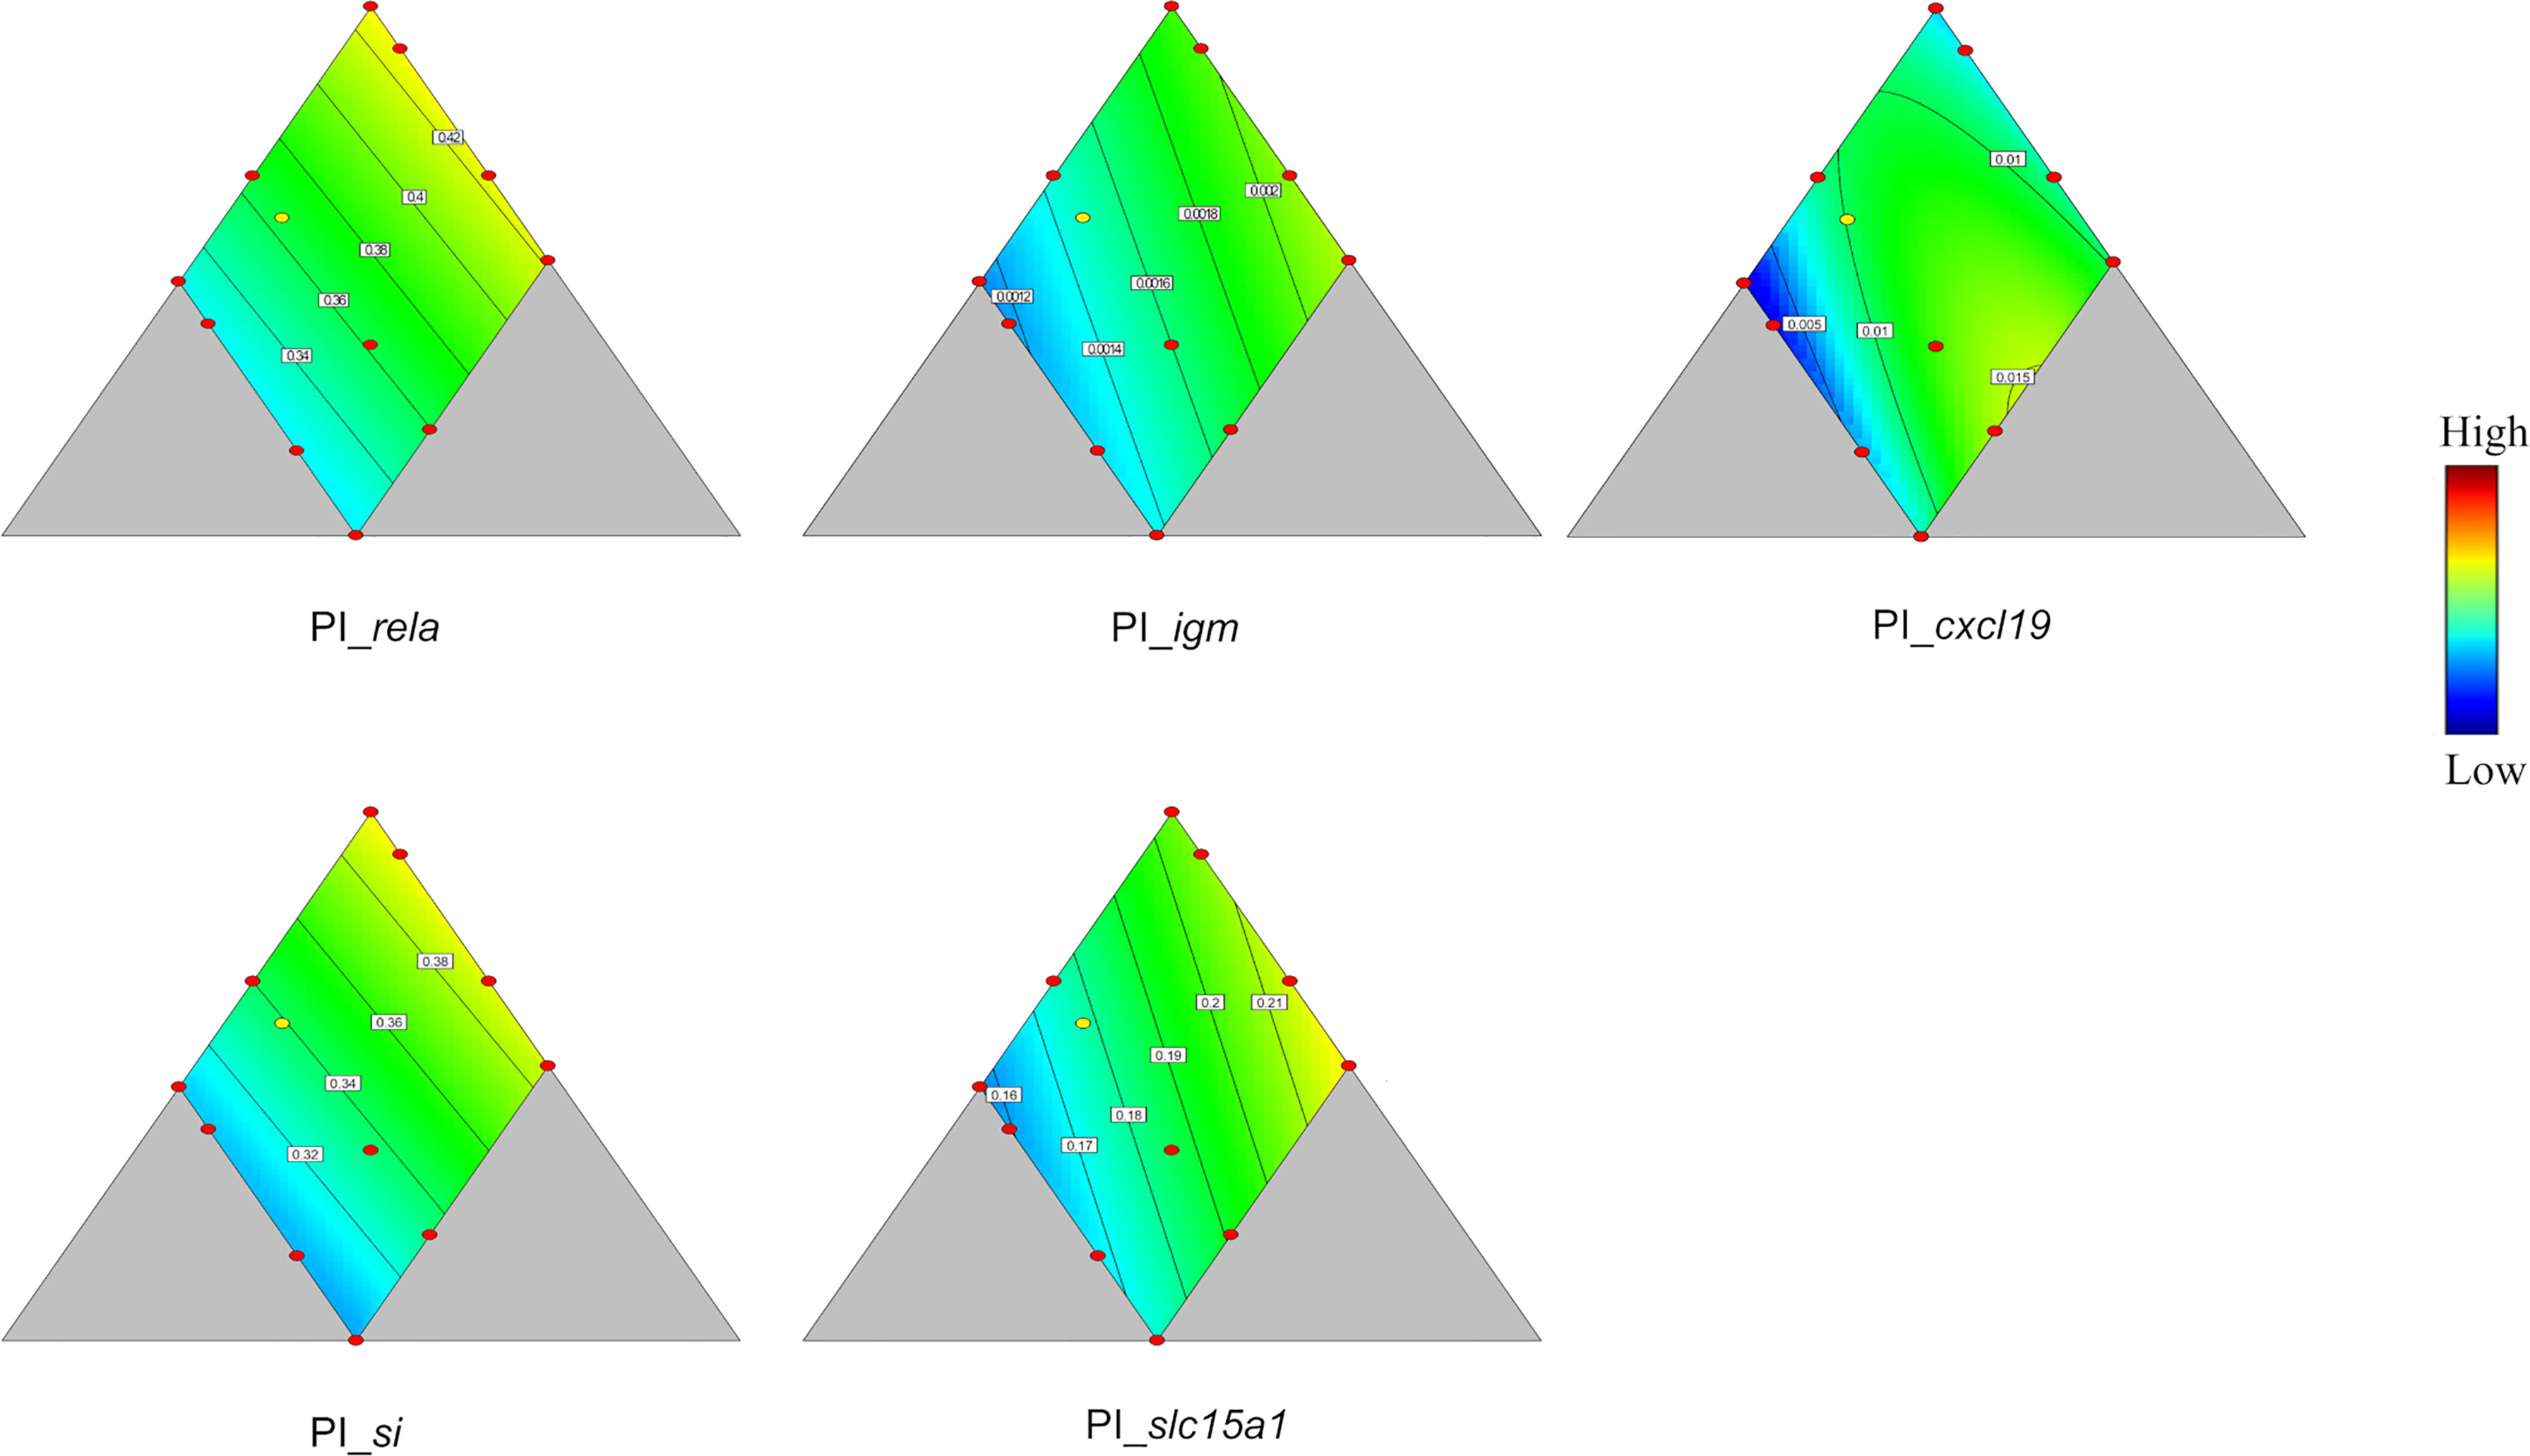
Figure 4 Genes showing significant responses (p < 0.05) or trend (0.05 < p < 0.1) in proximal intestine (PI). rela, nuclear factor NF-kappa-B p65 subunit; igm, immunoglobulin M; cxcl19, chemokine ligand 19; si, sucrase-isomaltase; slc15a1, peptide transporter 1. Color scale from blue to red indicates value changes from low to high. The yellow dot represents diet was fed to three tanks. Macronutrient composition of each dot can refer to Figure 1.
In MI, more genes responded significantly to variation in diet composition. As in PI, significant response was observed for si and slc15a, and the pattern of responses was quite similar, with a decrease with decreasing dietary protein, a decrease with increasing lipid and an increase with dietary carbohydrate level (p = 0.026 and 0.001, Table 4 and Figure 5). Also, slc12a1, the gene involved in ion exchange expression decreased with decreasing protein level, decreased with increasing lipid (p = 0.031, Table 4 and Figure 5) and increased with increasing carbohydrate level. Regarding genes involved in immune functions, linear effects of diet composition were seen for igm and mmp13, and quadratic responses were seen for rela and cxcl19 (for p values see Table 4 and Figure 5). For the former four, expression decreased with decreasing protein level, most pronounced for mmp13, decreased with increasing lipid level as well as with increasing carbohydrate level.
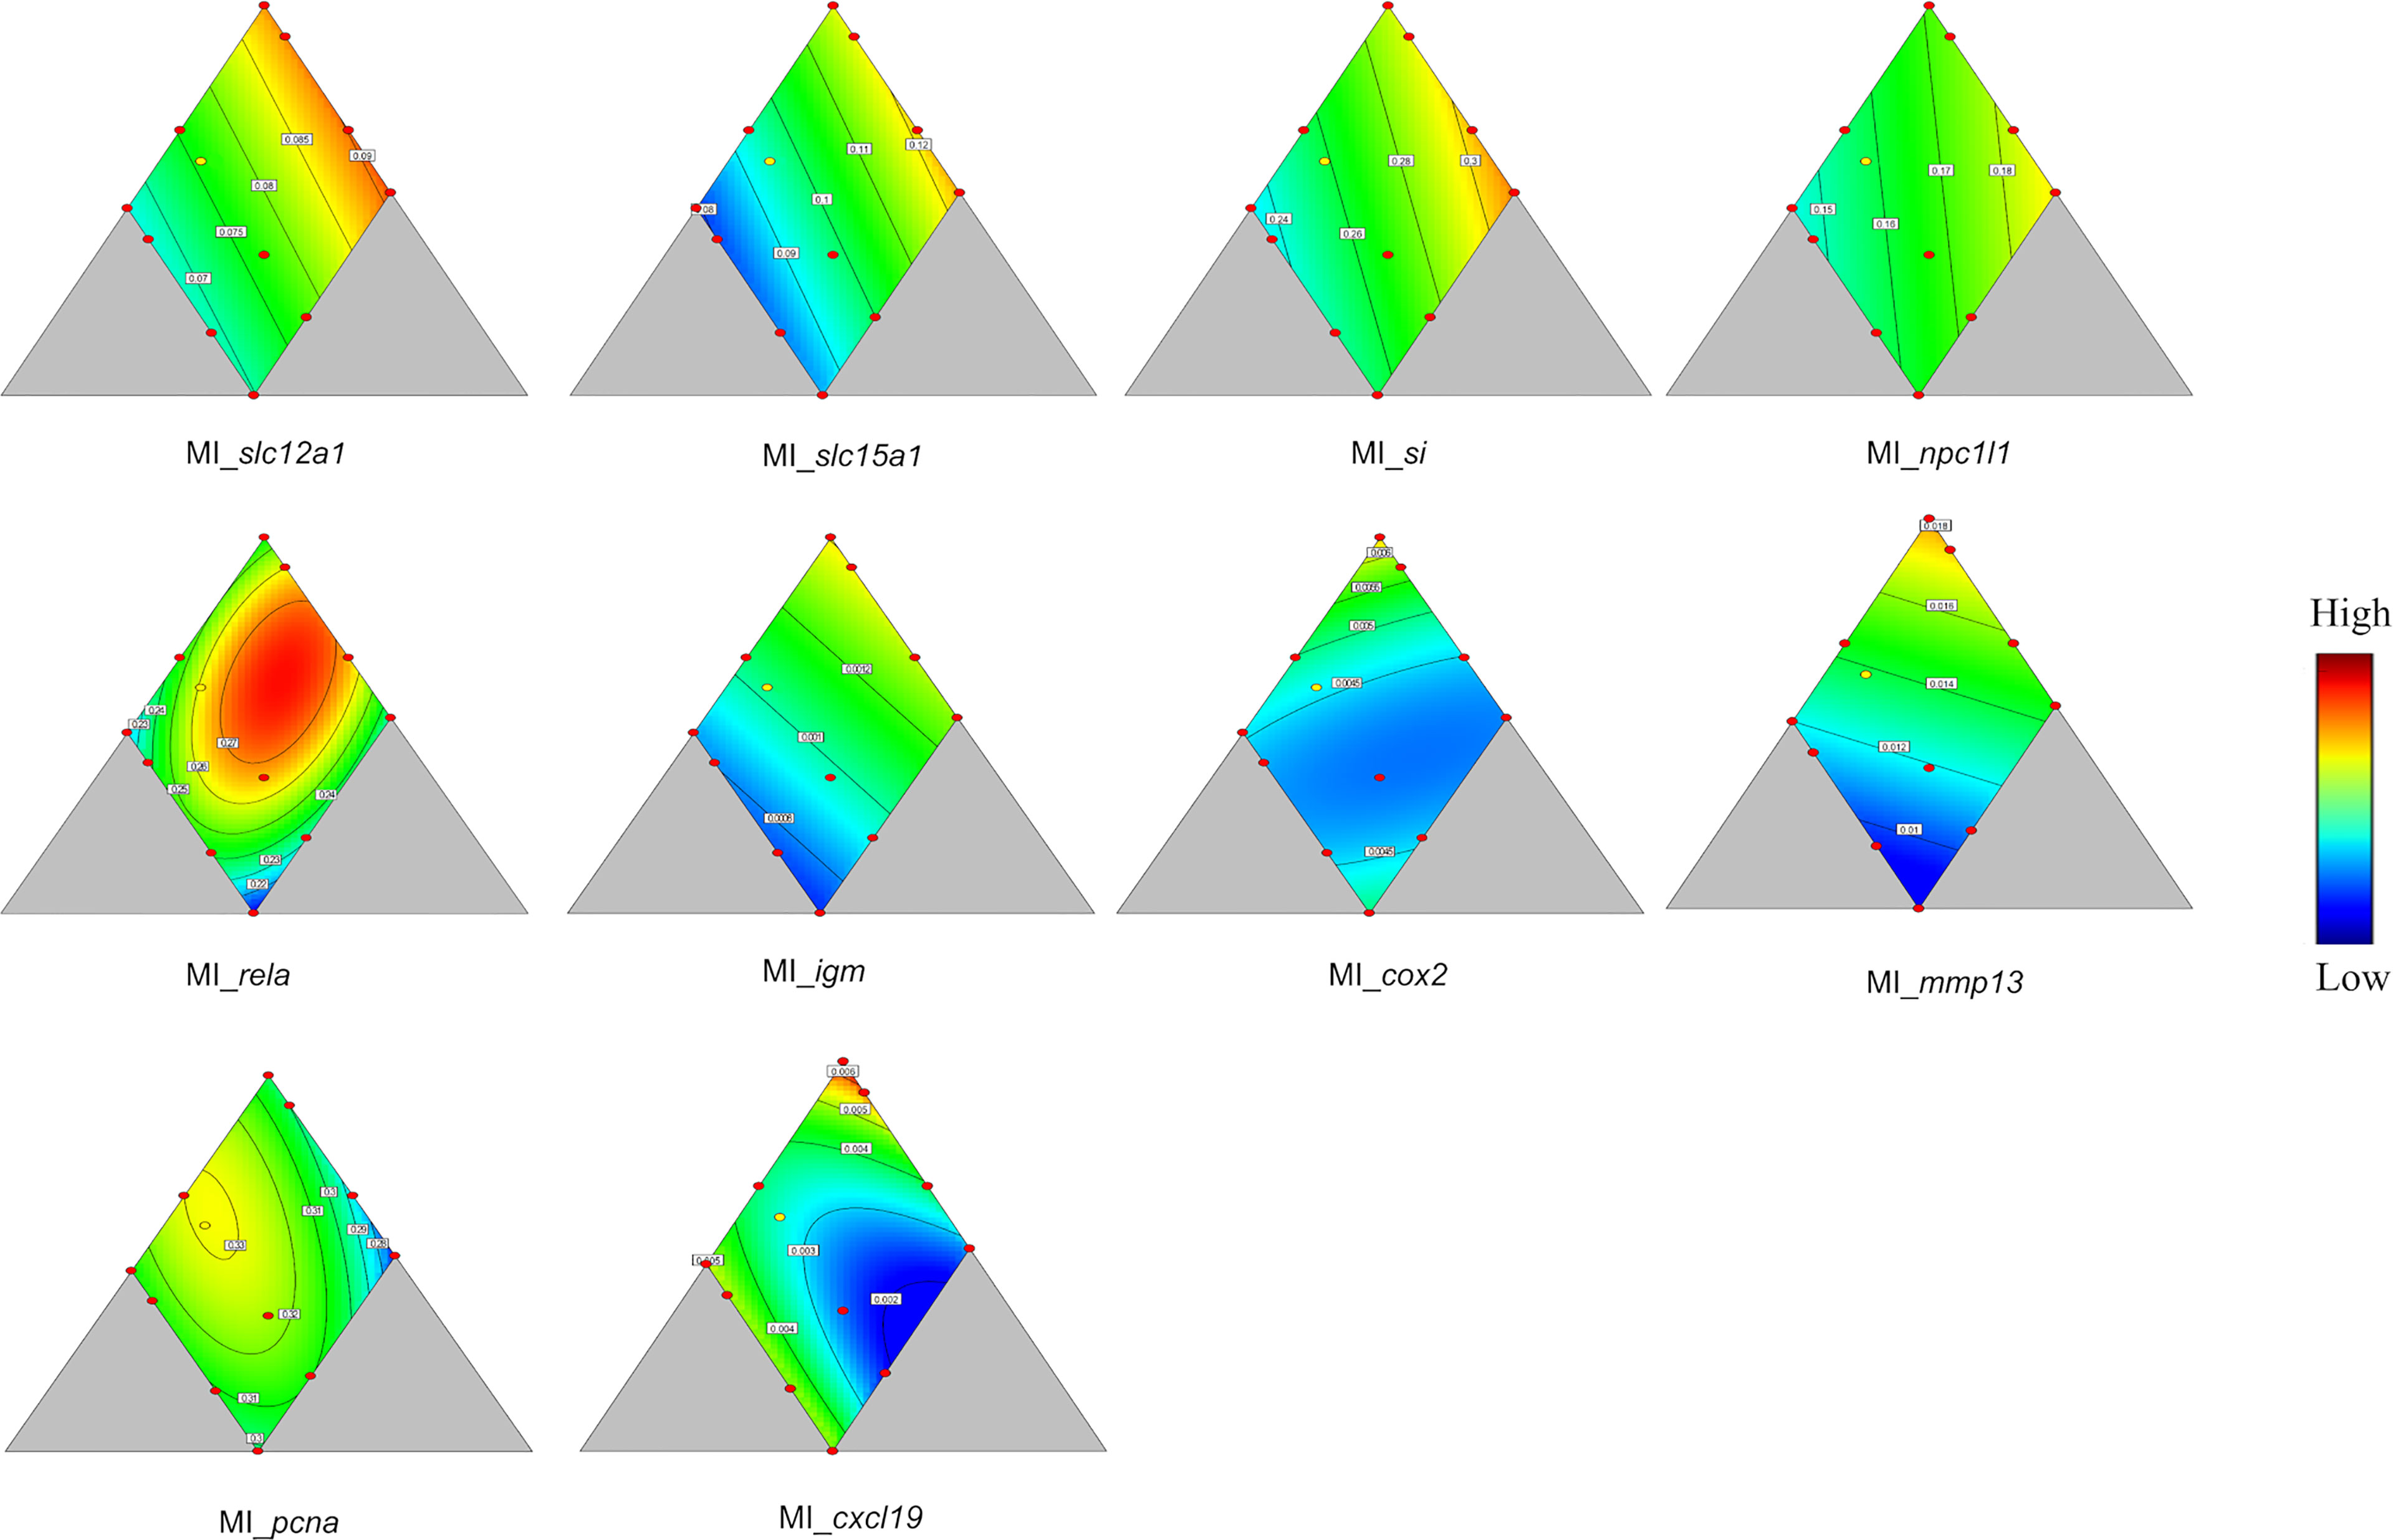
Figure 5 Genes showing significant responses (p < 0.05) or trend (0.05 < p < 0.1) in mid intestine (MI). slc12a1, Na-K-Cl cotransporter; slc15a1, peptide transporter 1; si, sucrase-isomaltase; npc1l1, Niemann-pick C1-like 1; rela, nuclear factor NF-kappa-B p65 subunit; igm, immunoglobulin M; cox2, cyclooxygenase 2; mmp13, matrix metallopeptidase 13; pcna, proliferating cell nuclear antigen; cxcl19, chemokin ligand 19. Color scale from blue to red indicates value changes from low to high. The yellow dot represents diet was fed to three tanks. Macronutrient composition of each dot can refer to Figure 1.
For rela, which fitted a quadratic model, the maximum expression was found near the center of the design, i.e., at medium levels of all the three macronutrients. Two low values were seen, i.e., at medium protein, high lipid, and low carbohydrates, and at low protein, high lipid, and high carbohydrates. The highest value for cxcl19 was observed at the highest protein level, at which both lipid and carbohydrates were low. Lowest value was found at medium protein and lipid level and high carbohydrate level. For some genes showing fewer clear relationships with diet composition, trends (0.05 < p <0.10) were indicated, i.e., for npc1l1, cox2, and pcna (for p values see Table 4). The relationship of expression of npc1l1, the cholesterol transporter, showed decreased level with decreasing protein level, decreased level with increasing lipid level and increased level with increasing carbohydrate level. The expression cox2 and the cell proliferating related gene pcna fitted quadratic models. The maximum expression of cox2 was at high protein, low lipid, and low carbohydrate level, with a lower peak at low protein level, high lipid, and high carbohydrate level. The minimum was shown at medium protein level, medium lipid, and high carbohydrate level. Maximum expression of pcna was at medium lipid and protein level and low carbohydrate level.
In DI, only expression of the tight junction related gene occludin and the immune related gene igm were significantly influenced by diet composition (p = 0.003 and 0.004 respectively, Table 4). Expression of igm was best explained by a quadratic model (Figure 6), with two maxima, one at medium protein, high lipid, and low carbohydrate level, and the other at medium protein level, low lipid, and high carbohydrate level. The minimum was observed at low protein, high lipid, and high carbohydrate level. The occludin expression, following a linear model, showed highest values at high protein a low lipid level, with minor, but positive dependency on carbohydrate level.
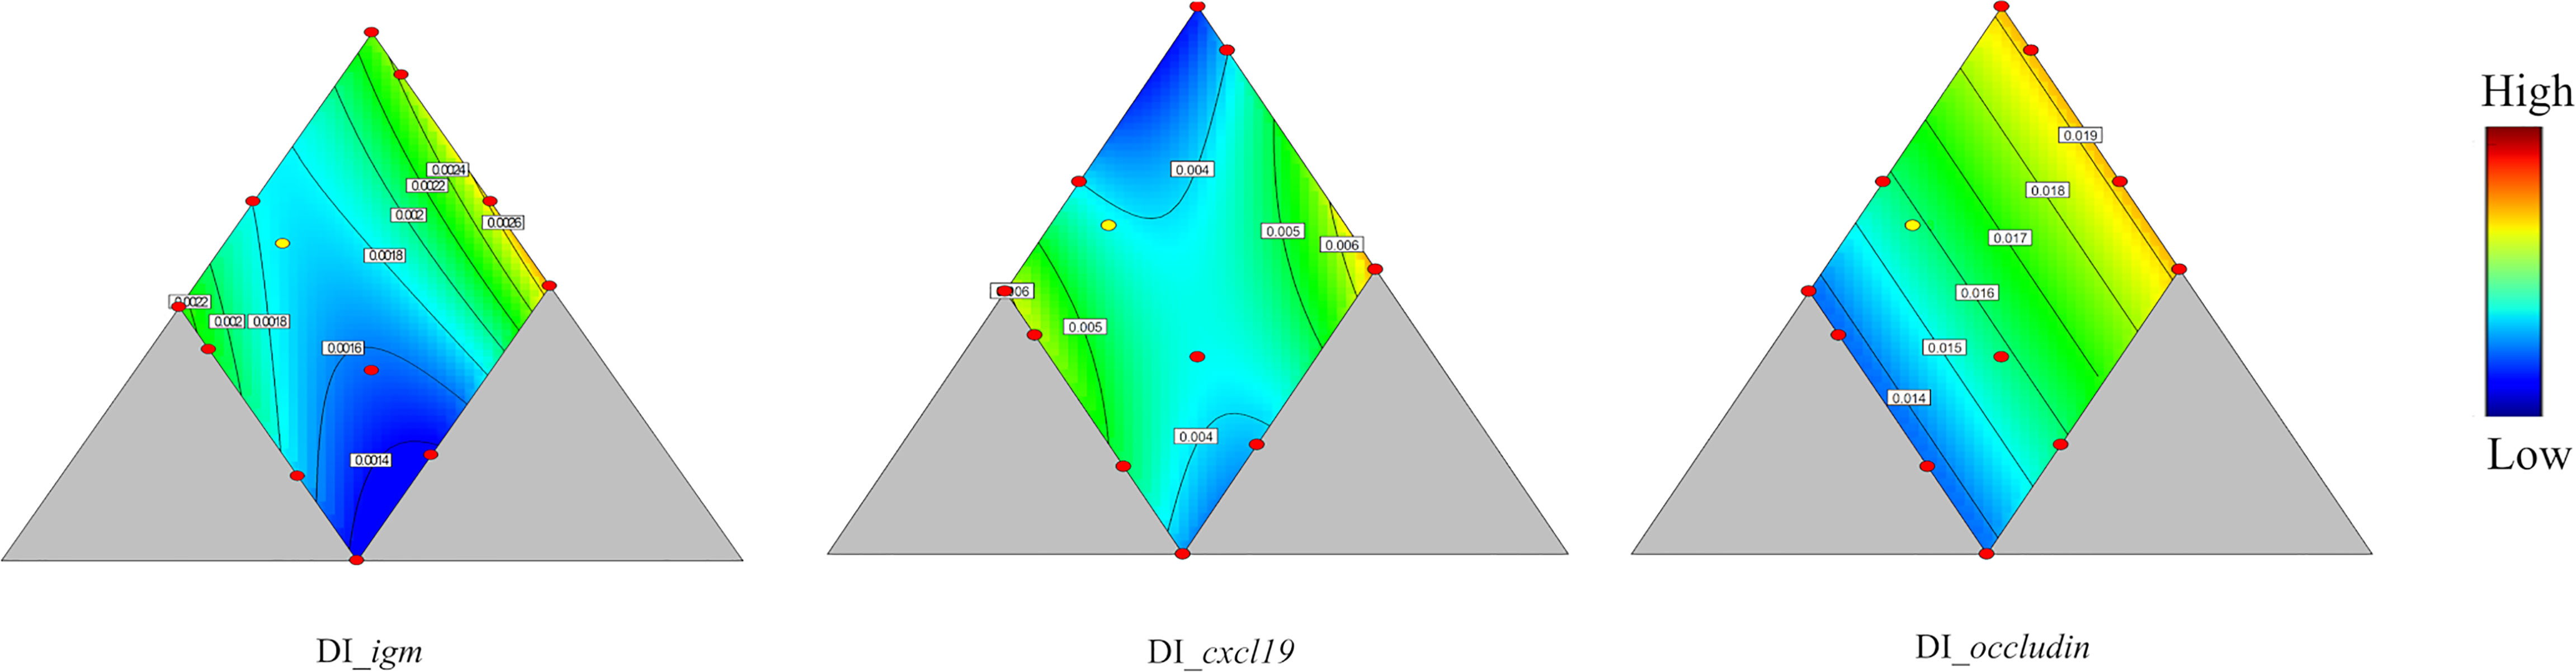
Figure 6 Genes showing significant responses (p < 0.05) or trend (0.05 < p < 0.1) in distal intestine (DI). igm, immunoglobulin M; cxcl19, chemokine ligand 19; occludin, an integral membrane protein at the tight junctions. Color scale from blue to red indicates value changes from low to high. The yellow dot represents diet was fed to three tanks. Macronutrient composition of each dot can refer to Figure 1.
Among the genes observed in the liver, only c5 and pcna, coding for proteins participating in immune regulation and cell proliferation, respectively, showed significant responses to the dietary variation (p = 0.020 and 0.025, respectively, Table 4). The expression of c5 was affected only to a minor degree by protein level, decreased with increasing lipid, and increased with increasing carbohydrate level (Figure 7). The pcna expression data fitted a quadratic model (Figure 7) with two maxima, one at medium protein, high lipid, and low carbohydrate level, the other at low protein, high lipid, and high carbohydrate level. One minimum was apparent, i.e., at high protein, low lipid and medium carbohydrate and high protein level.
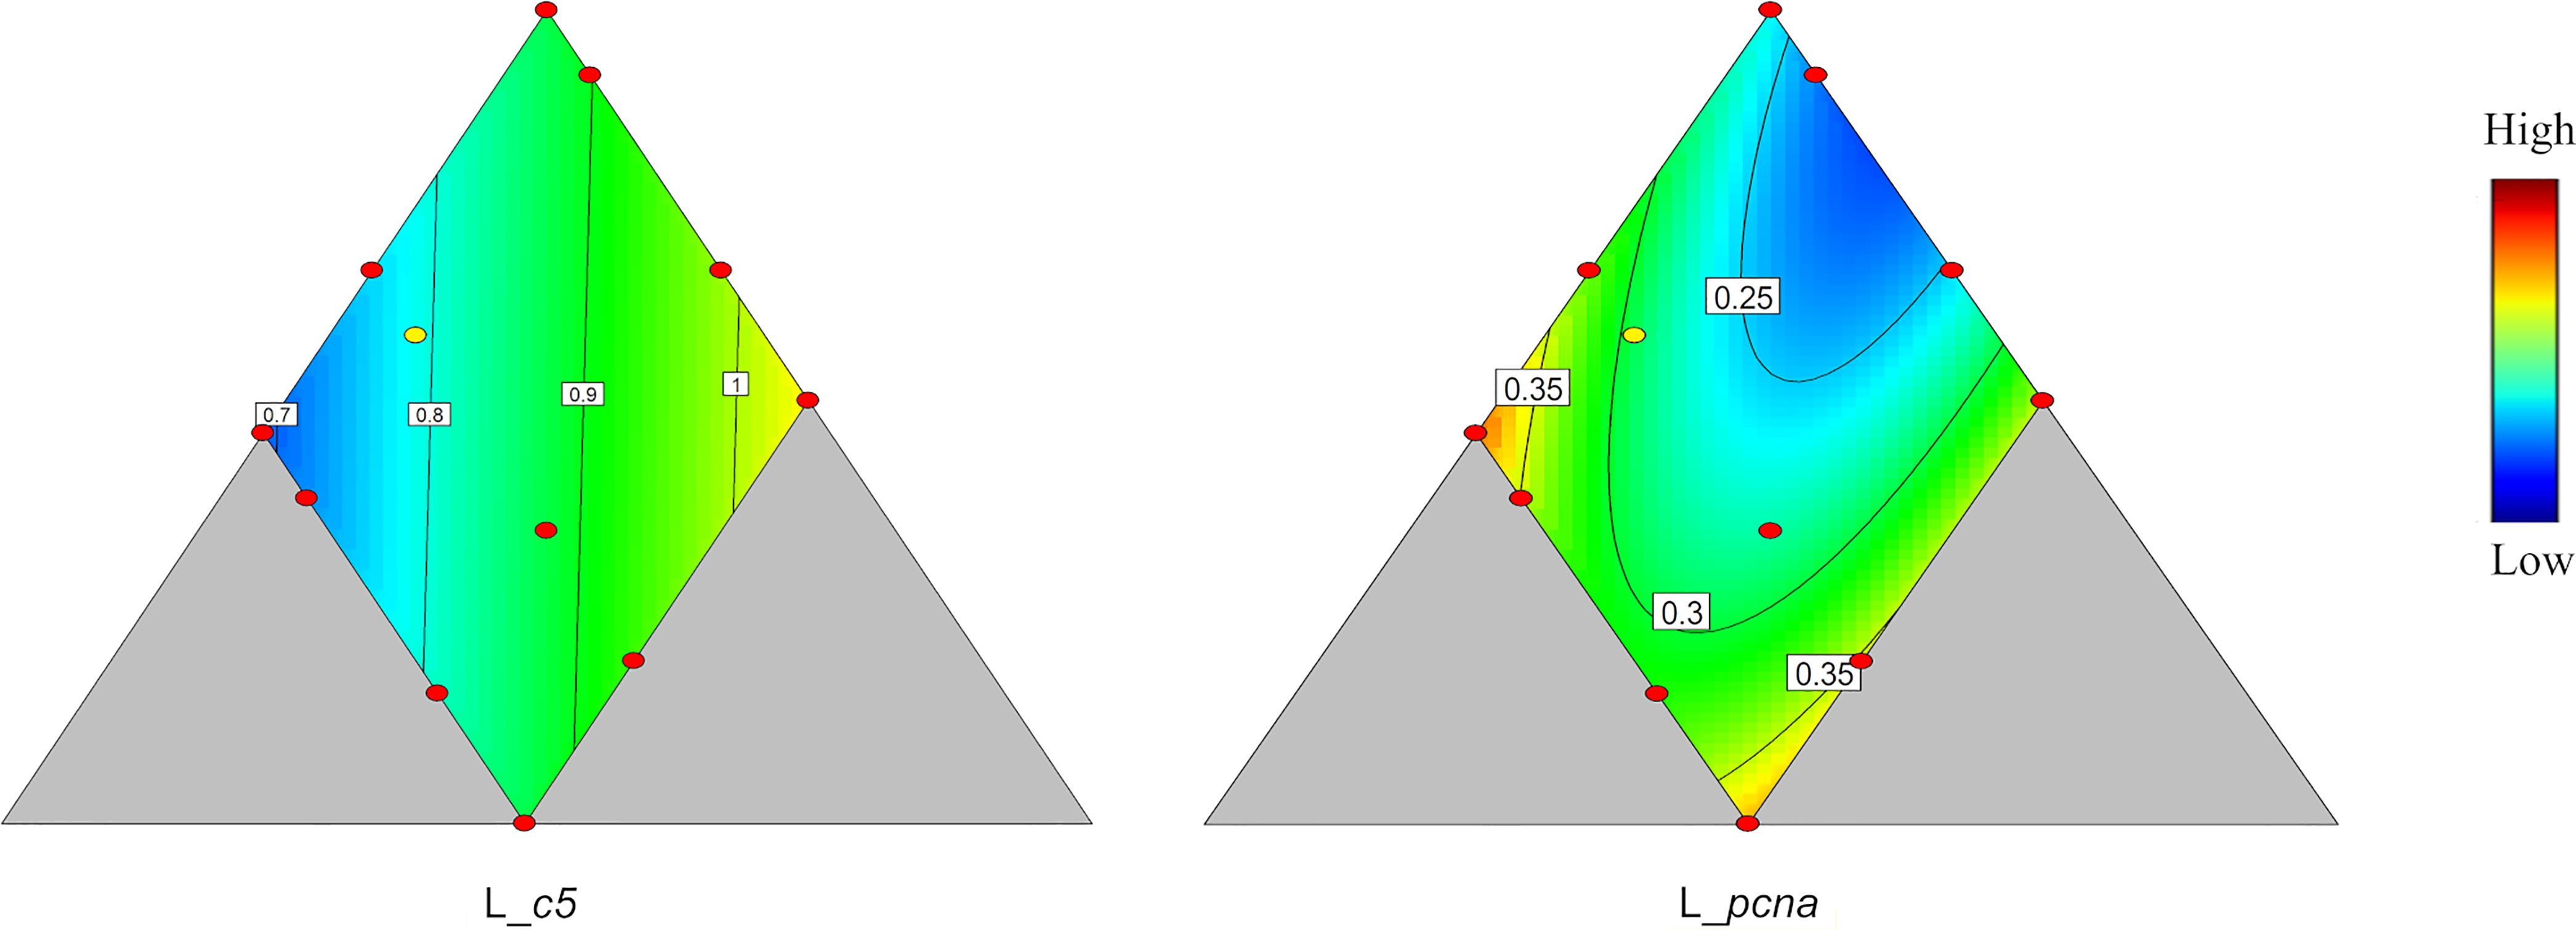
Figure 7 Genes showing significant response (p < 0.05) responses in liver. c5, complement component 5; pcna, proliferating cell nuclear antigen. Color scale from blue to red indicates value changes from low to high. The yellow dot represents diet was fed to three tanks. Macronutrient composition of each dot can refer to Figure 1.
The general histological appearance of the gut mucosa is presented in Figures 8A–D. The stomach structure was quite similar to that observed in other fish species with simple columnar epithelium, gastric glands, and a thick smooth muscle layer with two layers, the inner circular and the outer longitudinal (Figure 8A). The structure of the pyloric caeca (Figure 8B) also appeared similar to what has been observed in other fish species. The caeca were surrounded by pancreatic tissue and were of thin wall with simple unbranched mucosal folds. Lamina propria and submucosa were thin. Fused caeca, due to branching of pyloric caeca were a unique finding for the lumpfish with shared muscular and serosal wall (Figure 8B, blue arrow). The mid intestine showed structures comparable to those observed in Atlantic salmon with short mucosal folds and short branching, thin lamina propria and submucosa with sparse cellularity, but thick muscle layer (Figure 8C). The structure of the distal intestine (Figure 8D) appeared similar to that in Atlantic salmon with simple (Baeverfjord and Krogdahl, 1996; Knudsen et al., 2007), and complex (branched) mucosal folds which were taller than in mid intestine, and lamina propria and submucosa with fibrous tissue and little cellular composition. The enterocytes showed little or no vacuolization, a feature which may distinguish the lumpfish from Atlantic salmon which, in the fed state, show high vacuolation of the distal intestinal enterocytes.
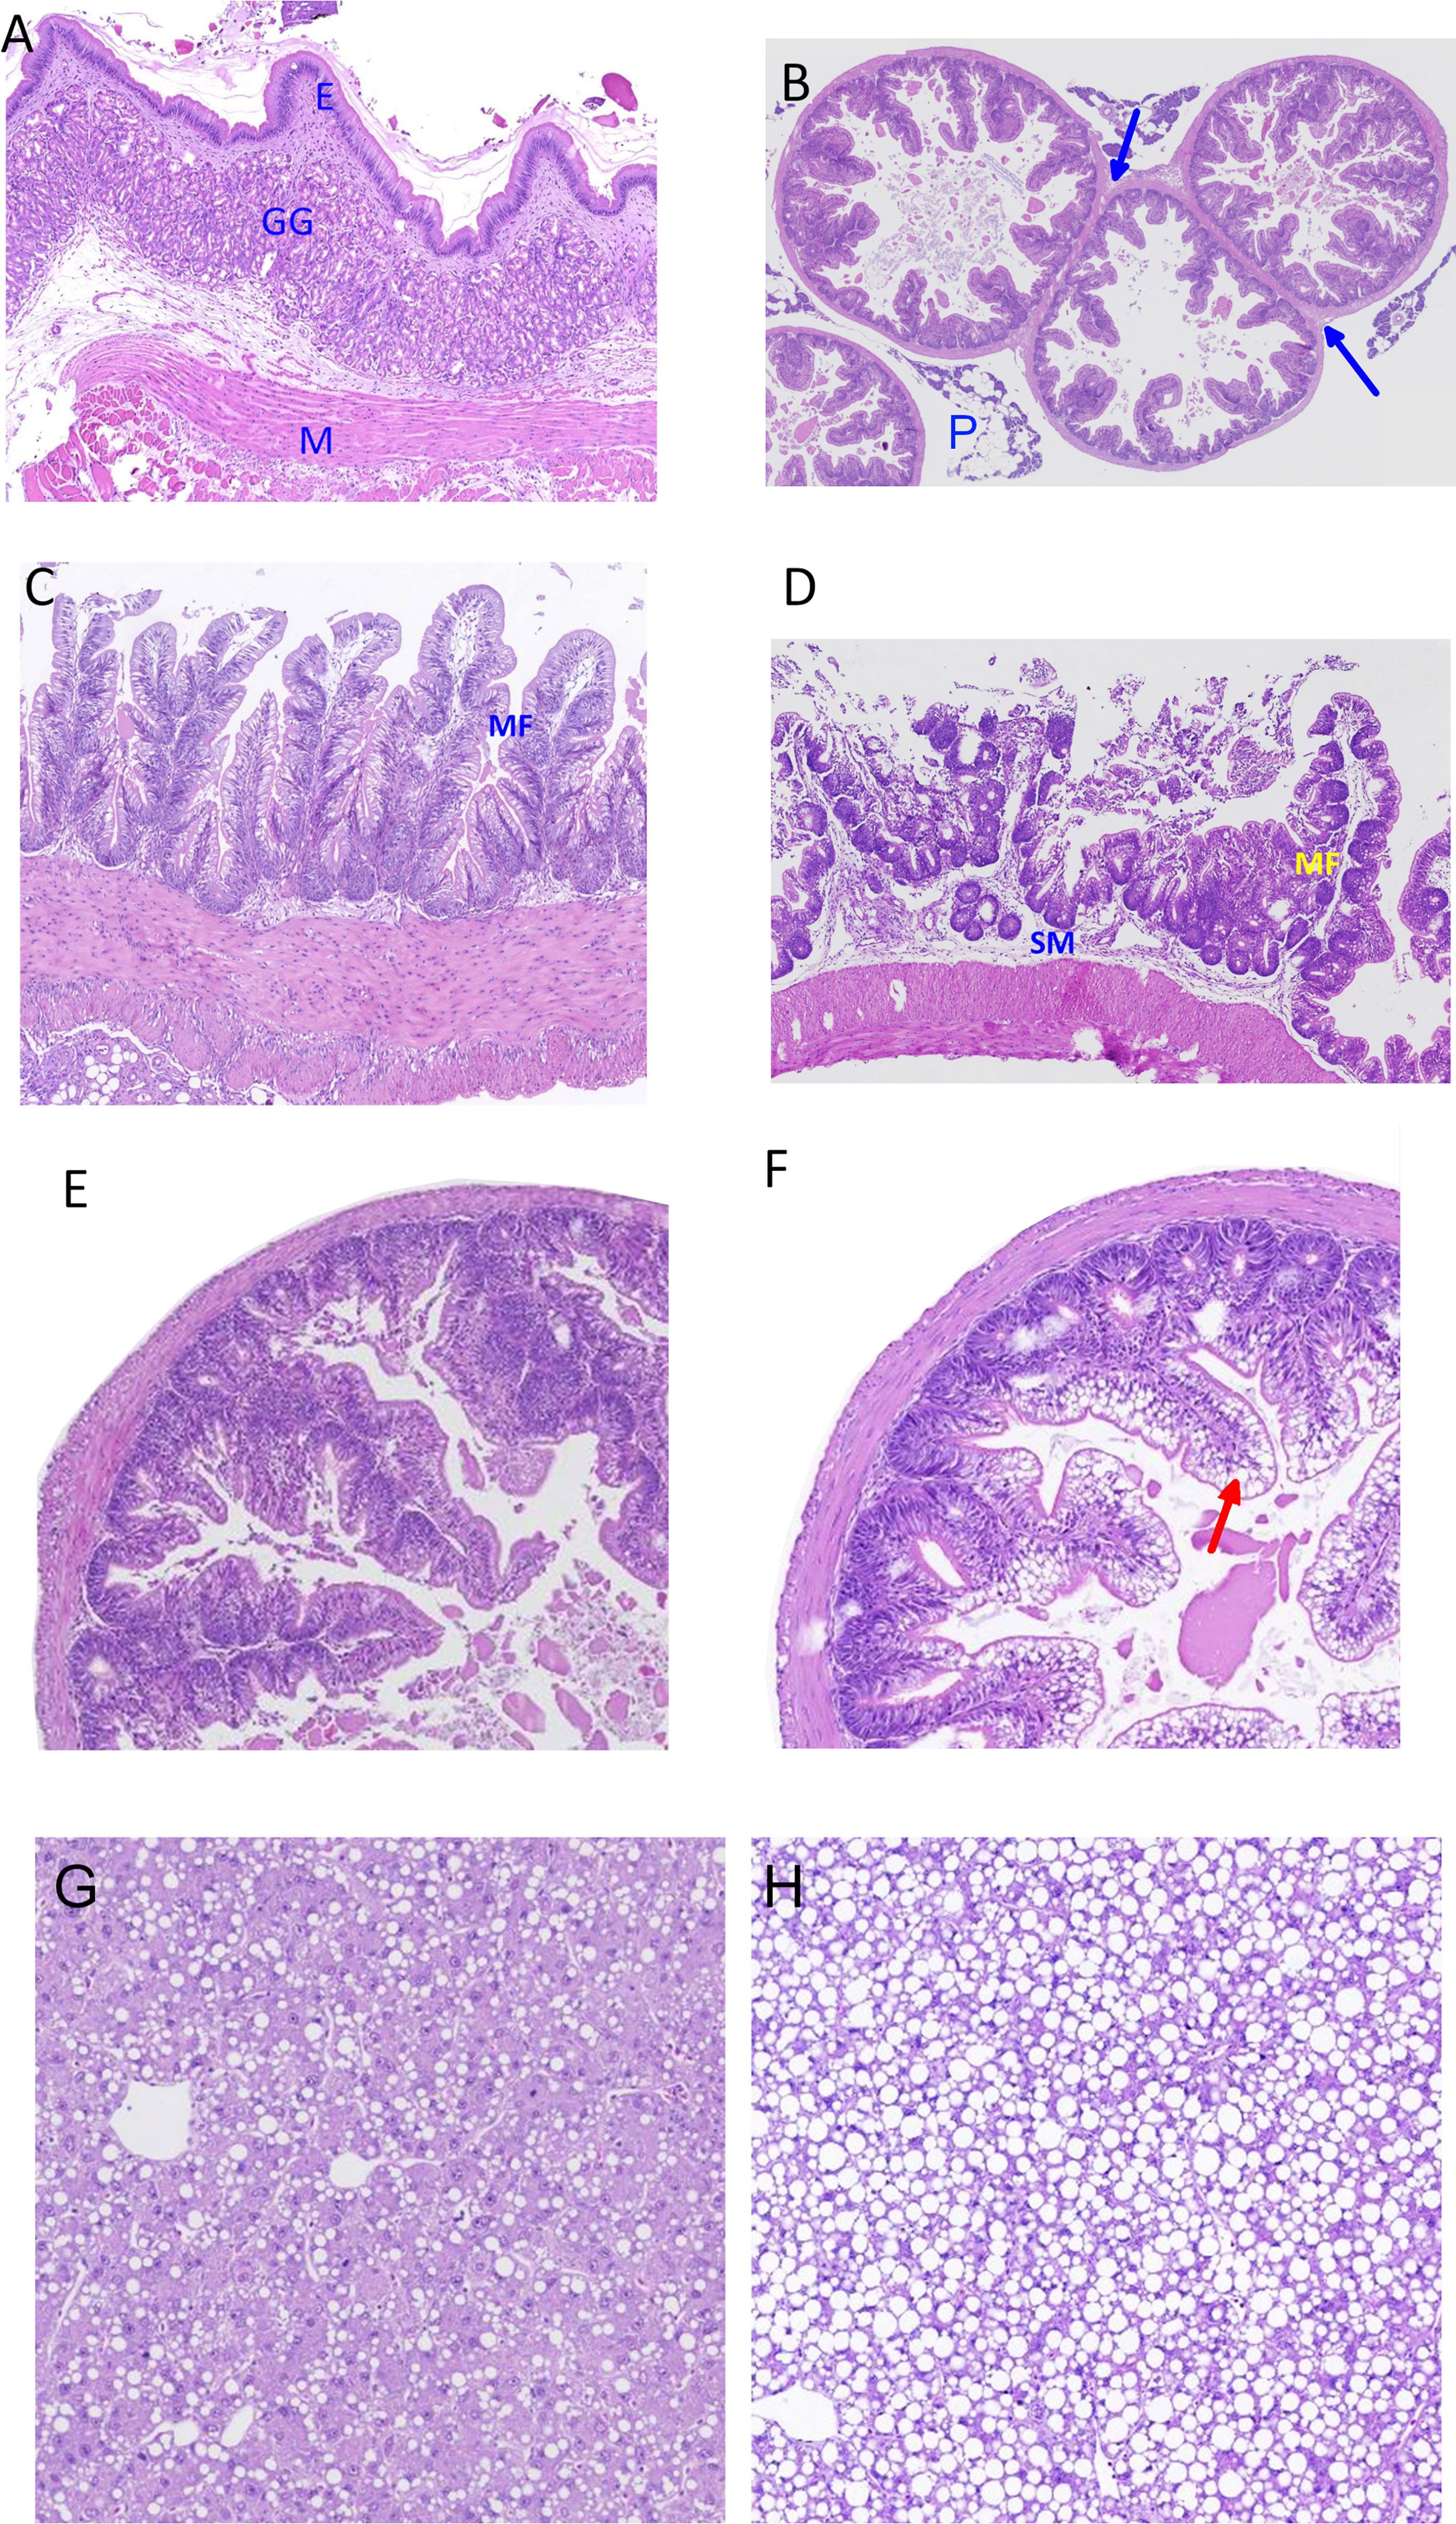
Figure 8 Images of histological characteristics of the mucosa in the stomach (A), pyloric intestine (B), mid intestine (C) and distal intestine (D) of lumpfish, as indicated by H&E staining, and images of pyloric caeca with normal appearance (E) and with clear signs of hypervacuolation/steatosis (F), and images of liver with normal appearance (G) and with clear signs of hypervacuolation/steatosis (H). Image A: E, simple columnar epithelium; GG, gastric glands; M, smooth muscle layer with inner circular and outer longitudinal indicated. Image B: blue arrows indicate the unique feature of fused caeca, the share of muscular and serosal wall, and indicates a point of branching in pyloric caeca; P, pancreatic tissue. Image C: MF, short mucosal folds with short branching and with thin lamina propria and submucosa with sparse cellularity, and a thick muscle layer are apparent. Image D: MF, simple and branched mucosal folds (MF) with enterocytes of no vacuolation; SM, submucosa with and little cellularity. Image F, red arrow indicates vacuolation in enterocytes which is considered a sign of steatosis.
Figures 8E–H show histological features of the cells of the PI and liver in fish fed diets with high protein and low lipid and low protein high lipid levels. Hyper-vacuolization, a symptom of excessive lipid accumulation, so-called steatosis, was observed in both PI and liver. The steatosis level was scored and analyzed for PI, MI, and liver (Figure 9), clearly showing increasing steatosis with increasing lipid level.
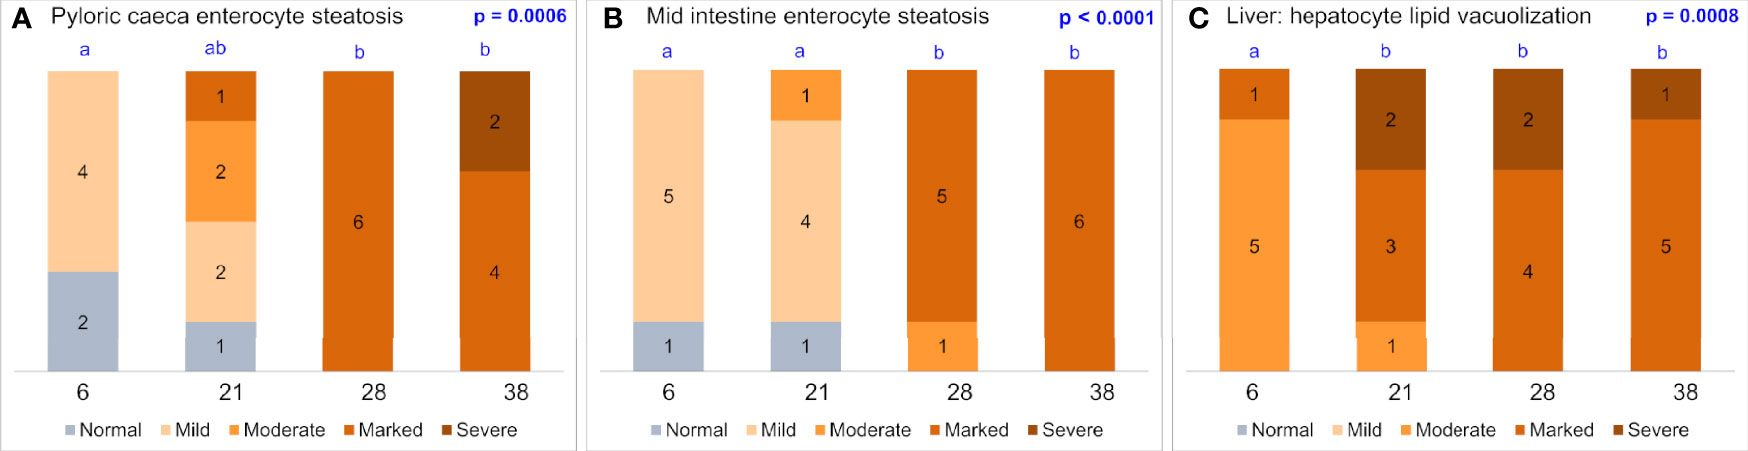
Figure 9 Results of histological scoring of vacuolation in the enterocytes of the pyloric ceaca (A), mid intestine (B) and hepatocytes (C). The numbers of the x-axis indicate level of lipid in the diets, i.e. (Protein (P)/Lipid (L)/Carbohydrates (C): Diet 1: 68/4.3/5.9%; Diet 5: 58/11.9/8.2%; Diet 3: 58/16.4/5.8% and Diet 12: 45/17.3/17.7%, respectively. The x-values 6, 21, 28, and 38 represent the ratio lipid to 100g protein in the diets. Stack bars with different letters above indicate significant difference.
The results of the additional digestibility experiment, E2, are illustrated in Figure 10, showing effects of dietary lipid level on starch, protein, and fatty acid digestibility. Protein digestibility did not change as lipid or starch level varied. Fatty acid digestibility increased as dietary lipid level increased. For saturated fatty acids this effect was not significant, but the results showed the same trend as for other fatty acids (p = 0.06). The digestibility of ω-6 fatty acids was relatively low, between 60% and 68%. Noticeably, starch digestibility decreased greatly as starch level increased, from 84.3% at 6.6% inclusion to 50% at 16% inclusion. This means a mean partial digestibility of the starch increment from 6.6% to 16.0% of about 27% and increase in available starch level from 55-80 g/kg diet.
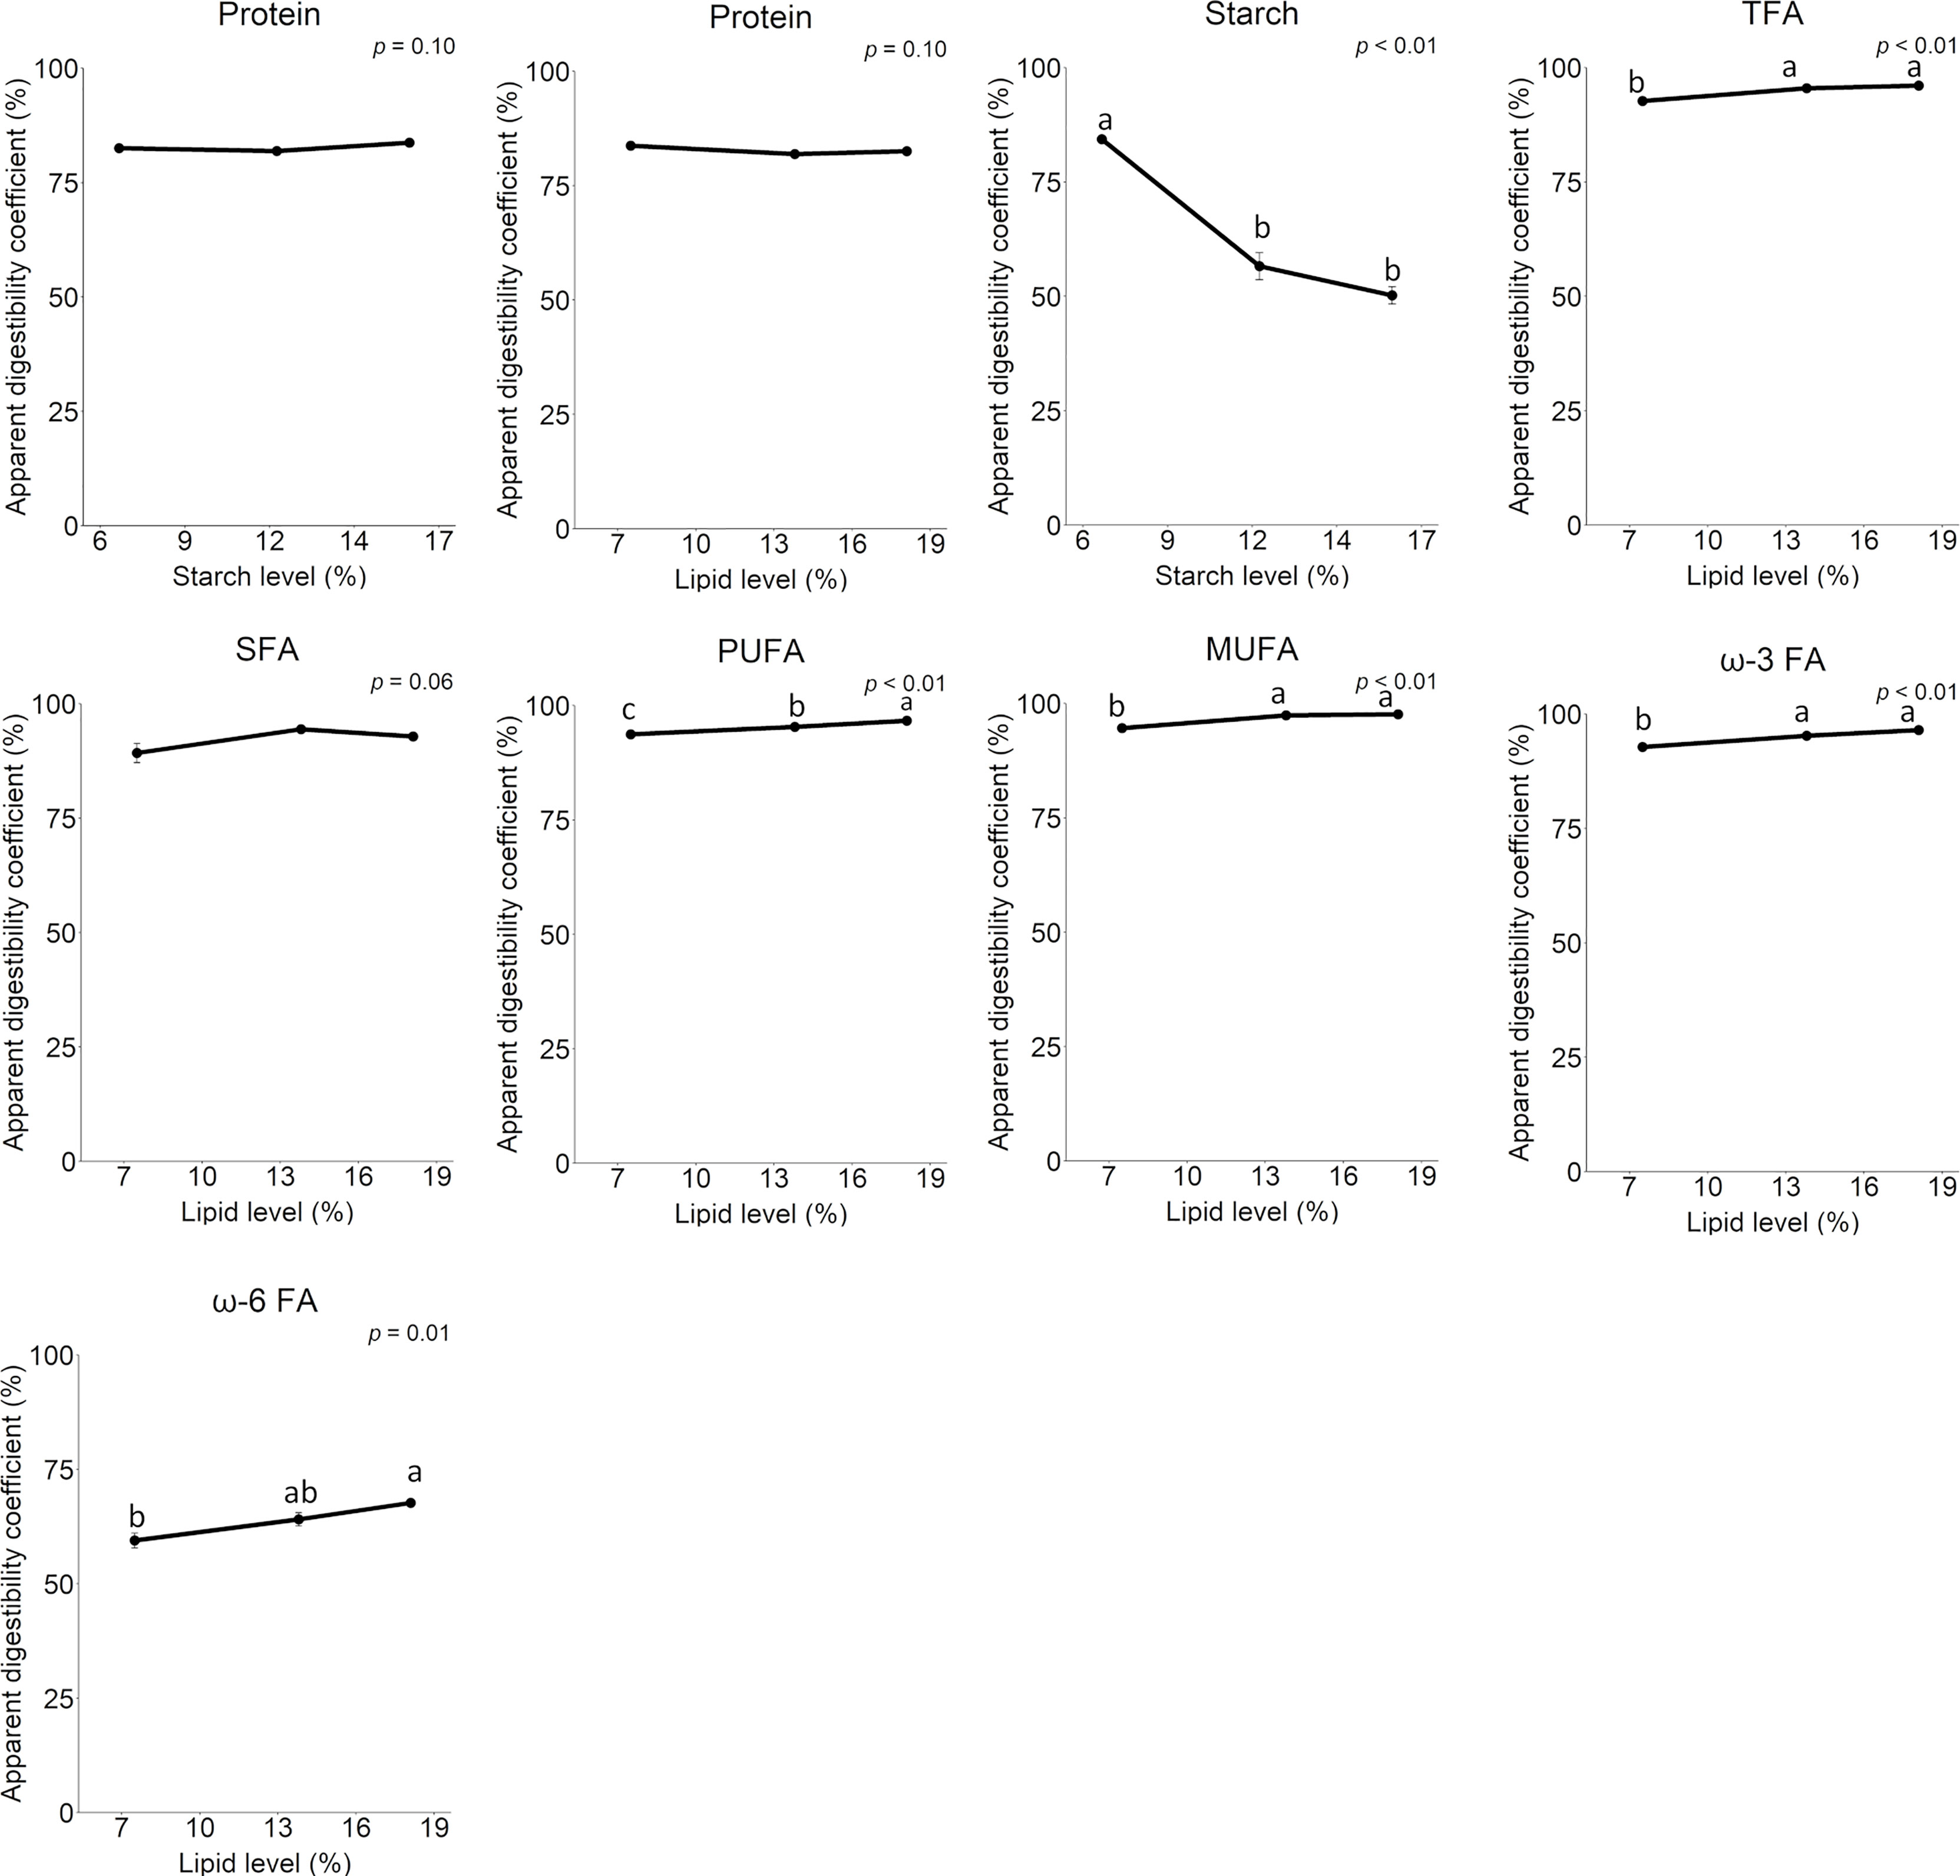
Figure 10 Apparent digestibility coefficients of protein, starch, and total fatty acids. Starch digestibility is related to dietary starch level, total fatty acid digestibility is related to dietary lipid level, and protein digestibility is related to both starch and lipid level. TFAs, total fatty acids; SFA, saturated fatty acids; PUFA, polyunsaturated fatty acids; MUFA, monounsaturated fatty acids; ω-3 FA, omega-3 fatty acids; ω-6 FA, omega-6 fatty acids.
Lumpfish belongs to the family Cyclopteridae in which only lumpfish is commercially produced. It means gut characteristics of evolutionarily relevant species of lumpfish is lacking. In this context, comparing to other fish species of similar feeding habit is a better way to understand our results in lumpfish. Despite of shorter intestinal length to body length compared to lumpfish, Atlantic salmon is also a carnivorous fish with stomach, with available well-defined gut characteristic. Therefore, Atlantic salmon is chosen as a major species for comparison in the following discussion.
The present study greatly improves general knowledge regarding characteristics of the lumpfish intestine and makes comparison with other fish species possible. As studies of similar characteristics of the intestinal tract of Atlantic salmon, employing the same methods and assays as in the present work is available, the present lumpfish results are compared to similarities and differences relative to Atlantic salmon. The weight of the pyloric intestine of lumpfish comprised a much lower proportion of the weight of the intestinal tract than observed in salmon, about 50% compared to about 75% in salmon (Kraugerud et al., 2007). On the other hand, the MI was much larger in lumpfish, about 40% compared to about 5% in salmon, whereas the DI comprised a small part of the intestine of both species, about 10 and 20%, respectively. In the salmon, the enzyme capacities of these intestinal sections reflect the weigh differences, with 70 – 80% of the total capacity (U/kg fish) in the PI (Bakke-McKellep et al., 2008). In the lumpfish, however, of total LAP and maltase capacity, the PI and MI showed similar values, in the range 40 to 50%. The activity (U/mg digesta dry matter) of the pancreatic enzymes, trypsin, amylase, and lipase, measured in content from MI, showed values very different from values observed in Atlantic salmon, in particular for trypsin and lipase. In lumpfish the trypsin activity was 1/6 and lipase 1/10, of values often observed in salmon (Chikwati et al., 2013). Amylase showed values quite similar to those observed in salmon (Froystad et al., 2006). The species differences observed for these pancreatic enzymes may be related to differences in diet composition between the experiments. However, the high activities of trypsin and lipase in the salmon, may also be a result of the breeding program steady improving growth rate and capacity for feed intake and utilization. The similarity of the observed amylase activities in lumpfish and salmon is remarkable, as salmon amylase is known to be rather ineffective. The salmon amylase has at least two amino acid sequence modifications greatly reducing its specific activity, compared, for example, to the amylase of rainbow trout (Oncorhynchus mykiss) which shows values 10 times higher than observed for the Atlantic salmon and herein for lumpfish (Froystad et al., 2006). Our results suggest that similar limitations as in the Atlantic salmon may be present also in the amylase of the lumpfish. Further evidence supporting this is that the starch digestibility decreased to around 50% when dietary starch level increased to 16%, indicating the starch was not efficiently digested and absorbed at levels above 6%.
The decreasing digestibility of starch with increasing dietary inclusion level implicates that the variation in available carbohydrates of the diets was much less than the variation in analyzed level of carbohydrates, in both the E1 and E2 experiment. Variation in analyzed carbohydrates in E1 was from 6 to 18%, whereas available carbohydrate, based on estimates from E2, varied from about 5.5 to 8.1% (almost 30%). This means that the quantitative aspects of effects of analyzed and available carbohydrate levels on the relationships between diet composition and the observed biomarkers might differ substantially. For protein and lipid, the analyzed and available levels differed much less. The impact of variation in these nutrients on the various observed biomarkers would therefore be expected to be quite similar whether based on chemically analyzed values or as levels of digestible nutrients.
Although the amylase activity was not affected by dietary starch, it seemed that the disaccharidase activities were induced at the transcriptional level (si expression) as well as on the enzymatic level (maltase specific activity and capacity) in MI, shown as slight positive relationship with carbohydrate level. Similar relationships have been observed also in Atlantic salmon and rainbow trout (Krogdahl et al., 2004). The mechanisms underlying such effects cannot, however, be found based on the available results in the present study. These effects may be related to the increased amount of digested starch (5.6, 6.6 and 8.1 g/100g diet in E2) when dietary starch increased as the digested starch provided substrates, i.e., maltose, which may have induced disaccharidase expression and activity. Besides this, bacteria inhabiting the intestine of fish and the metabolites produced by these, may influence host intestinal metabolism and homeostasis, i.e. macronutrient and cholesterol metabolism (Le Roy et al., 2019), as well as immune regulations (Zhang et al., 2017). Therefore, the undigested starch remaining in the lumen might influence intestinal metabolism and immune regulations in lumpfish by altering intestinal microbiota composition. This suggestion is in line the results recently reported from experiments with the pompano (Trachinotus ovatus) (Zhao et al., 2020) and largemouth bass (Micropterus salmoides) (Zhang et al., 2020). Gut microbiota were not investigated in the present study but deserves attention in further studies. All in all, it can be concluded that the diet for lumpfish should not contain high level of dietary starch, as this will not be utilized by the fish, and instead increase environmental pollution, and may also harm production and health of the lumpfish.
The diet effects observed for OSI of PI and MI in E1, with a positive, linear relationship with dietary lipid level, indicate increased lipid accumulation in the intestinal tissue, and were confirmed by the histologically apparent elevation of the number of vacuoles in enterocytes of PI and MI. These changes may result from either excessive dietary lipid content, or deficiency of substances essential for lipid transport and metabolism. Enterocyte lipid accumulation has been observed in studies of Atlantic cod (Gadus morhua) (Kjaer et al., 2009), pikeperch (Sander lucioperca) (Kowalska et al., 2011) and Atlantic salmon (Penn, 2011) in which lipid accumulation was observed as an increase in the presence of lipid droplet in enterocytes of fish fed high-fat diets. The cause of the lipid accumulation in these fish may be deficient supply of essential nutrients necessary for efficient transport of lipid through the enterocytes. Deficiency of essential fatty acids have been observed to cause lipid accumulation in the enterocytes of Atlantic salmon (Olsen et al., 1999; Olsen et al., 2003; Bou et al., 2017).Choline is another nutrient recently shown to be essential for Atlantic salmon and signs of deficiency comprise similar symptoms (Hansen et al., 2020). Whether deficient supply of essential fatty acids, choline, or some other essential nutrient involved in lipid transport and metabolism are causing the histological alterations observed in the present study, cannot be concluded upon due to lack of knowledge. Great efforts are needed to define nutrient requirement of lumpfish, necessary to secure good health and welfare.
Among the genes investigated in the present work, two are involved in lipid transport, i.e., slc27a4, coding for the principal long chain fatty acid transporter (Krammer et al., 2011; Mitchell et al., 2011), and npc1l1, a cholesterol transporter and key actor in absorption of cholesterol by enterocytes and hepatocytes (Davis et al., 2004; Betters and Yu, 2010). The independence of expression of slc27a4 in PI and MI of the lumpfish on dietary lipid and choline level, is in line with results from Atlantic salmon (Hansen et al., 2020). The trend of decreasing expression of npc1l1 with increasing lipid level and decreasing choline level indicates that this might be a compensatory mechanism related to the increasing dietary cholesterol. This is in line with the results from salmon fed a choline deficient diet (Kortner et al., 2014; Krogdahl et al., 2020).
The results observed for the genes, mmp13, rela, igm and cxcl19, all involved in regulation of immune responses, suggest that the immune functions located in MI are more responsive to macronutrient variation than those located in PI and DI. The decrease in expression of mmp13 and igm, with increasing lipid level indicate responses in the activity of B cells (igm), and lymphocyte recruitment (mmp13) (Xu et al., 2018). These responses may be related to the increasing level of ω3-PUFAs with increasing dietary lipid level, i.e., increased levels of fish oil. Earlier studies have shown that ω3-PUFAs, mainly eicosapentaenoic acid (EPA) and docosahexaenoic acid (DHA), may inhibit expression of immune relevant genes (Teitelbaum and Walker, 2001; Calder, 2008). Also results of in vitro studies have shown suppression of B cells by EPA and DHA (Wang et al., 2011; Yang et al., 2016).
The results which showed effects of carbohydrate level on the intestinal immune regulation, indicated by altered expression of rela, cox2, mmp13, cxcl19, and pcna in MI, must be interpreted with caution, as the digestibility, and therefore the availability of the starch, decreased greatly with increasing dietary inclusion level. This fact makes interpretation of the results of the four genes rela, cox2, cxcl19, and pcna particularly challenging as they showed quadratic responses and with different maxima and minima. Further studies are needed before the results regarding effects of variation in carbohydrate level can be discussed and concluded upon.
Although certain effects of diet composition on immune related genes were observed, the histological observations did not show important symptoms of inflammation. The diet effects on expression of immune genes can therefore merely be reflections of normal adjustments to variation in diet composition. It is also possible, however, that they indicate altered resistance to pathogens such as bacteria or virus, for the better or worse. Challenge tests should therefore be conducted to clarify such possible effects.
To get an overview of the present results, they are summarized in Table 5 with indication of the nutrient level (low, medium or high) which gives minimum and maximum for the variables which showed a statistically significant relationship with diet composition and visually apparent relationship with dietary level of macronutrients in Figures 3–10. The MI seemed to show the clearest picture, whereas the pictures for DI and the liver were less clear. Based on the results for MI, the maximum results for the biomarkers of digestive functions were observed for diets with medium to high protein level. For the indicators of protein digestion (LAP and slc15a1), the highest value was observed at medium protein, low lipid, and high carbohydrate level, for carbohydrate digestion (MALT and si) the highest results were found for medium protein, high carbohydrate, and low lipid level, whereas for lipid digestion (lipase) the highest results were observed for diets with high protein, low lipid, and low carbohydrate level. For the biomarkers of immune functions in MI, high values were found at low lipid and carbohydrate levels for most of the biomarkers. The minimum results were found at low to medium level of protein and high level of lipid and carbohydrates. As the activity of lipase (Krogdahl and Sell, 1989) and maltase, as well as expression of a number of immune related genes showed the lowest values at low protein level, the results indicate that the diets with low protein level were protein deficient. It is well known that protein deficiency severely affects the immune functions and disease resistance in animals including humans (Carrillo et al., 2014). It should be kept in mind that the gut mucosa is among the most dynamic tissues in an animal body and has a great capacity to adapt to diet composition (Olli et al., 1994). Therefore, the finding that level of LAP was low at low protein level may reflect low production of peptidases at low dietary protein level rather than protein deficiency, in accordance with the need for efficient protein digestion. The effects of carbohydrate level were less clear regarding indication of minimum and maximum of the biomarkers. This may be related to the fact that the range of available carbohydrates among the diets was rather small, resulting in less clear relationships. Based on the present results, it is not possible to conclude firmly regarding optimal macronutrient balance in lumpfish diets.
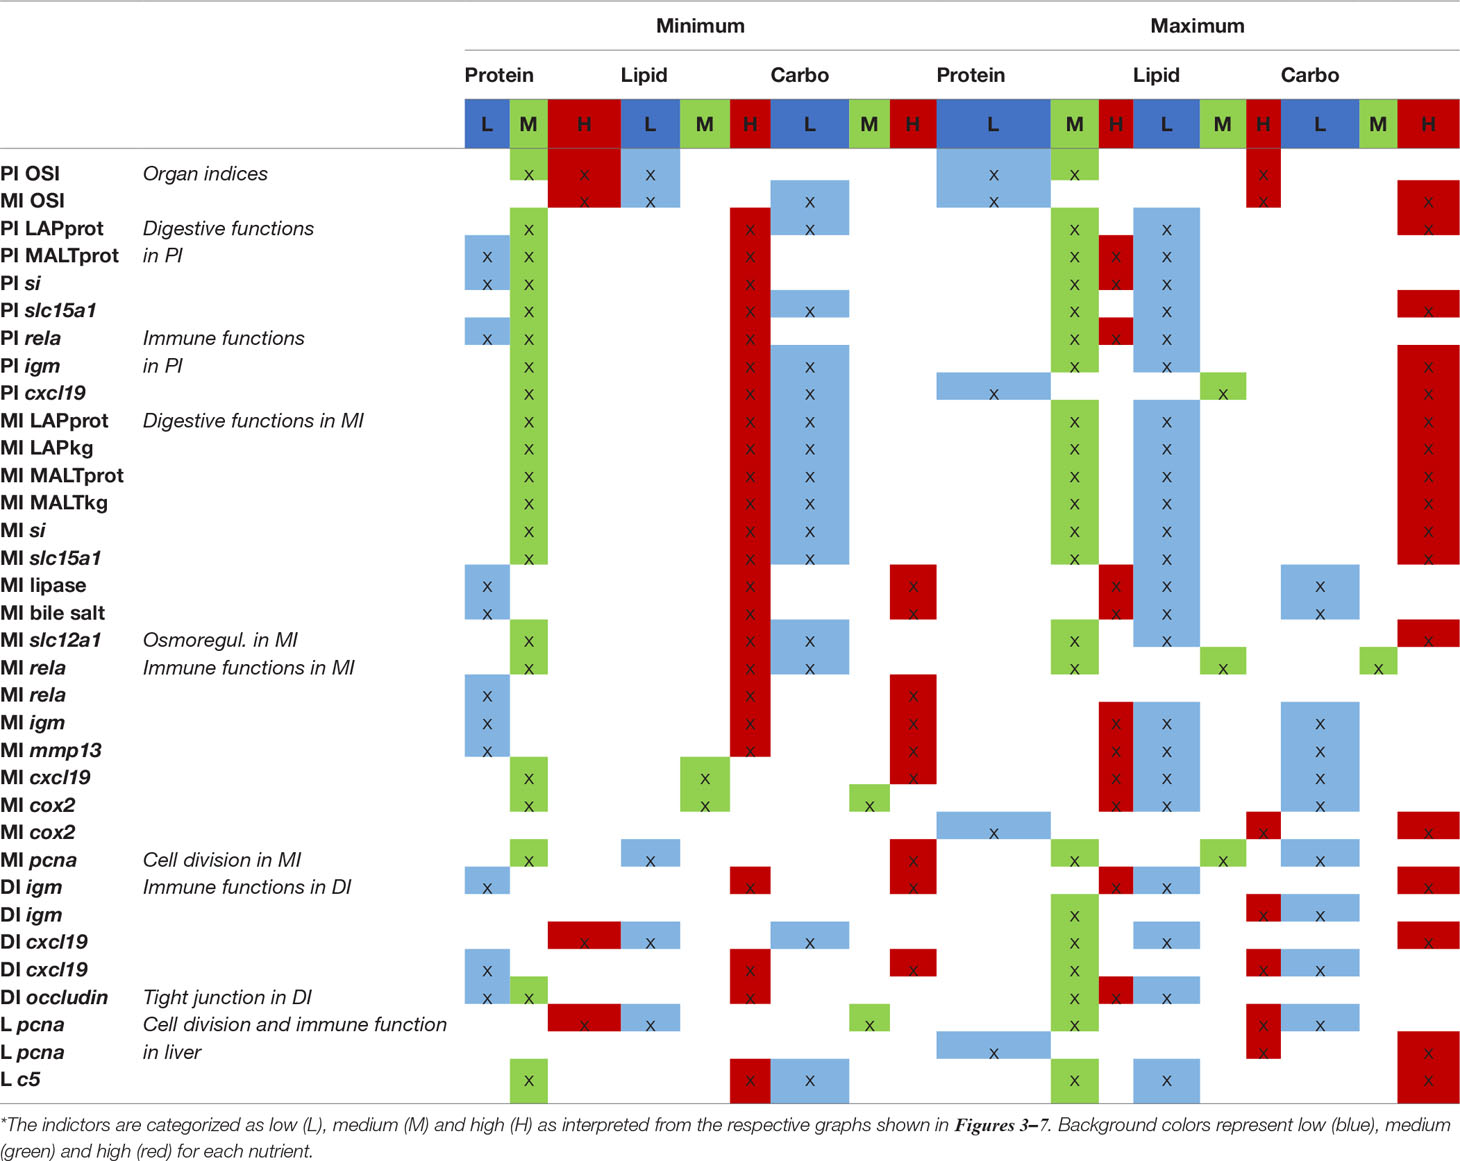
Table 5 Indication of position in the triangle of minimum and maximum for the biomarkers which showed apparent relationship with macronutrient content of the diets*.
As mentioned in the introduction, our previously published results from E1, indicated that peak performance of lumpfish weighing between 15 and 50g, based on growth, body composition, welfare score and immune responses in isolated head kidney cells, would be obtained with a diet containing 55% protein, minimum 17% lipid and maximum 6% carbohydrate (Hamre et al., 2022). The present results, showing very low starch digestibility, suggest that dietary starch level should be limited to about 6%. The intestinal immune related biomarkers showed a linear relationship with the dietary protein/lipid ratio at low carbohydrate, with the highest response at maximum protein level. Since it is not certain if strong immune responses in unchallenged tissues is positive or negative for the fish, a recommendation on the optimal macronutrient composition cannot be given based on the present results regarding immune function. However, according to Hamre et al. (2022), head kidney cells from fish fed the diet with the maximum level of protein, showed a suboptimal immune response when challenged with lipopolysaccharide (LPS). Fish fed the diet with the highest growth (55, 17, 6) had a normal immune response. In line with this, the present results do not suggest alteration in the conclusion presented in our previous paper, i.e., that for peak performance a diet with high lipid, minimum carbohydrate and medium protein is optimal for lumpfish of 10-50g.
The current study improved knowledge regarding responses to dietary macronutrient composition in lumpfish intestine via a three-component mixture design. The intestinal functions were broadly impacted by increasing lipid level in the diet with corresponding decrease in protein level, including digestion of polypeptides, maltose and lipid, absorption of fatty acids and peptides, and immune regulations that involve rela, igm and cxcl19 and mmp13. Elevated lipid digestibility by dietary lipid level was also observed. Although alteration by dietary carbohydrate to protein level was observed on multiple parameters, such as the expression of igm and mmp13, we should be careful considering the influence of carbohydrate variation because of low starch digestibility when dietary starch level was above 6%. In all, a diet of 55% protein, 17% lipid and 6% carbohydrate is recommended for lumpfish.
Among the many questions to which answers are urgently needed for the feed industry to be able to produce nutritionally well-balanced feeds for lumpfish, the present study answers only a few. Further information is urgently needed and should be addressed in future research. Examples of questions which need answers regard optimal inclusion of available macronutrients, vitamin and minerals, for growth, function as lice cleaners and, not at least, immune functions and disease resistance.
The original contributions presented in the study are included in the article/Supplementary Material. Further inquiries can be directed to the corresponding author.
The animal study was reviewed and approved by Norwegian Food Safety Authority.
WZ analyzed samples and data processing, and drafting and completing of the manuscript. ÅK and TK overviewed the analyses, joined the data processing and writing of the manuscript. KK, KH, ØS, IL and GB participated in planning of experimental design and feed formulation. KK was in charge of feed production. GB was in charge of the feeding trial. EC performed histological analysis and related statistics. KH conducted statistics related to the mixture design. All authors contributed to the article and approved the submitted version.
This study was funded by the Norwegian Seafood Research Fund (FHF) as part of the project CleanFeed, research no. 901331.
The authors declare that the research was conducted in the absence of any commercial or financial relationships that could be construed as a potential conflict of interest.
All claims expressed in this article are solely those of the authors and do not necessarily represent those of their affiliated organizations, or those of the publisher, the editors and the reviewers. Any product that may be evaluated in this article, or claim that may be made by its manufacturer, is not guaranteed or endorsed by the publisher.
The authors acknowledge the contributions of the laboratory collaborators from IMR (Institute of Marine Research in Norway) and Nofima AS BioLab and Aqualab, for the execution of chemical analyses in feeds, the staff of the Feed Technology Center of Nofima in Bergen for the experimental feed production, the staff of MOWI and Nofima Aquaculture Research Center Sunndalsøra for the execution of the fish feeding trials, and the technicians of the Nutrition and health group at Faculty of Veterinary Medicine, University of Life Sciences (NMBU) for skillful assistance of the assays.
The Supplementary Material for this article can be found online at: https://www.frontiersin.org/articles/10.3389/fmars.2022.889778/full#supplementary-material
Baeverfjord G., Krogdahl A. (1996). Development and Regression of Soybean Meal Induced Enteritis in Atlantic Salmon, Salmo Salar L, Distal Intestine: A Comparison With the Intestines of Fasted Fish. J. Fish. Dis. 19 (5), 375–387. doi: 10.1111/j.1365-2761.1996.tb00376.x
Bakke-McKellep A. M., Sanden M., Danieli A., Acierno R., Hemre G. I., Maffia M., et al. (2008). Atlantic Salmon (Salmo Salar L.) Parr Fed Genetically Modified Soybeans and Maize: Histological, Digestive, Metabolic, and Immunological Investigations. Res. In Vet. Sci. 84 (3), 395–408. doi: 10.1016/j.rvsc.2007.06.008
Betters J. L., Yu L. Q. (2010). NPC1L1 and Cholesterol Transport. FEBS Lett. 584 (13), 2740–2747. doi: 10.1016/j.febslet.2010.03.030
Bou M., Berge G. M., Baeverfjord G., Sigholt T., Ostbye T. K., Romarheim O. H., et al. (2017). Requirements of N-3 Very Long-Chain PUFA in Atlantic Salmon (Salmo Salar L): Effects of Different Dietary Levels of EPA and DHA on Fish Performance and Tissue Composition and Integrity. Br. J. Nutr. 117 (1), 30–47. doi: 10.1017/S0007114516004396
Brockman H. L. (1981). [72] Triglyceride Lipase From Porcine Pancreas: EC 3.1. 1.3 Triacylglycerol Acylhydrolase. Methods Enzymol. 71, 619–627. doi: 10.1016/0076-6879(81)71074-7
Calder P. C. (2008). The Relationship Between the Fatty Acid Composition of Immune Cells and Their Function. Prostaglandins Leukotrienes Essential Fatty Acids 79 (3-5), 101–108. doi: 10.1016/j.plefa.2008.09.016
Carrillo E., Jimenez M. A., Sanchez C., Cunha J., Martins C. M., Seva A. D., et al. (2014). Protein Malnutrition Impairs the Immune Response and Influences the Severity of Infection in a Hamster Model of Chronic Visceral Leishmaniasis. PLoS One 9 (2). e89412. doi: 10.1371/journal.pone.0089412
Chikwati E., Sahlmann C., Holm H., Penn H., Krogdahl A., Bakke A. (2013). Alterations in Digestive Enzyme Activities During the Development of Diet-Induced Enteritis in Atlantic Salmon, Salmo Salar L. Aquaculture 402, 28–37. doi: 10.1016/j.aquaculture.2013.03.023
Cornell J. A. (2011). Experiments With Mixtures: Designs, Models, and the Analysis of Mixture Data (New York: John Wiley & Sons Inc).
Dahlqvist A. (1970). Assay of Intestinal Disaccharidases. Enzymol. Biol. Clin. 11, 52–66. doi: 10.1159/000458348
Davis H. R., Zhu L. J., Hoos L. M., Tetzloff G., Maguire M., Liu J. J., et al. (2004). Niemann-Pick C1 Like 1 (NPC1L1) is the Intestinal Phytosterol and Cholesterol Transporter and a Key Modulator of Whole-Body Cholesterol Homeostasis. J. Biol. Chem. 279 (32), 33586–33592. doi: 10.1074/jbc.M405817200
Froystad M. K., Lilleeng E., Sundby A., Krogdahl Å. (2006). Cloning and Characterization of Alpha-Amylase From Atlantic Salmon (Salmo Salar L.). Comp. Biochem. Physiol. a-Molecular Integr. Physiol. 145 (4), 479–492. doi: 10.1016/j.cbpa.2006.08.003
Garcia-Hernandez V., Quiros M., Nusrat A. (2017). Intestinal Epithelial Claudins: Expression and Regulation in Homeostasis and Inflammation. Annu. NY Acad. Sci. 1397 (1), 66–79. doi: 10.1111/nyas.13360
Gregorio S. F., Fuentes J. (2018). Regulation of Bicarbonate Secretion in Marine Fish Intestine by the Calcium-Sensing Receptor. Int. J. Mol. Sci. 19 (4), 14. doi: 10.3390/ijms19041072
Grosell M. (2006). Intestinal Anion Exchange in Marine Fish Osmoregulation. J. Exp. Biol. 209 (15), 2813–2827. doi: 10.1242/jeb.02345
Gu M., Kortner T. M., Penn M., Hansen A. K., Krogdahl A. (2014). Effects of Dietary Plant Meal and Soya-Saponin Supplementation on Intestinal and Hepatic Lipid Droplet Accumulation and Lipoprotein and Sterol Metabolism in Atlantic Salmon (Salmo Salar L.). Br. J. Nutr. 111 (3), 432–444. doi: 10.1017/S0007114513002717
Hamre K., Berge G. M., Saele Ø., Holen E., Kousoulaki K., Remo S. C., et al. (2022). Optimization of the Balance Between Protein, Lipid and Carbohydrate in Diets for Lumpfish (Cyclopterus Lumpus). Aquacult. Nutr. 2022, 1–15. doi: 10.1155/2022/1155989
Hamre K., Mangor-Jensen A. (2006). A Multivariate Approach to Optimization of Macronutrient Composition in Weaning Diets for Cod (Gadus Morhua). Aquacult. Nutr. 12 (1), 15–24. doi: 10.1111/j.1365-2095.2006.00377.x
Hamre K., Nordgreen A., Grotan E., Breck O. (2013). A Holistic Approach to Development of Diets for Ballan Wrasse (Labrus Berggylta) - a New Species in Aquaculture. PeerJ 1, e99. doi: 10.7717/peerj.99
Hamre K., Ofsti A., Naess T., Nortvedt R., Holm J. C. (2003). Macronutrient Composition of Formulated Diets for Atlantic Halibut (Hippoglossus Hippoglossus, L.) Juveniles. Aquaculture 227 (1-4), 233–244. doi: 10.1016/s0044-8486(03)00506-4
Hansen A. K. G., Kortner T. M., Krasnov A., Bjorkhem I., Penn M., Krogdahl Å. (2020). Choline Supplementation Prevents Diet Induced Gut Mucosa Lipid Accumulation in Post-Smolt Atlantic Salmon (Salmo Salar L.). BMC Vet. Res. 16 (1). 1–15. doi: 10.1186/s12917-020-2252-7
Hu H. B., Kortner T. M., Gajardo K., Chikwati E., Tinsley J., Krogdahl A. (2016). Intestinal Fluid Permeability in Atlantic Salmon (Salmo Salar L.) Is Affected by Dietary Protein Source. PLoS One 11 (12). e0167515. doi: 10.1371/journal.pone.0167515
Imsland A. K., Reynolds P., Eliassen G., Hangstad T. A., Nytro A. V., Foss A., et al. (2015). Feeding Preferences of Lumpfish (Cyclopterus Lumpus L.) Maintained in Open Net-Pens With Atlantic Salmon (Salmo Salar L.). Aquaculture 436, 47–51. doi: 10.1016/j.aquaculture.2014.10.048
Imsland A. K. D., Reynolds P., Jonassen T. M., Hangstad T. A., Adron J., Elvegard T. A., et al. (2019a). Comparison of Diet Composition, Feeding, Growth and Health of Lumpfish (Cyclopterus Lumpus L.) Fed Either Feed Blocks or Pelleted Commercial Feed. Aquacult. Res. 50 (7), 1952–1963. doi: 10.1111/are.14083
Imsland A. K. D., Reynolds P., Jonassen T. M., Hangstad T. A., Elvegard T. A., Urskog T. C., et al. (2018). Effects of Three Commercial Diets on Growth, Cataract Development and Histopathology of Lumpfish (Cyclopterus Lumpus L.). Aquacult. Res. 49 (9), 3131–3141. doi: 10.1111/are.13776
Imsland A. K. D., Reynolds P., Jonassen T. M., Hangstad T. A., Elvegard T. A., Urskog T. C., et al. (2019b). Effects of Different Feeding Frequencies on Growth, Cataract Development and Histopathology of Lumpfish (Cyclopterus Lumpus L.). Aquaculture 501, 161–168. doi: 10.1016/j.aquaculture.2018.11.026
Ingolfsson A., Kristjansson B. K. (2002). Diet of Juvenile Lumpsucker Cyclopterus Lumpus (Cyclopteridae) in Floating Seaweed: Effects of Ontogeny and Prey Availability. Copeia 2, 472–476. doi: 10.1643/0045-8511(2002)002[0472:Dojlcl]2.0.Co;2
Kakade M. L., Hoffa D. E., Liener I. E. (1973). Contribution of Trypsin-Inhibitors to Deleterious Effects of Unheated Soybeans Fed to Rats. J. Nutr. 103 (12), 1772–1778. doi: 10.1093/jn/103.12.1772
Kjaer M. A., Vegusdal A., Berge G. M., Galloway T. F., Hillestad M., Krogdahl Å., et al. (2009). Characterisation of Lipid Transport in Atlantic Cod (Gadus Morhua) When Fasted and Fed High or Low Fat Diets. Aquaculture 288 (3-4), 325–336. doi: 10.1016/j.aquaculture.2008.12.022
Knudsen D., Uran P., Arnous A., Koppe W., Frokiaer H. (2007). Saponin-Containing Subfractions of Soybean Molasses Induce Enteritis in the Distal Intestine of Atlantic Salmon. J. Agric. Food Chem. 55 (6), 2261–2267. doi: 10.1021/jf0626967
Kortner T. M., Bjorkhem I., Krasnov A., Timmerhaus G., Krogdahl A. (2014). Dietary Cholesterol Supplementation to a Plant-Based Diet Suppresses the Complete Pathway of Cholesterol Synthesis and Induces Bile Acid Production in Atlantic Salmon (Salmo Salar L.). Br. J. Nutr. 111 (12), 2089–2103. doi: 10.1017/S0007114514000373
Kortner T. M., Valen E. C., Kortner H., Marjara I. S., Krogdahl A., Bakke A. M. (2011). Candidate Reference Genes for Quantitative Real-Time PCR (qPCR) Assays During Development of a Diet-Related Enteropathy in Atlantic Salmon (Salmo Salar L.) and the Potential Pitfalls of Uncritical Use of Normalization Software Tools. Aquaculture 318 (3-4), 355–363. doi: 10.1016/j.aquaculture.2011.05.038
Kowalska A., Zakes Z., Jankowska B., Demska-Zakes K. (2011). Effect of Different Dietary Lipid Levels on Growth Performance, Slaughter Yield, Chemical Composition, and Histology of Liver and Intestine of Pikeperch, Sander Lucioperca. Czech J. Anim. Sci. 56 (3), 136–149. doi: 10.17221/1298-Cjas
Krammer J., Digel M., Ehehalt F., Stremmel W., Fullekrug J., Ehehalt R. (2011). Overexpression of CD36 and Acyl-CoA Synthetases FATP2, FATP4 and ACSL1 Increases Fatty Acid Uptake in Human Hepatoma Cells. Int. J. Med. Sci. 8 (7), 599–614. doi: 10.7150/ijms.8.599
Kraugerud O. F., Penn M., Storebakken T., Refstie S., Krogdahl A., Svihus B. (2007). Nutrient Digestibilities and Gut Function in Atlantic Salmon (Salmo Salar) Fed Diets With Cellulose or non-Starch Polysaccharides From Soy. Aquaculture 273 (1), 96–107. doi: 10.1016/j.aquaculture.2007.09.013
Krogdahl A., Bakke-McKellep A. M., Baeverfjord G. (2003). Effects of Graded Levels of Standard Soybean Meal on Intestinal Structure, Mucosal Enzyme Activities, and Pancreatic Response in Atlantic Salmon (Salmo Salar L.). Aquacult. Nutr. 9 (6), 361–371. doi: 10.1046/j.1365-2095.2003.00264.x
Krogdahl A., Gajardo K., Kortner T. M., Penn M., Gu M., Berge G. M., et al. (2015). Soya Saponins Induce Enteritis in Atlantic Salmon (Salmo Salar L.). J. Agric. Food Chem. 63 (15), 3887–3902. doi: 10.1021/jf506242t
Krogdahl Å., Hansen A. K. G., Kortner T. M., Bjӧrkhem I., Krasnov A., Berge G. M., et al. (2020). Choline and Phosphatidylcholine, But Not Methionine, Cysteine, Taurine and Taurocholate, Eliminate Excessive Gut Mucosal Lipid Accumulation in Atlantic Salmon (Salmo Salar L). Aquaculture 528. 735552. doi: 10.1016/j.aquaculture.2020.735552
Krogdahl Å., Nordrum S., Sørensen M., Brudeseth L., Røsjø C. (1999). Effects of Diet Composition on Apparent Nutrient Absorption Along the Intestinal Tract and of Subsequent Fasting on Mucosal Disaccharidase Activities and Plasma Nutrient Concentration in Atlantic Salmon, Salmo Salar L. Aquacult. Nutr. 5 (2), 121–133. doi: 10.1046/j.1365-2095.1999.00095.x
Krogdahl Å., Sell J. L. (1989). Influence of Age on Lipase, Amylase, and Protease Activities in Pancreatic Tissue and Intestinal Contents of Young Turkeys. Poultry Sci. 68 (11), 1561–1568. doi: 10.3382/ps.0681561
Krogdahl Å., Sundby A., Olli J. J. (2004). Atlantic Salmon (Salmo Salar) and Rainbow Trout (Oncorhynchus Mykiss) Digest and Metabolize Nutrients Differently. Effects of Water Salinity and Dietary Starch Level. Aquaculture 229 (1-4), 335–360. doi: 10.1016/S0044-8486(03)00396-X
Kruse-Jarres J. D., Kaiser C., Hafkenscheid J. C. M., Hohenwallner W., Stein W., Bohner J., et al. (1989). Evaluation of a New Alpha-Amylase Assay Using 4.6-Ethylidene-(G7)-1-4-Nitrophenyl-(G1)-Alpha-D-Maltoheptaoside as Substrate. J. Clin. Chem. Clin. Biochem. 27 (2), 103–113. doi: 10.1515/cclm.1989.27.2.103
Le Roy T., Lecuyer E., Chassaing B., Rhimi M., Lhomme M., Boudebbouze S., et al. (2019). The Intestinal Microbiota Regulates Host Cholesterol Homeostasis. BMC Biol. 17 (1). 1–18. doi: 10.1186/s12915-019-0715-8
Mitchell R. W., On N. H., Del Bigio M. R., Miller D. W., Hatch G. M. (2011). Fatty Acid Transport Protein Expression in Human Brain and Potential Role in Fatty Acid Transport Across Human Brain Microvessel Endothelial Cells. J. Neurochem. 117 (4), 735–746. doi: 10.1111/j.1471-4159.2011.07245.x
Muller P. Y., Janovjak H., Miserez A. R., Dobbie Z. (2002). Processing of Gene Expression Data Generated by Quantitative Real-Time RT-PCR. Biotechniques 32 (6), 1372.
Munro L. A. (2020). “Scottish Fish Farm Production Survey 2019” (Scotland: The Scottish Government). https://www.fiskeridir.no/English/Aquaculture/Statistics/Cleanerfish-Lumpfish-and-Wrasse
Norwegian Directorate of Fisheries. (2021). Available at: https://www.fiskeridir.no/English/Aquaculture/Statistics/Cleanerfish-Lumpfish-and-Wrasse
O’Fallon J. V., Busboom J. R., Nelson M. L., Gaskins C. T. (2007). A Direct Method for Fatty Acid Methyl Ester Synthesis: Application to Wet Meat Tissues, Oils, and Feedstuffs. J. Anim. Sci. 85 (6), 1511–1521. doi: 10.2527/jas.2006-491
Olli J. J., Hjelmeland K., Krogdahl Å. (1994). Soybean Trypsin Inhibitors in Diets for Atlantic Salmon (Salmo Salar, L.) - Effects on Nutrient Digestibilities and Trypsin in Pyloric Ceca Homogenate and Intestinal Content. Comp. Biochem. Physiol. a-Physiol. 109 (4), 923–928. doi: 10.1016/0300-9629(94)90240-2
Olsen R. E., Dragnes B. T., Myklebust R., Ringo E. (2003). Effect of Soybean Oil and Soybean Lecithin on Intestinal Lipid Composition and Lipid Droplet Accumulation of Rainbow Trout, Oncorhynchus Mykiss Walbaum. Fish. Physiol. Biochem. 29 (3), 181–192. doi: 10.1023/B:Fish.0000045708.67760.43
Olsen R. E., Myklebust R., Kaino T., Ringo E. (1999). Lipid Digestibility and Ultrastructural Changes in the Enterocytes of Arctic Char (Salvelinus Alpinus L.) Fed Linseed Oil and Soybean Lecithin. Fish. Physiol. Biochem. 21 (1), 35–44. doi: 10.1023/A:1007726615889
Penn M. H. (2011). ““Lipid Malabsorption in Atlantic Salmon – the Recurring Problem of Floating Feces.”,” in Annual Report on Fish Health ( Norwegian Institute of Veterinary Medicine).
Powell A., Treasurer J. W., Pooley C. L., Keay A. J., Lloyd R., Imsland A. K., et al. (2018). Use of Lumpfish for Sea-Lice Control in Salmon Farming: Challenges and Opportunities. Rev. Aquacult. 10 (3), 683–702. doi: 10.1111/raq.12194
Silva F. C. P., Nicoli J. R., Zambonino-Infante J. L., Le Gall M. M., Kaushik S., Gatesoupe F. J. (2010). Influence of Partial Substitution of Dietary Fish Meal on the Activity of Digestive Enzymes in the Intestinal Brush Border Membrane of Gilthead Sea Bream, Sparus Aurata and Goldfish, Carassius Auratus. Aquaculture 306 (1-4), 233–237. doi: 10.1016/j.aquaculture.2010.05.018
Taylor J. R., Grosell M. (2006). Feeding and Osmoregulation: Dual Function of the Marine Teleost Intestine. J. Exp. Biol. 209 (Pt 15), 2939–2951. doi: 10.1242/jeb.02342
Teitelbaum J. E., Walker W. A. (2001). Review: The Role of Omega 3 Fatty Acids in Intestinal Inflammation. J. Nutr. Biochem. 12 (1), 21–32. doi: 10.1016/S0955-2863(00)00141-8
Wang Y. B., Yang X. J., Qin D. K., Feng Y., Guo Y. M., Yao J. H. (2011). Effects of Eicosapentaenoic Acid and Docosahexaenoic Acid on Responses of LPS-Stimulated Intestinal B Lymphocytes From Broiler Chickens Studied In Vitro. Eur. Food Res. Technol. 233 (4), 677–683. doi: 10.1007/s00217-011-1554-1
Willora F. P., Gronevik B., Liu C., Palihawadana A., Sorensen M., Hagen O. (2021). Total Replacement of Marine Oil by Rapeseed Oil in Plant Protein Rich Diets of Juvenile Lumpfish (Cyclopterus Lumpus): Effects on Growth Performance, Chemical and Fatty Acid Composition. Aquacult. Rep. 19. 100560. doi: 10.1016/j.aqrep.2020.100560
Willora F. P., Nadanasabesan N., Knutsen H. R., Liu C., Sorensen M., Hagen O. (2020). Growth Performance, Fast Muscle Development and Chemical Composition of Juvenile Lumpfish (Cyclopterus Lumpus) Fed Diets Incorporating Soy and Pea Protein Concentrates. Aquacult. Rep. 17. 100352. doi: 10.1016/j.aqrep.2020.100352
Xu S. S., Webb S. E., Lau T. C. K., Cheng S. H. (2018). Matrix Metalloproteinases (MMPs) Mediate Leukocyte Recruitment During the Inflammatory Phase of Zebrafish Heart Regeneration. Sci. Rep. 8. 1–14. doi: 10.1038/s41598-018-25490-w
Yang X., Wang Y. B., Yao J. H., Yang X. J. (2016). Mechanistic Study of Signalling Pathways in Intestinal B Lymphocytes Using Eicosapentaenoic and Docosahexaenoic Acid in Broiler Chickens. Food Agric. Immunol. 27 (3), 329–337. doi: 10.1080/09540105.2015.1104652
Zhang M., Sun K. J., Wu Y. J., Yang Y., Tso P., Wu Z. L. (2017). Interactions Between Intestinal Microbiota and Host Immune Response in Inflammatory Bowel Disease. Front. Immunol. 8. doi: 10.3389/fimmu.2017.00942
Zhang Y. M., Xie S. W., Guo T. Y., Liu Z. L., Fang H. H., Zheng L., et al. (2020). High Dietary Starch Inclusion Impairs Growth and Antioxidant Status, and Alters Liver Organization and Intestinal Microbiota in Largemouth Bass Micropterus Salmoides. Aquacult. Nutr. 26 (5), 1806–1821. doi: 10.1111/anu.13131
Zhao W., Xie J. J., Fang H. H., Liu Y. J., Tian L. X., Niu J. (2020). Effects of Corn Starch Level on Growth Performance, Antioxidant Capacity, Gut Morphology and Intestinal Microflora of Juvenile Golden Pompano, Trachinotus Ovatus. Aquaculture 524. 735197. doi: 10.1016/j.aquaculture.2020.735197
Zhukova K, Stroganov A. N(2021)Anatomy of the digestive system of lumpfish (Cyclopterus lumpus) as an adaptation to puffing behavior. The Anatomical Record doi: 10.1002/ar.24799
Keywords: cleaner fish, lumpfish, gut functions, macronutrient requirement, digestibility
Citation: Zhou W, Hamre K, Chikwati E, Kousoulaki K, Lein I, Berge GM, Sæle Ø, Kortner TM and Krogdahl Å (2022) A Screening Study on Effects Varying Dietary Macronutrient Composition on Gut Functions in Lumpfish (Cyclopterus lumpus). Front. Mar. Sci. 9:889778. doi: 10.3389/fmars.2022.889778
Received: 04 March 2022; Accepted: 22 June 2022;
Published: 22 July 2022.
Edited by:
Enric Gisbert, Institute of Agrifood Research and Technology (IRTA), SpainReviewed by:
Chang’an Wang, Chinese Academy of Fishery Sciences, ChinaCopyright © 2022 Zhou, Hamre, Chikwati, Kousoulaki, Lein, Berge, Sæle, Kortner and Krogdahl. This is an open-access article distributed under the terms of the Creative Commons Attribution License (CC BY). The use, distribution or reproduction in other forums is permitted, provided the original author(s) and the copyright owner(s) are credited and that the original publication in this journal is cited, in accordance with accepted academic practice. No use, distribution or reproduction is permitted which does not comply with these terms.
*Correspondence: Weiwen Zhou, d2Vpd2VuLnpob3VAbm1idS5ubw==
Disclaimer: All claims expressed in this article are solely those of the authors and do not necessarily represent those of their affiliated organizations, or those of the publisher, the editors and the reviewers. Any product that may be evaluated in this article or claim that may be made by its manufacturer is not guaranteed or endorsed by the publisher.
Research integrity at Frontiers
Learn more about the work of our research integrity team to safeguard the quality of each article we publish.