Abstract
The purpose of this study was to evaluate if vegetation regulates soil biogeochemistry in coastal salt marshes, here measured as element concentrations (43 elements) and organic matter content of the soils. We selected seven sampling sites in Liao River Delta, China, within each of which three areas existed in close proximity of each other, characterized as ‘bare, unvegetated sediments’, ‘Phragmites australis marsh’, and ‘Suaeda heteroptera marsh’. We recorded sampling locations and measured soil element concentrations, organic matter content, soil pH, soil salinity, soil water content, and soil electrical conductivity. All but four of element concentrations of soils varied by wetland type, and concentrations of 35 elements, and organic matter content increased from bare, unvegetated sites to Phragmites marshes to Suaeda marshes. Redundancy analysis (RDA) identified that organic matter content explained most variance. Organic matter content was positively related with most elements including nutrients and metals, negatively related with Sr, Ba and Na. However, further analysis of element concentrations revealed significant differences also between Phragmites-dominated and Suaeda-dominated sites, even though they did not differ significantly in organic matter content. This information highlights the importance of vegetation in regulating soil element composition and biogeochemical processes in coastal salt marshes.
Introduction
Coastal salt marshes can cover large areas between marine and terrestrial environments and offer important ecological and societal benefits (Webb et al., 2013). Salt marshes provide refuge and nursery grounds for marine organisms, act as buffers against storms, sequester carbon, filter sediments from water flowing through them, as well as plant nutrients and metals, thereby decreasing their inputs into more fragile ecosystems such as coral reefs and seagrass beds (Valiela and Cole, 2002; McKee et al., 2020). Salt marshes are usually vegetated by halophytes which can tolerate periodic flooding and a wide range of salinities. Halophytes make direct contribution to soil formation by organic matter input (Graham and Mendelssohn, 2014; Wang et al., 2017). Plant growth and root development regulate carbon accumulation, metal mobility, and nutrient accumulation (Loomis and Craft, 2010; Yu et al., 2016). Together with soil burial, sorption, and organic matter accumulation this leads to coastal wetlands being important sinks for nutrients and metals (Elsey-Quirk et al., 2019). Gradients in oxidation and pH in the rhizosphere of plants may change concentrations of nutrients, metals and organic matter, and mobilize or immobilize elements (Jacob and Otte, 2003; Jacob et al., 2011; Kissoon et al., 2011).
Element composition of soils is a good indicator of soil biogeochemical process (Werkmeister et al., 2018; Zhu et al., 2019). Soil element composition is mainly affected by soil pedogenesis, sediment inputs, climate characteristics, and human activities. Former studies in soil elements mainly focused on a particular process with few elements, e.g., bioaccumulation and phytoremediation of metals and nutrient over-enrichment (Sun et al., 2015). However, little was known about the soil element composition in salt marshes and about the environmental conditions that affect its variation. Such knowledge is very important for the understanding of the chemical environment and biogeochemical processes in wetlands, and affects how we protect and manage coastal salt marshes (Otte et al., 1993; Mitsch and Gosselink, 2015).
Liao River Delta has the world’s largest coastal reed marsh (Wang et al., 2016). Salt marsh vegetated by Suaeda heteroptera is another main vegetation type (Tian et al., 2017). Former studies concluded that vegetation influenced sedimentation on wetland surface and showed a positive feedback on soil accretion in Liao River Delta (Wang et al., 2017). Wetland plants can absorb nutrients and metals and release them as they die (Sun et al., 2015). Yet little is known about the general patterns of soil element composition and roles of the vegetation in regulating soil element composition in coastal salt marshes. This paper reports extensive data on concentrations of 43 soil elements in coastal salt marshes of the Liao River Delta, assesses the effects of vegetation on soil element composition and biogeochemistry. We hypothesized (1) that soil element composition and environmental factors would differ significantly between bare, unvegetated sediments, Phragmites australis marsh and Suaeda heteroptera marsh and (2) that organic matter content would strongly correlate with concentrations of most elements in soils, as observed in inland freshwater wetlands in our previous studies (Wang et al., 2019; Zhu et al., 2021).
Materials and Methods
Study Area
The study area is located in Liao River Delta, northeastern China (121°10′-122°30′E, 40°30′-41°30′N), where sediments are deposited by Liao River. The Liao River Delta is adjacent to Bohai Sea with the wetland area of over 1200 km2. The stand of Phragmites australis in Liao River Delta covers over 800 km2 and is the world’s largest reed wetland (Brix et al., 2014; Wang et al., 2016). The famous Suaeda heteroptera salt marsh referred to as “red beach”, is another main vegetation type in the delta. The wetlands are very important breeding ground for migration waterfowls including the red-crowned crane (Ciconia boyciana) and the white-naped crane (Grus vipio). The wetlands are designated as the Liao Estuary National Natural Reserve since 1988 and became a Ramsar site with international importance in 2005 (Tian et al., 2017). Mean annual precipitation in the study area is 612 mm, and mean annual temperature is 8.3°C (Wang et al., 2017).
Sample Collection
Seven sites were selected along the Liao River on September 15-17, 2018 (Figure 1). These sites were all directly influenced by both the river and wave activity. At each site, we sampled three wetland types: bare, unvegetated sediments (‘bare’), Phragmites australis marsh (‘Phrag’) and Suaeda heteroptera marsh (‘Suaeda’) which were present next to each other at each site, within 200 m. We assumed that the original soils, sediment inputs, tidal fluctuation and regional climate of the three vegetation types within each site were more similar to each other than between sites, and the differences were due to changes in vegetation. Three replicate samples with 10 cm soil depth were collected in each vegetation site. Each sample was over 20 m apart from each other. Longitude and latitude were recorded GPS. Soil samples were stored in a cooler in 4°C.
Figure 1

Site Locations of the three wetland types: bare, unvegetated sediments (‘bare’), Phragmites australis marsh (‘Phrag’) and Suaeda heteroptera marsh (‘Suaeda’) in Liao River Delta, China.
Sample Analysis
Samples were first dried to a constant weight at 60°C. Samples were then homogenized, and sieved with a mesh screen of 2-mm. We determined (1) soil element concentrations, (2) soil organic matter content, (3) soil salinity, (4) soil pH, (5) water content, and (6) electrical conductivity. Element concentrations were measured by ICP-MS analysis (NexION 350D, PerkinElmer, US). Total nitrogen was determined by Kjeldahl method using a SKALAR SAN++ continuous flow analysis (Skalar, Netherlands). Organic matter content was measured by dichromate oxidation and titration with ferrous ammonium sulfate. Soil salinity, electrical conductivity and pH were measured with a water-soil ratio of 5:1 by using a glass electrode. Soil water content was measured as a ratio of water weight to the weight of dried soil.
Data Analysis
The number of elements in this study were determined by which elements can be detected by the ICP-MS equipment. Mean values of concentration of 43 elements and five environmental factors (soil organic matter content, salinity, pH, water content, electrical conductivity) were calculated for bare, Phrag, and Suaeda. One-way ANOVA and a subsequent Tukey’s test were used to analyse the concentrations of 43 soil elements and the five environmental factors between wetland types. Significance was set at a level of 0.05. Data were log-transformed to meet normality and homogeneity assumptions of ANOVA. Spearman correlation analysis was performed to study the relationships of soil element concentration with organic matter content. The analysis was carried out in SPSS 17.0. Redundancy analysis (RDA) was conducted to study the relationship between element concentrations (43 elements) and five environmental variables (organic matter content, salinity, pH, water content, and electrical conductivity) using CANOCO 5.0. Environmental factors in the final model were selected by the forward selection procedures with 499 permutations. Non-metric multidimensional scaling (NMDS) in CANOCO 5.0 was performed to study the similarities of element composition among the three wetland types (bare, Phrag, and Suaeda).
Results
Variation in Environmental Variables Between Vegetation Types
The values of environmental variables and element concentrations are presented in Table 1. Soil organic matter content (OM) in the Phragmites marshes and Suaeda marshes was significantly higher than in bare, unvegetated sites. The electrical conductivity (EC) and soil salinity (SS) in the Suaeda marshes was significantly higher than the Phragmites marshes and bare, unvegetated sites. The soil pH in the bare, unvegetated sites was significantly higher than the Suaeda marshes, while the soil water content (WC) in the bare, unvegetated sites was significantly lower than the Suaeda marshes. Even though the values for EC, pH and SS differed significantly, the ranges in values were very small.
Table 1
| Unit | bare | Phrag | Suaeda | P | |
|---|---|---|---|---|---|
| Environmental Factors | |||||
| OM | % | 0.88±0.04a | 1.11±0.07b | 1.12±0.04b | 0.003 |
| EC | μs/cm | 2400±13a | 2479±101a | 2940±103b | 0.002 |
| pH | – | 8.50±0.04b | 8.39±0.04ab | 8.31±0.02a | 0.004 |
| SS | ‰ | 3.65±0.27a | 3.43±0.21a | 4.29±0.21b | 0.026 |
| WC | – | 0.35±0.01a | 0.39±0.01ab | 0.42±0.01b | <0.001 |
| Element concentrations, increasing (B<P<S) | |||||
| Lu | mg/kg | 0.228±0.003a | 0.240±0.003b | 0.251±0.003c | <0.001 |
| Tm | mg/kg | 0.24±0.003a | 0.25±0.003b | 0.26±0.003c | <0.001 |
| Yb | mg/kg | 1.55±0.02a | 1.63±0.02b | 1.71±0.02c | <0.001 |
| Element concentrations, increasing (B ≤ P ≤ S) | |||||
| Al | g/kg | 58.21±0.83a | 61.22±1.08ab | 63.78±0.87b | <0.001 |
| As | mg/kg | 12.64±0.28a | 12.90±0.28ab | 13.69±0.25b | 0.027 |
| B | mg/kg | 29.77±1.10a | 33.6±1.37ab | 36.19±0.99b | 0.001 |
| Fe | g/kg | 25.50±0.75a | 28.09±0.92ab | 30.05±0.65b | <0.001 |
| Sn | mg/kg | 1.91±0.06a | 2.08±0.06ab | 2.24±0.05b | 0.001 |
| Cu | mg/kg | 12.60±0.36a | 13.68±0.52ab | 15.20±0.39b | 0.001 |
| Ce | mg/kg | 55.1±1.01a | 57.3±1.04ab | 60.4±0.89b | 0.001 |
| La | mg/kg | 28.23±0.50a | 29.12±0.61ab | 30.72±0.51b | 0.008 |
| Nd | mg/kg | 23.54±0.34a | 24.71±0.39ab | 25.92±0.33b | <0.001 |
| Sb | mg/kg | 0.86±0.02a | 0.93±0.03ab | 0.95±0.01b | 0.006 |
| Sm | mg/kg | 4.41±0.06a | 4.61±0.07ab | 4.86±0.06b | <0.001 |
| Ti | g/kg | 3.11±0.05a | 3.22±0.04ab | 3.28±0.03b | 0.011 |
| Element concentrations, increasing (B=P<S) | |||||
| Co | mg/kg | 8.04±0.19a | 8.31±0.25a | 9.43±0.22b | <0.001 |
| Cr | mg/kg | 45.30±0.98a | 47.08±1.14a | 51.70±0.90b | <0.001 |
| Dy | mg/kg | 3.00±0.04a | 3.14±0.05a | 3.31±0.04b | <0.001 |
| Er | mg/kg | 1.67±0.02a | 1.75±0.03a | 1.84±0.02b | <0.001 |
| Eu | mg/kg | 0.96±0.01a | 0.99±0.01a | 1.03±0.01b | <0.001 |
| Gd | mg/kg | 4.02±0.07a | 4.19±0.07a | 4.42±0.05b | <0.001 |
| Ho | mg/kg | 0.58±0.01a | 0.60±0.01a | 0.64±0.01b | <0.001 |
| Mg | g/kg | 9.03±0.28a | 9.54±0.32a | 10.68±0.25b | 0.001 |
| Mn | g/kg | 0.52±0.01a | 0.56±0.02a | 0.63±0.02b | <0.001 |
| Ni | mg/kg | 22.22±0.54a | 23.54±0.72a | 26.00±0.59b | 0.001 |
| Pr | mg/kg | 6.20±0.09a | 6.47±0.10a | 6.79±0.09b | <0.001 |
| Tb | mg/kg | 0.54±0.01a | 0.57±0.01a | 0.60±0.01b | <0.001 |
| V | mg/kg | 53.60±1.27a | 56.16±1.52a | 62.56±1.24b | <0.001 |
| Zn | mg/kg | 54.36±1.44a | 57.97±1.74a | 65.95±1.46b | <0.001 |
| Element concentrations, increasing (B<P=S) | |||||
| Pb | mg/kg | 18.14±0.31a | 19.30±0.36b | 20.32±0.27b | <0.001 |
| Cd | mg/kg | 0.179±0.007a | 0.208±0.008b | 0.228±0.009b | <0.001 |
| Mo | mg/kg | 0.337±0.009a | 0.392±0.012b | 0.382±0.007b | <0.001 |
| N | g/kg | 0.25±0.01a | 0.33±0.02b | 0.33±0.01b | <0.001 |
| Y | mg/kg | 11.20±0.19a | 12.22±0.28b | 12.83±0.36b | 0.001 |
| P | g/kg | 0.47±0.01a | 0.51±0.01b | 0.53±0.01b | <0.001 |
| Element concentrations, decreasing (B ≥ P ≥ S) | |||||
| Ba | g/kg | 0.58±0.005b | 0.57±0.005ab | 0.56±0.003a | 0.002 |
| Element concentrations, decreasing (B>P=S) | |||||
| Na | g/kg | 21.84±0.23b | 20.81±0.28a | 20.79±0.22a | 0.004 |
| Sr | g/kg | 0.177±0.002b | 0.164±0.002a | 0.165±0.001a | 0.005 |
| Element concentrations, B>P<S | |||||
| Ca | g/kg | 13.34±0.17b | 12.25±0.21a | 13.85±0.16b | <0.001 |
| Element concentrations, no significant variation (B=P=S) | |||||
| Hg | mg/kg | 0.0032±0.0006 | 0.0035±0.0005 | 0.0048±0.0006 | 0.109 |
| K | g/kg | 23.45±1.19 | 23.23±0.16 | 22.29±0.77 | 0.230 |
| S | g/kg | 0.58±30.04 | 0.74±0.11 | 0.63±0.03 | 0.142 |
| Se | mg/kg | 0.555±0.002 | 0.053±0.002 | 0.059±0.002 | 0.123 |
Mean ± standard error of organic matter content (OM), electrical conductivity (EC), pH, soil salinity (SS), soil water content (WC) and concentrations of elements in bare (B), Phrag (P) and Suaeda (S), and results of one-way ANOVA of variance and Turkey’s test (n=3).
Different letters indicate significant differences in means (P< 0.05).
Variation in Element Concentrations of Soils Between Vegetation Types
In total, 43 elements had detectable concentrations in the soils (Table 1). Concentrations of Hg, K, S, and Se did not significantly differ between types of vegetation. The concentrations of 15 soil elements increased from bare, unvegetated sites to Phragmites marshes to Suaeda marshes. The concentrations of 14 soil elements in the Suaeda marshes were higher than the bare, unvegetated sites and Phragmites marshes. The concentrations of 6 soil elements in the Suaeda marshes and Phragmites marshes were higher than the bare, unvegetated sites. The concentration of Ba decreased from bare, unvegetated sites to Phragmites to Suaeda marshes. The concentrations of Na and Sr in the bare, unvegetated sites were higher than the Phragmites and Suaeda marshes. The concentration of Ca was lower in Phragmites marshes than the bare, unvegetated sites and Suaeda marshes.
Relationships of Soil Element Concentration With Environmental Factors
Redundancy analysis (RDA) showed that organic matter content explained most variation in soil element concentrations (42.7%), followed by soil electrical conductivity (7.5%), pH (3.0%), and soil salinity (2.7%) (Figure 2; Table 2).
Figure 2
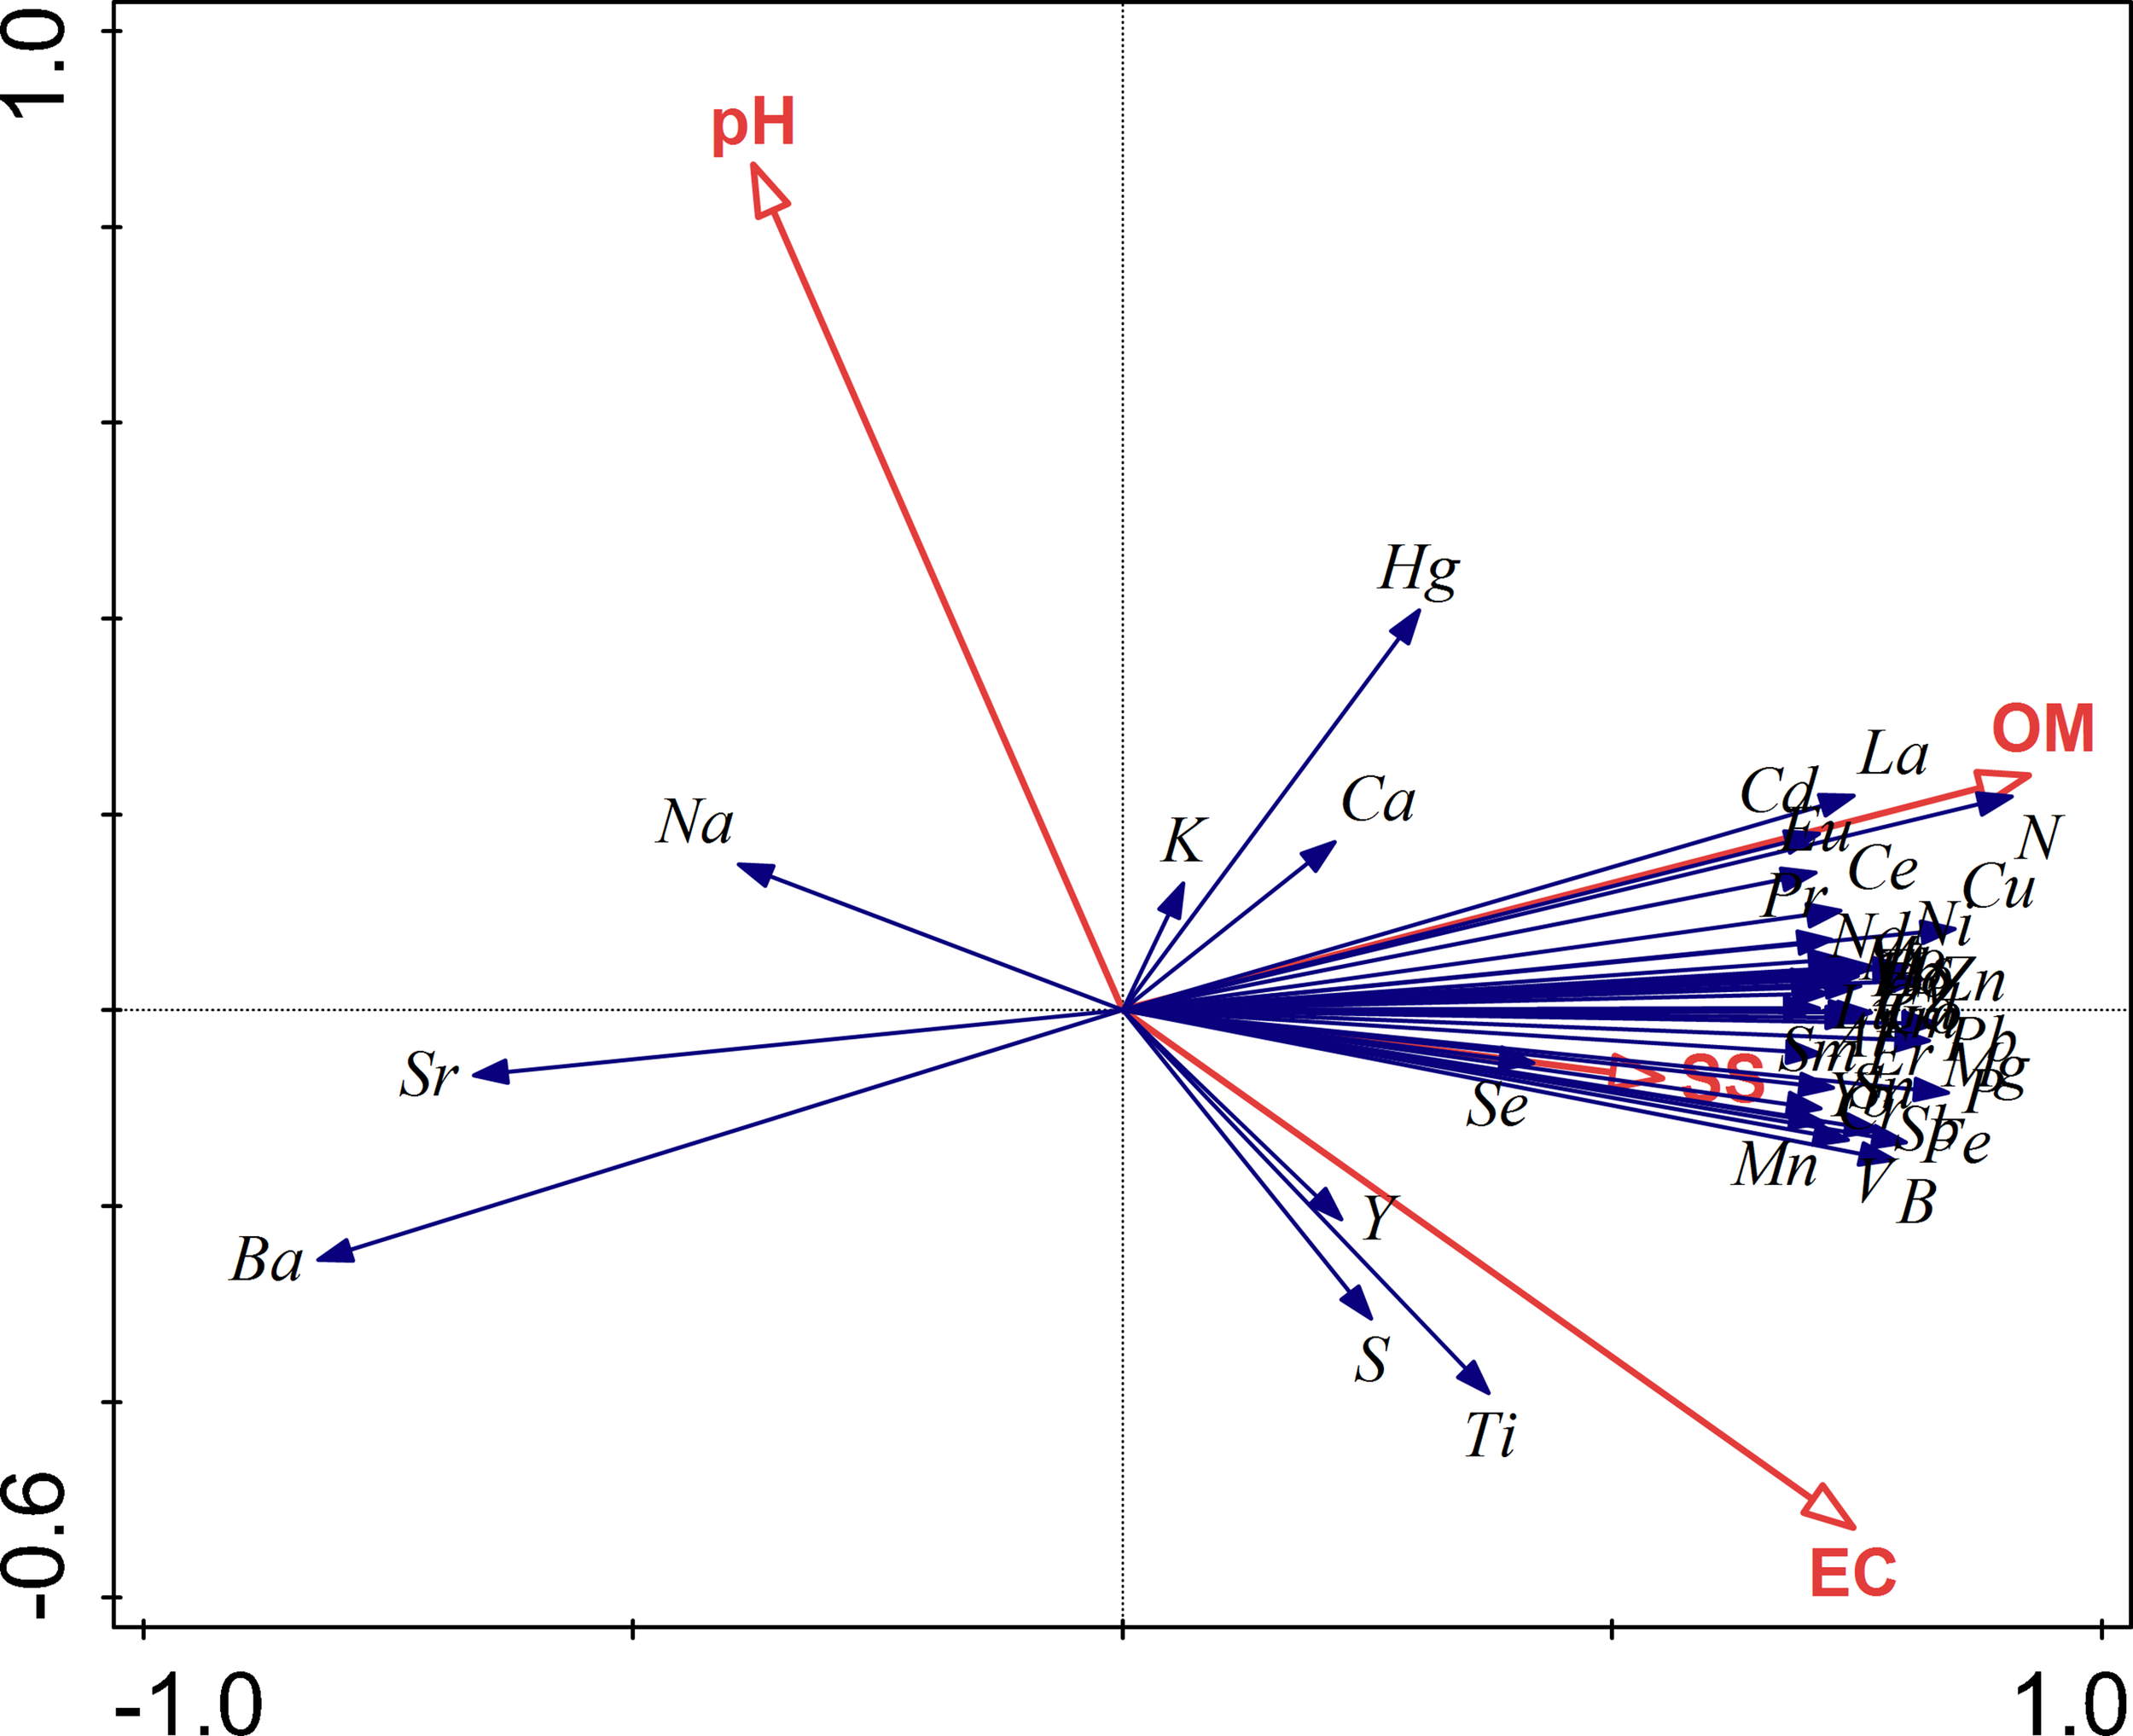
Ordination graph of redundancy analysis of element concentrations affected by environmental factors. OM, soil organic matter content; pH; EC, electrical conductivity; and SS, soil salinity.
Table 2
| Variables | % of variation explained | Contribution (% of variation explained) | Pseudo-F | P |
|---|---|---|---|---|
| OM | 42.7 | 75.4 | 45.4 | 0.002 |
| EC | 7.5 | 13.3 | 9.0 | 0.002 |
| pH | 3.0 | 5.3 | 3.9 | 0.006 |
| SS | 2.7 | 4.9 | 3.4 | 0.018 |
| Total | 55.9 | 98.9 |
Results of redundancy analysis (RDA) of element concentrations constrained by environmental variables, OM, soil organic matter; SS, soil salinity; pH and EC, electrical conductivity; determined by interactive forward selection procedure with unrestricted permutation tests, combining all sites (21) and all replications (3 for each site), therefore n=63.
Organic matter content was positively related with most of the elements (37 elements) including the macro-elements Ca, S, N, P, Mg and most metals (Figure 2; Table 3). Organic matter content was negatively related with Ba, Sr and Na. Two examples were shown for N and Ba (Figure 3).
Table 3
| No significant correlations | Positive correlations | ||||||||||
|---|---|---|---|---|---|---|---|---|---|---|---|
| K | 0.178 | As | 0.643** | B | 0.672** | Ce | 0.792** | Dy | 0.777** | N | 0.956** |
| Ti | 0.214 | Se | 0.456** | Mg | 0.724** | Pr | 0.773** | Ho | 0.772** | P | 0.771** |
| Y | 0.125 | Mo | 0.730** | Cr | 0.620** | Ni | 0.722** | Zn | 0.763** | V | 0.639** |
| Negative correlations | Cd | 0.770** | Al | 0.711** | Nd | 0.768** | Er | 0.748** | Co | 0.685** | |
| Na | -0.361** | Sn | 0.676** | S | 0.422** | Sm | 0.756** | Tm | 0.752** | Cu | 0.785** |
| Ba | -0.843** | Sb | 0.679** | Ca | 0.270* | Eu | 0.739** | Yb | 0.699** | ||
| Sr | -0.700** | Pb | 0.800** | Mn | 0.684** | Gd | 0.797** | Lu | 0.723** | ||
| Hg | 0.492** | Fe | 0.691** | Tb | 0.780** | La | 0.793** | ||||
Spearman correlation coefficients between organic matter content and element concentrations in all sites.
Asterisks indicate significant differences: *P< 0.05, **P< 0.01.
Figure 3

Positive (N) and negative (Ba) correlations between elements and soil organic matter.
Similarity of Element Compositions Among Wetland Types
The distribution of elements in soils was studied with NMDS analysis (Figure 4). Almost all the bare, unvegetated sites were distributed in the right quadrant, whereas almost all the Suaeda marsh sites were distributed in the left quadrant (Figure 4). The Phragmites marsh sites were distributed across the entire NMDS ordination graph (Figure 4).
Figure 4
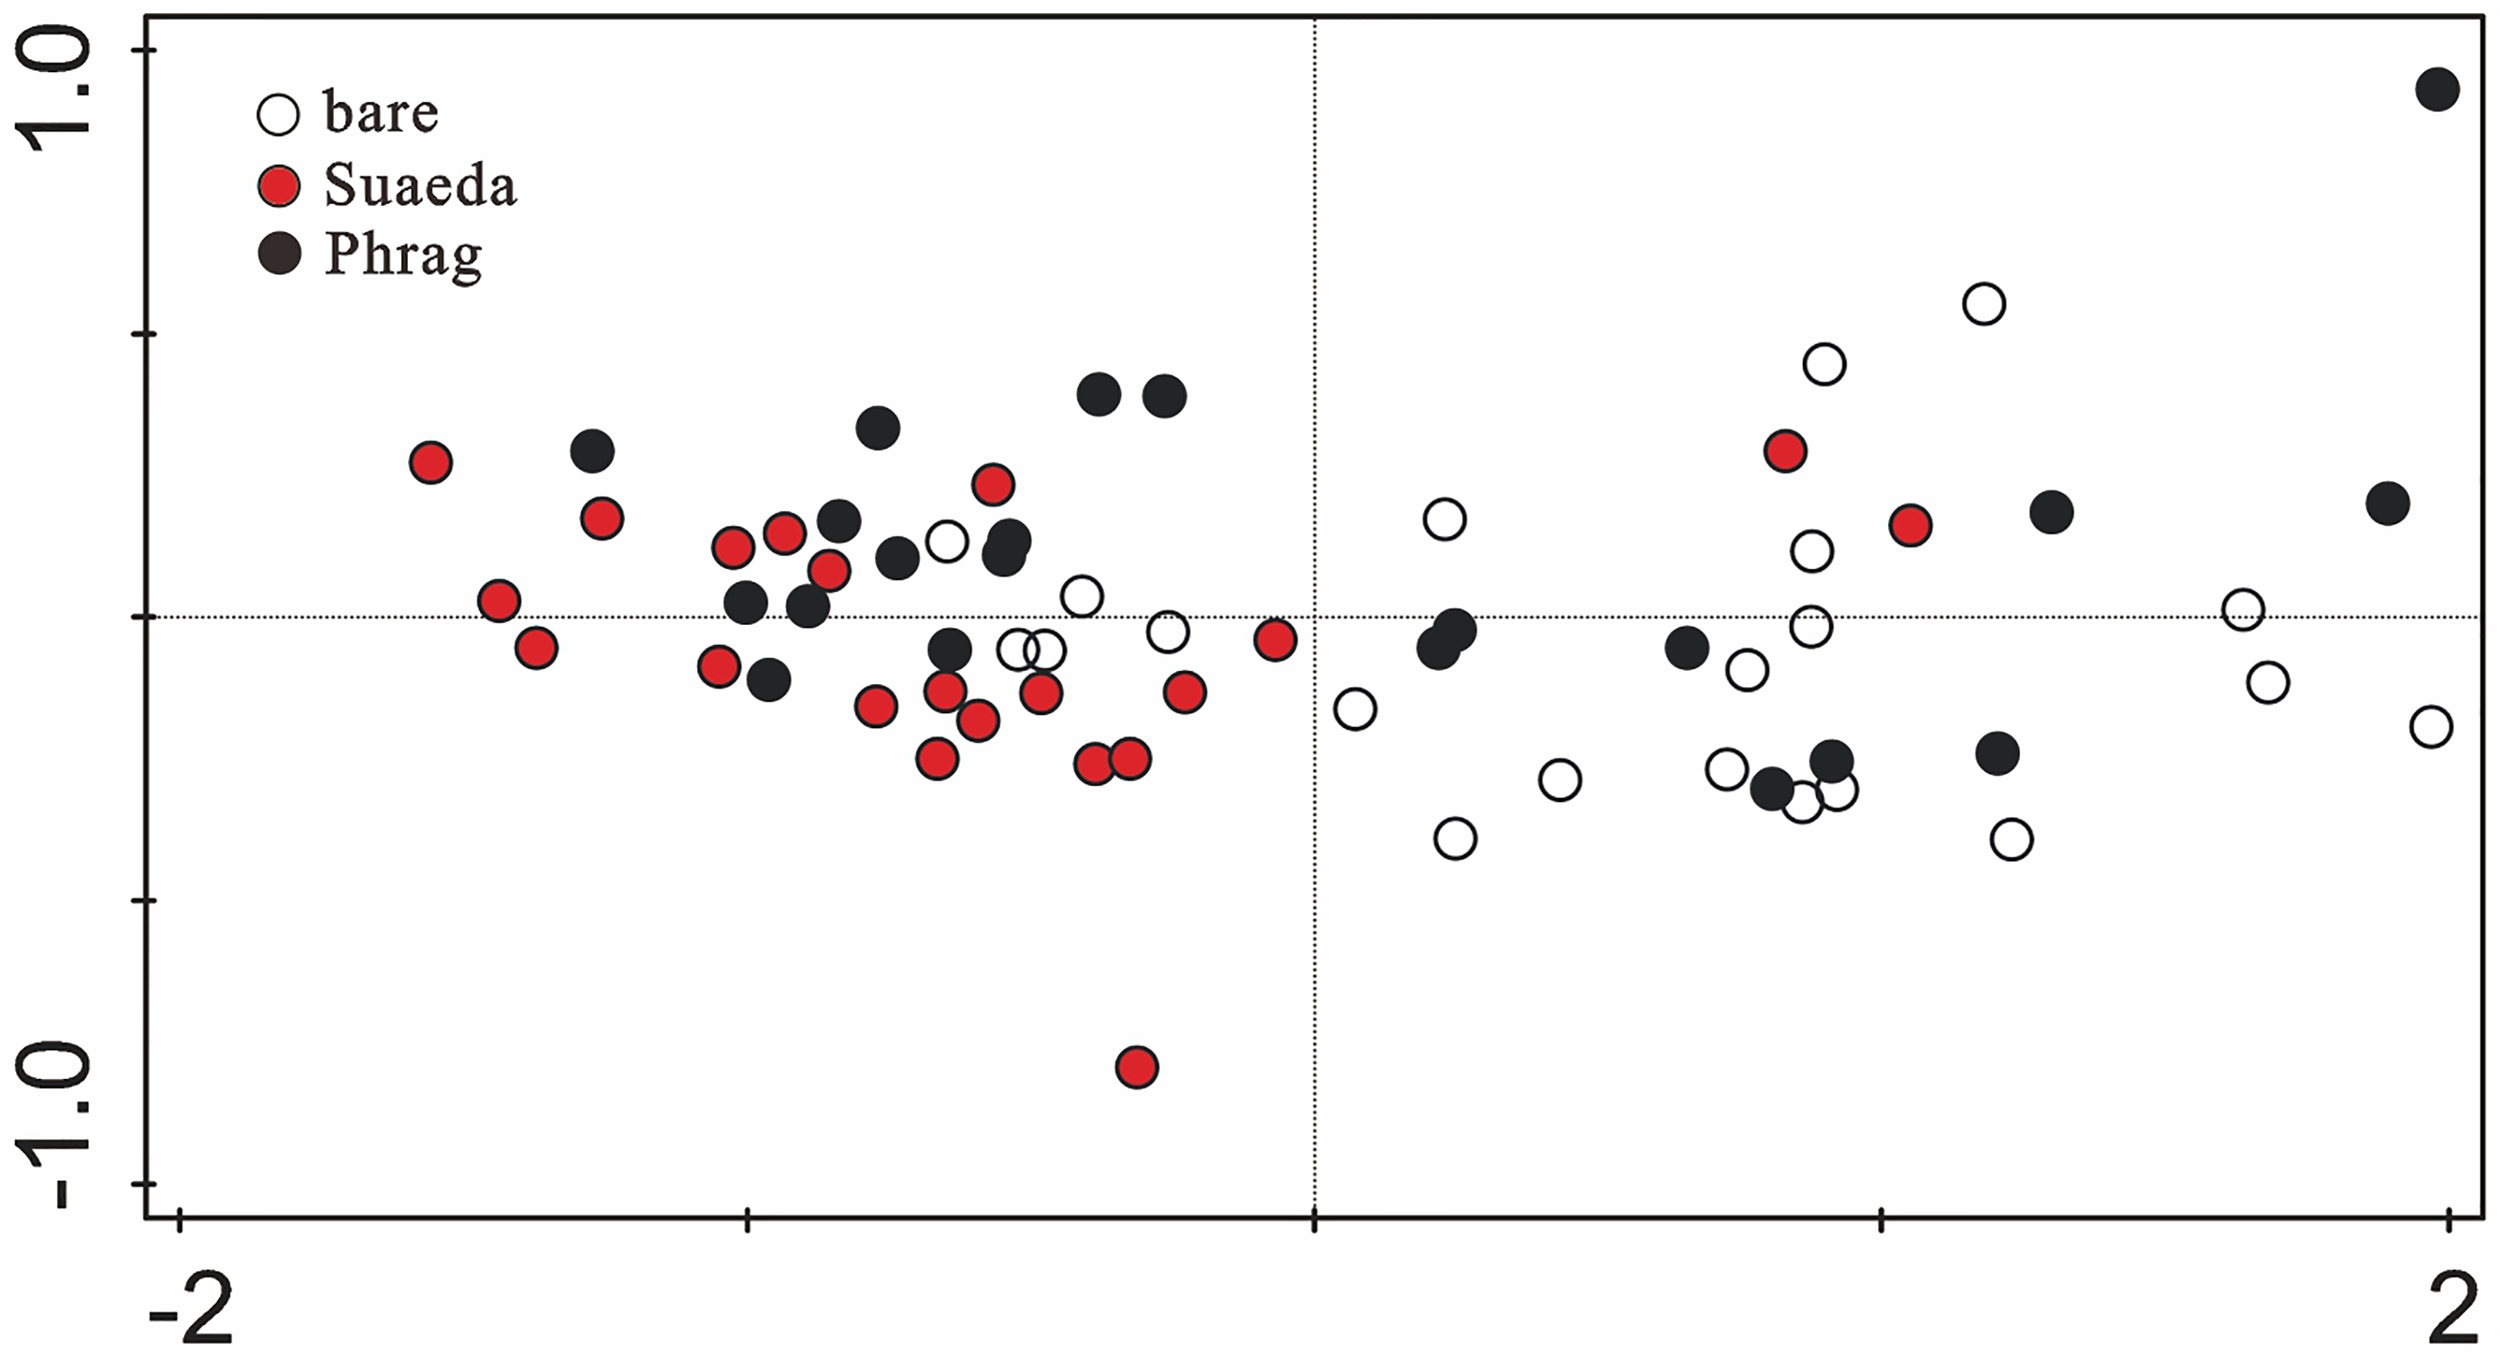
Ordination graph of non-metric multidimensional scaling analysis using the Bray-Curtis coefficient of dissimilarity, based on mean values of element concentrations in soils. Wetland types of bare, Phrag, and Suaeda are represented by white, black and red circles, respectively.
Discussion
Element Concentrations and Soil Organic Matter
Organic matter content is found to be the most important factor influencing element mobility and concentrations in freshwater wetlands (Salomons and Förstner, 1984; Kissoon et al., 2015; Yuan et al., 2019; Wang et al., 2020). In our study, organic matter content correlated positively with concentrations of most elements including the nutrients of N, P and S (Figure 2; Table 3), which is consistent with other studies in salt marshes (Jokic et al., 2003; Sun et al., 2013; Yu et al., 2014; Qu et al., 2018) and mangroves (Chen and Twilley, 1999; McKee et al., 2007). In addition, similar with our study, sediments in Suaeda salt marshes often show higher concentrations of metal elements (e.g., Pb, Cu, Cr, Zn, Mg, Ni, Ca, Al, V, Ca, and Ni) due to the enrichment of soil organic matter content and Fe-Mn oxides (Williams et al., 1994; Graham and Mendelssohn, 2014). Coastal wetlands had large amounts of Al and Fe, the oxides and phosphates bind to several elements (Salomons and Förstner, 1984; Sun et al., 2015). On the contrary, elements that bind with soil organic matter content in a weak affinity usually are in soils which contain much inorganic particles (Beesley et al., 2010). Concentrations of such elements in soils decreased with the increase of organic matter content (Wang et al., 2019). This explains the negative relationships between organic matter content and alkali metals Na, Ba and Sr (Figure 2).
Even though OM is recognized as the most important factor influencing element concentrations in wetlands, there are striking differences between studies in coastal and inland wetlands, which is that in the coastal systems most metals correlate positively with OM (e.g. Otte et al., 1993; Wang et al., 2022), whereas in the inland systems it is a negative relationship (e.g. Yellick et al., 2016; Zhu et al., 2021). This can be understood if we consider the origin of the metals in those different systems. As Salomons and Förstner (1984) already described in detail, metals in estuaries originate from precipitation with sediments and organic matter. As a result, metal concentrations, OM and fraction of small sedimentary particles strongly correlate (Otte et al., 1993). However, metals in inland wetlands do not originate from sedimentation processes, but are derived from erosion of inorganic materials, in which the metals are occluded (Salomons and Förstner, 1984; Gao et al., 2018). In that case, as OM increases, the proportion of inorganic matter per volume of soil decreases, as do the concentrations of metals associated with that inorganic fraction (Werkmeister et al., 2018; Zhu et al., 2021).
Element Concentrations, pH, EC and SS
Although pH, EC and SS were identified as statistically significant factors in explaining variation in element concentrations, those relationships likely have no real relevance in explaining spatial variation of elements. This is because although there are numerical differences, the ranges in values are very small. This is evident if the correlation between Na, EC and SS is more closely examined. Na is usually an important element in determining salinity, and usually concentrations of Na increase with increasing salinity and electrical conductivity. That is particularly evident if such gradients are observed along the entire length of estuaries, from freshwater to full seawater salinity (Salomons and Förstner, 1984; Du Laing et al., 2009; Cloern et al., 2017). However, in this study, even though the geographic range of the sampling sites was about 10 km, values for pH, EC and SS varied very little. As a result, Na in our study correlated slightly negatively with salinity, which was an artefact of the narrow range of values. Therefore, although pH, EC and SS varied significantly between vegetation sites and were identified as significant environmental variables, the effects of those environmental variables on metals distributions were insignificant compared to the effects of OM, which varied strongly between types of vegetation.
The Role of Vegetation in Regulating Element Composition
Our study found relatively high organic matter and high concentrations of most elements in Suaeda salt marshes, similar with other studies in coastal salt marshes (Otte et al., 1993; Yu et al., 2011), most likely due to biological processes (Schmidt et al., 2011). Without vegetation (bare, unvegetated sites) we observed 0.88% organic matter, but this was 1.11-1.12% in the Phragmites and Suaeda marshes. Wetland plants make direct contribution to soil formation by organic matter input (Baustian et al., 2012), which, as discussed above, affects element distributions. Wetland plants can absorb nutrients and metals and release them as they die (Baldantoni et al., 2004). Plant growth, root development and microbial processes regulate carbon accumulation, metal mobility, and nutrient accumulation (Jacob and Otte, 2003; Pennings et al., 2005; Loomis and Craft, 2010; Yu et al., 2016).
So, plants produce OM, which explains the higher levels of OM compared to bare, unvegetated sites, but this has been known for a very long time. The more important outcome of this work, however, is that where no statistically significant differences were found in OM between Phragmites and Suaeda sites, many elements showed statistically different concentrations between sites dominated by Phragmites compared to Suaeda, namely: Ca, Co, Cr, Dy, Er, Eu, Gd, Ho, Mg, Mn, Ni, Pr, Tb, V, and Zn. This shows the power of multi-element analysis. It highlights that it is the plants that are the most important determinant of element distribution in estuarine sediments, through their production of organic matter, but also through the different ways in which different plant species interact with their immediate environment.
Conclusions
This study evaluated the concentrations of 43 elements in soils between three vegetation types in coastal salt marshes. We confirmed that differences between plant species, and the very presence of plants are the most important factors regulating element concentrations. Salt marsh vegetation enhanced soil organic matter accumulation, in turn increasing the concentrations of most elements including metals and nutrients, but different plant species do so differently. This information highlights the importance of vegetation in regulating soil element composition and biogeochemical processes in coastal salt marshes. Understanding these processes is critical for assessment of effects of sea level rise and anthropogenic activities on coastal ecosystems and their biogeochemistry and sustainable management of coastal wetlands.
Funding
This study was supported by the National Natural Science Foundation of China (41877075, 42077070, 41871081, U19A2042), Alliance of International Science Organizations (ANSO-PA-2020-14), and the Youth Innovation Promotion Association CAS (2019234, 2020237).
Publisher’s Note
All claims expressed in this article are solely those of the authors and do not necessarily represent those of their affiliated organizations, or those of the publisher, the editors and the reviewers. Any product that may be evaluated in this article, or claim that may be made by its manufacturer, is not guaranteed or endorsed by the publisher.
Statements
Data availability statement
The original contributions presented in the study are included in the article/supplementary material. Further inquiries can be directed to the corresponding author.
Author contributions
GW designed the study, performed the field investigation and collected the data, conducted the statistical analysis and wrote the manuscript. MW designed the study, conducted the statistical analysis, and wrote the manuscript. ZX performed the field investigation and collected the data. ZR and MJ reviewed and edited the manuscript. MO conducted the statistical analysis, reviewed and edited the manuscript. All authors contributed to the article and approved the submitted version.
Conflict of interest
The authors declare that the research was conducted in the absence of any commercial or financial relationships that could be construed as a potential conflict of interest.
References
1
Baldantoni D. Alfani A. D. Tommasi P. Bartoli G. Virzo D. Santo A. (2004). Assessment of Macro and Microelement Accumulation Capability of Two Aquatic Plants. Environ. Pollution130, 149–156. doi: 10.1016/j.envpol.2003.12.015
2
Baustian J. J. Mendelssohn I. A. Hester M. W. (2012). Vegetation’s Importance in Regulating Surface Elevation in a Coastal Salt Marsh Facing Elevated Rates of Sea Level Rise. Global Change Biol.18, 3377–3382. doi: 10.1111/j.1365-2486.2012.02792.x
3
Beesley L. Moreno-Jiménez E. Gomez-Eyles J. L. (2010). Effects of Biochar and Green Waste Compost Amendments on Mobility, Bioavailability and Toxicity of Inorganic and Organic Contaminants in a Multi-Element Polluted Soil. Environ. Pollution158, 2282–2287. doi: 10.1016/j.envpol.2010.02.003
4
Brix H. Ye S. Y. Laws E. A. Sun D. C. Li G. S. Ding X. G. et al . (2014). Large-Scale Management of Common Reed, Phragmites Australis, for Paper Production: A Case Study From the Liaohe Delta. China. Ecol. Eng.73, 760–769. doi: 10.1016/j.ecoleng.2014.09.099
5
Chen R. H. Twilley R. R. (1999). A Simulation Model of Organic Matter and Nutrient Accumulation in Mangrove Wetland Soils. Biogeochemistry44, 93–118. doi: 10.1023/A:1006076405557
6
Cloern J. E. Jassby A. D. Schraga T. S. Nejad E. Martin C. (2017). Ecosystem Variability Along the Estuarine Salinity Gradient: Examples From Long-Term Study of San Francisco Bay. Limnol. Oceanography62, S272–S291. doi: 10.1002/lno.10537
7
Du Laing G. Rinklebe J. Vandecasteele B. Meers E. Tack F. M. (2009). Trace Metal Behaviour in Estuarine and Riverine Floodplain Soils and Sediment: A Review. Sci. Total. Environ.407, 3972–3985. doi: 10.1016/j.scitotenv.2008.07.025
8
Elsey-Quirk T. Graham S. A. Mendelssohn I. A. Snedden G. Day J. W. Twilley R. R. et al . (2019). Mississippi River Sediment Diversions and Coastal Wetland Sustainability: Synthesis of Responses to Freshwater, Sediment, and Nutrient Inputs. Estuarine. Coastal. Shelf. Sci.221, 170–183. doi: 10.1016/j.ecss.2019.03.002
9
Gao C. Y. Zhang S. Q. Liu H. X. Cong J. X. Li Y. H. Wang G. P. (2018). The Impacts of Land Reclamation on the Accumulation of Key Elements in Wetland Ecosystems in the Sanjiang Plain, Northeast China. Environ. Pollution237, 487–498. doi: 10.1016/j.envpol.2018.02.075
10
Graham S. A. Mendelssohn I. A. (2014). Coastal Wetland Stability Maintained Through Counterbalancing Accretionary Responses to Chronic Nutrient Enrichment. Ecology95, 3271–3283. doi: 10.1890/14-0196.1
11
Jacob D. L. Otte M. L. (2003). Conflicting Processes in the Wetland Plant Rhizosphere: Metal Retention or Mobilization? Water. Air. Soil Pollution.: Focus3, 91–104. doi: 10.1023/A:1022138919019
12
Jacob D. L. Otte M. L. Hopkins D. G. (2011). Phyto (In)stabilization of Elements. Int. J. Phytoremediation.13 (sup 1), 34–54. doi: 10.1080/15226514.2011.568535
13
Jokic A. Cutler J. N. Ponomarenko E. van der Kamp G. Anderson D. W. (2003). Organic Carbon and Sulphur Compounds in Wetland Soils: Insights on Structure and Transformation Processes Using K-Edge XANES and NMR Spectroscopy. Geochim. Cosmochim. Acta67, 2585–2597. doi: 10.1016/S0016-7037(03)00101-7
14
Kissoon L. T. Jacob D. L. Hanson M. A. Herwig B. R. Bowe S. E. Otte M. L. (2015). Multi-Elements in Waters and Sediments of Shallow Lakes: Relationships With Water, Sediment, and Watershed Characteristics. Wetlands35, 443–457. doi: 10.1007/s13157-015-0632-8
15
Kissoon L. T. Jacob D. L. Otte M. L. (2011). Multiple Elements in Typha Angustifolia Rhizosphere and Plants: Wetland Versus Dryland. Environ. Exp. Bot.72, 232–241. doi: 10.1016/j.envexpbot.2011.03.010
16
Loomis M. J. Craft C. B. (2010). Carbon Sequestration and Nutrient (Nitrogen, Phosphorus) Accumulation in River-Dominated Tidal Marshes, Georgia, USA. Soil Sci. Soc. Am J.74, 1028–1036. doi: 10.2136/sssaj2009.0171
17
McKee K. L. Cahoon D. R. Feller I. C. (2007). Caribbean Mangroves Adjust to Rising Sea Level Through Biotic Controls on Change in Soil Elevation. Global Ecol. Biogeography.16, 545–556. doi: 10.1111/j.1466-8238.2007.00317.x
18
McKee K. L. Mendelssohn I. A. Hester M. W. (2020). Hurricane Sedimentation in a Subtropical Salt Marsh-Mangrove Community is Unaffected by Vegetation Type. Estuarine. Coastal. Shelf. Sci.239, 106733. doi: 10.1016/j.ecss.2020.106733
19
Mitsch W. J. Gosselink J. G. (2015). Wetlands. 5th ed (New York: Wiley).
20
Otte M. L. Haarsma M. S. Broekman R. A. Rozema J. (1993). Relation Between Heavy Metal Concentrations in Salt Marsh Plants and Soils. Environ. Pollution82, 13–22. doi: 10.1016/0269-7491(93)90157-j
21
Pennings S. C. Grant M. B. Bertness M. D. (2005). Plant Zonation in Low-Latitude Salt Marshes: Disentangling the Roles of Flooding, Salinity and Competition. J. Ecol.93, 159–167. doi: 10.1111/j.1365-2745.2004.00959.x
22
Qu F. Z. Shao H. B. Meng L. Yu J. B. Xia J. B. Sun J. K. et al . (2018). Forms and Vertical Distributions of Soil Phosphorus in Newly Formed Coastal Wetlands in the Yellow River Delta Estuary. Land. Degradation Dev.29, 4219–4226. doi: 10.1002/ldr.3132
23
Salomons W. Förstner U. (1984). Metals in the Hydrocycle (Berlin, Germany: Springer-Verlag).
24
Schmidt M. W. I. Torn M. S. Abiven S. Dittmar T. Guggenberger G. Janssens I. A. et al . (2011). Persistence of Soil Organic Matter as an Ecosystem Property. Nature478, 49–56. doi: 10.1038/nature10386
25
Sun Z. G. Mou X. J. Song H. L. Jiang H. H. (2013). Sulfur Biological Cycle of the Different Suaeda Salsa Marshes in the Intertidal Zone of the Yellow River Estuary, China. Ecol. Eng.53, 153–164. doi: 10.1016/j.ecoleng.2012.12.036
26
Sun Z. G. Mou X. J. Tong C. Wang C. Y. Xie Z. L. Song H. L. et al . (2015). Spatial Variations and Bioaccumulation of Heavy Metals in Intertidal Zone of the Yellow River Estuary, China. Catena126, 43–52. doi: 10.1016/j.catena.2014.10.037
27
Tian Y. L. Luo L. Mao D. H. Wang Z. M. Li L. Liang J. P. (2017). Using Landsat Images to Quantify Different Human Threats to the Shuangtai Estuary Ramsar Site, China. Ocean Coastal. Manage135, 56–64. doi: 10.1016/j.ocecoaman.2016.11.011
28
Valiela I. Cole M. L. (2002). Comparative Evidence That Salt Marshes and Mangroves may Protect Seagrass Meadows From Land-Derived Nitrogen Loads. Ecosystems5, 92–102. doi: 10.1007/s10021-001-0058-4
29
Wang G. D. Jiang M. Wang M. (2022). Coastal Salt Marsh Restoration Drives Element Composition of Soils Toward its Original State by Recovering Soil Organic Matter. Land. Degradation Dev.33, 649–657. doi: 10.1002/ldr.4203
30
Wang G. D. Jiang M. Wang M. Xue Z. S. (2020). Element Composition of Soils to Assess the Success of Wetland Restoration. Land. Degradation Dev.31, 1641–1649. doi: 10.1002/ldr.3561
31
Wang G. D. Otte M. L. Jiang M. Wang M. Yuan Y. X. Xue Z. S. (2019). Does the Element Composition of Soils of Restored Wetlands Resemble Natural Wetlands? Geoderma351, 174–179. doi: 10.1016/j.geoderma.2019.05.032
32
Wang G. D. Wang M. Jiang M. Lu X. G. He X. Y. Wu H. T. (2017). Effects of Vegetation Type on Surface Elevation Change in Liaohe River Delta Wetlands Facing Accelerated Sea Level Rise. Chin. Geograph. Sci.27, 810–817. doi: 10.1007/s11769-017-0909-3
33
Wang G. D. Wang M. Lu X. G. Jiang M. (2016). Surface Elevation Change and Susceptibility of Coastal Wetlands to Sea Level Rise in Liaohe Delta, China. Estuarine. Coastal Shelf. Sci.180, 204–211. doi: 10.1016/j.ecss.2016.07.011
34
Webb E. L. Friess D. A. Krauss K. W. Cahoon D. R. Guntenspergen G. R. Phelps J. (2013). A Global Standard for Monitoring Coastal Wetland Vulnerability to Accelerated Sea-Level Rise. Nat. Climate Change3, 458–465. doi: 10.1038/nclimate1756
35
Werkmeister C. Jacob D. L. Cihacek L. Otte M. L. (2018). Multi-Element Composition of Prairie Pothole Wetland Soils Along Depth Profiles Reflects Past Disturbance to a Depth of at Least One Meter. Wetlands38, 1245–1258. doi: 10.1007/s13157-018-1032-7
36
Williams T. P. Bubb J. M. Lester J. N. (1994). Metal Accumulation Within Salt Marsh Environment: A Review. Marine. Pollution Bull.28, 277–290. doi: 10.1016/0025-326X(94)90152-X
37
Yellick A. H. Jacob D. L. Dekeyser E. S. Hargiss C. L. M. Meyers L. M. Ell M. et al . (2016). Multi-Element Composition of Soils of Seasonal Wetlands Across North Dakota, USA. Environ. Monit. Assess.188, 17. doi: 10.1007/s10661-015-5013-5
38
Yuan Y. X. Zhu X. Y. Mushet D. M. Otte M. L. (2019). Multi-Element Fingerprinting of Waters to Evaluate Connectivity Among Depressional Wetlands. Ecol. Indic.97, 398–409. doi: 10.1016/j.ecolind.2018.10.033
39
Yu J. B. Dong H. F. Li Y. Z. Wu H. F. Guan B. Gao Y. J. et al . (2014). Spatiotemporal Distribution Characteristics of Soil Organic Carbon in Newborn Coastal Wetlands of the Yellow River Delta Estuary. Clean-Soil. Air. Water42, 311–318. doi: 10.1002/clen.201100511
40
Yu J. B. Dong H. F. Wang H. B. Chen X. B. Xie W. J. Mao P. L. et al . (2011). Spatial Distribution Characteristics of Metals in New-Born Coastal Wetlands in the Yellow River Delta. Wetland Sci.9, 297–304. doi: 10.13248/j.cnki.wetlandsci.2011.04.001
41
Yu J. B. Zhan C. Li Y. Z. Zhou D. Fu Y. Q. Chu X. J. et al . (2016). Distribution of Carbon, Nitrogen and Phosphorus in Coastal Wetland Soil Related Land Use in the Modern Yellow River Delta. Sci. Rep.6, 37940. doi: 10.1038/srep37940
42
Zhu X. Y. Yuan Y. X. Jiang M. Song C. C. Li Y. C. Wang G. D. et al . (2021). Multi-Element Fingerprinting of Soils can Reveal Conversion of Wetlands to Croplands. Sci. Total Environ.752, 141997. doi: 10.1016/j.scitotenv.2020.141997
43
Zhu X. Y. Yuan Y. X. Mushet D. M. Otte M. L. (2019). Can Multi-Element Fingerprinting of Soils Inform Assessments of Chemical Connectivity Between Depressional Wetlands? Wetlands39, 1015–1027. doi: 10.1007/s13157-019-01154-x
Summary
Keywords
biogeochemistry, element concentrations, Phragmites australis , Suaeda heteroptera , coastal salt marsh
Citation
Wang G, Wang M, Xue Z, Ren Z, Jiang M and Otte M (2022) Vegetation Regulates Element Composition of Soils by Enhancing Organic Matter Accumulation in the Salt Marshes of Liao River Delta, China. Front. Mar. Sci. 9:888605. doi: 10.3389/fmars.2022.888605
Received
03 March 2022
Accepted
23 March 2022
Published
12 April 2022
Volume
9 - 2022
Edited by
Tian Xie, Beijing Normal University, China
Reviewed by
Ting Lei, Beijing Forestry University, China; Xi Min, Qingdao University, China
Updates
Copyright
© 2022 Wang, Wang, Xue, Ren, Jiang and Otte.
This is an open-access article distributed under the terms of the Creative Commons Attribution License (CC BY). The use, distribution or reproduction in other forums is permitted, provided the original author(s) and the copyright owner(s) are credited and that the original publication in this journal is cited, in accordance with accepted academic practice. No use, distribution or reproduction is permitted which does not comply with these terms.
*Correspondence: Ming Wang, wangm100@nenu.edu.cn
This article was submitted to Marine Ecosystem Ecology, a section of the journal Frontiers in Marine Science
Disclaimer
All claims expressed in this article are solely those of the authors and do not necessarily represent those of their affiliated organizations, or those of the publisher, the editors and the reviewers. Any product that may be evaluated in this article or claim that may be made by its manufacturer is not guaranteed or endorsed by the publisher.