 Bo Kyung Kim
 Misa Jeon1
 Jisoo Park
 Sun-Yong Ha
95% of researchers rate our articles as excellent or good
Learn more about the work of our research integrity team to safeguard the quality of each article we publish.
Find out more
ORIGINAL RESEARCH article
Front. Mar. Sci. , 25 July 2022
Sec. Aquatic Microbiology
Volume 9 - 2022 | https://doi.org/10.3389/fmars.2022.887909
This article is part of the Research Topic Microbial Response to a Rapidly Changing Marine Environment: Global Warming and Ocean Acidification, Volume II View all 12 articles
Quantifying the temporal variability in phytoplankton productivity is essential for improving our understanding of carbon (C) and nitrogen (N) dynamics and energy flows in natural aquatic ecosystems. Samples were collected at three-day intervals from December 2018 to January 2019 from fixed station in Marian Cove, Antarctica to determine the C and N (NO3- and NH4+) uptake by phytoplankton. Considerable fluctuations in the total C and N productivities were observed, which led to dynamic changes in the phytoplankton communities and a stronger coupling between the phytoplankton biomass. The increased rate of NO3- uptake coincided with an enhanced C uptake mainly by microphytoplankton (>20 µm), followed by an increase in NH4+ uptake towards the end of sampling period. However, the <2 µm fraction (picophytoplankton) showed little variation in C and NO3- uptake, and the proportions of assimilated NH4+ contributed to more than half of the total assimilated inorganic N. The increased NH4+ did not increase the total phytoplankton biomass and C production. Interestingly, after January 9 (maximum chlorophyll a, C, and N uptake) there was a shift to a predominantly easterly wind (>6 m s-1), which rapidly decreased the total chl-a, C and N uptake rate to ~4% of the highest values (0.6 mg m-3, 1.0 mg C m-3 h-1, 0.1 mg N m-3 h-1, respectively) on January 12. The phytoplankton community was also replaced by neritic and ice-related species. These findings suggest that strong temporal shifts in phytoplankton C and N assimilation are strongly influenced by external forces (wind stress).
The Southern Ocean plays a critical role in Earth’s carbon cycle as a significant carbon sink, accounting for ~43% of the total oceanic inventory of anthropogenic CO2 south of 30° S (Frölicher et al., 2015). This is a region of seasonal extremes, with large fluctuations in phytoplankton productivity. Coastal Antarctic is considered to have high productivity, with large summer blooms phytoplankton representing the most important annual input to pelagic food webs (Kang et al., 1997; Fiala et al., 1998; Kang et al., 2002; Arrigo et al., 2008; Vernet et al., 2012; Biggs et al., 2019).
Phytoplankton bloom dynamics in coastal Antarctic waters are governed by irradiance, temperature, stratification, anticyclones, and nutrient supply (Saba et al., 2014; Schloss et al., 2014; Höfer et al., 2019, and references therein). They consists of a series of sequential blooms of different phytoplankton species and sizes that utilize different forms of dissolved inorganic N (DIN) for optimal growth, depending on the ambient nutrient concentration and cell phases. Usually, high primary productivity (C uptake) phytoplankton blooms are seasonal in ice-covered regions and occur after sea ice melts. These blooms are composed of large phytoplankton cells (>20 µm, e.g., diatoms) that utilize nitrate (NO3-; so-called “new”) as their nitrogen (N) source. Smaller cells and haptophytes, which use regenerated forms of N compounds, e.g., ammonium (NH4+) to sustain growth, become important under post-bloom conditions (Dugdale and Goering, 1967; Kanda et al., 1990; Kristiansen et al., 1994; Bode et al., 2002; Clarke et al., 2008). Therefore, changes in the productivity and size classes of marine phytoplankton reflect environmental conditions and affect the flow of dietary energy from lower to upper trophic levels.
The coastal ecosystems of Antarctica on the western Antarctic Peninsula (WAP), where significant changes in sea ice and terrestrial ice sheet dynamics, temperature, nutrients, and salinity have been observed, are more vulnerable to climate change than other regions (Prézelin et al., 2000; Cook et al., 2005; Martinson et al., 2008; Stammerjohn et al., 2008; Annett et al., 2015; Cook et al., 2016; Llanillo et al., 2019). These changes are directly linked to observed changes in coastal ecosystems (Atkinson et al., 2004; Moline et al., 2004; Moon et al., 2015; Arrigo et al., 2017; Höfer et al., 2019; Plum et al., 2020; Gutt et al., 2021). In particular, Marian Cove is one of the fastest glacier retreat fronts in the WAP (Rückamp et al., 2011), and is a marine biological hotspot, as it is a fjord experiencing ecosystem changes due to global warming-induced glacier retreat and ice-melt (Gutt et al., 2021). Most studies in the area have focused primarily on benthic genera and bacterial community structures (Moon et al., 2015; Ahn et al., 2016; Ha et al., 2019; Kim et al., 2020; Bae et al., 2021), with numerous studies dealing with phytoplankton in the Marian Cove (Kang et al., 1997; Kang et al., 2002; Lee et al., 2015). However, limited phytoplankton productivity data are available from the same area (Yang, 1990; Kim et al., 2021). Studies on 15N-based uptake of phytoplankton have not been conducted in the Marian Cove till date. Therefore, the temporal pattern of phytoplankton succession in the Marian Cove, as influenced by their C and N uptake dynamics were undertaken to better understand the ecosystem structures and functions. The aim of this study was to describe the temporal variations in the C and N (new and regenerated) uptake rates of phytoplankton and associated chlorophyll a (chl-a) during summertime in the Marian Cove. The present study also constitutes the first measurement of in-situ N productivity in the study area and mainly focuses on the mechanisms controlling C and N dynamics related to environmental conditions.
The Marian Cove is 4.5 km long, 1.5 km wide, ~110 m deep, and is located in the Maxwell Bay, southwest of the King George Island, WAP. The area has experienced ~1.7 km of glacial retreat for 50 years (Park et al., 1998; Lee et al., 2008; Rückamp et al., 2011). Recent (1956–1957 and 2020–2021) glacier retreat velocity was ~27.2 m/yr in the Marian Cove (Figure 1). The phytoplankton biomass (chl-a) in the area started to increase from October to November peaking (i.e., a “bloom”) around January, whereas the lowest values occurred during winter (June–August) (Kang et al., 2002; Lee et al., 2015; Jeon et al., 2021). Marian Cove is characterized by intense summer blooms with high primary production in January (Kim et al., 2021). The general pattern of seasonal phytoplankton succession is that diatoms (>20 µm) dominate in summer and, pico- and nanophytoplanktons (<20 µm) dominate in winter (Kang et al., 1997; Kang et al., 2002; Lee et al., 2015; Jeon et al., 2021).
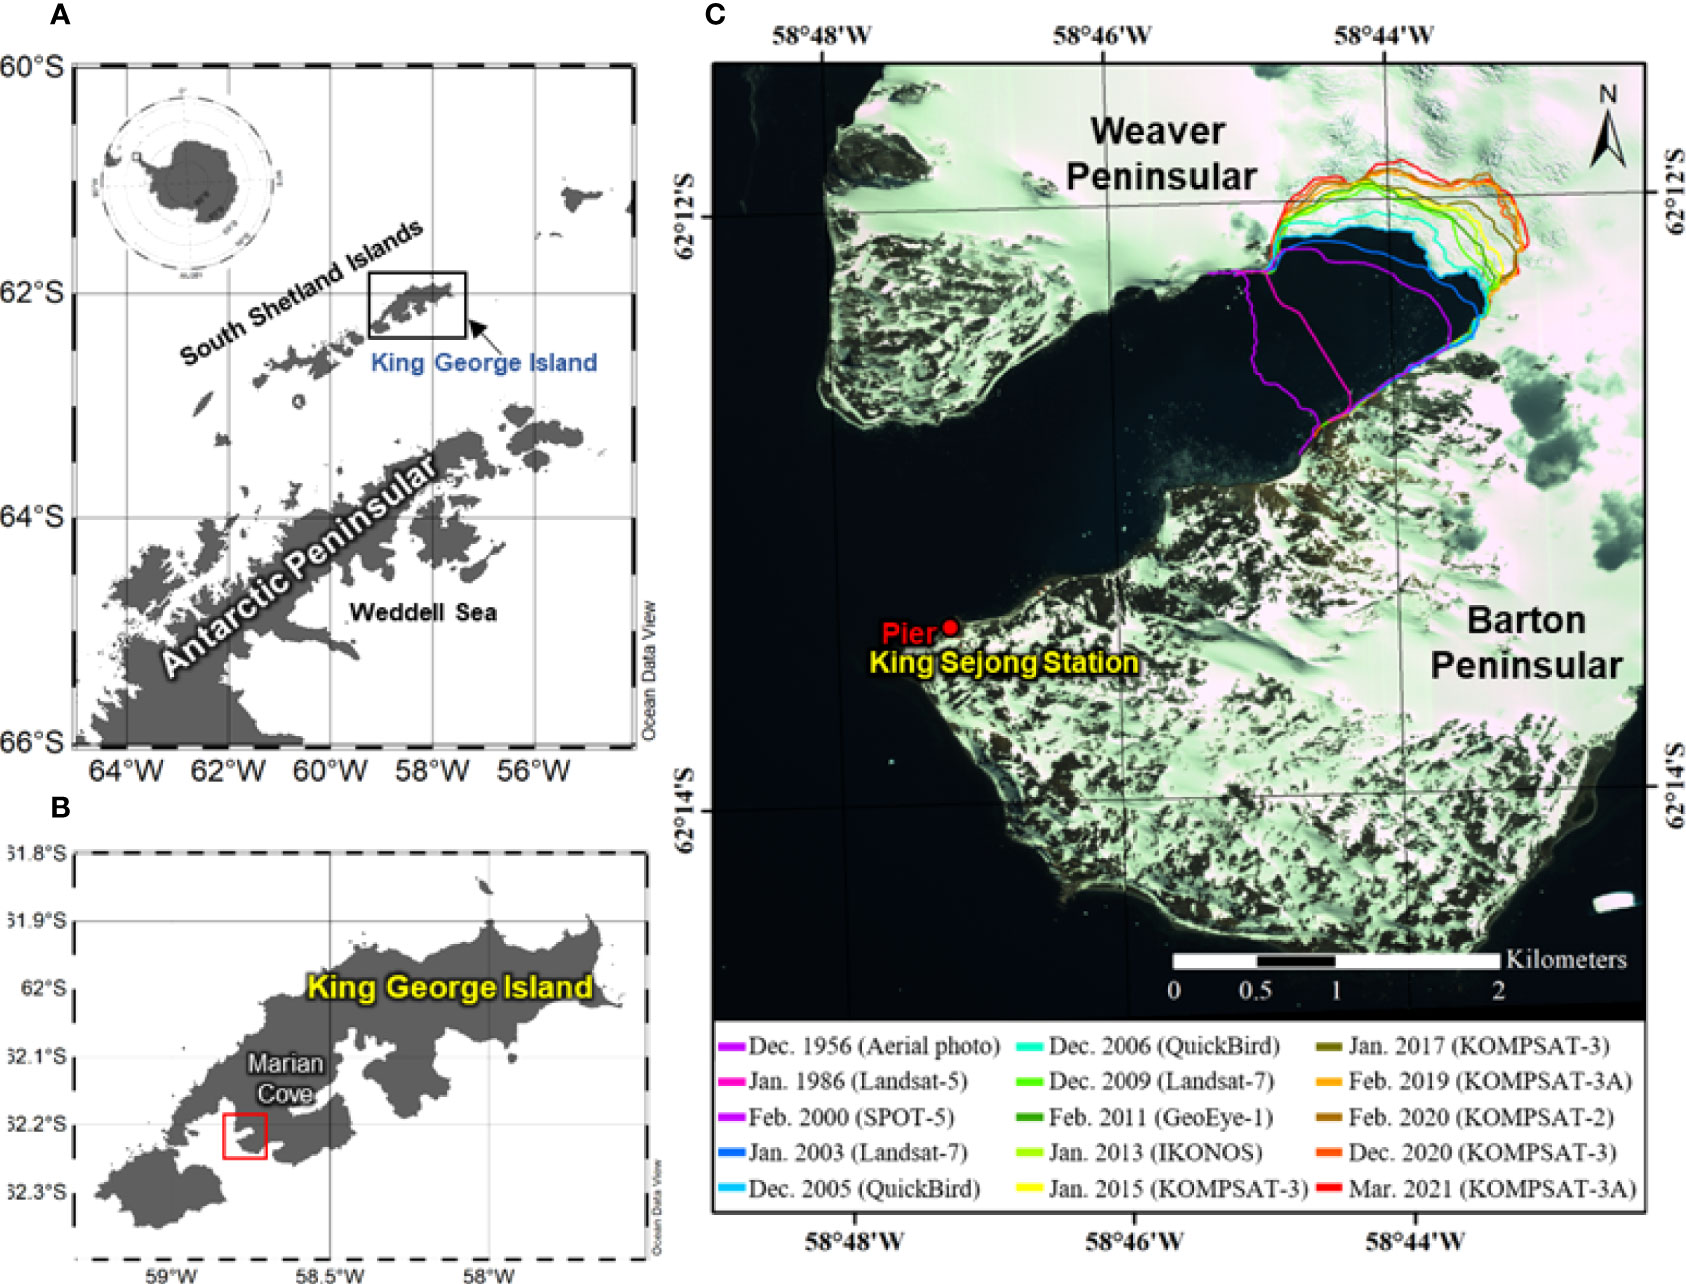
Figure 1 Map showing the location of the (A) South Shetland Islands, (B) King George Island, and (C) Marian Cove. Glacier termini overlaid on remote sensing images and aerial photographs acquired in 1956-2021. The maps (A, B) were generated by using Ocean Data View v. 5.3.0 (https://odv.awi.de) (AWI, Bremerhaven, Germany, Schlitzer, R.).
The study site was conducted from a fixed-point coastal monitoring site for marine ecosystem near King Sejong Station (62°13’ S, 58°47’ W; KSS), Korea (Figure 1). Experiments for C and N uptake by phytoplankton were conducted from December 19, 2018, to January 26, 2019, and results were compared with the environmental parameters (water temperature, salinity, chl-a, nutrients, and phytoplankton taxonomy). The water depth at the site is between 5 and 10 m, and is vertically well-mixed owing to wind- and tide-induced currents (Lee et al., 2015 and references therein). Surface water samples were collected every third day around solar noon at a depth of 0.5 m using a sampler. Average three–hour meteorological data (wind speed and wind direction) were collected during the sampling period from the automatic meteorological observation system (AMOS-3) of the KSS. The wind vane was located 10 m above ground (Park et al., 2013). Ten-minute interval data were averaged into hourly and daily data.
Water temperature and salinity were measured using a YSI Model 30 (Yellow Springs Inc. Ohio, USA). For dissolved inorganic nutrient (NO2- + NO3-, NH4+, PO43-, and SiO2) concentrations, the seawater was filtered through GF/F filters (pre-combusted at 450°C for 4 h, nominal 0.7 µm, Whatman, UK). The filtered seawater samples were preserved at approximately -20°C until analysis. Major inorganic nutrients were measured using a 4-channel continuous autoanalyzer (QuAAtro, SEAL Analytical, UK), according to the manufacturer’s instructions. Standard curves were run for each sample batch using freshly prepared standards with concentrations in the range of that of the samples. For total chl-a analysis, seawater was filtered through GF/F filters (pre-combusted at 450°C for 4 h). For size-fractionated chl-a analysis, water was passed sequentially through a nucleopore membrane filter (20 µm and 2 µm) and GF/F filters. All filters were extracted overnight with 90% acetone, and the extracts were analyzed using a fluorometer (Trilogy, Turner Designs, Sunnyvale, CA, USA) (Parsons et al., 1984).
The sampled seawater was prefiltered through a 200 µm mesh to remove zooplankton. 13C-labeled sodium bicarbonate (Cambridge Isotope Laboratories, USA), 15N-labeled potassium nitrate and sodium ammonium (Sigma–Aldrich, USA) were added to the surface water samples in 1 L polycarbonate bottles. The 13C and 15N levels were ~4–20% of the total dissolved inorganic C and ambient nitrogenous nutrient concentrations. The bottles were incubated for 4–5 h in ambient seawater. The incubated seawater was filtered (0.3 L) through 450°C pre-combusted GF/F filters (25 mm). A fraction of the picophytoplankton and water passed through 2 μm nucleopore filters (47 mm) and the filtrate was passed through GF/F filters (25 mm). The filters were immediately stored at -80°C until further analysis. The C and N (nitrate and ammonium) uptake rates of the phytoplankton were measured according to the protocol described by Kim et al. (2021). The samples were placed overnight in an acid fume to remove carbonates. C and N isotope abundances were determined using Elemental Analysis (Euro EA3028, EuroVector, Milan, Italy) - Isotope Ratio Mass Spectrometry (Isoprime 100, EIementar, Manchester, UK) in a stable isotope laboratory at Hanyang University, Korea. Carbonate alkalinity of the water sample was determined by titration with 0.01 N HCl, and the total CO2 content was calculated according to the method of Parson et al. (1984). The C or N uptake rates (mg C (or N) m-3 h-1) of phytoplankton were calculated based on Hama et al. (1983) and Dugdale and Goering (1967), respectively, using the following formula (1):
where ΔPOC(orPON)(t) is the increase in particulate organic C or N concentration during incubation (mg C (or N) m-3), respectively, t is the incubation time, ais is the atomic % of 13C (or 15N) in the incubated sample, ans , is the atomic % of 13C (or 15N) in the natural sample, aic is the atomic % of 13C (or 15N) in the total inorganic C (or N). The specific uptake rate can be defined as the rate of uptake or transport of the product (h-1). Unlike the C uptake samples (duplicates), single samples were analyzed for the N uptake rates.
Pearson’s correlation was used to investigate the relationship between environmental variables and C and N uptake rates. In this study, we estimated the time series of temporally cumulative zonal wind stress (τx, in N m-2) from December 19, 2018 to January 26, 2019, to identify cumulative force exerted on the surface. The cumulative zonal wind stress at a particular time is calculated as the sum of the wind stresses over the previous days (1-day to 5-day in this study). Positive and negative values indicate eastward and westward wind stress, respectively.
The surface water temperature at the sampling site in the Marian Cove was the highest (2.2°C) and lowest (0.3°C) on December 19, 2018 and January 26, 2019, respectively (Figure 2A). With the exception of a few days (≤0.6°C) in December to January, most recorded temperatures were above >1°C. The surface salinity ranged from 29.6 to 34.5. Salinity was stable throughout the study period, except a low salinity period in January 12–20. Salinity was positively correlated with the water temperature (r = 0.615, p< 0.05; Table 1).
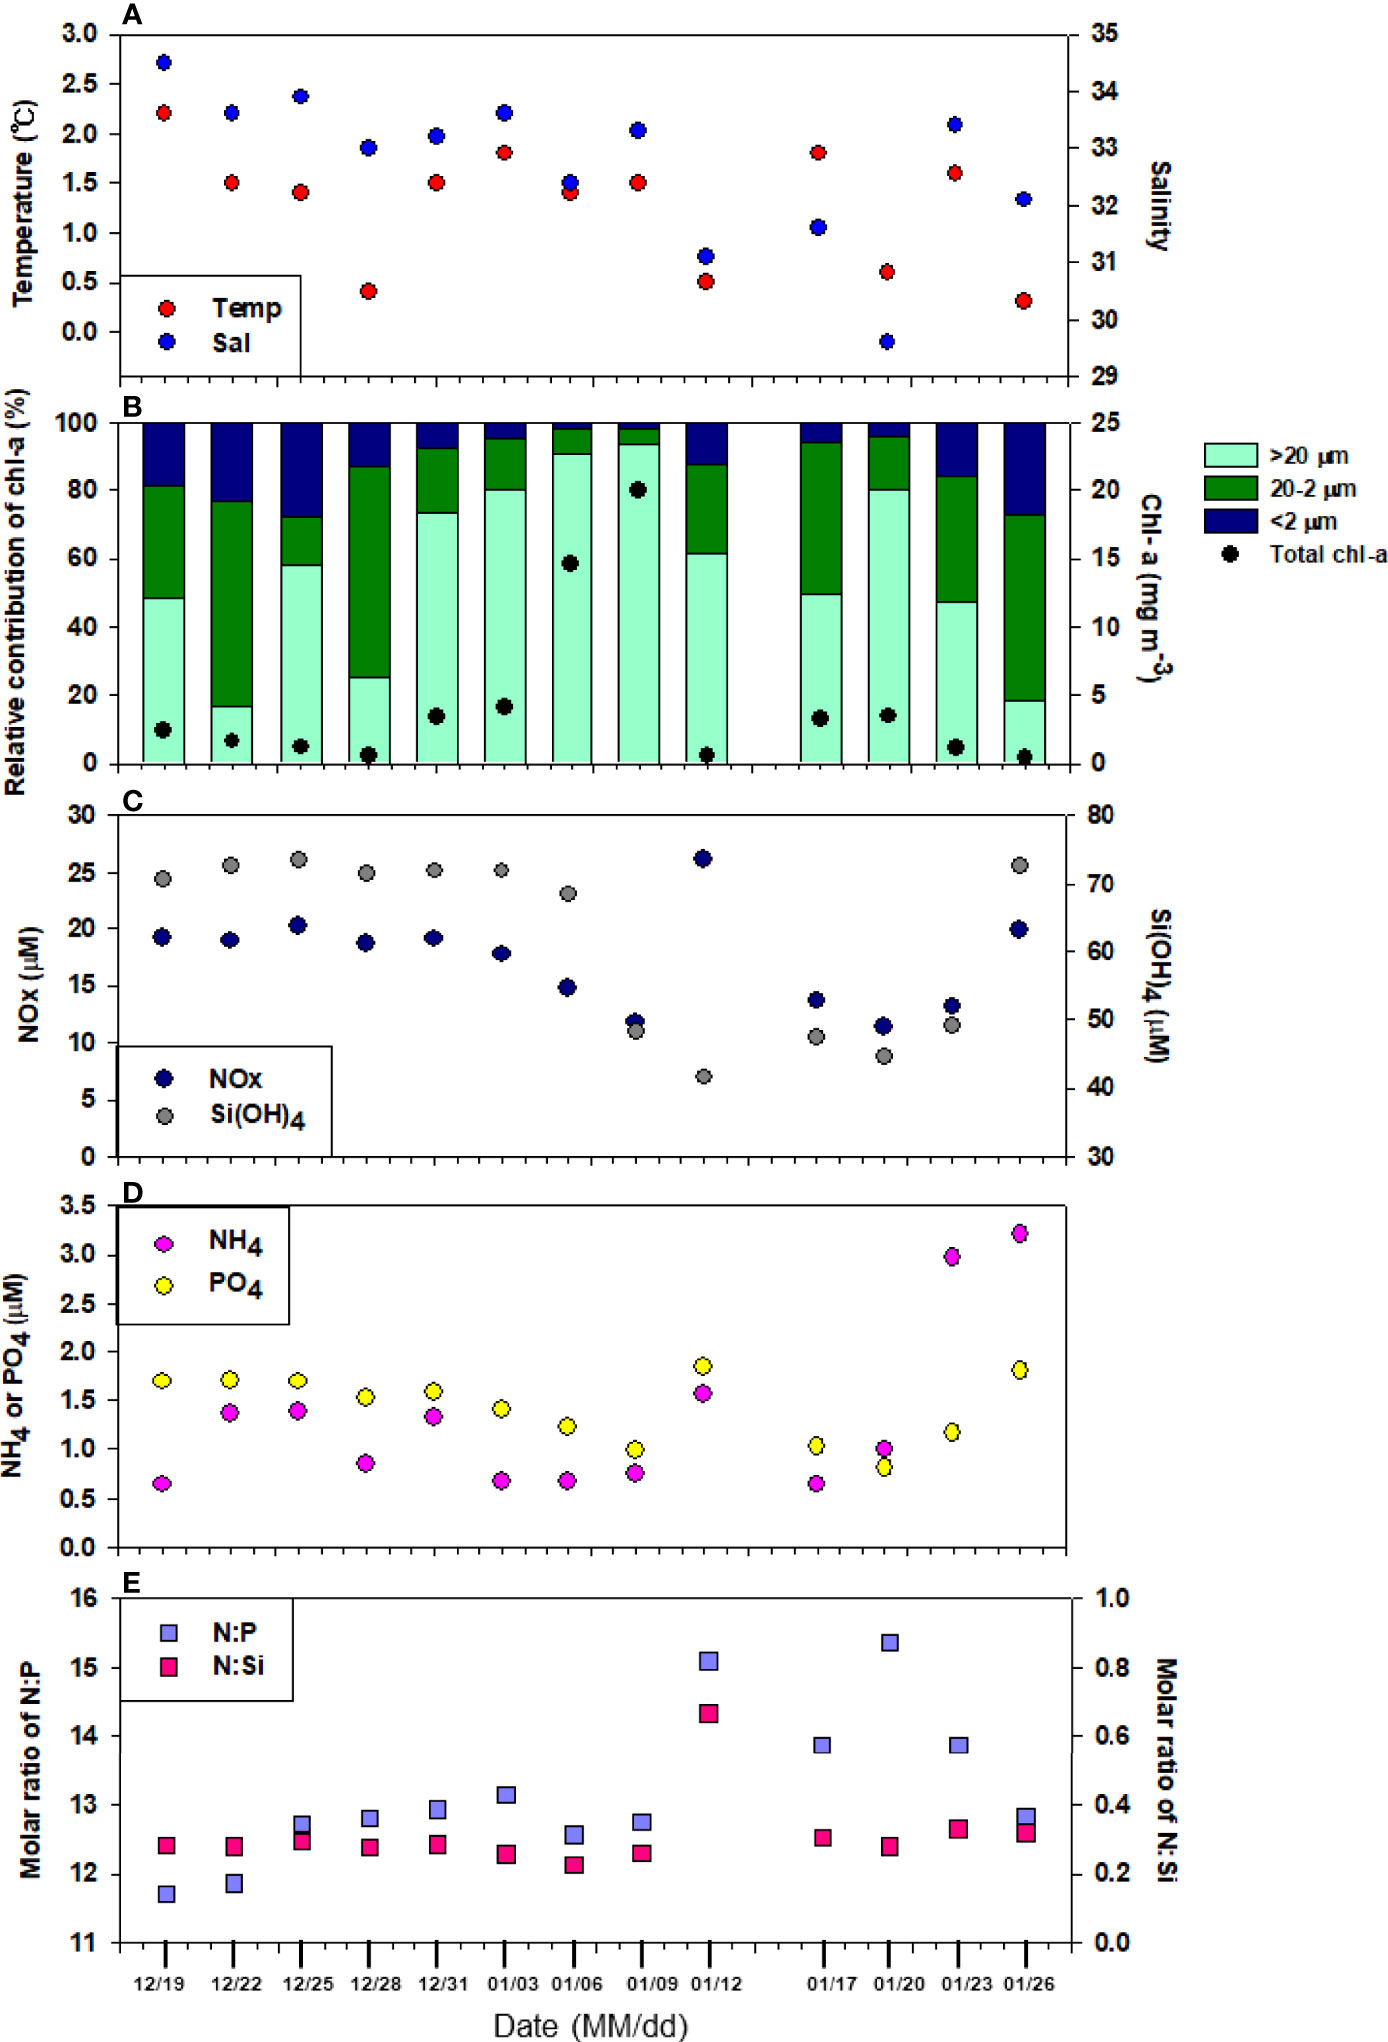
Figure 2 Temporal variability of (A) water temperature and salinity, (B) total chlorophyll a concentration and percentage contribution of size-fractionated chlorophyll a, concentration of (C) NOx (NO2-+NO3-) and SiO2,(D) PO43- and NH4+, (E) molar ratio of N:P and N:Si at surface water during sampling period.
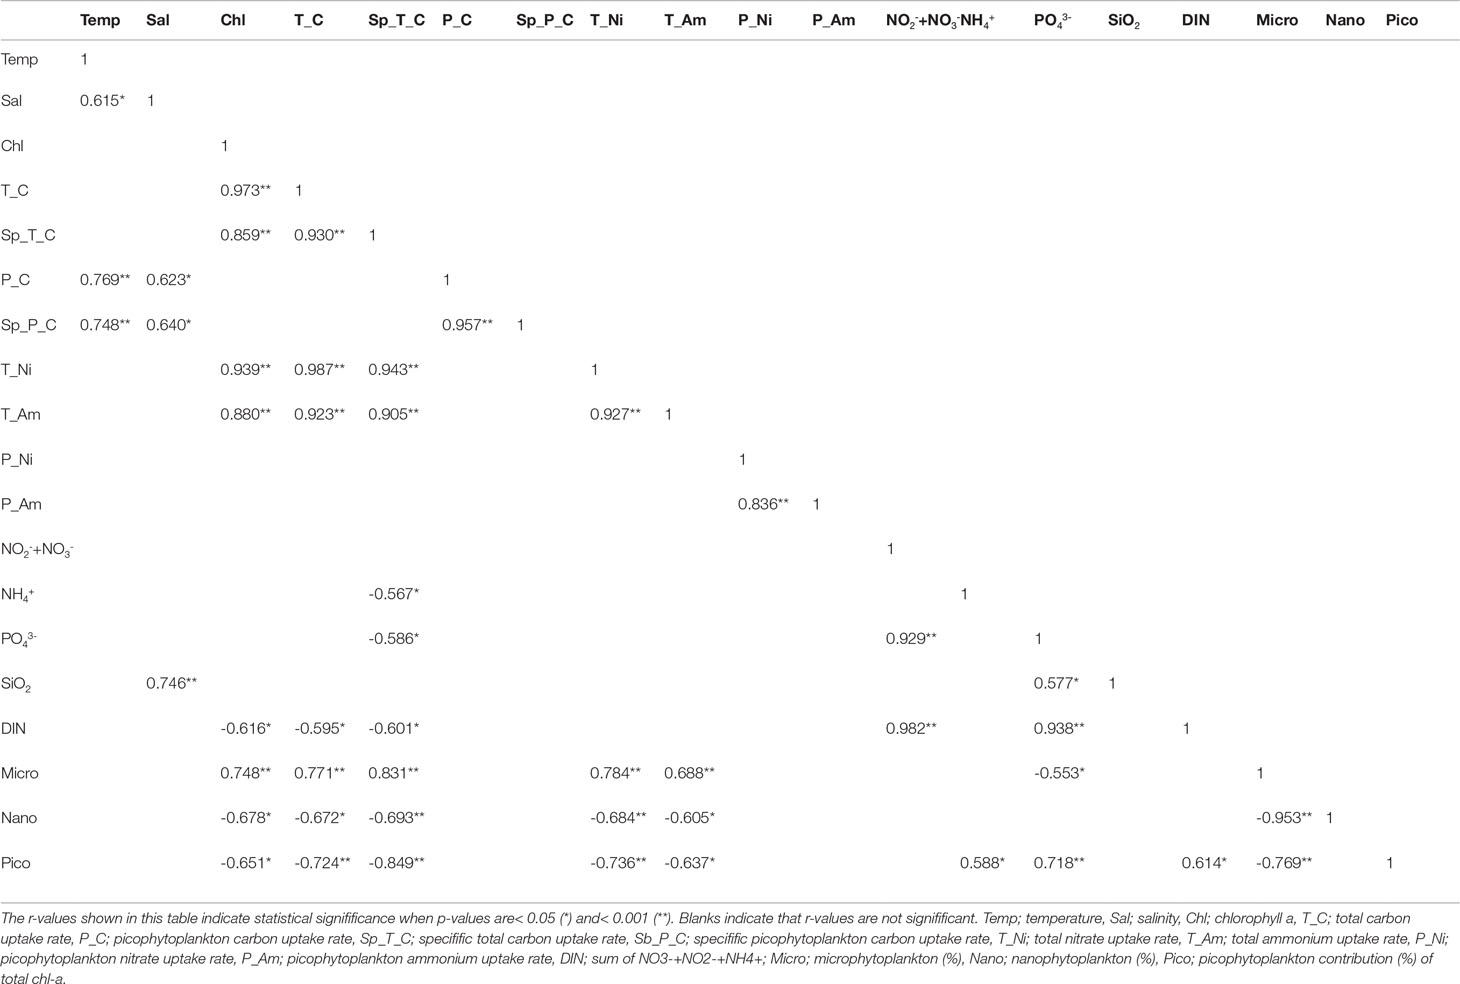
Table 1 Pearson correlation coefficients between the environmental parameters on productivity.
Figure 2B shows the temporal variability of the total chl-a content and the relative contribution of size-fractionated phytoplankton (micro-, nano-, and picophytoplankton). The highest total phytoplankton biomass (chl-a) was recorded on January 6 and 9, 2019 (14.6 and 20.0 mg m-3, respectively). Average chl-a was 4.4 mg m-3 (SD = ± 6.0 mg m-3) during the period from December 19, 2018 to January 26, 2019 (Figure 2B). Microphytoplankton constituted the dominant size fraction during the sampling period, accounting for 16.5-93.6% of the total chl-a content, with a mean of 57.2% (± 26.2%), followed by nano- (30.3%), and picophytoplankton (12.5%). At peak chl-a content, microphytoplankton (>20 μm) contributed >90% of the total chl-a. In comparison, the contribution of picophytoplankton (<2 μm) to the total biomass was always low, reaching peak values (28%) on December 25, 2018. The total chl-a concentration was positively correlated with microphytoplankton (p< 0.05, r = 0.748) and negatively correlated with picophytoplankton (p< 0.05, r = -0.651) (Table 1).The daily concentrations of NO2-+NO3- and SiO2 were 11.4–26.2 μM and 41.6–73.5 μM, respectively, although they differed widely on each sampling date. PO43- displayed the same pattern as NO2-+NO3- (Figure 2C). However, the PO43- concentration was relatively lower (0.8-1.8 μM). Decrease in nutrient concentrations during sampling were common with substantially increased chl-a concentration, such as from early to mid-January. The largest decrease in nutrient concentration in the surface water from the initial values was observed during January 12–20. NO2-+NO3- and PO43- concentrations decreased from 19.2 to 11.4 μM and 1.7 to 0.8 μM, respectively (Figure 2C). Similarly, low NH4+ was observed (<1 μM) at peak chl-a. Interestingly, SiO2 concentrations further decreased between January 9 and 23, which was not observed for other inorganic nutrients (Figure 2D). Overall, the NO2-+NO3-+NH4+:PO43- (N:P) and NO2-+NO3-+NH4+:SiO2 (N:Si) molar ratios ranged from 11.7 to 15.4 (average ± SD = 13.2 ± 1.1) and 0.2 to 0.7 (average ± SD = 0.3 ± 0.1), respectively (Figure 2E).
Figure 3 shows the three-hourly average wind speed and direction. The average wind speed during the study period was 6 m s-1. A large change was observed in the average wind speed in the Marian Cove during the sampling period, reaching 14.4 m s-1. The overall wind direction was WNW during the sampling period. Meanwhile, an easterly wind prevailed from January 10 and 13, with highest wind speeds (>6 m s-1) (Figures 3A, B). The colored curve in Figure 3C shows the accumulated τx values, there were two strong eastward episodes. The pulses of accumulated τx match well with the wind speed through December 19, 2018 to January 26, 2019 (Figures 3A, C). It exhibits clearly that the overall intensity of the eastward in 2-day is the strongest from 1-day to 5-day (see red curve in Figure 3C). The accumulated intensity of easterly wind in 2-day between January 11 and 13 is the most prominent.
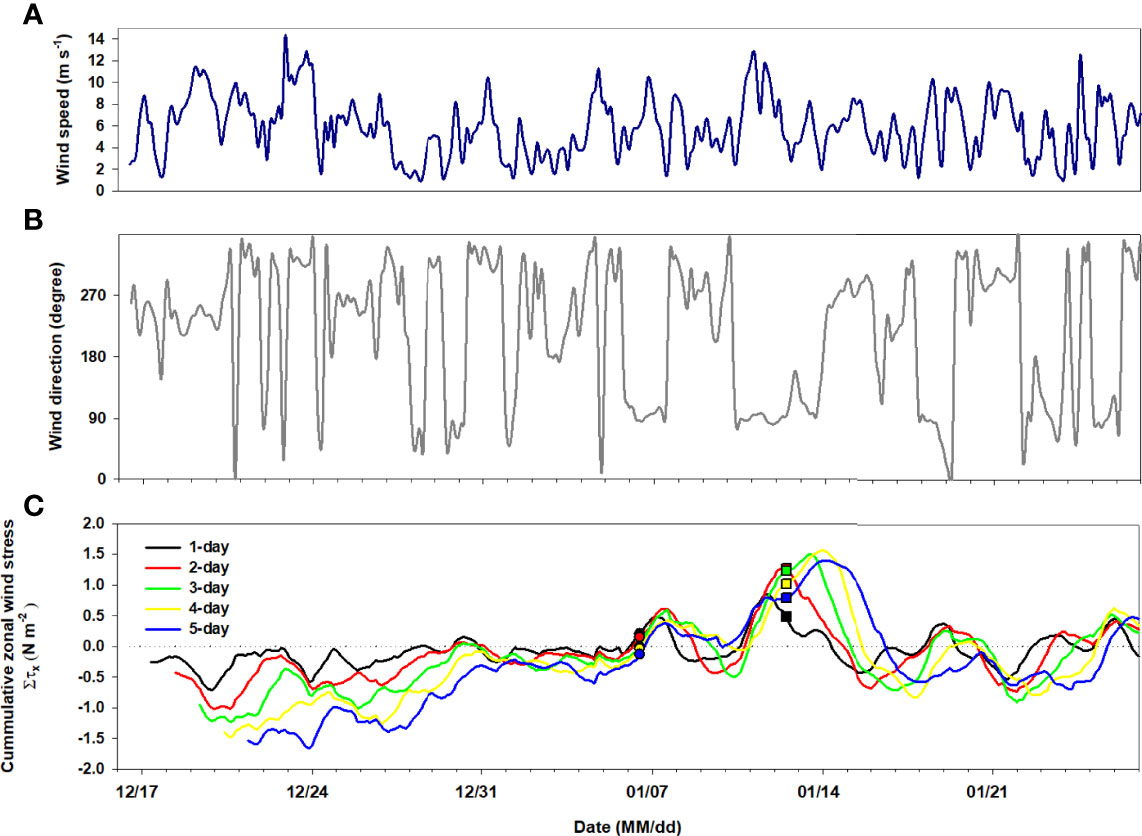
Figure 3 Time series of (A) wind direction, (B) wind speed and (C) cumulative zonal wind stress during sampling period. In (C), the black line indicates the prescribed climatological wind stress (τx ) for the 1-day. The red, green, yellow, and blue lines are cumulative wind stress forcing for 2-, 3-, 4-, and 5-day, respectively. The circle and square symbols represent the sampling time of January 6 and 12, respectively.
The total C and N (sum of NO3- and NH4+ uptake) uptake rates (mg C (or N) m-3 h-1) by phytoplankton in the surface water were measured during summer (December–January) (Figures 4, 5), and were 0.3–24.5 mg C m-3 h-1 and 0.06–3.27 mg N m-3 h-1, respectively. The average C and N uptake rates were 6.8 mg C m-3 h-1 (SD = ± 7.9 mg C m-3 h-1) and 1.0 mg N m-3 h-1 (SD = ± 1.1 mg N m-3 h-1), respectively, with the highest rates observed on January 9 and the lowest on January 26 (Figures 4A, 5A). The temporal pattern of N uptake was very similar to that of C uptake and chl-a content (Figures 4A, 5A). Moreover, the specific uptakes (h-1) of total C and NO3- were the highest on January 6, after which they gradually decreased, peaked on January 17, and then steadily decreased until the end of the observation period (Figures 4B, 5C). Relative contributions of the different N compounds to the measured total N uptake varied for on each sampling date (Figure 5D). Compared to total N, proportion of the NO3- uptake fraction was 15.2% at the beginning (in the middle of December) but increased gradually to 64.7% on January 3.
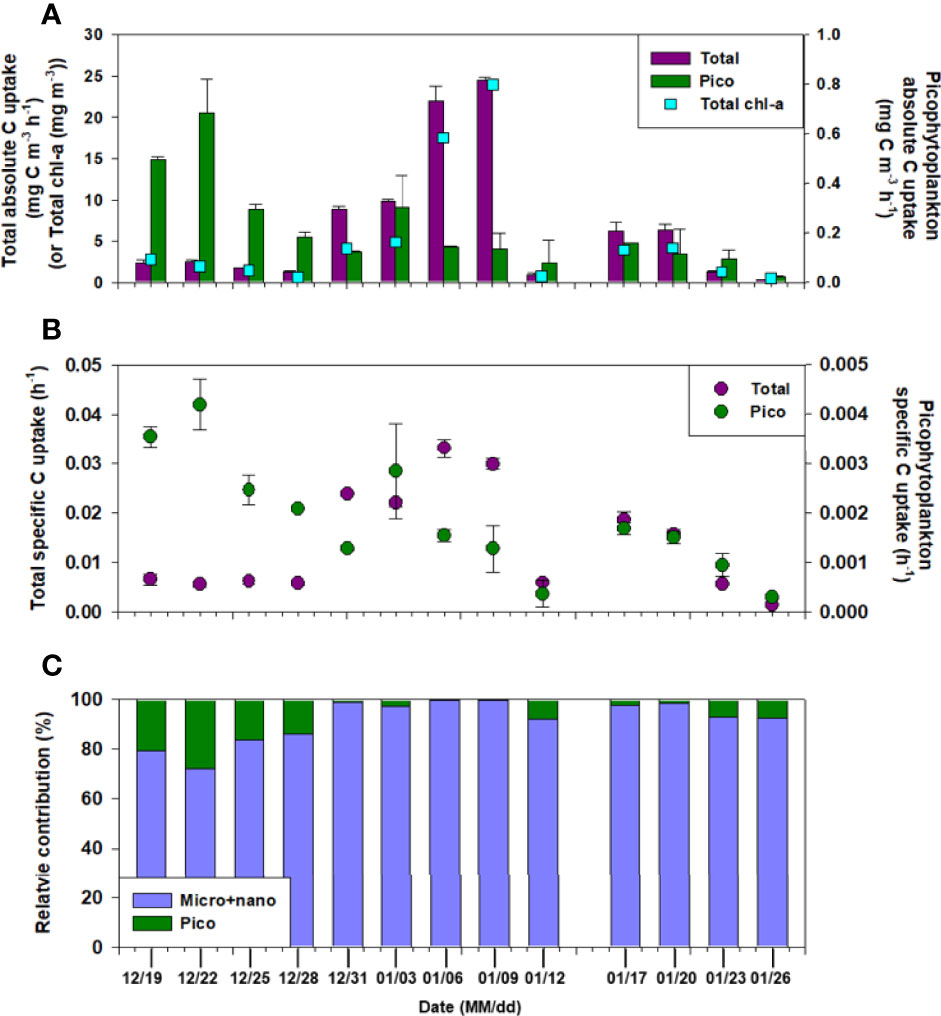
Figure 4 Hourly (A) carbon and (B) specific uptake rates for total and picophytoplankton, and (C) the relative contribution of size-fractionated phytoplankton each sampling date.
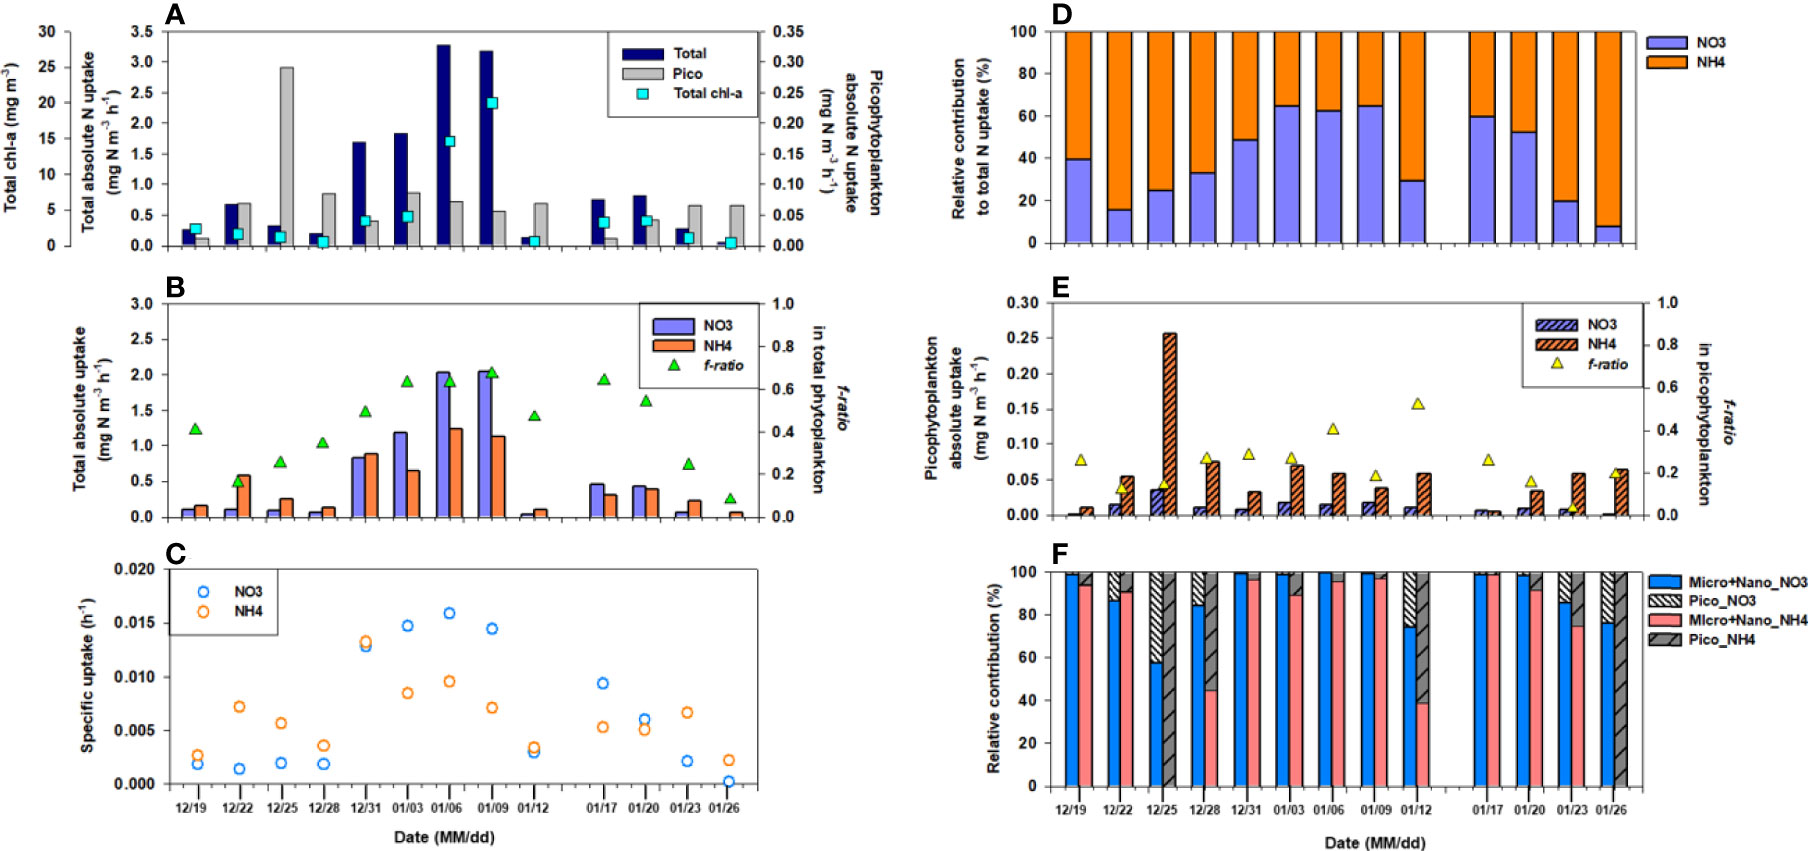
Figure 5 Hourly rates of (A) nitrogen, (B) nitrate (NO3-) and ammonium (NH4+) uptake, (C) specific nitrate (NO3-) and ammonium (NH4+) uptake, and (D) the relative contribution of different N forms in total phytoplankton, (E) nitrate (NO3-) and ammonium (NH4+) uptake in picophytoplankton, (F) the relative contribution of size-fractionated phytoplankton for different N forms on each sampling date. The blue squares in (A) and triangles in (B, E) represent total chl-a concentration and f-ratio, respectively.
Although both NO3- and NH4+ were taken up by phytoplankton, the C and dominant N sources varied between the growth phases and blooms. During the sampling period, the 31-fold change in biomass was lower than the 84-fold change in total C uptake, and growth acceleration was much faster in this region. Simultaneously, a more substantial (462-fold) change in the total NO3- uptake rate was observed, whereas the total NH4+ uptake (31-fold) was similar to that of the chl-a content. The total and specific C uptake rates were inversely correlated with DIN (NO2-+NO3-+NH4+, p< 0.05, r = -0.595, and r = -0.601, respectively) but positively correlated with phytoplankton biomass (chl-a, p< 0.05, r = 0.973, and r = 0.859, respectively) (Table 1). This suggests that the nutrients were alomost simultaneously used by the Marian Cove phytoplankton.
Decrease in the C uptake rate was mainly due to the decline in chl-a values for the total phytoplankton; however, the picophytoplankton fraction showed little variation in chl-a. We found that picophytoplankton productivity remained relatively constant during the sampling period compared to the total uptake, even with nutrient fluctuations (Figure 4A). The average surface C uptake by picophytoplankton was 0.2 mg C m-3 h-1 (SD = ± 0.2 mg C m-3 h-1), the highest being on December 22 (0.7 mg C m-3 h-1), and the lowest (0.02 mg C m-3 h-1) at the end of the observation period. The contribution of picophytoplankton to the total phytoplankton C uptake ranged from a minimum of 0.6% to a maximum of 27.9% on January 9 (Figure 4C). However, the average C uptake by picophytoplankton was up to 8.6% (SD = ± 8.7%) of the total measured C uptake. The specific uptake rate (h-1) of picophytoplankton showed a similar trend to the uptake rate of C, and decreased with decreasing surface C uptake (Figure 4B). A positive relationship was observed between the picophytoplankton C uptake, temperature, and salinity (p< 0.05), while a negative relationship was found between the picophytoplankton relative contribution to total biomass an the total C uptake (Table 1).
NO3- uptake by picophytoplankton in the surface waters varied from<0.01 to up to 0.04 mg N m-3 h-1, with a mean of 0.01 mg N m-3 h-1 (SD = ± 0.01 mg N m-3 h-1) (Figure 5E). The surface NH4+ uptake rates varied from 0.005 to 0.257 mg N m-3 h-1, whereas the NO3- uptake rates showed a relatively narrow range (0.001-0.035 mg N m-3 h-1) (Figure 5E). The NH4+ uptake rate was higher than the NO3- uptake rate in picophytoplankton, suggesting that it preferred NH4+ over NO3- (average NH4+ to NO3- uptake ratio of 9.1). Unlike the C uptake, neither NO3- nor NH4+ uptake showed any trend (data not shown). No statistical relationship was observed between picophytoplankton N productivity and hydrography and/or dissolved inorganic nutrient concentrations (Table 1).
We measured the in-situ C and N uptake rates of phytoplankton at a fixed monitoring site during the summer of 2018–2019 using a dual-stable isotope method. The Marian Cove is a semi-enclosed water body that has a tidal, turbid, wind-induced circulation current with high nutrient concentrations, water temperature, and organic matter load (Ahn et al., 1997; Yoo et al., 2003; Jeon et al., 2021). Freshwater discharge from glacier melt is an important control of phytoplankton production, and the accompanying high input of suspended particulate matter (SPM) in the inner Cove changes the optical conditions (Kim et al., 2021). During the study period, SPM concentration did not show any correlation with chl-a, C, or N uptake (p > 0.05, data not shown). However, phytoplankton C and N uptake rates and dominant species may be affected by the form of N supplied, nutrient levels, and wind-driven transport processes, such as glacial outflow in the cove. For the present study, we assumed a negligible influence of tidal forces because all sampling was conducted during flood tides.
Relatively high phytoplankton biomass (up to 45 mg m-3 near-shore waters adjacent to Palmer station; Goldman et al., 2014) and productivity have been observed in coastal and shelf areas (Garibotti et al., 2003; Arrigo et al., 2008; Ducklow et al., 2012b; Mendes et al., 2012). Particularly during the summer growing period, the phytoplankton species composition varied seasonally, with species abundance related to changes in environmental conditions based on 15 years of monitoring data (1996–2011) (Jeon et al., 2021). For example, seasonal nutrient depletion reflects diatom-dominated phytoplankton communities in regions where blooms are common, with a significant contribution of diatoms to the total phytoplankton biomass in the WAP (Clarke et al., 2008; Vernet et al., 2008; reviewed in Ducklow et al., 2012a; Höfer et al., 2019, and references therein).
Similarly, we observed massive phytoplankton blooms (chl-a up to 20 mg m-3), which were mainly composed of microphytoplankton (>20 µm) and large diatoms (>40 µm, e.g., Thalassiosira spp.; Supplementary Figure 1). There was a strong relationship between microphytoplankton fraction and the total chl-a concentration (p< 0.05, r = 0.748, n = 13), where microphytoplankton contributed >90% of the total chl-a when the latter exceeded ~14 mg m-3. When the chl-a concentration was<2 mg m-3, nanophytoplankton was occasionally the dominant size class (Figure 2B). This is consistent with Jeon et al. (2021), who reported that centric and pennate diatoms comprised a substantial part of phytoplankton biomass in the Marian Cove, with an ~58% contribution to the total microphytoplankton abundance during summer blooms. Therefore, seasonal blooms result primarily from increases in microphytoplankton and diatoms.We observed similar trends in the C uptake data and chl-a concentrations. During the peak bloom, the C uptake rate was much higher (24.5 mg C m-3 h-1) and the macronutrient concentrations declined considerably, implying a much more active nutrient intake by the phytoplankton. Variability in macronutrient consumption is reflected in the phytoplankton biomass in the Antarctic coastal waters during summer (Clarke et al., 2008; Zhang et al., 2019, and references therein). The dominance of microphytoplankton is consistent with the total primary production, and also positively correlates with the chl-a in various coastal waters (Varela et al., 2002; Marañón et al., 2012; Kim et al., 2021). Previous studies have documented a markedly high chl-a and C uptake rate in the coastal ice-edge zone in Antarctic waters adjoining the Indian Ocean (up to 4.0 mg m-3 and 3.3 mg C m-3 h-1, respectively; Verlencar et al., 1990), Marguerite Bay (>10 mg m-3 and >4.2 mg C m-3 h-1, respectively; Ducklow et al., 2012b), Marian Cove (up to 19.5 mg m-3 and 31.1 mg C m-3 h-1, respectively; Kim et al., 2021), and South Bay (>15 mg m-3 and >50 mg C m-3 h-1, respectively; Höfer et al., 2019). This is consistent with observations from the Antarctic coastal waters, and supports the theory that this is one of the most important global “biological hotspots”. The development of phytoplankton blooms is also an important factor affecting primary production.However, the observed temporal variability (0.3–24.5 mg C m-3 h-1) probably reflects a combination of changes in light availability due to turbidity and water stability (Schloss et al., 2002; Kim et al., 2021), as well as water movement (Höfer et al., 2019). Although various environmental factors affected the C uptake rate, no statistically significant differences were observed in the direct light intensity, SPM, water temperature, and salinity during the sampling period. Low macronutrient contents were observed during the peak bloom, but the N/P ratio remained similar regardless of the growth phase and was unlikely to act as a limiting factor for phytoplankton growth. Earlier studies reported that macronutrient values in the Marian Cove are generally a non-limiting factor for phytoplankton growth (Lee et al., 2015; Jeon et al., 2021), both due to inflow from the Maxwell Bay and the penguin colonies (Pruszak, 1980; Nędzarek, 2008), where turbulent mixing and wind-driven upwelling cause continuous and abundant nutrient flow into the photic layer. Additionally, lateral iron inputs from glacial meltwaters and terrestrial sources are sufficient to sustain large-scale phytoplankton blooms on the King George Island (Schloss et al., 2014; Kim et al., 2015; Höfer et al., 2019), and phytoplankton growth is not limited, even during intense blooms (Bown et al., 2017).
Nevertheless, the significant reduction in biomass and total C uptake immediately after peak chl-a (on January 12) may have enhanced other phytoplankton losses, such as zooplankton predation and other loss rates (i.e., viral lysis, sinking, and aggregation) (Petrou et al., 2016). Grazing effects, phytoplankton sinking, and mortality rates were not explored in this study. Instead, heterotrophic activity and the physiological status of phytoplankton were estimated based on the NH4+ concentration and specific C uptake by phytoplankton. For example, being its main contributor, zooplankton excretion can boost ambient NH4+ concentrations (Corner and Davies, 1971). Bacterial degradation of organic matter may also result in summertime NH4+ accumulation (Koike et al., 1986). NH4+ and NO3- concentrations in the area showed a rapid increase under lower C uptake on January 12 (Figures 3D and 4A). Simultaneously, the specific C uptake rates by phytoplankton were approximately 1/6 of the peak value (0.03 h-1). These results imply a physiological limitation of phytoplankton growth on January 12, which may have temporarily enhanced nutrient concentrations in the surface water due to less consumption by phytoplankton. This suggests the increased possibility of the influence of external forces (i.e., bottom-up control) rather than biointeractions (i.e., top-down control).
Utilisation of inorganic N by phytoplankton was observed to be highly variable in the Marian Cove during summer. The total NO3- uptake was higher than the NH4+ uptake in the bloom phase, while primary production in the system evolved from NO3–-based to NH4+-based at the end of sampling. This evolution is in agreement with earlier studies that reported rise in NH4+ levels during summers, when zooplankton and microbial metabolism provide regenerated N (Clarke et al., 2008; Mosseri et al., 2008). The high ambient NH4+ concentrations in conjunction with increased NH4+ uptake are indicative of an active regeneration process in the Marian Cove and are attributed to the late summer sampling. Thus, we hypothesized that NH4+ uptake occurs in relation to changes in its concentration and phytoplankton species/size composition.
Dependence of the NH4+ concentration on NO3- uptake has been described in previous studies (Dortch, 1990; L’Helguen et al., 2008; Dugdale et al., 2012; Glibert et al., 2016). For example, NH4+ concentrations >1 µM (Dortch, 1990) or over a certain threshold (0.2–100 µM; Varela and Harrison, 1999; Dugdale et al., 2012; Glibert et al., 2016) inhibit NO3- uptake rates. Our data also support that a relatively higher uptake of NH4+ than that of NO3- was observed in the presence of >1 µM NH4+ in ambient waters, which might be influenced by the inhibition of assimilated NO3- by phytoplankton. However, the elevated NH4+ uptake did not enhance the total phytoplankton C uptake or biomass. The observed rapid NO2-+NO3- drawdown and uptake rate of NO3- in January, coupled with increases in chl-a and C uptake, indicate high productivity. These results clearly suggest that NO3- is the preferred growth- and biomass-promoting N source for the studied phytoplankton community. Notably, the NH4+ uptake by phytoplankton was higher despite the high NO3- concentrations. Consequently, inhibition of NO3- uptake by NH4+ (>1 µM) may be one of the factors that led to the low f-ratio (0.08–0.24, Figure 5B) in the total phytoplankton (f-ratio= NO3- uptake/total N uptake (NO3- + NH4+ uptake), Eppley and Peterson, 1979).Another possible cause of the lower f-ratio could be the increasing contribution of the smaller cells (<20 µm). Microphytoplankton levels were higher during relatively high biomass and C and NO3- uptake rates, reaching an f-ratio of up to 0.67 on January 9 (Figure 5B). The NH4+ uptake rates were the highest in the picophytoplankton fraction throughout the sampling period, resulting in an f-ratio<0.5, which decreased to 0.03 at the end of the sampling period (Figure 5E). In picophytoplankton, NH4+ is preferentially assimilated over NO3- because NO3- assimilation is more energy consuming than NH4+ assimilation. Once NO3- is transported into the cell, it must be further reduced to NH4+ before it can be assimilated (Mulholland and Lomas, 2008).More importantly, f-ratio values show that planktonic diatoms (larger cells) are replaced by small phytoplankton in surface water, causing decreased primary production and C export. This is because NO3–-fueled new production at steady state is equivalent to the organic C that can be exported from total production in the euphotic layer (Eppley and Peterson, 1979). In this regard, phytoplankton species shifts toward smaller values could substantially lower C export efficiency as well as primary production (Montes-Hugo et al., 2008; Montes-Hugo et al., 2009; Lee et al., 2015, Mendes et al., 2012; Rozema et al., 2017; Schofield et al., 2017). The undergoing reductions in diatom silica production in response to ocean acidification and shifts toward smaller cells could reduce the vertical fluxes of diatoms and diminish C export efficiency before the end of this century (Petrou et al., 2019). Therefore, in the neritic area of Marian Cove, nutrient utilization in the surface layer during the summer induced variations in phytoplankton size composition in terms of chl-a and C and N uptake, from summer blooms (early January) skewed toward the microsized fraction (>20 μm) undergoing a gradual shift toward the pico sized fraction (<2 μm) through the nanosized fraction (2–20 μm) in late January. This shift in the size of the phytoplankton community probably involved the prevailing wind direction associated with physiological and morphological properties (e.g., nutrient uptake and export rate), as mentioned above.
Surface wind, meltwater dynamics, and currents, as key drivers of the upper water layer structure, strongly influence nutrient availability and phytoplankton growth (Deppeler and Davidson, 2017). Wind speed and direction may influence the strength and duration of phytoplankton blooms (Schloss et al., 2014; Deppeler and Davidson, 2017, and references therein). High-frequency (HF) wind forcing is important for the residence time of water (Kohut et al., 2018). The major component of HF zonal wind forcing was the so-called easterly wind events, which played a critical role in modulating water movement. Previous, studies on the Marian Cove (Yoo et al., 1999 and Yoo et al., 2015; Jeon et al., 2021) and the adjacent Potter Cove (K1öser et al., 1994) and Admiralty Bay (Nowosielski, 1980) have suggested that the prevailing easterly wind can generate outflow and upwelling near the cove head or deter the flow rate of surface influents from the Maxwell Bay. Pruszak (1980) observed the drift ice movement and reported that, surface water circulation can be controlled with a wind speed of >4 m s-1 in the adjacent Admiralty Bay. There is also a study result that surface water flows out of the Marian Cove within one day when the east wind blows with an average wind speed of over 8 m s-1 (Yoo et al., 1999).
Similarly, in our study, the wind direction changed from west to east, and continued for approximately three days. Additionally, strong winds (>6 m s-1) blew simultaneously, which is believed to have caused low biomass and C and N uptake rates. Although easterly winds occurred on January 6, their speed was low compared to that during January 10–12. In detail, Figure 3C shows the evolution of zonal wind stress during sampling period. As a result of the analysis of cumulative wind stress from Day 1 to Day 5, the wind forcing was higher when 2 days were considered. Overall, negative ∑τx values with low wind speeds led to high chl-a, C, and N uptakes from January 2 to 9. This is because factors, such as outflowing water from the Marian Cove to the Maxwell Bay, also play a role in transporting particulate matter, including algae, near the ice wall and resuspending it (Brandini and Rebello, 1994; Yoo et al., 1999). This surface circulation influenced by the easterly wind can deliver surface water and suspended particles to the Maxwell Bay because the Coriolis effect is not important for a small bay width (~1.5 km for the Marian Cove) (Yoo et al., 2015). Resuspension of sediments and benthic diatoms in the inner Admiralty Bay induced by wind-driven upwelling (<20 m water depth) increases surface turbidity and nutrient concentrations (Brandini and Rebello, 1994); however, the effect of resuspension was not significant in the present study. As the SiO2 concentration was lower than that at peak bloom, benthic diatom species (Cocconeis spp.) accounted for 8.5% of total diatom abundance (Supplementary Figure 1). On January 12, the dominant species were small (<20 µm) Navicula spp. and Fragilariopsis spp., accounting for 72.2% to the total diatom abundance that lives mainly on the ice walls and in low-salinity coastal waters (Kang et al., 1999; Fernandes and Procopiak, 2003; Jeon et al., 2021). More specifically, a change in the structure of the phytoplankton community was observed during the sampling period in microscope-based phytoplankton observation (Supplementary Figure 1). Phytoplankton communities were dominated by bacillariophytes (diatoms), which comprised >60% (up to 96.3%) of the total C biomass over the sampling period. Thalassiosira spp., accounting for 67.7% of total diatom abundance at peak bloom, decreased to 1/4 of its peak bloom value on January 12 (Supplementary Figure 1).Water column stratification and relatively weak wind speed are favorable for initiating seasonal blooms, and the presence of sea ice and glacial meltwaters influences primary production patterns (Saba et al., 2014; Rozema et al., 2017; Höfer et al., 2019; Kim et al., 2021). In this regard, the relatively weak wind speeds observed at the beginning of January seem to enable water column stabilization, favoring an increase in the residence times of cells in the photic layer and providing more light for photosynthesis, allowing high phytoplankton accumulation in the cove.
In this study, we examined the C and N uptake regimes in the Marian Cove during the austral summers of 2018–19 using 13C and 15N dual isotope tracer assays. During phytoplankton blooms, the study area was generally characterized by high f-ratios (>0.5), suggesting that NO3- plays a dominant role in phytoplankton nutrition. Low f-ratios were observed at the end of the sampling period, and microphytoplankton and planktonic diatoms were replaced by nanophytoplankton and sympagic (sea-ice-associated) diatoms, causing decreased primary production and C export. Our results highlight the influence of wind on the changes in C and N uptake regimes and physical–biological coupling in the Marian Cove. Increased regenerated production was not observed as the total phytoplankton biomass increased.
However, we assumed that the bacterial uptake rate was negligible in the present study. It is possible that the N uptake rate of heterotrophic bacteria may contribute to the N uptake rate in the study area. Phytoplankton and bacterial N uptake have been studied in various ecosystems (Bronk et al., 2007). Few records are available for the direct measurements of inorganic N uptake by bacteria in the Southern Ocean. The bacterial NH4+ demand in the coastal waters of the northern Gerlache Strait region of the Antarctic Peninsula during summer is 8~25% (mean 17%) of the total community NH4+ uptake rate (Tupas et al., 1994). Cochlan and Bronk (2001) reported similar mean value of 17% for the potential NH4+ uptake by heterotrophic bacteria in the Ross Sea during summer. The lower f-ratio could reflect more available NH4+ compared to NO3-. However, accurately determining the contributions to bacterial N uptake using the GF/F filter method, as in this study, to distinguish them by size is still challenging. Therefore, further research is needed to clarify the contribution of bacteria to the primary production of the Marian Cove and the trophic linkages between phytoplankton assemblages and associated consumers. More observations with a longer timescale are required to better understand the C and N dynamics in the Sothern Ocean, particularly in coastal waters where rapid changes in glacial retreat and vigorous meteorological conditions take place owing to the effects of climate change.
The original contributions presented in the study are included in the article/Supplementary Material. Further inquiries can be directed to the corresponding author.
S-YH conceived of the study, participated in its design and helped to draft the manuscript. BK drafted the manuscript and performed the field and laboratory experiments. MJ carried out the analysis of the chl-a and phytoplankton community. S-JP provided meteorological data. H-CK processed and analyzed satellite imagery for glacier change detection. J-OM contributed to writing the manuscript. JP was the leader of the Korean Antarctic Research Program and provided scientific advice. All authors contributed to the article and approved the submitted version.
This study was supported by the Korea Polar Research Institute (KOPRI) and undertaken as part of “Carbon cycle change and ecosystem response under the Southern Ocean warming (PE22110)”.
The authors declare that the research was conducted in the absence of any commercial or financial relationships that could be construed as a potential conflict of interest.
All claims expressed in this article are solely those of the authors and do not necessarily represent those of their affiliated organizations, or those of the publisher, the editors and the reviewers. Any product that may be evaluated in this article, or claim that may be made by its manufacturer, is not guaranteed or endorsed by the publisher.
We take the opportunity to thank the colleagues and 32nd King Sejong Station Overwintering Team assistance during work.
The Supplementary Material for this article can be found online at: https://www.frontiersin.org/articles/10.3389/fmars.2022.887909/full#supplementary-material
Supplementary Figure 1 | Temporal variations of the (A) relative C biomass (%) of each phytoplankton group and (B) the relative cell abundance of major dominant phytoplankton species in diatoms (%) among six sampling dates (December 22 and January 6, 9,12, 23, and 26).
Ahn I.-Y., Chung H., Kang J.-S., Kang S.-H. (1997). Diatom Composition and Biomass Variability in Nearshore Waters of Maxwell Bay, Antarctica, During the 1992/1993 Austral Summer. Polar. Biol. 17, 123–130. doi: 10.1007/s003000050114
Ahn I.-Y., Moon H.-W., Jeon M., Kang S.-H. (2016). First Record of Massive Blooming of Benthic Diatoms and Their Association With Megabenthic Filter Feeders on the Shallow Seafloor of an Antarctic Fjord: Does Glacier Melting Fuel the Bloom? Ocean. Sci. J. 51, 273–279. doi: 10.1007/s12601-016-0023-y
Annett A. L., Skiba M., Henley S. F., Venables H. J., Meredith M. P., Statham P. J., et al. (2015). Comparative Roles of Upwelling and Glacial Iron Sources in Ryder Bay, Coastal Western Antarctic Peninsula. Mar. Chem. 176, 21–33. doi: 10.1016/j.marchem.2015.06.017
Arrigo K. R., van Dijken G. L., Alderkamp A.-C., Erickson Z. K., Lewis K. M., Lowry K. E., et al. (2017). Early Spring Phytoplankton Dynamics in the Western Antarctic Peninsula. J. Geophys. Res. Oceans. 122, 9350–9369. doi: 10.1002/2017JC013281
Arrigo K. R., van Dijken G. L., Bushinsky S. (2008). Primary Production in the Southern Ocean 1997-2006. J. Geophys. Res. Oceans. 113, C8. doi: 10.1029/2007JC004551
Atkinson A., Siegel V., Pakhomov E., Rothery P. (2004). Long-Term Decline in Krill Stock and Increase in Salps Within the Southern Ocean. Nature 432, 100–103. doi: 10.1038/nature02996
Bae H., Ahn I.-Y., Park J., Song S. J., Noh J., Kim H., et al. (2021). Shift in Polar Benthic Community Structure in a Fast Retreating Glacial Area of Marian Cove, West Antarctica. Sci. Rep. 11, 241. doi: 10.1038/s41598-020-80636-z
Biggs T. E. G., Alvarez-Fernandez S., Evans C., Mojica K. D. A., Rozema P. D., Venables H. J., et al. (2019). Antarctic Phytoplankton Community Composition and Size Structure: Importance of Ice Type and Temperature as Regulatory Factors. Polar. Biol. 42, 1997–2015. doi: 10.1007/s00300-019-02576-3
Bode A., Castro C. G., Doval M. D., Varela M. (2002). New and Regenerated Production and Ammonium Regeneration in the Western Bransfield Strait Region (Antarctica) During Phytoplankton Bloom Conditions in Summer. . Deep. Sea. Res. Part II 49, 787–804. doi: 10.1016/S0967-0645(01)00124-2
Bown J., Laan P., Ossebaar S., Bakker K., Rozema P., de Baar H. J. W. (2017). Bioactive Trace Metal Time Series During Austral Summer in Ryder Bay, Western Antarctic Peninsula. Deep. Sea. Res. Part II 139, 103–119. doi: 10.1016/j.dsr2.2016.07.004
Brandini F., Rebello J. (1994). Wind Field Effect on Hydrography and Chlorophyll Dynamics in the Coastal Pelagial of Admiralty Bay, King George Island, Antarctica. Antarct. Sci. 6 (4), 433–442. doi: 10.1017/S0954102094000672
Bronk D. A., See J. H., Bradley P., Killberg L. (2007). DON as a Source of Bioavailable Nitrogen for Phytoplankton. Biogeosciences 4, 283–296. doi: 10.5194/bg-4-283-2007
Clarke A., Meredith M. P., Wallace M. I., Brandon M. A., Thomas D. N. (2008). Seasonal and Interannual Variability in Temperature, Chlorophyll and Macronutrients in Northern Marguerite Bay, Antarctica. Deep. Sea. Res. Part II 55 (18-19), 1988–2006. doi: 10.1016/j.dsr2.2008.04.035
Cochlan W. P., Bronk D. A. (2001). Nitrogen Uptake Kinetics in the Ross Sea, Antarctica. Deep. Sea. Res. Part II 48, 4127–4153. doi: 10.1016/S0967-0645(01)00083-2
Cook A. J., Fox A. J., Vaughan D. G., Ferrigno J. G. (2005). Retreating Glacier Fronts on the Antarctic Peninsula Over the Past Half-Century. Science 308, 541–544. doi: 10.1126/science.1104235
Cook A. J., Holland P. R., Meredith M. P., Murray T., Luckman A., Vaughan D. G. (2016). Ocean Forcing of Glacier Retreat in the Western Antarctic Peninsula. Science 353, 283–286. doi: 10.1126/science.aae0017
Corner E. D. S., Davies A. G. (1971). Plankton as a Factor in the Nitrogen and Phosphorus Cycle in the Sea. Adv. Biol. 9, 101–204. doi: 10.1016/S0065-2881(08)60342-9
Deppeler S. L., Davidson A. T. (2017). Southern Ocean Phytoplankton in a Changing Climate. Front. Mar. Sci. 4. doi: 10.3389/fmars.2017.00040
Dortch Q. (1990). The Interaction Between Ammonium and Nitrate Uptake in Phytoplankton. Mar. Ecol. Prog. Ser. 61, 183–201. doi: 10.3354/meps061183
Ducklow H. W., Clarke A., Dickhut R., Doney S. C., Geisz H., Kuan H., et al. (2012a). The Marine System of the Western Antarctic Peninsula. Antarct. Ecosyst. Extrem. Environ. Change World, 121–159. doi: 10.1002/9781444347241.ch5
Ducklow H. W., Schofield O., Vernet M., Stammerjohn S., Erickson M. (2012b). Multiscale Control of Bacterial Production by Phytoplankton Dynamics and Sea Ice Along the Western Antarctic Peninsula: A Regional and Decadal Investigation. J. Mar. Syst. 98-99, 26–39. doi: 10.1016/j.jmarsys.2012.03.003
Dugdale R. C., Goering J. J. (1967). Uptake of New and Regenerated Forms of Nitrogen in Primary Productivity. Limnol. Oceanogr. 12, 196–206. doi: 10.4319/lo.1967.12.2.0196
Dugdale R. C., Wilkerson F. P., Parker A. E., Marchia A., Taberski K. (2012). River Flow and Ammonium Discharge Determine Spring Phytoplankton Blooms in an Urbanized Estuary. Estuar. Coast. Shelf. Sci. 115, 187–199. doi: 10.1016/j.ecss.2012.08.025
Eppley R. W., Peterson B. J. (1979). Particulate Organic Matter Flux and Planktonic New Production in the Deep Ocean. Nature 28, 677–680. doi: 10.1038/282677a0
Fernandes L. F., Procopiak L. K. (2003). Observations on Valve Structures of Navicula Directa (Wm. Smith) Ralfs in Pritchard and Navicula Glaciei V. Heurck From Rocky Substrates in Antarctic Peninsula. Hoehnea 30 (1), 1–10.
Fiala M., Kopczynsk E. E., Jeandel C., Oriola L., Vetion G. (1998). Seasonal and Interannual Variability of Size-Fractionated Phytoplankton Biomass and Community Structure at Station Kerfix, Off the Kerguelen Islands, Antarctica. J. Plankton. Res. 20, 1341–1356. doi: 10.1093/plankt/20.7.1341
Frölicher T. L., Sarmiento J. L., Paynter D. J., Dunne J. P., Krasting J. P., Winton M. (2015). Dominance of the Southern Ocean in Anthropogenic Carbon and Heat Uptake in CMIP5 Models. J. Climate 28 (2), 862–886. doi: 10.1175/JCLI-D-14-00117.1
Garibotti I. A., Vernet M., Ferrario M. E., Smith R. C., Ross R. M., Quetin L. B. (2003). Phytoplankton Spatial Distribution Patterns Along the Western Antarctic Peninsula (Southern Ocean). Mar. Ecol. Prog. Ser. 261, 21–39. doi: 10.3354/meps261021
Glibert P. M., Wilkerson F. P., Dugdale R. C., Raven J. A., Dupont C. L., Leavitt P. R., et al. (2016). Pluses and Minuses of Ammonium and Nitrate Uptake and Assimilation by Phytoplankton and Implications for Productivity and Community Composition, With Emphasis on Nitrogen-Enriched Conditions. Limnol. Oceanogr. 61 (1), 165–197. doi: 10.1002/lno.10203
Goldman J. A. A., Kranz S. A., Young J. N., Tortell P. D., Stanley R. H. R., Bender M. L., et al. (2014). Gross and Net Production During the Spring Bloom Along the Western Antarctic Peninsula. New Phytol. 205 (1), 182–191. doi: 10.1111/nph.13125
Gutt J., Isla E., Xavier J. C., Adams B. J., Ahn I.-Y., Cheng C.-H. C., et al. (2021). Antarctic Ecosystems in Transition – Life Between Stresses and Opportunities. Biol. Rev. 96, 798–821. doi: 10.1111/brv.12679
Ha S.-Y., Ahn I.-Y., Moon H.-W., Choi B., Shin K.-H. (2019). Tight Trophic Association Between Benthic Diatom Blooms and Shallow-Water Megabenthic Communities in a Rapidly Deglaciated Antarctic Fjord. Estuar. Coast. Shelf. Sci. 218, 258–267. doi: 10.1016/j.ecss.2018.12.020
Hama T., Miyazaki T., Ogawa Y., Iwakuma T., Takahashi M. (1983). Measurement of Photosynthetic Production of a Marine Phytoplankton Population Using a Stable 13C Isotope. Mar. Biol. 73, 31–36. doi: 10.1007/BF00396282
Höfer J., Giesecke R., Hopwood M. J., Carrera V., Alarcón E., González H. E. (2019). The Role of Water Column Stability and Wind Mixing in the Production/Export Dynamics of Two Bays in the Western Antarctic Peninsula. Prog. Oceanogr. 174, 105–116. doi: 10.1016/j.pocean.2019.01.005
Jeon M., Iriarte J. L., Yang E. J., Kang S.-H., Lee Y., Joo H. M., et al. (2021). Phytoplankton Succession During a Massive Coastal Diatom Bloom at Marian Cove, King George Island, Antarctica. Polar. Biol. 44, 1993–2010. doi: 10.1007/s00300-021-02933-1
K1öser H., Ferreyra G., Schloss I., Mercuri G., Laturnus F., Curtosi A. (1994). Hydrography of Potter Cove, a Small Fjord-Like Inlet on King George Island (South Shetlands). Estuar. Coast. Shelf. Sci. 38, 523–537. doi: 10.1006/ecss.1994.1036
Kanda J., Ziemann D. A., Conquest L. D., Bienfang P. K. (1990). Nitrate and Ammonium Uptake by Phytoplankton Populations During the Spring Bloom in Auke Bay, Alaska. Estuar. Coast. Shelf. Sci. 30, 509–524. doi: 10.1016/0272-7714(90)90070-8
Kang S.-H., Kang J.-S., Chung K.-H., Lee M.-Y., Lee B.-Y., Chung H., et al. (1997). Seasonal Variation of Nearshore Antarctic Microalgae and Environmental Factors in Marian Cove, King George Island, 1996. J. Polar. Res. 8, 9–27.
Kang J.-S., Kang S.-H., Lee J. H. (1999). Cryophilic Diatoms Navicula Glaciei and N. Perminuta in Antarctic Coastal Environment. I. Morphology and Ecology. Algae 14 (3), 169–179.
Kang J.-S., Kang S.-H., Lee J. H., Lee S. (2002). Seasonal Variation of Microalgal Assemblages at a Fixed Station in King George Island, Antarctic. Mar. Ecol. Prog. Ser. 229, 19–32. doi: 10.3354/meps229019
Kim B. K., Jeon M., Joo H. M., Kim T.-W., Park S.-J., Park J., et al. (2021). Impact of Freshwater Discharge on the Carbon Uptake Rate of Phytoplankton During Summer (January–February 2019) in Marian Cove, King George Island, Antarctica. Front. Mar. Sci. 8. doi: 10.3389/fmars.2021.725173
Kim I., Kim G., Choy E. J. (2015). The Significant Inputs of Trace Elements and Rare Earth Elements From Melting Glaciers in Antarctic Coastal Waters. Polar. Res. 34, 24289. doi: 10.3402/polar.v34.24289
Kim S., Kim J.-H., Lim J.-H., Jeong J.-H., Heo J.-M., Kim I.-N. (2020). Distribution and Control of Bacterial Community Composition in Marian Cove Surface Waters, King George Island, Antarctica During the Summer of 2018. Microorganisms 8,1115. doi: 10.3390/microorganisms8081115
Kohut J. T., Winsor P., Statscewich H., Oliver M. J., Fredj E., Couto N. (2018). Variability in Summer Surface Residence Time Within a West Antarctic Peninsula Biological Hotspot. Phil. Trans. R. Soc A376, 20170165. doi: 10.1098/rsta.2017.0165
Koike I., Holm-Hansen O., Biggs D. C. (1986). Inorganic Nitrogen Metabolism by Antarctic Phytoplankton With Special Reference to Ammonium Cycling. Mar. Ecol. Prog. Ser. 30, 105–116. doi: 10.3354/meps030105
Kristiansen S., Farbrot T., Wheeler P. A. (1994). Nitrogen Cycling in the Barents Sea—seasonal Dynamics of New and Regenerated Production in the Marginal Ice Zone. Limnol. Oceanogr. 39, 1630–1642. doi: 10.4319/lo.1994.39.7.1630
L’Helguen S., Maguer J.-F., Caradec J. (2008). Inhibition Kinetics of Nitrate Uptake by Ammonium in Size-Fractionated Oceanic Phytoplankton Communities: Implications for New Production and F-Ratio Estimates. J. Plankton. Res. 10, 1179–1188. doi: 10.1093/plankt/fbn072
Lee J., Jin Y. K., Hong J. K., Yoo H. J., Shon H. (2008). Simulation of a Tidewater Glacier Evolution in Marian Cove, King George Island, Antarctica. Geosci. J. 12, 33–39. doi: 10.1007/s12303-008-0005-x
Lee S. H., Joo H. M., Joo H., Kim B. K., Song H. J., Jeon M., et al. (2015). Large Contribution of Small Phytoplankton at Marian Cove, King George Island, Antarctica, Based on Long-Term Monitoring From 1996 to 2008. Polar. Biol. 38, 207–220. doi: 10.1007/s00300-014-1579-6
Llanillo P. J., Aiken C. M., Cordero R. R., Damiani A., Sepúlveda E., Fernández-Gómez B. (2019). Oceanographic Variability Induced by Tides, the Intraseasonal Cycle and Warm Subsurface Water Intrusions in Maxwell Bay, King George Island (West-Antarctica). Sci. Rep. 9, 18571. doi: 10.1038/s41598-019-54875-8
Marañón E., Cermeño P., Latasa M., Tadonléké R. D. (2012). Temperature, Resources, and Phytoplankton Size Structure in the Ocean. Limnol. Oceanogr. 57 (5), 1266–1278. doi: 10.4319/lo.2012.57.5.1266
Martinson D. G., Stammerjohn S. E., Iannuzzi R. A., Smith R. C., Vernet M. (2008). Western Antarctic Peninsula Physical Oceanography and Spatio-Temporal Variability. Deep. Sea. Res. Part II 55, 1964–1987. doi: 10.1016/j.dsr2.2008.04.038
Mendes C. R. B., de Souza M. S., Garcia V. M. T., Leal M. C., Brotas V., Garcia C. A. E. (2012). Dynamics of Phytoplankton Communities During Late Summer Around the Tip of the Antarctic Peninsula. Deep. Sea. Res. Part I 65, 1–14. doi: 10.1016/j.dsr.2012.03.002
Moline M. A., Claustre H., Frazer T. K., Schofield O., Vernet M. (2004). Alteration of the Food Web Along the Antarctic Peninsula in Response to a Regional Warming Trend. Glob. Change Biol. 10, 1973–1980. doi: 10.1111/j.1365-2486.2004.00825.x
Montes-Hugo M., Doney S. C., Ducklow H. W., Fraser W., Martinson D., Stammerjohn S. E., et al. (2009). Recent Changes in Phytoplankton Communities Associated With Rapid Regional Climate Change Along the Western Antarctic Peninsula. Science 323, 1470–1473. doi: 10.1126/science.1164533
Montes-Hugo M. A., Vernet M., Smith R., Carder K. (2008). Phytoplankton Size-Structure on the Western Shelf of the Antarctic Peninsula: A Remote-Sensing Approach. Int. J. Remote Sens. 29 (3), 801–829. doi: 10.1080/01431160701297615
Moon H.-W., Wan Hussin W. M. R., Kim H.-C., Ahn I.-Y. (2015). The Impacts of Climate Change on Antarctic Nearshore Mega-Epifaunal Benthic Assemblages in a Glacial Fjord on King George Island: Responses and Implications. Ecol. Indic. 57, 280–292. doi: 10.1016/j.ecolind.2015.04.031
Mosseri J., Quéguiner B., Armand L. K., Cornet V. (2008). Impact of Iron on Silicon Utilization by Diatoms in the Southern Ocean: A Case Study of Si/N Cycle Decoupling in a Naturally Iron-Enriched Area. Deep. Sea. Res. Part II 55, 801–819. doi: 10.1016/j.dsr2.2007.12.003
Mulholland M., Lomas M. (2008). “Nitrogen Uptake and Assimilation, in:Nitrogen in the Marine Environment, 2nd Edition,”. Eds. Capone D. G., Bronk D. A., Mulholland M., Carpenter E. J. (San Diego: Elsevier), 303–385.
Nędzarek A. (2008). Sources, Diversity and Circulation of Biogenic Compounds in Admiralty Bay, King George Island, Antarctica. Antarct. Sci. 20 (2), 135–145. doi: 10.1017/S0954102007000909
Nowosielski L. (1980). Meteorological Conditions at Arctowski Station in 1978 (King George Island, South Shetland Islands). Pol. Polar. Res. 1 (1), 83–93.
Park B. K., Chang S. K., Yoon H. I., Chung H. (1998). Recent Retreat of Ice Cliffs, King George Island, South Shetland Islands, Antarctic Peninsula. Ann. Glaciol. 27, 633–635. doi: 10.3189/1998AoG27-1-633-635
Park S.-J., Choi T.-J., Kim S.-J. (2013). Heat Flux Variations Over Sea Ice Observed at the Coastal Area of the Sejong Station, Antarctica. Asia-Pacific. J. Atmos. Sci. 49, 443–450. doi: 10.1007/s13143-013-0040-z
Parsons T. R., Maita Y., Lalli C. M. (1984). A Manual of Chemical and Biological Methods for Seawater Analysis (Oxford: Pergamon Press), 173.
Petrou K., Baker K., Nielsen D., Hancock A., Schulz K., Davidson A. (2019). ‘Acidification Diminishes Diatom Silica Production in the Southern Ocean’. Nat. Clim. Change 9, 781–786. doi: 10.1038/s41558-019-0557-y
Petrou K., Kranz S. A., Trimborn S., Hassler C. S., Ameijeiras S. B., Sackett O., et al. (2016). Southern Ocean Phytoplankton Physiology in a Changing Climate. J. Plant Physiol. 20 (203), 135–150. doi: 10.1016/j.jplph.2016.05.004
Plum C., Hillebrand H., Moorthi S. (2020). Krill vs Salps: Dominance Shift From Krill to Salps is Associated With Higher Dissolved N:P Ratios. Nature 10,5911. doi: 10.1038/s41598-020-62829-8
Prézelin B. B., Hofmann E. E., Mengelt C., Klinck J. M. (2000). The Linkage Between Upper Circumpolar Deep Water (UCDW) and Phytoplankton Assemblages on the West Antarctic Peninsula Continental Shelf. J. Mar. Res. 58, 165–202. doi: 10.1357/002224000321511133
Pruszak Z. (1980). Current Circulation in the Water of Adrniralty Bay (Region of Arctowski Station on King George Island). Pol. Polar. Res. 1, 55–74.
Rozema P. D., Venables H. J., van de Poll W. H., Clarke A., Meredith M. P., Buma A. G. J. (2017). Interannual Variability in Phytoplankton Biomass and Species Composition in Northern Marguerite Bay (West Antarctic Peninsula) is Governed by Both Winter Sea Ice Cover and Summer Stratification. Limnol. Oceanogr. 62, 235–252. doi: 10.1002/lno.10391
Rückamp M., Braun M., Suckro S., Blindow N. (2011). Observed Glacial Changes on the King George Island Ice Cap, Antarctica, in the Last Decade. Glob. Planet. Change 79, 99–109. doi: 10.1016/j.gloplacha.2011.06.009
Saba G. K., Fraser W. R., Saba V. S., Iannuzzi R. A., Coleman K. E., Doney S. C., et al. (2014). Winter and Spring Controls on the Summer Food Web of the Coastal West Antarctic Peninsula. Nat. Commun. 5,4318. doi: 10.1038/ncomms5318
Schloss I. R., Ferreyra G. A., Ruiz-Pino D. (2002). Phytoplankton Biomass in Antarctic Shelf Zones: A Conceptual Model Based on Potter Cove, King George Island. J. Mar. Syst. 36, 129–143. doi: 10.1016/S0924-7963(02)00183-5
Schloss I. R., Wasilowska A., Dumont D., Almandoz G. O., Hernando M. P., Michaud-Tremblay C.-A., et al. (2014). On the Phytoplankton Bloom in Coastal Waters of Southern King George Island (Antarctica) in January 2010: An Exceptional Feature? Limnol. Oceanogr. 59, 195–210. doi: 10.4319/lo.2014.59.1.0195
Schofield O., Saba G., Coleman K., Carvalho F., Couto N., Ducklow H., et al. (2017). Decadal Variability in Coastal Phytoplankton Community Composition in a Changing West Antarctic Peninsula. Deep. Sea. Res. Part I 124, 42–54. doi: 10.1016/j.dsr.2017.04.014
Stammerjohn S. E., Martinson D. G., Smith R. C., Yuan X., Rind D. (2008). Trends in Antarctic Annual Sea Ice Retreat and Advance and Their Relation to El Niño–Southern Oscillation and Southern Annular Mode Variability. J. Geophys. Res. Oceans. 113, C3. doi: 10.1029/2007JC004269J
Tupas L. M., Koike I., Karl D. M., Holm-Hansen O. (1994). Nitrogen Metabolism by Heterotrophic Bacterial Assemblages in Antarctic Coastal Waters. Polar. Biol. 14, 195–204. doi: 10.1007/BF00240524
Varela M., Fernandez E., Serret P. (2002). Size-Fractionated Phytoplankton Biomass and Primary Production in the Gerlache and South Bransfield Straits (Antarctic Peninsula) in Austral Summer 1995–1996. Deep. Sea. Res. Part II 49, 749–768. doi: 10.1016/S0967-0645(01)00122-9
Varela D. E., Harrison P. J. (1999). Effect of Ammonium on Nitrate Utilization by Emiliana Huxleyi, a Coccolithophore From the Oceanic Northeastern Pacific. Mar. Ecol. Prog. Ser. 186, 67–74. doi: 10.3354/meps186067
Verlencar X. N., Somasunder K., Qasi S. Z. (1990). Regeneration of Nutrients and Biological Productivity in Antarctic Waters. Mar. Ecol. Prog. Ser. 61, 41–59. doi: 10.3354/meps061041
Vernet M., Kozlowski W. A., Yarmey L. R., Lowe A. T., Ross R. M., Quetin L. B., et al. (2012). Primary Production Throughout Austral Fall, During a Time of Decreasing Daylength in the Western Antarctic Peninsula. Mar. Ecol. Prog. Ser. 452, 45–61. doi: 10.3354/meps09704
Vernet M., Martinson D., Iannuzzi R., Stammerjohn S., Kozlowski W., Sines K., et al. (2008). Primary Production Within the Sea-Ice Zone West of the Antarctic Peninsula: I—Sea Ice, Summer Mixed Layer, and Irradiance. Deep. Sea. Res. Part II 55, 2068–2085. doi: 10.1016/j.dsr2.2008.05.021
Yang J. S. (1990). Nutrients, Chlorophyll-A and Primary Productivity in Maxwell Bay, King George Island, Antarctica. J. Polar. Res. 1, 11–18.
Yoo K.-C., Lee M. K., Yoon H. I., Lee Y. I., Kang C. Y. (2015). Hydrography of Marian Cove, King George Island, West Antarctica: Implications for Ice-Proximal Sedimentation During Summer. Antarct. Sci. 27, 185–196. doi: 10.1017/S095410201400056X
Yoo K.-C., Yoon H. I., Oh J.-K., Kang C. Y., Kim Y., Bae S.-H. (2003). Wind- and Rain-Induced Variations of Water Column Structures and Dispersal Pattern of Suspended Particulate Matter (SPM) in Marian Cove, the South Shetland Islands, West Antarctica During the Austral Summer. Sea. 8, 357–368.
Yoo K.-C., Yoon H. I., Oh J.-K., Kim Y., Kang C. Y. (1999). Water Column Properties and Dispersal Pattern of Suspended Particulate Matter (SPM) of Marian Cove During Austral Summer, King George Island, West Antarctica. Sea. 4, 266–274. [Korean]
Keywords: phytoplankton, carbon, nitrogen, stable isotope, Marian Cove, Antarctica
Citation: Kim BK, Jeon M, Park S-J, Kim H-C, Min J-O, Park J and Ha S-Y (2022) Variability in the Carbon and Nitrogen Uptake Rates of Phytoplankton Associated With Wind Speed and Direction in the Marian Cove, Antarctica. Front. Mar. Sci. 9:887909. doi: 10.3389/fmars.2022.887909
Received: 02 March 2022; Accepted: 16 June 2022;
Published: 25 July 2022.
Edited by:
Mi Sun Yun, Tianjin University of Science and Technology, ChinaCopyright © 2022 Kim, Jeon, Park, Kim, Min, Park and Ha. This is an open-access article distributed under the terms of the Creative Commons Attribution License (CC BY). The use, distribution or reproduction in other forums is permitted, provided the original author(s) and the copyright owner(s) are credited and that the original publication in this journal is cited, in accordance with accepted academic practice. No use, distribution or reproduction is permitted which does not comply with these terms.
*Correspondence: Sun-Yong Ha, c3loYUBrb3ByaS5yZS5rcg==
Disclaimer: All claims expressed in this article are solely those of the authors and do not necessarily represent those of their affiliated organizations, or those of the publisher, the editors and the reviewers. Any product that may be evaluated in this article or claim that may be made by its manufacturer is not guaranteed or endorsed by the publisher.
Research integrity at Frontiers
Learn more about the work of our research integrity team to safeguard the quality of each article we publish.