
94% of researchers rate our articles as excellent or good
Learn more about the work of our research integrity team to safeguard the quality of each article we publish.
Find out more
ORIGINAL RESEARCH article
Front. Mar. Sci., 22 July 2022
Sec. Marine Pollution
Volume 9 - 2022 | https://doi.org/10.3389/fmars.2022.886775
This article is part of the Research TopicCleaning Litter by Developing and Applying Innovative Methods in European SeasView all 19 articles
This study considers the transport of microplastics (MPs) from inland waters (rivers and lakes) to coastal waters and then to the open sea. A three-dimensional MP Eulerian tracer model based on the HIROMB-BOOS model (HBM) with wave-induced transport and biofouling process is used. Multilayer two-way nested model grids with 3–0.5–0.25–0.05 nautical mile resolutions are applied to resolve relevant riverine–estuarial–coastal hydrodynamics with a focus on the southern waters in the Gulf of Riga. The major river of the Gulf of Riga, Daugava, is governed by the Riga Hydro Power Station (RHPS) with high daily and weekly variability of the runoff creating more intense outflows during its working hours. This gives additional complexity when calibrating this model. The model results are validated against MP observations that are collected on various cruises in the summer of 2018 in the Gulf of Riga. There exists a strong synoptic variability in the observations, which are also reproduced. As the rivers are the primary source of MPs, a special backtracking algorithm was developed to find the most possible source of pollutants at a given location and time. The backtracking algorithm includes optimization with respect to salinity in order to prefer trajectories coming from freshwater and, consequently, MP sources. Lagrangian drift studies are performed for events with high precipitation in the estuary domain when sewer overflow at wastewater treatment plants (WWTPs) can occur, and the results are compared with different MP components in observations.
Research on microplastic (MP) pollution is accelerating in oceanographic science because of its uncertain and potentially devastating influence on ocean health in the long term. Most of the MPs enter the seas and oceans from the land and typically exceed the MPs created either by the shipping industry or disintegration of macroplastics in the sea (Boucher and Friot, 2017; Coyle et al., 2020). On the other hand, coastal zones are among the most vulnerable environments with a large variety of marine species. Therefore, the transport and fate of MPs in the land-to-ocean aquatic continuum (LOAC) has to be investigated more in detail, either by monitoring, modeling, or integrated monitoring–modeling approaches. Although MP monitoring-related research has been extensively carried out in the last decade (e.g., Setälä et al., 2016; Karlsson et al., 2020; Aigars et al., 2021), MP observations are still far from sufficient to resolve MP transport processes in the LOAC system, especially in the river mouth, estuary, and inland waters. The observation research also faces significant challenges on the uncertainty and consistency between different datasets due to varying monitoring methods and standards (She et al., 2022). Since MP particles are so small that they can be treated as suspended particle matter (SPM) in hydrodynamic models, modeling has become an important tool to understand the pathway and fate of the MPs in the sea. Modeling of SPM has been developed by implementing an SPM module in a three-dimensional (3D) hydrodynamic model, including the driving force from weather and wave models (Pleskachevsky et al., 2005; Gayer et al., 2006). A similar method has been used to simulate MP transportation in the Baltic Sea. A 3D MP model (Osinski et al., 2020; Schernewski et al., 2021) in the Baltic Sea was made based on the GETM ocean circulation model, with the inclusion of resuspension of MP floating and non-floating fractions. However, biofouling of MP particles is not included in these studies, which leads to an increasing fraction of floating MPs, especially in the surface layer. Biofouling is regarded as a major sink term for floating MP particles in the sea; thus, it needs to be resolved in the MP models. Some other recent modeling studies in the Mediterranean (e.g., Tsiaras et al., 2021) and Baltic Seas (Murawski et al., 2022) have included parameterization of biofouling of MP particles. The results show that the models are capable of simulating general spatial patterns of MPs in the seas.
However, existing 3D MP modeling focuses mainly on MP transportation from coastal areas to open seas. There are still two major challenges when using the current MP models on MP transport and transformation from inland to coastal waters. The first is that, in the current practice, the river to sea MP flux is calculated as a product of prescribed MP concentration, riverine discharge, and ocean model currents at the river source grid, which makes the detailed modeling of riverine MP retention and riverine–estuarial MP exchange, and also related phenomenon such as river plumes, not possible. Inland waters (rivers, lakes) and related infrastructures, e.g., dams and hydropower plants, are major sinks of land-derived MPs in the catchments. Existing research has shown the importance of river retention rate in MP modeling (Schernewski et al., 2021). For slow-moving and non-tidal rivers, Besseling et al. (2006) found that the model with particle aggregation predicted a 100% retention rate for particles ≥50 μm. However, it should be noted that this study applied a flow speed of 0.2 m/s. The situation can be quite different for fast-moving rivers. Large river flow velocity may be caused by a large topography slope or a large amount of runoff flux as a result of either snow/ice melting or heavy rain. The increased flow velocity will generate a significant amount of resuspension and turbulence, which can both effectively move the MPs in the water body and also clean the “old” MP sedimentation. Schuchardt et al. (2013) measured MP concentrations in the Unterweser, a German river flowing into the North Sea. When considering realistic river flow rates, the observations suggest that most of the particles will remain mobile and will ultimately flow with the water into the North Sea. The flow can reach 1.4 and 1.2 m/s in the ebb stream and flood stream, respectively. In a recent study, Hurley et al. (2018) found that flooding can completely change MP transportation in the river: a catchment-wide winter flooding in 2015/2016 in northeastern England effectively flushed out approximately 70% of MPs in the riverbeds, which is equivalent to 0.85 ± 0.27 tons or 43 ± 14 billion particles. Several significant flood events will be able to effectively flush a major part of the particles stored in the riverbed. Hence, it is important to include MP transportation generated by the floods. However, detailed knowledge of MP retention in inland waters is still largely not available due to the lack of observations and advanced modeling.
The second challenge is that resolutions used in the previous 3D MP models are too coarse (1 km or coarser) to resolve complex estuary features, such as lagoons, outlets, and narrow passages that serve as connections between the rivers and coastal waters. In the Baltic Sea, these include some large river–estuary systems such as the Neman estuary (Neman River–Curonian Lagoon) and West Oder estuary (Oder River–Szczecin Lagoon) regions. Similar to inland waters, these estuary regions serve as important buffer and retention zones of MPs before they are transported to the coastal seas. The lack of model resolution in these regions can lead to inaccurate modeling on the estuarial–coastal MP exchange. It is quite often that a resolution up to tens of meters is required (Frishfelds et al., 2021). The recent development in seamless modeling has enabled a modeling capacity to resolve the LOAC system with flexible model grids (She and Murawski, 2018; Frishfelds et al., 2021; Murawski et al., 2022). For example, a 3D hydrodynamic model, the HIROMB-BOOS model (HBM), has been applied to riverine–estuarial–coastal–open sea modeling with multiple two-way nested domains (Frishfelds et al., 2021; Murawski et al., 2021).
The purpose of this study was to apply the seamless modeling tool HBM to simulate the MP transport and transformation from inland to coastal waters and to evaluate the influence of MP retention in inland waters on MP concentration in open waters. The feature of this MP modeling study is that the inland waters, including impacts of an upstream hydropower plant, will be explicitly resolved in a two-way nested MP model. The study will be performed with a focus on the transport of MPs from the Daugava and Lielupe rivers and nearby lakes into the Gulf of Riga and the Baltic Sea. Hydrographic observations in Latvian inland waters and MP observations in coastal and open waters of the Gulf of Riga will be used to validate the model performance.
The relatively isolated Gulf of Riga with estuaries of the two main rivers Daugava and Lielupe provides a characteristic testing case to consider MP dynamics from inland–coastal scales to open-sea scales. The retention time in the Gulf of Riga is 2–3 years (Håkanson and Bryhn, 2008), and the primary water exchange with the Baltic proper occurs through the Irbe Strait. The characteristic lifetime of floating MPs does not exceed a year. Therefore, the concentration of MPs in the southeastern part of the Gulf of Riga primarily depends on the contribution of MPs by the Daugava estuary. The direction of spreading of MPs from Daugava into the Gulf of Riga depends on surface currents at a particular time. There are contradicting views (Yurkovskis et al., 1993; Soosaar et al., 2014) on whether cyclonic or anticyclonic circulation dominates in the Gulf of Riga. As Suursaar et al. (2012) suggested, it largely depends on the cyclonic activity. Furthermore, significant seasonal variations exist (Lips et al., 2016). Double gyre circulation is also prominent in the Gulf of Riga (Soosaar et al., 2014).
Most of the released MPs sink to the bottom of the sea either due to initial MP-specific gravity heavier than the seawater or due to biofouling (Koo et al., 2017; Coyle et al., 2020) of lighter MP fractions. Some floating fractions of MPs get washed to the shore, but it is more likely for meso- or macroplastics (Hinata et al., 2017). It is supposed here that the concentration of chlorophyll α (CHL-a) has a main influence on the biofouling rate in the sea (Murawski et al., 2022). Strictly speaking, CHL-a should not be considered the main driver of biofouling, but it can still be regarded as a good indicator of the amount of biomaterial in the sea. Furthermore, CHL-a concentration is available through the ERGOM model for the Baltic Sea in the Copernicus Marine Environment Monitoring Service (CMEMS). CHL-a concentrations can vary considerably, but river estuaries are usually not included in the biochemical reanalysis or forecasts of the sea. In the estimates of Finnish rivers, Raike et al. (2003) suggest that the concentration of CHL-a is sufficient for the biofouling of MPs for most of the year. Moreover, CHL-a concentrations are usually higher at lower latitudes with a milder winter season. In this paper, it is assumed that CHL-a in the inland waters is always sufficient for generating MP biofouling.
The observed MP concentration is strongly dependent on the size and shape of the MP particles. Depending on their shape, they are usually classified as fibers, fragments, and films (Aigars et al., 2021). The relative fraction of fibers could be rather large (Coyle et al., 2020; Ramírez-Álvarez et al., 2020). However, the concentration of fibers can be rather uncertain because they can be leaked through a filter due to their small diameter (She et al., 2022). Open-sea observations are usually performed with the trawl method with a focus on MPs with a particle size larger than 300 μm. Thus, there are much fewer observation data about smaller-sized MP particles and also subsurface waters. MP observations are still relatively costly which prevents us to perform these observations on a regular basis. Most of the MP observations are performed from spring to autumn. Summer and autumn benefit from warmer waters, whereas MP observations in spring require less cleaning as there is less amount of floating biomaterial in the sea (Zalewska et al., 2021).
The Daugava estuary located between the Riga Hydro Power Station (RHPS) and the river outlet has a relatively low residence time ranging from a few hours to a few days depending on the upstream runoff at the RHPS. Such an interval is insufficient for the significant biofouling of larger MP particles. Therefore, the high-resolution estuary domain in the model includes also the river Jugla which enters the Daugava estuary through two lakes (Figure 1, right). The residence time in these lakes can range from weeks to months, resulting in significant biofouling there.
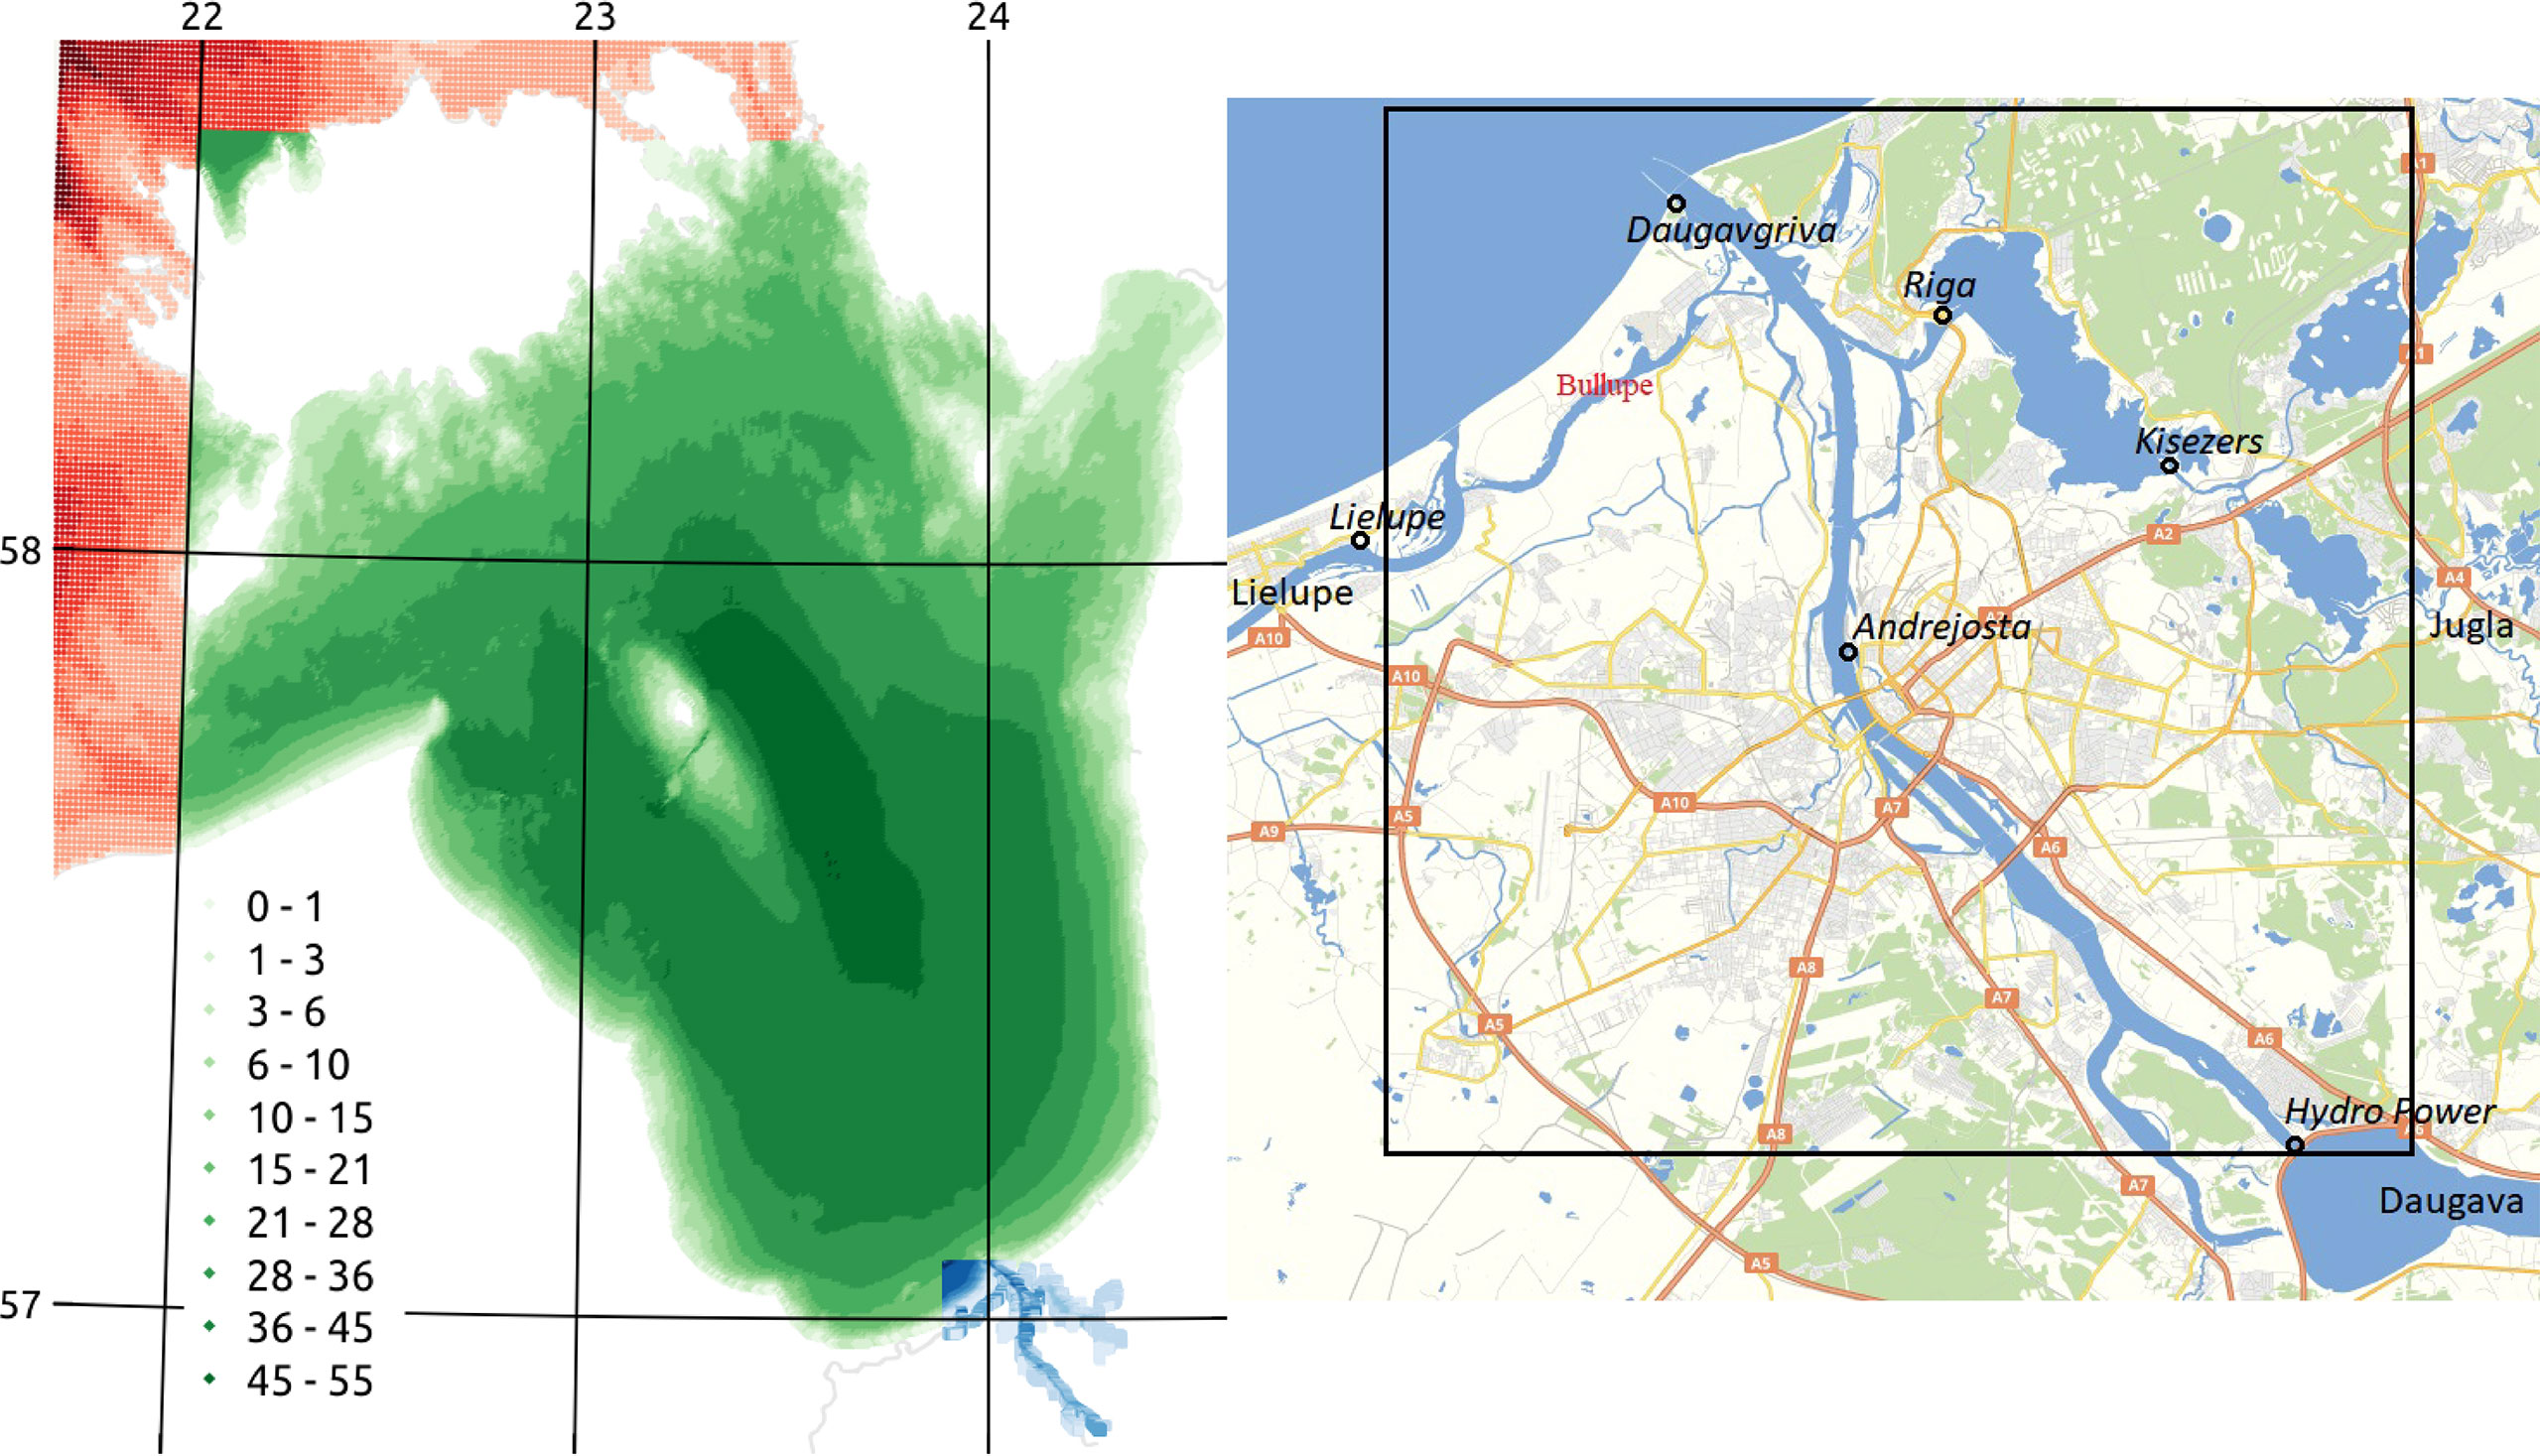
Figure 1 Left: Bathymetry and mesh in the high-resolution domains of the setup. Red is part of the Baltic Sea domain, green—the Gulf of Riga domain, and blue—the fine-grid domain of the Daugava and Lielupe rivers. Right: Localization map in the estuary domain. The rectangle represents domain boundaries (blue grid in the left figure). Circles with names in italic are observation stations. The other names in black are the main rivers contributing to the estuary domain. Bullupe River connecting the Daugava and Lielupe rivers is shown with red font.
The paper is organized as follows: first, the model setup will be described; next, the modeled physical parameters and MP concentration in the riverine–estuarial–coastal area will be verified, the role of river retention in the estuary domain will be examined, and the results of MPs in the Gulf of Riga will be studied and discussed. Finally, a conclusion will be given.
The oceanographic model on the transport of MPs is built based on the HBM which enables a seamless transition from ocean to estuary scales by using the dynamic two-way nesting (Murawski et al., 2021; Frishfelds et al., 2021) and the HBM-based MP dynamic module (Murawski et al., 2022), which includes three two-way nested domains, hereafter referred to as the three-domain model:
North Sea—coarse resolution with 3 nm (nautical miles), 50 vertical layers (Figure 2)
Wadden Sea—resolution 1 nm, 24 vertical layers (Figure 2)
Baltic Sea—0.5 nm resolution, 122 vertical layers (Figures 2, 3)
We further added two nested layers with higher resolutions in the Gulf of Riga and inland waters to form a five-domain MP model:
Gulf of Riga—0.25 nm resolution, 55 vertical layers (Figures 1–3)
Riga domain—0.05 nm resolution, 22 vertical layers (Figures 1–3)
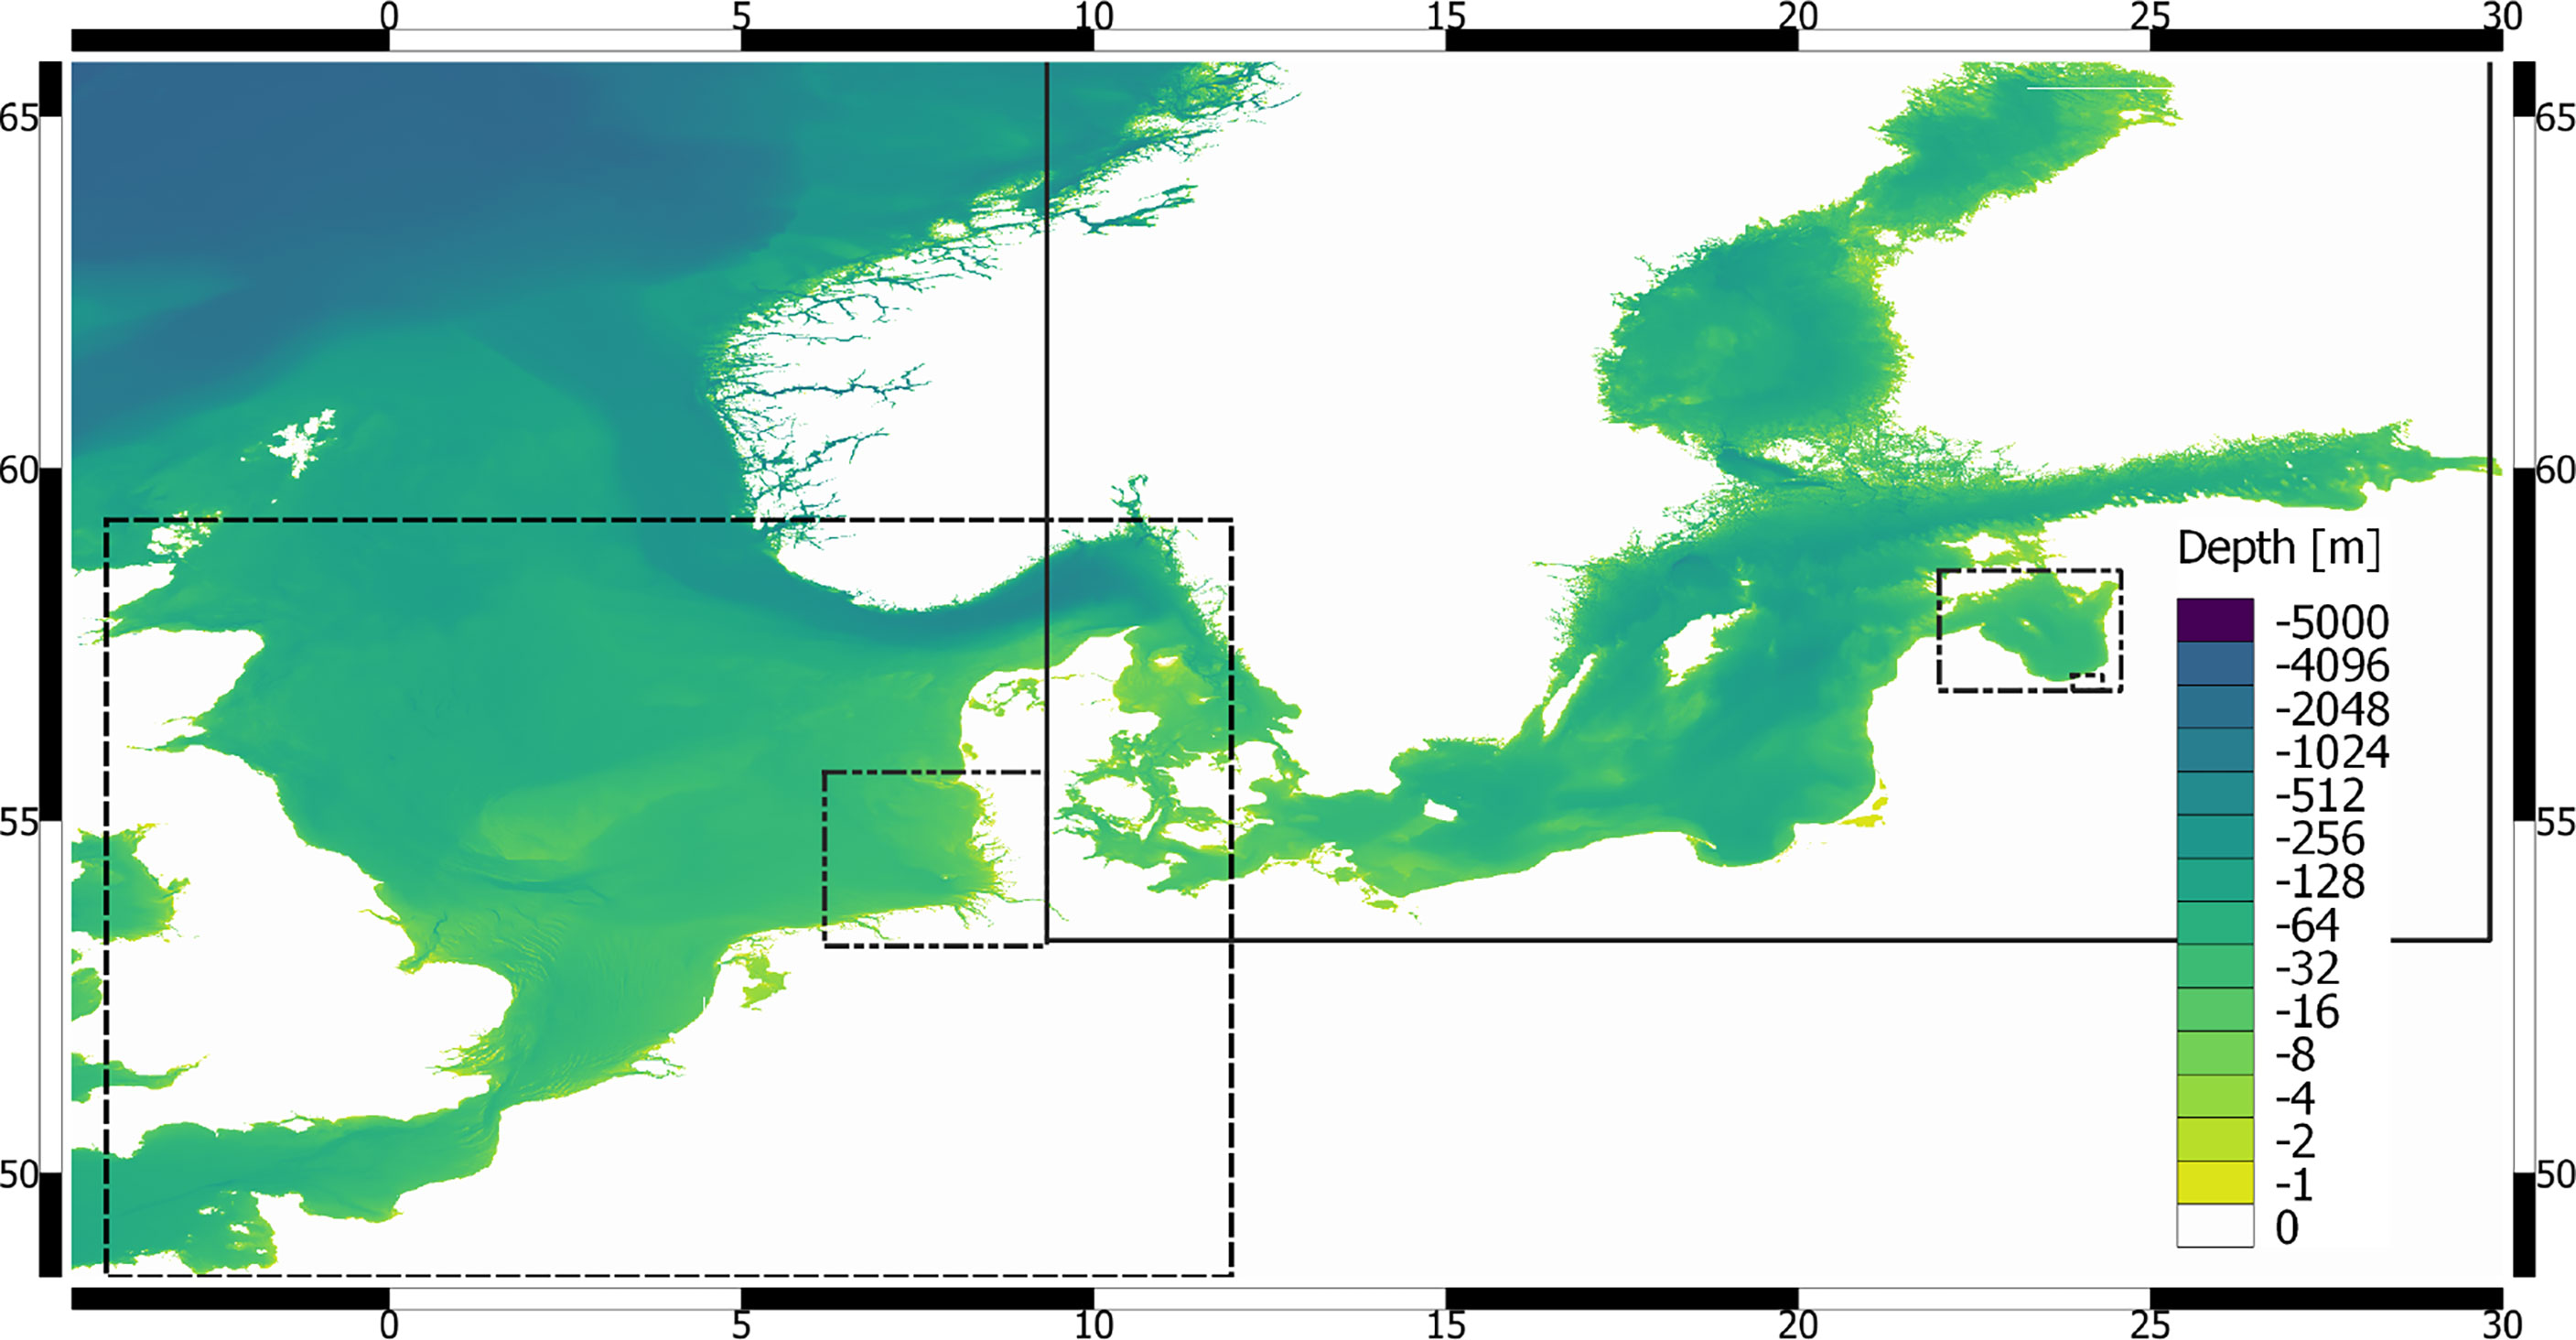
Figure 2 Domains of the HBM setup. Dashed line—the North Sea, dot-dot-dashed—the Wadden Sea, solid—the Baltic Sea, dot-dashed—the Gulf of Riga, and dotted—the Daugava and Lielupe estuaries.
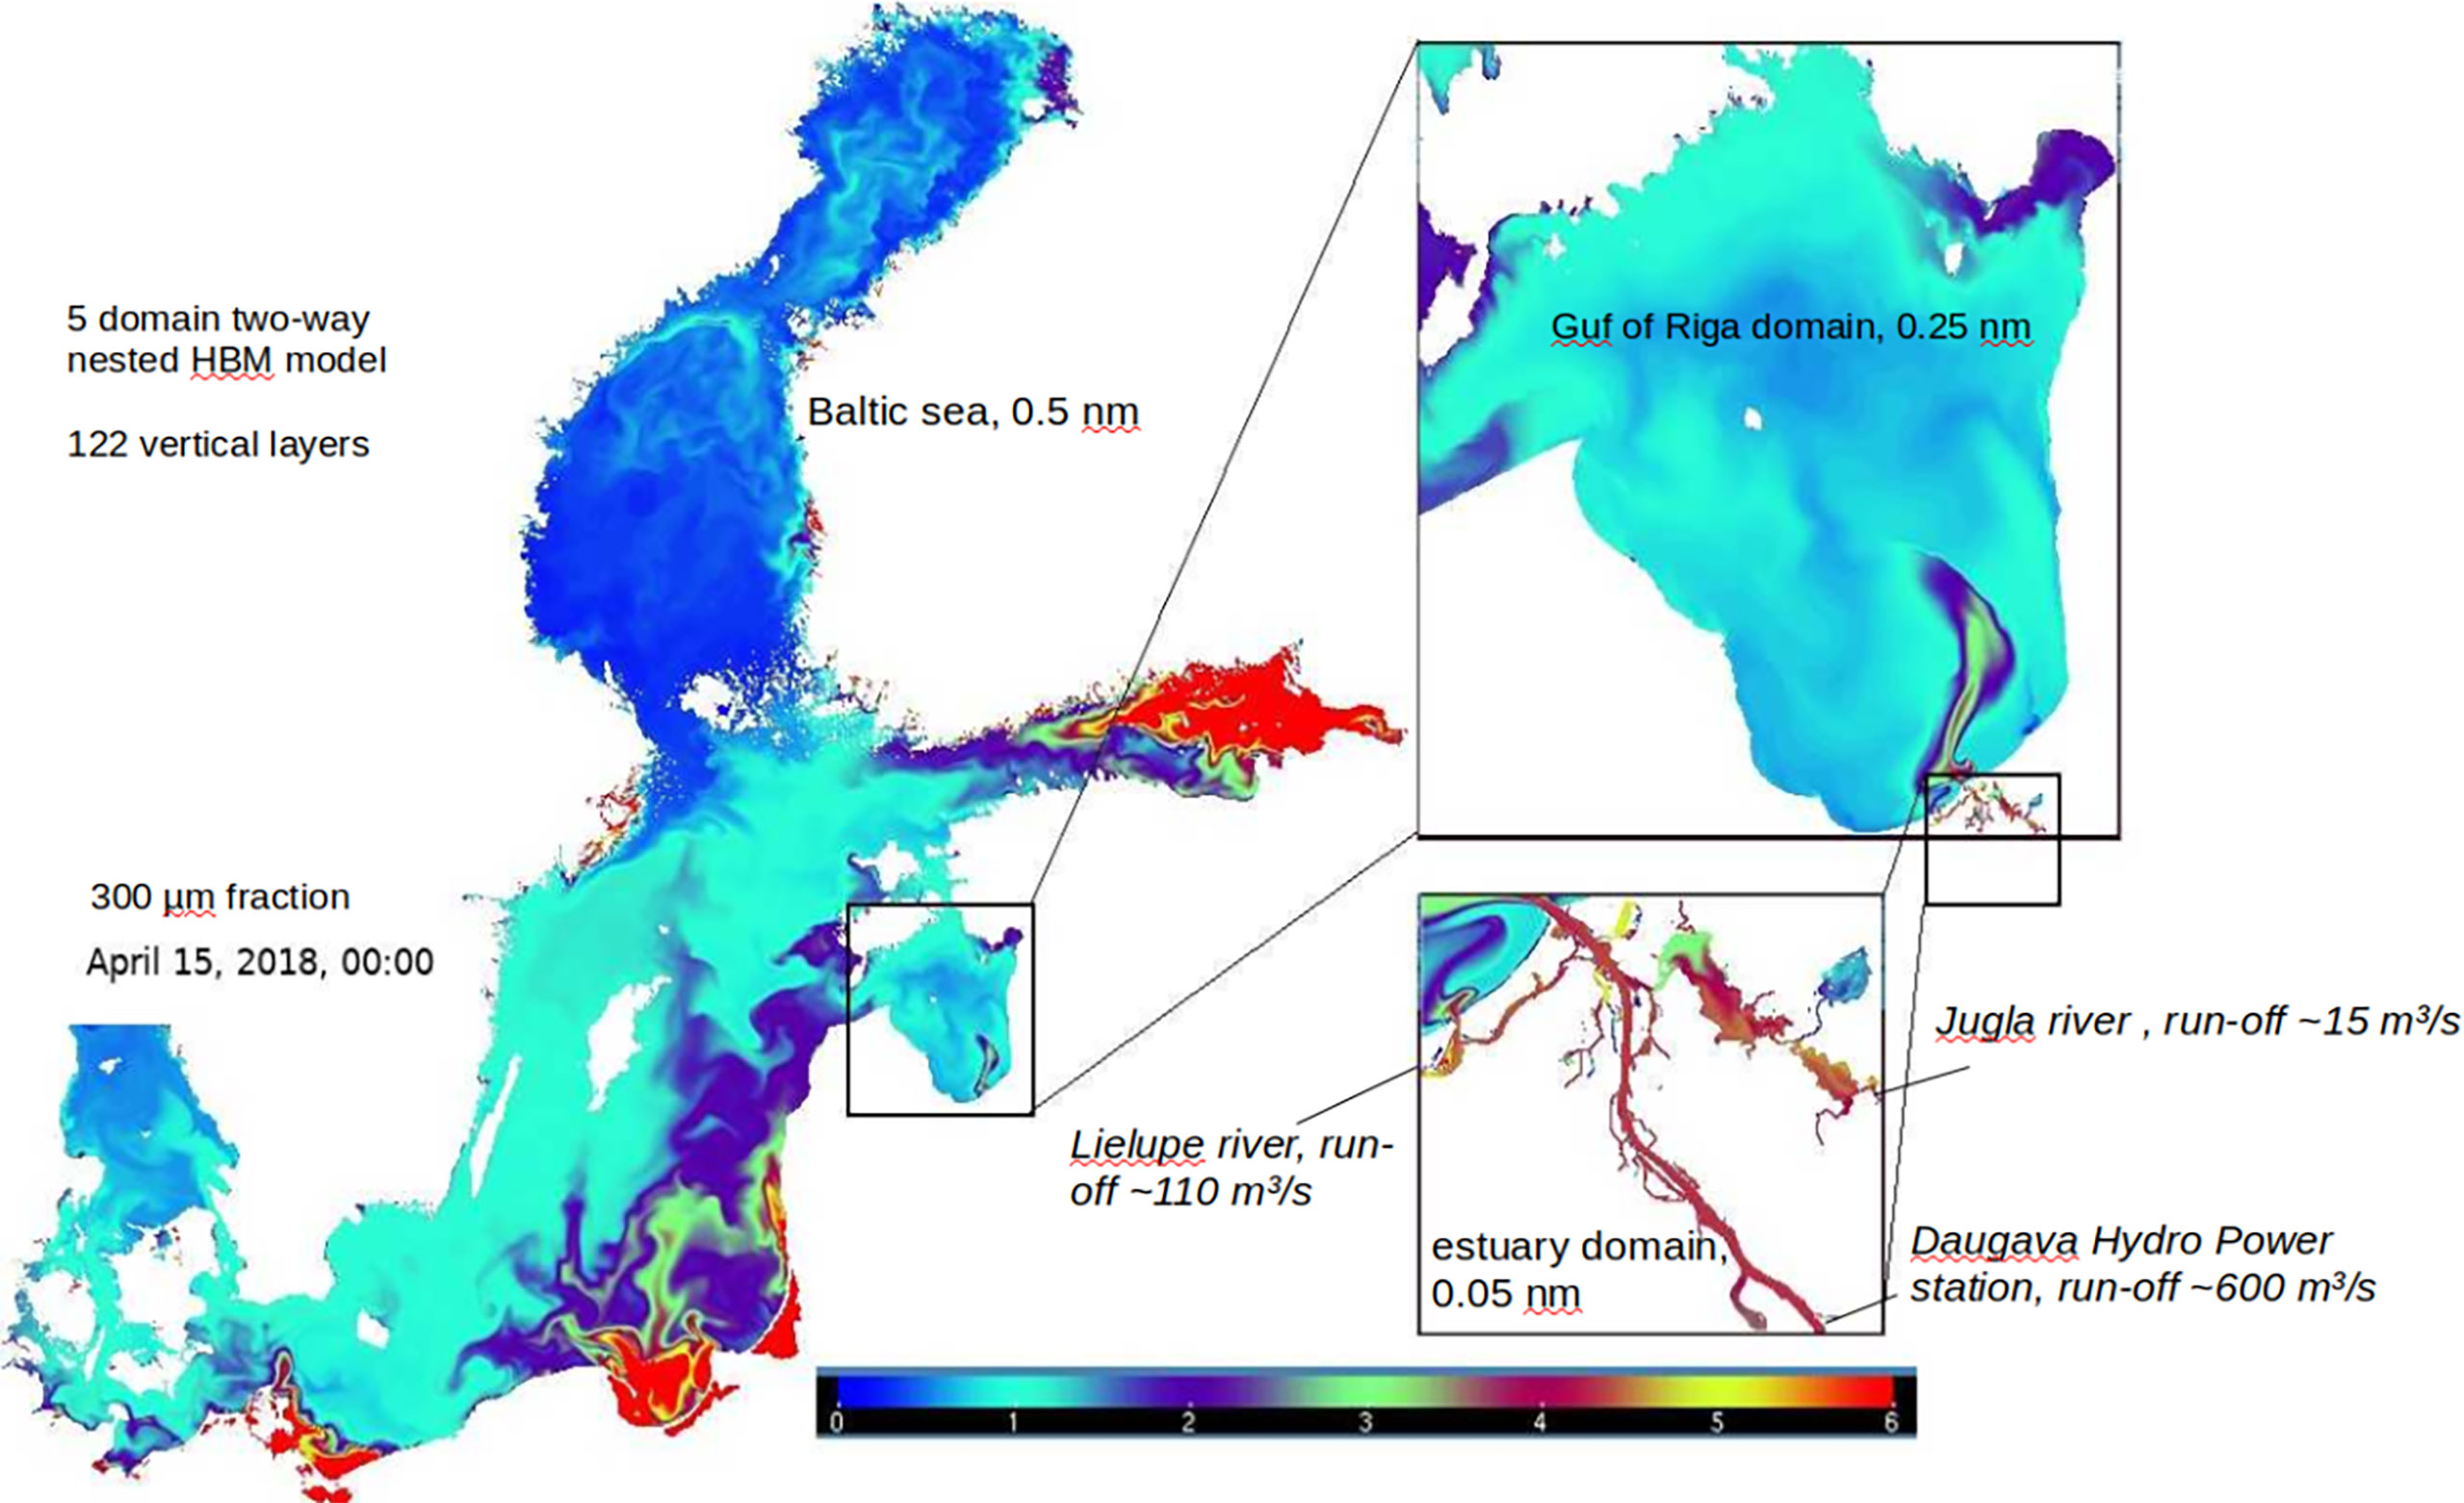
Figure 3 High-resolution domains inside the Baltic Sea domain. The color map represents the modeled surface concentration of 300 μm of MP particles on April 15, 2018, showing the Daugava River plume after a spring flood.
The sea-level boundary condition at the North Sea is derived from a two-dimensional wind-driven NOAMOD model in the Atlantic Ocean and adding 15 tidal components. The model is compared to a three-domain setup (the first 3 domains) where the Gulf of Riga and the Baltic Sea are resolved in the original 0.5-nm horizontal resolution. The three-domain setup is a derivative of an earlier version of the Danish storm surge setup DKSS used at the Danish Meteorological Institute, which has been validated extensively for operational forecasting. More details of this setup can be found in Murawski et al. (2022). The configuration of the fifth domain of the estuary and inland waters is derived from the HYWAS-PORT operational service (Sennikovs et al., 2021) for Latvian ports as a CMEMS coastal application.
The performance of the physical parameters is also compared with the standalone operational HBM setup for the Daugava estuary in the CMEMS coastal application (Sennikovs et al., 2021), where the northern boundary in the Gulf of Riga is placed at 57.085°N. It uses boundary conditions from the HBM operational setup designed for Latvian territorial waters at the University of Latvia with 1.6 km resolution which is optimized for stations in the Gulf of Riga. The fine-grid domain in the standalone setup has a horizontal resolution of 38 m in the Daugava estuary.
HBM is a three-dimensional, free-surface, baroclinic ocean circulation model (Frishfelds et al., 2021; Murawski et al., 2021). The model code is efficient and highly parallelized both with OpenMP and MPI interfaces (Berg and Poulsen, 2012). The HBM model allows for a full two-way nesting of grids with different vertical and horizontal resolutions as well as time resolution. Meier’s formulation (Meier, 2001) of thermodynamics is applied here which is well suited for the seas and oceans.
The bathymetry of the Gulf of Riga is derived from the EMODnet database of 2018. The Latvian territorial waters are resolved well in this database as it includes updated data from the Maritime Administration of Latvia. The bathymetry of Riga and Jurmala ports including dredged areas and shipping routes is obtained from the latest depth survey by port authorities. Daugava River is shippable up to Andrejosta. Smaller ships can use the Lielupe River with approximately 10 m depth. Kisezers and Jugla lakes are rather shallow lakes with a depth of 0–4 m. Flooding (wetting/drying cells) is enabled up to 0.41 m above zero level in the LAS-2000,5 height reference system. Enabling even higher-level wetting and drying would increase instabilities, and a lower time step has to be used in the simulations. However, flooding can deliver a large amount of MPs, which will be addressed in the next section.
Meteorological forcing is derived from a regional scale, non-hydrostatic DMI’s regional numerical weather forecast products with a high horizontal resolution of 2.5 km, which is very important for the coastal systems with strong cross-shore gradients. The atmospheric parameters comprise the hourly instantaneous values of the mean sea level pressure, the wind speed at 10 m height, the temperature and relative moisture at 2 m height, the cloudiness, and the hourly accumulated value of precipitation. Wind forcing is applied using the Charnock wind stress formulation (Charnock, 1955) at the water surface
where W is the wind speed at 10 m height, u is the surface current, and ρair is the air density. Coefficient Cd is dependent on wind speed according to Kara et al. (2000).
MP particles are considered passive tracers in the HBM model, i.e., their transport is driven by three-dimensional advection and dispersion within the ocean circulation model. They are subjected to biofouling in the presence of organic material in the sea. The methodology follows the formulation presented in Koo et al. (2017). The particles are considered to be spherical which simplifies the description of biofilm growth. One of the main constituents characterizing the amount of organic material and the rate of biofouling is CHL-a. If there is only a small concentration of CHL-a, biofouling does not occur. However, if the CHL-a concentration exceeds ≈1 mg/m3, then the organic layer starts to grow on the surface of the MP particle, making it less buoyant which leads to sinking. The sinking rate is estimated by using Stokes drag on a spherical particle. The methodology itself is described in Murawski et al. (2022). Three MP fractions are considered: tire wear particles with the size of 5 μm and household particles with diameters of 42 and 300 μm. The first fraction has a density of 1,027 kg/m3, whereas the density of the floating fractions is 965 kg/m3. The density of the biofilm is assumed to be 1,388 kg/m3. The larger particles float longer about a month as they require a longer period of biofouling to sink.
The smaller-sized fraction of tire wear is not buoyant at the start and sinks already at the start. However, the Stokes formula suggests that sinking speed is relatively small for particles with a diameter of 5 μm as compared to larger particles with a thick layer of organic material. Thus, the larger particles may sink even faster when they have gotten enough of the biofilm. The real description of the sinking of MPs is much more complicated with possible oscillatory behavior (Coyle et al., 2020). However, observations are taken predominantly in the surface water layer; thus, the simplified approach is still useful.
Freshwater inflows are considered to be the sources of MPs. Although the hydrodynamic model covers both the Baltic and North Seas, only MP sources from the Baltic Sea catchment are included. The source mapping of MPs in the Baltic Sea is made by yearly average data of MPs released into the sea that are derived from urbanization density for each coastal area (Murawski et al., 2022). MP sources are distributed along different river outlets, and each river has its own concentration of different MP fractions. Insufficient MP data for all months of the season did not allow to include seasonal variations of MP concentration for each source of MPs. Moreover, it could lead to very high MP concentrations in rivers at low runoff. Therefore, it is assumed that the release of MPs by rivers is proportional to the runoff for each of the sources. That means there is a constant concentration of each MP fraction at the river outlet, and the constants for each river are derived from the MP source mapping (Murawski et al., 2022). That assumption works well in the Baltic Sea scale. The amount of MPs at different river sections and branches depends considerably on the local density of urbanization (Yan et al., 2021). The number of observations in the coastal area is insufficient for the accurate setting of MP sources in the Daugava estuary domain. Therefore, MP source concentrations for smaller rivers in the estuary domain are put the same as for the Daugava River. Households that are disconnected from WWTPs are included in estimating source mapping of MPs in the Baltic Sea. As an example, there is still about 10% of the population not connected to WWTPs in Latvia and that could give comparable MP pollution (Schernewski et al., 2021), and its estimate is included in the source mapping of MPs (Murawski et al., 2022).
Observations usually include only the larger fraction as the mesh size of sieves used in the trawl method typically varies from 100 to 500 μm. Thus, there is currently a lack of data to verify the dynamics of smaller-sized particles in the Gulf of Riga and also the Baltic Sea (She et al., 2022). Observations of MPs are usually expressed as the number of particles per cubic meter, whereas the model uses mass concentration. The size of the observed MP particles is not uniform, and just the minimum size depends on the filter. The typical diameter of MP fragments with the trawl method is around 500 μm. The Pearson correlation coefficient or simply correlation does not depend on the units, and it will be used as a measure to assess the quality of MP modeling assumptions. Observations by the Technical University of Tallinn (TalTech) in the Gulf of Finland and the Gulf of Riga in the HELCOM database demonstrated that the observed MP value can differ multiple times and even by a particle per cubic meter from different transects on the same day and location within an open-sea area of a few square kilometers. The numerical model cannot reproduce these highly variable MP observations in detail. In general, the larger size of the sample volume yields better results. Unfortunately, the size of the characteristic confidence interval of MPs is too large compared to the observed MP value because of two factors: the sampling area is a thousand times smaller than the area of squared transect length and the low concentration of MP particles. Therefore, only the qualitative comparison of model runs with observations will be considered in a water body with a strong gradient of MPs as in the Gulf of Riga with a dominant source of the Daugava River. This can be addressed by the Pearson correlation coefficient as what was done in the Results section.
The Latvian Institute of Aquatic Ecology (LIAE) performed MP observations in the summer–autumn of 2018 in the Gulf of Riga and the western coast of Latvia during five monitoring cruises (Aigars et al., 2021). The transects of observations in June, July, August, and September are presented on a website (LHEI, 2018). The length of the transects in the observations is typically about 3.6 km. Some transects are shorter if there were biological remnants on the surface. Sampling was performed by using a Manta net (mesh size 300 μm) that was towed from the side of the vessel for 1 h. The average sample volume was about 639.1 m3, which is typically a few times higher than the observations by TalTech. Nevertheless, TalTech observations cover repeated year-to-year missions at Estonian stations enabling seasonal verifications (Murawski et al., 2022).
The freshwater inflow is estimated from the high-resolution pan-European water model (E-hype) data (Donnelly et al., 2016). River discharge locations in the model may slightly differ from real river outlets due to the limited resolutions of both the E-hype and HBM models. The E-hype model yields a reasonable estimate for total average river runoff, but it may underpredict high runoff events and yield a higher runoff value in drier periods. Fifteen major river sources are selected in the Gulf of Riga. Due to the importance of the RHPS to the Daugava River runoff, runoff data from the RHPS are used as well. It is noted that E-hype does not include the specific regimes of hydro power stations. Quick opening and closing of the RHPS gates can affect the release of MPs from the river estuary by bringing MPs from deeper layers to the surface. Runoff at the RHPS is typically higher in the rush hours of business days when the electricity price in the North European electricity market “Nord Pool” is the highest. Therefore, runoff data from the RHPS are used from the year 2020. Hourly runoff data are averaged from the 10-min data of the RHPS. The data show that runoff between gate opening and closing periods can differ more than 100 times. In order to mimic the varying runoffs in the years before 2020, the E-hype runoff is multiplied by a coefficient of 0.24 in the gate closing period (night hours), 0.45 on weekend days, and 2.25 in working hours of business days. In this way, the weekly average runoff remains the same as that of E-hype but has strong variation in time. The Daugava runoff is of high importance as it contributes more than half of all freshwater inflow in the Gulf of Riga. The contributions of smaller rivers to the Daugava River in the high-resolution estuary domain are also estimated from E-hype. The most interesting is the Jugla River with a mean runoff of about 14 m3/s, which runs into Daugava through two lakes. Therefore, it enables us to consider longer residence times of MPs in the high-resolution estuary domain.
As MP observations in the Gulf of Riga are present for the period starting from 2014 with most of the data for the year 2018, then the simulation period is adjusted accordingly to cover the period from July 1, 2017, to the year 2020 in seven different variants (v1–v7) (see Table 1 in the Results section). The initial conditions are derived from previous multiyear runs, assuming that MP concentration will be saturated from the year 2018 in the Gulf of Riga (variants v1, v2, v4). Additionally, the three-domain setup covers the period from July 1, 2013, up to 2020 (Murawski et al., 2022). MP distribution on July 1, 2017, is used as a new starting condition for the five-domain setup in the later runs (variants v3, v5, v6, v7). Initial conditions for temperature and salinity in the Baltic Sea and the North Sea are derived from the CMEMS reanalysis products. In order to test the influence of the estuary domain, the following simulation experiments were performed: control runs with the three-domain setup without the estuary domain (variants v1, v3), control runs with river runoff as in E-hype (variants v1, v2, v3), an adjusted run with characteristic RHPS runoff cycle but keeping the same amount of weekly runoff as in E-hype (variants v4, v5, v6, v7), a no-biofouling testing run without biofouling in the inland water domain (variant v5), and a no-sedimentation run without sedimentation in the inland water domain (variant v7).

Table 1 Correlations between observations of MP fragments performed by the LIAE in 2018 with different variants of the model setup.
In order to see the possible origin of MPs and traveling time, a backward drift method is introduced. A backtrack (Øyvind et al., 2011), i.e., a trajectory that a water parcel would have traveled to reach a specific location and time, is searched for each observation in order to estimate the most probable source of MPs. A small stochastic uncertainty of currents with an amplitude of ɛ= 0.2 m/s is added to account for the dispersion as what was done in Øyvind and Allen (2008) for a Markov process:
where dx is the change in horizontal position during time step dt and surface currents v, k are two-dimensional vectors with random coordinates in a square box (-0.5,0.5) × (-0.5,0.5). Only ocean surface currents are considered in the drift calculations, i.e., wind drift and Stokes drift are neglected. A simple optimization of 9,000 backward trajectories with respect to salinity is added in order to prefer those backtracking trajectories that are originating from the river sources. Due to horizontal dispersion, the methodology could result in several river sources; therefore, those rivers with smaller backtracking duration and lower salinity (more intense freshwater source) are preferred in the optimization.
The transport of MPs in coastal scales largely depended on local hydrodynamics as the small particles behaved like passive tracers. As a consequence, the quality of MP transport largely relied on correct currents of the high-resolution domains. Therefore, the performance of the physical parameters of the coastal model in the inland and estuarial areas was examined first. Observation of the currents at Riga station, i.e., the channel connecting the Daugava River and Kisezers lake (Figure 1, right), was used to assess the model quality. As shown in Figure 4, the model with two-way nesting in the five-domain configuration predicts the currents at Riga station much better than the standalone inland water model with 38 m resolution, when using the RHPS river runoff data. The latter overpredicts the inflow (Figure 4). The flow at Riga station through the Milgravis channel was influenced by multiple factors such as the Daugava River runoff, Jugla River runoff, storm surge, winds, and port seiches. Both the model and observations showed that the direction of the flow changed direction irregularly due to sea-level oscillations in Kisezers lake for a period of 2–5 h. Nevertheless, it was usually either storm surge or runoff at the RHPS that triggered the change of flow direction at Riga station. The Pearson correlation coefficient between the observed and modeled flow at the Riga station was 5%–15% improved when real hourly runoff from the RHPS was used instead of E-hype data (see Figure 5). In the second half of 2020, the monthly correlation was improved from about 0.6 to about 0.7 by including specific RHPS runoff. The case with the standalone setup had the lowest correlation as it lacked two-way nesting with the Gulf of Riga despite having a higher resolution. The standalone setup did not describe momentary currents correctly at the boundaries (Frishfelds et al., 2021; Murawski et al., 2021). Therefore, proper boundary conditions can be more essential than the resolution of a coastal model, especially when estimating transport from inland waters to open seas.
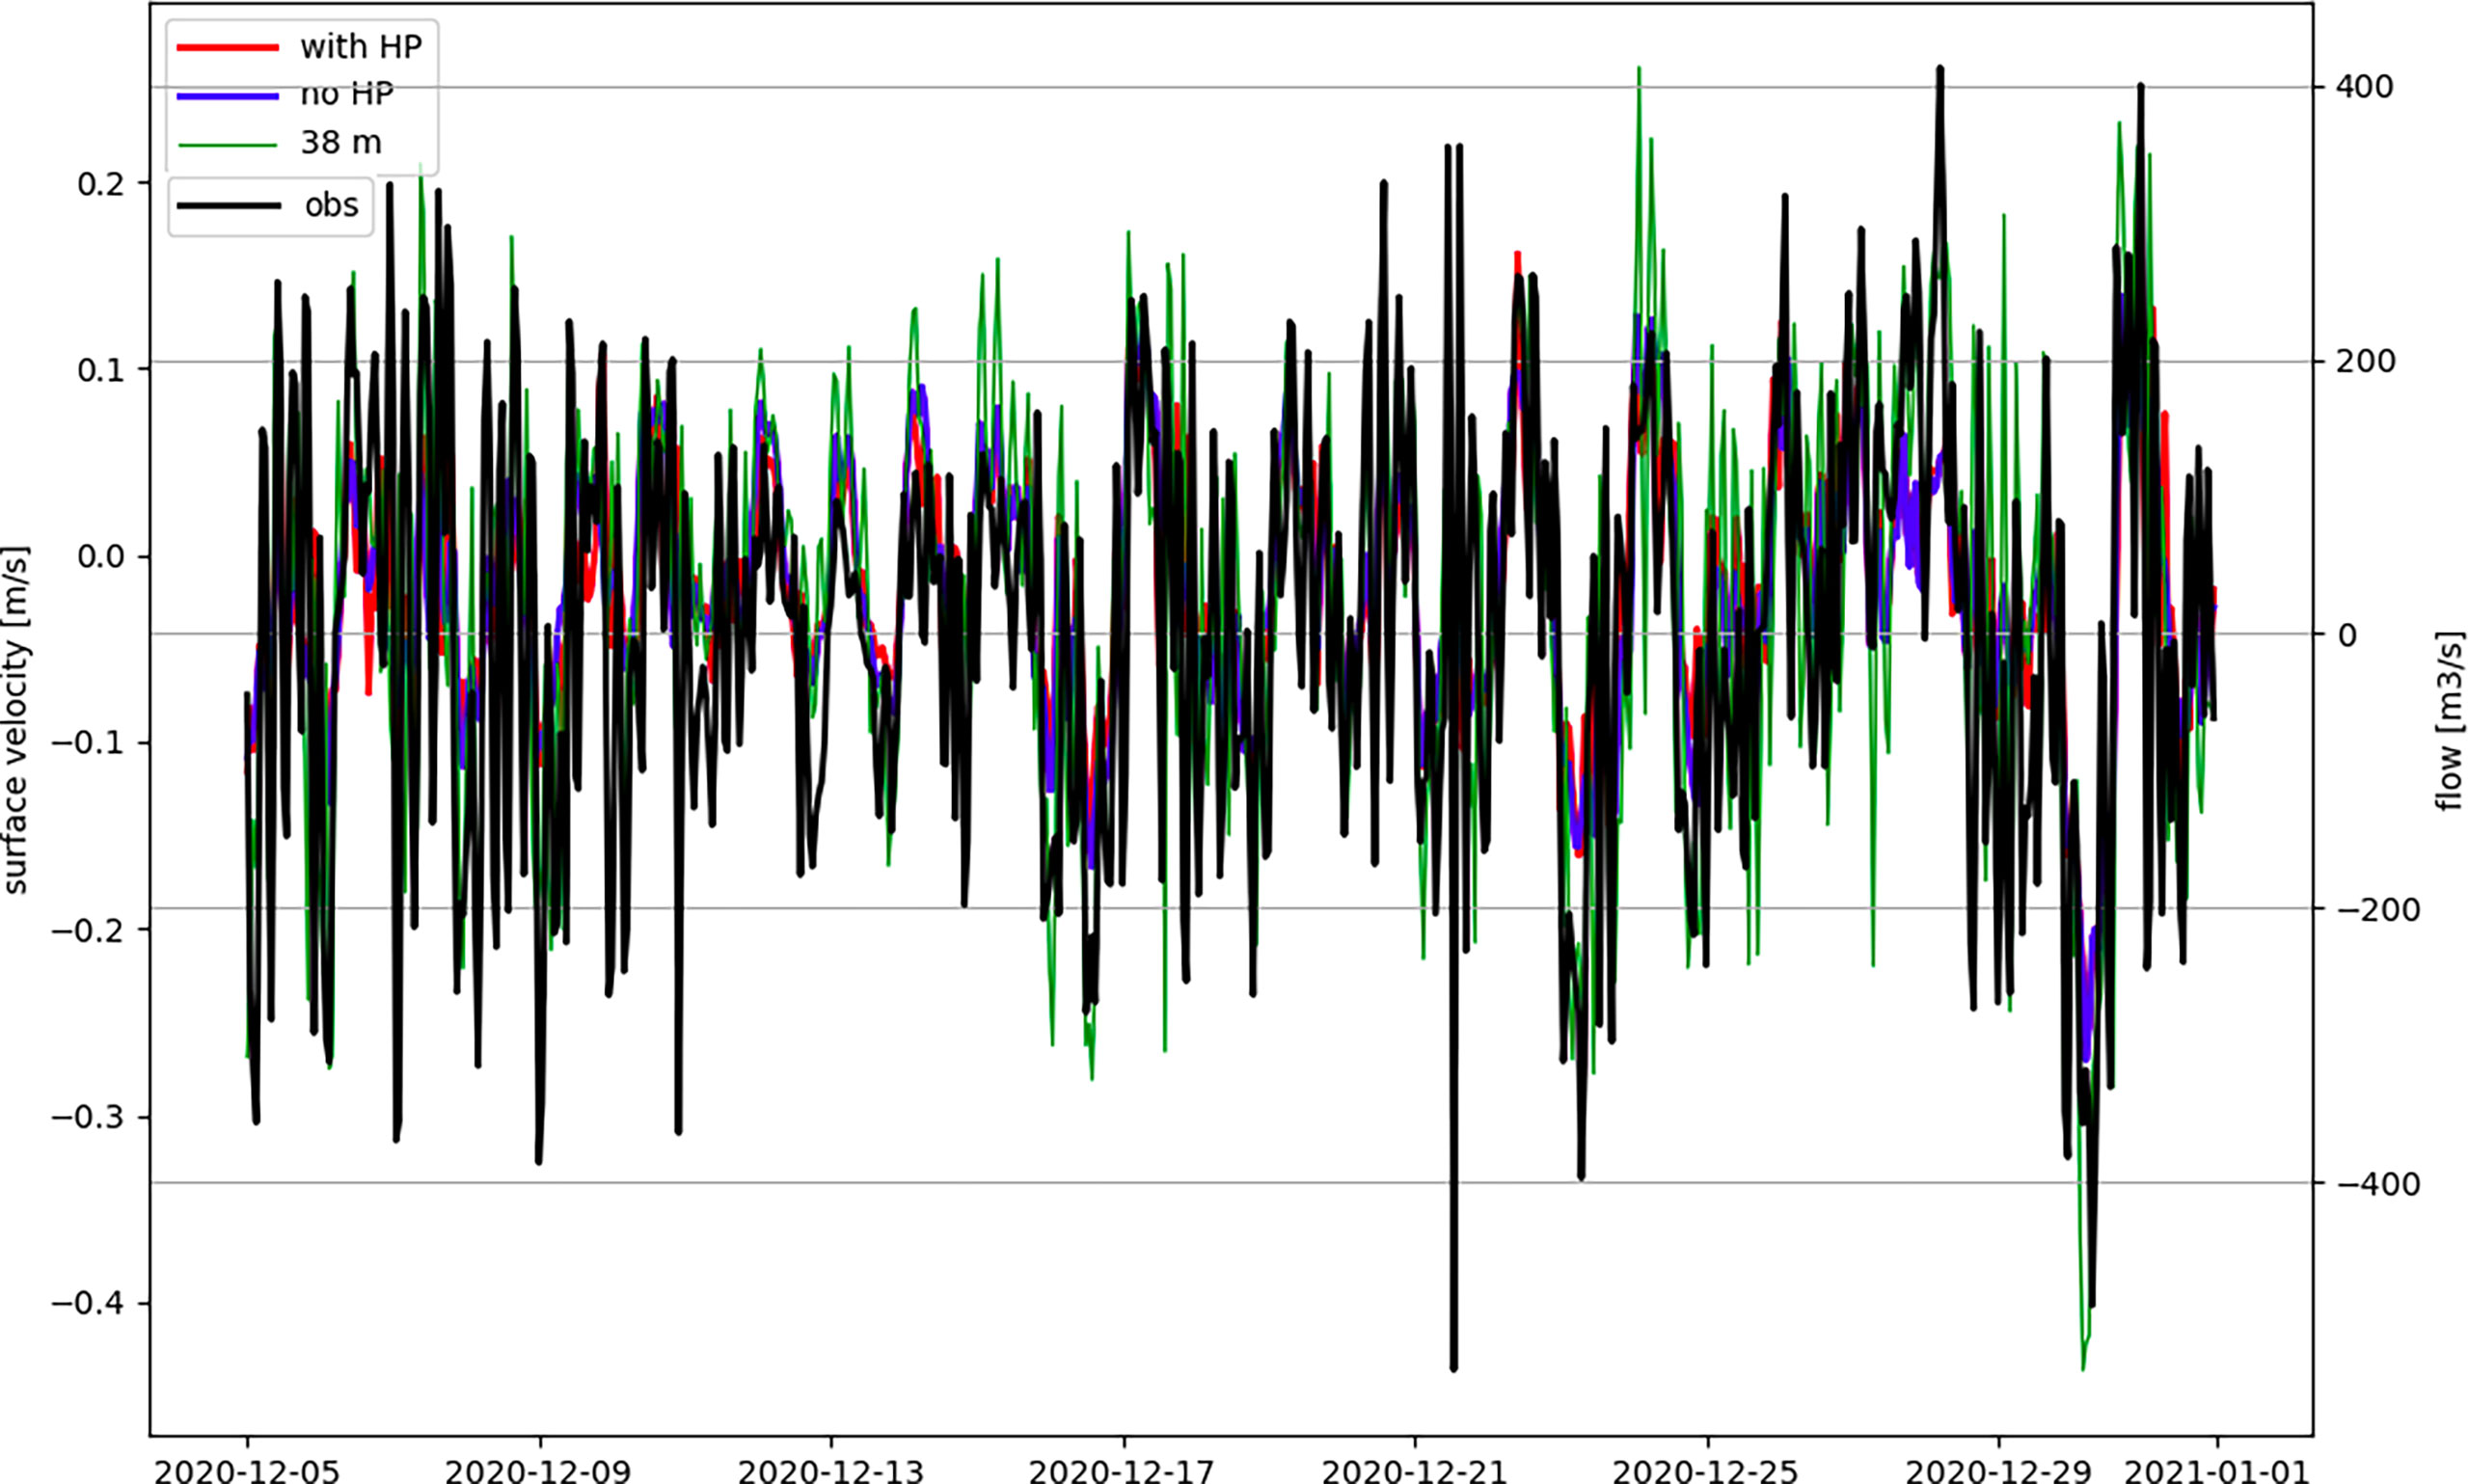
Figure 4 Flow through the Milgravis channel in Riga station (see Figure 1, right) in December 2020. The black line represents observations (secondary y-axis), red—the model with Daugava hourly runoff according to the data of the RHPS, blue—the model with Daugava runoff according to E-hype, and green—the standalone setup.
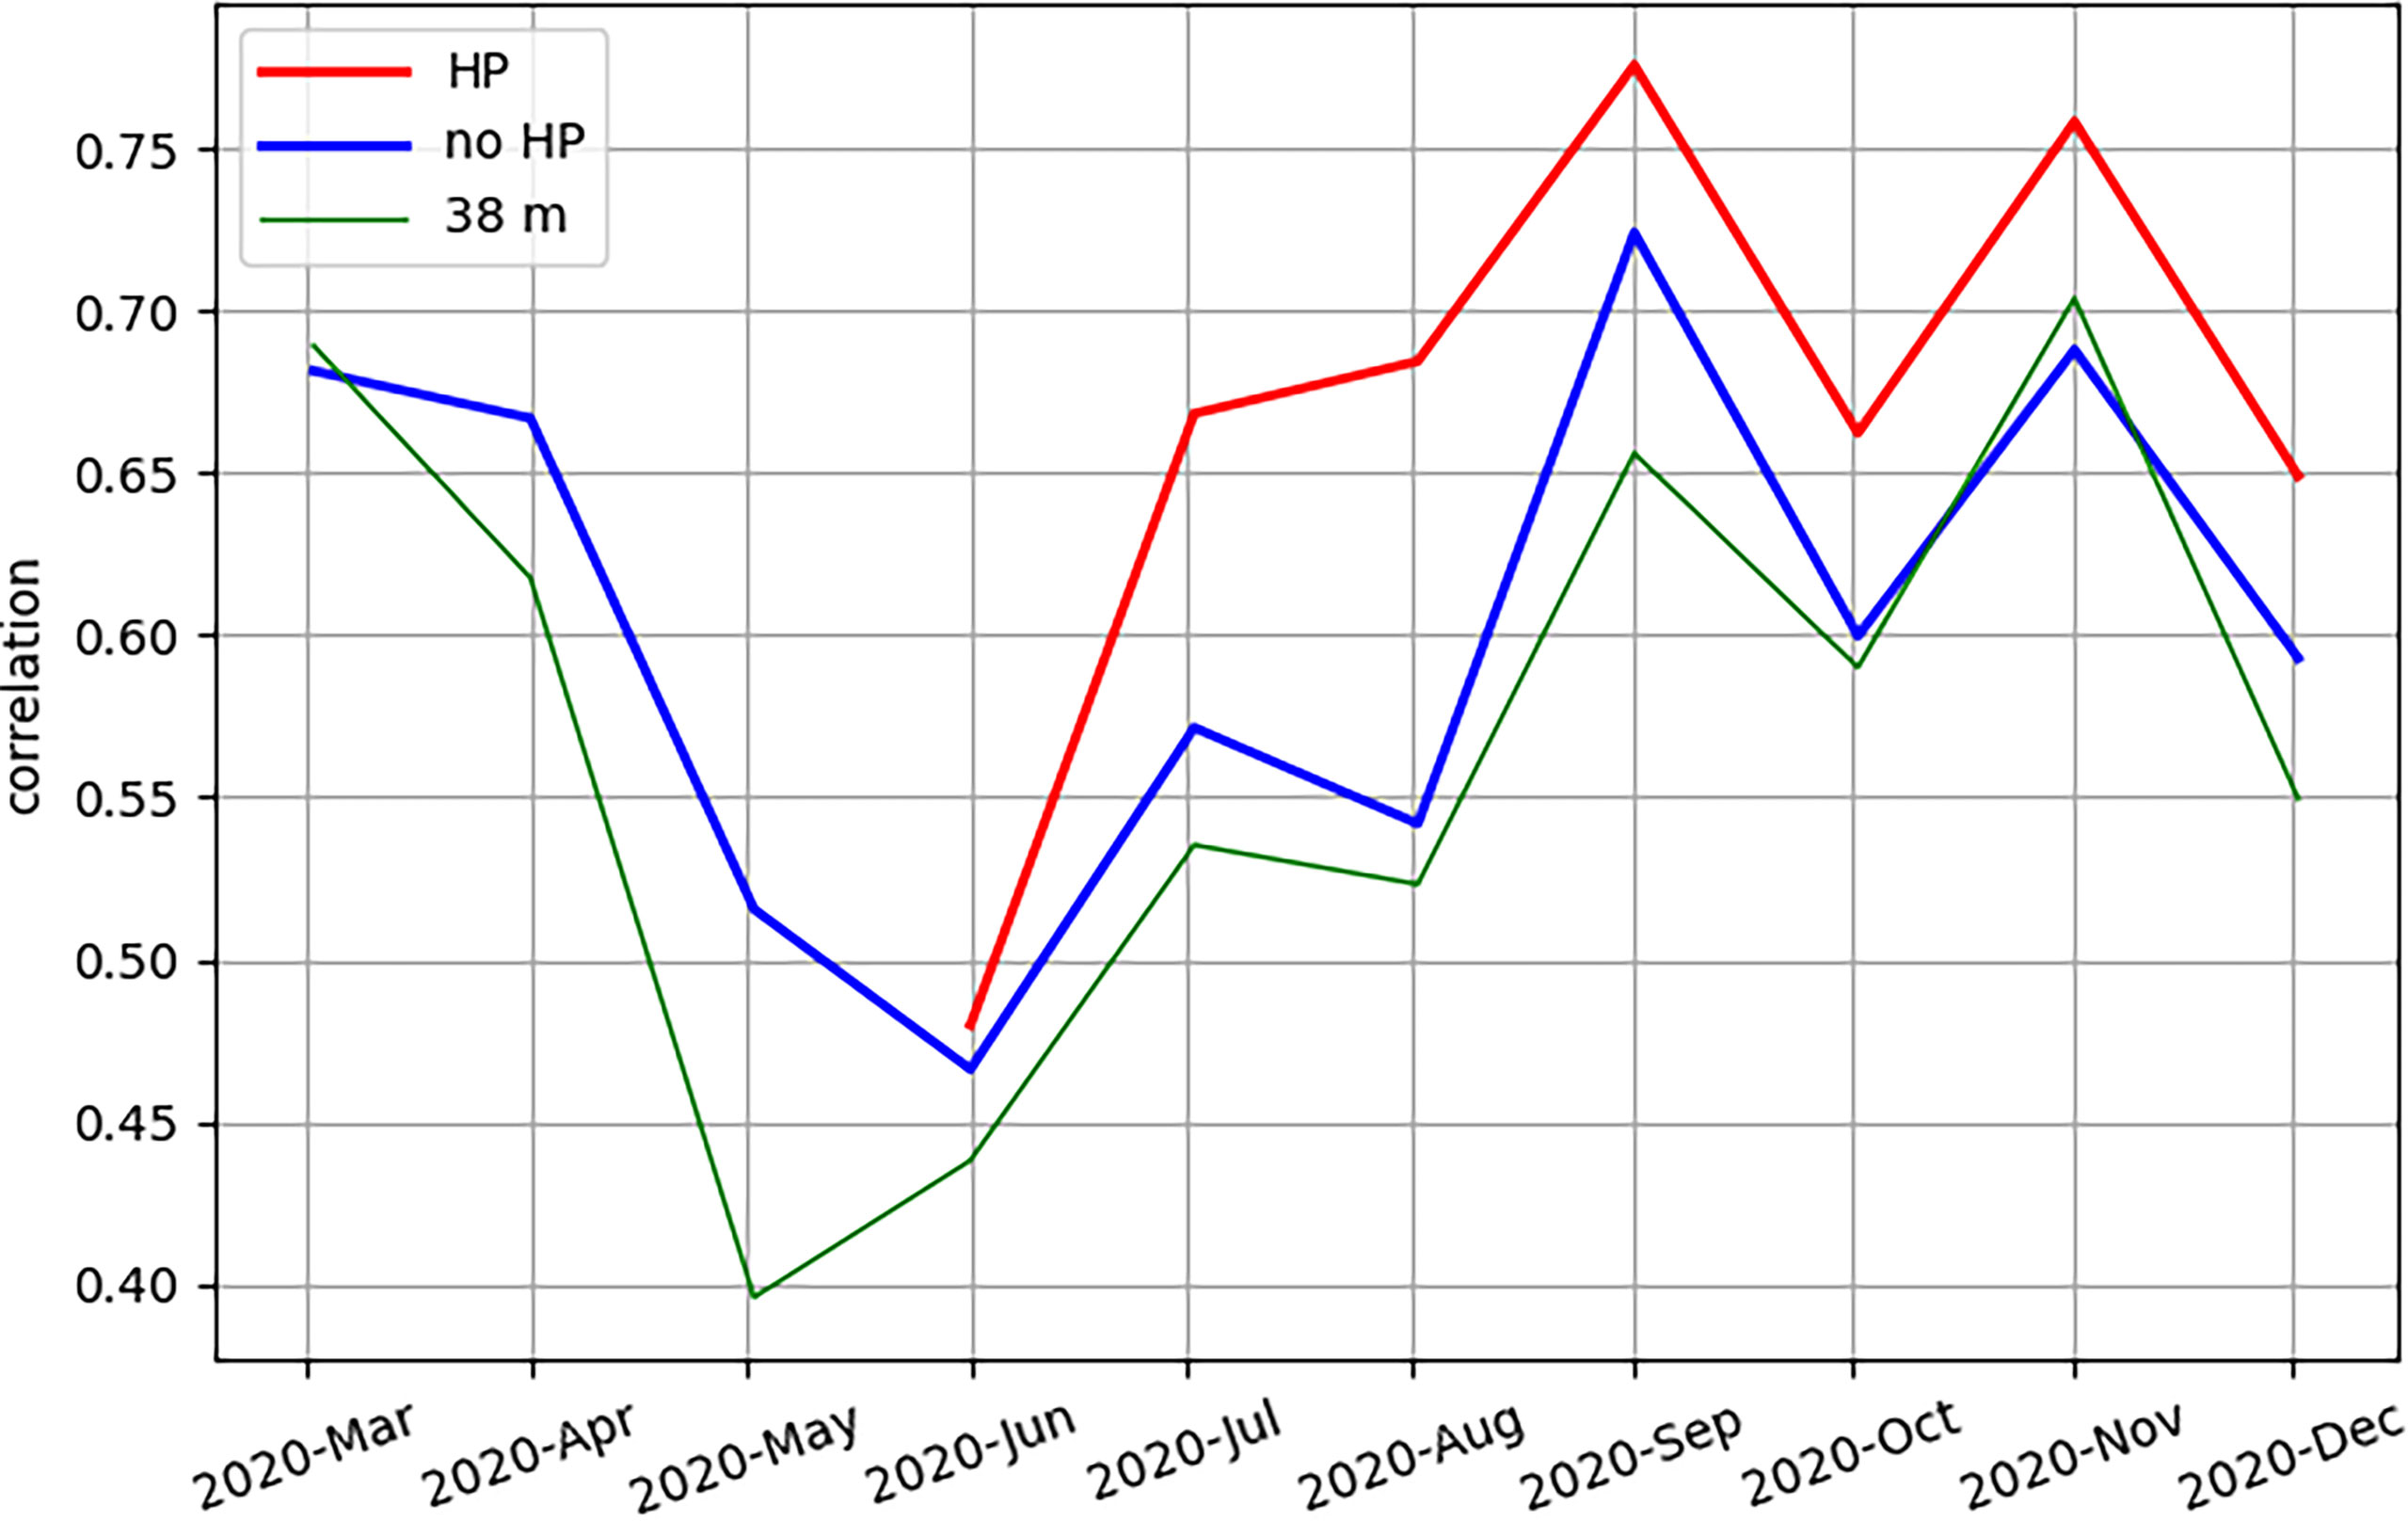
Figure 5 Monthly correlation of total flow through the Milgravis in Riga station (see Figure 1). The red curve corresponds to Daugava runoff according to hourly data of the RHPS, blue—the Daugava runoff according to E-hype, and green—the standalone setup with Daugava runoff according to hourly data of the RHPS.
Water-level variations within the high-resolution domain were highly sensitive to the hydrology of inflowing rivers and internal flows within the domain. The HBM nested setup performed fairly well at the coastal stations (see the comparison with the observed water level in Figure 6). The water level at Andrejosta station (Figure 1, right) was strongly dependent on the runoff of the RHPS as the station was placed downstream from the RHPS at the river. However, quick changes in Daugava runoff sometimes increased the deviation when using hourly runoff instead of a constant daily value. Also, the southern part of the Daugava River (see Figure 1, right) was not resolved well in the model leading to lower hydrodynamic resistance there. Therefore, the water level at Andrejosta was not improved when using hourly runoff at the RHPS. As a reference, the result of the CMEMS Baltic Sea product “BALTIC SEA ANALYSIS FORECAST PHY 003 006” was shown at Daugavgriva station, where it had a lower performance of water level due to lower spatial resolution. The good performance of the standalone setup at this Daugavgriva station was attributed to the use of boundary conditions from the regional open-sea model based on the HBM at the University of Latvia, which was optimized for the Gulf of Riga and western Latvia.
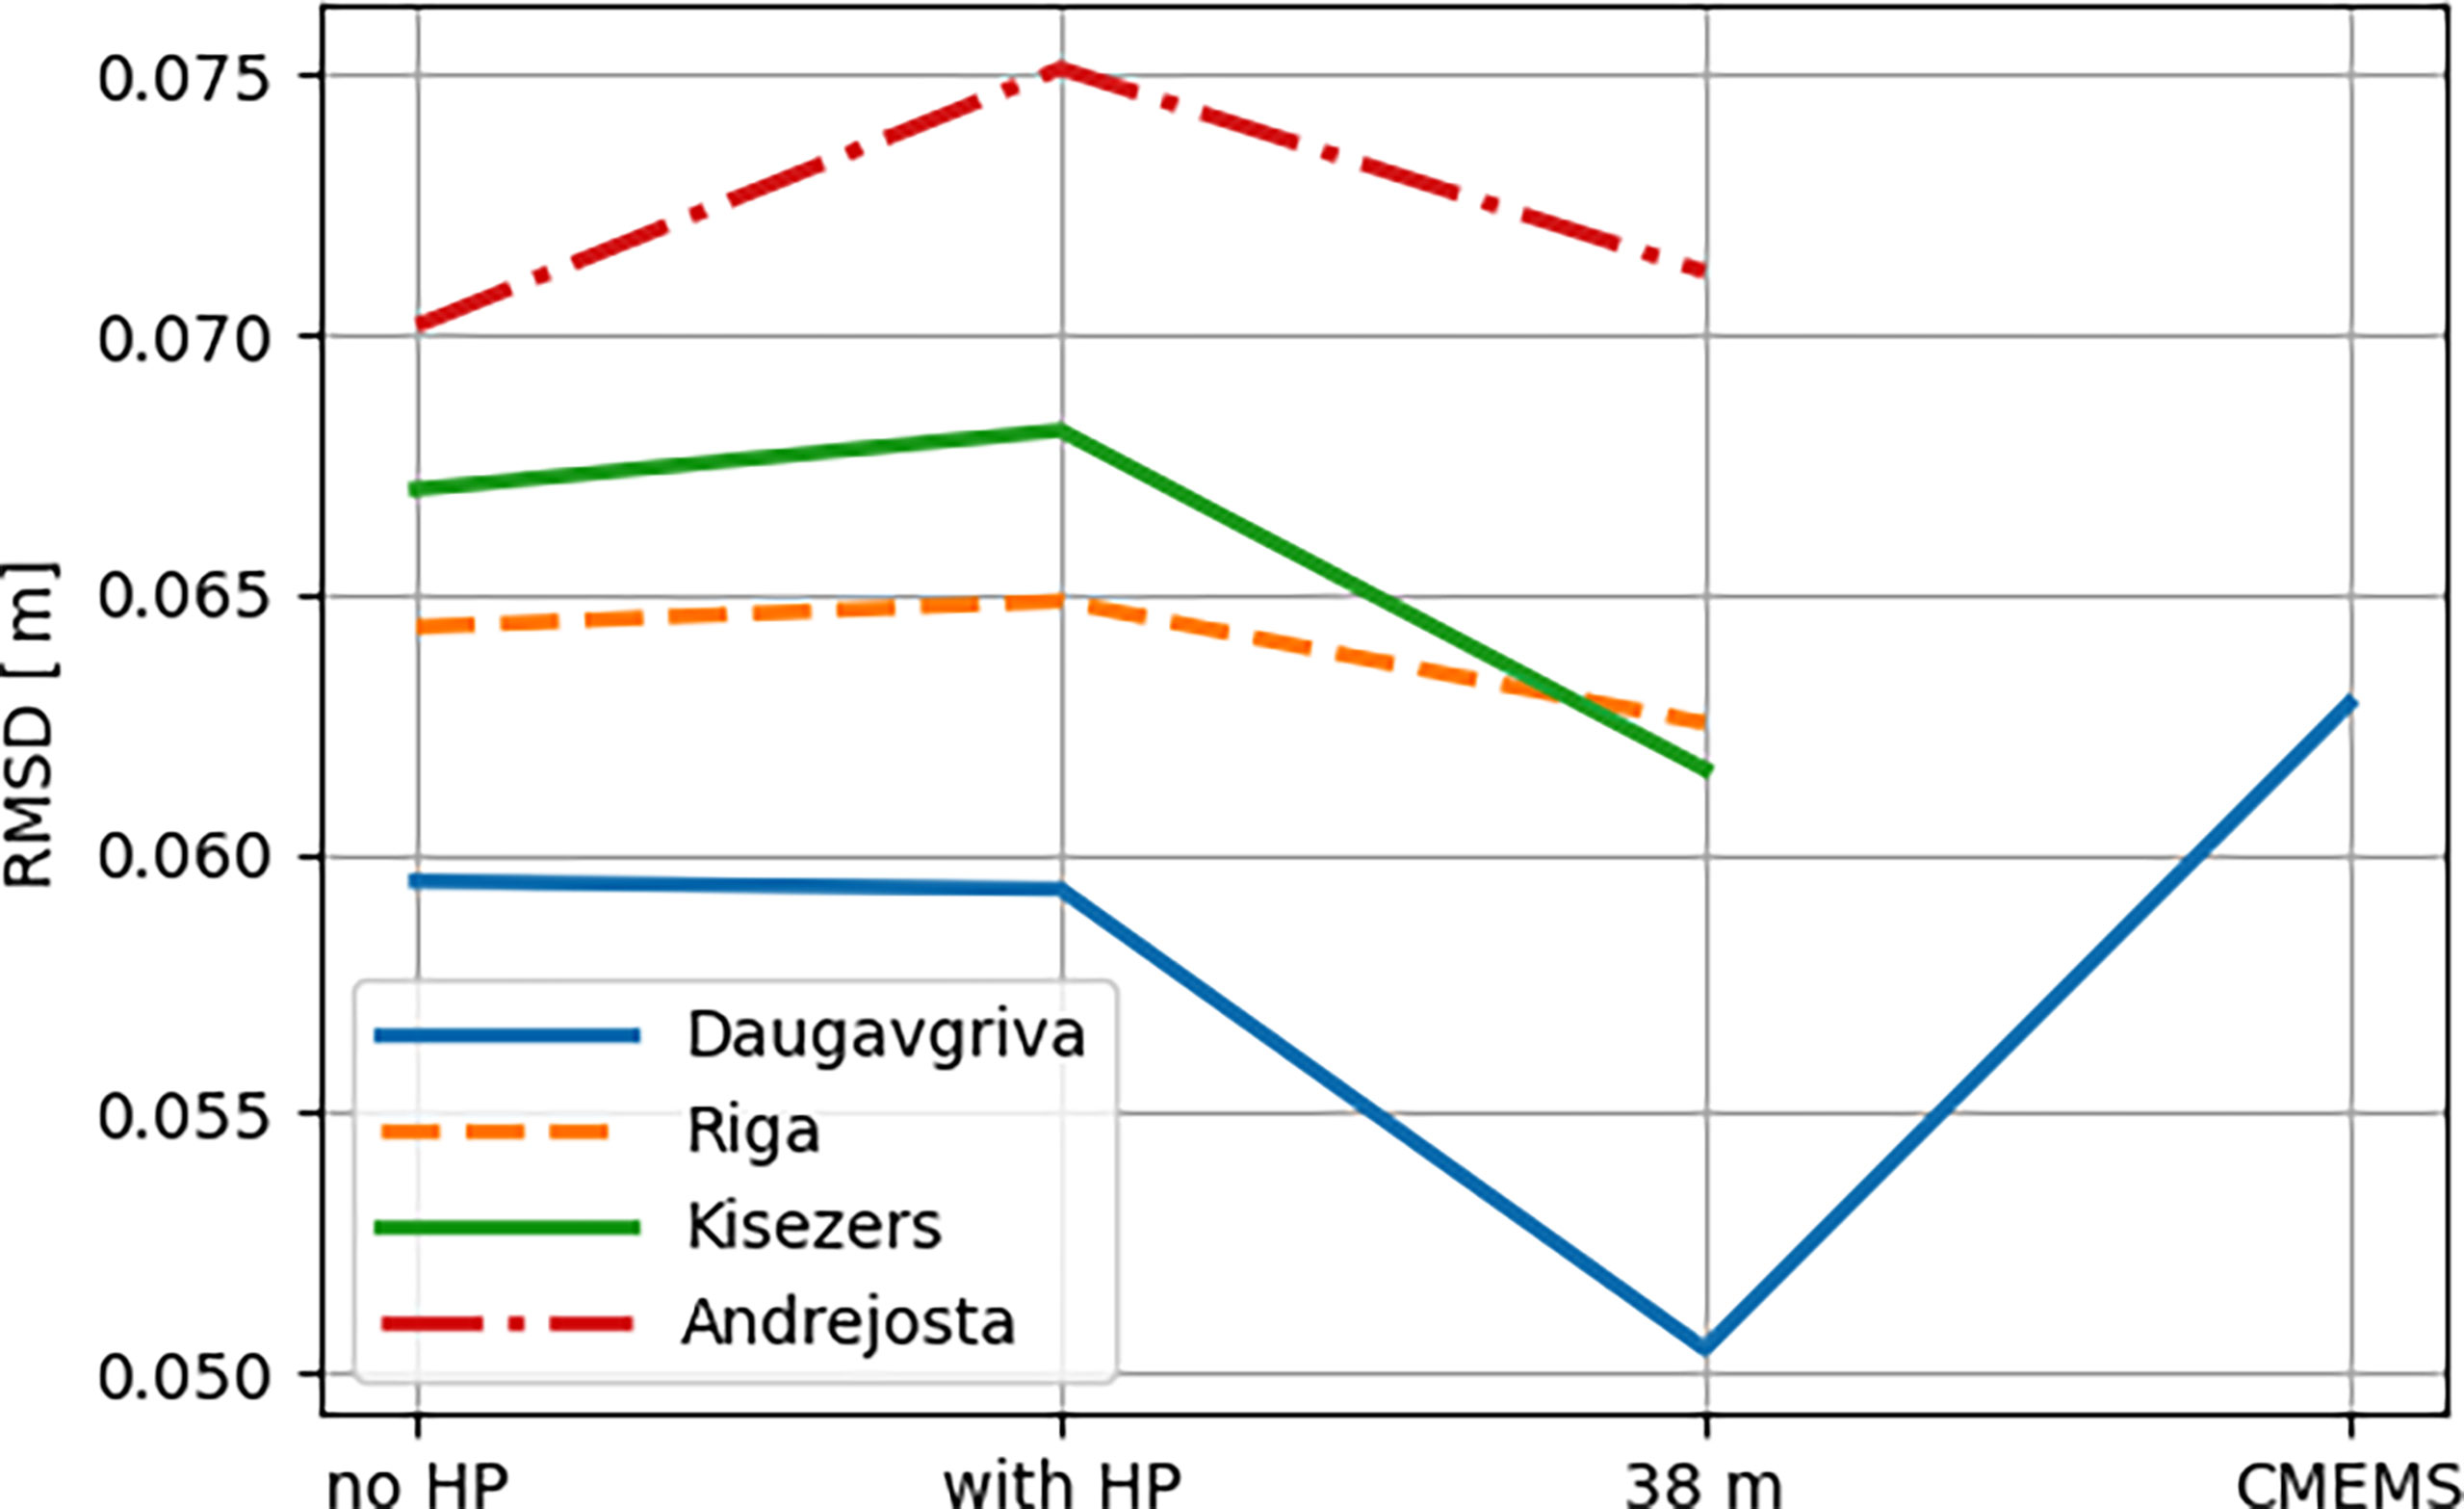
Figure 6 Centered root mean square error (RMSD) of sea level at stations within the high-resolution estuary domain (see Figure 1) from June 1, 2020, to January 1, 2021. Labels of the x-axis represent different models or model variants. The label “no HP” denotes the case with Daugava runoff according to E-hype, “with HP”—the hourly Daugava runoff according to the data of the RHPS, “38 m”—the standalone setup, and “CMEMS”—the sea level according to the CMEMS forecast.
The main interest of including the high-resolution estuary domain in the Baltic Sea was to study the impact of riverine inputs of MPs on the coastal MP distribution and see which formulation of MP behavior in the inland water domain works best. Unfortunately, there were not many observations of MPs directly in Daugava and Lielupe estuaries except for a few transects in Daugava and Lielupe river mouth by the LIAE. Figure 7 shows the difference in the surface 300μm concentration between the cases of the RHPS daily cycle included and excluded with the same average weekly runoff in 2018. There was a 10% lower MP concentration directly at the river mouth as well as a higher MP concentration in the upstream of the riverine domain, probably due to more intense vertical mixing in the upstream and sedimentation in the downstream during the rush hours. In addition, water-level variations in the Daugava River caused by the RHPS cycle improved water exchange with side branches of the river (see Figure 7), resulting in higher simulated MP values there. The change of overall surface transport from the estuary domain was weakly dependent on the RHPS cycle (see Figure 8), except that some more intense runoff period was expressed in the spring. The case without river retention resulted in a higher transport from the river domain especially in summer–autumn when the biofouling rate was higher and river runoff was lower.
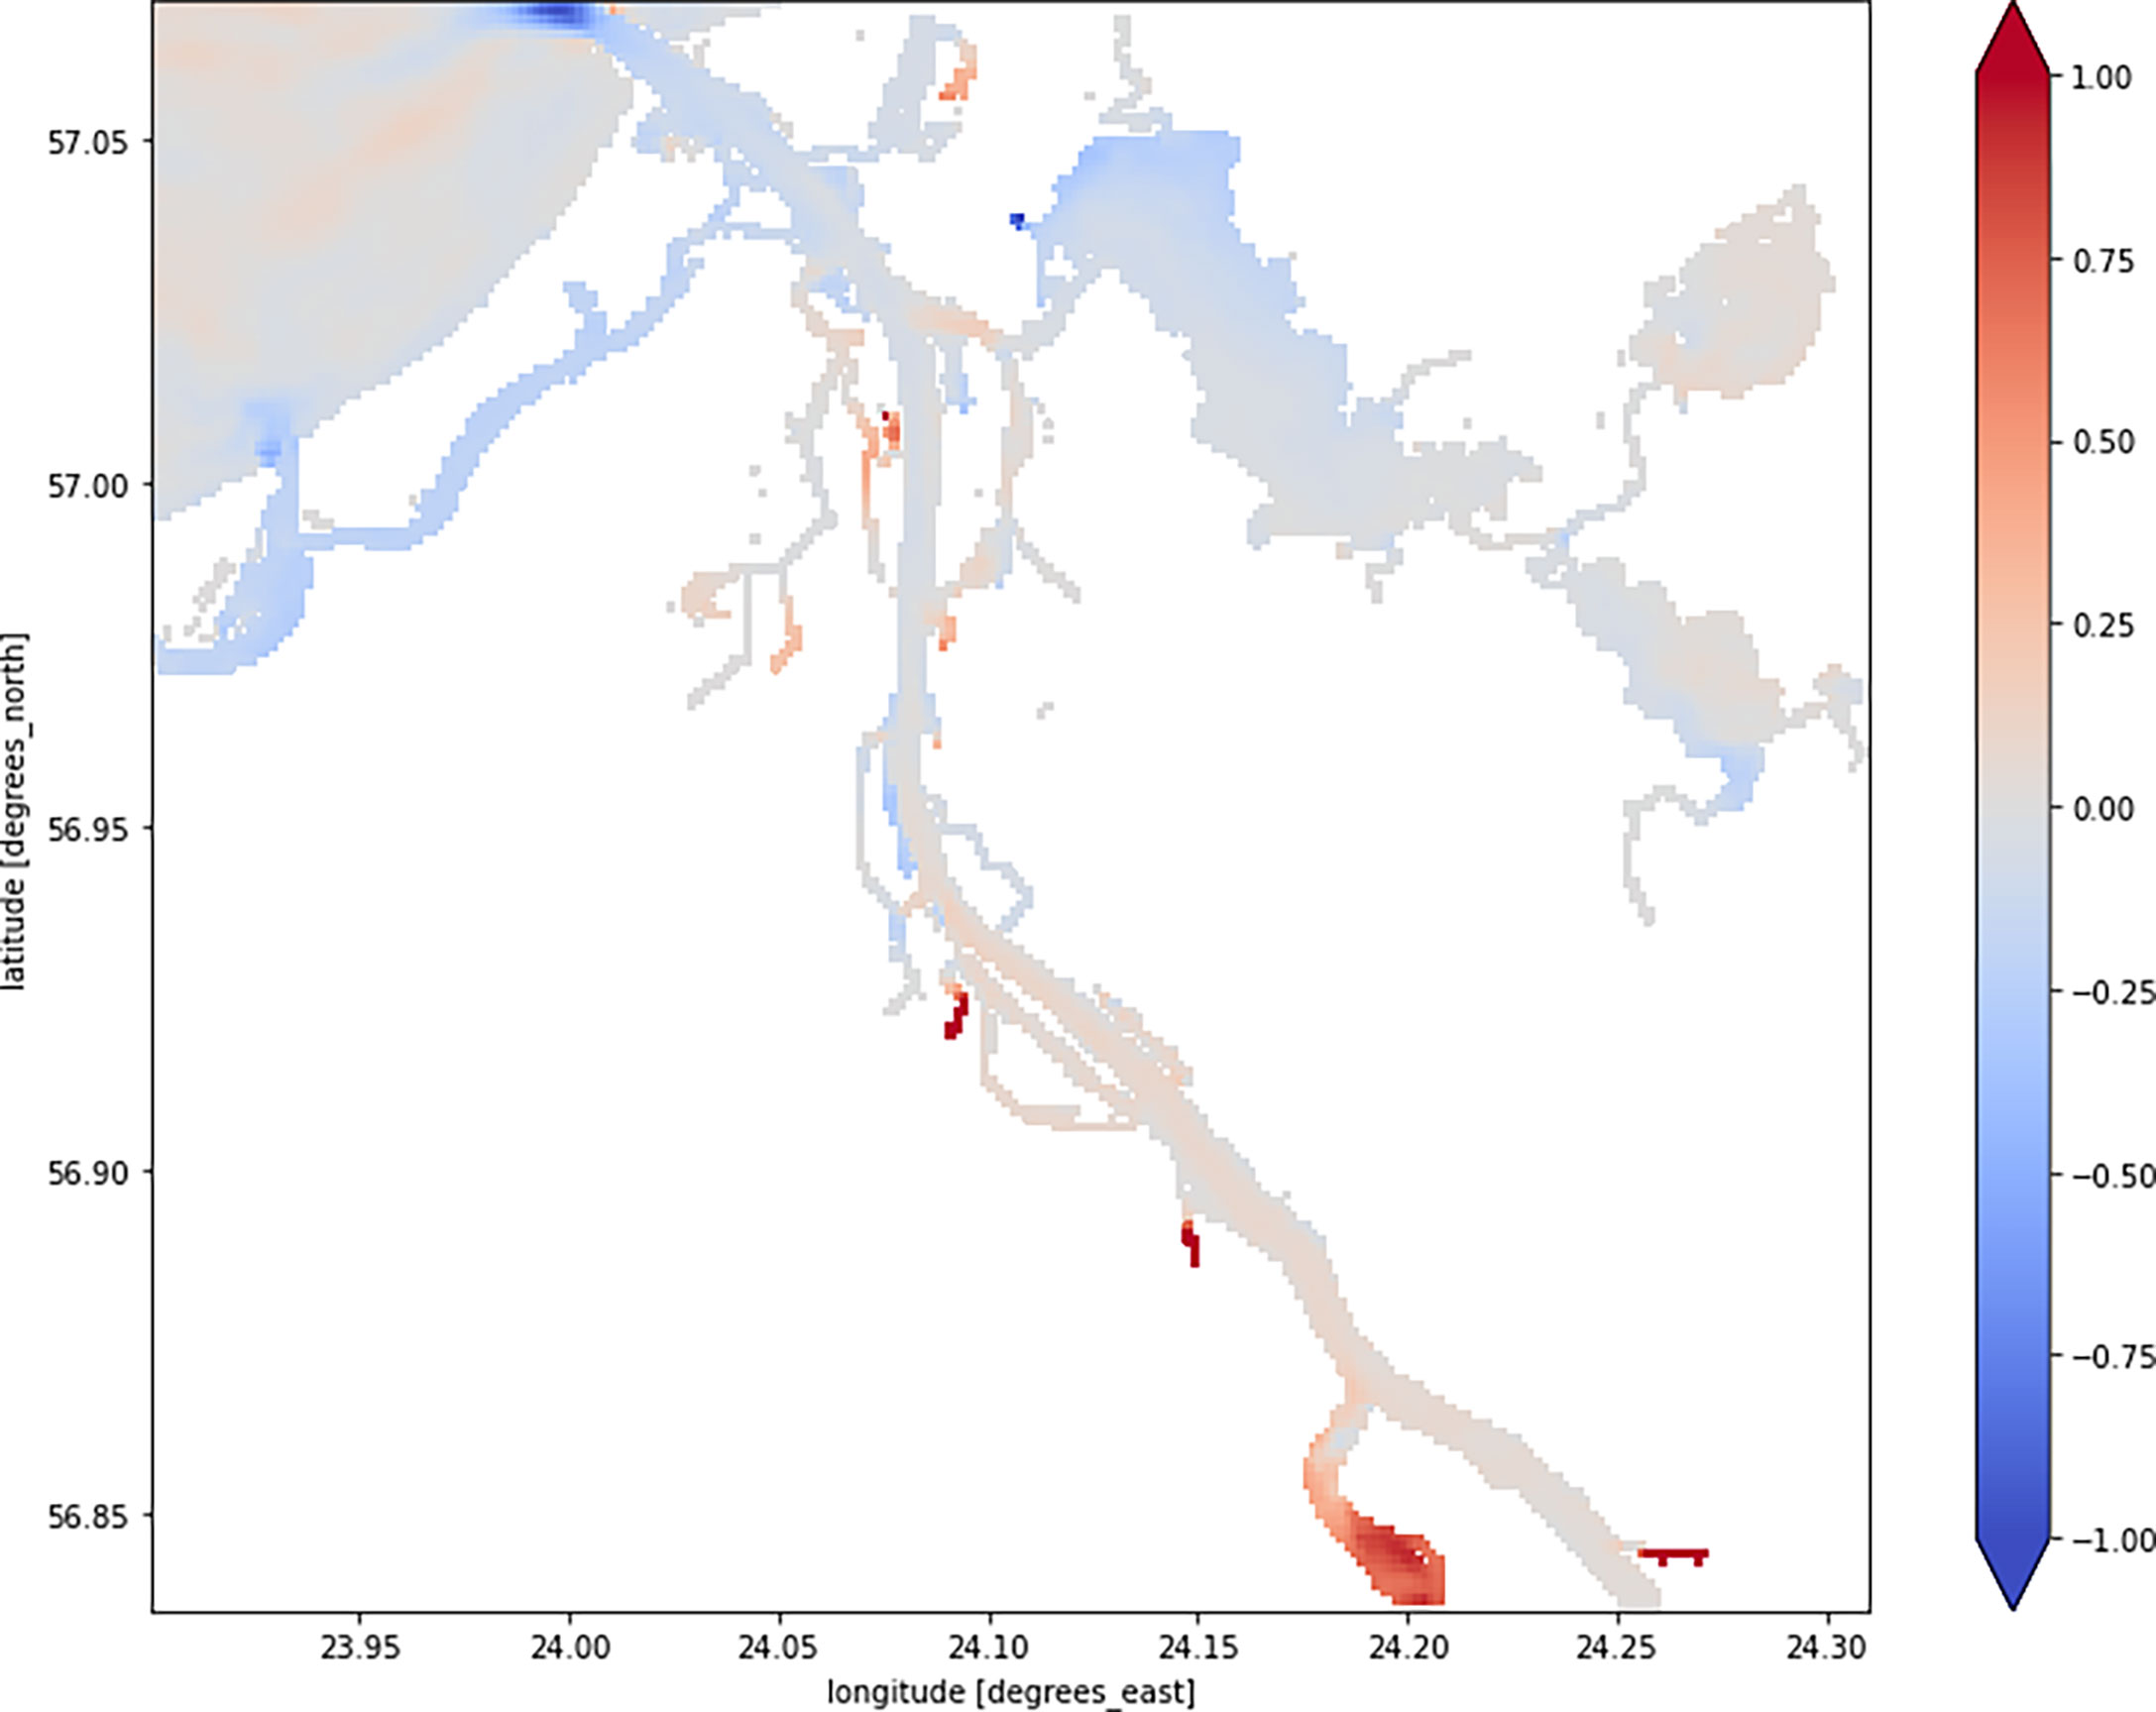
Figure 7 Average yearly difference of the calculated 300-μm MP surface concentration [in units (× 0.00001 g/m3)] in the estuary domain in 2018 between cases of the RHPS cycle (higher runoff in business hours and lower in other times) included and excluded applying the same weekly average release of MPs.
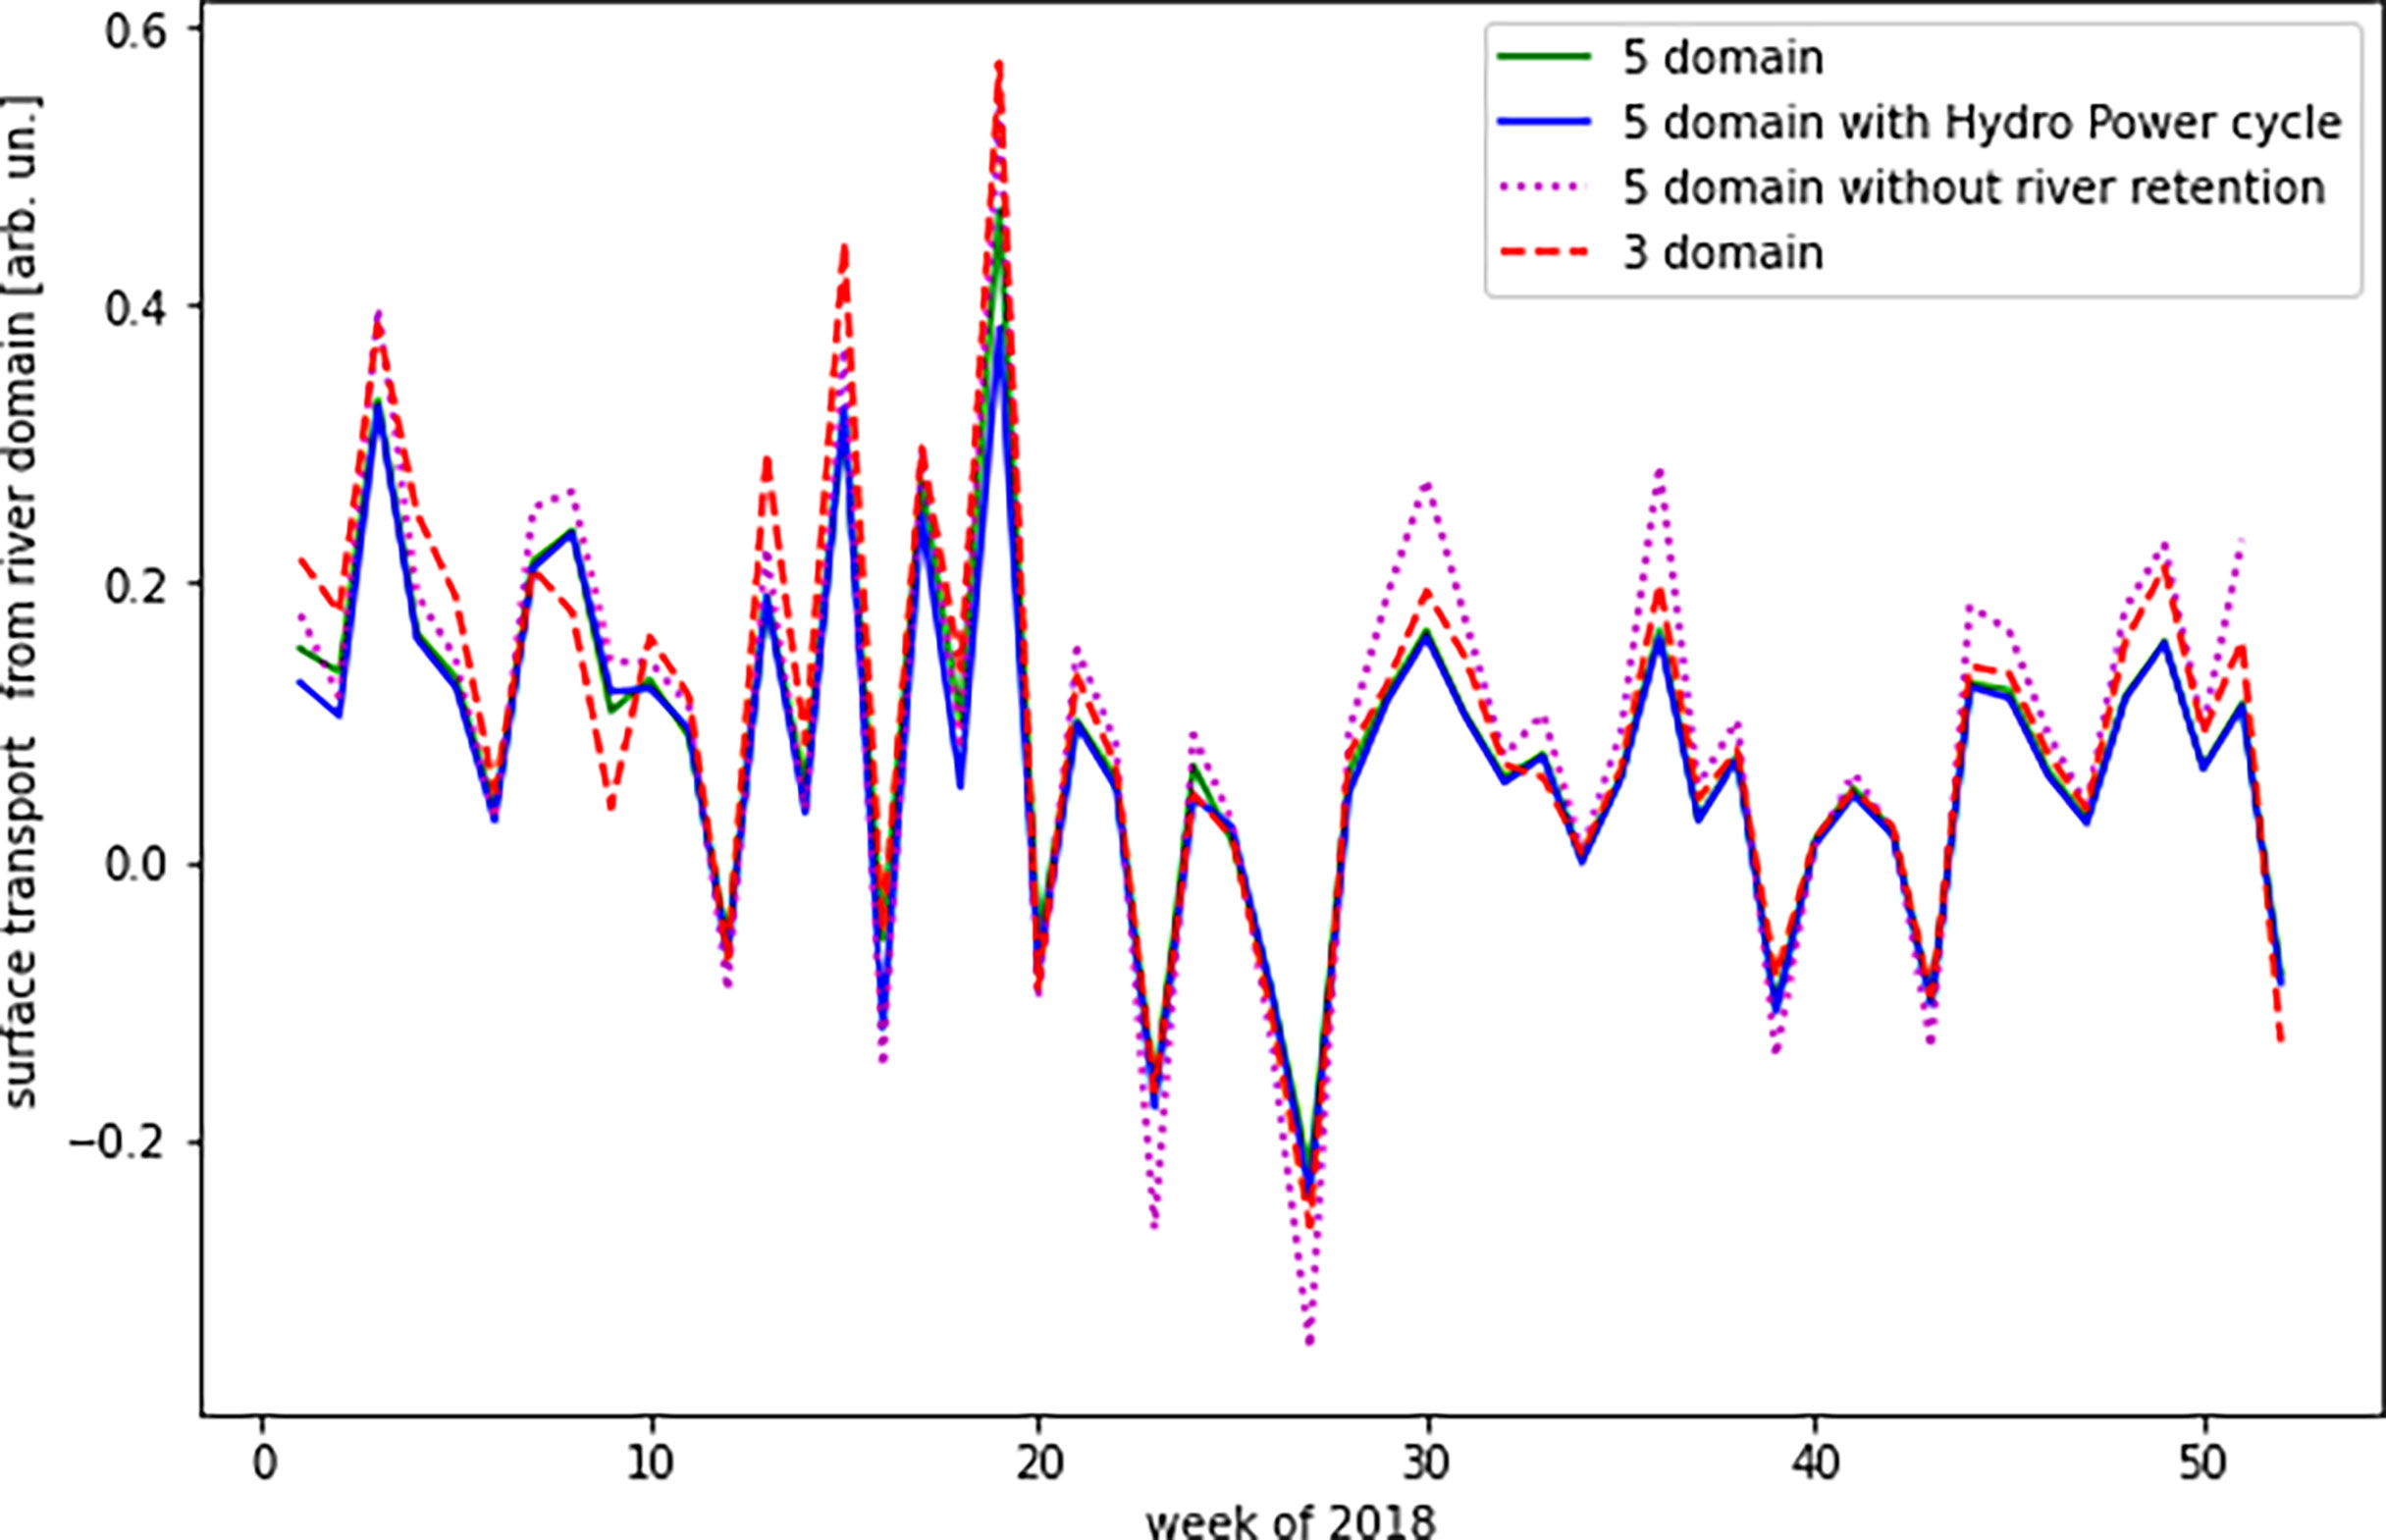
Figure 8 Average weekly northward surface transport of 300 μm particles at 57.07° latitude in the southern part of the Gulf of Riga in 2018.
The results of simulations of different variants were compared with MP observations. Only the MP fraction of the model with the largest size was considered, i.e., 300 μm particles, as the mesh size used in the observations was 0.3 mm. As expected, the highest observation and model values occurred near the Daugava outlet in the southern part of the Gulf of Riga (see Figure 9).
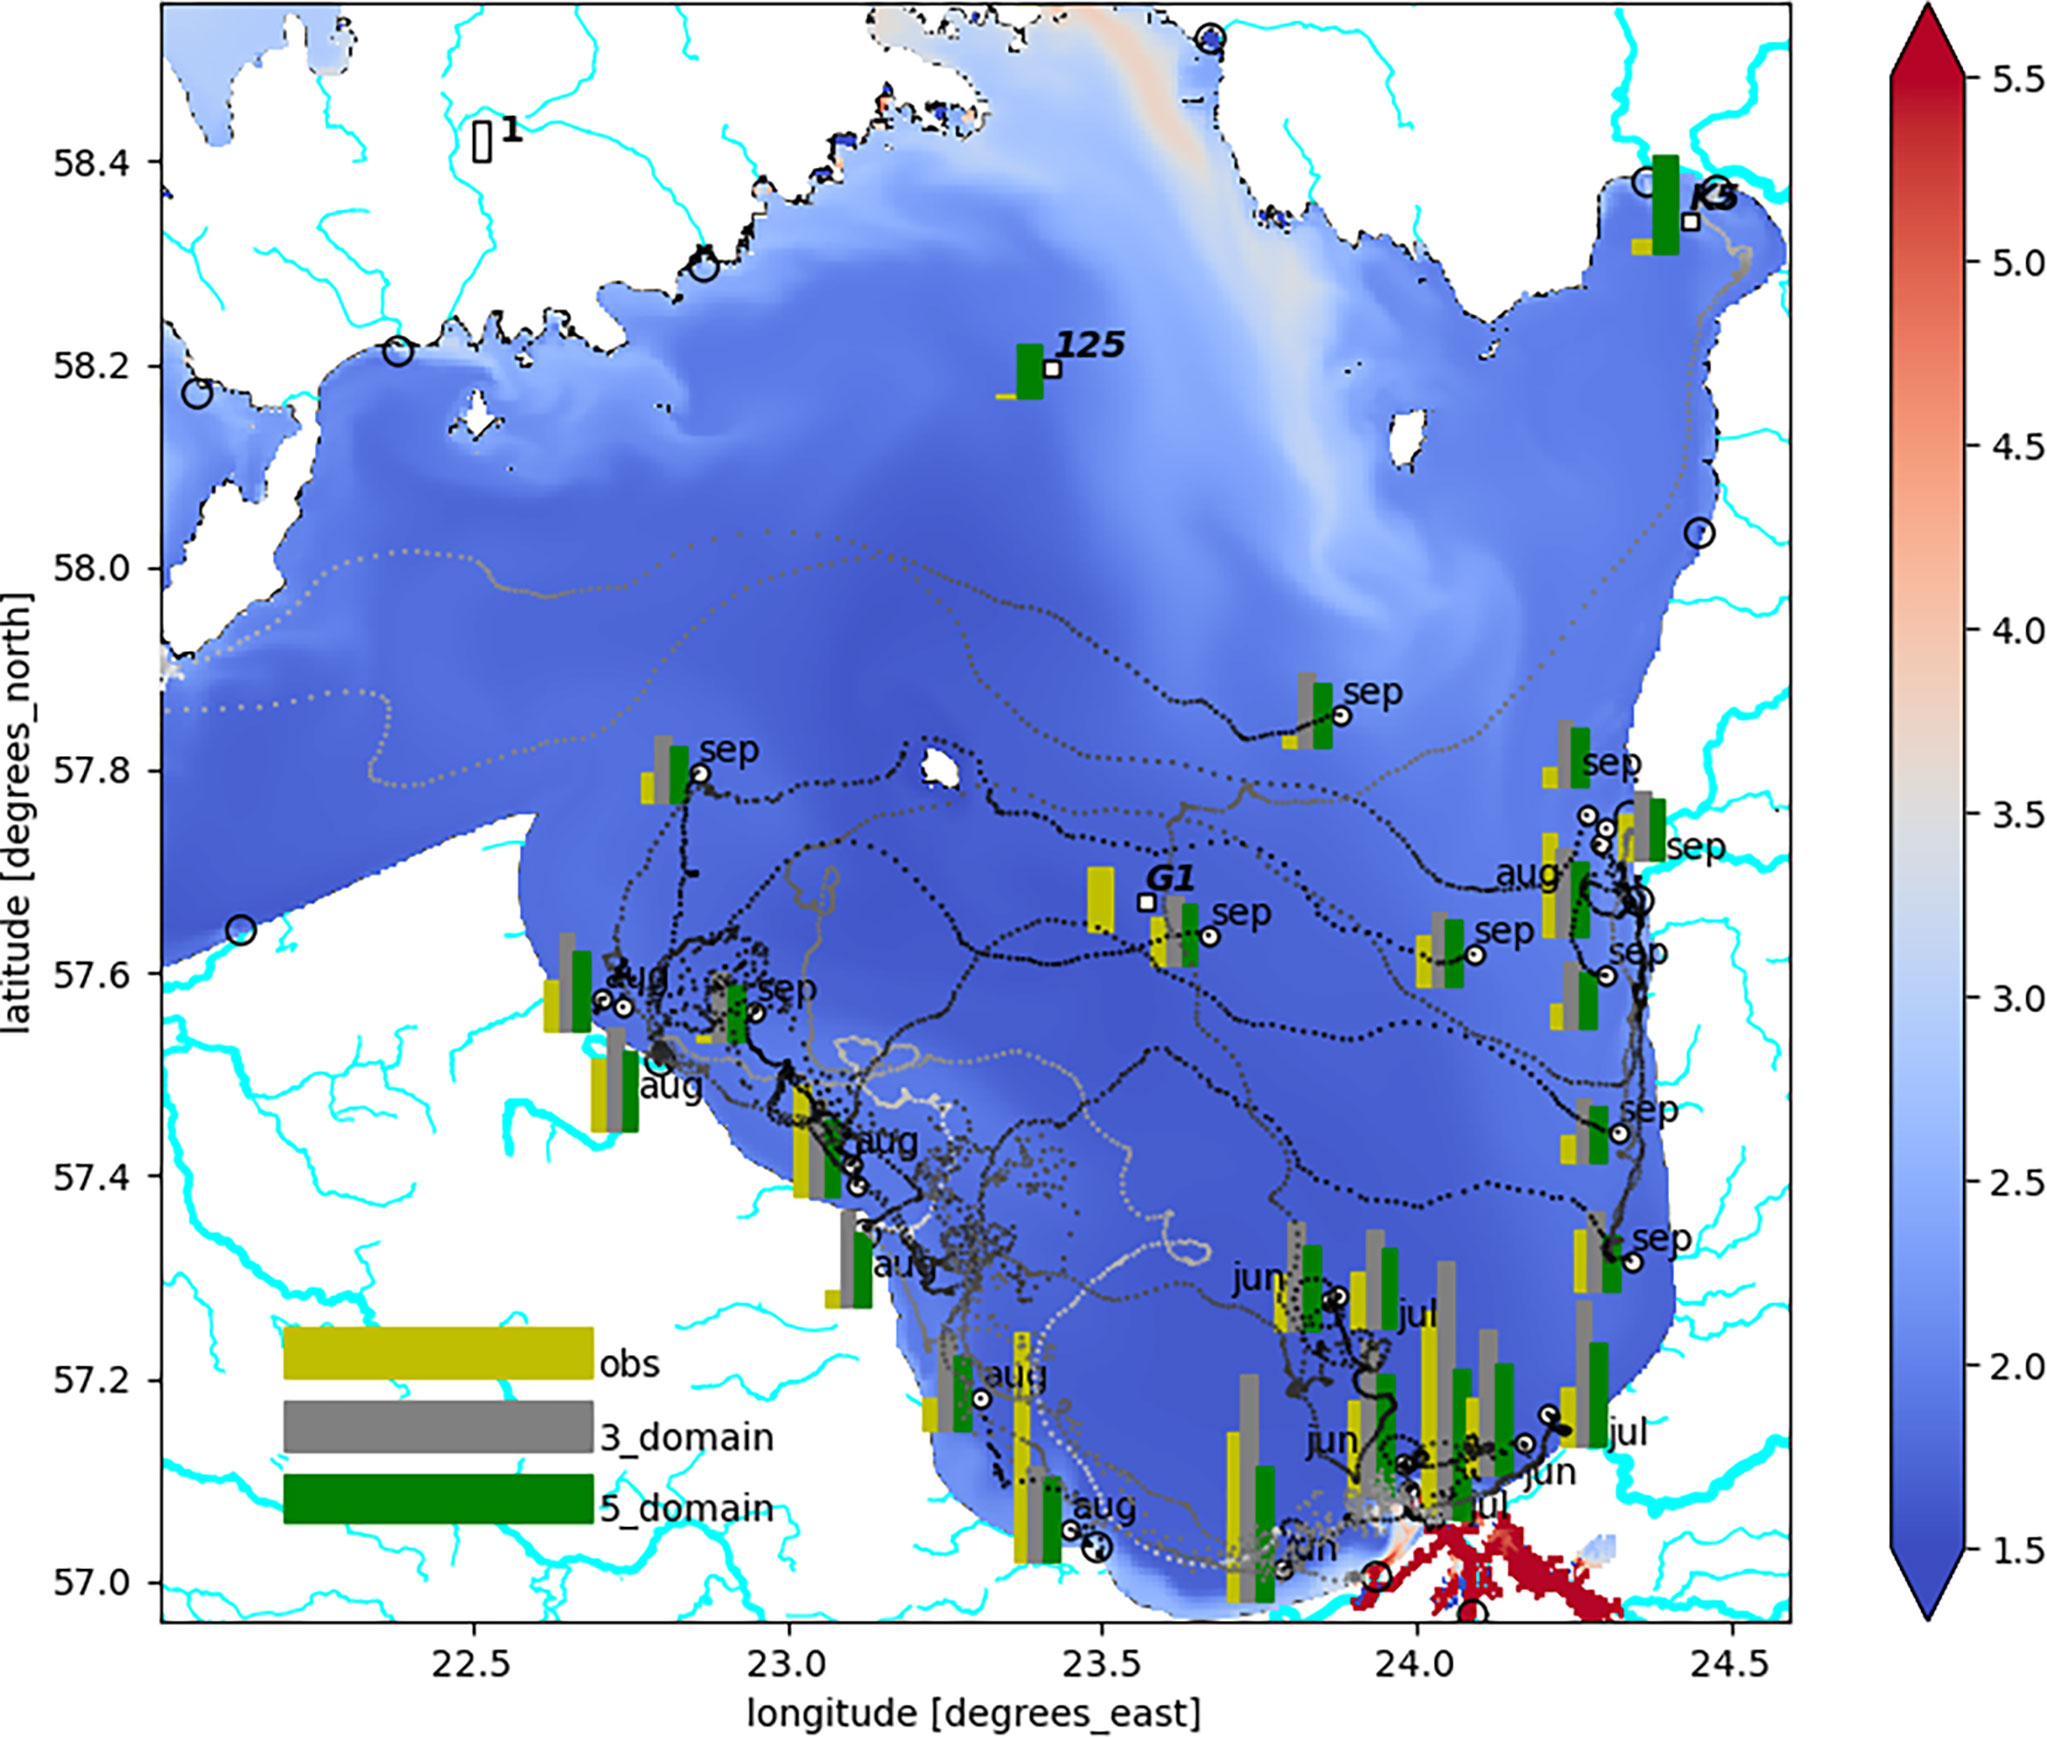
Figure 9 Map of MP observations and calculated values of 300 μm particles. The color map represents the calculated surface MP concentration (×0.00001 g/m3) on August 8, 2018. Stations with bold italic names represent the average value from the HELCOM dataset 2016–2019. Stations with the name of the month represent instantaneous observation data from the LIAE in the year 2018. Yellow bars are observed values, gray bars—three-domain setup, and green bars—five-domain setup. Dotted lines represent the estimated backtracking trajectory to a river source. Empty circles at the coast represent the location of river outlets in the HBM that are derived from the E-hype model.
In order to see the possible origin of MPs and traveling time, backward drift studies were examined. All the backtracks stemmed from the middle of the transect at 12:00 UTC of the observation day. In late spring and summer, there was usually a rather weak wind forcing resulting in long backtracking trajectories with characteristic inertial oscillations. Stronger currents occurred in September when two of the tracks started from the Baltic proper due to strong westerly winds (see Figures 9, 10). In general, the observed value of MPs decreased with the distance from the river source (see Figure 10). Also, the higher values of the observations correlated well with the higher average river load of the corresponding river, i.e., rivers with catchments in urbanized areas caused higher MP concentration. Most of the backtracks started from the Daugava River as it was the main freshwater source in the Gulf of Riga.
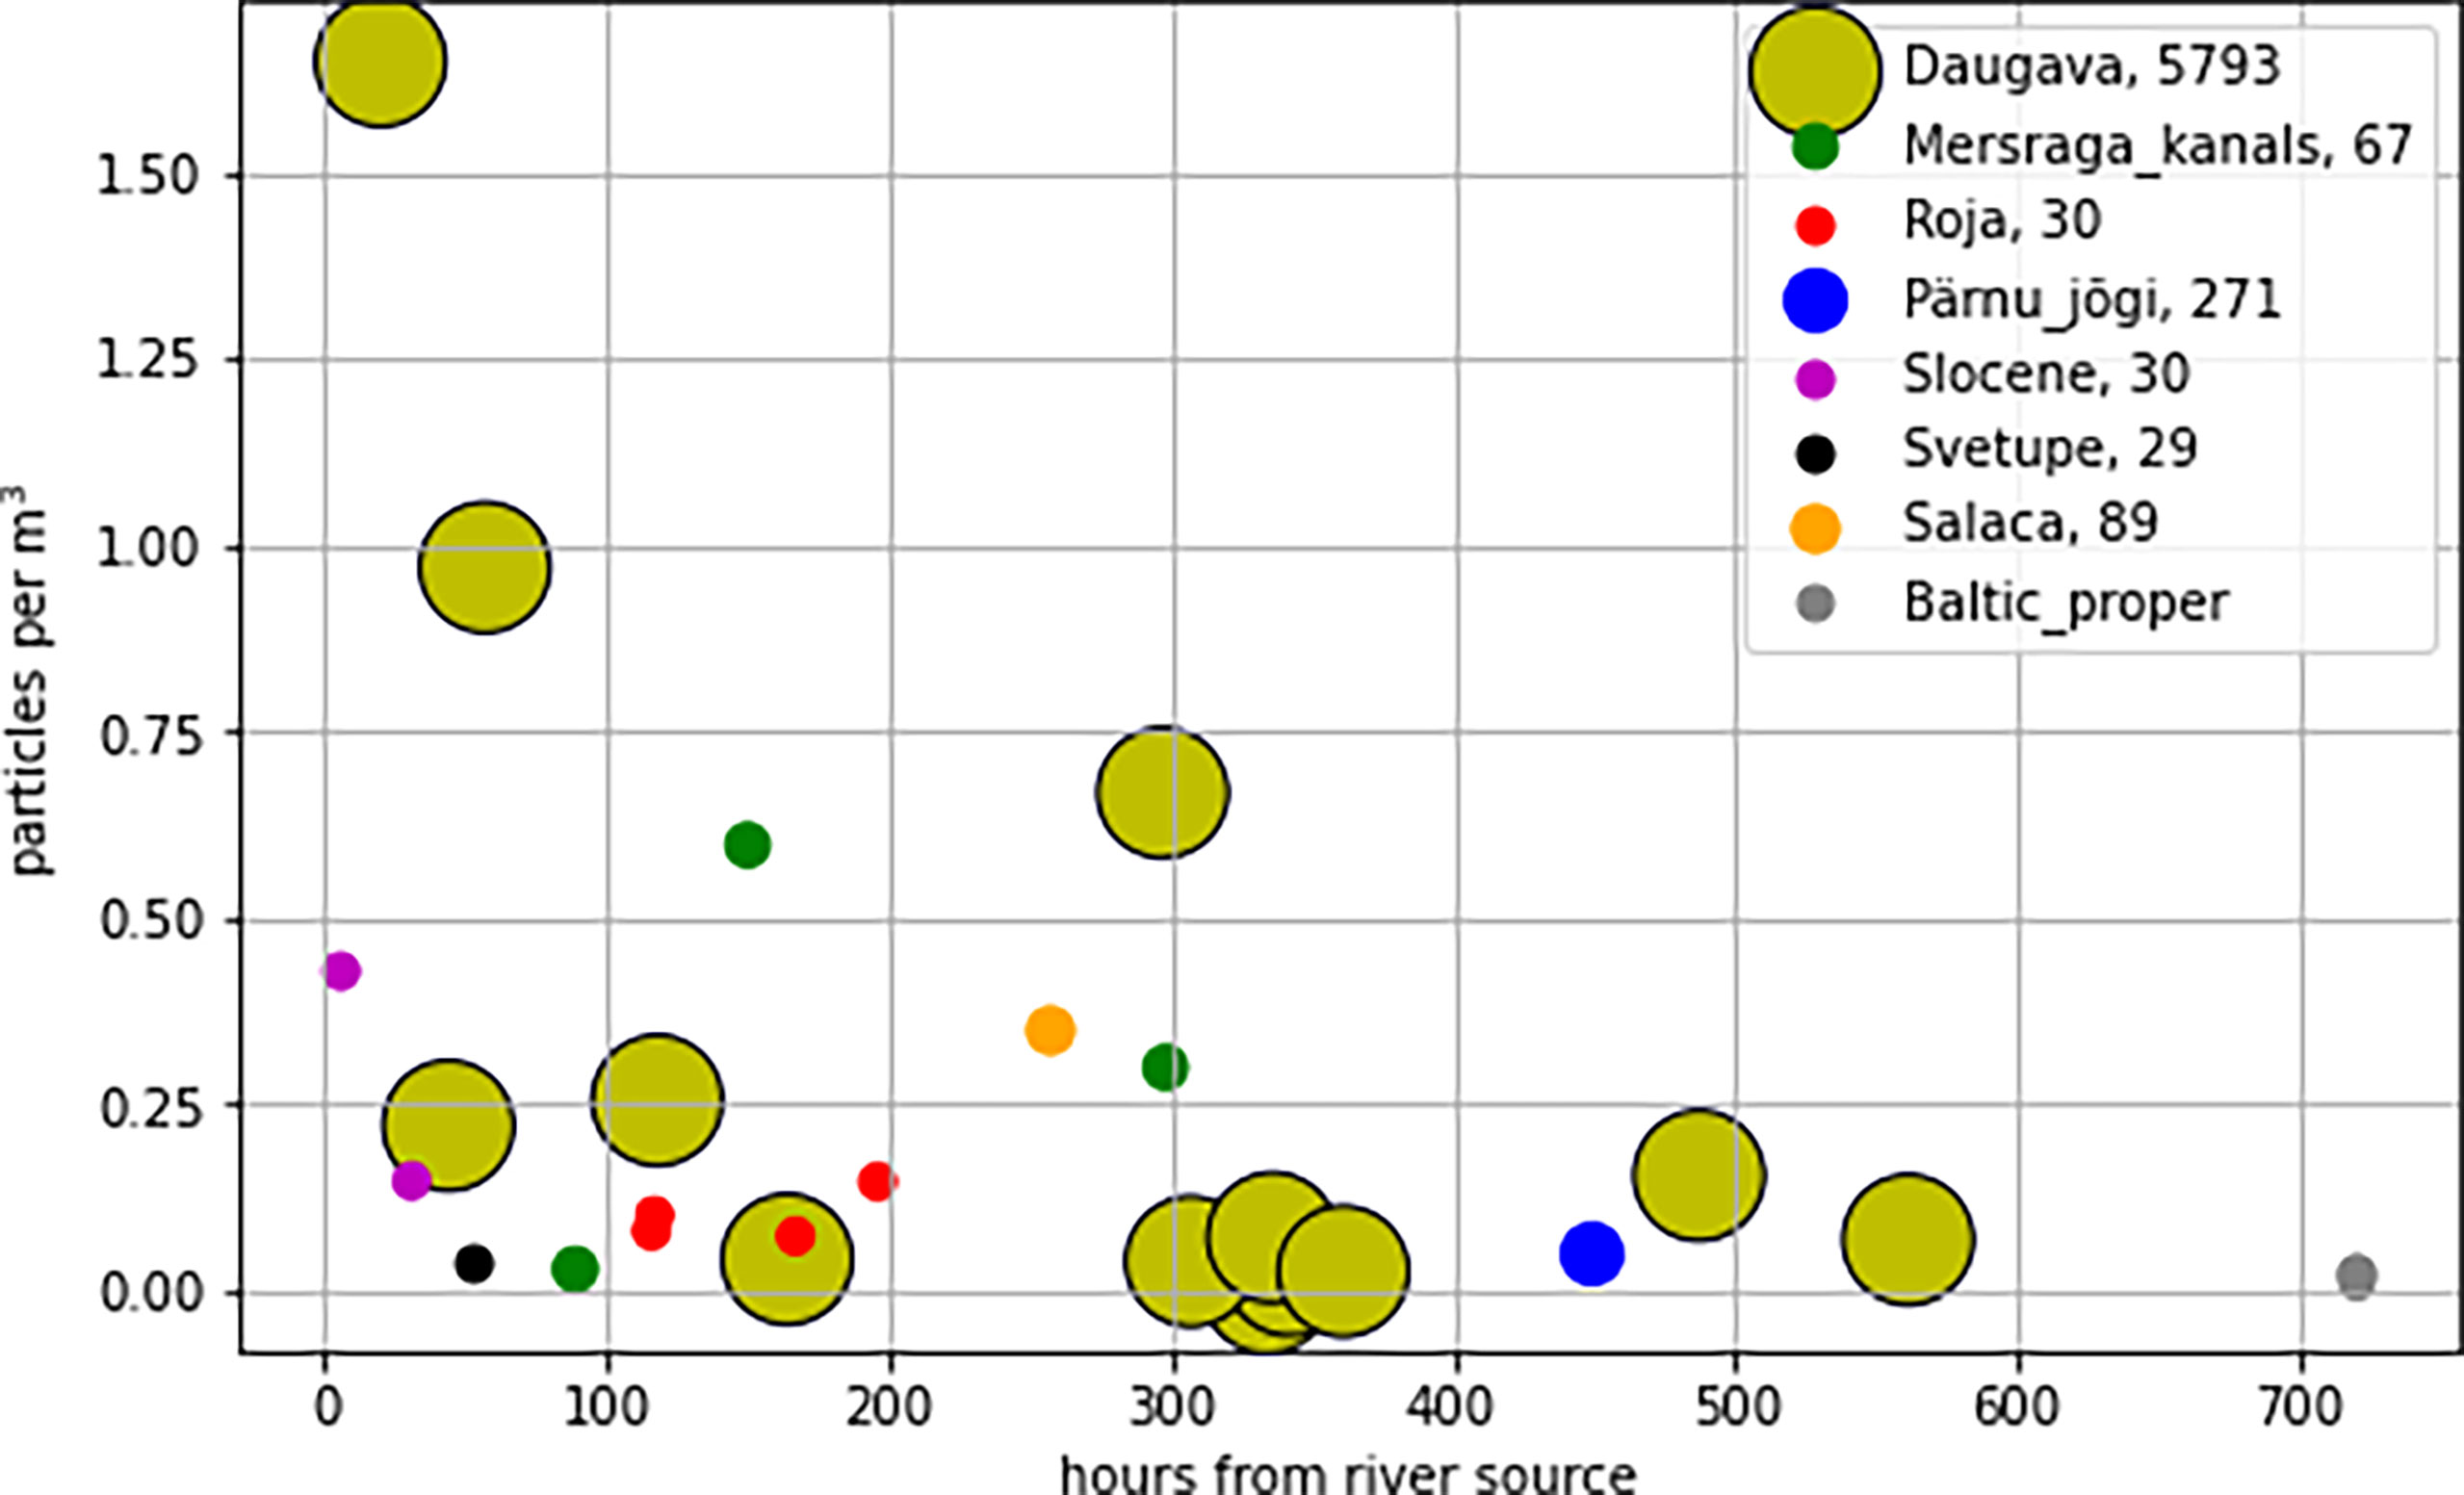
Figure 10 Observed concentration of MP fragments vs. duration of backtrack from expected river source shown in the legend. The size of the markers corresponds to the average MP load of that river for 300 μm particles [value in units of (×0.00001 g/s) is added in the legend].
Different model variants (v1–v7) were tested in order to see how the changes in the river domain influenced the results in the Gulf of Riga (see Table 1). Because there was a slight multiyear trend of accumulation of the largest size fraction of MP in the model (Murawski et al., 2022), the modeled MP concentration was higher for the longer runs from 2013. Hourly runoff variations of the Daugava River at the RHPS in variants v4, v5, v6, and v7 did not lead to notable changes in surface concentration in the Gulf of Riga (Figure 8). Variant v5 without biofouling in the estuary domain resulted in a higher concentration of MPs that were released in the Gulf of Riga, but it showed less correlation with the observations. The discharge of surface MPs by Daugava in this variant increased by up to 30% in the dry summer of 2018 but was negligibly small in the spring during higher river runoff. Variant v7 showed that the effect of sedimentation of MPs in the estuary domain had a negligible influence on the surface concentration in the Gulf of Riga. Presumably, these submerged heavier MP particles were unable to reach the surface layer. Slightly higher surface concentrations occurred only in shallow lakes. With the limited number of observations (25) used in the calculation, the correlation efficiency varied from 0.56 in v5 to 0.71 in v7. With a bilateral t-test, all of them reached a 99% significance level. However, observations of MPs had rather high local variability and sampling error as noted above. Hence, the number of observations was still insufficient to judge which model variant fits best. A much higher number of MP observations near the Daugava River mouth was required for the optimization of the model parameters in the estuary domain. Daugava River plumes of MPs were clearly expressed with the inclusion of the estuary domain (see Figure 11), whereas the three-domain variant had more coastal release of MPs from the rivers. Thus, the inclusion of highly resolved rivers was essential within an area influenced by rivers. Daugava and Lielupe River plumes were most clearly expressed during high river runoff in spring (see Figure 3).
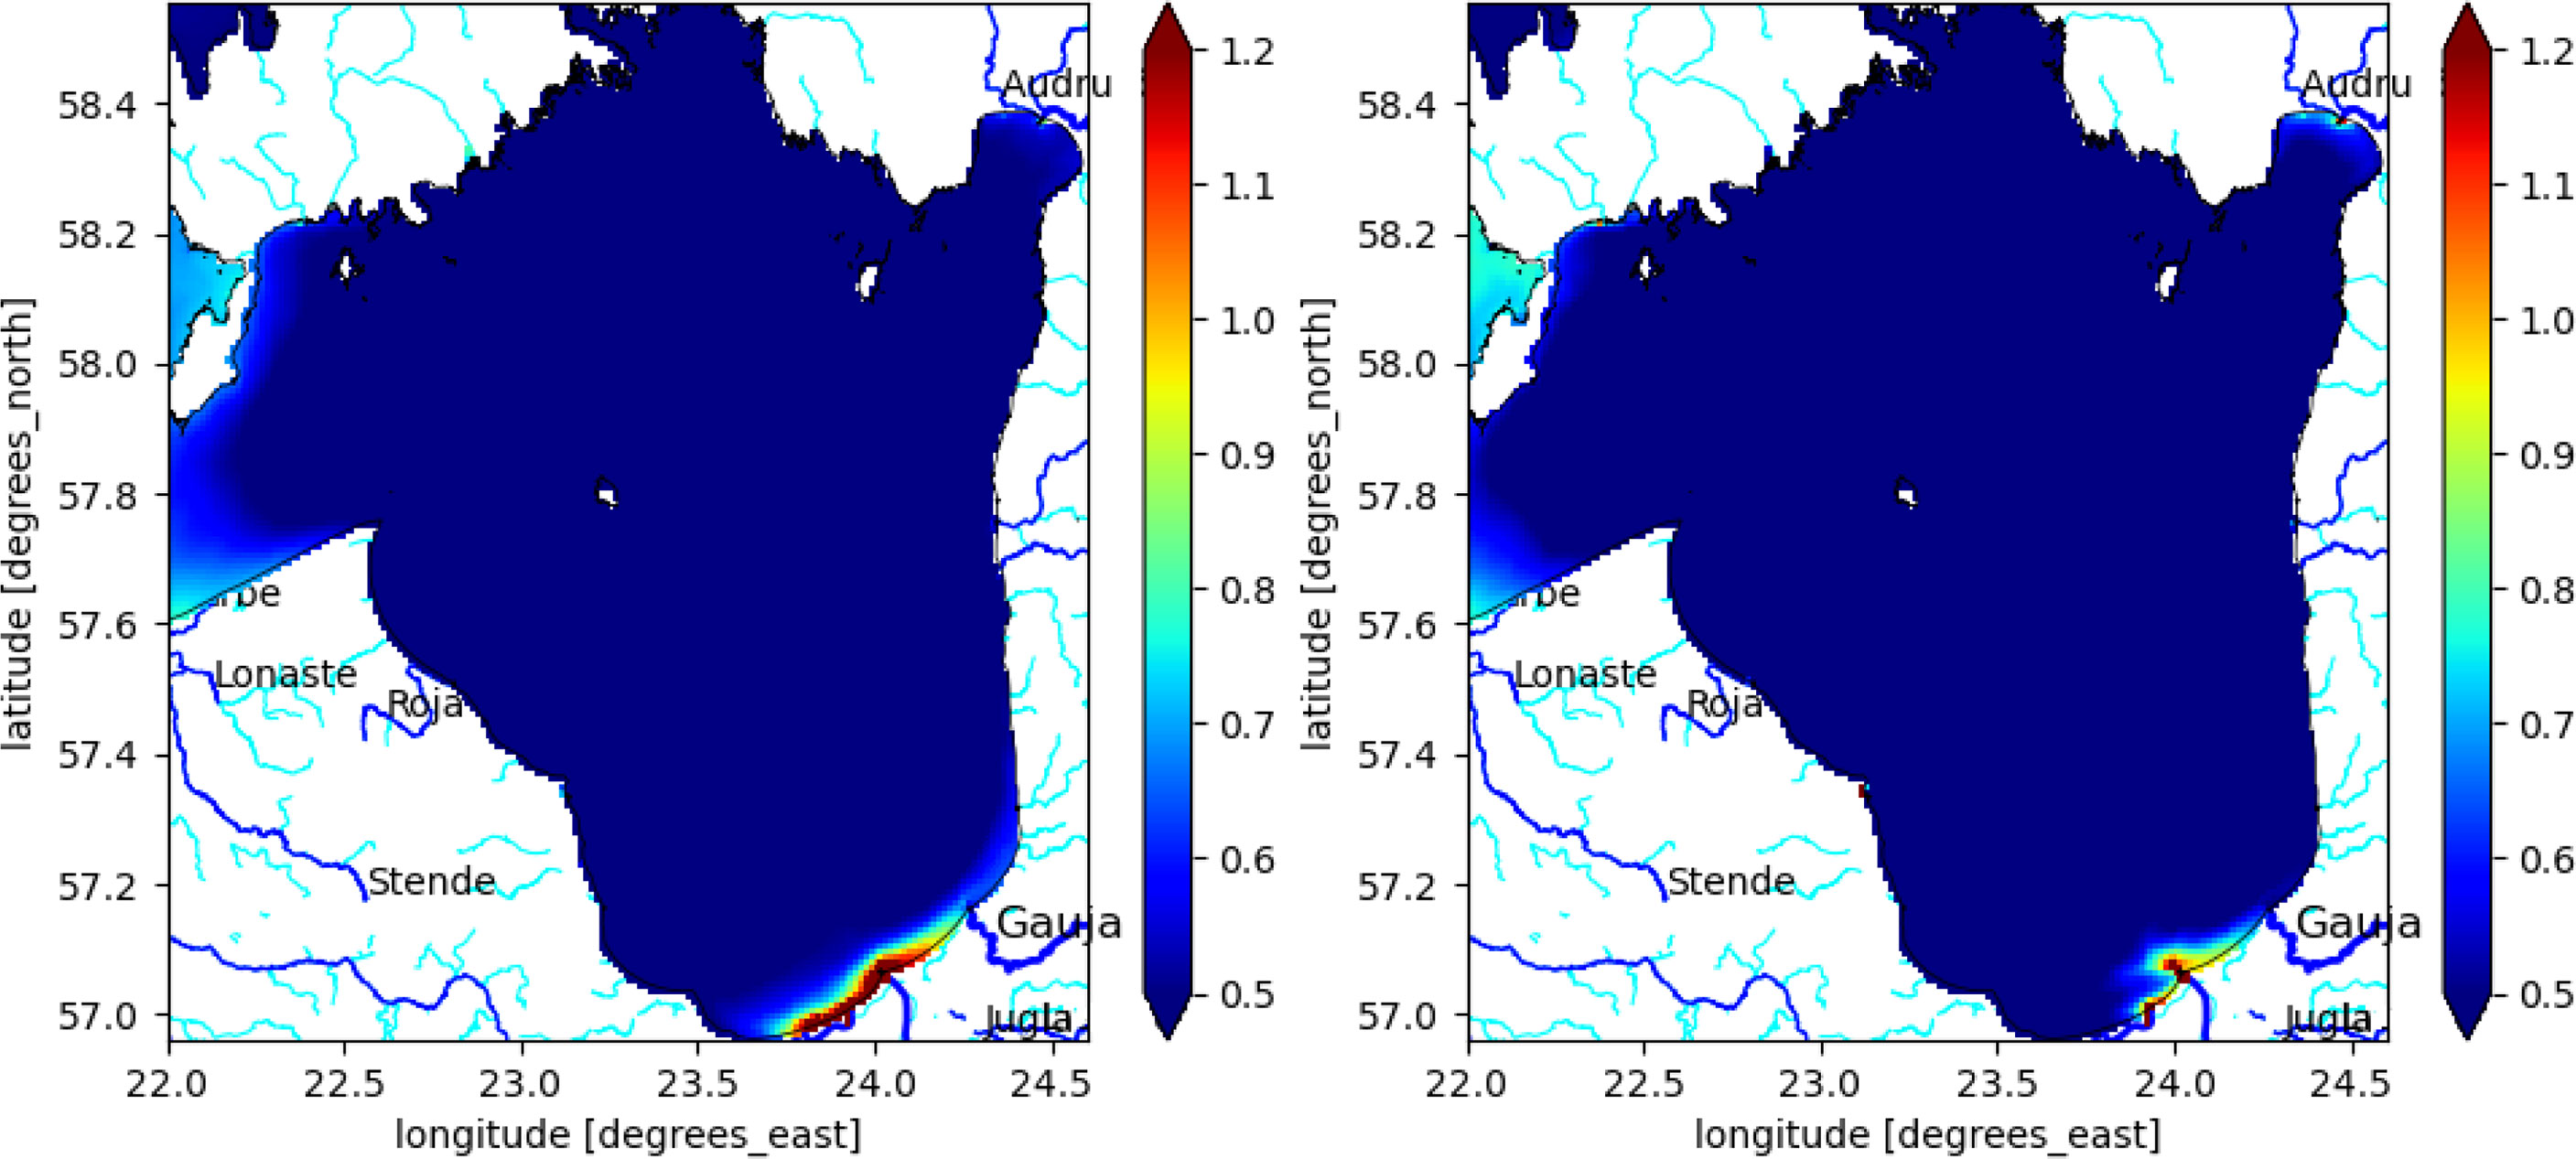
Figure 11 The average surface relative concentration of 42 μm particles in 2018 of the three-domain setup v3 (left) and the five-domain setup v6 (right). Scaling with respect to the average tracer value at the Daugava outlet area of 10 × 10 km² centered at the outlet point, i.e., the relative concentration is set to 1 at the Daugava outlet area.
There were also MP observations by TalTech in the northern part of the Gulf of Riga and were available in the HELCOM database in the years 2016–2019 (see Figure 9). Because the data from both sources did not necessarily have the same methodology, they were treated separately. The analyzed data included nine MP observations in station K5 and three observations in stations 125 and G1. The observed MP concentration was higher in station K5 than in station 125 as it was situated in Parnu Bay with the influence of the River Parnu and Parnu City. Station G1 had one large observed MP value in 2014, but the model with five domains did not cover this year.
As shown in Schernewski et al. (2021), nearly half of the total MPs were released from overflow events in WWTPs or runoffs from storm surges. The capacity of WWTPs is occasionally insufficient to hold all wastewater and part of the untreated wastewater has to be released directly; otherwise, sewer overflow occurs. In such a case, untreated wastewater goes directly into the river or sea. For the Riga WWTP, the untreated wastewater entered Daugava at the Voleri River coast. The heavy load of WWTP facilities occurred during intense precipitation events in an urban environment. Therefore, the precipitation records at the University of Latvia station in Riga (http://www.meteo.lv) were checked for the presence of an abnormal precipitation rate. Heavy rains usually occurred during cloudbursts in the middle of summer. In the year 2018, which was relatively dry, there was just one such event when the hourly precipitation rate was above the threshold of 1 cm/h and reached 17.2 mm/h on July 13, 2018, at 12:00 UTC at the station. Hence, the Lagrangian drift was performed from this time and position to find the possible pathways of MPs. It was found that microfilm observations by the LIAE (Aigars et al., 2021) in the summer of 2018 correlated very well with the Lagrangian drift trajectories that ended up mostly at the western coast 40 km from the Daugava outlet (see Figure 12). That could explain the very high concentration of the observed microfilms near the sparsely populated river basin at the Kemeri National Park. Because unfiltered water contains larger particles, it takes longer for them as compared to filtered MP fragments to build enough biofilm for sinking and they can travel for even a month.
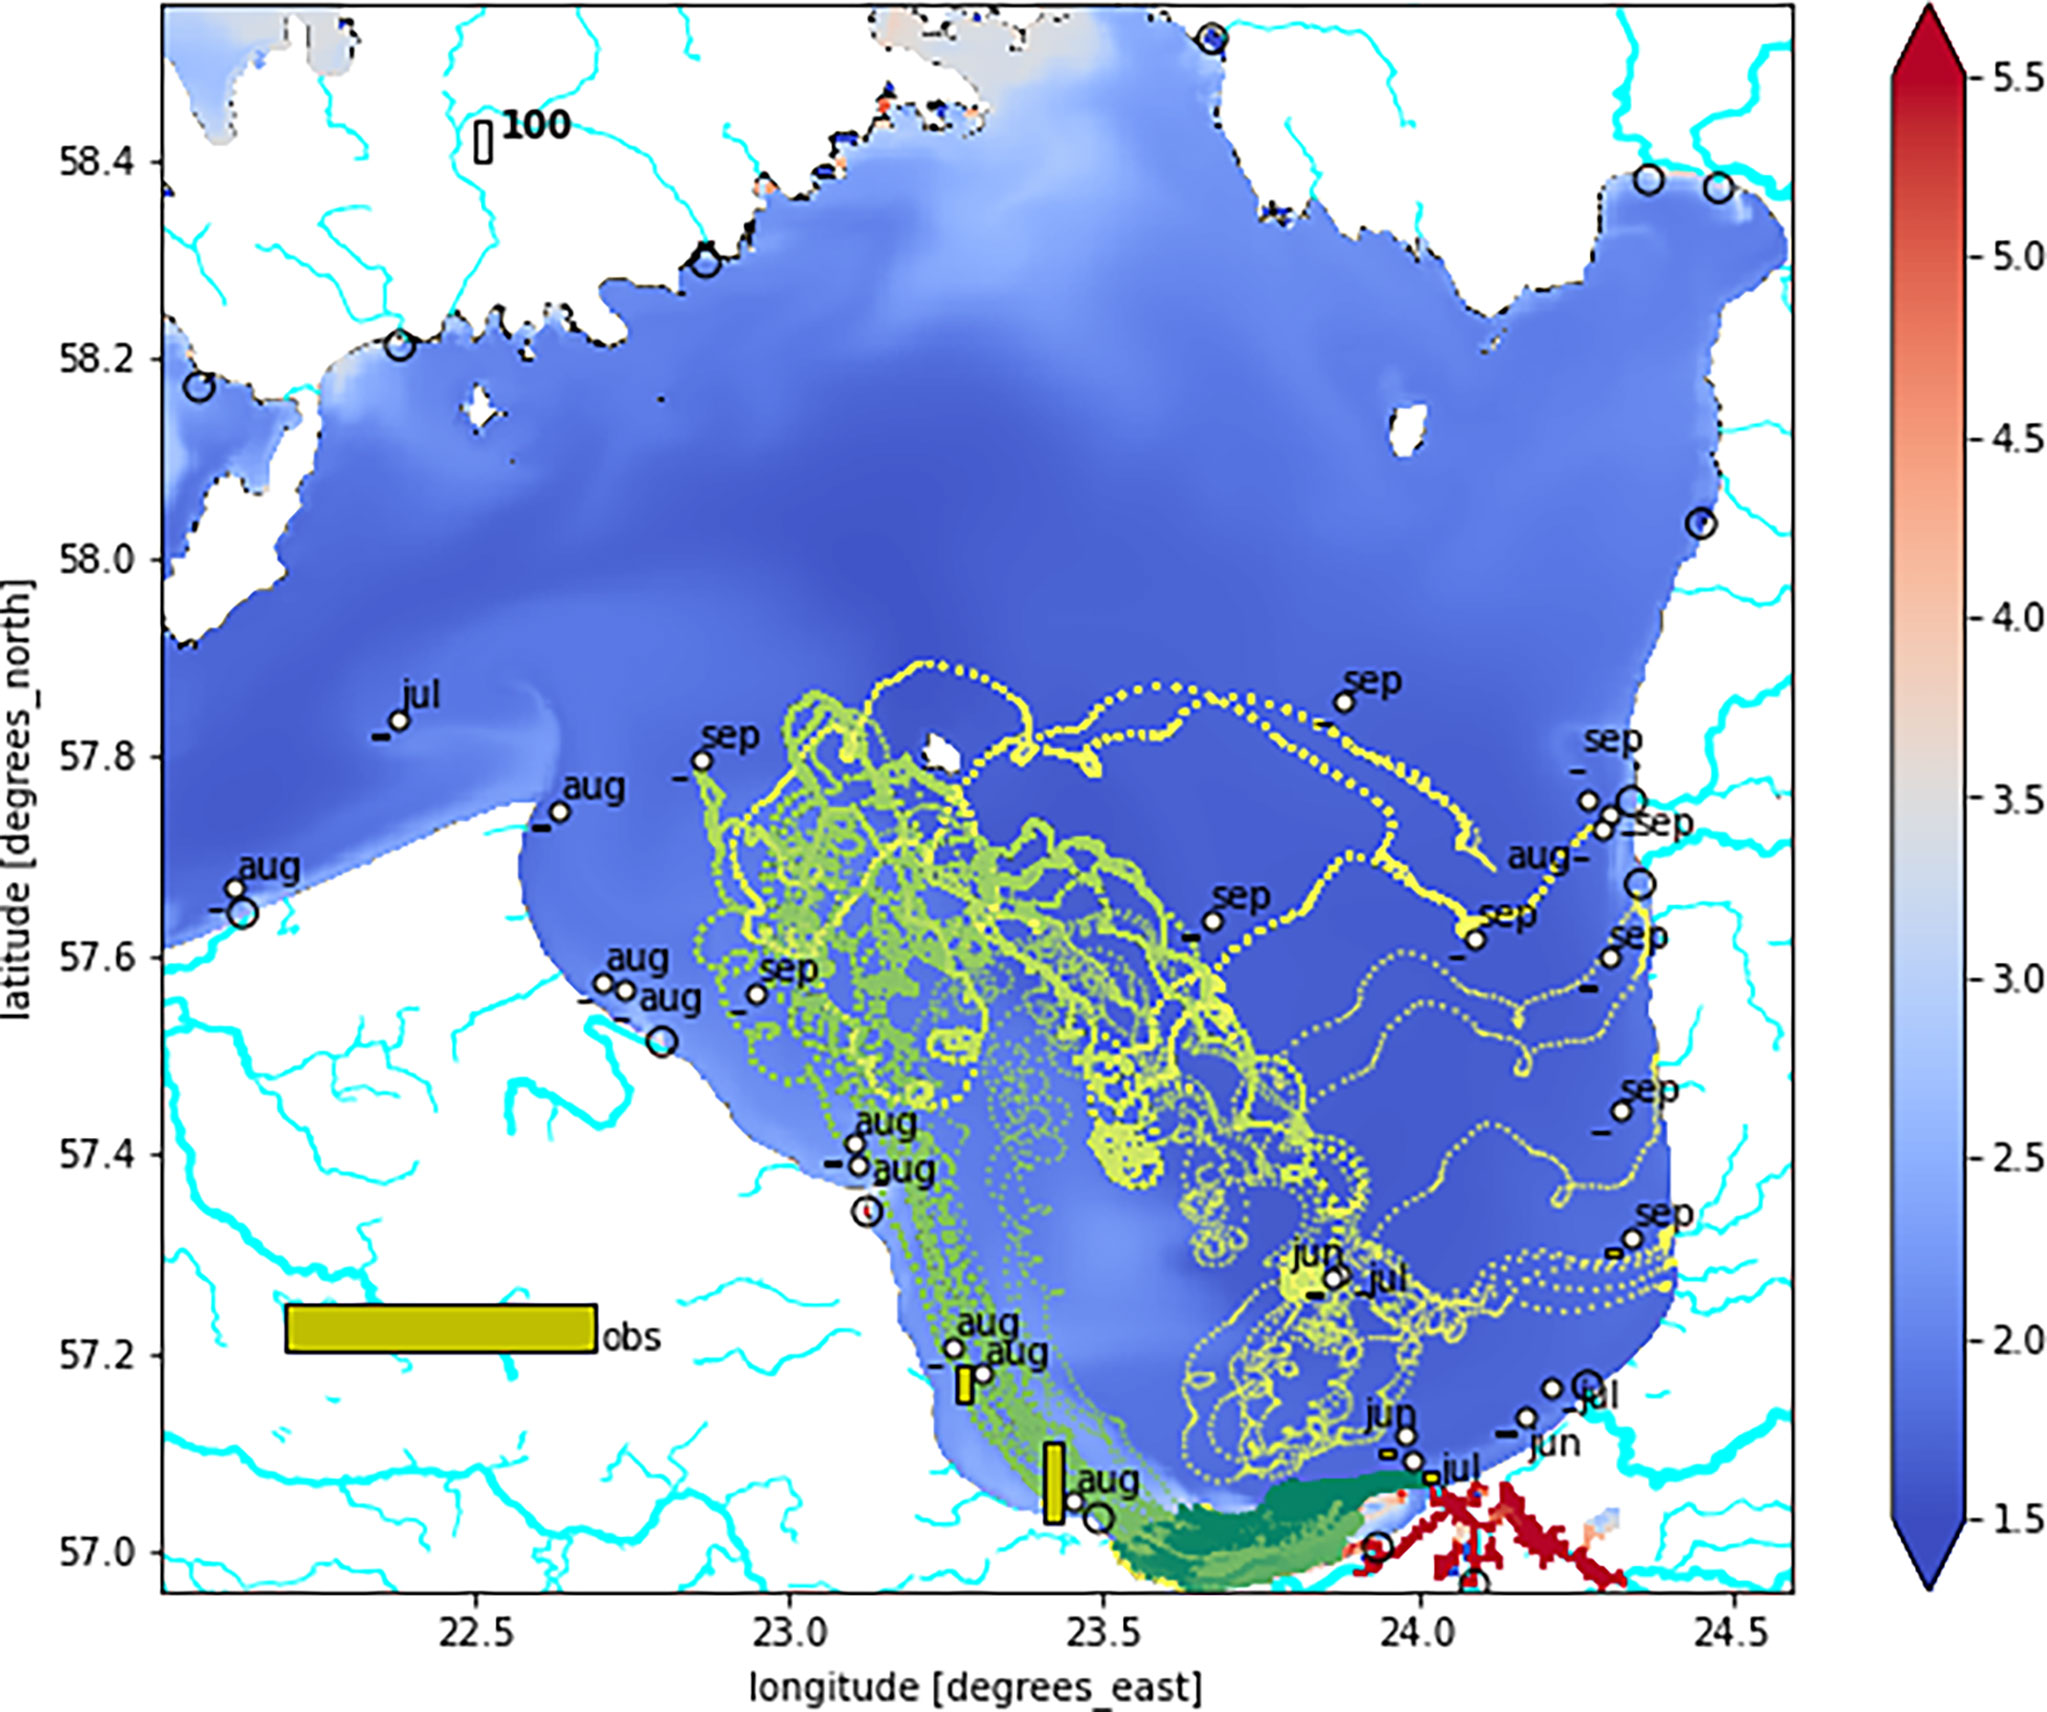
Figure 12 Lagrangian drift trajectories from the “flush” event of July 13, 2018, when hourly precipitation in the University of Latvia station in Riga exceeded 17 mm/h. Trajectories start from the Daugava outlet at the same hour. Most of the trajectories end up 40 km west from the Daugava outlet (dark green curves). More yellow parts of the other curves are later stages of the drift. The bars denote the concentration of the observed microfilms per cubic meter (Aigars et al., 2021). Observations in August (“aug”) took place during August 10–12, 2018. Observation in July (“jul”) was just before the day of the flush event resulting in a rather low concentration in front of the Daugava outlet. The color map shows the calculated surface MP concentration of 300 μm particles (×0.00001 g/m3) on August 3, 2018.
The dynamic two-way nesting of an ocean circulation model enables a seamless transition from coastal scales to open-sea scales. The performance of sea level and currents is much improved when moving from the standalone setup to two-way dynamic nesting because inflow currents are better represented in the nested model. There are other possibilities to combine coastal and open-sea scales in the models, e.g., by using unstructured grids. However, they are still rarely used in operational forecasts due to less elaborated parallelization and stability problems. In the case of two-way nesting in the HBM, the speed and stability of simulations of the Baltic Sea–North Sea are not much dependent on whether the coastal estuary domain is included or not. This aspect suggests that it is better to combine open sea and coastal areas in a single model rather than modeling them separately, e.g., in operational models.
MP simulations show that changes in biofouling regime in the river estuary can notably change the MP concentration in the open sea. The retention rate in the estuary domain varies depending on the runoff of the Daugava and Lielupe rivers. During the period with high runoff such as in spring, MPs can travel from the RHPS to the Daugava outlet in less than 1 day and the retention rate is negligible. However, the retention rate can reach about 30% for surface MP fraction of 300 μm particles in a dry summer such as in 2018. Even a higher retention rate is achieved for smaller MPs with a particle size of 42 μm. MPs that travel through the lakes into the Daugava River can spend even a month there during the summer, leading to almost complete retention. The temporal change of river inflow, e.g., by changing the regime at the RHPS, does not bring notable changes into open seas, i.e., the cumulative discharge of MPs on a weekly scale is important. The length of the Lielupe River included in the estuary domain is just about 5 km which is not enough for notable retention of the largest MP particles there in the model.
Backtracking from the observations in the Gulf of Riga confirms that the concentration of MPs decreases as the distance to a corresponding river source increases. Therefore, a higher concentration in the Gulf of Riga occurs in the southern part near the estuaries of the major rivers Daugava and Lielupe which have higher concentrations of MPs.
Sewer overflow events at WWTPs are very important for the overall release of MPs into the open seas. These events are likely to happen during cloud bursts occurring in urbanized environments. If this environment is close to the coastline, then MPs could be released directly into the sea or nearby waters. The threshold depends on the specific maximal capacity of each WWTP. Nowadays, WWTPs are steadily improved, leading to potentially less sewer overflows in the future.
River estuaries typically show higher variability of MPs than the open seas. High variability of MPs in the river domain was demonstrated in the Warnow River (Schernewski et al., 2021). Most of the variations in MP concentration occurred near WWTPs. Schernewski et al. (2021) showed also a high retention rate in the river close to these WWTPs. The current configuration of the model assumed that freshwater sources were considered also as sources of MPs which may not be the case for real coastal systems, and comparison with observations was not straightforward. The Daugava and Lielupe estuaries are connected by the Bullupe River, where the main WWTP of Riga is situated. The Bullupe River (Figure 1, right) is relatively deep at about 9 m, and it can have a notable flow rate depending on the winds, Lielupe runoff, and runoff at the RHPS. Hence, it is important to keep a high resolution of the Daugava, Lielupe, and Bullupe rivers in the next upgrade of the model, where WWTPs will be treated as MP sources.
The transition of MPs from coastal river estuaries to open seas was studied with a three-dimensional model using two-way dynamic nesting. The system of the North Sea–Baltic Sea–Gulf of Riga–Daugava estuary is considered as an example with a horizontal resolution of up to 0.05 nm in the Daugava–Lielupe River estuaries. The model was verified with observations in the estuary domain including sea level and flow observations that demonstrated an advantage of the two-way nested setup over either the standalone open-sea or estuary setups. The two-way nested river estuary domain enabled us to consider river plumes that were present in cases of high river runoff. Thus, it changed the MP distribution of the open sea in the vicinity of river outlets. The results of MPs were compared with existing observations of MPs in the Gulf of Riga. The simulations and observations in the year 2018 confirmed that the concentration of MPs in the Gulf of Riga decreased as the drift time from the Daugava estuary increased. Furthermore, river retention of MPs in the estuary domain improved MP correlation with experimental data in the Gulf of Riga. However, a larger number of observations near the Daugava River outlet are necessary to verify additional parameterizations of MPs in the estuary domain. A large part of MPs are released in sewer overflow events in WWTPs with a considerable concentration of microfilms, showing the importance of Lagrangian drift assessments.
The raw data supporting the conclusions of this article will be made available by the authors, without undue reservation.
Modeling of MPs in the Baltic Sea was developed by JM. VF applied the model for the North Sea–Baltic Sea system that includes the river estuary, analyzed the model performance in finer-grid domains, and made comparisons with MP observations. JS was responsible for the physical concept of MP modeling, source mapping of MP, and working with MP observations. All authors contributed to the article and approved the submitted version.
Authors are grateful to be supported by the Horizon 2020 project “Cleaning Litter by developing and Applying Innovative Methods in European seas (CLAIM)” under Grant Agreement ID 774586. VF is also grateful to be supported by the Latvian Fundamental and Applied Research Project lzp-2018/1-0162.
The authors declare that the research was conducted in the absence of any commercial or financial relationships that could be construed as a potential conflict of interest.
All claims expressed in this article are solely those of the authors and do not necessarily represent those of their affiliated organizations, or those of the publisher, the editors and the reviewers. Any product that may be evaluated in this article, or claim that may be made by its manufacturer, is not guaranteed or endorsed by the publisher.
Øyvind B., Allen A. A. (2008). An Operational Search and Rescue Model for the Norwegian Sea and the North Sea. J. Mar. Syst. 69, 99–113. doi: 10.1016/j.jmarsys.2007.02.010
Øyvind B., Bekkvik T. C., Wettre C., Ommundsen A. (2011). Baktrak: Backtracking Drifting Objects Using an Iterative Algorithm With a Forward Trajectory Model. Ocean Dynamics 62, 239–252. doi: 10.48550/arXiv.1111.0756
Aigars J., Barone M., Suhareva N., Putna-Nimane I., Deimantovica-Dimante I. (2021). Occurrence and Spatial Distribution of Microplastics in the Surface Waters of the Baltic Sea and the Gulf of Riga. Mar. pollut. Bull. 172, 112860. doi: 10.1016/j.marpolbul.2021.112860
Berg P., Poulsen J. W. (2012) Technical Report. 12/16, More Details on Hbm : General Modelling Theory and Survey of Recent Studies. Available at: http://beta.dmi.dk/fileadmin/Rapporter/TR/tr12-16.pdf (Accessed 2022-02-28).
Besseling E., Quik J., Sun M., Koelmans A. (2006). Fate of Nano- and Microplastic in Freshwater Systems: A Modeling Study. Environ. pollut. 220, 540–548. doi: 10.1016/j.envpol.2016.10.001
Boucher J., Friot D. (2017). Primary Microplastics in the Oceans: A Global Evaluation of Sources (Gland, Switzerland: IUCN).
Charnock H. (1955). Wind Stress on a Water Surface. Q. J. R. Meteorological Soc. 81, 639–640. doi: 10.1002/qj.49708135027
Coyle R., Hardiman G., O’Driscoll K. (2020). Microplastics in the Marine Environment: A Review of Their Sources, Distribution Processes, Uptake and Exchange in Ecosystems. Case Stud. Chem. Environ. Eng. 2, 100010. doi: 10.1016/j.cscee.2020.100010
Donnelly C., Andersson J. C., Arheimer B. (2016). Using Flow Signatures and Catchment Similarities to Evaluate the E-Hype Multi-Basin Model Across Europe. Hydrological Sci. J. 61, 255–273. doi: 10.1080/02626667.2015.1027710
Frishfelds V., Sennikovs J., Bethers U., Murawski J., Timuhins A. (2021). Modeling Transit Flow Through Port Gates and Connecting Channel in Baltic Sea—Liepaja Port—Liepaja Lake System. Front. Mar. Sci. 8, doi: 10.3389/fmars.2021.657721
Gayer G., Dick S. A., Pleskachevsky A., Rosenthal W. (2006). Numerical Modeling of Suspended Matter Transport in the North Sea. Ocean Dynamics 56, 62–77. doi: 10.1007/s10236-006-0070-5
Hinata H., Mori K., Ohno K., Miyao Y., Kataoka T. (2017). An Estimation of the Average Residence Times and Onshore-Offshore Diffusivities of Beached Microplastics Based on the Population Decay of Tagged Meso- and Macrolitter. Mar. pollut. Bull. 122, 17–26. doi: 10.1016/j.marpolbul.2017.05.012
Hurley R., Woodward J., Rothwell J. (2018). Microplastic Contamination of River Beds Significantly Reduced by Catchment-Wide Flooding. Nat. Geosci. 11, 251–257. doi: 10.1038/s41561-018-0080-1
Kara A. B., Rochford P. A., Hurlburt H. E. (2000). Efficient and Accurate Bulk Parameterizations of Air–Sea Fluxes for Use in General Circulation Models. J. Atmospheric Oceanic Technol. 17, 1421–1438. doi: 10.1175/1520-0426(2000)017<1421:EAABPO>2.0.CO;2
Karlsson T., Kärrman A., Rotander A., Hassellöv M. (2020). Comparison Between Manta Trawl and in Situ Pump Filtration Methods, and Guidance for Visual Identification of Microplastics in Surface Waters. Environ. Sci. pollut. Res. 27, 5559–5571. doi: 10.1007/s11356-019-07274-5
Koo M., van Nes E. H., Scheffer M., Koelmans A. A. (2017). Ups and Downs in the Ocean: Effects of Biofouling on Vertical Transport of Microplastics. Environ. Sci. Technol. 51, 7963–7971. doi: 10.1021/acs.est.6b04702
LHEI (2018) Micoplastic Pollution by Liae. Available at: https://www.lhei.lv/lv/karte (Accessed 2022-02-28).
Lips U., Zhurbas V., Skudra M., Väli G. (2016). A Numerical Study of Circulation in the Gulf of Riga, Baltic Sea. Part I: Whole-Basin Gyres and Mean Currents. Continental Shelf Res. 112, 1–13. doi: 10.1016/j.csr.2015.11.008
Meier H. E. M. (2001). On the Parameterization of Mixing in Three-Dimensional Baltic Sea Models. J. Geophysical Res. 106, 30997–31016. doi: 10.1029/2000JC000631
Murawski J., She J., Frishfelds V. (2022). Modelling Drift and Fate of Microplastics in the Baltic Sea. Front. Mar. Sci. Submitted.
Murawski J., She J., Mohn C., Frishfelds V., Nielsen J. W. (2021). Ocean Circulation Model Applications for the Estuary-Coastal-Open Sea Continuum. Front. Mar. Sci. 26. doi: 10.3389/fmars.2021.657720
Osinski R. D., Enders K., Gräwe U., Klingbeil K., Radtke H. (2020). Model Uncertainties of a Storm and Their Influence on Microplastics and Sediment Transport in the Baltic Sea. Ocean Sci. 16, 1491–1507. doi: 10.5194/os-16-1491-2020
Pleskachevsky A., Gayer G., Horstmann J., Rosenthal W. (2005). Synergy of Satellite Remote Sensing and Numerical Modelling for Monitoring of Suspended Particulate Matter. Ocean Dynamics 55, 2–9. doi: 10.1007/s10236-004-0101-z
Raike A., Pietilainen O.-P., Rekolainen S., Kauppila P., Pitkanen H., Niemi J., et al. (2003). Trends of Phosphorus, Nitrogen and Chlorophyll a Concentrations in Finnish Rivers and Lakes in 1975–2000. Sci. Total Environ. 310, 47–59. doi: 10.1016/S0048-9697(02)00622-8
Ramírez-Álvarez N., Mendoza L. M. R., Macías-Zamora J. V., Oregel-Vázquez L., Alvarez-Aguilar A., Hernández-Guzmán F. A., et al. (2020). Microplastics: Sources and Distribution in Surface Waters and Sediments of Todos Santos Bay, Mexico. Sci. Total Environ. 703, 134838. doi: 10.1016/j.scitotenv.2019.134838
Schernewski G., Radtke H., Hauk R., Baresel C., Olshammar M., Oberbeckmann S. (2021). Urban Microplastics Emissions: Effectiveness of Retention Measures and Consequences for the Baltic Sea. Front. Mar. Sci. 8. doi: 10.3389/fmars.2021.594415
Schuchardt B., Beilfuß S., Reincke T., Hofmann O., Ziebarth N., Liebezeit G., et al. (2013). In Der Nordsee–Pilotprojekt Zur Relevanz Des Eintragspfades Ästuar am Beispiel Der Unterweser-Untersuchung Vor Dem Hintergrund Der Meeresstrategie-Rahmenrichtlinie (MSRL) (Bremen, Germany: Bioconsult Schuchardt & Scholle GbR).
Sennikovs J., Timuhins A., Frishfelds V., Bethers U. (2021) Hydrodynamic, Wave and Siltation Modelling for Ports: Riga Port. Available at: http://www.water.lv/HywasPort/RigasOsta (Accessed 2022-02-28).
Setälä O., Magnusson K., Lehtiniemi M., Norén F. (2016). Distribution and Abundance of Surface Water Microlitter in the Baltic Sea: A Comparison of Two Sampling Methods. Mar. pollut. Bull. 110, 177–183. doi: 10.1016/j.marpolbul.2016.06.065
She J., Buhhalko N., Lind K., Mishra A., Kikas A., Costa Elisa, et al (2022). Uncertainty and Consistency Assessment in Multiple Microplastic Observation Datasets in the Baltic Sea. Front. Mar. Sci. 9. doi: 10.3389/fmars.2022.886357
She J., Murawski J. (2018). “Towards Seamless Modelling for the Baltic Sea. Operational Oceanography Serving Sustainable Marine Development, ” in Proceedings of the Eight EuroGOOS International Conference.Belgium: EuroGOOS, 233–241.
Soosaar E., Maljutenko I., Raudsepp U., Elken J. (2014). An Investigation of Anticyclonic Circulation in the Southern Gulf of Riga During the Spring Period. Continental Shelf Res. 78, 75–84. doi: 10.1016/j.csr.2014.02.009
Suursaar U., Kullas T., Aps R. (2012). Currents and Waves in the Northern Gulf of Riga: Measurement and Long-Term Hindcast. Oceanologia 54, 421–447. doi: 10.5697/oc.54-3.421
Tsiaras K., Hatzonikolakis Y., Kalaroni S., Pollani A., Triantafyllou G. (2021). Modeling the Pathways and Accumulation Patterns of Micro- and Macro-Plastics in the Mediterranean. Front. Mar. Sci. 8. doi: 10.3389/fmars.2021.743117
Yan Z., Chen Y., Bao X., Zhang X., Ling X., Lu G., et al. (2021). Microplastic Pollution in an Urbanized River Affected by Water Diversion: Combining With Active Biomonitoring. J. Hazardous Materials 417, 126058. doi: 10.1016/j.jhazmat.2021.126058
Yurkovskis A., Wulff F., Rahm L., Andruzaitis A., Rodriguez-Medina M. (1993). A Nutrient Budget of the Gulf of Riga; Baltic Sea. Estuarine Coast. Shelf Sci. 37, 113–127. doi: 10.1006/ecss.1993.1046
Keywords: two-way nesting, microplastics, biofouling, riverine–estuarial–coastal modeling, marine plastic modeling
Citation: Frishfelds V, Murawski J and She J (2022) Transport of Microplastics From the Daugava Estuary to the Open Sea. Front. Mar. Sci. 9:886775. doi: 10.3389/fmars.2022.886775
Received: 28 February 2022; Accepted: 21 June 2022;
Published: 22 July 2022.
Edited by:
Carlos Gravato, University of Lisbon, PortugalReviewed by:
Mariana Capparelli, National Autonomous University of Mexico, MexicoCopyright © 2022 Frishfelds, Murawski and She. This is an open-access article distributed under the terms of the Creative Commons Attribution License (CC BY). The use, distribution or reproduction in other forums is permitted, provided the original author(s) and the copyright owner(s) are credited and that the original publication in this journal is cited, in accordance with accepted academic practice. No use, distribution or reproduction is permitted which does not comply with these terms.
*Correspondence: Vilnis Frishfelds, ZnJpc2hmZWxkc0BsYXRuZXQubHY=
Disclaimer: All claims expressed in this article are solely those of the authors and do not necessarily represent those of their affiliated organizations, or those of the publisher, the editors and the reviewers. Any product that may be evaluated in this article or claim that may be made by its manufacturer is not guaranteed or endorsed by the publisher.
Research integrity at Frontiers

Learn more about the work of our research integrity team to safeguard the quality of each article we publish.