- 1School of Marine Science, Ningbo University, Ningbo, China
- 2Aquatic Technology Promotion Station, Sanmen Rural Bureau, Taizhou, China
- 3Key Laboratory of Applied Marine Biotechnology, Ministry of Education, Ningbo University, Ningbo, China
Salinity is an important factor affecting the survival, growth, and metabolism of marine crustaceans. Low-salt stress will result in the death of swimming crabs. This paper investigates the metabolic response in the gills of Portunus trituberculatus under short-term low-salt stress by comparing the metabolic molecules in the four salinity treatment groups (24‰, 16‰, 12‰, and 8‰) by GC-MS technique. In this study, nine common differential metabolites such as pyruvate, malic acid, and phosphoethanolamine were found in the gill tissues of crabs. KEGG enrichment analysis revealed that six metabolic pathways, including the citric acid cycle, pyruvate metabolism, and the HIF-1 signaling system, were significantly impacted by low salt stimulation. According to the findings, salinity 12‰ is a critical node in crab adaptation to low salinity. In the process of adaptation to short-term low-salinity environment, amino acids participated in osmotic regulation, and organic acids such as pyruvate and malic acid were involved in energy metabolism to ensure their energy supply. This research further enriched the theory of osmotic regulation and metabolic mechanism of adaptation to low salt in crustaceans, with the goal of providing guidance for the improvement of culture technique in Portunus trituberculatus.
Introduction
Portunus trituberculatus, which belongs to the Crustecea, Malacostraca, Decapoda, Portunidae, Portunus, is widely distributed in the coastal waters of China, Korea, Japan, and South Asia (Ren et al., 2013). It is an essential mariculture species in China. And salinity as an important environmental factor in aquaculture, is closely related to the geographical distribution (Lv et al., 2019), growth, and reproduction (Chen et al., 2019) of swimming crabs. Although P. trituberculatus has a certain degree of wide salinity, sudden decrease of salinity in water or low salinity environment can cause crab death and economic losses (Feng et al., 2019).
Euryhaline crustaceans can maintain osmotic pressure stability in vivo through osmoregulation by two mechanisms (Ramaglia et al., 2018): (a) Anisosmotic extracellular regulation. It regulates body fluid osmolality through the ion transporter of gill epithelial cell, including V(H+)-ATPase, Na+/K+-ATPase, Na+/K+/2Cl- cotransporter and so on. (McNamara and Faria, 2012). (b) Intracellular isosmotic regulation. It controls intracellular osmolality and maintains the balance between tissues and hemolymph by adjusting the concentration of osmoregulatory effectors (Lu et al., 2015). For example, crustaceans living in low-salinity environments like estuaries and intertidal zones, can quickly excrete excess amino acids from muscle tissue to prevent cell swelling and rupture, as well as compensate for free amino acids in the hemolymph (Sokolova et al., 2012; Lu et al., 2015). Amino acids produced by intracellular isosmotic regulation have been shown to provide energy to the organism by generating glucose through gluconeogenesis reactions (Ye et al., 2014). Free amino acids like glycine, taurine, alanine, and arginine have been proposed as osmoeffectors in crustaceans in previous studies (Augusto et al., 2007; de Faria et al., 2011).
The study of osmoregulation in P. trituberculatus is vital for its culture and artificial breeding, and many studies have been conducted on this topic. The osmotic pressure of crabs decreases with the salinity decreasing, which is proportional to the salinity changes, and the activity of ion transporters (Na+/K+-ATPase and carbonic anhydrase) in gills increases with decreasing salinity (Lu et al., 2013). The results of gene expression in P. trituberculatus under salinity stress showed that Na+/K+-ATPase β-subunit was significantly up-regulated during low salinity challenge, and metabolism and energy genes were significantly up-regulated during high salinity challenge (Xu and Liu, 2011). Based on transcriptome research, Lv et colleagues (Lv et al., 2013) found that differentially expressed genes of swimming crabs under low salt stress were involved in ion transport, amino acid metabolism and synthesis, protein hydrolysis, and carbohydrate metabolism. The expression of miRNAs under low salt stress was also investigated. GO enrichment analysis revealed a significant increase in biological processes such as α-amino acid metabolism and intracellular protein transport (Lv et al., 2016). The process of crab response to low salinity could be divided into early (0-12h), middle (12-48h) and late (48-72h) stages, and the differentially expressed genes in each stage were related to lipid metabolism, energy metabolism and signal transduction, respectively (Gao et al., 2019). Previous research has established that ion transport, amino acid metabolism and carbohydrate metabolism play an important role in osmoregulation.
Following genomics, transcriptomics, and proteomics, metabolomics has become a hotspot in biological research, which can be used to detect the impacts of external environmental stress on the organism (Mazzarelli et al., 2015; Long et al., 2017). Differential metabolites related to osmoregulation such as amino acids, sugars, betaine, and fenugreek were identified in a study for metabolic changes in the muscles of P. trituberculatus under low salt stress based on NMR spectroscopy. It was concluded that swimming crabs responds to low salt stress primarily through osmotic pressure regulation, amino acid gluconeogenesis, and energy accumulation (Ye et al., 2014).
In this study, we used the GC-MS technique to compare the metabolic difference molecules in gills of P. trituberculatus under four salinity treatments of 24‰, 16‰, 12‰, and 8‰, in order to investigate the metabolic changes in gills of crabs under short-term low salt stress, and finally analyzed the metabolic response of P. trituberculatus gills under short-term low salt stress.
Materials
Animals
Swimming crabs (Portunus trituberculatus) weighing 5 g ± 0.5 g were acclimated in the laboratory (24 ‰, 28°C) for one week before experimental treatments. The crabs were divided into four groups (each with 60 crabs) and exposed to light hyposalinity challenge (LC, 16 ‰), moderate hyposalinity challenge (MC, 12 ‰), severe hyposalinity challenge (SC, 8 ‰), and non-challenge conditions (NC, 24 ‰) at 28°C. The aquaculture water in the low-salt challenge group was a mixture of ordinary seawater and fresh water. Each treatment was repeated three times with a total of 20 crabs per replicate. As a result, there were 12 buckets in all (4 salinity treatments x 3 repeats). After 48 hours, crabs’ posterior gills were extracted and quickly frozen in liquid nitrogen, then stored at -80°C until the metabolic analysis was performed.
Sample Preparation
60 mg of precisely weighed material was put to a 1.5-mL Eppendorf tube. The tube was then filled with two small steel balls, 20 μL of internal standard (0.3 mg/mL 2-chloro-1-phenylalanine methanol solution), and 600 μL of extraction solvent with methanol/water (V: V=4:1). After 2 minutes at -80°C, the samples were ground at 60 Hz for another 2 min. Then 120 μL of chloroform was added, extracted by sonication in an ice-water bath for 10 min and then left at -20°C for 30 min, and centrifuged at 13000 rpm, 4 °C for 10 min, and 200 μL of supernatant was loaded into glass derivatization vials. Quality control samples (QC) were made by combining aliquots from all of the samples into a single sample, with the volume of each QC being the same as the sample. The samples were evaporated with a centrifugal concentrator and drier, and 80 μL of pyridinium methoxamine hydrochloride solution (15 mg/mL) was added to the glass derivatization vial, vortexed and shaken for 2 min, and then subjected to an oxime reaction in a shaking incubator at 37°C for 90 min. The samples were removed, and 80 μL of BSTFA derivatization reagent (with 1% TMCS) and 20 μL of hexane were added. 10 mL of 11 internal standards were added and vortex shaken for 2 min (C8/C9/C10/C12/C14/C16, 0.16 mg/mL; C18/C20/C22/C24/C26, 0.08 mg/mL, all in chloroform configuration). After 30 min at room temperature, the samples were GC-MS examined.
GC-MS
The analytical instrument used for this experiment was a 7890B-5977A GC/MSD gas chromatograph from Agilent Technologies Inc. (UAS, CA). The chromatographic conditions were a DB-5MS capillary column (30 m×0.25 mm×0.25 μm, Agilent J&W Scientific, Folsom, CA, USA), high purity helium gas (purity not less than 99.999%), the flow rate of 1.0 mL/min, an inlet temperature of 260°C, injection volume of 1 μL, no splitting, and solvent delay of 5 min. Programmed ramp-up: the initial temperature of the column temperature chamber was 60°C, maintained for 0.5 min; programmed ramp-up to 125°C at 8°C/min, 210°C at 5°C/min, 270°C at 10°C/min, 305°C at 20°C/min, maintained for 5 min; mass spectrometry conditions for electron bombardment ion source (EI), ion source temperature The scanning mode was full scan mode (SCAN), mass scan range: m/z 50-500. one QC sample was inserted in every 8 analyzed samples to check the reproducibility of the whole analysis process.
Data Preprocessing and Statistical Analysis
The raw data (.D format) was converted to.CDF format using Chem Station (version E.02.02.1431, Agilent, USA) software, and then the.CDF data were imported into Chroma TOF software (version 4.34, LECO, St Joseph, MI) for processing. The Fiehn and NIST databases were used to annotate metabolites. To produce a “raw data array,” sample information, peak names (or retention durations and m/z), and peaks were recovered from raw data by comparing to statistical comparison components in a 3D dataset (.cvs). In all, 1264 peaks were found in all of the samples. All internal standards, as well as any known false positive peaks (due to background noise, chromatographic priming, or BSTFA derivative techniques), were eliminated from the “data set.” Each sample’s peak area is standardized to the data, multiplied by 10,000, and the peaks of the same metabolite are added together. There were a total of 342 metabolites found.
The data were converted using log2, and the resulting data matrix was then imported into the SIMCA software installation package (14.0, Umetrics, Ume, Sweden). After mean centering and unit variance scaling, principal component analysis (PCA) and orthogonal partial least-squares-discriminant analysis OPLS-DA were used to illustrate the metabolic differences across experimental groups. The 95% confidence interval of the modeled variance is defined by the Hotelling’s T2 area, which appears as an ellipse in score plots of the models. The overall contribution of each variable to the OPLS-DA model is ranked by variable importance in the projection (VIP), and variables with VIP > 1 are considered relevant for group discrimination.
To avoid overfitting, the default 7-round cross-validation was used in this investigation, with one/seventh of the samples being omitted from the mathematical model in each round.
Selection of Differential Metabolites
The selection of differential metabolites was based on statistically significant threshold of variable influence on projection (VIP) values derived from the OPLS-DA model and p-values from a two-tailed Student’s t-test for normalized peak areas of different groups. VIP values greater than 1.0 and p-values less than 0.05 were considered differential metabolites.
Results
Metabolite Alterations Induced by Low-Salinity Exposure
To summarize the similarities and differences of metabolic phenotypes between LCvsNC, MCvsNC, and SCvsNC crabs separately, we plotted the average metabolic trajectories of PCA for each crab group in the first three PCA diagrams (Figures 1A–C). Clearly, compared with LCvsNC groups under light hyposaline stress, the metabolic responses of MCvsNC and SCvsNC groups were more significant. Furthermore, the metabolic alterations in MCvsNC and SCvsNC were more similar.
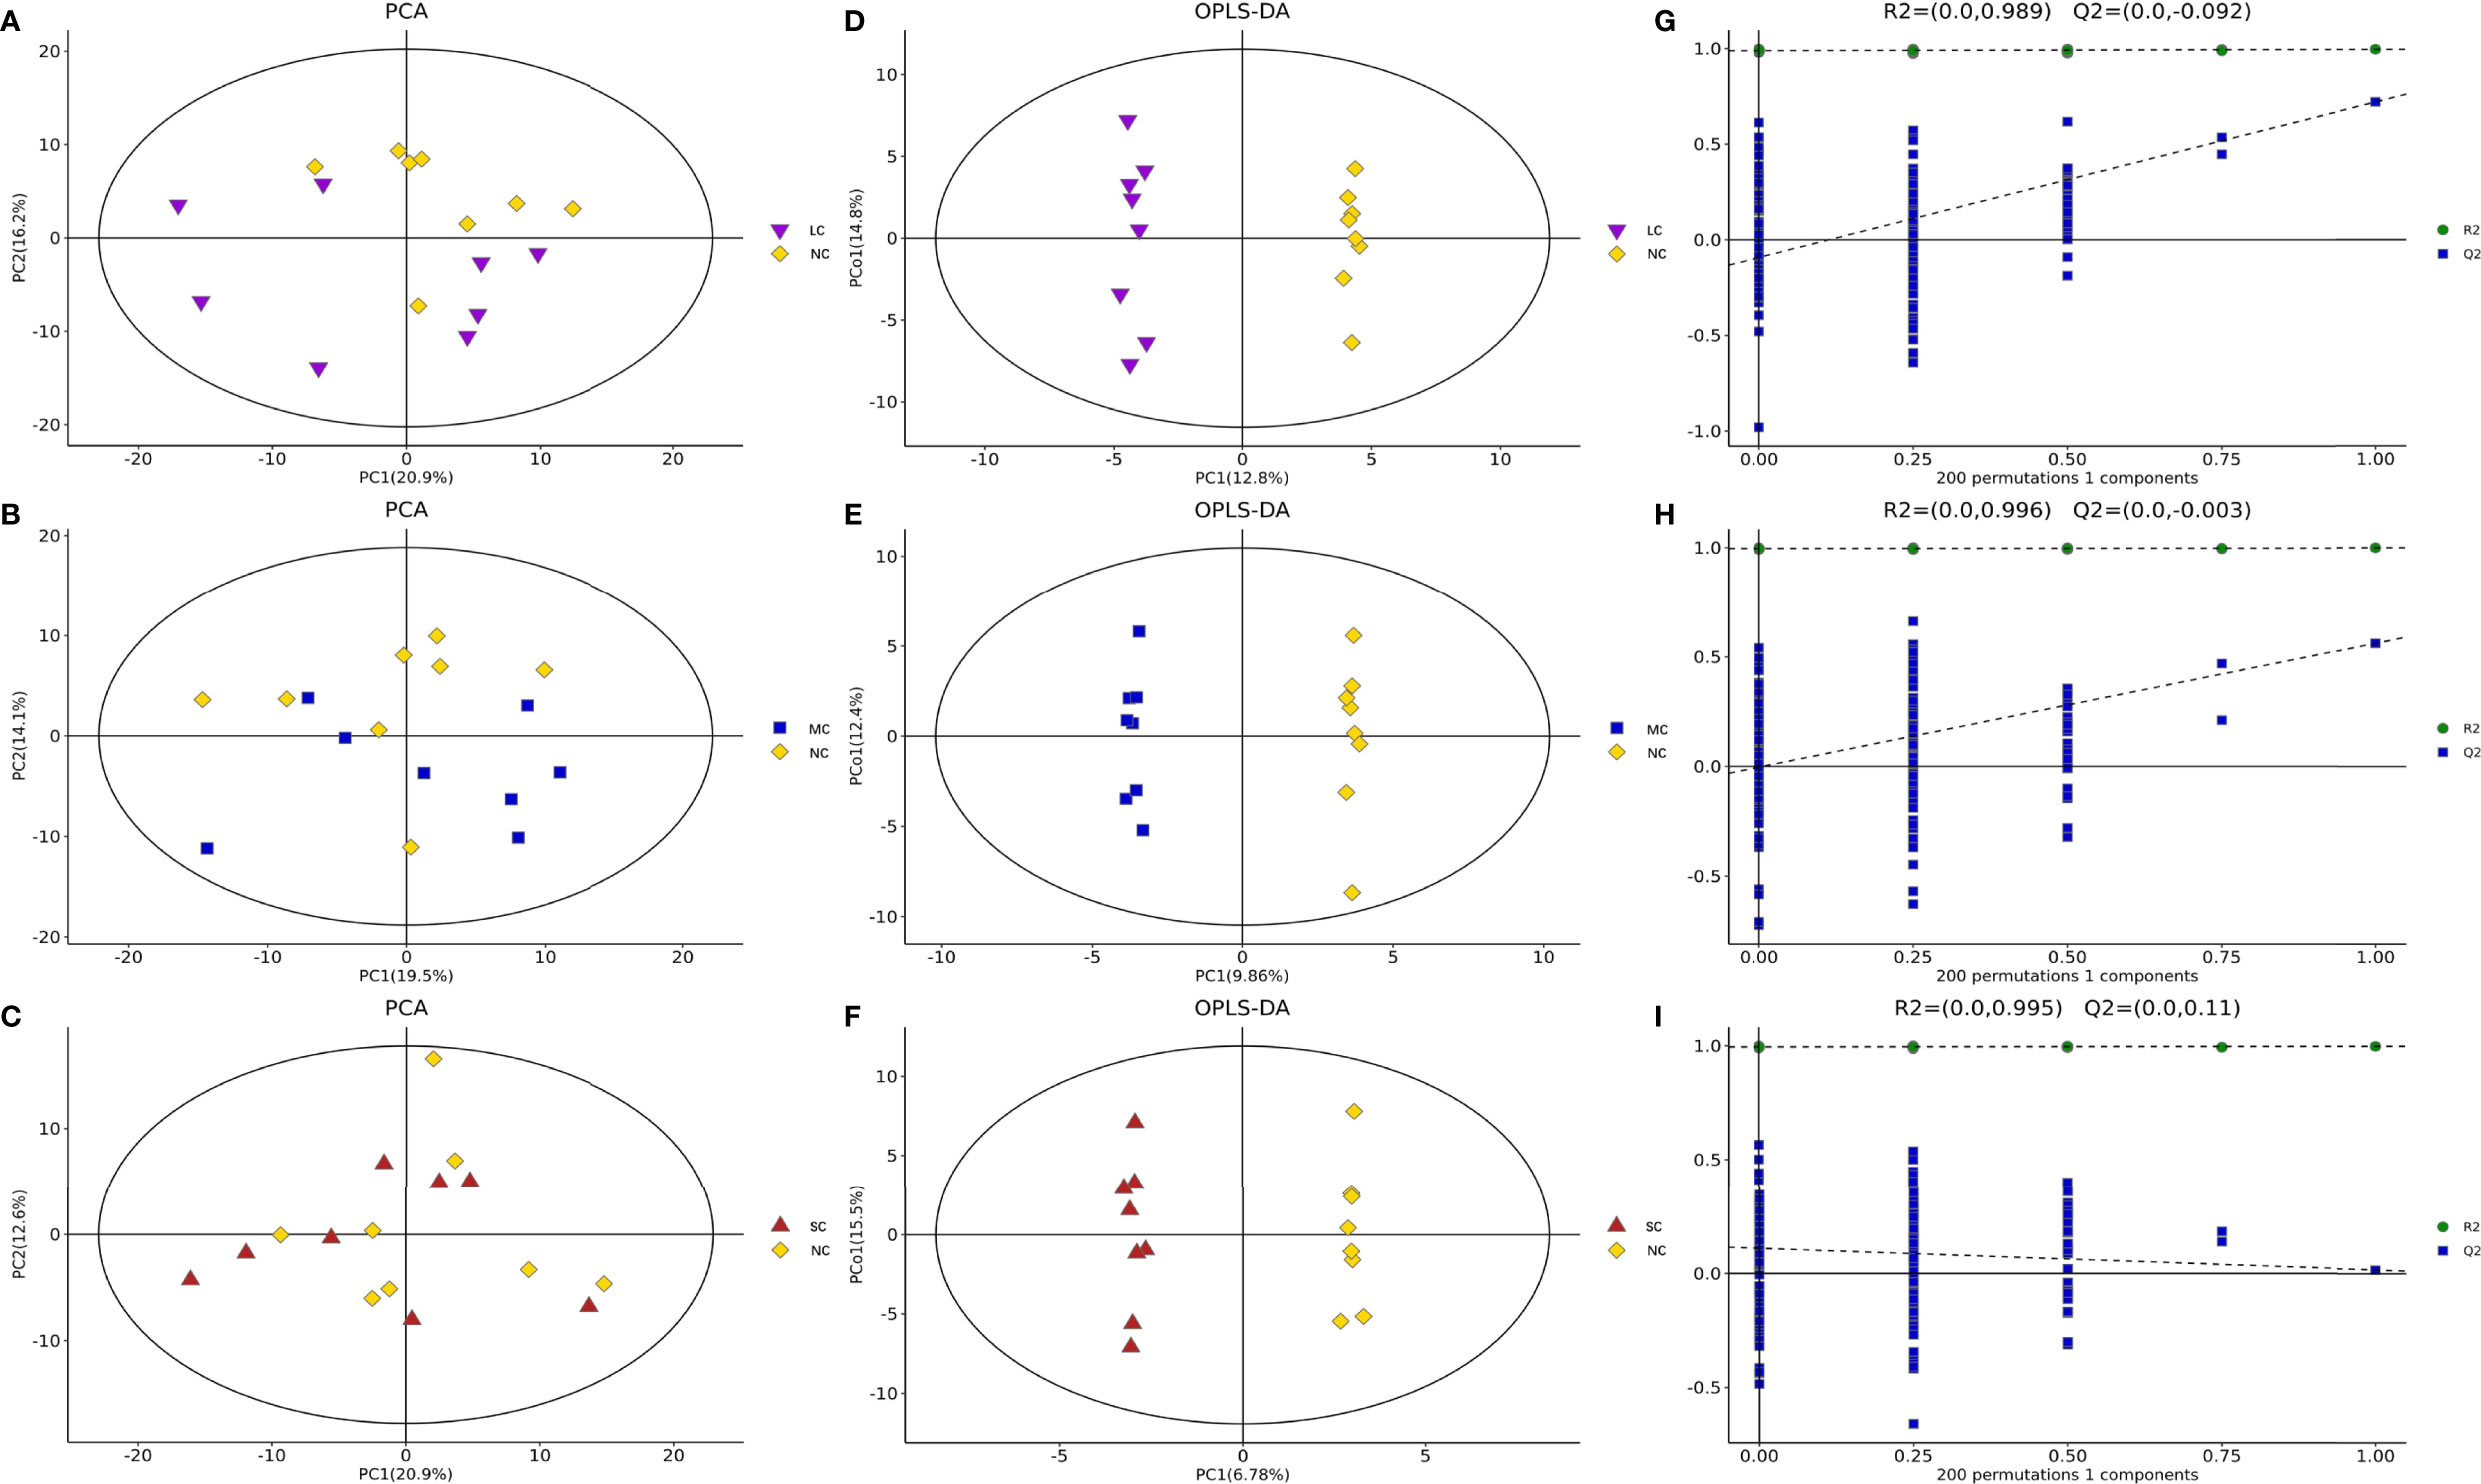
Figure 1 The PCA scores plots, OPLS-DA scores plots and response permutation testing plots for different salinity groups of P. trituberculatus. PCA score plot of LCvsNC (A), MCvsNC (B) and SCvsNC (C); OPLS-DA scores plots of LCvsNC (D), MCvsNC (E) and SCvsNC (F); response permutation testing plots of LCvsNC (G), MCvsNC (H) and SCvsNC (I).
The OPLS-DA method was used to show the metabolites in gill extracts from low salinity treatment group and normal salinity treatment group (Figures 1D–F). The OPLS-DA model had an explanatory ability (R2Y(cum)) close to one and a predictive ability (Q2(cum)) of more than 0.5 for all samples, showing that the model was stable (Table 1). To avoid model over-fitting, seven-fold cross-validation and 200 response permutation testing (RPT) were performed to assess the model’s quality. In the response ranking test of OPLS-DA model, except for the LC group, the Q2 values of the MCvsNC and SCvsNC groups were smaller than 0, indicating that the OPLS-DA model had high explanatory and predictive power in the MCvsNC and SCvsNC groups (Figures 1G–I). To ensure the reliability of the results obtained, further univariate data analysis was performed on the selected metabolites (Figures 2A–C). The results showed that most of the changes of metabolic levels were in agreement with the multivariate data analysis. Finally, only univariate statistical results were referred to for the screening of differentials in the LCvsNC group, and both univariate and multivariate statistical analyses could be referred to for the screening of differentials in the MCvsNC and SCvsNC groups.
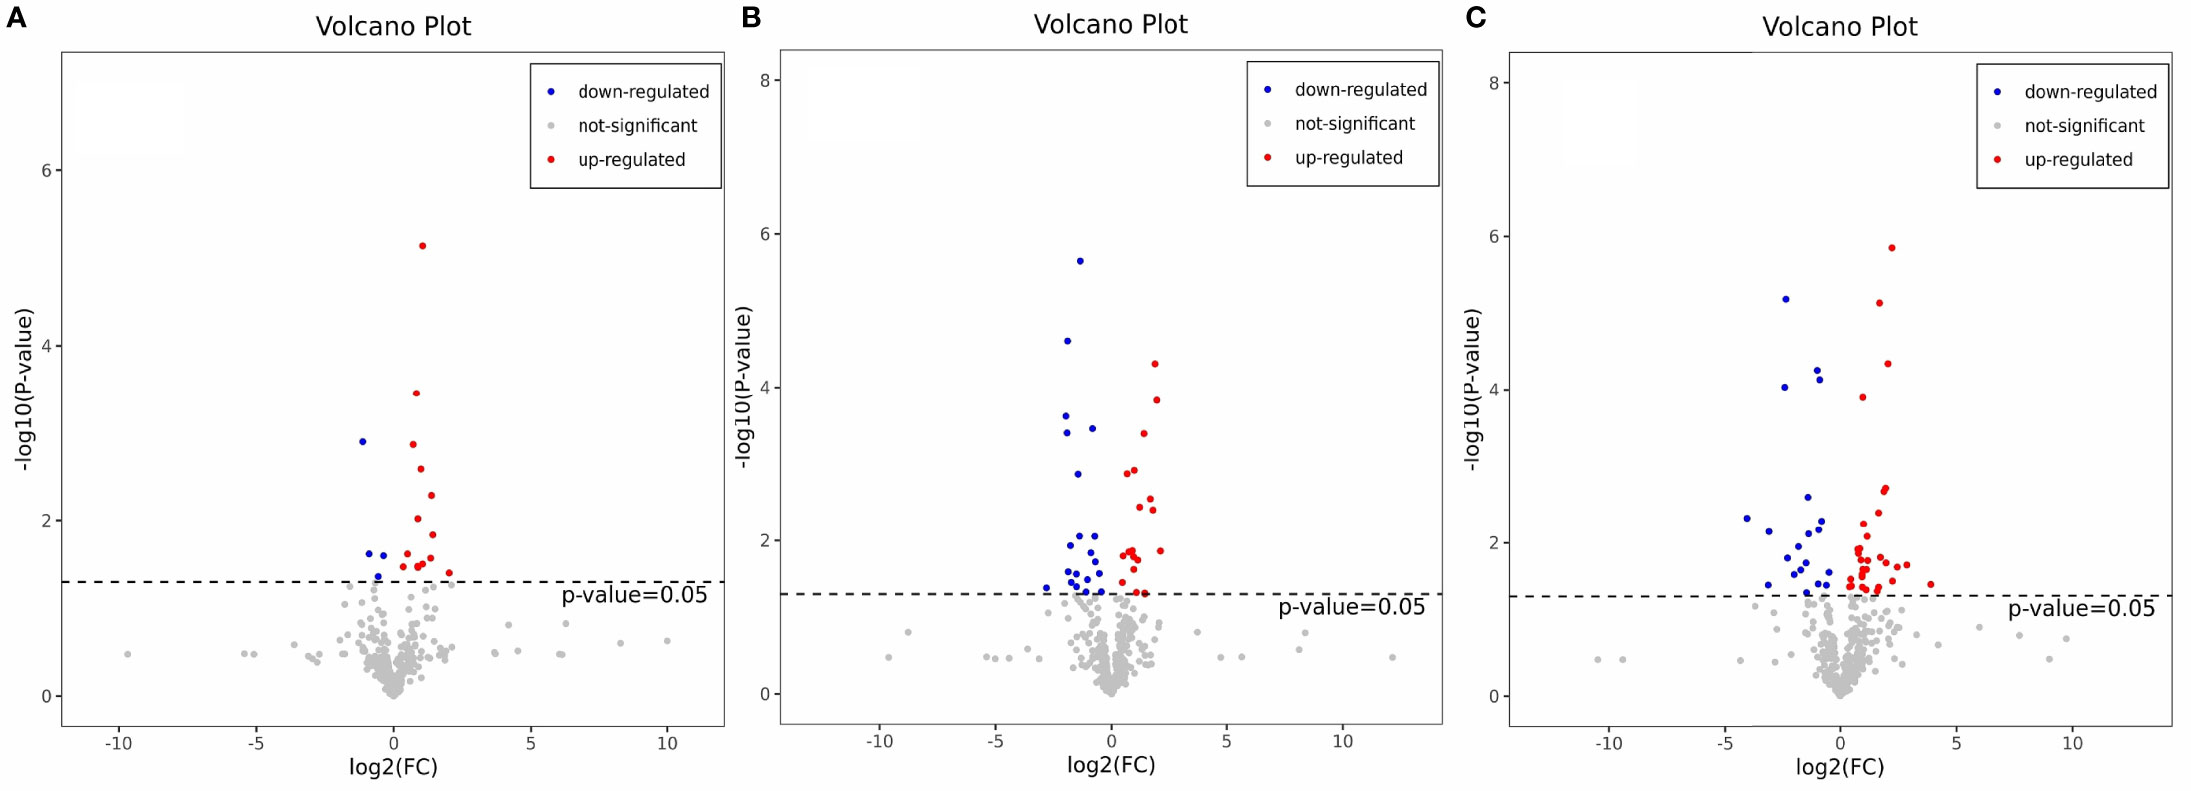
Figure 2 Volcano map of differential metabolites in LCvsNC group (A), MCvsNC group (B), SCvsNC group (C). The red origin represents the differential metabolites that are significantly up-regulated, the blue origin represents the differential metabolites that are significantly down-regulated, and the gray origin represents the insignificant differential metabolites.
Differential Metabolite Screening at Various Salinities
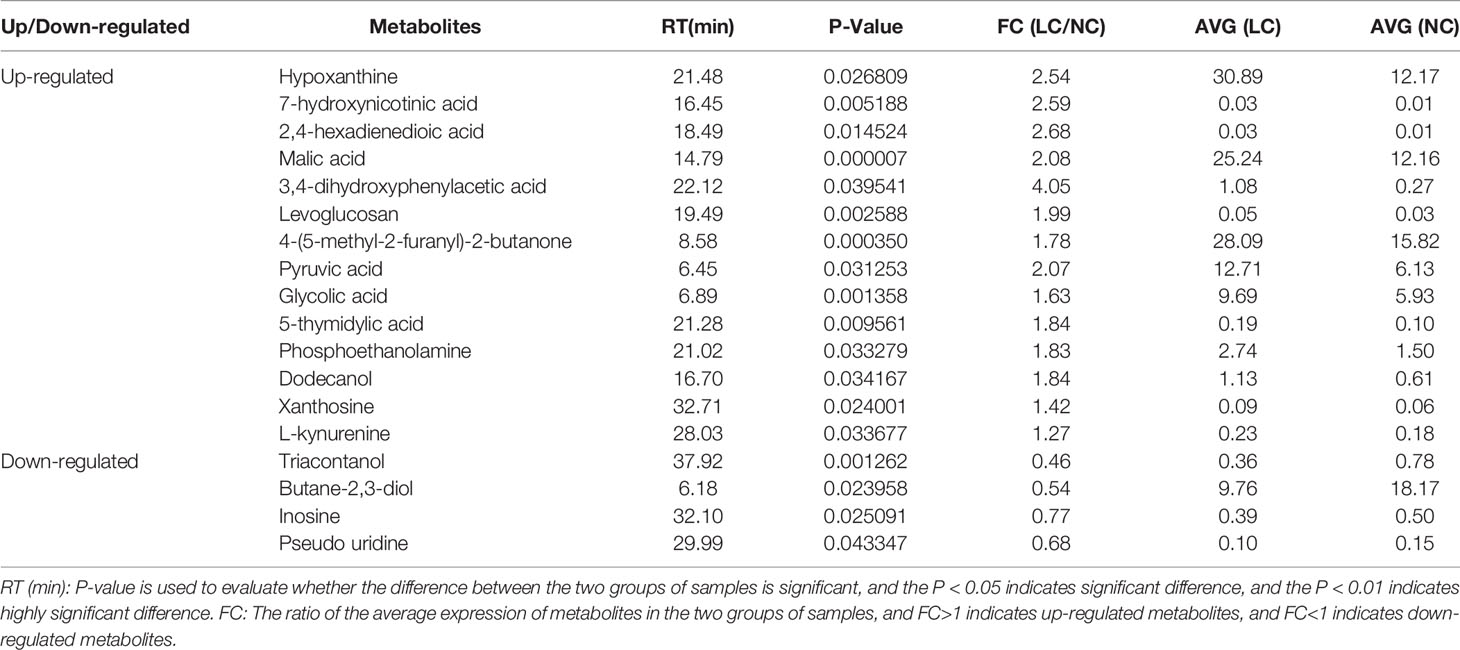
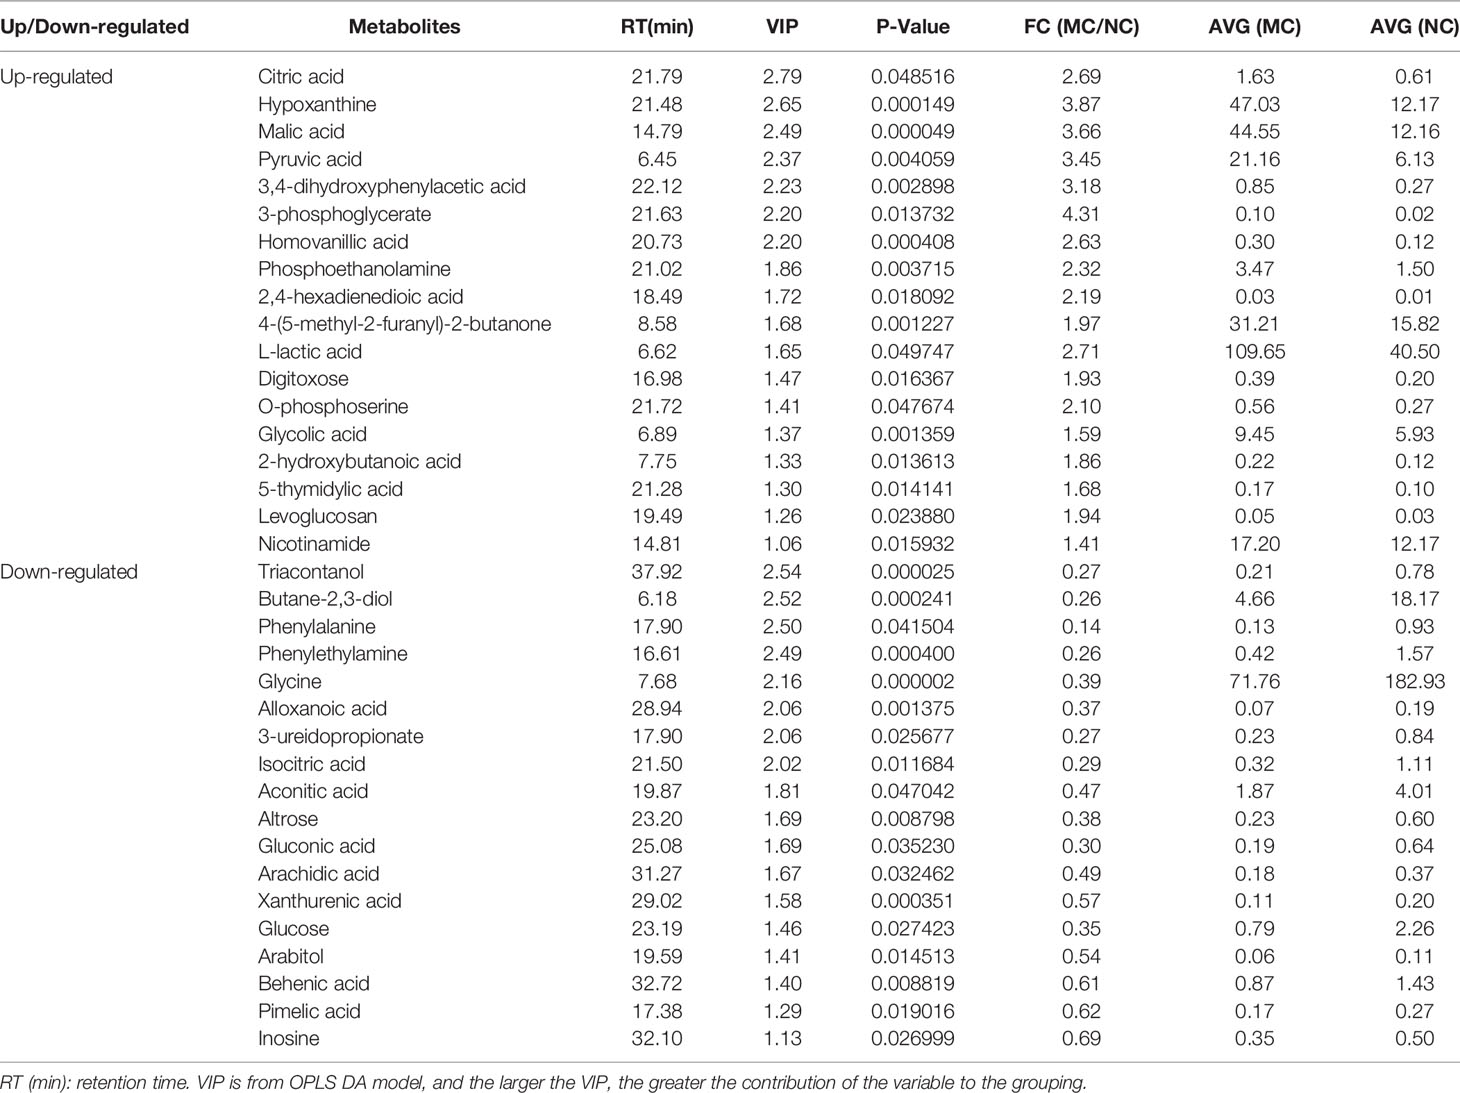
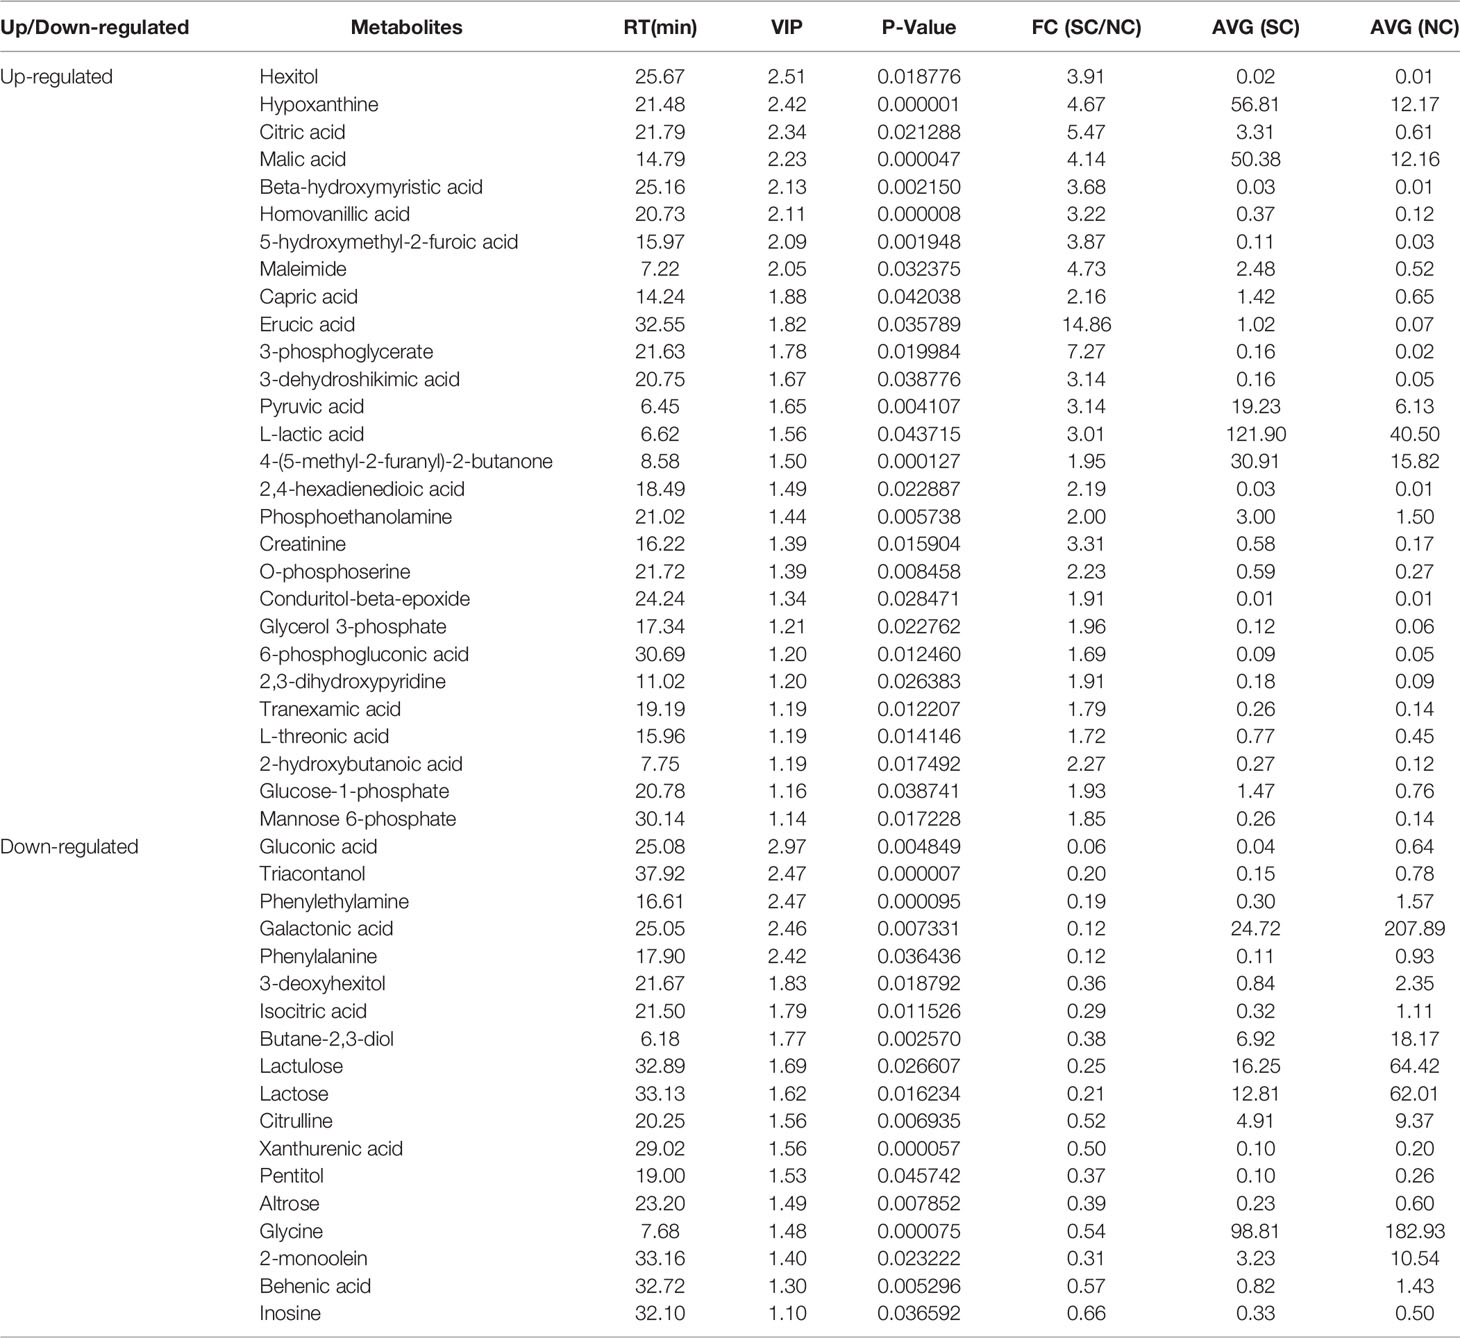
The differential metabolites between low salinity treatment groups (LC, MC and SC) and normal salinity treatment group (NC) were screened using a combination of multivariate analysis, univariate analysis, and heat map analysis (Figure 3). The screening criteria of LCvsNC group were P-value < 0.05 and VIP value > 1, MCvsNC and SCvsNC groups were P value < 0.05 and VIP value > 1, respectively. The results revealed 18 differential metabolites in the LCvsNC group, including 14 up-regulated metabolites and 4 down-regulated metabolites (Table 2), while 36 metabolites changed significantly in the MCvsNC group, including 18 up-regulated metabolites and 18 down-regulated metabolites (Table 3). In addition, a total of 46 differential metabolites were found in the SCvsNC group, including 28 up-regulated metabolites and 18 down-regulated metabolites (Table 4).
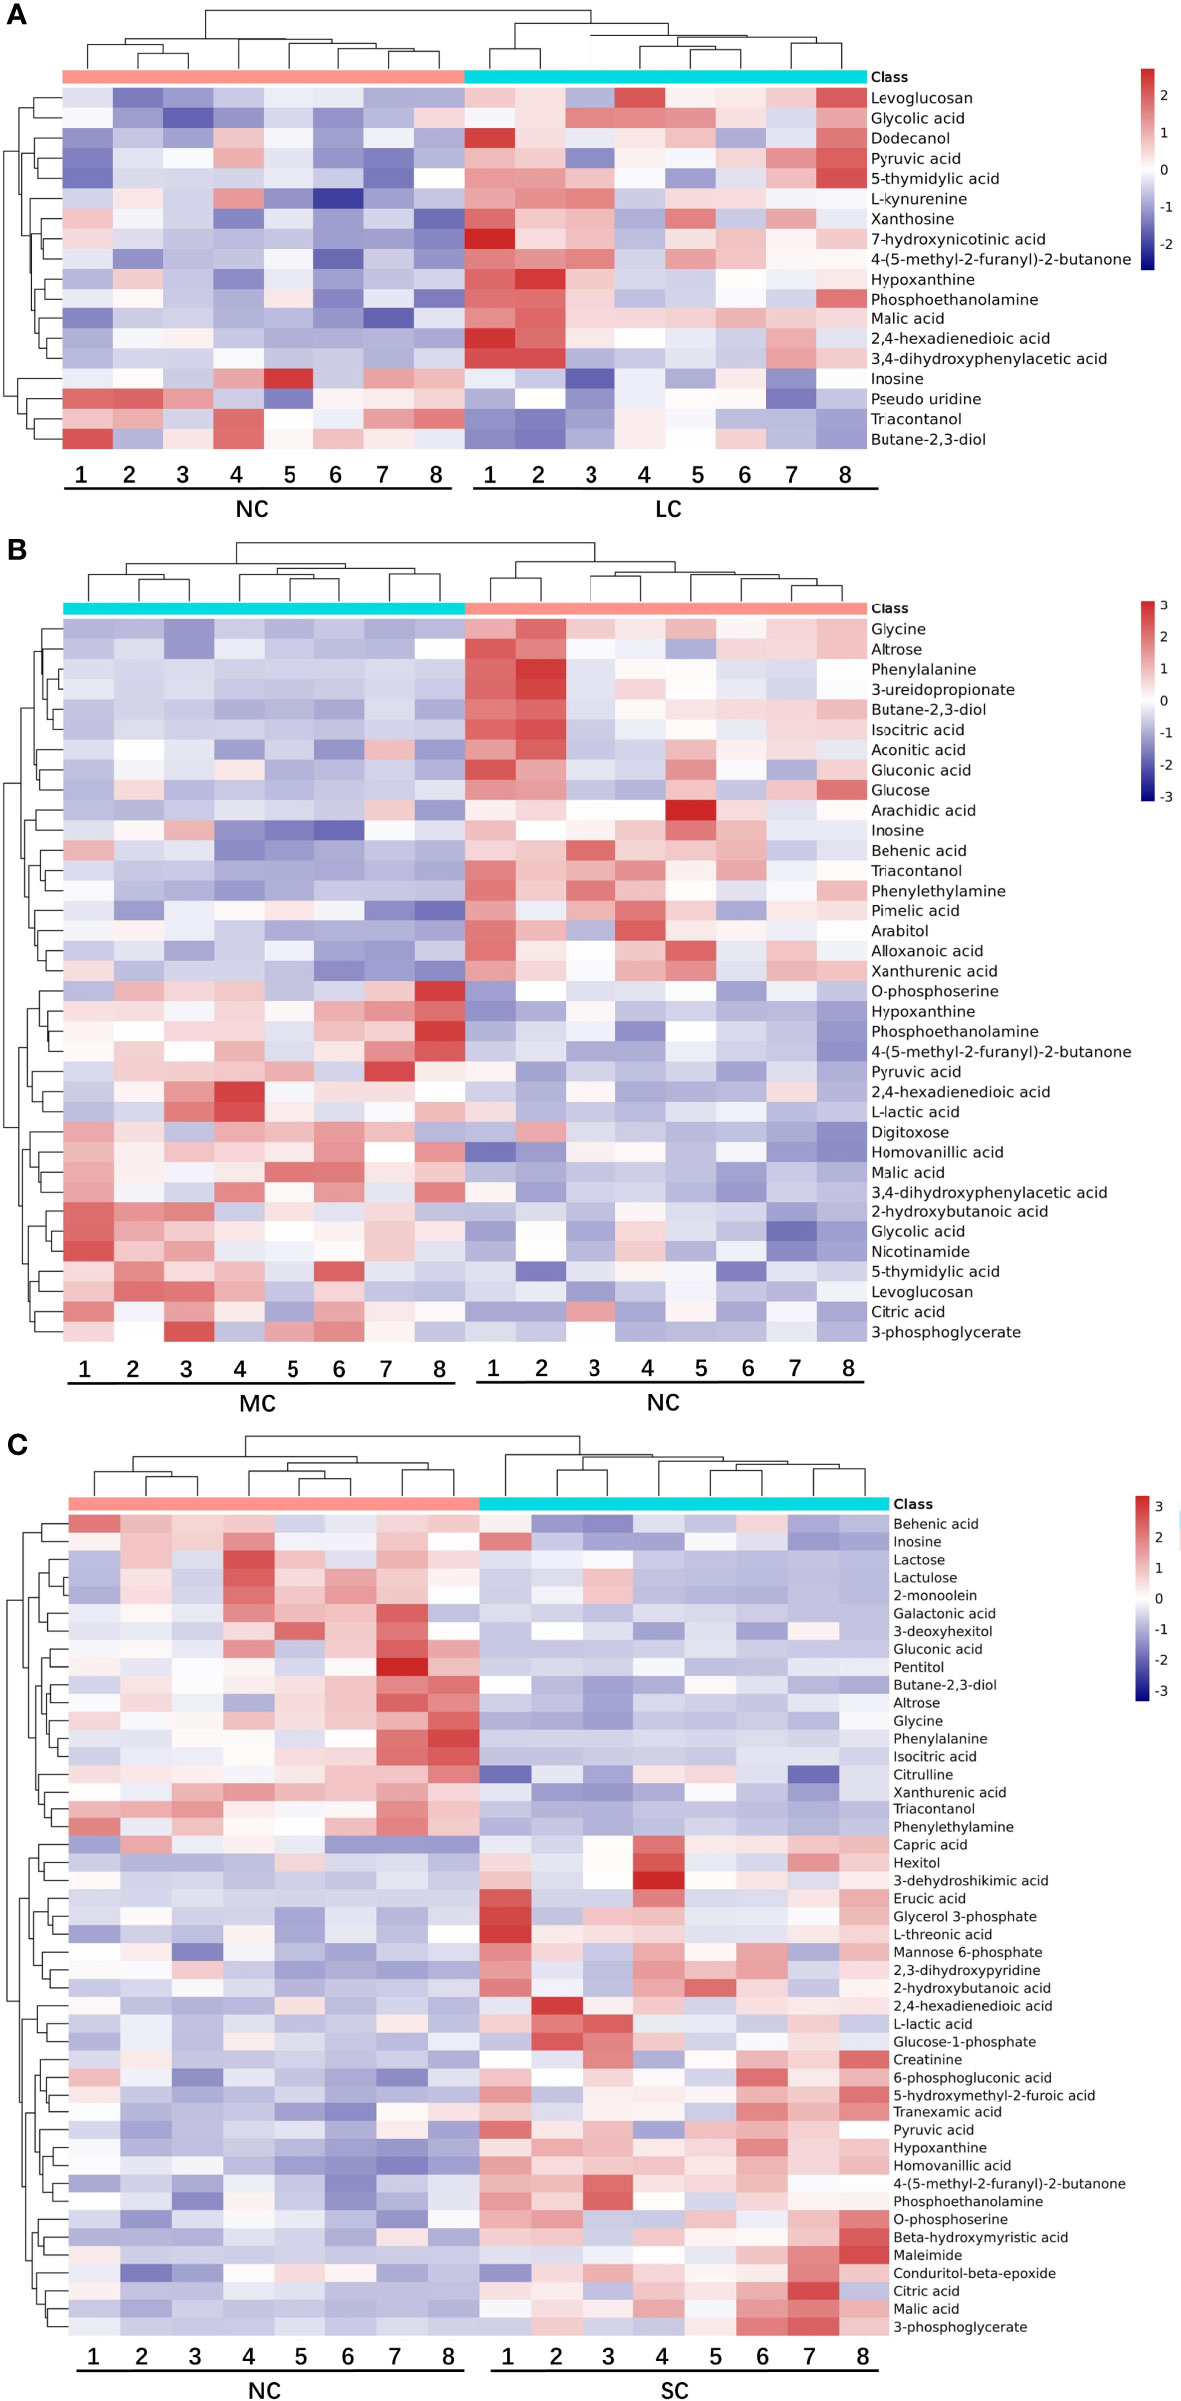
Figure 3 Heat map of differential metabolites in LCvsNC group (A), MCvsNC group (B), SCvsNC group (C). Each gill sample is visualized in a column, and each metabolite is represented by a row. Blue indicates a lower metabolite concentration, while red indicates a higher metabolite level (refer to color scale).
According to the classification of these differential metabolites (Figure 4), among the up-regulated differential metabolites, the most abundant categories in the LCvsNC group were hydroxy acids and derivatives and fatty acyl species (Figure 4A). The most abundant categories in the MCvsNC group were hydroxy acids and derivatives, carboxylic acids and derivatives, and phenols (Figure 4C). And the most abundant categories in the SCvsNC group were organooxygen compounds, carboxylic acids and derivatives, and fatty acyl species (Figure 4E). Among the down-regulated differential metabolites, there were fewer species in the LCvsNC group (Figure 4B). While the most abundant categories in the MCvsNC group were organooxygen compounds, carboxylic acids and derivatives, and fatty acyl species (Figure 4D). And the most abundant categories in the SCvsNC group were organooxygen compounds and carboxylic acids and derivatives (Figure 4F).
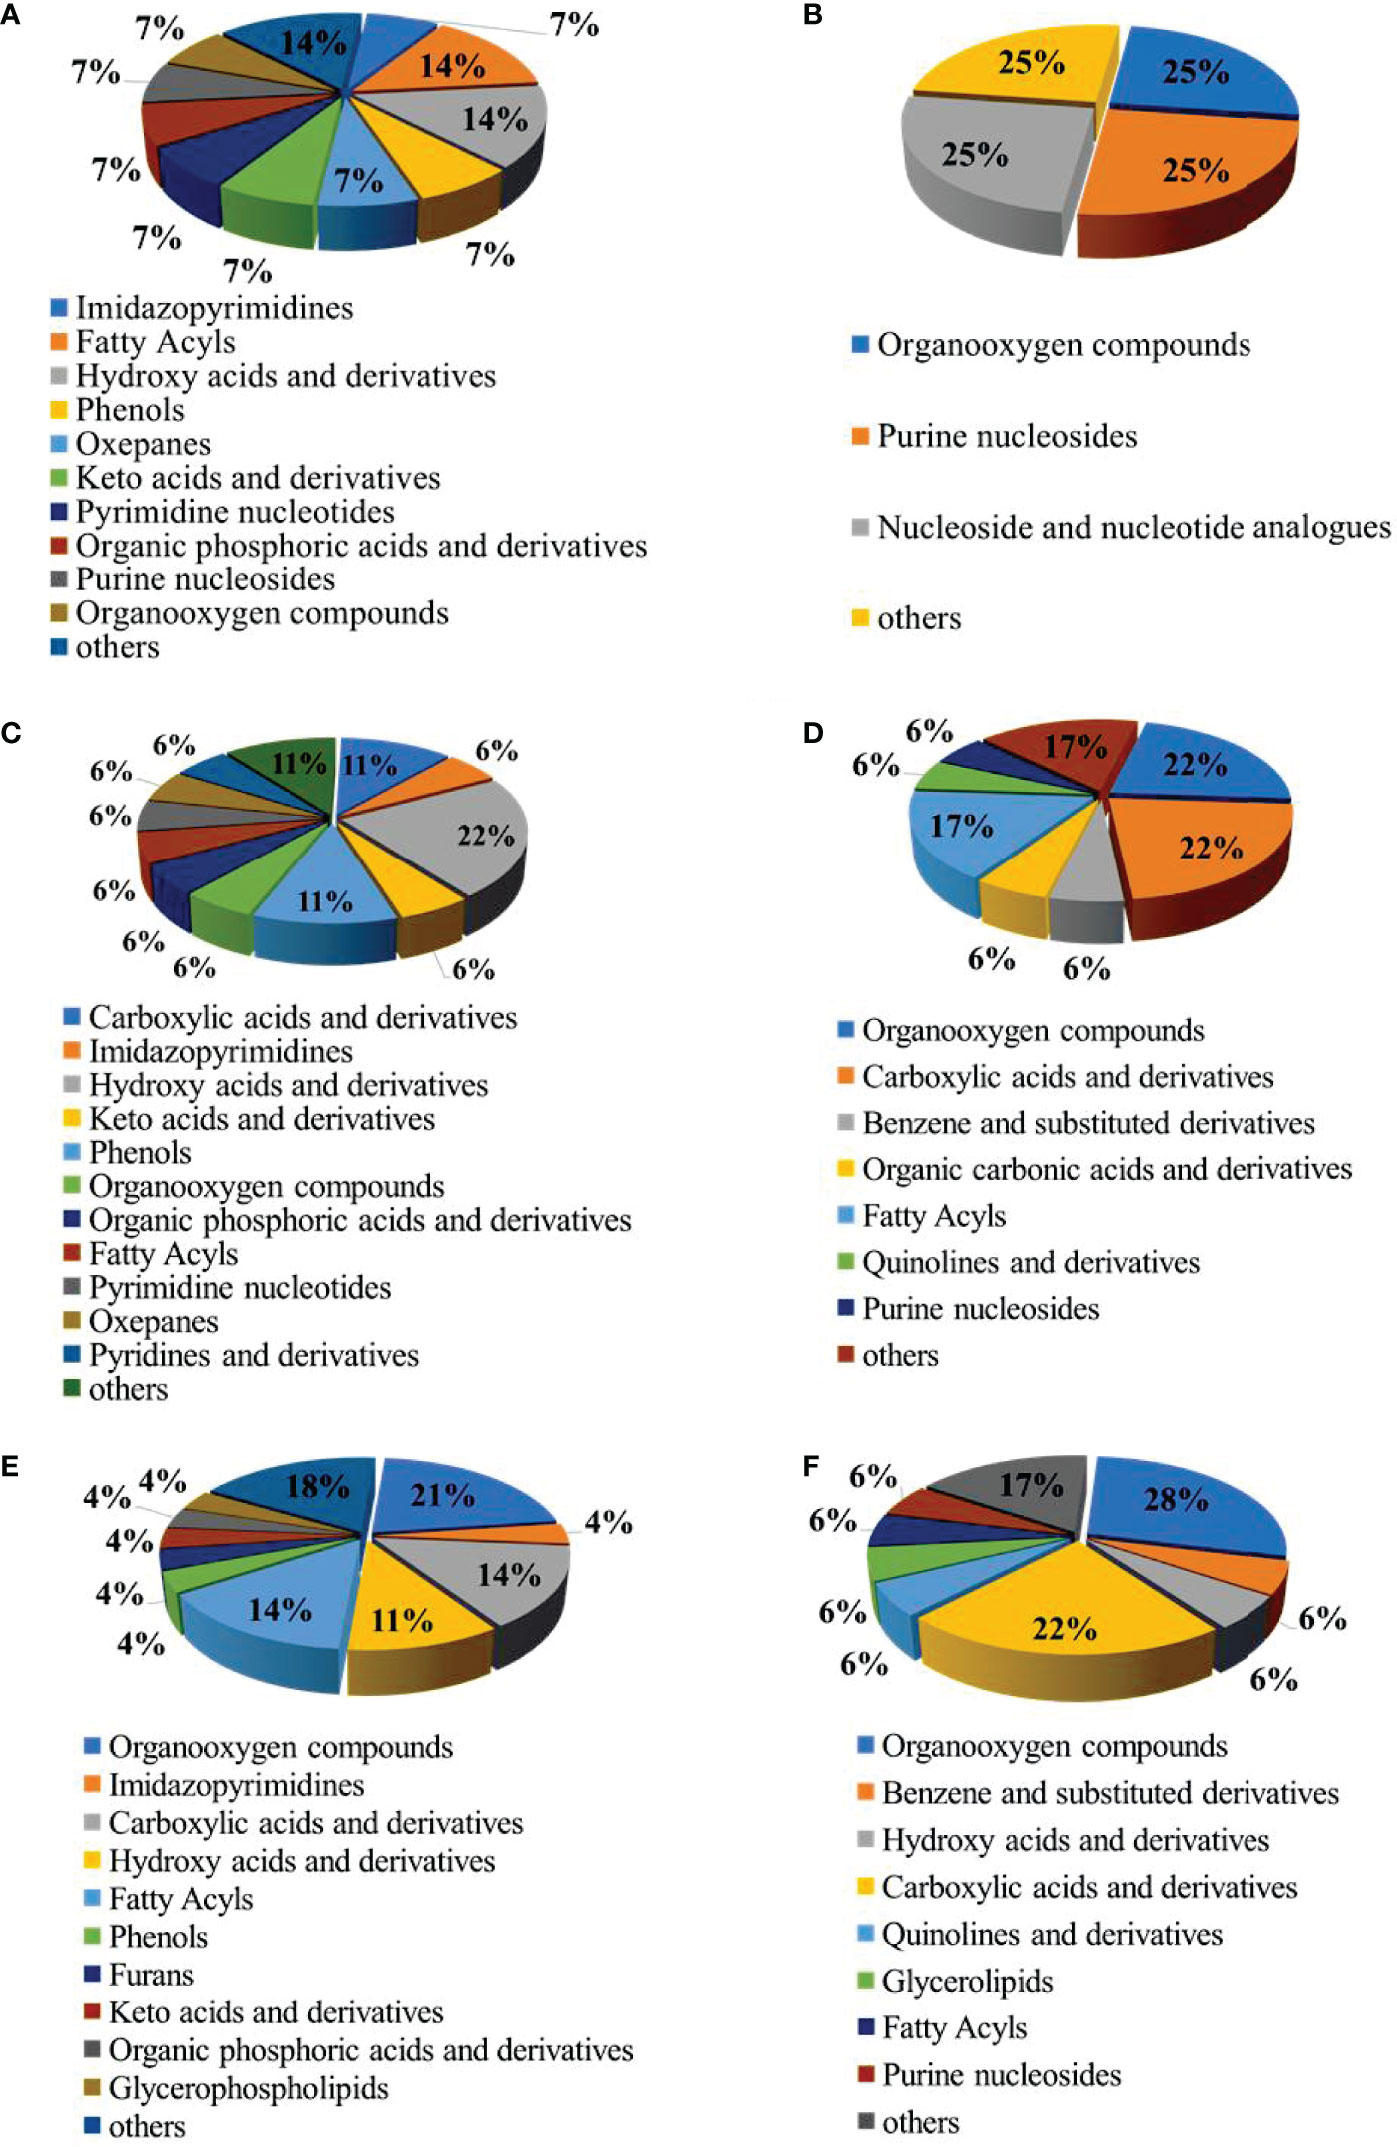
Figure 4 The pie chart of the differential metabolite classification: Up-regulated metabolites in gills of LCvsNC group (A), MCvsNC group (C) and SCvsNC group (E); down-regulated metabolites in gills of LCvsNC group(B), MCvsNC group(D)and SCvsNC group (F).
In summary, the number of differential metabolites increased with decreasing salinity. The up-regulated differential metabolites were mainly concentrated in hydroxy acids and their derivatives, carboxylic acids and their derivatives and fatty acyl groups, while the down-regulated differential metabolites were mainly concentrated in organooxygen compounds and carboxylic acids and their derivatives.
Correlation Analysis of Differential Metabolites With Salinity Changes
To find the common effects of different levels of low salt stress on the crab metabolism, we used a Wayne diagram to compare the three groups of differential metabolites (Figure 5A). The results showed that there were nine common differential metabolites in the three different treatments, including six common up-regulated metabolites and three common down-regulated metabolites. Among them, the up-regulated metabolites included keto acids and derivatives (pyruvate), hydroxy acids and derivatives (malic acid), fatty acyl (2,4-hexadienedioic acid), organophosphate and derivatives (phosphoethanolamine), imidazopyridine (hypoxanthine) and other classes [4 -(5-methyl-2-furanyl)-2-butanone]. The three down-regulated common differential metabolites included organoxylates (butane-2,3-diol), purine nucleoside (inosine) and other categories (triacontanol). In addition to the nine common differential metabolites mentioned above, there were four common differential metabolites between the LCvsNC and MCvsNC groups and 14 common differential metabolites between the MCvsNC and SCvsNC groups (Figure 5A).
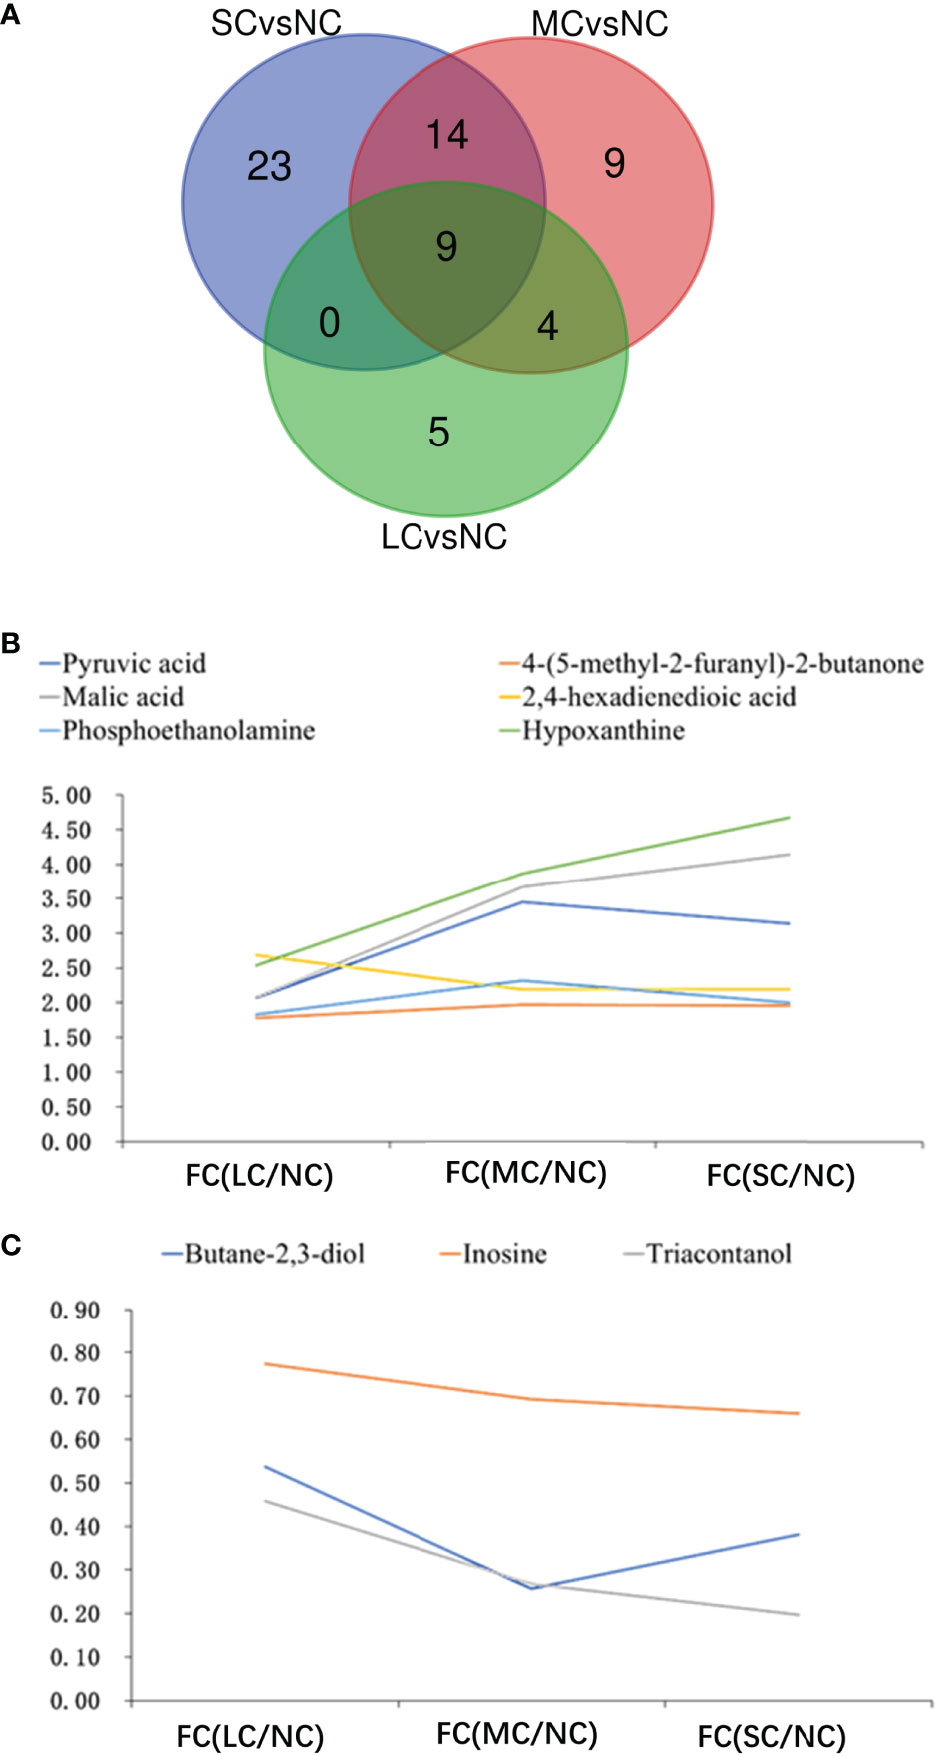
Figure 5 Association analysis of differential metabolites in the three groups:Venn diagram of mutual differential metabolites (A); FC figures of mutual up-regulated metabolites (B) and down-regulated metabolites (C) in gills. In a, Green circle represents SCvsNC group, red circle represents MCvsNC group, blue circle represents LCvsNC group; the number in the figure represents the amount of different metabolites after intersection.
Among the nine differential metabolites commonly contained in the three groups, there was a certain potency relationship between the expression of metabolites and salinity. The FC values of the up-regulated differential products like pyruvate, malic acid, phosphoethanolamine, hypoxanthine, and 4 -(5-methyl-2-furanyl)-2-butanone increased with decreasing salinity (Figure 5B), that is, the expression of up-regulated differential metabolites increased. The FC values of malic acid and ethanolamine phosphate increased greatly with decreasing salinity, from 2.08 to 4.14 for malic acid and from 2.54 to 4.67 for ethanolamine phosphate. With the decrease of salinity, the FC values of the three common down-regulated differential metabolites decreased, among which the FC value of the triacontanol decreased greatly, and their FC values decreased from 0.46 to 0.20.
The researchers discovered that when salinity reduced, the contents of pyruvate, malic acid, ethanolamine phosphate, hypoxanthine, and 4 -(5-methyl-2-furanyl)-2-butanone increased, while the levels of butane-2,3-diol and inosine decreased (Figure 5C). These results suggest that the aforementioned compounds serve as osmoregulators in the gills to help swimming crabs adapt to low salinity.
Analysis of Metabolic Pathways Related to Differential Metabolites at Different Salinities
Metabolic spectrum can reveal individual differential metabolites as well as provide a comprehensive understanding of metabolic pathway induced by salinity reductions.
The metabolic pathway enrichment analysis of the differential metabolites, combined with the p-values obtained from the enrichment analysis and the pathway impact values obtained from the topological analysis, revealed that the LCvsNC group enriched 46 metabolic pathways, of which 17 were significantly affected (p<0.05) and 29 were non-significantly affected. The metabolic pathways that were significantly affected included citric acid cycle (TCA cycle), glucagon signaling pathway, pyruvate metabolism, and purine metabolism (Figure 6A). The MCvsNC group has 60 metabolic pathways, 21 of which were significantly impacted (p<0.05). The significantly affected metabolic pathways included citric acid cycle (TCA cycle), glucagon signaling pathway, glyoxylate and dicarboxylic acid metabolism, glycolysis/gluconeogenesis, pyruvate metabolism, pentose phosphate pathway, HIF-1 signaling pathway glycine, serine and threonine metabolism, etc. (Figure 6B). A total of 62 metabolic pathways were enriched in the SCvsNC group, of which 20 metabolic pathways were significantly affected (p<0.05), overlapping with most of the metabolic pathways in the MC group. The significantly affected metabolic pathways included glucagon transmission, citric acid cycle (TCA cycle), glycolysis/gluconeogenesis, galactose metabolism, pyruvate metabolism, glycine, serine and threonine metabolism, alanine, aspartate and glutamate metabolism, and HIF-1 signaling pathway (Figure 6C).
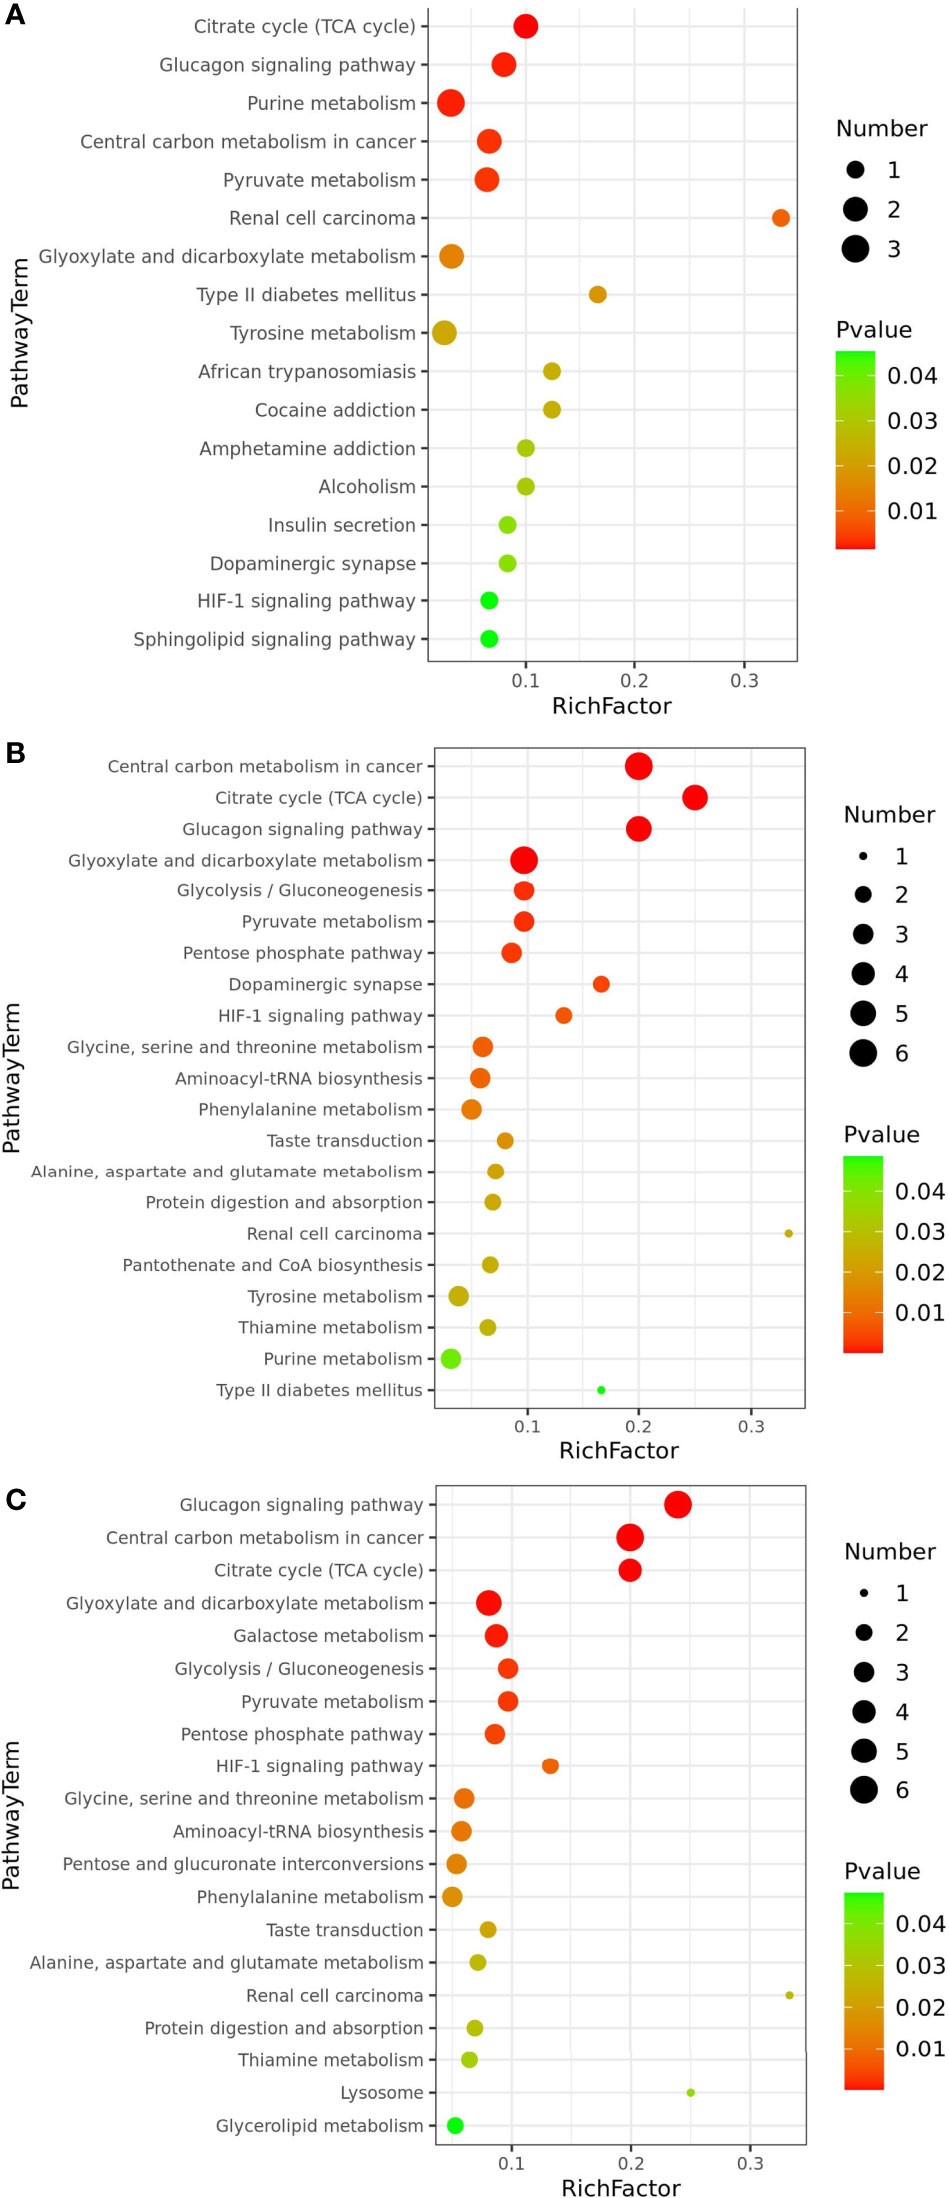
Figure 6 Significantly differential metabolic pathways associated with differential metabolites (p<0.05): LCvsNC group (A), MCvsNC group (B) and SCvsNC group (C).
The metabolic pathways significantly affected in the 3 groups were analyzed by Wayne diagram (Figure 7B), and 6 common differential metabolic pathways were found, including citric acid cycle (TCA cycle), glucagon signaling pathway, HIF-1 signaling pathway, and pyruvate metabolism. These pathways were related to carbohydrate metabolism and signal transduction in P. trituberculatus. When the salinity decreased from 16 to 12, the enrichment factors of citric acid cycle (TCA cycle), pyruvate metabolism, glucagon signaling, and HIF-1 signaling pathway increased (Figures 6A, B), indicating that the enrichment of energy-related metabolic pathways deepened when the salinity decreased from 16 to 12. When the salinity decreased from 12 to 8, 16 metabolic pathways in the SCvsNC group were the same as those in the MCvsNC group (Figure 7B) indicating that the metabolic pathway species of swimming crabs changed little after the salinity decreased to 12. The 16 significantly different metabolic pathways contained five carbohydrate metabolisms and three amino acid or other amino acid metabolisms. The former included TCA cycle, pyruvate metabolism, glyoxylate and dicarboxylic acid metabolism, glycolysis/gluconeogenesis, and pentose phosphate pathways, and the latter included alanine, aspartate and glutamate metabolism, phenylalanine metabolism, glycine, serine and threonine metabolism.
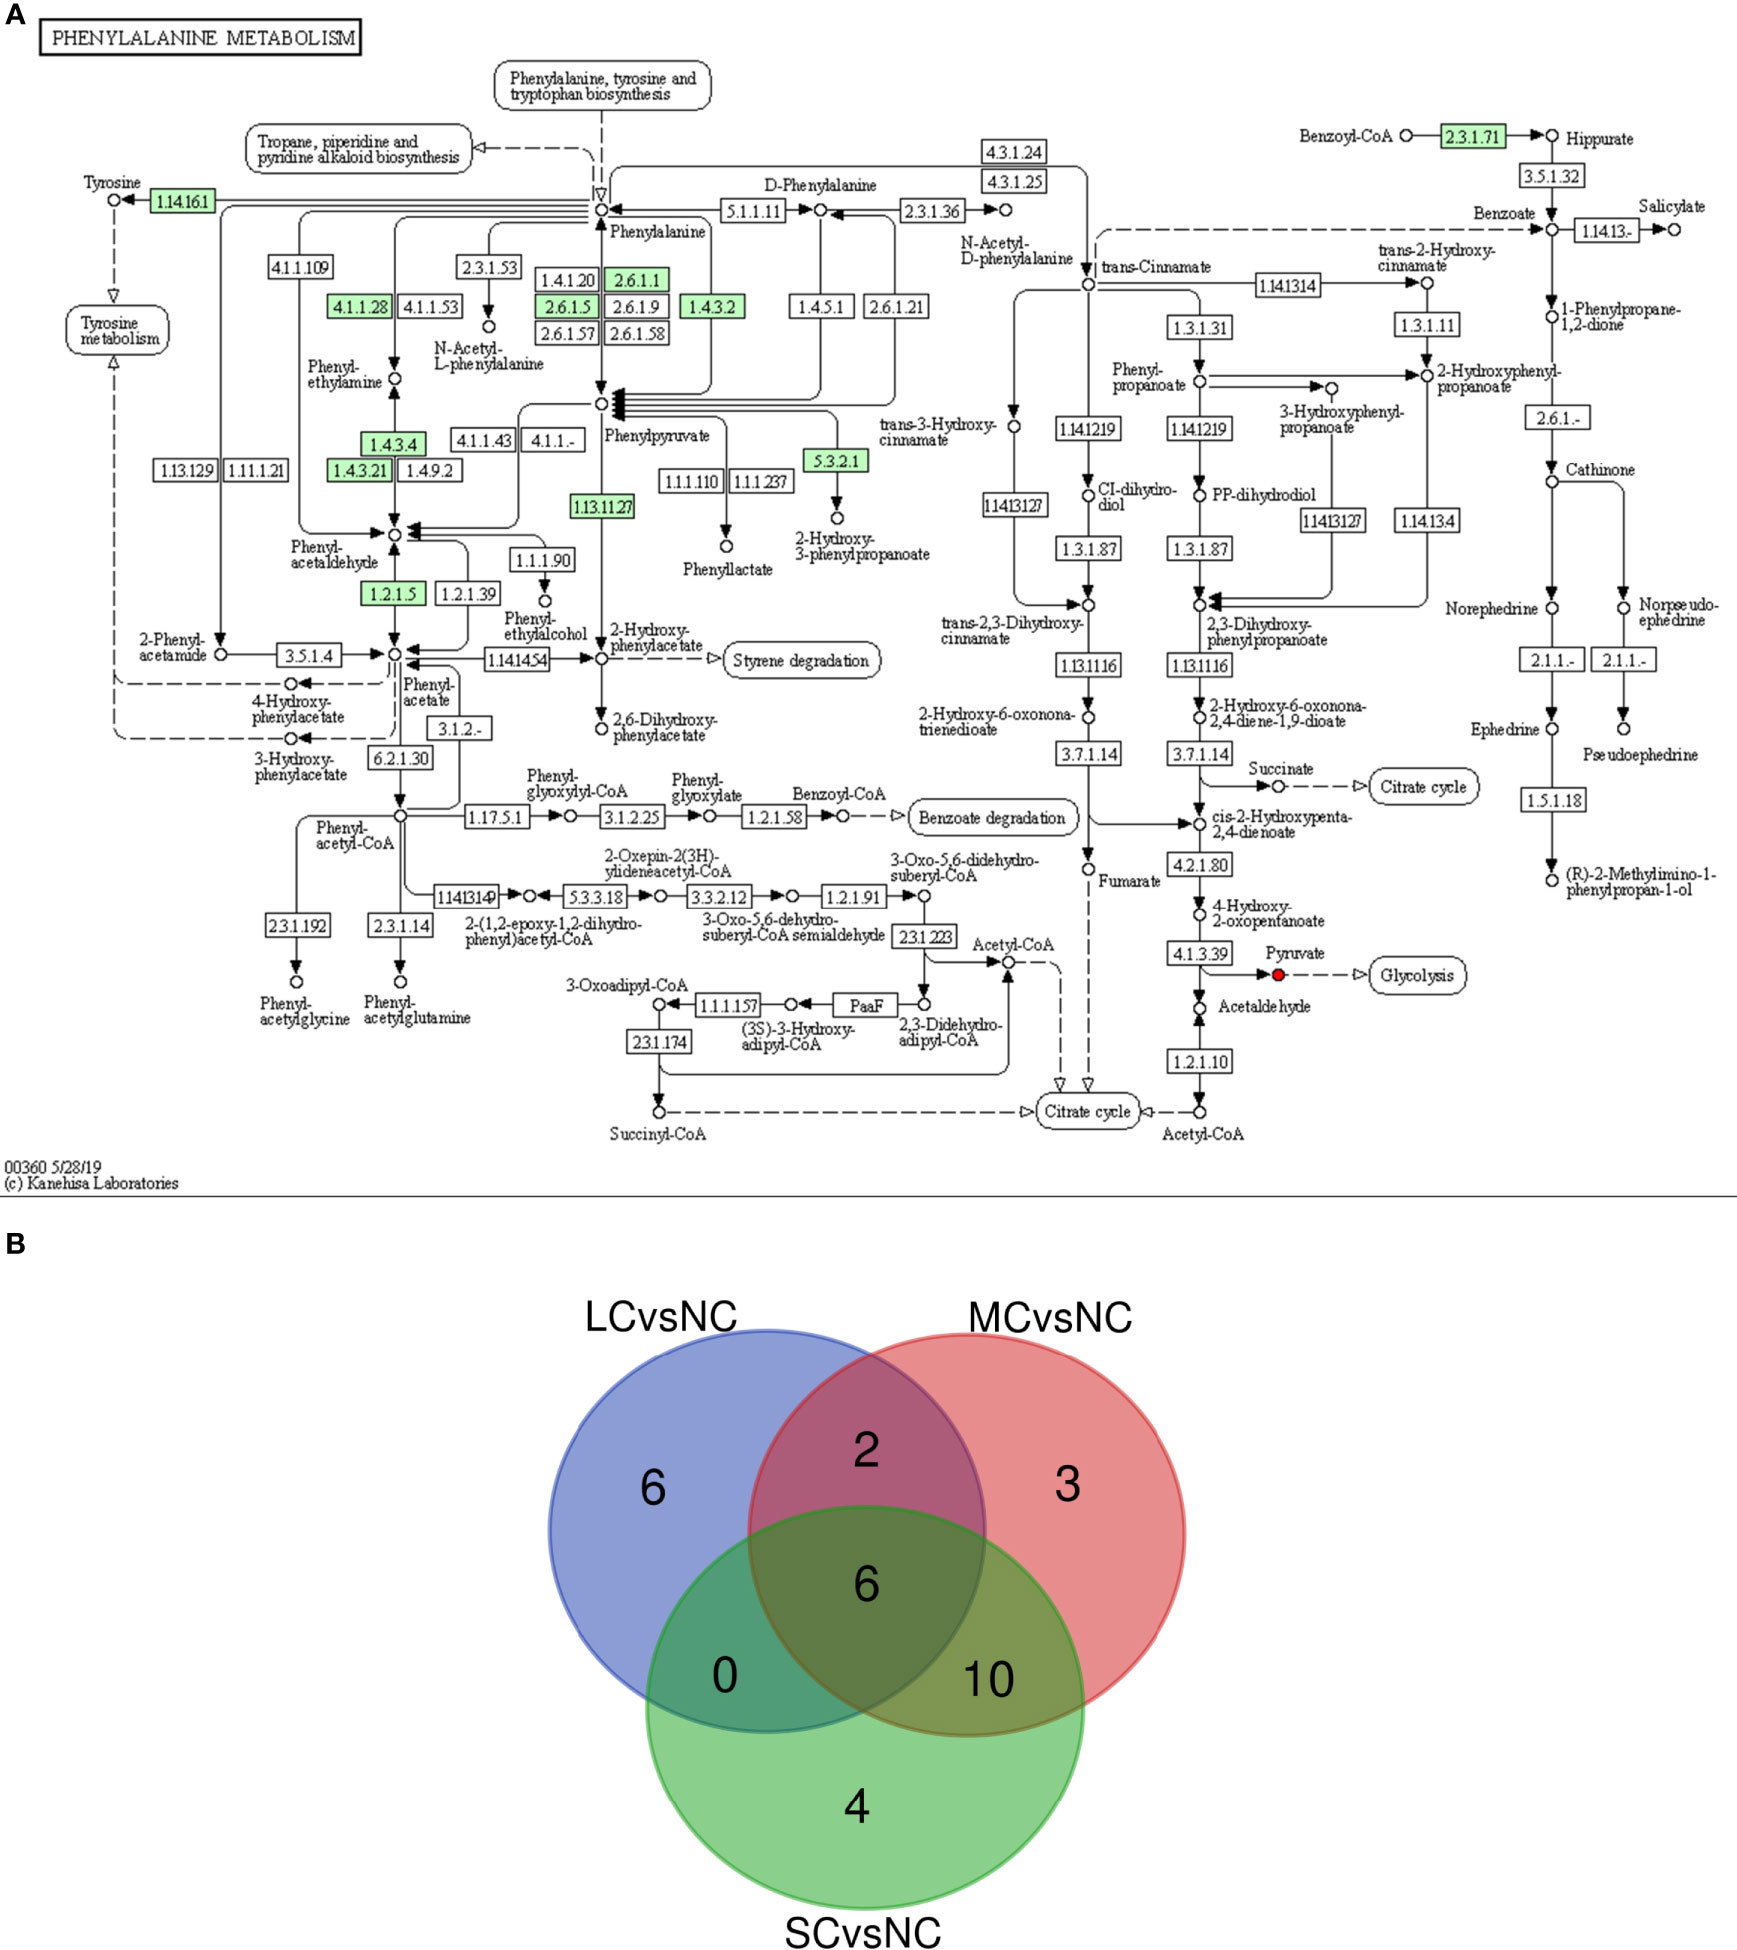
Figure 7 Phenylalanine metabolic pathway (A) and Venn diagram of mutual significant metabolic pathways (B). In a, “→” indicates the reaction direction, the small box indicates the enzyme activity, the small circle indicates the compound, the red indicates the up-regulated compound, the blue indicates the down-regulated compound, the large round box indicates the other metabolic pathway, and the dotted arrow indicates the relationship with other metabolic pathways, small green squares indicate enzymes unique to the species. In b, Green circle represents SCvsNC group, red circle represents MCvsNC group, blue circle represents LCvsNC group, the number in the figure represents the amount of different metabolites after intersection.
The above results showed that the number of differential metabolic pathways increased with decreasing salinity. The significantly affected differential metabolic pathways in the three experimental groups included TCA cycle and pyruvate metabolism, mainly involving differential metabolites such as citric acid, malic acid, pyruvate and so on. The results imply that TCA cycle and pyruvate metabolism serving as energy supply provided an extremely important role in the osmotic regulation of swimming crabs.
Discussion
Several reports have shown that salinity and its potential changes will affect the survival of aquatic organisms (Charmantier, 1998). Aquatic crustaceans adapt to different salinity environments mainly through the process of osmotic regulation (Romano and Zeng, 2012), and gills are the main sites for the regulation of osmotic pressure and blood ion concentration in crustaceans (Shen et al., 2020). In this study, we used GC-MS techonolgy to investigate the metabolic response of osmotic regulation in gills of P. trituberculatus under short-term low salt stress. The result showed that a total of 64 difference metabolites were extracted from gill tissue of swimming crabs using non-targeted metabolomics techniques. And the number of differential metabolites increased significantly with decreasing salinity. According to the results of metabolic pathway enrichment analysis, the number of differential metabolic pathways also increased with the decrease in salinity. Especially when the salinity was reduced from 16 to 12, the number of differential metabolic pathways increased greatly, but when the salinity was reduced from 12 to 8, the number and species of differential metabolic pathways did not change obviously. It is suggested that salinity 12 may be an important node for P. trituberculatus to adapt to low salinity.
Free amino acids (FAAs) are important cellular osmotic substances and sources of energy supply. They are involved in the regulation of osmotic pressure in aquatic organisms (Sun et al., 2021). Among the differential metabolites screened in this study, the down-regulated amino acids included phenylalanine, glycine, and citrulline. This result may be explained by the fact that low salt stress induced glycine catabolic processes in P. trituberculatus (Lv et al., 2013). This result is similar to the conclusion of Nile tilapia and Litopenaeus vannamei. In Nile tilapia, the content of phenylalanine increased under acute salinity stress (Liu et al., 2018). And in Litopenaeus vannamei, the content of organic osmolytes such as phenylalanine and glycine increased under salinity stress (Gomez-Jimenez et al., 2004). It is suggested that phenylalanine and glycine play a significant role in osmotic regulation. In phenylalanine metabolic pathway (Figure 7A), phenylalanine can be metabolized into acetyl-CoA and succinyl-CoA for the TCA cycle, and indirectly participates in energy metabolism. Glycine is the most basic amino acid found in animals, and it is involved in energy metabolism processes such as glycan metabolism and the TCA cycle. Hence, it could be hypothesized that glycine and phenylalanine are used for energy metabolism in osmotic regulation, causing a decrease in their content in the gills.
Several reports have shown that osmoregulation in crustaceans is an energy-consuming process (Charmantier, 1998; Ye et al., 2009; Mazzarelli et al., 2015; Ramaglia et al., 2018; Huang et al., 2019) and its main modalities include ion transport in gill epithelial cell (Ramaglia et al., 2018), intracellular proteolysis and amino acid release (Sokolova et al., 2012). In comparison to the control NC group, the LC, MC, and SC groups had nine same identical different metabolites, among which pyruvate, malic acid, and phosphoethanolamine were up-regulated. The degree of up-regulation increased as salinity decreased. Thus, these organic molecules were essential indicators for gill metabolism of P. trituberculatus in response to low salt stress. Furthermore, both the MCvsNC and SCvsNC groups exhibited a significantly different metabolite, lactate, which is the embodiment of cell anaerobic respiration. Pyruvate is oxidatively decarboxylated to produce acetyl-CoA, which links the metabolism of the three major nutrients: sugar, fat and amino acids. Pyruvate and lactate are also jointly involved in the glycolysis/gluconeogenesis process. Glycolysis is an irreversible reaction that produces pyruvate and lactate, which increases their levels in the tissues. These findings suggest that the increase of pyruvate and lactate levels is linked to the energy supply of osmotic regulation. Malic acid is also an important intermediary in the TCA cycle, and it had the highest VIP value of all the up-regulated organic acids in our study, confirming that malic acid is an essential osmoregulatory agent for crabs. It has been found that the content of malic acid increases significantly under salinity stress in plants (Derakhshani et al., 2020; Panda et al., 2021), but the change of malic acid metabolism in crustaceans has not been reported. Pyruvate, lactic acid, and malic acid are critical intermediates of sugar metabolism, which may play a role in the adaptation of P. trituberculatus to low salt.
Pyruvate and derivatives have been proven to be essential endogenous ROS scavengers with the potential to reduce inflammation and prevent illnesses induced by oxidative stress (Kładna et al., 2015). Under low salt stress, the activity of electron transport chain enzymes in the gill mitochondria of Scylla serrata is reduced (Paital and Chainy, 2012), and electrons will escape from the electron transport chain to create ROS (Kim et al., 2006; Kumar et al., 2017), causing oxidative cellular damage (Lushchak, 2011). HIF-1 signaling has been found to accelerate glycolysis, resulting in the massive synthesis of pyruvate, to prevent producing toxic ROS and maintain ATP levels in the body (Kim et al., 2006). Thus, it is proposed that crabs under low salt stress will boost glycolysis by stimulating the HIF-1 signaling pathway, increase the content of pyruvate and lactate levels in tissues and prevent the body from being poisoned by ROS. Besides, among up-regulated differential metabolites, o-phosphatidylserine, a precursor of phosphatidylserine (PS), and phosphoethanolamine increased with decreasing salinity. In the Kennedy pathway, phosphoethanolamine can manufacture the two most prevalent phospholipids in the cell membrane, phosphatidylethanolamine (PE) and phosphatidylcholine (PC) (Fontana et al., 2020). In extensively saline crustaceans, PS can be decarboxylated to form PE, which is further methylated to PC, altering the cell membrane structure for rapid adaptation (Zwingelstein et al., 1998). A considerable rise in PC content was detected in the gills of Scylla paramamosain during acute hyposaline stress (Yao et al., 2021). The increased amount of o-phosphoserine and phosphoethanolamine in the gills of P.trituberculatus is thought to boost the production of cell membrane phospholipid and protect the osmoregulation function of cell membranes.
Conclusion
In this study, the metabolic response in the gills of Portunus trituberculatus under various short-term low salinity stress were analyzed, and the number of differential metabolites increased with decreasing salinity. Among the nine common differential metabolites, six metabolites including pyruvate, malic acid and ethanolamine phosphate were up-regulated and three metabolites such as inosine were down-regulated. KEGG enrichment analysis of differential metabolites showed that the number of differential metabolic pathways increased with decreasing salinity. There were 6 common differential metabolic pathways, including pyruvate metabolism, citric acid cycle (TCA cycle), glucagon signaling pathway, and HIF-1 signaling pathway. These metabolic pathways were mainly related to carbohydrate metabolism, signaling and other metabolic processes. In the process of this adaptation, organic acids play a significant role, while carbohydrate metabolism provides energy supply. This research contributes to a better understanding of the metabolic mechanism of osmotic regulation and adaptation to low salinity in crustaceans, with the goal of improving Portunus trituberculatus culture technique.
Data Availability Statement
The original contributions presented in the study are included in the article/supplementary material. Further inquiries can be directed to the corresponding authors.
Ethics Statement
Ethical review and approval was not required for the animal study because the animal subjects used in the present study are crabs, which are invertebrates and are exempt from this requirement.
Author Contributions
HW conceived and designed the study. JW, QL, XZ, and FW took samples of experimental animals. JW, QL, XZ, GG, and MN performed and analyzed all the other experiments. JW, QL, and XZ analysed and interpreted results. JW, XZ, GG, MN, LC, CW, and CM checked the paper. JW and QL wrote the manuscript with support from all authors. All authors read and approved the final manuscript.
Funding
This work was supported by the National Key R&D Program of China (2020YFD0900203); China Agriculture Research System of MOF and MARA, the K. C.Wong Magna Fund in Ningbo University. The funders had no role in the study design, data collection, and analysis, decision to publish, or preparation of the manuscript
Conflict of Interest
The authors declare that the research was conducted in the absence of any commercial or financial relationships that could be construed as a potential conflict of interest.
Publisher’s Note
All claims expressed in this article are solely those of the authors and do not necessarily represent those of their affiliated organizations, or those of the publisher, the editors and the reviewers. Any product that may be evaluated in this article, or claim that may be made by its manufacturer, is not guaranteed or endorsed by the publisher.
References
Augusto A., Greene L. J., Laure H. J., McNamara J. C. (2007). The Ontogeny of Isosmotic Intracellular Regulation in the Diadromous, Freshwater Palaemonid Shrimps, Macrobrachium Amazonicum and M. Olfersi (Decapoda). J. Crustacean Biol. 27 (4), 626–634. doi: 10.1651/S-2796.1
Charmantier G. (1998). Ontogeny of Osmoregulation in Crustaceans: A Review. Invertebrate Reprod. Dev. 33 (2-3), 177–190. doi: 10.1080/07924259.1998.9652630
Chen X., Chen J., Shen Y., Bi Y., Hou W., Pan G., et al. (2019). Transcriptional Responses to Low-Salinity Stress in the Gills of Adult Female Portunus Trituberculatus. Comp. Biochem. Physiol. Part D Genomics Proteomics 29, 86–94. doi: 10.1016/j.cbd.2018.11.001
de Faria S. C., Augusto A. S., McNamara J. C. (2011). Intra- and Extracellular Osmotic Regulation in the Hololimnetic Caridea and Anomura: A Phylogenetic Perspective on the Conquest of Fresh Water by the Decapod Crustacea. J. Comp. Physiol. B 181 (2), 175–186. doi: 10.1007/s00360-010-0522-6
Derakhshani Z., Bhave M., Shah R. M. (2020). Metabolic Contribution to Salinity Stress Response in Grains of Two Barley Cultivars With Contrasting Salt Tolerance. Environ. Exp. Bot. 179, 104229. doi: 10.1016/j.envexpbot.2020.104229
Feng Y., Zhang D., Lv J., Gao B., Li J., Liu P. (2019). Identification of SNP Markers Correlated With the Tolerance of Low-Salinity Challenge in Swimming Crab (Portunus Trituberculatus). Acta Oceanolog Sin. 38 (8), 41–47. doi: 10.1007/s13131-019-1428-0
Fontana D., Mauri M., Renso R., Docci M., Crespiatico I., Røst L. M., et al. (2020). ETNK1 Mutations Induce a Mutator Phenotype That can be Reverted With Phosphoethanolamine. Nat. Commun. 11 (1), 5938. doi: 10.1038/s41467-020-19721-w
Gao B., Sun D., Lv J., Ren X., Liu P., Li J. (2019). Transcriptomic Analysis Provides Insight Into the Mechanism of Salinity Adjustment in Swimming Crab Portunus Trituberculatus. Genes Genomics 41 (8), 961–971. doi: 10.1007/s13258-019-00828-4
Gomez-Jimenez S., Urias-Reyes A. A., Vazquez-Ortiz F., Hernandez-Watanabe G. (2004). Ammonia Efflux Rates and Free Amino Acid Levels in Litopenaeus Vannamei Postlarvae During Sudden Salinity Changes. Aquaculture 233 (1-4), 573–581. doi: 10.1016/j.aquaculture.2003.09.050
Huang Y. H., Zhang M., Li Y. M., Wu D. L., Liu Z. Q., Jiang Q. C., et al. (2019). Effects of Salinity Acclimation on the Growth Performance, Osmoregulation and Energy Metabolism of the Oriental River Prawn, Macrobrachium Nipponense (De Haan). Aquacult Res. 50 (2), 685–693. doi: 10.1111/are.13950
Kim J. W., Tchernyshyov I., Semenza G. L., Dang C. V. (2006). HIF-1-Mediated Expression of Pyruvate Dehydrogenase Kinase: A Metabolic Switch Required for Cellular Adaptation to Hypoxia. Cell Metab. 3 (3), 177–185. doi: 10.1016/j.cmet.2006.02.002
Kładna A., Marchlewicz M., Piechowska T., Kruk I., Aboul-Enein H. Y. (2015). Reactivity of Pyruvic Acid and its Derivatives Towards Reactive Oxygen Species. Luminescence 30 (7), 1153–1158. doi: 10.1002/bio.2879
Kumar V., Khare T., Sharma M., Wani S. H. (2017). ““ROS-Induced Signaling and Gene Expression in Crops Under Salinity Stress,”,” in Reactive Oxygen Species and Antioxidant Systems in Plants: Role and Regulation Under Abiotic Stress.), 159–184. Singapore: Springer Nature. doi: 10.1007/978-981-10-5254-5_7
Liu Y., Li E., Xu C., Su Y., Qin J. G., Chen L., et al. (2018). Brain Transcriptome Profiling Analysis of Nile Tilapia (Oreochromis Niloticus) Under Long-Term Hypersaline Stress. Front. Physiol. 9. doi: 10.3389/fphys.2018.00219
Long X., Wu X., Zhao L., Ye H., Cheng Y., Zeng C. (2017). Effects of Salinity on Gonadal Development, Osmoregulation and Metabolism of Adult Male Chinese Mitten Crab, Eriocheir Sinensis. PloS One 12 (6), e0179036. doi: 10.1371/journal.pone.0179036
Lushchak V. I. (2011). Environmentally Induced Oxidative Stress in Aquatic Animals. Aquat Toxicol. 101 (1), 13–30. doi: 10.1016/j.aquatox.2010.10.006
Lu J.-Y., Shu M.-A., Xu B.-P., Liu G.-X., Ma Y.-Z., Guo X.-L., et al. (2015). Mud Crab Scylla Paramamosain Glutamate Dehydrogenase: Molecular Cloning, Tissue Expression and Response to Hyposmotic Stress. Fish Sci. 81 (1), 175–186. doi: 10.1007/s12562-014-0828-5
Lu Y. L., Wang F., Jia X. Y., Gao Q. F., Dong S. L. (2013). A Laboratory Simulation of the Effects of Acute Salinity Decrease on Osmoregulation and Hsps Expression in the Swimming Crab, Portunus Trituberculatus: Implications for Aquaculture. Marine Freshwater Behav. Physiol. 46 (5), 301–311. doi: 10.1080/10236244.2013.832573
Lv J., Liu P., Gao B., Li J. (2016). The Identification and Characteristics of Salinity-Related microRNAs in Gills of Portunus Trituberculatus. Cell Stress Chaperones 21 (1), 63–74. doi: 10.1007/s12192-015-0641-9
Lv J., Liu P., Wang Y., Gao B., Chen P., Li J. (2013). Transcriptome Analysis of Portunus Trituberculatus in Response to Salinity Stress Provides Insights Into the Molecular Basis of Osmoregulation. PloS One 8 (12), e82155. doi: 10.1371/journal.pone.0082155
Lv J., Sun D., Yan D., Ti X., Liu P., Li J. (2019). Quantitative Trait Loci Mapping and Marker Identification for Low Salinity Tolerance Trait in the Swimming Crab (Portunus Trituberculatus). Front. Genet. 10. doi: 10.3389/fgene.2019.01193
Mazzarelli C. C., Santos M. R., Amorim R. V., Augusto A. (2015). Effect of Salinity on the Metabolism and Osmoregulation of Selected Ontogenetic Stages of an Amazon Population of Macrobrachium Amazonicum Shrimp (Decapoda, Palaemonidae). Braz. J. Biol. 75 (2), 372–379. doi: 10.1590/1519-6984.14413
McNamara J. C., Faria S. C. (2012). Evolution of Osmoregulatory Patterns and Gill Ion Transport Mechanisms in the Decapod Crustacea: A Review. J. Comp. Physiol. B 182 (8), 997–1014. doi: 10.1007/s00360-012-0665-8
Paital B., Chainy G. B. (2012). Effects of Salinity on O2 Consumption, ROS Generation and Oxidative Stress Status of Gill Mitochondria of the Mud Crab Scylla Serrata. Comp. Biochem. Physiol. C Toxicol. Pharmacol. 155 (2), 228–237. doi: 10.1016/j.cbpc.2011.08.009
Panda A., Rangani J., Parida A. K. (2021). Unraveling Salt Responsive Metabolites and Metabolic Pathways Using non-Targeted Metabolomics Approach and Elucidation of Salt Tolerance Mechanisms in the Xero-Halophyte Haloxylon Salicornicum. Plant Physiol. Biochem. 158, 284–296. doi: 10.1016/j.plaphy.2020.11.012
Ramaglia A. C., de Castro L. M., Augusto A. (2018). Effects of Ocean Acidification and Salinity Variations on the Physiology of Osmoregulating and Osmoconforming Crustaceans. J. Comp. Physiol. B 188 (5), 729–738. doi: 10.1007/s00360-018-1167-0
Ren L. P., Qin Y., Li X. C., Sun Y. N., Wang R. X. (2013). Isolation and Characterization of Polymorphic Microsatellite Loci in the Swimming Crab Portunus Trituberculatus (Portunidae). Genet. Mol. Res. 12 (4), 5911–5915. doi: 10.4238/2013.November.22.19
Romano N., Zeng C. (2012). Osmoregulation in Decapod Crustaceans: Implications to Aquaculture Productivity, Methods for Potential Improvement and Interactions With Elevated Ammonia Exposure. Aquaculture 334-337, 12–23. doi: 10.1016/j.aquaculture.2011.12.035
Shen G., Zhang X., Gong J., Wang Y., Huang P., Shui Y., et al. (2020). Transcriptomic Analysis of Procambarus Clarkii Affected by “Black May” Disease. Sci. Rep. 10 (1), 21225. doi: 10.1038/s41598-020-78191-8
Sokolova I. M., Frederich M., Bagwe R., Lannig G., Sukhotin A. A. (2012). Energy Homeostasis as an Integrative Tool for Assessing Limits of Environmental Stress Tolerance in Aquatic Invertebrates. Marine Environ. Res. 79, 1–15. doi: 10.1016/j.marenvres.2012.04.003
Sun Y. C., Han S. C., Yao M. Z., Wang Y. M., Geng L. W., Wang P., et al. (2021). High-Throughput Metabolomics Method Based on Liquid Chromatography-Mass Spectrometry: Insights Into the Underlying Mechanisms of Salinity-Alkalinity Exposure-Induced Metabolites Changes in Barbus Capito. J. Sep Sci. 44 (2), 497–512. doi: 10.1002/jssc.202000861
Xu Q., Liu Y. (2011). Gene Expression Profiles of the Swimming Crab Portunus Trituberculatus Exposed to Salinity Stress. Marine Biol. 158 (10), 2161–2172. doi: 10.1007/s00227-011-1721-8
Yao H., Li X., Chen Y., Liang G., Gao G., Wang H., et al. (2021). Metabolic Changes in Scylla Paramamosain During Adaptation to an Acute Decrease in Salinity. Front. Marine Sci. 8. doi: 10.3389/fmars.2021.734519
Ye Y., An Y., Li R., Mu C., Wang C. (2014). Strategy of Metabolic Phenotype Modulation in Portunus Trituberculatus Exposed to Low Salinity. J. Agric. Food Chem. 62 (15), 3496–3503. doi: 10.1021/jf405668a
Ye L., Jiang S., Zhu X., Yang Q., Wen W., Wu K. (2009). Effects of Salinity on Growth and Energy Budget of Juvenile Penaeus Monodon. Aquaculture 290 (1-2), 140–144. doi: 10.1016/j.aquaculture.2009.01.028
Zwingelstein G., Bodennec J., Brichon G., Abdul-Malak N., Chapelle S., El Babili M. (1998). Formation of Phospholipid Nitrogenous Bases in Euryhaline Fish and Crustaceans. I. Effects of Salinity and Temperature on Synthesis of Phosphatidylserine and its Decarboxylation. Comp. Biochem. Physiol. - B Biochem. Mol. Biol. 120 (3), 467–473. doi: 10.1016/S0305-0491(98)10031-7
Keywords: Portunus trituberculatus, low salt stress, gills, GC-MS technology, metabolic response
Citation: Wang J, Liu Q, Zhang X, Gao G, Niu M, Wang H, Chen L, Wang C, Mu C and Wang F (2022) Metabolic Response in the Gill of Portunus trituberculatus Under Short-Term Low Salinity Stress Based on GC-MS Technique. Front. Mar. Sci. 9:881016. doi: 10.3389/fmars.2022.881016
Received: 22 February 2022; Accepted: 29 March 2022;
Published: 20 April 2022.
Edited by:
Xiangli Tian, Ocean University of China, ChinaReviewed by:
Xianliang Meng, Chinese Academy of Fishery Sciences (CAFS), ChinaXugan Wu, Shanghai Ocean University, China
Copyright © 2022 Wang, Liu, Zhang, Gao, Niu, Wang, Chen, Wang, Mu and Wang. This is an open-access article distributed under the terms of the Creative Commons Attribution License (CC BY). The use, distribution or reproduction in other forums is permitted, provided the original author(s) and the copyright owner(s) are credited and that the original publication in this journal is cited, in accordance with accepted academic practice. No use, distribution or reproduction is permitted which does not comply with these terms.
*Correspondence: Huan Wang, d2FuZ2h1YW4xQG5idS5lZHUuY24=; Lizhi Chen, ODAwNzk3NDVAcXEuY29t
†These authors have contributed equally to this work
 Jiali Wang
 Qi Liu2†
 Gao Gao
 Huan Wang
 Chunlin Wang
 Changkao Mu
