 Pamela E. Michael1*
 Kathy M. Hixson1
 J. Christopher Haney2
 Yvan G. Satgé1Jeffrey S. Gleason3
 Patrick G. R. Jodice4
- 1South Carolina Cooperative Fish and Wildlife Research Unit, Department of Forestry and Environmental Conservation, Clemson University, Clemson, SC, United States
- 2Terra Mar Applied Sciences, Washington, DC, United States
- 3U.S. Fish and Wildlife Service, Gulf Restoration Office, Chiefland, FL, United States
- 4U.S. Geological Survey South Carolina Cooperative Fish and Wildlife Research Unit, Clemson University, Clemson, SC, United States
The northern Gulf of Mexico (nGoM) is a globally important region for oil extraction and supports a diverse assemblage of marine birds. Due to their frequent contact with surface waters, diverse foraging strategies, and the ease with which oil adheres to feathers, seabirds are particularly susceptible to hydrocarbon contamination. Given the chronic and acute exposure of seabirds to oiling and a lack of studies that focus on the exposure of seabirds to oiling in sub-tropical and tropical regions, a greater understanding of the vulnerability of seabirds to oil in the nGoM appears warranted. We present an oil vulnerability index for seabirds in the nGoM tailored to the current state of knowledge using new, spatiotemporally expensive vessel-based seabird observations. We use information on the exposure and sensitivity of seabirds to oil to rank seabird vulnerability. Exposure variables characterized the potential to encounter oil and gas (O&G). Sensitivity variables characterized the potential impact of seabirds interacting with O&G and are related to life history and productivity. We also incorporated uncertainty in each variable, identifying data gaps. We found that the percent of seabirds’ habitat defined as highly suitable within 10 km of an O&G platform ranged from 0%-65% among 24 species. Though O&G platforms only overlap with 15% of highly suitable seabird habitat, overlap occurs in areas of moderate to high vulnerability of seabirds, particularly along the shelf-slope. Productivity-associated sensitivity variables were primarily responsible for creating the gradient in vulnerability scores and had greater uncertainty than exposure variables. Highly vulnerable species (e.g., Northern gannet (Morus bassanus)) tended to have high exposure to the water surface via foraging behaviors (e.g., plunge-diving), older age at first breeding, and an extended incubating and fledging period compared to less vulnerable species (e.g., Pomarine jaeger (Stercorarius pomarinus)). Uncertainty related to productivity could be reduced through at-colony monitoring. Strategic seabird satellite tagging could help target monitoring efforts to colonies known to use the nGoM, and continued vessel-based observations could improve habitat characterization. As offshore energy development in the nGoM continues, managers and researchers could use these vulnerability ranks to identify information gaps to prioritize research and focal species.
1 Introduction
Offshore oil and gas (O&G) activities are important to regional and global economies, but acute and chronic exposure to oil and oil production byproducts can significantly impact marine fauna (Holdway, 2002). Due to their frequent contact with surface waters, diverse foraging strategies, and the ease with which oil adheres to feathers, marine avifauna (i.e., seabirds), are particularly sensitive to and often used as tracers of hydrocarbon contamination (Haney et al., 2017). Interactions of seabirds with oil can be temporally acute or chronic and can have sublethal to lethal effects (King et al., 2021). Oiling can impact organ function (Harr et al., 2017), offspring behavior (Szaro et al., 1978), body mass (Paruk et al., 2016), hormone levels (Champoux et al., 2020), and hematological parameters (Fallon et al., 2018) in birds. Such sublethal effects can even occur when oiling is not visible (Fallon et al., 2020). Even exposure to thin sheens of oil on the surface can compromise the microstructure of feathers, impairing thermoregulation (O’Hara and Morandin, 2010). The impacts of exposure to oil can be long-lasting and can reduce long-term reproductive success (Barros et al., 2014). In addition to these direct effects of exposure to oil, seabirds may be indirectly impacted by reduced prey availability (Golet et al., 2002). For these reasons, Dias et al. (2019) identified oil pollution as an important threat to seabirds at sea. Therefore, given the physiological and demographic sensitivity of seabirds to oiling, as well as their conservation status globally (Dias et al., 2019), efforts to both monitor populations for exposure to oiling (e.g., either directly or via physiological parameters) and predict spatial and temporal ‘hot spots’ for exposure to oiling appear warranted. A better understanding of where and when exposure is most likely to occur could enable efficient monitoring and management of seabird interactions with O&G.
The northern Gulf of Mexico (nGoM) is a globally significant region for oil extraction and an important habitat for a wide array of avifauna, including seabirds (Jodice et al., 2019; Wilson et al., 2019). Seabirds may be exposed to oil through acute events (e.g., oil spills) and chronic pathways (e.g., persistent leaks or discharges; Jodice et al., 2019; Lamb et al., 2020). Acute events tend to be relatively well documented. For example, between 1964 and 2010, approximately 120 oil spills per year occurred in the nGoM (BOEM spill statistics, 2012). The cumulative volume of oil spilled per year averaged ~24,000 barrels (BOEM spill statistics, 2012). Spills can vary dramatically in size and temporal extent. Between 1964-2010, most spills in the nGoM were small (range 1-50 barrels released), but they can be much larger (BOEM spill statistics, 2012). Long-duration events have occurred, resulting in chronic discharge from what was initially a single acute event. For example, Taylor Energy’s MC-20 Saratoga platform has released an estimated 1.3 and 5.0 million barrels of oil over the last 17 years. In contrast to acute events, chronic exposure to oil tends to be less understood and more challenging to measure, having lethal, sublethal, and cascading effects that slow the recovery of affected systems (Peterson et al., 2003). Furthermore, the release of produced waters, which contain fluids and byproducts of oil extraction, can be a significant source of chronic petrochemical release (Bakke et al., 2013; Beyer et al., 2020). An average of ~558 million barrels of produced water was discharged annually into the nGoM between 2000 and 2015 (BOEM, 2016). Given the levels of both acute and chronic exposure of seabirds to oiling in the nGoM, an assessment of the risk to seabirds from oiling appears warranted. To date, such an assessment has not been performed, mainly due to data gaps for the distribution and abundance of seabirds in this region (Jodice et al., 2019).
Assessing the risk that oiling poses to seabirds requires estimating exposure, sensitivity, and vulnerability. Herein, we define these terms similar to Nevalainen et al. (2019). Exposure relates to a species’ potential co-occurrence with oil, and sensitivity relates to the probability of mortality due to contact with oil and, subsequently, the relative impact on the population. Vulnerability is the synthesis of exposure and sensitivity, reflecting the overall potential to encounter oil and the impact of an encounter. One approach to assess seabirds’ exposure, sensitivity, and vulnerability to oiling is to apply indices. Indices are a broad-scale approach to synthesizing information from multiple sources and are a tool that stakeholders can apply without necessarily investing in detailed and labor-intensive measures. Researchers have used seabird-oil indices for decades (e.g., King and Sanger, 1979), and their complexity varies widely. Some exclusively assess spatial or temporal overlap (e.g., exposure to shipping, recreational boating, or O&G platforms; Humphries and Huettmann, 2014; Lieske et al., 2014; Renner and Kuletz, 2015; Fox et al., 2016). Others consider behavioral and life-history characteristics (e.g., sensitivity; Romero et al., 2018), and some have assessed a combination of life history and habitat overlap (Nevalainen et al., 2019). Some have also proposed (e.g., Polidoro et al., 2021; applied to marine fishes only in Woodyard et al., 2022), and others have applied (e.g., Nevalainen et al., 2019) indices across taxa. All of the indices above that have been applied to seabirds occur in polar to temperate environments. Although some species occur in cool and warm-water environments, the assemblage of seabird species in these environments differs notably from those warm-temperate to tropical environments, including the nGoM. This makes it difficult to understand the vulnerability of seabirds in the nGoM relative to the regional seabird assemblage using preexisting indices from different ecoregions.
One of the greatest obstacles to applying a seabird-oil index is often identifying relevant data and assessing their quality. For example, indices based on assessing the overlap of focal species with points of exposure require location or temporal occurrence of the focal taxa. Data on population dynamics may also be needed if indices seek to characterize the impact of increased mortality related to oil on the population trajectory of the focal taxa (Seip et al., 1991). The uncertainty surrounding data informing an index decreases as the quality and amount of data increases, but taxonomic groups, species, and regions are not uniformly studied. Detailed information from data-rich species and regions can be used to infer information on data-poor species (Bird et al., 2020), but the associated assumptions contribute to uncertainty. Natural variation between years, locations, and individuals can also produce uncertainty across individuals, amplifying the uncertainty of index scores. Some studies have intentionally presented indices at a relatively coarse spatial resolution to prevent over-interpretation (Fox et al., 2016). Other indices have characterized uncertainty through quantitative scoring of qualitative uncertainty ranks (Kelsey et al., 2018) or probability distributions (Nevalainen et al., 2019). Relative to other O&G extraction regions in the United States, few studies on the distribution and demographics of seabirds in the nGoM have been undertaken, making it challenging to apply detailed indices (e.g., Polidoro et al., 2021) without very high levels of uncertainty. Thus, defining, calculating, and applying an index involves making a series of decisions related to the species of interest, the data available, regional knowledge, and types and levels of uncertainty.
In this study, we assess the relative vulnerability of seabirds to oil via offshore O&G platforms on the outer continental shelf of the nGoM. Using existing indices and frameworks as examples, we create and apply a vulnerability to oiling index by characterizing a range of variables affecting the relative exposure potential and sensitivity of nGoM seabirds to oil. The information used in this index is derived from data aggregated from a literature review, O&G platform locations, and is the first study to apply recently collected vessel-based seabird observations in the nGoM. This study generates three key outputs.
First, vulnerability is characterized by describing each species’ exposure potential and sensitivity to oil interactions based on a suite of variables relating to species-specific spatial, temporal, and behavioral ecology. This characterization produces relative ranks for the vulnerability among seabird species. Second, uncertainty is characterized in each variable for each species based on the quality and quantity of data available. Upper and lower vulnerability estimates for each variable are then calculated to provide a sense of variability within and among variables. We compare each variable’s average uncertainty, identifying key data gaps in understanding seabird vulnerability in the nGoM. Third, the spatial relationship of O&G platforms is assessed in relation to the cumulative vulnerability of seabirds. This is achieved by assigning species-specific vulnerability scores to the spatial extent of seabird habitat characterized as highly suitable. We then sum these scores across the overlapping habitats, identifying areas of high cumulative seabird vulnerability across the study area and its overlap with O&G activities. This presentation of vulnerability scores leverages species-specific seabird habitat maps and provides a visual context for the gradient vulnerability of the seabird assemblage in the nGoM. This index characterizes the vulnerability of seabirds to oil in a notably understudied region. Information gaps and areas of high species richness identified in our analyses could inform offshore energy development, reducing impacts on seabirds as the nGoM continues to be an essential part of the global O&G economy.
2 Methods
2.1 Overview
To assess the relative impact of oil on seabirds in the nGoM, we created an index of the vulnerability of seabirds to oiling (i.e., the vulnerability of seabirds to oiling index, VSOI). We developed the VSOI by adapting recently described frameworks and index-based approaches that assessed the potential impacts of offshore energy development on marine fauna and then tailored it to the current state of knowledge of seabirds in the nGoM. Our approach was informed by similar efforts (e.g., Kelsey et al., 2018) and proposed frameworks (Polidoro et al., 2021) and the terms used in our approach are most closely related to those described in Nevalainen et al. (2019). The framework applied by Nevalainen et al. (2019) best reflects the current state of knowledge for seabirds in the nGoM. In brief, seven variables were used to describe the vulnerability of seabirds to oiling. Variables are conceptually grouped into two sub-indices; exposure potential (n = 4 variables) and sensitivity (n = 3 variables). Exposure potential characterizes the probability of an individual co-occurring or potentially interacting with oil, and was described by seasonal occurrence, overlap with O&G platforms, flocking behavior, and primary foraging technique. Sensitivity characterizes the relative impact of mortality on the population and was described by age at first breeding, duration of the incubation and fledging period, and residency status within the nGoM (Figure 1). Section 2.3 describes each variable in detail. We also describe the uncertainty of the information used to calculate the VSOI to identify knowledge gaps (Section 2.4). Lastly, using spatial layers produced to characterize species-specific habitat, we also describe the spatial extent of the habitat of all seabird species (species habitat footprint), the sum of seabird vulnerability (cumulative seabird vulnerability), and the overlap of O&G platforms with cumulative seabird vulnerability (Section 2.5).
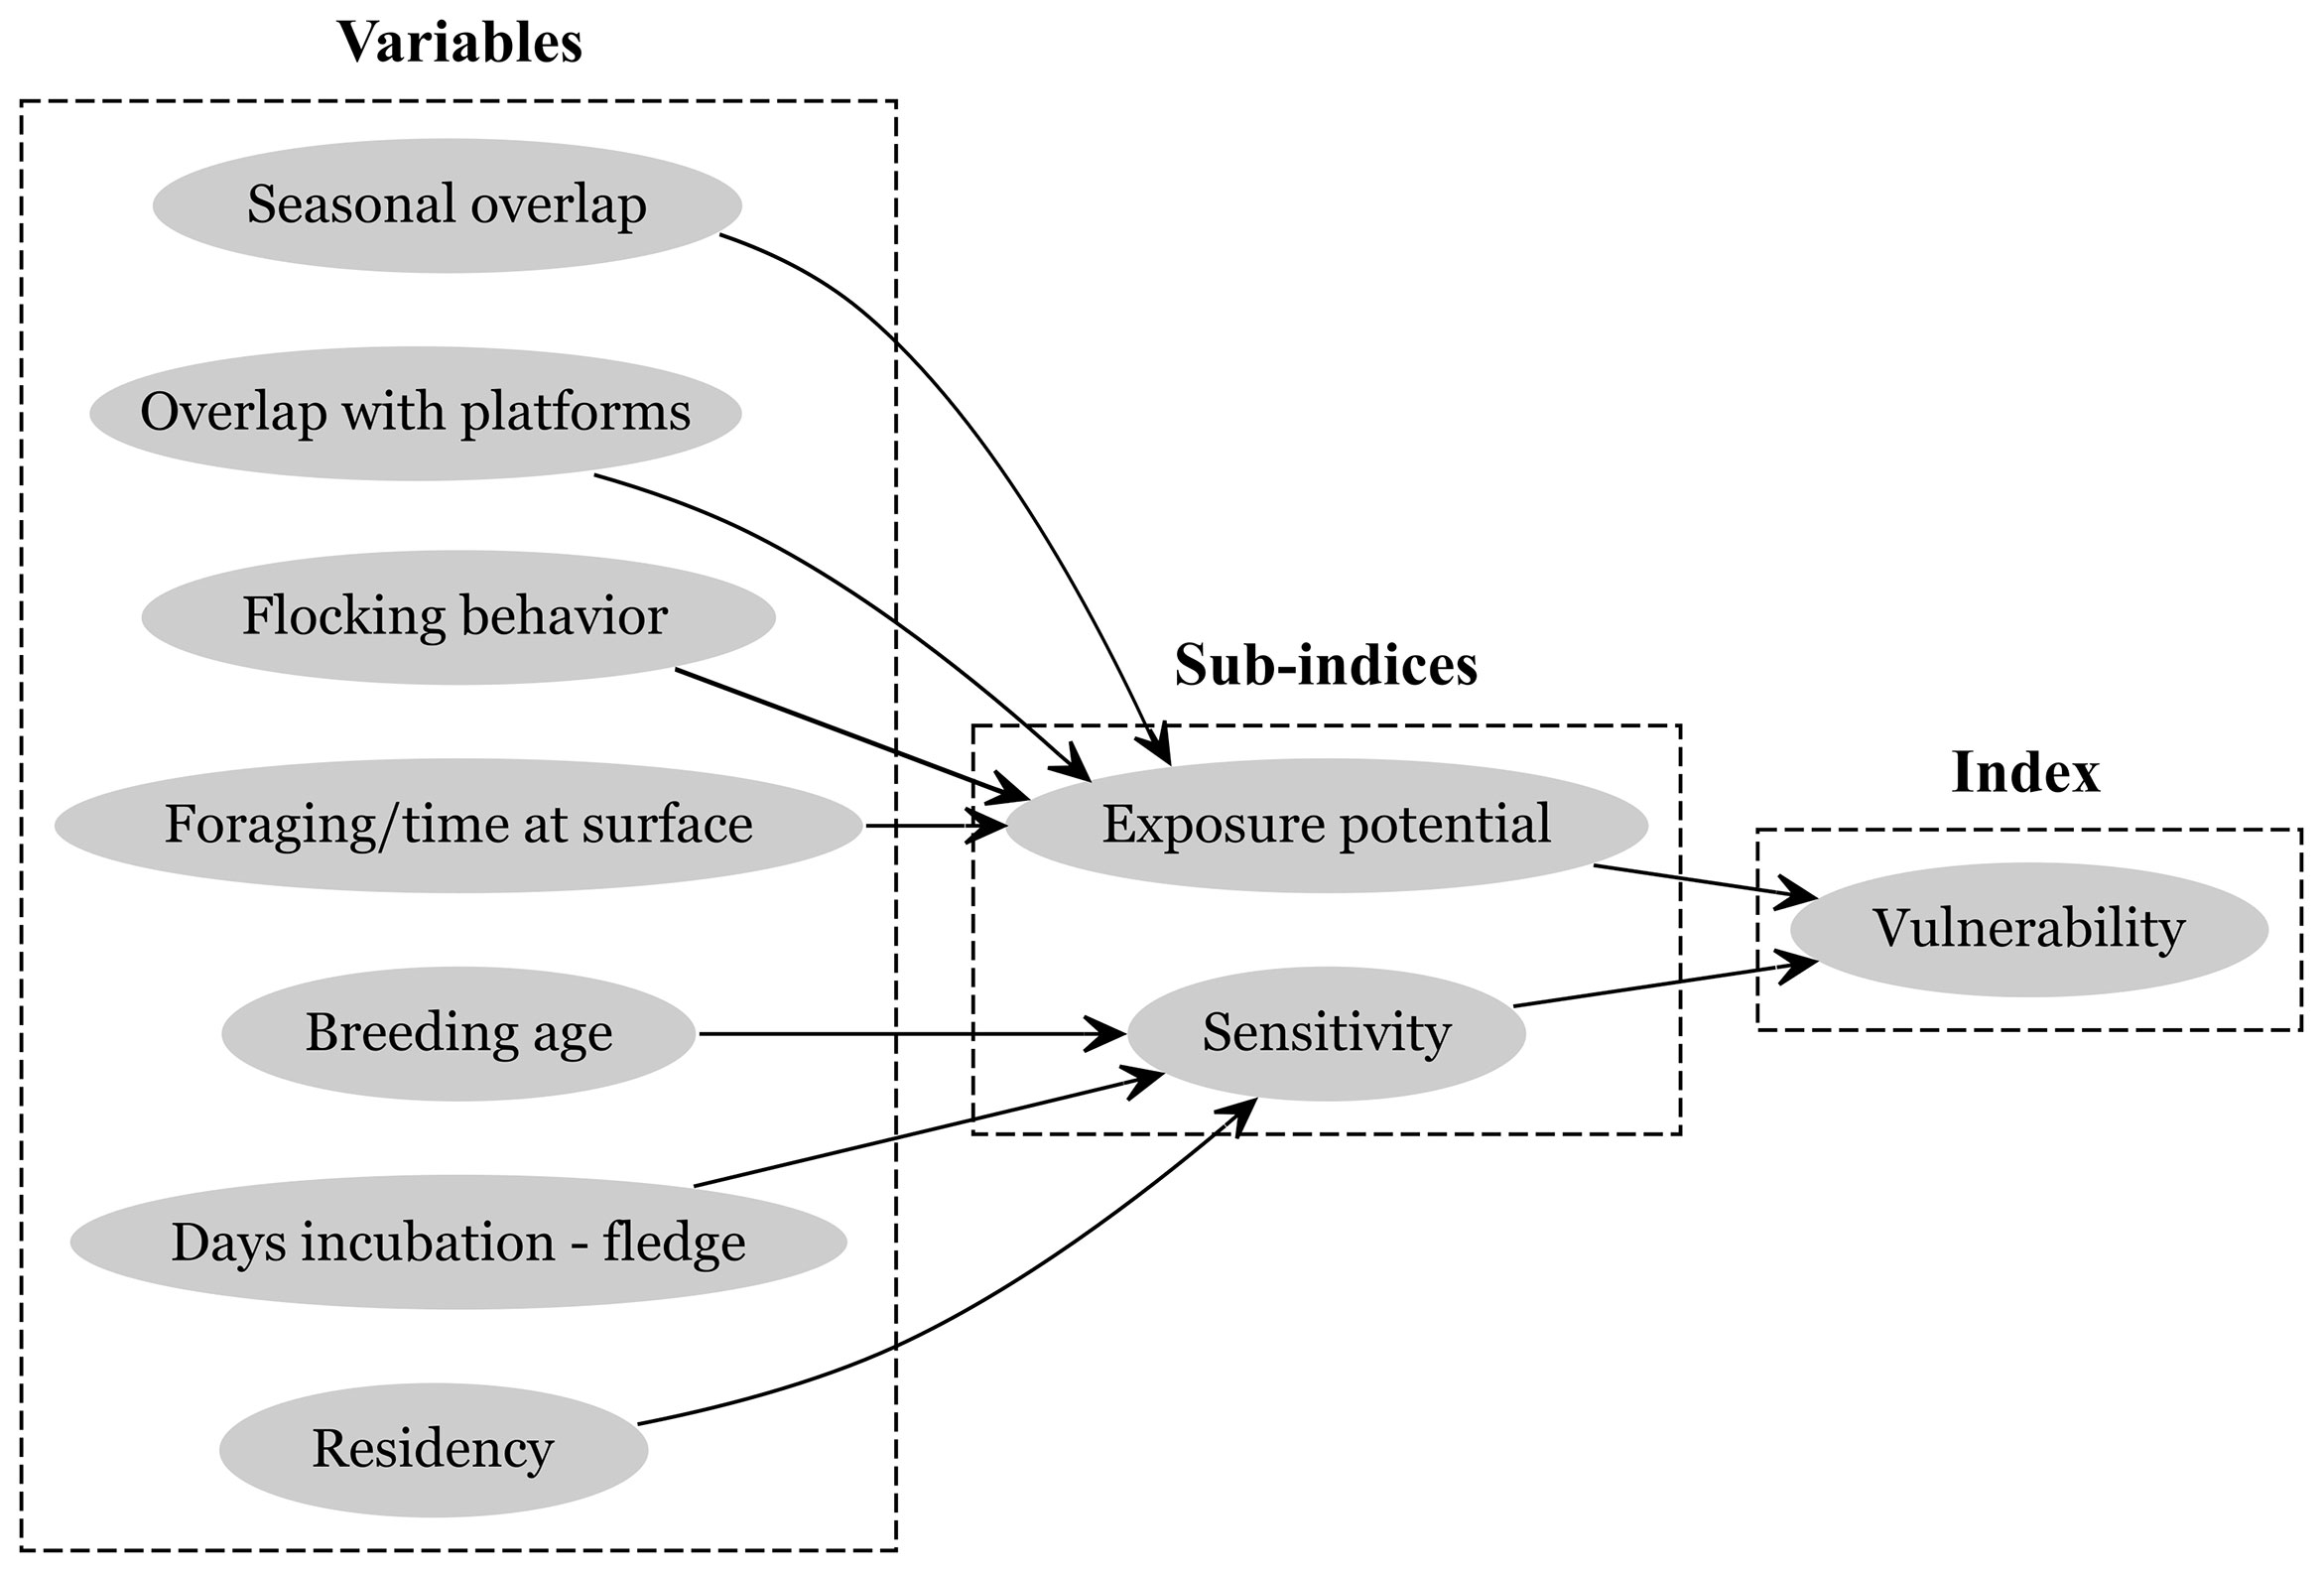
Figure 1 The relationship among species-specific variables, environmental variables, and sub-indices pertaining to the vulnerability of seabirds to oiling index (VSOI). Each variable receives a score based on the impact that interaction with oil is likely to have on that variable. For variable definitions, scoring, and index calculation, see below and Table 1.
2.2 Data sources
We gathered information from multiple sources (described below) and used the information collected to assign a qualitative score to each variable.
2.2.1. Literature review
We used the following resources to inform all but one (spatial overlap with O&G platforms, which was derived from abundance and distribution data; see below) of the seven variables: Schreiber and Burger (2001), life history data from the Cornell Lab of Ornithology (2019), and life-history data from the International Union for the Conservation of Nature (IUCN) Red List by BirdLife International (2021). If the necessary data for a specific species was not available, we used data from a closely related species. All references used and associated assumptions for related species are described in Supplementary Table S1.
2.2.2. Vessel-survey data
We used data on the abundance and distribution of seabirds from surveys conducted as a part of the Gulf of Mexico Marine Assessment Program for Protected Species (GoMMAPPS) to inform seasonal occurrence, overlap with O&G platforms, flocking behavior, and primary foraging technique. Data collection during GoMMAPPS followed a standardized protocol for vessel-based observations of marine fauna (e.g., Tasker et al., 1984; Jodice et al., 2021). Vessel-based surveys were conducted from April 2017 - September 2019; these data represent the most spatially and temporally extensive surveys for seabirds in the nGoM to date. Observations occurred over 293 days-at-sea representing ~2,300 hours of observer effort for ~41,700 km of transects. Given the relatively low densities of birds and good viewing conditions, we recorded all seabird detections out to 500 m on both sides of the vessel (Spear et al., 2001; Ballance and Force, 2016; Jodice et al., 2021). Although 44 seabird species were observed during GoMMAPPS surveys, we limited our analyses to 24 species with a sufficient number of detections (≥ 20) to produce the models needed to define some of the variables characterizing vulnerability. See Methods, section 2.3.1 Exposure potential, Habitat overlapping O&G platforms for modeling details. Due to uneven temporal coverage (Figures S1, S2), all observations were used in a single analysis, as opposed to being separated by season or year. Seabird observation data can be accessed through the National Centers for Environmental Information (NCEI) archives: https://www.ncei.noaa.gov/archive/accession/0247206 and DOI https://doi.org/10.25921/afrq-h385 (Gleason et al., 2022).
2.2.3. BOEM data center
To investigate the potential association of seabirds with O&G platforms, location data on historical and current O&G platforms were retrieved from the BOEM Data Center (www.data.boem.gov accessed 22 September 2020). These data were filtered for platforms present during the study period defined by the vessel survey data: April 2017 - September 2019.
2.3 Spatial extent of the study area
The spatial extent of analysis is constrained to the survey footprint of GoMMAPPS (Figure 2). Therefore, the rank of seabirds relative to each other is constrained to this same spatial footprint. Additional habitat for these species may occur within the Gulf of Mexico beyond the boundaries of the study area, including coastal areas that were excluded due to cruise logistics, and the southern Gulf of Mexico, which was not surveyed as part of GoMMAPPS (i.e., south of the U.S. Exclusive Economic Zone, which formed the southern extent of the survey footprint).
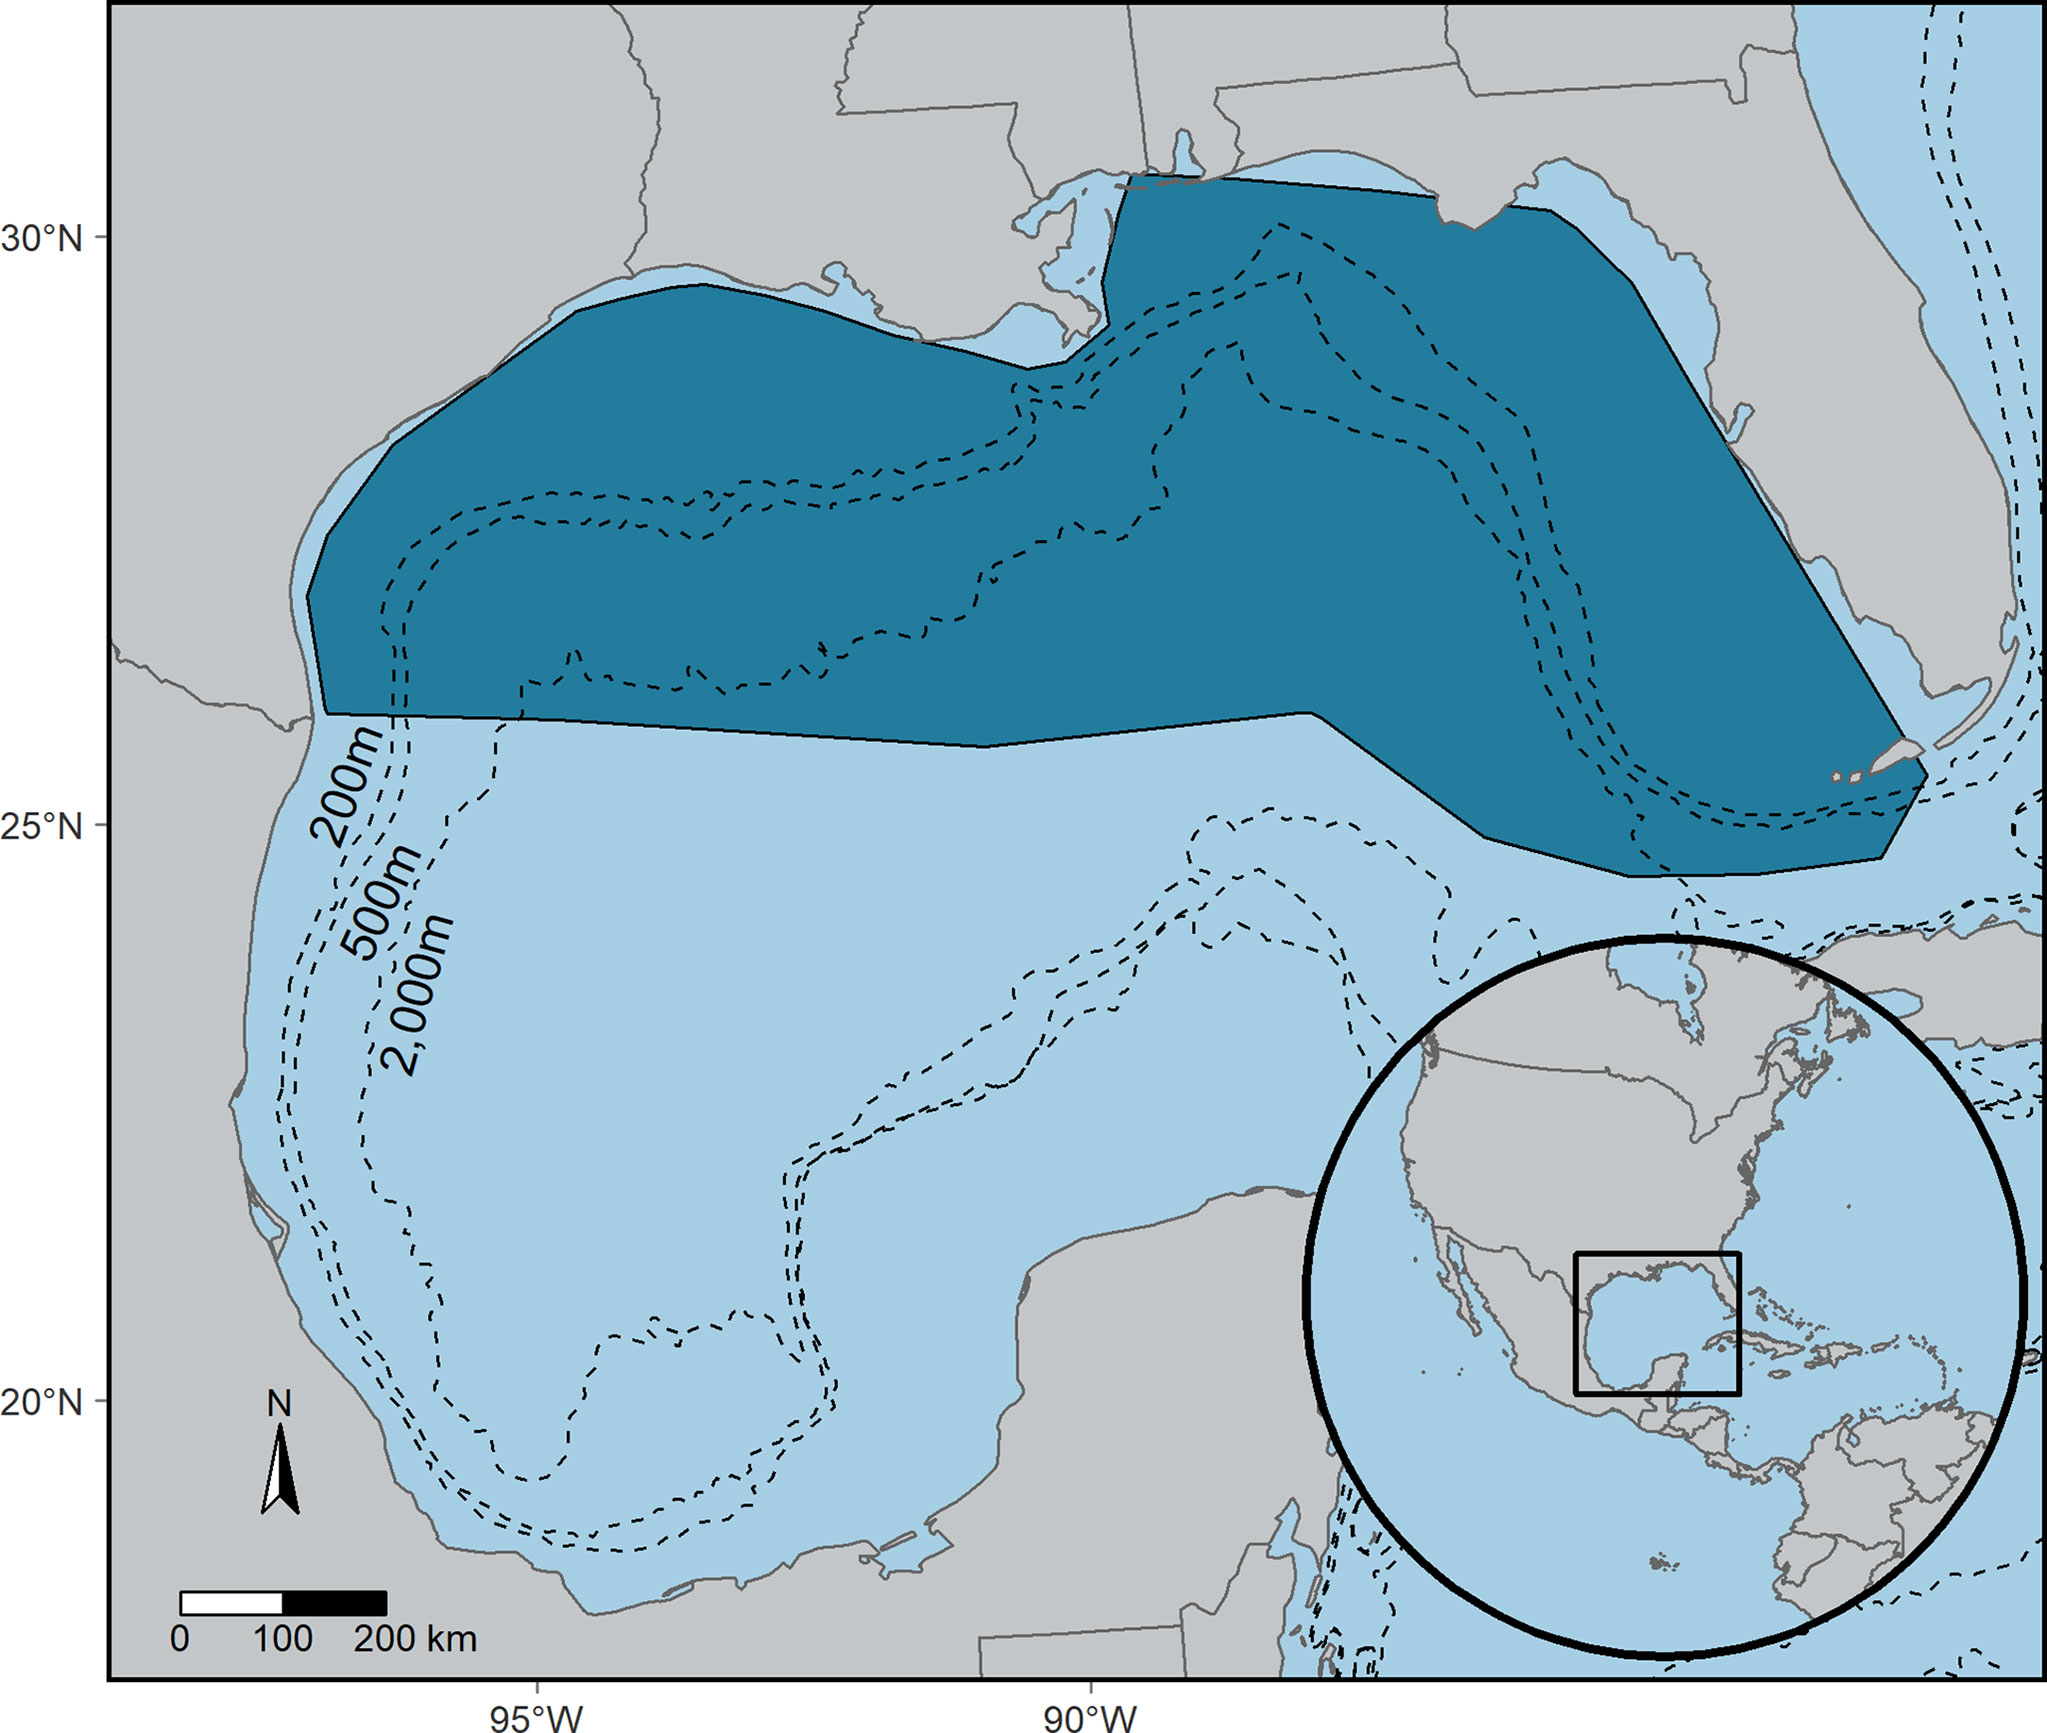
Figure 2 The study area (dark blue) for surveys conducted in support of the Gulf of Mexico Marine Assessment Program for Protected Species (GoMMAPPS), 2017-2019, and the subsequent area of inference for the vulnerability of seabirds to oiling index (VSOI).
2.4 VSOI
To describe the vulnerability of seabirds to oil through the VSOI, we characterized seven variables for each of the 24 focal species (Table 1). These variables were informed through a literature review, GoMMAPPS vessel survey data, and data from the BOEM data center (above). Seven variables are conceptually grouped into sub-indices (Figure 1). For each variable, the relative potential (exposure) for or intensity (sensitivity) of an interaction with oil is scored as 0 (none; if applicable), 1 (low), 2 (medium), or 3 (high). For variables where only two states were possible, scores were either low (1.67) or high (2.33). Scores (Table 1) for each variable were separated either by (1) intuitive intervals (i.e., seasonal occurrence (number of seasons, defined below), overlap with O&G platforms (even intervals), flocking behavior (log scale), residency (binomial), foraging technique (greater or lesser exposure to oil on the water), or (2) observed gaps in the spectrum of values (i.e., age at first breeding, days from incubation to fledge). The sum of the scores for each variable was then used to define the vulnerability of each species to oiling. The VSOI scores characterize each focal species’ relative vulnerability to oil but do not provide or predict the absolute vulnerability to oil.
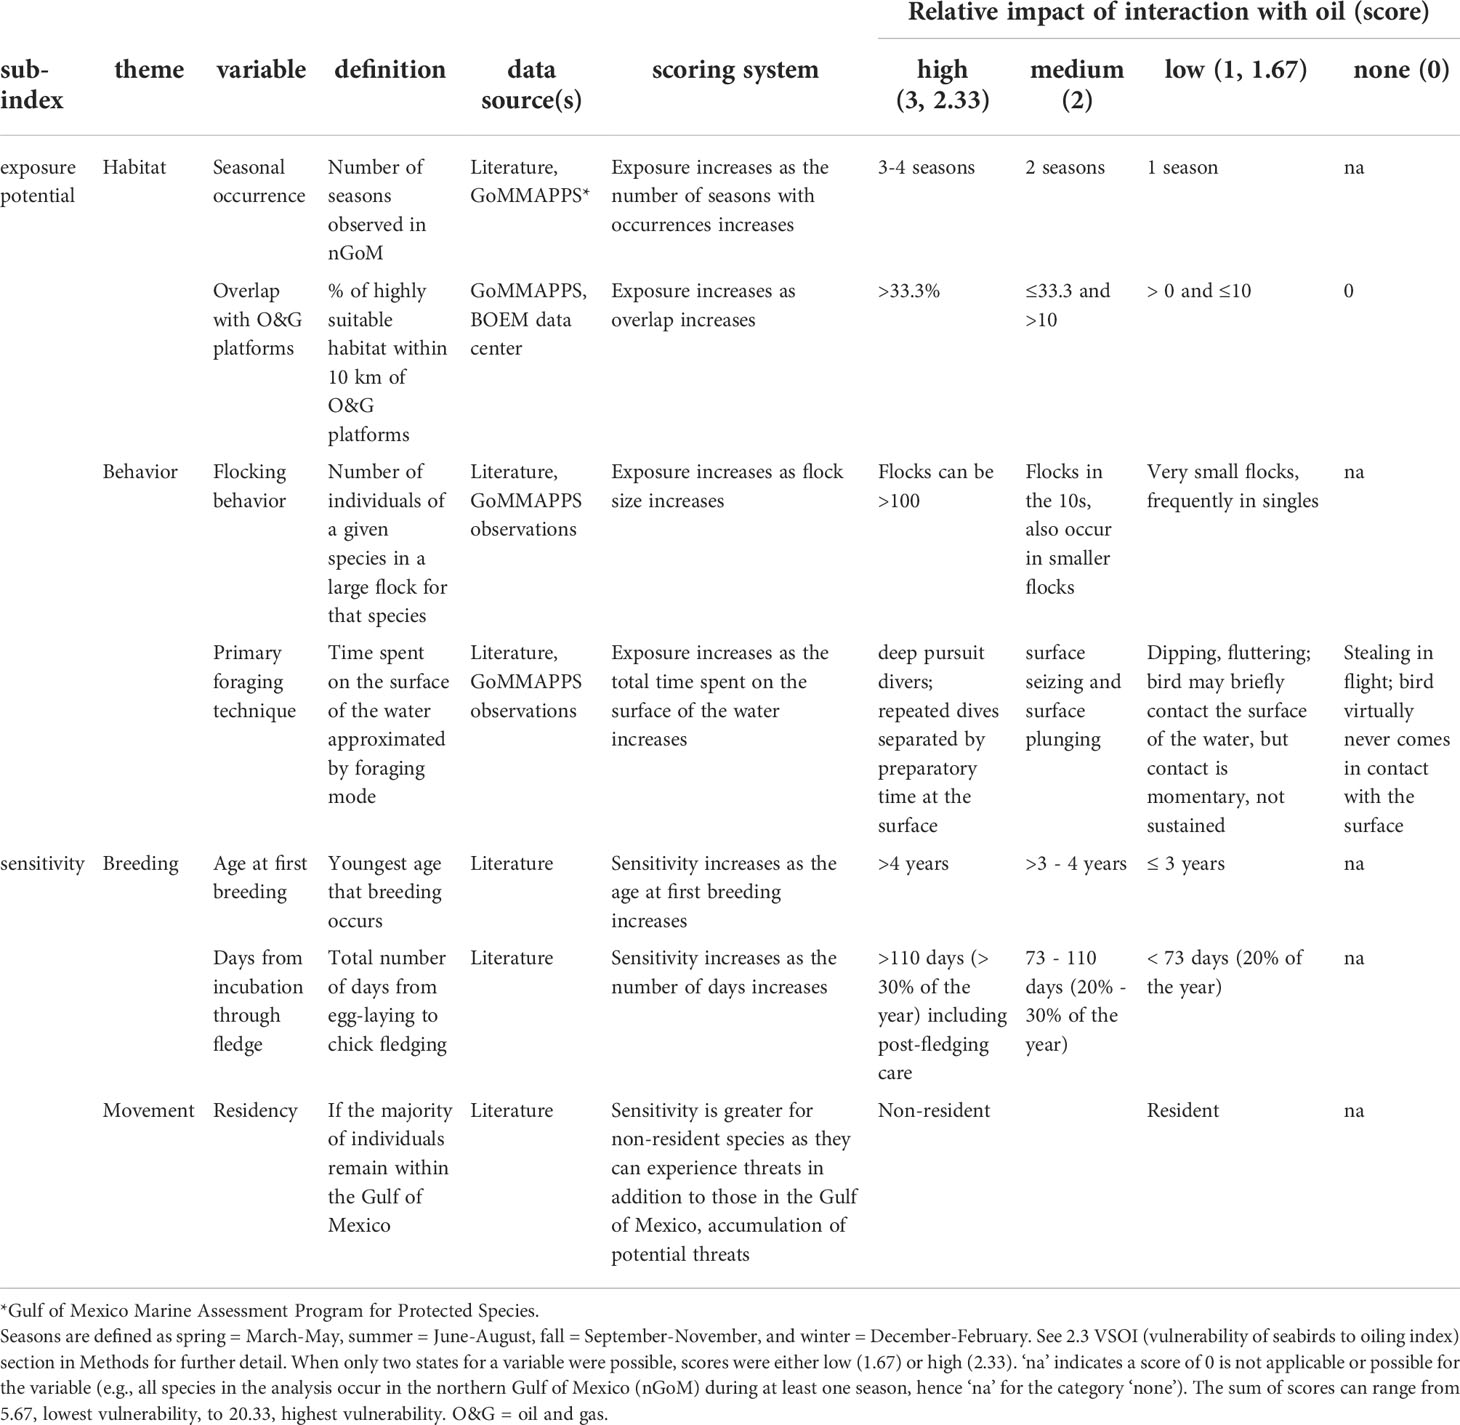
Table 1 Brief descriptions of each variable used to develop the oil vulnerability index for seabirds and rules for assigning scores indicating the potential impact of oil for each variable and species.
2.4.1 Exposure potential
The potential for an individual seabird to encounter oil, defined as exposure potential, was characterized by four variables: seasonal occurrence, habitat overlapping with O&G platforms, flocking behavior, and primary foraging technique (Table 1). Each is described below.
2.4.1.1 Seasonal occurrence within the study area
Seasonal occurrence of a species in the study area indicates the temporal extent of potential exposure to oil, with exposure potential increasing as the number of seasons with an occurrence increase (King and Sanger, 1979). Interannual variation in environmental conditions can impact seabird distributions, altering their exposure to threats (Baak et al., 2021; Bi et al., 2021). Therefore, seasonal occurrence can capture interannual differences in occurrence, whereas describing broad-scale distribution patterns (e.g., residency, described below) is not sensitive to this variation. To describe seasonal occurrence, we documented the number of seasons (1-4) a species was observed during at least one GoMMAPPS vessel survey (e.g., a single detection of a single individual would constitute an occurrence). Seasons are defined as spring = March-May, summer = June-August, fall = September-November, and winter = December - February.
2.4.1.2 Habitat overlapping with O&G platforms
The spatial overlap of a species in the study area with O&G platforms indicates the spatial extent of potential exposure to oil. We assume that exposure potential increases as the percent of suitable habitat encompassing O&G platforms increases.
We describe the spatial extent of seabird habitat by modeling the relative probability of occurrence for each species using observations collected during GoMMAPPS surveys and quantifying the area overlapped by O&G platforms. Specifically, we modeled the relative probability of occurrence of seabirds based on habitat suitability in the Gulf of Mexico using the maximum entropy approach in Program Maxent (Version 3.4.2; https://biodiversityinformatics.amnh.org/open_source/maxent/; Phillips et al., 2006). Briefly, Maxent is a machine learning technique that estimates the relative probability of a species’ occurrence (0-1) based on observations and a set of covariates (i.e., predictor variables that represent habitat conditions). Maxent is well suited to model with relatively low sample sizes (i.e., n < 100 observations) as it utilizes a presence-background algorithm that is less sensitive to sample size than other species distribution modeling approaches (Phillips et al., 2006; Wisz et al., 2008). This 0-1 scale describing seabird distribution in space enables direct comparisons across species (e.g., Humphries and Huettmann, 2014; Lieske et al., 2014). For species with ≥ 28 detections, we assessed model performance by separating the observations into randomly selected training (70%) and testing (30%) datasets. This distribution leaves a minimum of 20 data points in the training model, aligning with our threshold for model development (e.g., van Proosdij et al., 2016). This filtering criterion left 24 of the 44 seabird species observed to model.
The models were run through the Maxent interface and fitted using 10,000 random background points across the Gulf of Mexico. As observations occurred in only a portion of the study area, we applied “clamping” to reduce the potential to predict a high relative probability of occurrence in areas with covariate values well outside those in the training data (Philips et al., 2006). We quantified the model’s predictive power using the area under the receiver operating characteristics curve (AUC), where an AUC of 1 indicates perfect model prediction (Bradley, 1997).
We selected nine environmental covariates to model each species’ relative probability of occurrence based on previously identified seabird-habitat relationships with similar species in the Gulf of Mexico and western North Atlantic (e.g., Kinlan et al., 2016; Poli et al., 2017; Winship et al., 2018). These variables and their sources are summarized in Table S2. In brief, we obtained five covariates at a daily scale: sea-surface temperature, sea-surface salinity, sea-surface height, and surface current velocity (eastward (u) and northward (v)). We calculated two variables from the current velocity covariates: current direction and absolute current speed. We also obtained bathymetry and monthly chlorophyll-a data. We created a single spatial layer of the average conditions across all days with observations for each covariate. Each covariate was then aggregated to the coarsest native spatial resolution across all variables (~4.67 km; Table S2). Therefore, the spatial resolution of modeled relative probability of occurrence relating to habitat suitability is 4.67 km x 4.67 km. As the purpose of these models is to characterize the extent to which seabird habitat overlaps with O&G platforms, we do not interpret seabird-covariate relationships.
To quantify the overlap of O&G platforms with seabird habitat, we first defined highly suitable seabird habitat as locations within the GoMMAPPS footprint with a suitability score > 0.6. We selected this value because it is a slightly more conservative threshold for a highly suitable seabird habitat than 0.5, the midpoint of potential habitat suitability values. We then defined the area of potential oil exposure by creating a 10 km buffer around each O&G platform (hereafter ‘O&G platform footprint’) using ArcGIS Desktop 10.8 (ESRI, Redlands, California). Overlap was characterized as the percent of highly suitable seabird habitat overlapping the O&G platform footprint. A radius of 10 km represents the macro-scale of potential exposure and would likely be within the visual field of a flying seabird (e.g., Haney et al., 1992) and does not capture the potential for interactions if, for example, a large spill was to occur.
2.4.1.3 Flocking behavior
Flocking behavior can also impact oil exposure potential. Flocks can form in association with feeding events, which could increase the potential to interact with the water’s surface, resulting in increased exposure to oil. Flocking also can increase the likelihood of exposure because flocks attract conspecifics or other species that might forage in flocks or benefit from flocks (e.g., King and Sanger, 1979; Nevalainen et al., 2019). As flock size increases, the probability of an individual encountering oil within its habitat increases. Flocking behavior was informed through data collected during GoMMAPPS surveys on flock size and a literature review.
2.4.1.4 Primary foraging technique
Foraging behavior, particularly time spent on the surface of the water, has been linked to oiling rates (Camphuysen, 1998) and is considered to reflect the potential to interact with oil in other assessments of seabird vulnerability (King and Sanger, 1979; Seip et al., 1991; Nevalainen et al., 2019). The oil produced in the nGoM is called ‘light Louisiana sweet crude’, where ‘light’ indicates low density and low viscosity. Light crude oil tends to remain at the surface or within the upper water column longer than other forms of crude oil (e.g., Prudhoe Bay crude). Given these properties, we posited that exposure potential would increase as the amount of time a species spends on the surface of the water increases. For example, aerialists who rarely or never alight on the water’s surface (e.g., Sooty tern, Onychoprion fuscatus) would have less exposure potential than a diving species often found on the surface or within the water column (e.g., Common loon, Gavia immer). Therefore, we described foraging behavior as the primary mode of prey capture. The primary foraging technique was assigned based on a literature review and is described in Table 1. We considered assessing the proportion of individuals sitting on the surface of the water. However, extensive marine infrastructure providing roosting locations and the inability to differentiate observations of birds sitting on the surface of the water versus infrastructure, which would relate to different degrees of exposure to oiling, prevented the use of this variable.
2.4.2 Sensitivity
Three variables were used to describe the sensitivity of a population to an interaction with oil: age at first breeding, duration of incubation through fledge, and residency status in the nGoM (Table 1). We considered using global indices as a reference for sensitivity (e.g., International Union for Conservation of Nature Red List), but these indices are often driven by populations in regions with long-term monitoring programs, which are very rare or absent in the nGoM for most seabird species. For example, trends and threats in better-monitored regions, such as islands in the sub-tropical Pacific, are likely to be very different than those experienced by the same species using the nGoM, a semi-enclosed sea.
2.4.2.1 Age at first breeding
The age at first breeding is the youngest age at which a given species is known to breed. Age at first breeding approximates the number of years required to replace an individual lost (i.e., mortality event) from the breeding population due to a perturbation event, like an oil spill (Seip et al., 1991; Williams et al., 1995). Age at first breeding functions within the index as the temporal cost of losing (and replacing) an adult of breeding age. An older age at first breeding indicates a greater cost of ‘replacement’ (i.e., longer time to replacement) than a species with a younger age at first breeding. We assumed the mean value when only a range of age at first breeding was provided in the literature for a given species.
2.4.2.2 Days from incubation through fledge
The average number of days to fledge a chick approximates a species’ reproductive investment and has been used in other oil spill vulnerability analyses (Seip et al., 1991). We posit that species requiring more time to fledge a chick have greater reproductive investment and sensitivity than those requiring fewer days to fledge a chick. As with age at first breeding, we used the mean value when a range was provided. In some cases, we used the numeric value for a related species (Table S1).
2.4.2.3 Residency
Residency is broadly defined as either ‘resident’ or ‘non-resident’. Resident was assigned when most individuals of a given species are likely to remain in the Gulf of Mexico year-round. Conversely, non-resident was assigned to a given species when most individuals are likely to leave the Gulf of Mexico during the annual cycle. As the majority of individuals must be assumed to leave the Gulf of Mexico for the species to be classified as non-resident, some species were classified as resident despite some proportion of individuals of this species having been observed to leave the nGoM (e.g., Lamb et al., 2018). Residency differs from seasonal occurrence as residency reflects broad-resolution movement patterns, while seasonal occurrence differentiates the potential exposure of non-resident species who move rapidly through the nGoM (e.g., a single season) from those that occur across multiple seasons.
With respect to residency, a species’ use of different regions can result in annual exposure to more threats than encountered in a single region. Specifically, all seabirds in the nGoM may be exposed to any of the threats in the nGoM, and non-resident species may encounter additional (and cumulative) threats outside the area. Thus, non-residential status can result in greater sensitivity to oil interactions as non-residential species may experience threats and mortalities in addition to those occurring in the nGoM (e.g., King and Sanger, 1979). Some of the threats encountered outside the nGoM by seabirds migrating to or through the nGoM include bycatch, invasive species, and modification or degradation of breeding habitats (Sigourney et al., 2019; BirdLife International, 2021). The residency variable does not account for the relative magnitude or frequency of encountering threats at a single location versus another, nor does it explicitly account for temporal variation in threats. Here, residency is assumed to reflect the potential accumulation of threats encountered by most individuals of a species instead of the intensity of threats in any given area.
2.4.3 Index calculation
To calculate the VSOI for each species, we first scored each of the above variables according to the criteria described in Table 1. The index was calculated from the sum of all variables. This index does not quantify the number of individuals or proportion of a population that could be affected by an oil spill. Instead, the intent of this index is to produce a qualitative comparison of the vulnerability among seabird species within the nGoM and their relative ranks.
2.4.4 Dominant rank-forming variables
To better understand which variables had the greatest influence separating species at each extreme of vulnerability ranks for the 24 species assessed, we identified ‘dominant rank-forming variables. We calculated the average score for each variable of the species in the lower 20% (five species) of VSOI values, having the least vulnerability, and the average scores of each variable for the remaining (19) species. We then calculated the difference in the average score of each variable between the least vulnerable species and the remaining species. This was repeated with the species in the upper 20% (five species) of VOSI scores, having the greatest VSOI values. Variables with a difference of ≥ |0.5| are considered ‘dominant rank-forming variables.
2.5 Uncertainty
To acknowledge the imperfect nature of the data used to score each variable and the natural variation associated with each variable, we assessed the extent to which uncertainty can impact our estimate of vulnerability. Here, we consider uncertainty to encompass a lack of species-specific information, low or poor rigor, and natural variation. Based on the number and quality of data sources available and the level of natural variation, we assigned quantitative values for the characterization of the uncertainty of each variable for each species as either low (10%, 0.10), medium (20%, 0.20), or high (50%, 0.50), e.g., Kelsey et al. (2018). For example, high uncertainty (0.5) would occur if no data were available for the age at first breeding for a given species and values were obtained from a related species. In contrast, low uncertainty (0.1) would occur when data were directly available from the study area and where such data could be assumed to be relatively consistent across years. For example, flocking behavior was measured directly during vessel surveys and is presumed to be a behavioral characteristic that is relatively consistent across time. Medium uncertainty (0.2) could include contemporary observations but of a timescale unlikely to capture the full extent of natural variability. For example, seasonal occurrence in the study area was observed, but observations were uneven across seasons (Figures S1, S2).
Calculating the range in the score for a particular variable, including uncertainty, required knowing the: 1) score of the variable, 2) uncertainty for that variable, and 3) difference between the maximum and minimum potential scores for that variable. The range was calculated as the score of the variable +/- the uncertainty multiplied by the range of potential scores. For example, for age at first breeding, a given species has a score of 2, high uncertainty: 0.5, and potential scores of 1 to 3, with the difference being 3-1 = 2. The range of the score for age at first breeding would be 2 +/- (0.5*2); therefore, 1 (lower limit) to 3 (upper limit). The resulting lower and upper limits describe the uncertainty in each variable and, when combined across variables, describe the uncertainty in the vulnerability score for each species. We constrained the lower and upper limits to the extent of the variable scoring range, either 0-3 or 1-3 (Table 1). To identify knowledge gaps, we compared the average uncertainty of each variable where greater uncertainty indicates a greater knowledge gap.
2.6 Seabird habitat footprint, cumulative seabird vulnerability, and overlap with O&G
To define the spatial extent of all seabird habitats within the study area (hereafter seabird habitat footprint), we overlayed highly suitable habitat (Section 2.3.1. Exposure potential) of all species combined and used the entire area that was highly suitable habitat for >1 seabird species. This synthesizes species-specific habitats to provide an assemblage-wide seabird habitat footprint. To identify the areas of the highest vulnerability for all seabirds, we assigned the vulnerability score of each species across its high suitability habitat, then summed the areas of overlap between species. This defined the cumulative seabird vulnerability in a spatially-explicit context. The cumulative seabird vulnerability within the O&G footprint was compared to the cumulative seabird vulnerability outside of the O&G footprint and described as the cumulative seabird vulnerability/km2. This is a proxy for the intensity of seabird vulnerability in each area. Thus, the cumulative seabird vulnerability was used to characterize the distribution and intensity of the vulnerability of the seabird assemblage in the nGoM to oiling.
To review our characterization of high suitability habitat overlapping O&G platforms, seabird habitat footprint, and cumulative seabird vulnerability: 1) the habitat overlapping with O&G platforms is a variable that defines the ‘spatial extent of potential exposure to oil’ of an individual seabird species as a percentage of highly suitable habitat, 2) the seabird habitat footprint utilizes highly suitable habitat and characterizes the area within the ‘spatial extent of all seabird habitats’, and 3) the cumulative seabird vulnerability synthesizes highly suitable habitat and vulnerability scores to describe the ‘distribution and intensity of the vulnerability of the seabird assemblage in the nGoM to oiling’. Unless stated otherwise, all other data analysis was performed in R version 4.1.1 (R Development Core Team, 2021).
3 Results
3.1 Species vulnerability and rank-forming variables
Scores for vulnerability to oiling for seabirds in the nGoM ranged from 10.33 - 19.33 (median = 14.67, mean = 14.47 ± 0.44 SE), with a potential range of 5.67 - 20.33 (Table 2; Figure 3). Species in the lower 20% of VSOI scores were: Parasitic jaeger (Stercorarius parasiticus; 10.33), Bonaparte’s gull (Chroicocephalus philadelphia) and Pomarine jaeger (Stercorarius pomarinus; 11.33), and Brown noddy (Anous stolidus) and Common tern (Sterna hirundo; 12.33). All but Brown noddy, which breeds in the Dry Tortugas and on the Campeche Bank in the southern Gulf of Mexico, breed in the continental interior of North America or the high Arctic. The five species with these lowest vulnerability scores include only two families: Stercorarius and Laridae. The relatively low scores for these species were due to low values across four variables (Table 3). The incubation through fledge period is relatively short in these species compared to other species, with four of the five species spending less than 20% of the year with a chick (Table 2). The primary foraging techniques (i.e., kleptoparasitism and surface feeding) resulted in less exposure than foraging techniques of other species (e.g., plunge-diving). The spatial overlap between the highly suitable habitat and O&G platform footprint was relatively low compared to other species. Lastly, the age at first breeding for these species was relatively low (≤ 4 years) compared to the average age at first breeding of other species (Table 3).
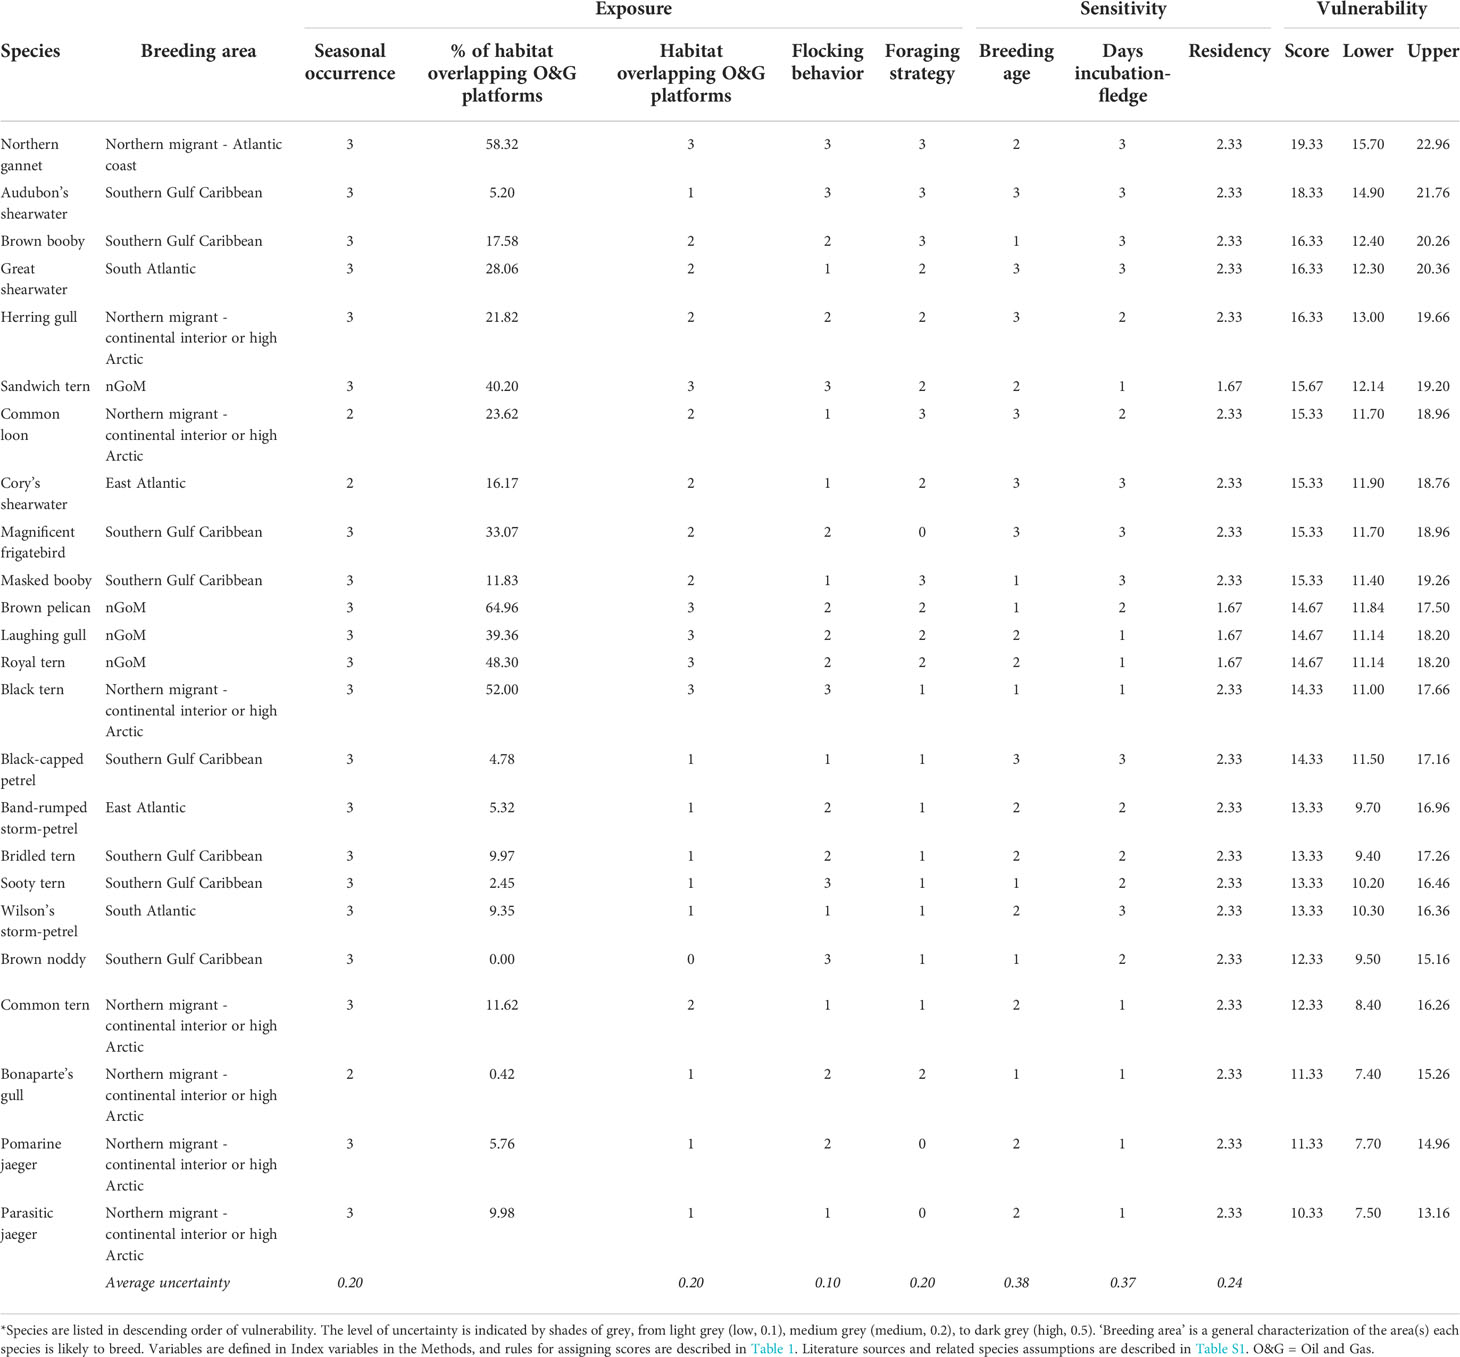
Table 2 Variable scores, uncertainty, and overall vulnerability of seabirds to oiling in the northern Gulf of Mexico (nGoM).
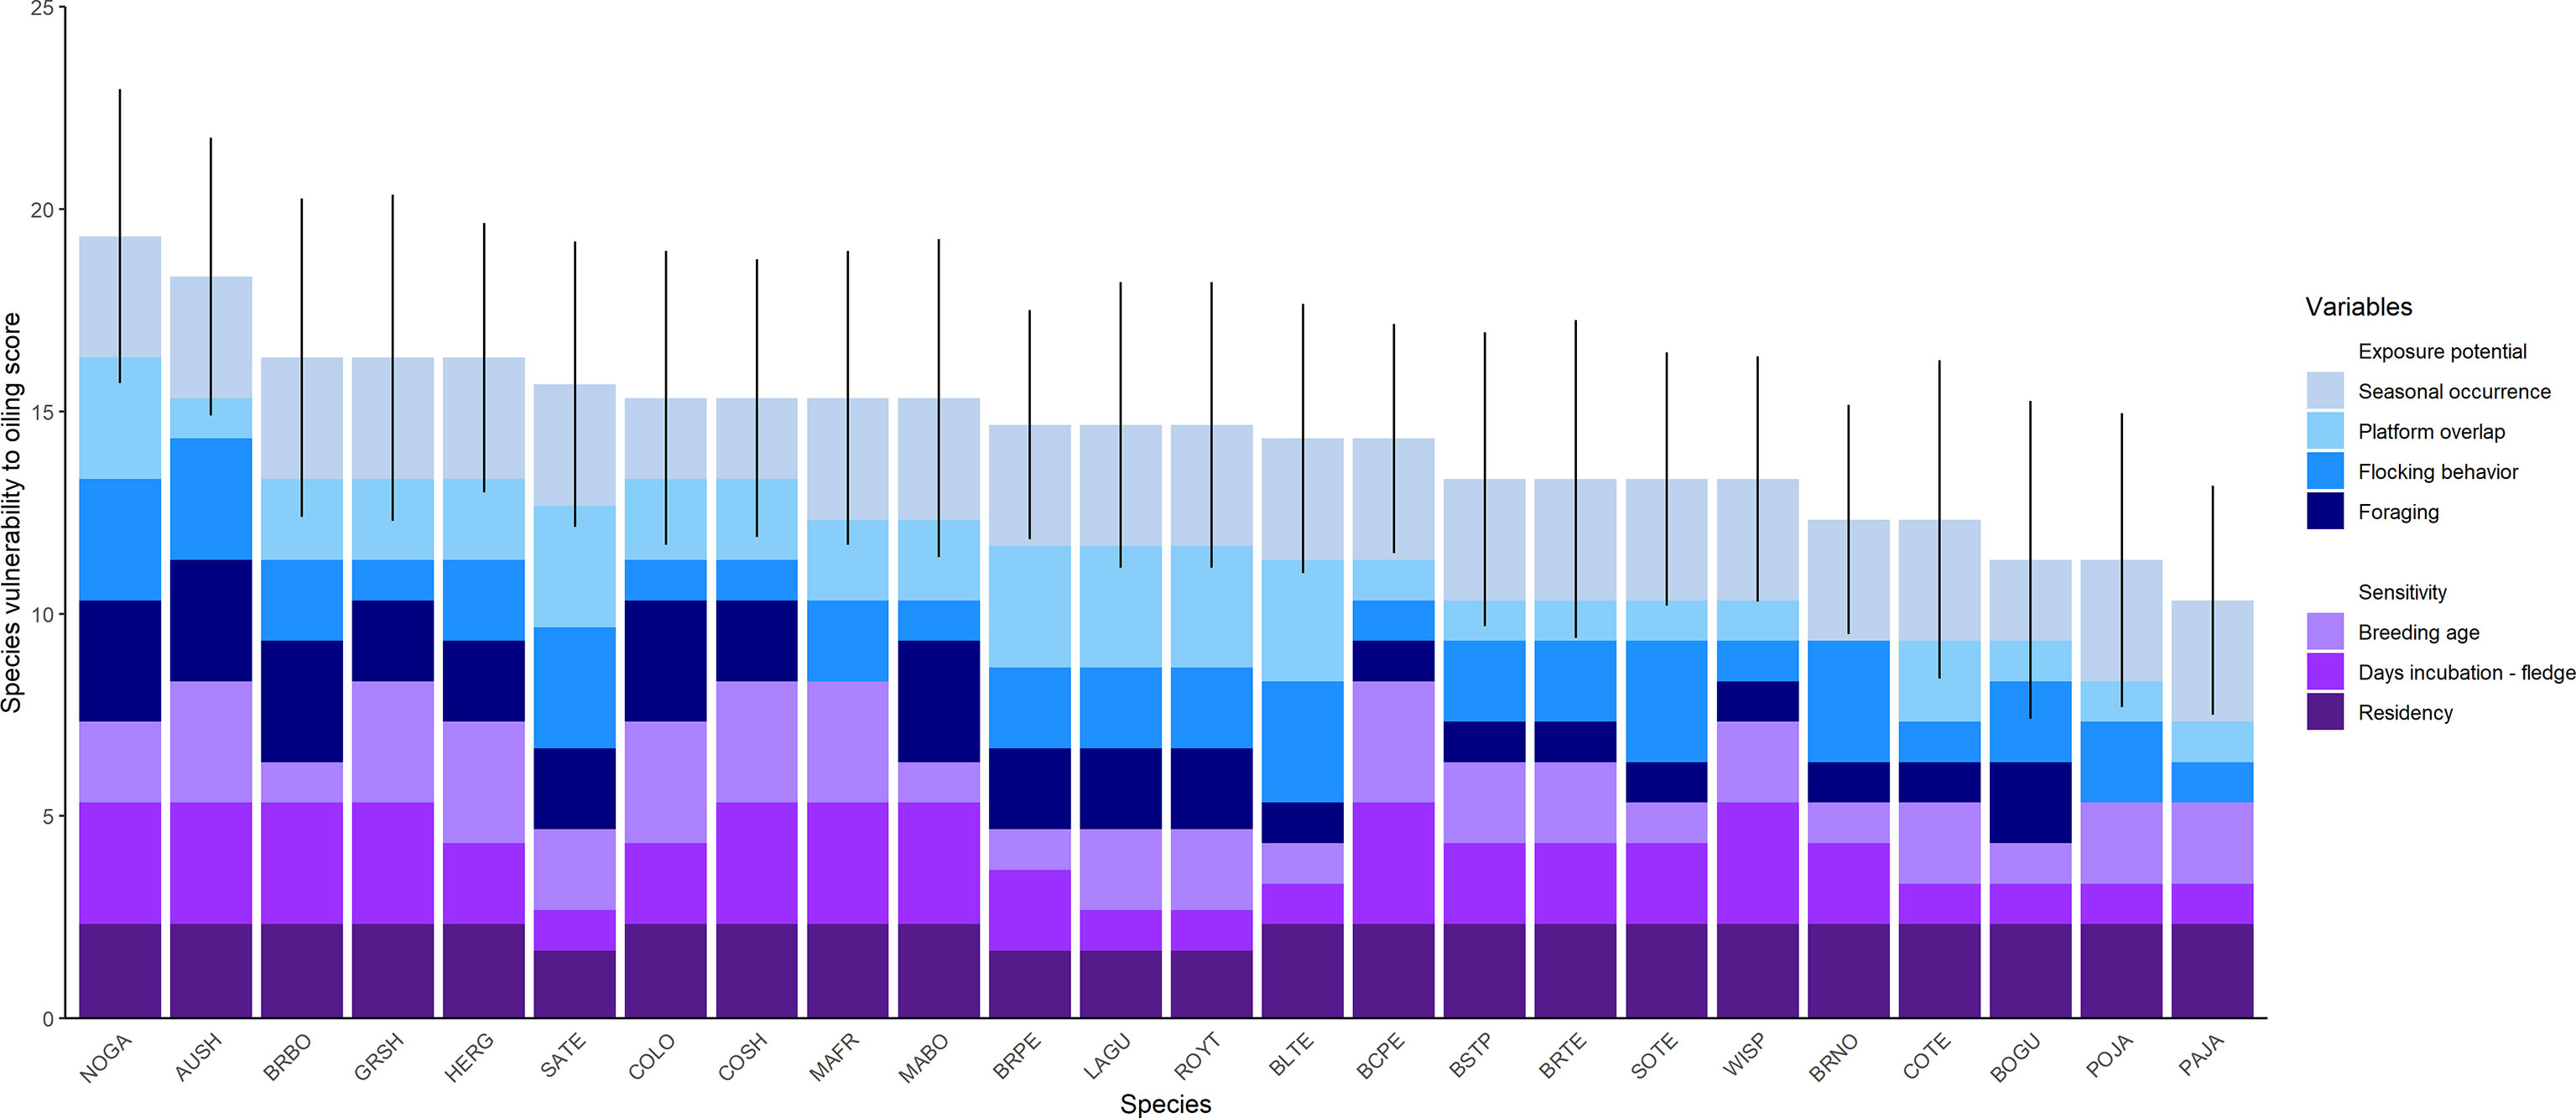
Figure 3 Cumulative vulnerability to oiling scores for seabirds in the northern Gulf of Mexico and the range of each cumulative score incorporating the uncertainty in the score of each variable. Species names are described in the ‘species code’ column of Table 4. Vertical lines indicate the range of the vulnerability score incorporating uncertainty (Section 2.4 Uncertainty in Methods) in variable scores. Variables are defined in Sections 2.3.1 Exposure potential and 2.3.2 Sensitivity in Methods, and rules for assigning scores are described in Table 1. Scores are also shown in Table 2.
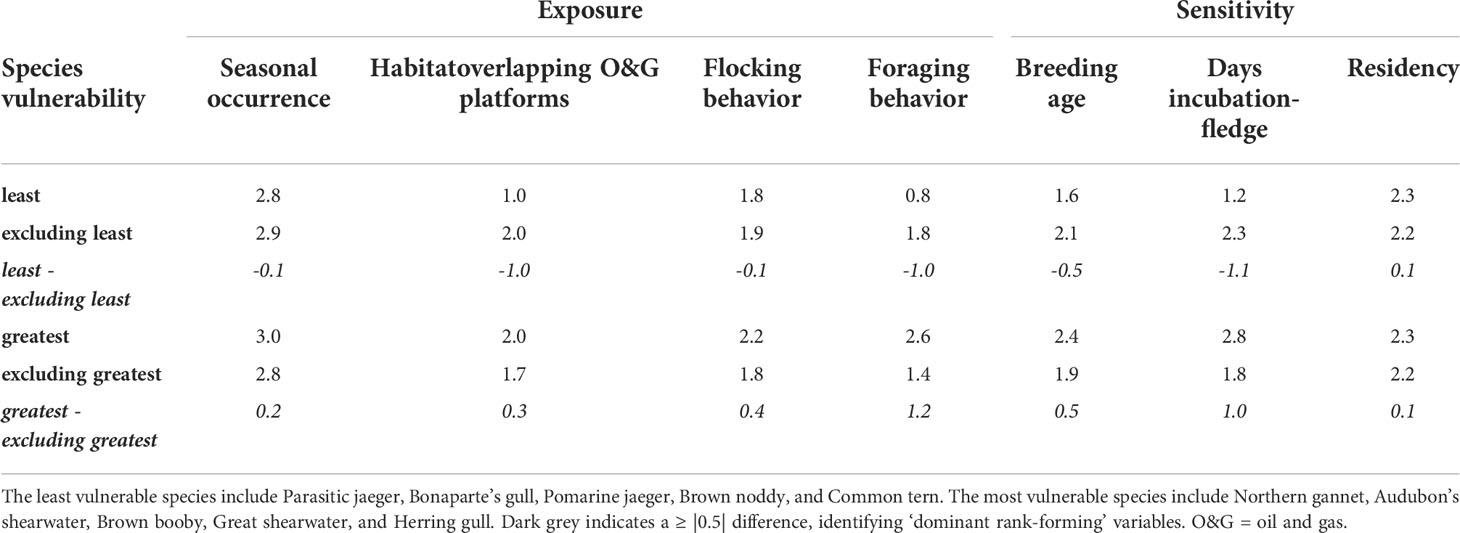
Table 3 The difference in the average score of each variable for the five species with either the least or greatest vulnerability of seabirds to oiling compared to the remaining 19 species in the northern Gulf of Mexico.
Species in the upper 20% of VSOI scores were Northern gannet (Morus bassanus; 19.33), Audubon’s shearwater (Puffinus lherminieri; 18.33), then Brown booby (Sula leucogaster), Great shearwater (Ardenna gravis), and Herring gull (Larus argentatus; 16.33; Table 2; Figure 3). Breeding ranges for these species include maritime Canada, the interior of North America, the Caribbean, and the South Atlantic. These species include three families: Sulidae (Northern gannet, Brown booby), Procillariidae (Audubon’s shearwater, Great shearwater), and Laridae (Herring gull). The relatively high scores for these species were due primarily to high values across three variables (Table 3). The primary foraging techniques (i.e., plunge- and pursuit-diving) resulted in higher exposure than foraging techniques of other species (e.g., dipping). The incubation through fledge duration was relatively long in these species, with four of five being > 30% of the year, compared to the majority of the other species (i.e., 20-30% of the year). Lastly, although there was variation in the age at first breeding, the age at first breeding for these species tended to be higher than the remaining species.
Three dominant rank-forming variables were shared in separating the species with the least and greatest vulnerability (Table 3). Two were related to sensitivity; breeding age and days from incubation to fledge, and one was related to exposure; primary foraging technique. The percent of habitat overlapping O&G platforms was important when separating species with the least vulnerability from the other species but did not have a notable impact on separating the most vulnerable species from the other species.
3.2 Uncertainty
The average uncertainty among species appeared greatest for sensitivity variables compared to exposure variables. The uncertainty surrounding age at first breeding (0.38), number of days incubation through fledge (0.37), and residency (0.24) were relatively high. In contrast, the uncertainty surrounding seasonal occurrence, overlapping O&G platforms, and primary foraging technique were all lower, at 0.2. Flocking behavior had the lowest uncertainty (0.10) (Table 2).
3.3 Seabird habitat footprint, cumulative seabird vulnerability, and overlap with O&G
The number of detections for each species ranged from 27 - 1,104, and the AUC for Maxent models ranged from 0.872 – 0.996 (training dataset) and 0.815 – 0.975 (testing dataset), suggesting very good to excellent model performance (Swets, 1988; Duan et al., 2014; Table 4). The spatial extent of highly suitable habitat ranged from ~9,100 to ~281,700 km2 of the study area among the focal species (Table 4; Figures S3A–X).
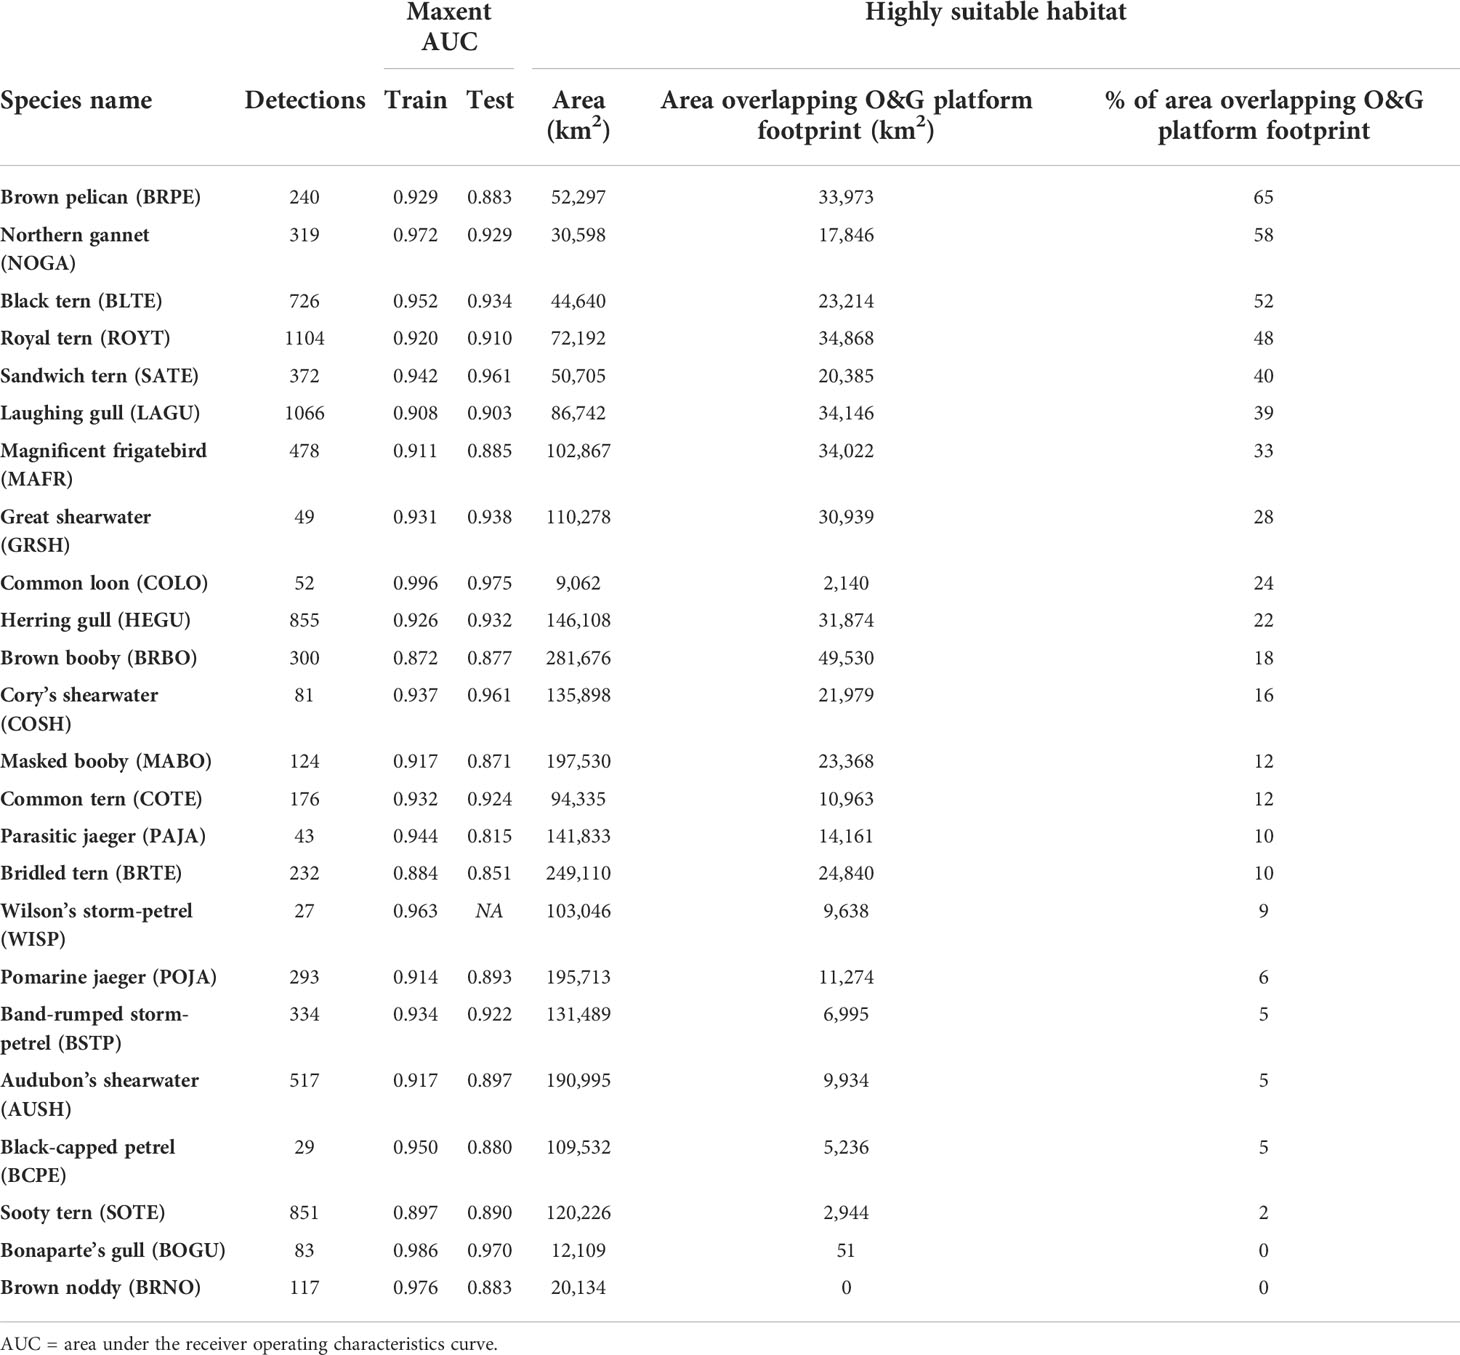
Table 4 Summary of the number of detections, Maxent model performance, and the area of suitable seabird habitat overlapping the offshore oil and gas (O&G) platform footprint in the northern Gulf of Mexico.
The percent of species-specific habitat within the O&G platform footprint varied among species (range = 0% - 64.96%, median = 14.00%, mean = 21.67% ± 13.97% SE; Table 2). The overlap of highly suitable habitat with the O&G platform footprint was greatest for Brown pelican (Pelecanus occidentalis; 64.96%) and least for Brown noddy (0%) (Table 2; Figures S3 I, H). Species with mostly nearshore habitat, such as Brown pelican and Black tern, had the highest percent of habitat within the O&G platform footprint (Table 2; Figures S3I, C). Species with highly pelagic distributions, such as Brown booby and Cory’s shearwater (Calonectris borealis), had a lower percent of habitat O&G platform footprint (Table 2; Figures S3G, l). The lowest percent of habitat within the O&G platform footprint occurred in species with most of their habitat in the eastern portion of the study area, such as Sooty tern and Brown noddy (Table 2, Figures S3W, H).
The seabird habitat footprint covered ~521,600 km2, encompassing portions of all bathymetric domains and covering much of the study area (Figure 4). The total area of the O&G platform footprint (platform locations surrounded by a 10 km buffer) was ~88,400 km2. Much of the O&G platform footprint occurred in waters < 500 m depth. Approximately 15% of the seabird habitat footprint (~78,900 km2) overlapped the O&G platform footprint, mainly < 500 m depth in the central and, to a lesser extent, western portions of the study area. A relatively large portion of the O&G platform footprint, ~89%, overlapped the seabird habitat footprint. This suggests that most O&G platforms co-occur with the habitats of one or more seabird species. Due to the absence of O&G platforms, no overlap occurred in the eastern portion of the study area (Figure 4).
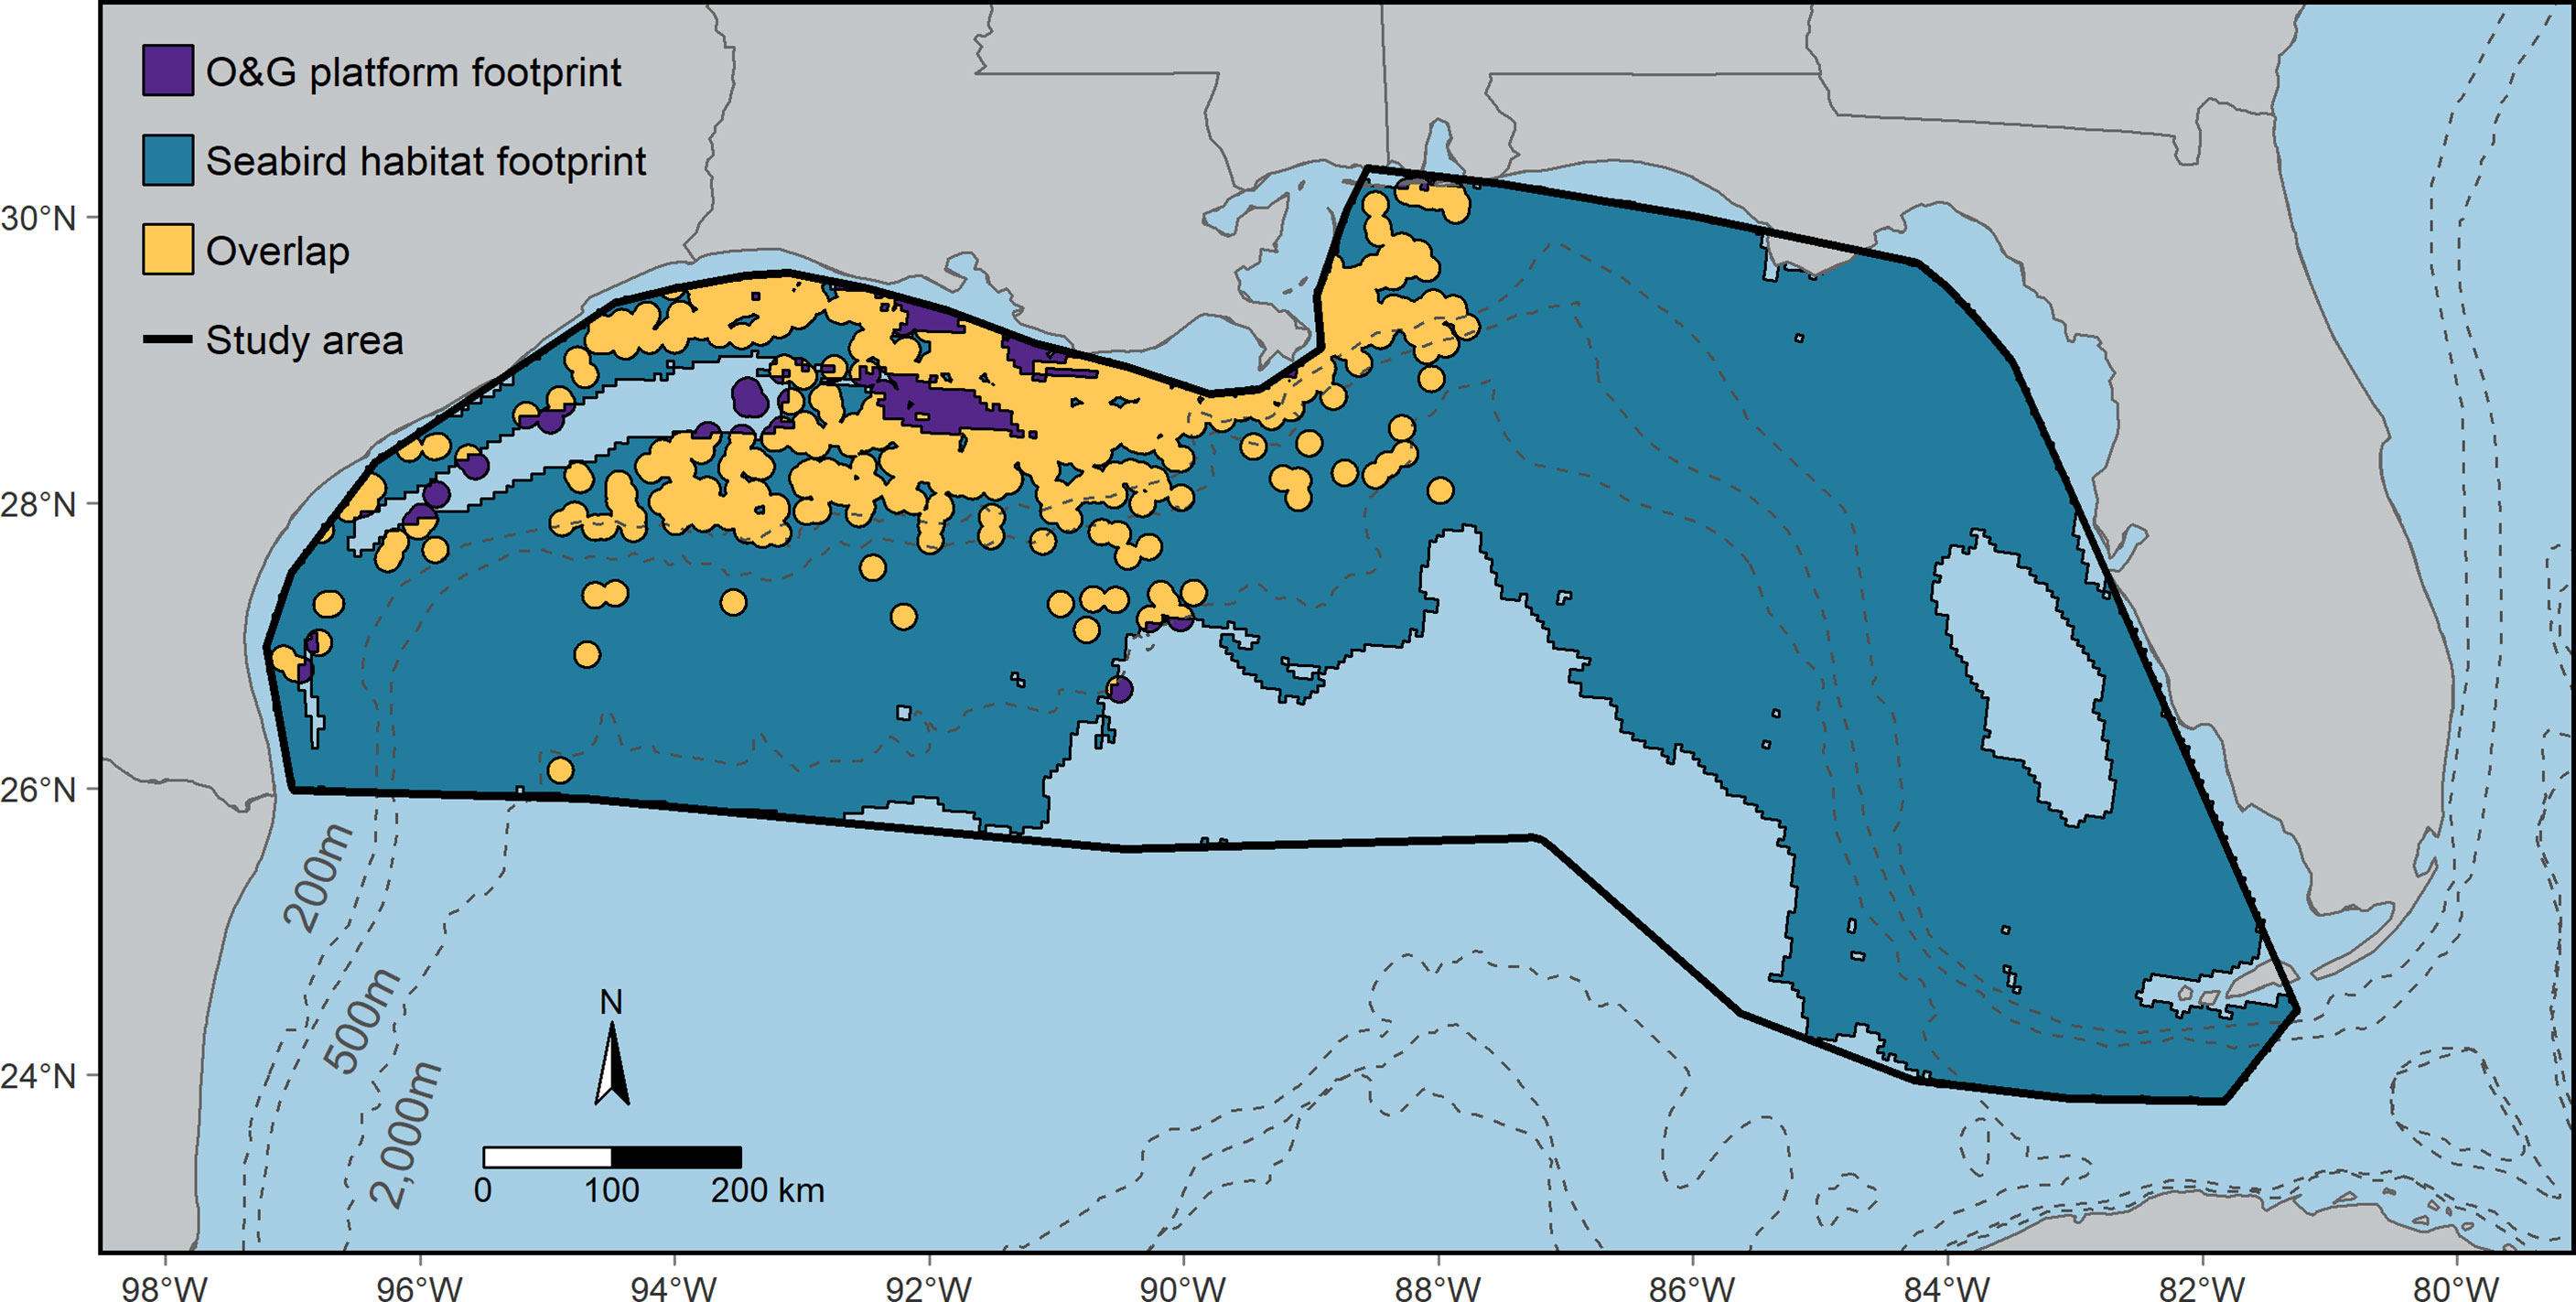
Figure 4 The overlap of seabird habitat with oil and gas (O&G) platforms in the northern Gulf of Mexico. The seabird habitat footprint (teal) covers the spatial extent of highly suitable habitat for all 24 seabird species modeled. The O&G platform footprint is the total area within 10 km of an O&G platform, where areas overlapping the seabird habitat footprint are yellow and non-overlapping areas are purple. See Section 2.3.1, Habitat overlapping with the O&G platforms section in Methods for details.
Cumulative seabird vulnerability was high along the continental shelf-slope in waters between ~200 m and 2,000 m (Figure 5). Moderate to low cumulative species vulnerability occasionally extended into pelagic areas. The cumulative seabird vulnerability/km2 was 3.21 within the O&G footprint compared to 2.33 outside of the O&G footprint. Overlap with high and moderate cumulative seabird vulnerability occurred from nearshore areas to the mid-shelf where the depth was ~500 m, and into more pelagic waters south of Louisiana.
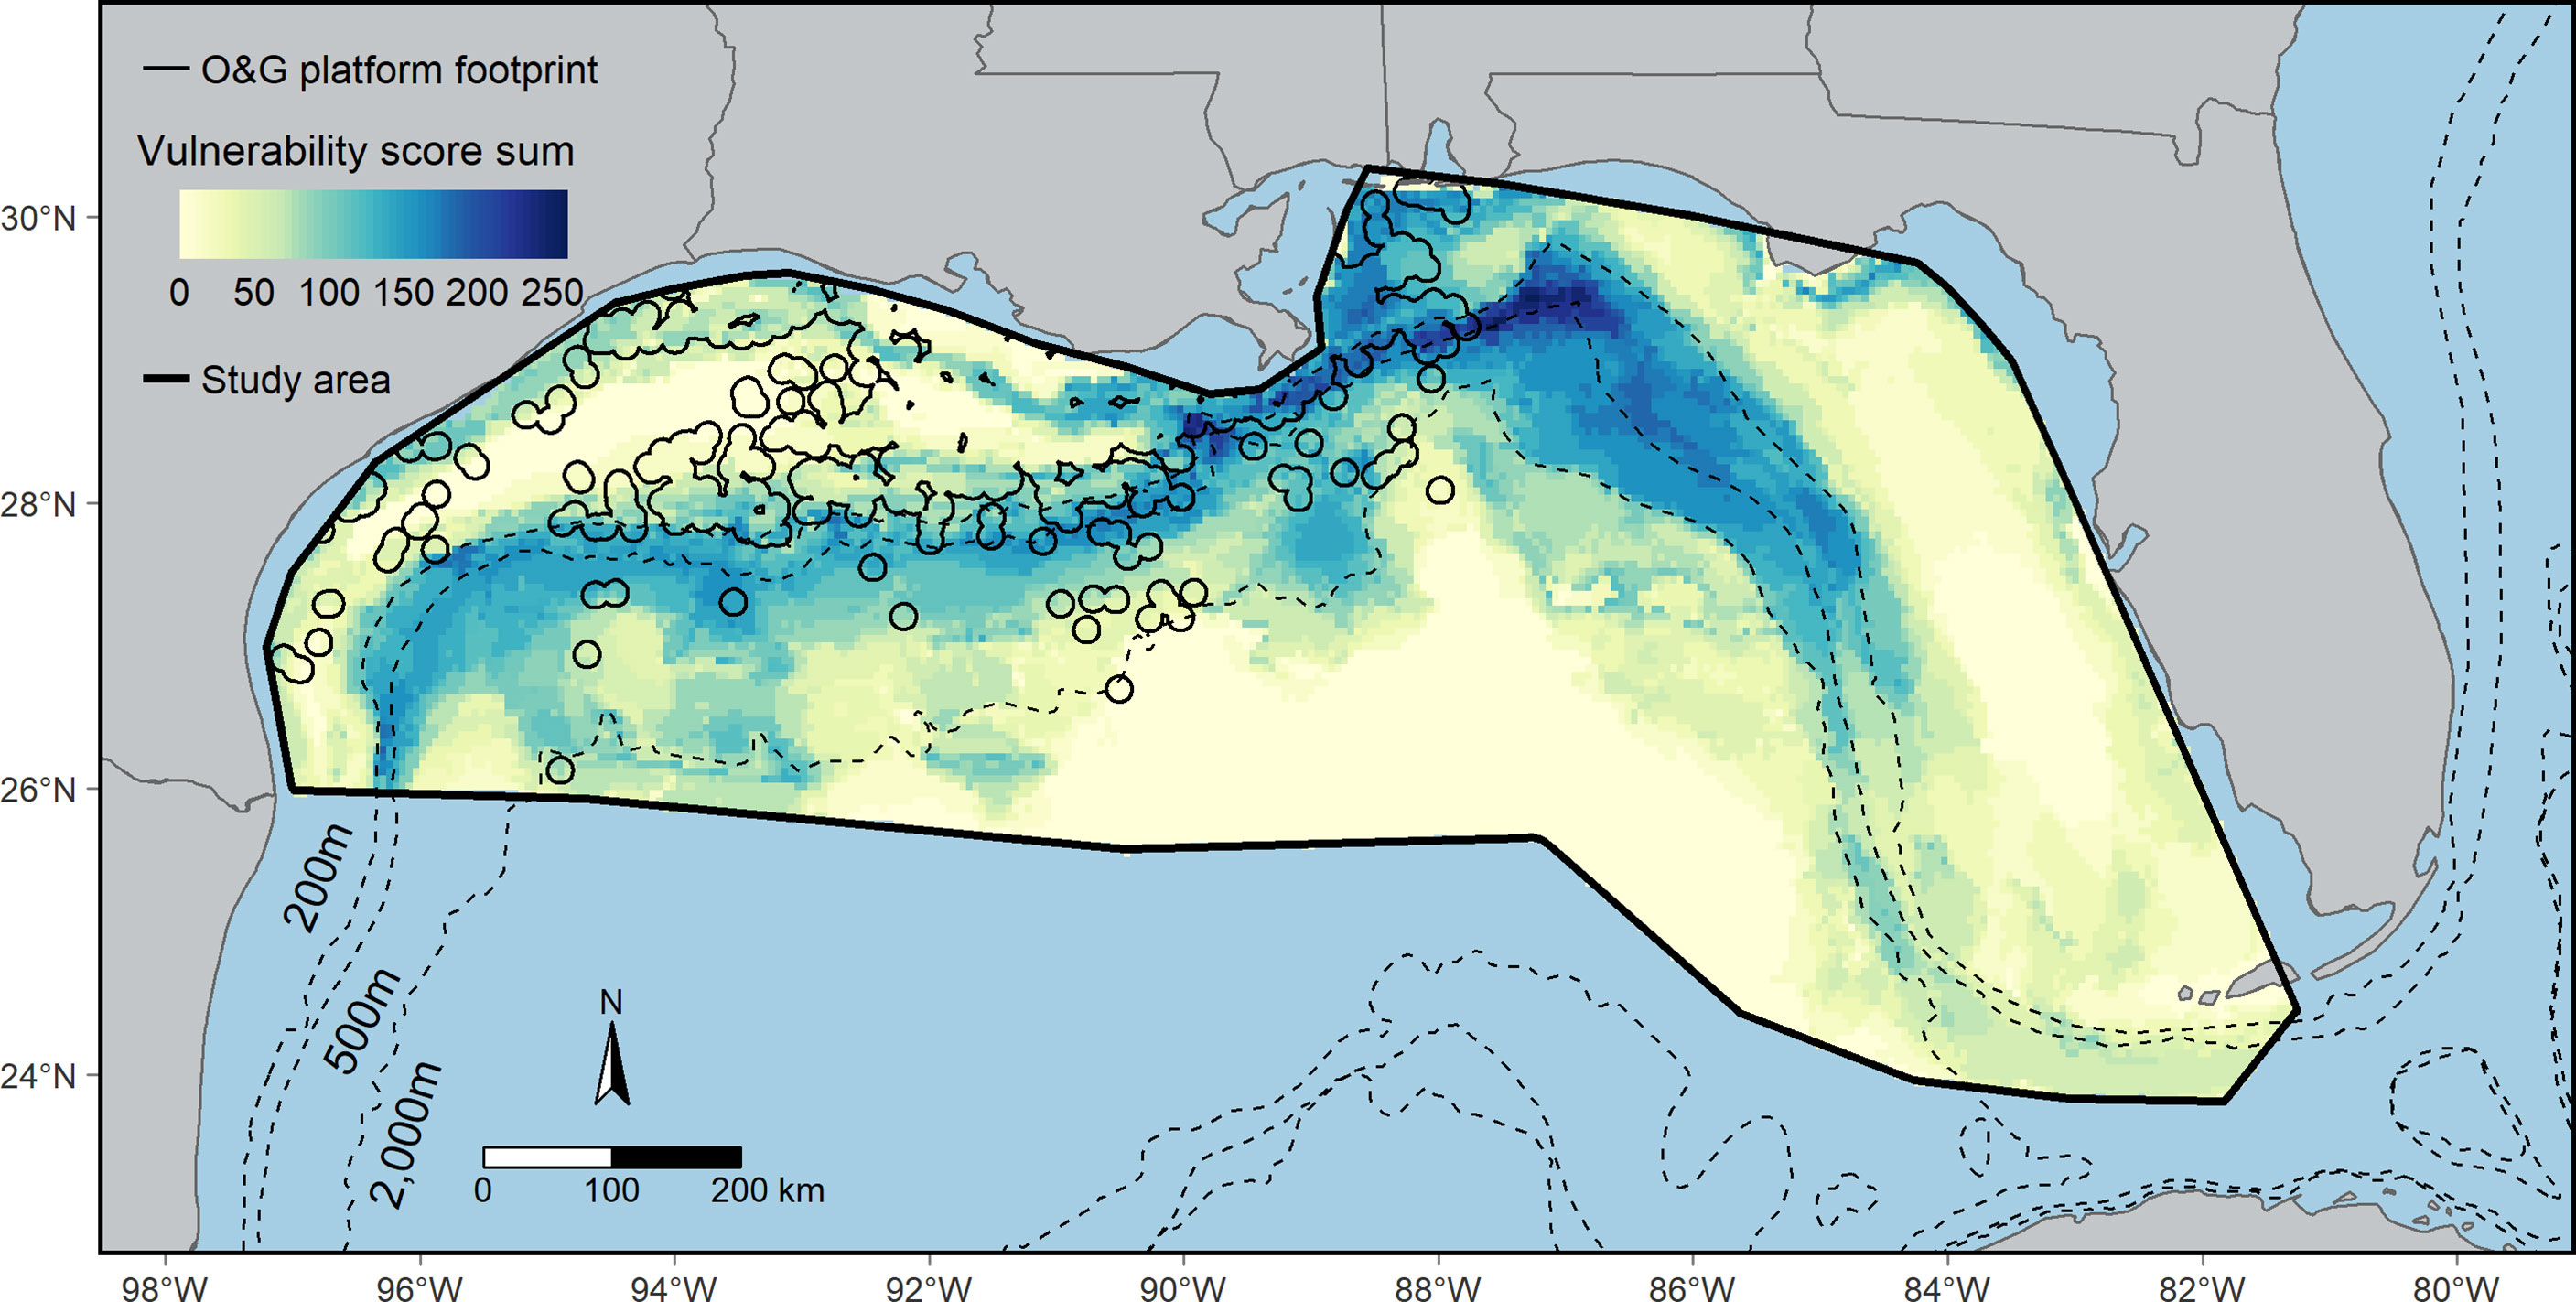
Figure 5 The overlap of cumulative seabird vulnerability with oil and gas (O&G) platforms in the northern Gulf of Mexico. Cumulative seabird vulnerability is the sum of the vulnerability scores assigned to the highly suitable habitat for each species. The O&G platform footprint (black outline within the study area) is the total area within 10 km of an O&G platform. See Section 2.5 Seabird habitat footprint, cumulative seabird vulnerability, and overlap with O&G in Methods for details.
4 Discussion
By integrating spatial, temporal, and life-history characteristics into one index, we characterized the relative vulnerability of seabirds to oiling in the nGoM; the first such index applied to seabirds in a sub-tropical to tropical environment. We found that variables that represent sensitivity (e.g., duration of the breeding period, age at first breeding) can strongly influence the vulnerability of a species to O&G activities and tend to have high uncertainty in the nGoM.
This suggests that it is important to continue to refine the understanding of the factors impacting how species can recover when assessing seabird vulnerability to oiling. Variables that represent exposure, particularly the proportion of highly suitable habitat that overlaps O&G platforms and the primary foraging technique for a species, were also important in distinguishing the species with the least and greatest measures of vulnerability. This first application of a seabird vulnerability index in the nGoM provides novel insights into sub-tropical and tropical systems. Including both sensitivity and exposure variables in future studies in sub-tropical to tropical regions and continued research in cooler regions could provide a more thorough characterization of seabird vulnerability to oiling across marine regions.
4.1 Species with the greatest vulnerability
The two most vulnerable species, Northern gannet and Audubon’s shearwater, had similar life-history and behavioral variable scores but very different levels of spatial overlap with O&G platforms (i.e., Northern gannet ~58%, Audubon’s shearwater ~5%). Breeding in Labrador and Newfoundland, ~25% of Northern gannets migrate to the nGoM during the nonbreeding/wintering period (November) and generally remain in the Gulf until they depart in the spring (April) (Montevecchi et al., 2012; Fifield et al., 2014). Blood, feather, and isotopic analysis of Northern gannet wintering in the nGoM indicate that they experience more stress than birds originating from the same colony, Bonaventure Island (Quebec, Canada), but wintering on the U.S. Atlantic coast (Champoux et al., 2020). The drivers of these differences are uncertain, but they may relate to greater exposure to environmental stressors in the nGoM than in the U.S. South Atlantic coast. Although Northern gannet are considered a species of least concern globally, our data and others suggest a relatively high level of vulnerability in the northern Gulf of Mexico (Jodice et al., 2019).
In contrast to Northern gannet using the nGoM in the nonbreeding season, the breeding origin of Audubon’s shearwater using the nGoM is not well understood. Audubon’s shearwater colonies exist throughout the Caribbean, but birds tagged in colonies in the northern Bahamas and Martinique did not enter the nGoM (Precheur, 2015; Ramos et al., 2021). Cay Sal Bank, which supports ~5,000 breeding pairs, is the closest known breeding site to the Gulf of Mexico (Mackin, 2016). With the most detections occurring in spring, summer, and fall, it is likely that many of the Audubon’s shearwater observed in the nGoM were post-breeding individuals. In addition to the variables included in the index applied here, the use of Sargassum reefs by Audubon’s shearwater for foraging (Haney, 1986; Moser and Lee, 2012) could lead to an additional oil exposure pathway, as algal mats and oil can aggregate due to processes at the water’s surface (Carmichael et al., 2012; Powers et al., 2013). While globally considered a species of least concern, Audubon’s shearwater has a Partners in Flight (United States of America and Canada) watch list classification of Yellow-D, indicating steep declines and the existence of major threats, and the Caribbean subspecies likely using the nGoM is a Caribbean at-risk species (Bradley and Norton, 2009; BirdLife International, 2021; Partners in Flight, 2021). A better understanding of the origins and population trends for Audubon’s shearwater using the nGoM could inform potential research or restoration actions related to this species.
4.2 Uncertainty
The high uncertainty of sensitivity variables is not surprising as the data needed to inform these variables can require intensive, multi-annual observation and monitoring efforts, and this is often lacking for seabirds that nest in remote locations. For example, if the determination of age at first breeding was deemed a variable for which additional data were required to fill a data gap, then a sustained population monitoring effort would likely need to be employed across a wide geographic range. Likewise, nest-based monitoring could provide additional data on the number of days from incubation through fledge. Beyond reducing the uncertainty in such variables, improved estimates of demographic data would allow other metrics synthesizing multiple life-history characteristics to be estimated. Such data could estimate the number of years lost through adult mortalities and the subsequent loss of potential offspring over their expected lifetimes, i.e., ‘bird years’ (Cole and Dahl, 2013; Evers et al., 2019). Within a Resource Equivalency Analysis framework, lost bird years have been used as a currency to estimate the degree of compensation needed to offset bird mortality associated with oil spills (Evers et al., 2019). Therefore, collecting robust demographic information could reduce uncertainty in sensitivity variables and augment the available tools for estimating interactions’ impacts and defining compensation targets.
Uncertainty in residency could be reduced by increasing the understanding of seabird movements across their annual cycle, including the degree of individual and interannual variation in movement patterns. Lagrangian methods, such as individual-based tracking, can be used to better understand variation in migration patterns (Baak et al., 2021), habitat use (Jodice et al., 2015; McCloskey et al., 2018; Phillips et al., 2018), and overlap with threats (Lamb et al., 2018; Isaksson et al., 2021). Tracking has identified previously unknown breeding areas (Kanai et al., 2002) and demonstrated links with distant colonies with seabirds using the nGoM (Montevecchi et al., 2012). Such information could inform population monitoring or recovery efforts and direct them towards the colonies and populations known to use the nGoM. More information on the magnitude, frequency, and degree of overlap with threats outside of the nGoM (e.g., bycatch, threats at breeding colonies), would enhance the inference gained from this variable, potentially revealing unexplored options to address seabird interactions in the nGoM. As data from the GoMMAPPS program are assessed, details on the marine range of species occurring in the Gulf are emerging (e.g., Jodice et al., 2021). Given that relatively few vessel surveys and satellite tracking efforts exist in the nGoM compared to other U.S. oil and gas production regions (e.g., Atlantic coast, California, Alaska), sustained, long-term regional surveys and satellite tracking would reduce uncertainty in estimates of seabird vulnerability to oil.
4.3 Habitat, cumulative seabird vulnerability, and overlap with O&G platforms
The extensive seabird habitat footprint demonstrates broad-scale use of the nGoM by seabirds, and the disproportionate percent of cumulative seabird vulnerability overlapping O&G platforms, notably on the shelf-slope, illustrates the non-exclusive use of Gulf habitats by humans and wildlife. Shelf-slope areas may offer seabirds enhanced foraging opportunities and prey aggregation associated with frontal zones such as the Louisiana Texas Shelf Front or other mesoscale features. As convergence zones, ocean fronts, and other dynamic features have been associated with seabird foraging behavior (Haney and McGillivary, 1985; Weimerskirch, 2007; Scales et al., 2014; Poli et al., 2017), these features could have a substantial impact on seabird distribution. Further study of seabird associations with oceanographic features in the nGoM could investigate these potential relationships and refine the characterization of seabird habitat, which could be used to reduce, manage, or mitigate interactions with O&G activities.
The near-complete (~89%) overlap of O&G platforms within the seabird habitat footprint suggests a high potential for seabirds to interact with any given platform. Much of this overlap of seabird habitat with O&G platforms in waters< 500 m depth, particularly near the 200 m isobath, an area of high cumulative seabird vulnerability. Seabird surveys in the Gulf of Mexico have noted relatively low densities of seabirds over the middle and outer continental shelf (Haney et al., 2019). However, without detailed information on species-specific densities, it is unclear how the number of individual seabirds could impact the characteristics of the vulnerability of the entire assemblage of seabirds in the nGoM.
In addition to small spills and produced waters, seabirds and other avifauna can be impacted by platforms themselves. Platforms and platform activities, particularly lights and flares, can distract and disorient avifauna, potentially resulting in collisions (Russell, 2005; Montevecchi, 2006; Ronconi et al., 2015). A better understanding of the spatial extent of seabird attraction to flares, which can occur at night and during the day, could be used to refine how the spatial footprint of O&G is defined and improve our understanding of the impacts of O&G activities. Seabirds in the nGoM have been observed roosting and foraging from platforms (Ortego, 1978; Russell, 2005), potentially resulting in prolonged/increased exposure to oiling and other anthropogenic interactions. Direct and indirect interactions with O&G platforms could be better understood through standardized monitoring programs with trained observers, systematically covering different environmental and lighting conditions (Wiese et al., 2001; Burke et al., 2012; Ronconi et al., 2015). Technologies including telemetry, cameras, and radar could also be used to augment monitoring efforts and coverage (Ronconi et al., 2015). While overlap at a macro-scale does not equate to an interaction, the degree of O&G platforms overlapping seabird habitat in our study area merits consideration as a coarse indicator of potential interaction.
4.4 Future seabird interactions with offshore energy in the nGoM
Ongoing development of O&G activity in the nGoM suggests that seabird overlap and potential interactions with offshore energy activities are not likely to decline over time. Continued installation of ultra-deep wells (> 1,000 meters depth) will expand the O&G footprint along the continental shelf and into more pelagic waters (Murawski et al., 2020). This spatial expansion would increase the spatial extent of overlap with seabird habitats. Increased overlap would increase seabird vulnerability scores of many seabird species, particularly those that occupy pelagic habitats. An expanded footprint of O&G platforms would also augment acute oil exposure via spills and chronic exposure through the continued release of produced waters. Thus, updating the scores of variables in the index to reflect current levels of overlap could help maintain the relevancy of index-based relative vulnerability ranks. Some have suggested that climate change could amplify these risks, with increased storm frequency heightening the potential for damage to oil and gas infrastructure and spills (Cruz and Krausmann, 2013). However, the relative importance of mechanisms controlling tropical cyclone activity in the Gulf remains unclear; the direction of change (increase or decrease) of future tropical cyclone activity in the nGoM remains an active field of research (Colbert et al., 2013; Knutson et al., 2015; Rodysill et al., 2020).
Installation of wind turbines on the Gulf of Mexico Outer Continental Shelf (DOI, 2021) could increase the footprint and density of marine infrastructure in areas ≤ 500 m depth, the current maximum depth for wind turbines. This depth range coincides with areas of high cumulative seabird vulnerability. The behavioral response and impacts of offshore wind energy development will be species-specific and may involve avoidance or attraction (Furness et al., 2013; Dierschke et al., 2016). Avoidance behavior can increase energy expenditure, while attraction can lead to collision mortalities or other lethal or sub-lethal interactions (Drewitt and Langston, 2006; Masden et al., 2010). These behavioral modifications and impacts could be compounded with those related to O&G activities. Understanding the cumulative effects of offshore energy, characterizing how and when seabirds interact with offshore energy acquisition, and considering the impacts of climate change appears warranted.
5 Conclusions
Multiple processes influence the vulnerability of seabirds to oiling. An index-based approach provides a rapid, albeit somewhat less detailed, tool to rank the relative vulnerability of seabirds to oiling. New data and changes in uncertainty related to new data sources could be incorporated into this index to provide an updated tool for assessment and allow comparisons across taxa (e.g., Polidoro et al., 2021). Information on seabird vulnerability to offshore wind energy activities could also be incorporated. The potential impacts of climate change could also be assessed by combining vulnerability indices or index values with climate change projections, providing further insight. Tailored to the current state of knowledge for seabirds in the nGoM, the index applied here is highly adaptable and demonstrates how currently available information on seabird distribution, abundance, life history, and behavior can be used to rank the relative vulnerability of seabirds to oiling. Stakeholders could use these rankings and the identified knowledge gaps to prioritize research or recovery efforts.
Data availability statement
Seabird observation data can be accessed through the National Centers for Environmental Information (NCEI) archives: https://www.ncei.noaa.gov/archive/accession/0247206 and DOI https://doi.org/10.25921/afrq-h385 (Gleason et al., 2022).
Author contributions
PEM: Conceptual design, analytical approach, manuscript development, analysis, writing KMH: Visualizations JCH, YGS: data management PGRJ, JCH, JSG, YGS: manuscript feedback YGS: data proofing, initial data management JCH, JSG, YGS: data collection PGRJ, JCH, JSG: subject expertise PGRJ: Conceptual design, manuscript development JSG, PGRJ: data ownership JSG, PGRJ: Acquire funding.
Funding
Funding for GoMMAPPS surveys was provided by the U.S. Department of the Interior, Bureau of Ocean Energy Management through Intra-Agency Agreement M17PG00011 with the U.S. Department of Interior, U.S. Fish and Wildlife Service via an Intra-Agency Agreement 4500108172-F17IA00005 with the U.S. Geological Survey, South Carolina Cooperative Fish and Wildlife Research Unit at Clemson University.
Acknowledgments
We are grateful to the crews and NOAA field party chiefs of the R/V Gordon Gunter, Oregon II, and Pisces, for their logistical support. We also thank the many seabird observers who participated in GoMMAPPS: Jonathan M. Andrew, Dan Bauer, Peter J. Blank, Dawn Breese, Elizabeth T. Hug, Matthew Love, Michelle McDowell, Nicholas Metheny, Mark Oberle, Jim Panaccione, and Stormy Paxton. E. Kelsey provided helpful feedback furthering the development of the manuscript. Anonymous reviewers provided helpful reviews of the manuscript. Funding for GoMMAPPS surveys was provided by the U.S. Department of the Interior, Bureau of Ocean Energy Management through Intra-Agency Agreement M17PG00011 with the U.S. Department of Interior, Fish and Wildlife Service via an Intra-Agency Agreement 4500108172-F17IA00005 with the U.S. Geological Survey, South Carolina Cooperative Fish and Wildlife Research at Clemson University. The South Carolina Cooperative Fish and Wildlife Research Unit is jointly supported by the U.S. Geological Survey, South Carolina DNR, and Clemson University. Any use of trade, firm, or product names is for descriptive purposes only and does not imply endorsement by the U.S. Government. The findings and conclusions in this paper are those of the author(s) and do not necessarily represent the views of the U.S. Fish and Wildlife Service.
Conflict of interest
Terra Mar Applied Sciences, LLC, has no commercial or financial relationships that could be construed as a potential conflict of interest (in part because business practices bar any direct investment or business relationships with offshore for-profit enterprises, including grants, awards, and consulting arrangements)
The authors declare that the research was conducted in the absence of any commercial or financial relationships that could be construed as a potential conflict of interest.
Publisher’s note
All claims expressed in this article are solely those of the authors and do not necessarily represent those of their affiliated organizations, or those of the publisher, the editors and the reviewers. Any product that may be evaluated in this article, or claim that may be made by its manufacturer, is not guaranteed or endorsed by the publisher.
Supplementary material
The Supplementary Material for this article can be found online at: https://www.frontiersin.org/articles/10.3389/fmars.2022.880750/full#supplementary-material
References
Baak J. E., Mallory M. L., Anderson C. M., Auger-Méthé M., Macdonald C. A., Jassen M. H., et al. (2021). Inter-individual variation in the migratory behaviour of a generalist seabird, the herring gull (Larus smithsoniansus), from the Canadian Arctic. Anim. Migr. 8, 144–155. doi: 10.1515/ami-2020-0109
Bakke T., Klungsøyr J., Sanni S. (2013). Environmental impacts of produced water and drilling waste discharges from the Norwegian offshore petroleum industry. Mar. Environ. Res. 92, 154–169. doi: 10.1016/j.marenvres.2013.09.012
Ballance L., Force M. (2016). Seabird distribution and abundance survey protocols (California, U.S.A.: Ecosystems Studies Program, Southwest Fisheries Science Center La Jolla).
Barros Á., Álvarez D., Velando A. (2014). Long-term reproductive impairment in a seabird after the prestige oil spill. Biol. Lett. 10, 20131041. doi: 10.1098/rsbl.2013.1041
Beyer J., Goksøyr A., Hjermann D.Ø., Klungsøyr J. (2020). Environmental effects of offshore produced water discharges: A review focused on the Norwegian continental shelf. Mar. Environ. Res. 105–155. doi: 10.1016/j.marenvres.2020.105155
Bi R., Jiao Y., Browder J. A. (2021). Climate driven spatiotemporal variations in seabird bycatch hotspots and implications for seabird bycatch mitigation. Sci. Rep. 11, 20704. doi: 10.1038/s41598-021-00078-z
BirdLife International 2021(2021) The IUCN red list of threatened species 2021. Available at: https://www.iucnredlist.org.
Bird J. P., Martin R., Akçakaya H. R., Gilroy J., Burfield I. J., Garnett S. T., et al. (2020). Generation lengths of the world’s birds and their implications for extinction risk. Conserv. Biol. 34, 1252–1261. doi: 10.1111/cobi.13486
BOEM (2016). “Gulf of Mexico OCS oil and gas lease sale: 2017,” in Central planning area lease sale 245 final supplemental environmental impact statement. OCS EIS/EA BOEM 2016-061(New Orleans, Louisiana, U.S.A: Bureau of Ocean Energy Management).
BOEM spill statistics (2012). Available at: https://www.boem.gov/environment/environmental-assessment/spills-statistics-and-summaries-1996-2011https://www.boem.gov/sites/default/files/uploadedFiles/BOEM/Environmental_Stewardship/Environmental_Assessment/Oil_Spill_Modeling/SpillsbblCY1970to2010%281%29.xls (Accessed July, 3, 2012).
Bradley A. P. (1997). The use of the area under the ROC curve in the evaluation of machine learning algorithms. Pattern Recognit. 30, 1145–1159. doi: 10.1016/S0031-3203(96)00142-2
Bradley P. E., Norton R. L. (2009). An inventory of breeding seabirds in the Caribbean (Gainesville, Florida: University Press of Florida).
Burke C. M., Montevecchi W. A., Wiese F. K. (2012). Inadequate environmental monitoring around offshore oil and gas platforms on the grand bank of Eastern Canada: Are risks to marine birds known? J. Environ. Manage. 104, 121–126. doi: 10.1016/j.jenvman.2012.02.012
Camphuysen K. C. J. (1998). Beached bird surveys indicate decline in chronic oil pollution in the north Sea. Mar. pollut. Bull. 36, 519–526. doi: 10.1016/S0025-326X(98)80018-0
Carmichael C. A., Arey J. S., Graham W. M., Linn L. J., Lemkau K. L., Nelson R. K., et al. (2012). Floating oil-covered debris from Deepwater Horizon : identification and application. Environ. Res. Lett. 7, 15301. doi: 10.1088/1748-9326/7/1/015301
Champoux L., Rail J.-F., Houde M., Giraudo M., Lacaze E., Franci C. D., et al. (2020). An investigation of physiological effects of the deepwater horizon oil spill on a long-distance migratory seabird, the northern gannet. Mar. Pollut. Bull. 153, 110953. doi: 10.1016/j.marpolbul.2020.110953
Colbert A. J., Soden B. J., Vecchi G. A., Kirtman B. P. (2013). The impact of anthropogenic climate change on north Atlantic tropical cyclone tracks. J. Clim. 26, 4088–4095. doi: 10.1175/JCLI-D-12-00342.1
Cole S. G., Dahl E. L. (2013). Compensating white-tailed eagle mortality at the smøla wind-power plant using electrocution prevention measures. Wildl. Soc Bull. 37, 84–93. doi: 10.1002/wsb.263
Cornell Lab of Ornithology (2019) All about birds.” Cornell Lab of ornithology (Ithaca, New York) (Accessed 27 May 2021).
Cruz A. M., Krausmann E. (2013). Vulnerability of the oil and gas sector to climate change and extreme weather events. Clim. Change 121, 41–53. doi: 10.1007/s10584-013-0891-4
Dias M. P., Martin R., Pearmain E. J., Burfield I. J., Small C., Phillips R. A., et al. (2019). Threats to seabirds: a global assessment. Biol. Conserv. 237, 525–537. doi: 10.1016/j.biocon.2019.06.033
Dierschke V., Furness R. W., Garthe S. (2016). Seabirds and offshore wind farms in European waters: Avoidance and attraction. Biol. Conserv. 202, 59–68. doi: 10.1016/j.biocon.2016.08.016
DOI (2021). Department of the Interior, Bureau of Ocean Energy management. Docket no. BOEM-2021-004. Request for Interest in Commercial Leasing for Wind Power Development on the Gulf of Mexico Outer Continental Shelf (OCS), FR Doc. 2021–12267 Filed 6–10–21; 8:45 am, Billing Code 4310–MR–P.
Drewitt A. L., Langston R. H. W. (2006). Assessing the impacts of wind farms on birds. Ibis (Lond. 1859). 148, 29–42. doi: 10.1111/j.1474-919X.2006.00516.x
Duan R.-Y., Kong X.-Q., Huang M.-Y., Fan W.-Y., Wang Z.-G. (2014). The predictive performance and stability of six species distribution models. PLoS One 9, e112764. doi: 10.1371/journal.pone.0112764
Evers D. C., Sperduto M., Gray C. E., Paruk J. D., Taylor K. M. (2019). Restoration of common loons following the north cape oil spill, Rhode island, USA. Sci. Total Environ. 695, 1–8. doi: 10.1016/j.scitotenv.2019.133849
Fallon J. A., Smith E. P., Schoch N., Paruk J. D., Adams E. A., Evers D. C., et al. (2018). Hematological indices of injury to lightly oiled birds from the deepwater horizon oil spill. Environ. Toxicol. Chem. 37, 451–461. doi: 10.1002/etc.3983
Fallon J. A., Smith E. P., Schoch N., Paruk J. D., Adams E. M., Evers D. C., et al. (2020). Ultraviolet-assisted oiling assessment improves detection of oiled birds experiencing clinical signs of hemolytic anemia after exposure to the deepwater horizon oil spill. Ecotoxicology 29, 1399–1408. doi: 10.1007/s10646-020-02255-8
Fifield D. A., Montevecchi W. A., Garthe S., Robertson G. J., Kubetzki U., Rail J.-F. (2014). Migratory tactics and wintering areas of northern gannets (Morus bassanus) breeding in north America. Ornithol. Monogr. 79, i–63. doi.org/10.1642/aoum.79-1
Fox C. H., O’hara P. D., Bertazzon S., Morgan K., Underwood F. E., Paquet P. C. (2016). A preliminary spatial assessment of risk: Marine birds and chronic oil pollution on canada’s pacific coast. Sci. Total Environ. 573, 799–809. doi: 10.1016/j.scitotenv.2016.08.145
Furness R. W., Wade H. M., Masden E. A. (2013). Assessing vulnerability of marine bird populations to offshore wind farms. J. Environ. Manage. 119, 56–66. doi: 10.1016/j.jenvman.2013.01.025
Gleason J. S., Wilson R. R., Jodice P. G., Satgé Y. G., Michael P. E., Hixson K. M., et al. (2022). Seabird visual surveys using line-transect methods collected from NOAA vessels in the northern Gulf of Mexico for the Gulf of Mexico Marine Assessment Program for Protected Species (GoMMAPPS) project from 2017-07-21 to 2019-09-25 (NCEI Accession 0247206) [Accessed April 4, 2022].
Golet G. H., Seiser P. E., McGuire A. D., Roby D. D., Fischer J. B., Kuletz K. J., et al. (2002). Long-term direct and indirect effects of the’Exxon valdez’oil spill on pigeon guillemots in prince William sound, Alaska. Mar. Ecol. Prog. Ser. 241, 287–304. doi: 10.3354/meps241287
Haney J. C. (1986). Seabird patchiness in tropical oceanic waters: the influence of sargassum “reefs”. Auk 103, 141–151. doi: 10.1093/auk/103.1.141
Haney J. C., Fristrup K. M., Lee D. S. (1992). Geometry of visual recruitment by seabirds to ephemeral foraging flocks. Ornis Scand, 49–62. doi: 10.2307/3676427
Haney J. C., Hemming J. M., Tuttle P. (2019). Pelagic seabird density and vulnerability in the gulf of Mexico to oiling from the deepwater Horizon/MC-252 spill. Environ. Monit. Assess. 191, 1–10. doi: 10.1007/s10661-019-7921-2
Haney J. C., Jodice P. G. R., Montevecchi W. A., Evers D. C. (2017). Challenges to oil spill assessment for seabirds in the deep ocean. Arch. Environ. Contam. Toxicol 73, 33–39. doi: 10.1007/s00244-016-0355-8
Haney J. C., McGillivary P. A. (1985). Midshelf fronts in the south Atlantic bight and their influence on seabird distribution and seasonal abundance. Biol. Oceanogr. 3, 401–430.
Harr K. E., Reavill D. R., Bursian S. J., Cacela D., Cunningham F. L., Dean K. M., et al. (2017). Organ weights and histopathology of double-crested cormorants (Phalacrocorax auritus) dosed orally or dermally with artificially weathered Mississippi canyon 252 crude oil. Ecotoxicol. Environ. Saf. 146, 52–61. doi: 10.1016/j.ecoenv.2017.07.011
Holdway D. A. (2002). The acute and chronic effects of wastes associated with offshore oil and gas production on temperate and tropical marine ecological processes. Mar. Pollut. Bull. 44, 185–203. doi: 10.1016/S0025-326X(01)00197-7
Humphries G. R. W., Huettmann F. (2014). Putting models to a good use: A rapid assessment of Arctic seabird biodiversity indicates potential conflicts with shipping lanes and human activity. Divers. Distrib 20, 478–90. doi: 10.1111/ddi.12177
Isaksson N., Cleasby I. R., Owen E., Williamson B. J., Houghton J. D. R., Wilson J., et al. (2021). The use of animal-borne biologging and telemetry data to quantify spatial overlap of wildlife with marine renewables. J. Mar. Sci. Eng. 9, 263. doi: 10.3390/jmse9030263
Jodice P. G. R., Adams E. M., Lamb J. S., Satgé Y., Gleason J. S. (2019). “Strategic bird monitoring guidelines for the northern gulf of Mexico: Seabirds,” in Wilson R. R., Fournier A., Gleason J. S., Lyons J. E., Woodrey M. S.Strategic Bird Monitoring Guidelines for the Northern Gulf of Mexico. (Mississippi Agricultural and Forestry Extension Research Bulletin 1228, Mississippi State University, Starkville, Mississisppi, U.S.A: Gulf of Mexico Avian Monitoring Network), 129–69. https://www.mafes.msstate.edu/publications/bulletins/b1228.pdf
Jodice P. G. R., Michael P. E., Gleason J. S., Haney J. C., Satgé Y. G. (2021). Revising the marine range of the endangered black-capped petrel pterodroma hasitata: occurrence in the northern gulf of Mexico and exposure to conservation threats. Endanger. Species Res. 46, 49–65. doi: 10.3354/esr01143
Jodice P. G. R., Ronconi R. A., Rupp E., Wallace G. E., Satgé Y. (2015). First satellite tracks of the endangered black-capped petrel. Endanger. Species Res. 29, 23–33. doi: 10.3354/esr00697
Kanai Y., Nagendran M., Ueta M., Markin Y., Rinne J., Sorokin A. G., et al. (2002). Discovery of breeding grounds of a Siberian crane grus leucogeranus flock that winters in Iran, via satellite telemetry. Bird Conserv. Int. 12, 327–333. doi: 10.1017/S0959270902002204
Kelsey E. C., Felis J. J., Czapanskiy M., Pereksta D. M., Adams J. (2018). Collision and displacement vulnerability to offshore wind energy infrastructure among marine birds of the pacific outer continental shelf. J. Environ. Manage. 227, 229–247. doi: 10.1016/j.jenvman.2018.08.051
King M. D., Elliott J. E., Williams T. D. (2021). Effects of petroleum exposure on birds: A review. Sci. Total Environ. 755, 142834. doi: 10.1016/j.scitotenv.2020.142834
King J. G., Sanger G. A. (1979). Oil vulnerability index for marine oriented birds. Conserv. Mar. birds North. North Am. 11, 227–239.
Kinlan B. P., Winship A. J., White T. P., Christensen J. (2016). Modeling at-sea occurrence and abundance of marine birds to support Atlantic marine renewable energy planning: Phase I report (U.S. Department of the Interior, Bureau of Ocean Energy Management, Office of Renewable Energy Programs. Sterling, Virginia, U.S.A: OCS Study BOEM 2016-039), 113.
Knutson T. R., Sirutis J. J., Zhao M., Tuleya R. E., Bender M., Vecchi G. A., et al. (2015). Global projections of intense tropical cyclone activity for the late twenty-first century from dynamical downscaling of CMIP5/RCP4. 5 scenarios. J. Clim. 28, 7203–7224. doi: 10.1175/JCLI-D-15-0129.1
Lamb J. S., Newstead D. J., Koczur L. M., Ballard B. M., Green M. C., Jodice P. G. R. (2018). A bridge between oceans: overland migration of marine birds in a wind energy corridor. J. Avian Biol. 49, jav–01474. doi: 10.1111/jav.01474
Lamb J. S., Satgé Y. G., Jodice P. G. R. (2020). Seasonal variation in environmental and behavioural drivers of annual-cycle habitat selection in a nearshore seabird. Divers. Distrib. 26, 254–266. doi: 10.1111/ddi.13015
Lieske D. J., Fifield D. A., Gjerdrum C. (2014). Maps, models, and marine vulnerability: Assessing the community distribution of seabirds at-sea. Biol. Conserv 172, 15–28. doi: 10.1016/j.biocon.2014.02.010
Mackin W. A. (2016). Current and former populations of audubon’s shearwater (Puffinus lherminieri) in the Caribbean region. Condor 118, 655–673. doi: 10.1650/CONDOR-16-2.1
Masden E. A., Haydon D. T., Fox A. D., Furness R. W. (2010). Barriers to movement: modelling energetic costs of avoiding marine wind farms amongst breeding seabirds. Mar. Pollut. Bull. 60, 1085–1091. doi: 10.1016/j.marpolbul.2010.01.016
McCloskey S. E., Uher-Koch B. D., Schmutz J. A., Fondell T. F. (2018). International migration patterns of red-throated loons (Gavia stellata) from four breeding populations in Alaska. PloS One 13, e0189954. doi: 10.1371/journal.pone.0189954
Montevecchi W. A. (2006). Influences of artificial light on marine birds. Ecological consequences Artif. night Light. (Washington, DC: Island Press), 94–113.
Montevecchi W., Fifield D., Burke C., Garthe S., Hedd A., Rail J.-F., et al. (2012). Tracking long-distance migration to assess marine pollution impact. Biol. Lett. 8, 218–221. doi: 10.1098/rsbl.2011.0880
Moser M. L., Lee D. S. (2012). A fourteen-year survey of plastic ingestion by Western north Atlantic seabirds. Source Colon. Waterbirds 15, 83–94. doi: 10.2307/1521357
Murawski S. A., Hollander D. J., Gilbert S., Gracia A., et al. (2020). “Deepwater oil and gas production in the gulf of Mexico and related global trends,” in Scenarios and responses to future deep oil spills. Eds. Murawski S. A., Ainsworth C. H., Gilbert S., Hollander D. J., Paris C. B., Schlüter M., et al. (Cham, Switzerland: Springer Nature Switzerland AG), 16–32. doi: 10.1007/978-3-030-12963-7_2
Nevalainen M., Vanhatalo J., Helle I. (2019). Index-based approach for estimating vulnerability of Arctic biota to oil spills. Ecosphere 10, e02766. doi: 10.1002/ecs2.2766
O’Hara P. D., Morandin L. A. (2010). Effects of sheens associated with offshore oil and gas development on the feather microstructure of pelagic seabirds. Mar. pollut. Bull. 60, 672–678. doi: 10.1016/j.marpolbul.2009.12.008
Partners in Flight (2021) Avian conservation assessment database, version 2021. Available at: http://pif.birdconservancy.org/ACAD (Accessed 24 March 2021).
Paruk J. D., Adams E. M., Uher-Koch H., Kovach K. A., Long D. IV, Perkins C., et al. (2016). Polycyclic aromatic hydrocarbons in blood related to lower body mass in common loons. Sci. Total Environ. 565, 360–368. doi: 10.1016/j.scitotenv.2016.04.150
Peterson C. H., Rice S. D., Short J. W., Esler D., Bodkin J. L., Ballachey B. E., et al. (2003). Long-term ecosystem response to the Exxon Valdez oil spill. Science 302, 2082–2086. doi: 10.1126/science.1084282
Phillips S. J., Anderson R. P., Schapire R. E. (2006). Maximum entropy modeling of species geographic distributions. Ecol. Modell. 190, 231–259. doi: 10.1016/j.ecolmodel.2005.03.026
Phillips E. M., Horne J. K., Adams J., Zamon J. E. (2018). Selective occupancy of a persistent yet variable coastal river plume by two seabird species. Mar. Ecol. Prog. Ser. 594, 245–261. doi: 10.3354/meps12534
Polidoro B., Matson C. W., Ottinger M. A., Renegar D. A., Romero I. C., Schlenk D., et al. (2021). A multi-taxonomic framework for assessing relative petrochemical vulnerability of marine biodiversity in the gulf of Mexico. Sci. Total Environ. 763, 142986. doi: 10.1016/j.scitotenv.2020.142986
Poli C. L., Harrison A. L., Vallarino A., Gerard P. D., Jodice P. G. R. (2017). Dynamic oceanography determines fine scale foraging behavior of masked boobies in the gulf of Mexico. PloS One 12, 1–24. doi: 10.1371/journal.pone.0178318
Powers S. P., Hernandez F. J., Condon R. H., Drymon J. M., Free C. M. (2013). Novel pathways for injury from offshore oil spills: Direct, sublethal and indirect effects of the deepwater horizon oil spill on pelagic sargassum communities PloS one 8, e74802. doi: 10.1371/journal.pone.0074802
Precheur C. (2015). Ecologie et conservation du puffin d’Audubon (Puffinus lherminieri lherminieri) de la réserve naturelle des îlets de sainte-Anne (Martinique) (Guadeloupe, Pointe-à-Pitre, Lesser Antilles: Doctoral thesis, l’Université des Antilles).
Ramos R., Paiva V. H., Zajková Z., Precheur C., Fagundes A. I., Jodice P. G. R., et al. (2021). Spatial ecology of closely related taxa: the case of the little shearwater complex in the north Atlantic ocean. Zool. J. Linn. Soc 191, 482–502. doi.org/10.1093/zoolinnean/zlaa045
R Development Core Team (2021) R: a language and environment for statistical computing. Available at: http://cran.r-project.org.
Renner M., Kuletz K. J. (2015). A spatial-seasonal analysis of the oiling risk from shipping traffic to seabirds in the Aleutian archipelago. Mar. pollut. Bull. 101, 127–136. doi: 10.1016/j.marpolbul.2015.11.007
Rodysill J. R., Donnelly J. P., Sullivan R., Lane P. D., Toomey M., Woodruff J. D., et al. (2020). Historically unprecedented northern gulf of Mexico hurricane activity from 650 to 1250 CE. Sci. Rep. 10, 1–17. doi: 10.1038/s41598-020-75874-0
Romero A. F., Oliveira M., Abessa D. M. S. (2018). A simple bird sensitivity to oil index as a management tool in coastal and marine areas subject to oil spills when few biological information is available. Mar. pollut. Bull. 128, 460–465. doi: 10.1016/j.marpolbul.2017.12.008
Ronconi R. A., Allard K. A., Taylor P. D. (2015). Bird interactions with offshore oil and gas platforms: review of impacts and monitoring techniques. J. Environ. Manage. 147, 34–45. doi: 10.1016/j.jenvman.2014.07.031
Russell R. W. (2005). Interactions between migrating birds and offshore oil and gas platforms in the northern gulf of Mexico: Final report. OCS Study MMS (New Orleans, Louisiana, USA: U.S. Department of the Interior, Minerals Management Service (MMS), Gulf of Mexico Outer Continental Shelf (OCS) Region, OCS Study MMS 2005-009) 9, 327.
Scales K. L., Miller P. I., Embling C. B., Ingram S. N., Pirotta E., Votier S. C. (2014). Mesoscale fronts as foraging habitats: composite front mapping reveals oceanographic drivers of habitat use for a pelagic seabird. C. J. R. Soc Interface 11, 20140679. doi: 10.1098/rsif.2014.0679
Seip K. L., Sandersen E., Mehlum F., Ryssdal J. (1991). Damages to seabirds from oil spills: comparing simulation results and vulnerability indexes. Ecol. Modell. (Boca Raton, Florida, U.S.A.) 53, 39–59. doi: 10.1016/0304-3800(91)90140-V
Sigourney D. B., Orphanides C. D., Hatch J. M. (2019). Estimates of seabird bycatch in commercial fisheries off the East coast of the united states from 2015 to 2016 (Northeast Fisheries Science Center, Woods Hole, Massachusetts, U.S.A.: U.S. Department of Commerce, National Oceanic and Atmospheric Administration).
Spear L. B., Ballance L. T., Ainley D. G. (2001). Response of seabirds to thermal boundaries in the tropical pacific: the thermocline versus the equatorial front. Mar. Ecol. Prog. Ser. 219, 275–289. doi: 10.3354/meps219275
Swets J. A. (1988). Measuring the accuracy of diagnostic systems. Science 240, 1285–1293. doi: 10.1126/science.3287615
Szaro R. C., Dieter M. P., Heinz G. H., Ferrell J. F. (1978). Effects of chronic ingestion of south Louisiana crude oil on mallard ducklings. Environ. Res. 17, 426–436. doi: 10.1016/0013-9351(78)90046-4
Tasker M. L., Jones P. H., Dixon T., Blake B. F. (1984). Counting seabirds at sea from ships: a review of methods employed and a suggestion for a standardized approach. Auk 101, 567–577. doi: 10.1093/auk/101.3.567
van Proosdij A. S. J., Sosef M. S. M., Wieringa J. J., Raes N. (2016). Minimum required number of specimen records to develop accurate species distribution models. Ecography (Cop.) 39, 542–552. doi: 10.1111/ecog.01509
Weimerskirch H. (2007). Are seabirds foraging for unpredictable resources? Deep Sea Res. Part II Top. Stud. Oceanogr. 54 (3-4), 211–23. doi: 10.1016/j.dsr2.2006.11.013
Wiese F. K., Montevecchi W. A., Davoren G. K., Huettmann F., Diamond A. W., Linke J. (2001). Seabirds at risk around offshore oil platforms in the north-west Atlantic. Mar. Pollut. Bull. 42, 1285–1290. doi: 10.1016/S0025-326X(01)00096-0
Williams J. M., Tasker M. L., Carter I. C., Webb A. (1995). A method of assessing seabird vulnerability to surface pollutants. Ibis (Lond. 1859). 137, S147–S152. doi: 10.1111/j.1474-919X.1995.tb08435.x
Wilson R. R., Fournier A., Gleason J. S., Lyons J. E. (2019). Strategic bird monitoring guidelines for the northern gulf of Mexico (Mississippi State University, Starkville, Mississisppi, U.S.A.: Gulf of Mexico Avian Monitoring Network. Mississippi Agricultural and Forestry Extension Research Bulletin 1228), 129–69. https://www.mafes.msstate.edu/publications/bulletins/b1228.pdf
Winship A. J., Kinlan B. P., White T. P., Leirness J. B., Christensen J. (2018). Modeling at-sea density of marine birds to support Atlantic marine renewable energy planning: final report. OCS Study BOEM 2018-010 Sterling, Virginia, (U.S.A.: U.S. Department of the Interior, Bureau of Ocean Energy Management, Office of Renewable Energy Programs) 10, 67.
Wisz M. S., Hijmans R. J., Li J., Peterson A. T., Graham C. H., Guisan A., et al. (2008). Effects of sample size on the performance of species distribution models. Divers. Distrib. 14, 763–773. doi: 10.1111/j.1472-4642.2008.00482.x
Keywords: index, uncertainty, offshore energy, spatial risk assessment, habitat modelling, sensitivity, sub-tropical & tropical, oil and gas
Citation: Michael PE, Hixson KM, Haney JC, Satgé YG, Gleason JS and Jodice PGR (2022) Seabird vulnerability to oil: Exposure potential, sensitivity, and uncertainty in the northern Gulf of Mexico. Front. Mar. Sci. 9:880750. doi: 10.3389/fmars.2022.880750
Received: 21 February 2022; Accepted: 12 August 2022;
Published: 02 September 2022.
Edited by:
Vitor H. Paiva, University of Coimbra, PortugalReviewed by:
Nina Jayne O’Hanlon, British Trust for Ornithology, United KingdomJaime Albino Ramos, University of Coimbra, Portugal
Copyright © 2022 Michael, Hixson, Haney, Satgé, Gleason and Jodice. This is an open-access article distributed under the terms of the Creative Commons Attribution License (CC BY). The use, distribution or reproduction in other forums is permitted, provided the original author(s) and the copyright owner(s) are credited and that the original publication in this journal is cited, in accordance with accepted academic practice. No use, distribution or reproduction is permitted which does not comply with these terms.
*Correspondence: Pamela E. Michael, cGVtaWNoYUBnLmNsZW1zb24uZWR1