 Min Zhou1
 Cong Zeng
 Li-Hong Zhang
 Cheng-Xu Zhou
 Zhuo-Yi Zhu
95% of researchers rate our articles as excellent or good
Learn more about the work of our research integrity team to safeguard the quality of each article we publish.
Find out more
ORIGINAL RESEARCH article
Front. Mar. Sci. , 31 May 2022
Sec. Marine Biogeochemistry
Volume 9 - 2022 | https://doi.org/10.3389/fmars.2022.880120
How the microbial community response to carbon degradation is unclear, while it plays an essential role in predicting microbial community shift and determining carbon cycling. Surface sediments in two contrasting aquacultural tidal flat sites in Fujian Province, China, were collected in October, 2020. In addition to 16s rRNA gene high-throughput sequencing for determining bacteria and archaea biodiversity, an amino acids-based molecular degradation index DI was used to quantify the carbon degradation status. The results revealed that the microorganism response to DI at the family level was community competition. Specifically, the winning microbes that grew under carbon degradation (i.e., operational taxa unit numbers negatively related with the degradation index) accounted for only 18% of the total family number, but accounted for 54% of the total operational taxa unit numbers. Network analysis confirmed the oppressive relation between winners and the rest (losers + centrists), and further suggested the losers survival strategy as uniting the centrists. These findings shed new light on microorganism feedback to carbon degradation, and provide a scientific basis for the explanation of microbial community shift under progressive carbon degradation.
Microorganisms (bacteria and archaea) play an essential role in carbon cycling via organic carbon utilization, degradation, and remineralization. Without microorganisms, the degradation of synthesized carbon can barely occur at the current rate. While organic carbon (carbon, hereafter) degradation is the result of microbial activities, the feedback of microorganisms to carbon degradation is more complicated (Mou et al., 2008; Teeling et al., 2012). This is not just a microbiological question, it is also essential for a deeper understanding of the controlling factors of carbon degradation in the carbon cycle. When facing excess CO2 and global warming, understanding the driving force behind carbon degradation is important for addressing carbon sequestration.
Experimental metagenomic studies in coastal oceans have revealed a potentially large diversity of carbon-processing capabilities of heterotrophic microorganisms, indicating the ability of generalist bacteria to process heterogeneous carbon in composition and/or source (Mou et al., 2008). However, the significant responsive changes of the bacterial community during the process of water blooming and extinction suggest that the microbial community structure can undergo observable changes with changing carbon activity (Teeling et al., 2012). Additional evidence for the structuring of bacterial community composition by carbon comes from studies on lakes (e.g., Jones et al., 2009), estuaries (e.g., Figueroa et al., 2021), and soil (e.g., Ding et al., 2015). In sediments, bacterial assemblages have shown an association with total carbon and nitrogen content (Sienkiewicz et al., 2020), indicating a potential bacterial interaction with bulk carbon content. In addition, bacteria community changes were best explained by carbon remineralization rate based on soils samples from a wide range of ecosystems (Fierer et al., 2007). In incubation experiments based on either sedimentary carbon or sediment-derived dissolved carbon, the degraded carbon pool and bacterial community both underwent changes during incubation, indicating that an interaction between bacteria and carbon indeed exists and is likely dependent (Mahmoudi et al., 2017; Wu et al., 2018).
Previous work on microbial feedback to carbon degradation has focused on identifying changes in carbon composition and corresponding microbial community changes with time (Mahmoudi et al., 2017; Wu et al., 2018); however, the network and interactions among microbial groups alongside carbon degradation remains unclear. This interaction, together with previously studied carbon and microbial community compositions, help addressing the mechanism of the stepwise degradation of carbon driven by microorganisms, and reveal the driving force behind how certain fractions of carbon become a CO2 source, while the rest is stored in nature in a reduced form for a long period.
Amino acids (AAs) are a series of compounds that comprise the basis of proteins, found universally in life. Due to the different metabolic pathways and physiological functions among AAs, different AAs show different trends of change during microbial utilization and degradation of synthetic carbon, in which some are relatively lost while a few others are relatively accumulated (“relatively” here means the mole percentage in total AAs). Based on this feature, Dauwe and Middelburg proposed the amino acid-based degradation index (DI) to quantify the degree of organic matter degradation (Dauwe and Middelburg, 1998). DI is the result of a dimension reduction treatment after principal component analysis of AA results based on a range of samples. For fresh phytoplankton and bacteria, the DI is +1.5, and for oxic sediment it is -2.2 (Dauwe et al., 1999). This approach has been widely used in carbon cycling studies from low to high latitudes, especially in those focused on sedimentary and particulate carbon degradation quantifications (Dittmar and Kattner, 2003; Unger et al., 2013; Matiasek and Hernes, 2019; Wei et al., 2021).
Tidal flats are the area where terrestrial carbon meets marine carbon. Autochthonous carbon (detritus of wetland plants and fauna) forms an additional local source for tidal flats. Tidal flat sediment shows the highest sedimentary carbon accumulation (in g C/m2/yr) compared to other coastal wetland sediments (mangroves and seagrasses) or forested ecosystems (Ouyang and Lee, 2014), while the large fraction of sedimentary carbon in the top layer often acts as a carbon source to air CO2 due to the high aerobic microorganisms activity (Endo and Otani, 2019). In aquaculture settings, the presence of economically valuable species strongly alter the diversity and density of benthic fauna, constituting the primary aquaculture impact on sediment carbon. In addition, the daily management of aquaculture fields, as well as harvesting (digging or elutriation), enhances the disturbance of sediments and additional aerobic respiration. The farming of some species (e.g., Sinonovacula constricta) involves the use of the genus Miscanthus (a higher plant) in the tidal flats, hence introducing a significant terrestrial carbon source to the mudflat. As a result, microorganisms in shellfish cultivation flats are subjected to dynamic environmental factors and sources, and carbon degradation status and storage in such pools are facing corresponding uncertainty. With the exception of carbon composition (e.g., Freese et al., 2008) and bacteria studies (e.g., Wilms et al., 2006), combination or interaction studies between carbon degradation status and microorganisms in tidal flats remain scarce (Graue et al., 2012).
Along the coast south of the Aojiang Estuary in Fujian Province, China, shellfish cultivation occupies almost all of the available tidal flats. Sinonovacula constricta and Ruditapes philippinarum are the two local key cultivation species, with contrasting habitats and sedimentary impact. In this work, we are interested in the carbon degradation status (quantified as DI) - microorganisms interaction in the tidal flats, especially in the background of various aquaculture impact. Sampling occurred in October, about two months after bivalves harvesting. Two months after strong turbulence from either intensive benthic fauna or anthropogenic activities (harvesting), the response of microbial community to sedimentary carbon has time to stabilize (Mahmoudi et al., 2017), while the new round of culture (Laver) in the coming winter has not yet begun. Sediment carbon, key environmental factors, and microorganism (bacteria and archaea via 16s rRNA gene high-throughput sequencing) investigations were conducted in both shellfish cultivation flats. The environmental constraints on microorganisms were first determined, and then the interaction between DI and microorganisms via a network approach was investigated. Finally, the competition features of microorganism feedback to DI were proposed, and different carbon cycle feedbacks between S. constricta and R. philippinarum aquaculture were inferred from a microbial perspective.
The Aojiang River (58 m3/s discharge) is located in Lianjiang County, Fujian, China. Tidal flats are in the south of the Aojiang Estuary (Figure 1A). The nearshore water is very turbid (yellowish), and the semi-diurnal tides show a range of 3.8 m (China Oceanic Information Network, http://www.nmdis.org.cn). During low tide, vast flats of up to a few kilometers long emerge from the water.
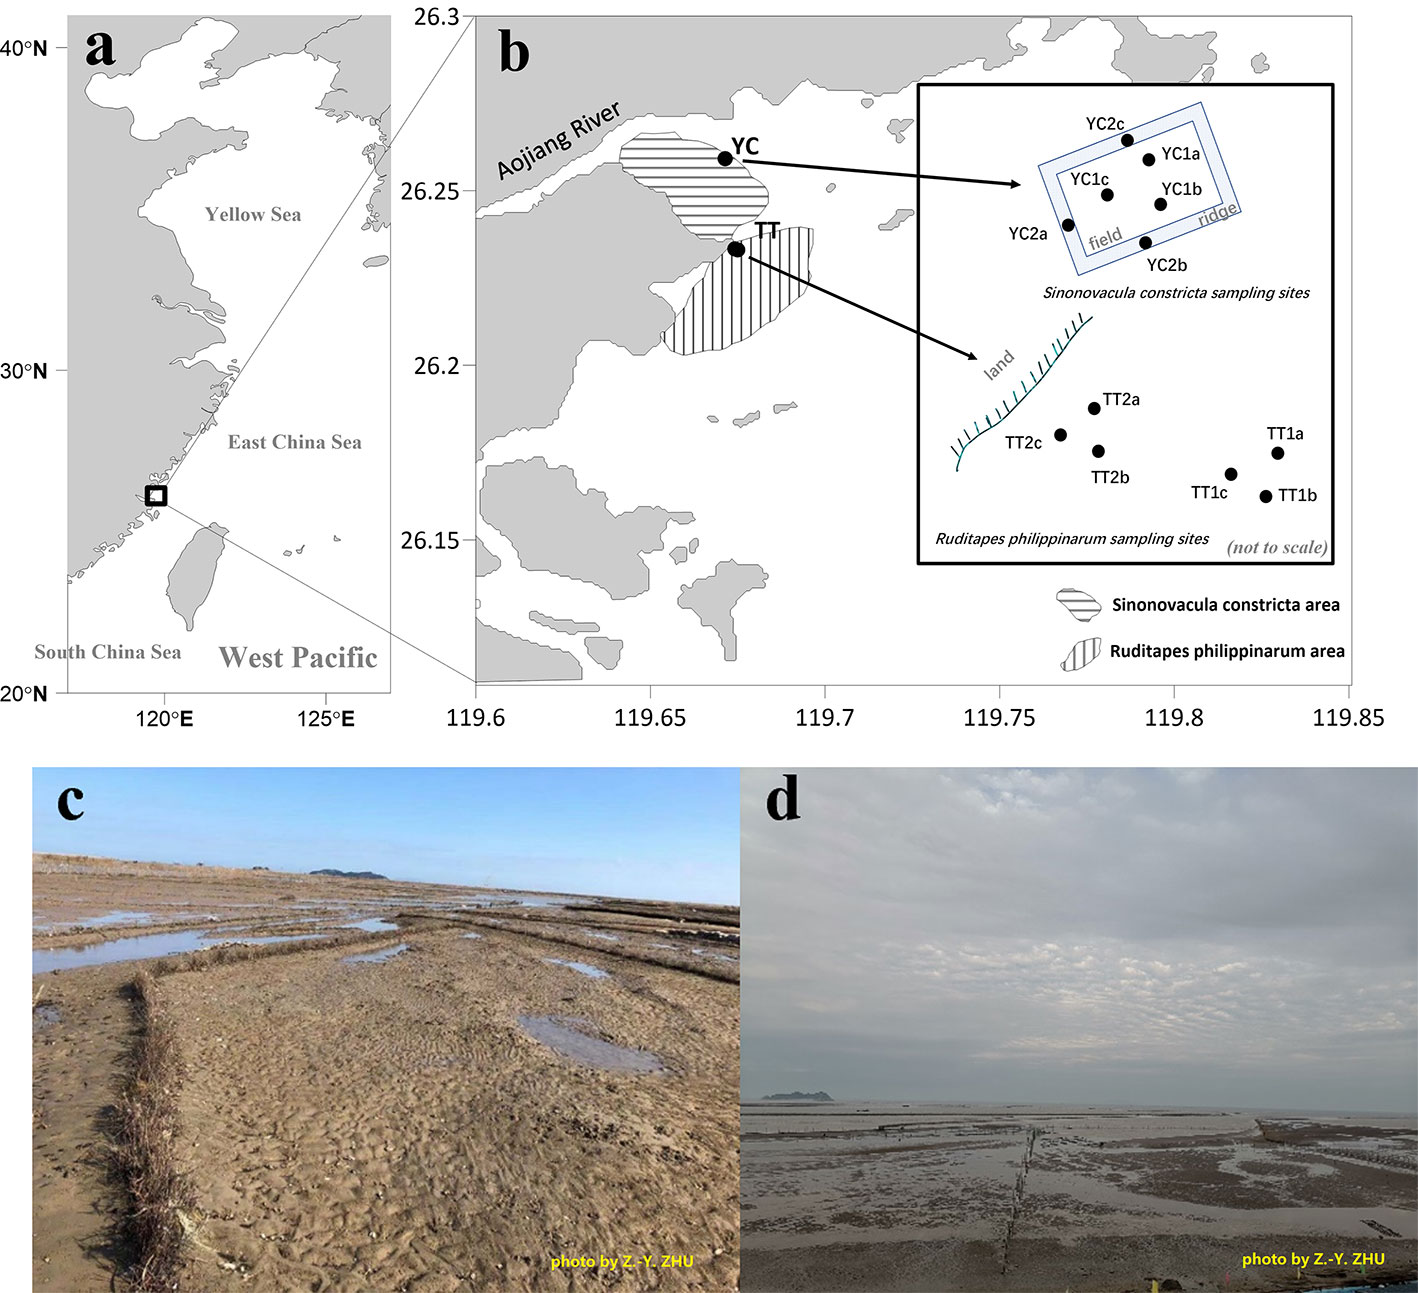
Figure 1 The study area (A) and the location where bivalves (Sinonovacula constricta and Ruditapes philippinarum) are raised (B–D). The insert in plot b shows the detailed sampling sites. In the text, TT1 and TT2 are referred to as seaward and landward samples of Ruditapes philippinarum sites, respectively, and YC1 and YC2 are referred to as field and ridge samples of Sinonovacula constricta sites. Plot c shows the Sinonovacula constricta sites during low tide and the ridges (about 30 cm in width) between fields are manually constructed and regularly maintained with Miscanthus. Plot d shows the Ruditapes philippinarum sites at a time between low tide and high tide. At Ruditapes philippinarum sites there are no ridges. Photo by Z-Y Zhu.
Sinonovacula constricta and R. philippinarum are the two species that are cultivated in the flats south of the Aojiang River mouth (Figures 1B–D). Sinonovacula constricta prefers finer sediments, digging 30–40 cm into the sediment, whereas R. philippinarum prefers coarser sediments, digging shallower (~10 cm). The S. constricta cultivation area is 705 hectares, with an annual production of 20,667 tons, while the R. philippinarum cultivation area is 525 hectares, with an annual production of 19,200 tons (Committee, O.O.L.L.C.C., 2017). Due to the bivalves vertical migration and harvesting, top 0−10 cm sediment were repeatedly under strong mixing or disturbance. Each year, larvae of both species are sowed in spring, and harvest occurs in late summer. For S. constricta, the cultivation area is manually maintained like a paddy field but without paddy plants. Sinonovacula constricta are cultivated in a field surrounded by a ridge (Figure 1C). The ridges are maintained by inserting Miscanthus plants into the surface sediment. Miscanthus are manually carried to the fields via tricycles and regularly re-supplied during low tide to maintain the ridge shape.
The bivalves feed themselves via burrows, which enhanced the vertical mixing of sedimentary materials. Due to the bivalves vertical migration and harvesting, top sediment (e.g., 0-10 cm) were repeatedly under strong mixing or disturbance. In the field, we saw “black soils” randomly distributed from very surface to the deep (~40cm deep), without any lamination structure. We repeatedly found this profile distribution feature in cultivating and non-cultivating seasons.
The external carbon added to the 0-10 cm top sediment is composed of sedimentation from overlaying water and from benthic algae production in the very surface of sediment. For the two months after harvest, these added carbon is estimated to account for a very trace proportion (2.7%) of the total carbon pool. Further given that the added carbon (and microbe) took place in the very surface of the sediment, the top 0-10 cm sediment after harvesting can be regarded as a close system. The detailed calculation process can be found in Supplemental Materials.
The S. constricta and the R. philippinarum are harvested in summer (late August early September) every year. Field sampling in this work was conducted in late October, 2020 (Figure 1B). For the S. constricta cultivation area (station YC), three subsamples were collected in the field where S. constricta was cultivated and another three subsamples were collected on the ridge (S. constricta-free). For the R. philippinarum area (station TT), two sites were chosen. One site was more seawards and the other more landwards. Again, three subsamples were collected for each site. Mixed surface sediment samples (0–10 cm deep) of the flats were collected using a clean spoon during low tide. Sediment samples were stored frozen until laboratory determination.
For carbon and its δ13C in the sediment samples, inorganic carbon was first removed by reaction with HCl vapor. The carbon content was then measured via an elemental analyzer (Vario EL III, Germany) using a high temperature catalytic oxidation method, while the δ13C of the carbon was measured using an isotope-ratio mass spectrometer (Deltaplus XP; Thermo Finnigan, USA) connected to a Flash EA 1112 analyzer (Zhu et al., 2016). For nitrogen, measurements were conducted following the same protocol as carbon, but without acidification.
For grain size measurements, the method described by Liu et al. (2019) was adopted. Briefly, organic matter and carbonates were first removed by adding 10 mL of H2O2 (10%) and 10 mL of HCl (10%) to the dried sediment (0.2 g). After 2 h the sample was filled with Milli-Q water and soaked overnight. The supernatant was then carefully removed and two drops of 5% sodium hexametaphosphate solution were added under ultrasonication for 10 min. Finally, the well-dispersed samples were measured using a laser particle size analyzer (LS13 320, Beckman Coulter, USA). The measurement error was < 3%.
To measure Cl-, , and concentrations in the dried sediments, the dried samples were passed through a 2-mm sieve to remove leaves, plant roots, and gravel. Approximately 6 g of dry sediment samples were mixed with 30 ml of distilled water (1:5 v:v). The mixture was stirred for 2 h. The supernatant was then filtrated using a 0.22-μm filter membrane after centrifuging at 2,000 × g for 10 min. The concentrations of Cl-, , and ions were determined using the Metrohm Advanced ion chromatography system (Metrohm AG, Switzerland).
For measurements of total hydrolyzable AA enantiomers and non-chiral glycine in the sediment, the method of Fitznar et al. (1999) was followed with slight modifications (Zhu et al., 2016). Briefly, ultra-pure HCl was added to freeze-dried sediment, which was then hydrolyzed at 110°C for 24 h. After pre-column derivatization via reaction with o-phthaldialdehyde and N-isobutyryl-L/D cysteine, samples were subjected to high-performance liquid chromatography (Agilent 1200, USA). Racemization during hydrolyzation was calibrated according to Kaiser and Benner (2005). Sample chromatogram peaks were compared with authentic standards for their elution time and peak area. The AA standards (including L- and D- form, 33 in total) were purchased from Sigma-Aldrich. The AA list, as well as the abbreviations, are shown in Table 1.
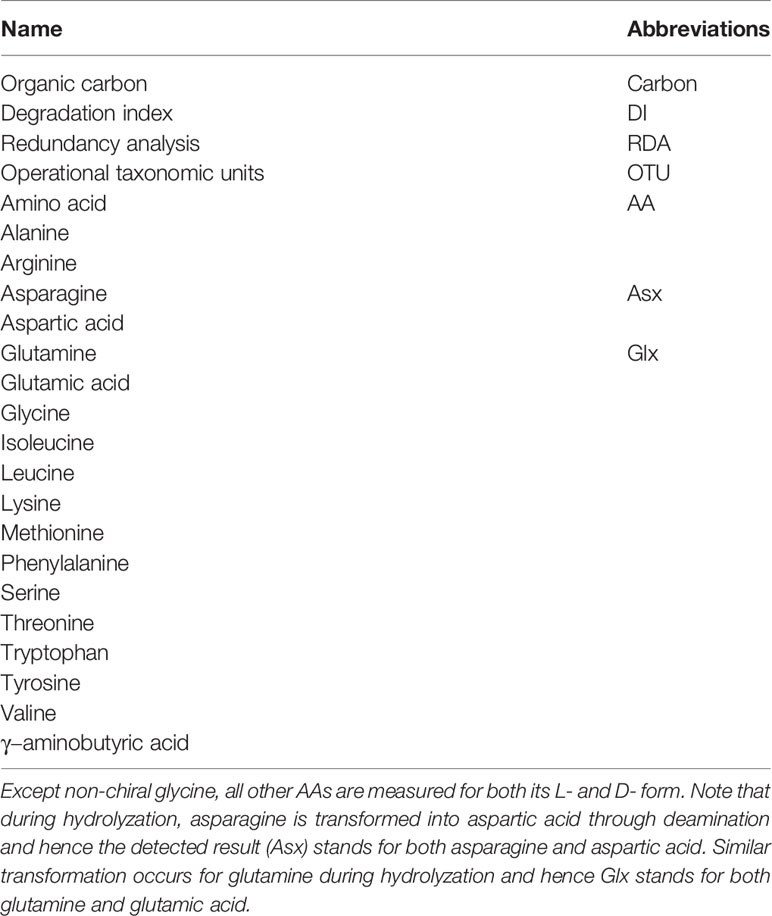
Table 1 The detected AAs list and key abbreviations used in this work.
The bacterial and archaeal populations were quantified by real-time quantitative PCR on the 7500 Real-Time PCR System (Applied Biosystems, Foster, CA, USA) and quantitative PCR were performed using primers to the 16S rRNA gene. The primer pair bac341F (5′-CCTACGGGWGGCWGCA-3′) and the prokaryotic 519R (5′-TTACCGCGGCKGCTG-3′) were used for bacteria, and Uni519F (5′-GCMGCCGCGGTAA-3′) and Arc908R (5′-CCCGCCAATTCCTTTAAGTT-3′) were used for archaea (Jorgensen et al., 2012). According to the manufacturer’s instructions for PowerUp™ SYBR™ Green Master Mix (Applied Biosystems, Foster City, CA, USA), a 20 μL reaction mixture contained 6.4 μL of nuclease-free water, 10 μL of PowerUp™ SYBR™ Green Master Mix, 0.8 μL of each primer, and 2 μL of DNA. Each reaction was conducted in triplicate. The quantitative PCR program for bacteria was 50°C for 2 min, 95°C for 5 min, and 35 cycles of 95°C for 15 s, 58°C for 30 s and 72°C for 30 s. For archaea, the program was 50°C for 2 min, 95°C for 5 min, followed by 40 cycles of 95°C for 30 s, 60°C for 30 s and 72°C for 45 s. Standards were provided by plasmids containing the target gene sequence with a 10-fold serial dilution. The r2 value for the standard curve was >0.99, and the amplification efficiencies were between 95% and 105%.
Total DNA was extracted from the 0.5 g sediment samples of each site by the FastDNA™ SPIN Kit for Soil (MP Biomedicals, USA) following the manufacturer’s instructions, and the extracted nucleic acids were subsequently stored and frozen at −20°C until the following experiments. The V4 region of bacterial 16S rRNA genes was amplified by polymerase chain reaction (PCR) with the primer pair 533F (5′-TGCCAGCAGCCGCGGTAA-3′) and Bac806R (5′-GGACTACCAGGGTATCTAATCCTGTT-3′), and the V4–V5 region of archaeal 16S rRNA genes was amplified with the primer pair Arc516F (5′-TGYCAGCCGCCGCGGTAAHACCVGC-3′) and Arc855R (5′-TCCCCCGCCAATTCCTTTAA-3′) (Klindworth et al., 2013). The 50 μL amplification mixture contained 1 μL of each forward and reverse primer, 1 μL of template DNA, 5 μL of 10 × Ex Taq buffer, 5 μL of 2.5 mM dNTP mix, 1 μL of Ex Taq polymerase (TAKARA, Tokyo, Japan) and 36 μL of ddH2O. The PCR conditions for archaeal 16S rRNA gene amplification were as follows: 94°C for 5 min, followed by 30 cycles at 94°C for 40 s, 60°C for 40 s, and 72°C for 40 s, and a final extension at 72°C for 10 min. For bacteria, the PCR conditions were 94°C for 5 min, 25 cycles of 40 s at 94°C, 40 s at 54°C, and 30 s at 72°C; and a final extension for 10 min at 72°C. The PCR products were purified with an E.Z.N.A. Gel Extraction Kit (Omega Bio-Tek, Norcross, GA, USA). The 16S rRNA gene amplicons containing the unique barcodes used for each sample were pooled at equal concentrations and sequenced on an Illumina MiSeq platform using 2 × 250-bp cycles at Shanghai Personal Biotechnology Co., Ltd. (Shanghai, China). The raw sequence reads from all the samples were imported to QIIME2 (Bolyen et al., 2019) for quality control and taxonomic identification. First, the corresponding region sequences from the SILVA database (version 138) (Glöckner et al., 2017) were extracted according to the primers used, and the sequences were then used to train the classifier. Second, chimeric sequences obtained during the PCR process were removed using “qiime2-vsearch”. The taxonomy of the obtained cluster was determined by the classifier. We used command “taxa filter-table” of QIIME 2 to filter OTUs not belonging to archaea or bacteria when processing bacteria or archaea, respectively.
The DI was calculated by the following equation (Dauwe et al., 1999):
where vari, AVG vari, STD vari, and fac.coef.i are the mol%, mean, standard deviation, and factor score coefficient of AAi, respectively. Factor score coefficients were calculated using principal component analysis.
For the Shannon index, 2 was the log base, and for the Simpson index, the equation is where pi is the proportion of the community represented by OTUi. For the biological and environmental data, a redundancy analysis (db-RDA) was conducted via PRIMER 7. In the PRIMER settings, the distance method is Bray-Curtis similarity, selection criterion is adjusted R2 and selection procedure is step-wise.
The network analysis was conducted via molecular ecological network analysis pipeline (Deng et al., 2012). The network analysis followed the default settings and the RMT threshold was set as 0.95 (p = 0.001, r2 = 0.5). The visualization of the network analysis results was further performed by Cytoscape (Shannon et al., 2003).
Mean grain size in S. constricta sites (field + ridge) and R. philippinarum sites (landwards + seawards) was 46.5 ± 15 μm and 146 ± 37 μm, respectively. Within the S. constricta sites, field sediment was finer (YC1, 35 ± 1 μm) compared to that from the ridge (YC2, 58 ± 13 μm) (Table 2). Within the R. philippinarum sites, larger grain size sediment was found in landward samples (TT2, 174 ± 34 μm) relative to seaward samples (TT1, 119 ± 8 μm) (Table 2). This was consistent with the grain size preference of S. constricta (silt) and R. philippinarum (sand), respectively. For sedimentary Cl- and , a seaward increase was recorded, namely elevated values were found in samples from seawards sites [TT1, (Cl-) = 208 ± 12 mmol/kg, () = 11 ± 0.4 mmol/kg] compared to landwards sites (TT2, (Cl-) = 160 ± 11 mmol/kg, [] = 9 ± 0.7 mmol/kg); however, there were no such significant differences found between the S. constricta field and ridge (Table 2). For sedimentary , the highest values were observed in the S. constricta field (YC1, 0.48 to 1.0 mmol/kg), with the rest of the samples (YC2, TT1, and TT2) ranging between 0.33 and 0.45 mmol/kg. Statistically, sedimentary Cl-, , and showed no clear difference between S. constricta and R. philippinarum sites, but there was a significant difference in grain size.
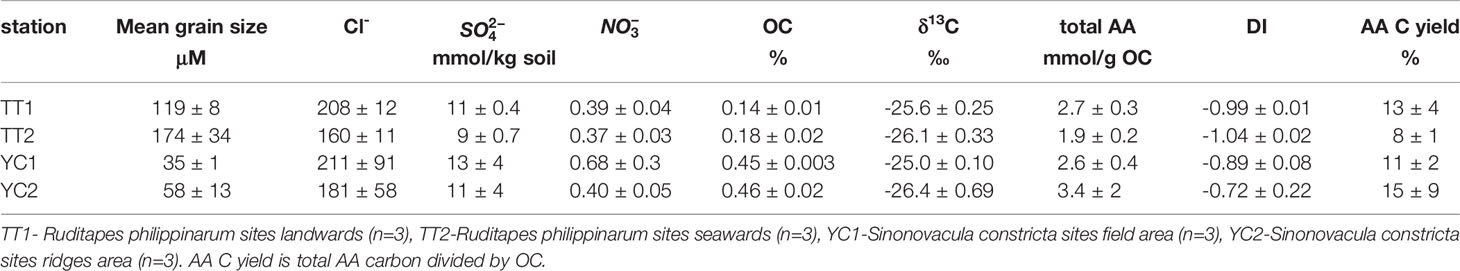
Table 2 Environmental parameters and organic carbon results for the tidal flats organic matter in this study.
Regarding bulk carbon, S. constricta sites showed a higher carbon content relative to R. philippinarum sites (i.e., 0.46% ± 0.02% vs. 0.16% ± 0.02%). Within each site, there was no clear difference in carbon content between the field and ridge, or between landwards and seawards sites (Table 2). The lowest δ13C (-27.22‰) was recorded in the ridges (Table 2).
Sedimentary total AAs ranged from 1.8 mmol/g OC to 5.6 mmol/g OC (OC: organic carbon). Samples from R. philippinarum landward sites (TT2) showed the lowest AAs (1.9 ± 0.2 mmol/g OC) and samples from S. constricta field ridges (YC2) showed the highest values (3.4 ± 2 mmol/g OC) (Table 2). Glycine, the non-chiral and most simple AA compound, was the most abundant (mean 1.2 mmol/g OC), followed by L-glutamic acid (0.19 mmol/g OC) and L-aspartic acid (mean 0.18 mmol/g OC). Regarding D-AAs, which are usually related to microorganism activities, D-arginine and D-aspartic acid were the two most abundant, with mean concentration as high as 22 μmol/g OC and 20 μmol/g OC, respectively. Correspondingly, the D/L ratio of arginine (D/L arg; mean 0.33) and D/L ratio of aspartic acid (D/L asp; mean 0.12) was the highest among chiral AAs. D/L ratios of key AAs in samples from S. constricta sites were higher (arginine, serine, and aspartic acid) or similar (threonine and alanine) when compared to samples from R. philippinarum sites. Within S. constricta sites, the field samples showed higher D/L ratios compared to the ridge samples, and within the R. philippinarum sites, a seawards decrease of D/L ratio was observed (namely D/L landwards sites > D/L seawards sites). The D/L ratio patterns were similar to those of the quantitative PCR results for bacteria and archaea. Namely, bacteria and archaea showed the highest abundance in S. constricta field samples (1.8 × 10⁹ copies/g wet weight [ww] and 1.0 × 10⁸ copies/g ww, respectively), followed by S. constricta ridge samples and R. philippinarum landwards site; the R. philippinarum seawards sites had the lowest bacteria (9.5×10⁸ copies/g ww) and archaea (4.6 × 10⁷ copies/g ww) abundances.
The mean DI of all 12 sediment samples was -0.91. The DIs of samples from R. philippinarum sites were commonly lower compared to those of S. constricta sites, and the lowest DI was found in R. philippinarum landwards sites (-1.06, TT2a). The highest DI (-0.47) was recorded on the ridge (YC2b), but overall DI within the S. constricta field and ridges was comparable (Table 2).
Statistically, carbon parameters (DI, δ13C) were significantly different between R. philippinarum sites and S. constricta sites, but AA composition did not significantly differ.
The microbial (bacteria and archaea) abundance obtained by quantitative PCR (copies/g ww) was significantly different between R. philippinarum sites and S. constricta sites (p = 0.002) (Figure S1). The bacterial and archaeal biodiversity quantified by 16s rRNA gene high-throughput sequencing also had significant difference between R. philippinarum sites and S. constricta sites, respectively (Figure S2).
Taxonomic assignment suggested that family Thermoanaerobaculaceae was the major bacterial group in S. constricta sites, followed by Desulfobulbaceae and Desulfobacteraceae; Similarly, the bacterial community of R. philippinarum sites, was also dominated by Thermoanaerobaculaceae, followed by NB1-j, Wosesiaceae and Microtrichaceae (Figure 2A). There was a clear difference between R. philippinarum sites and S. constricta sites as revealed by hierarchical clustering analysis (Figure 3A).
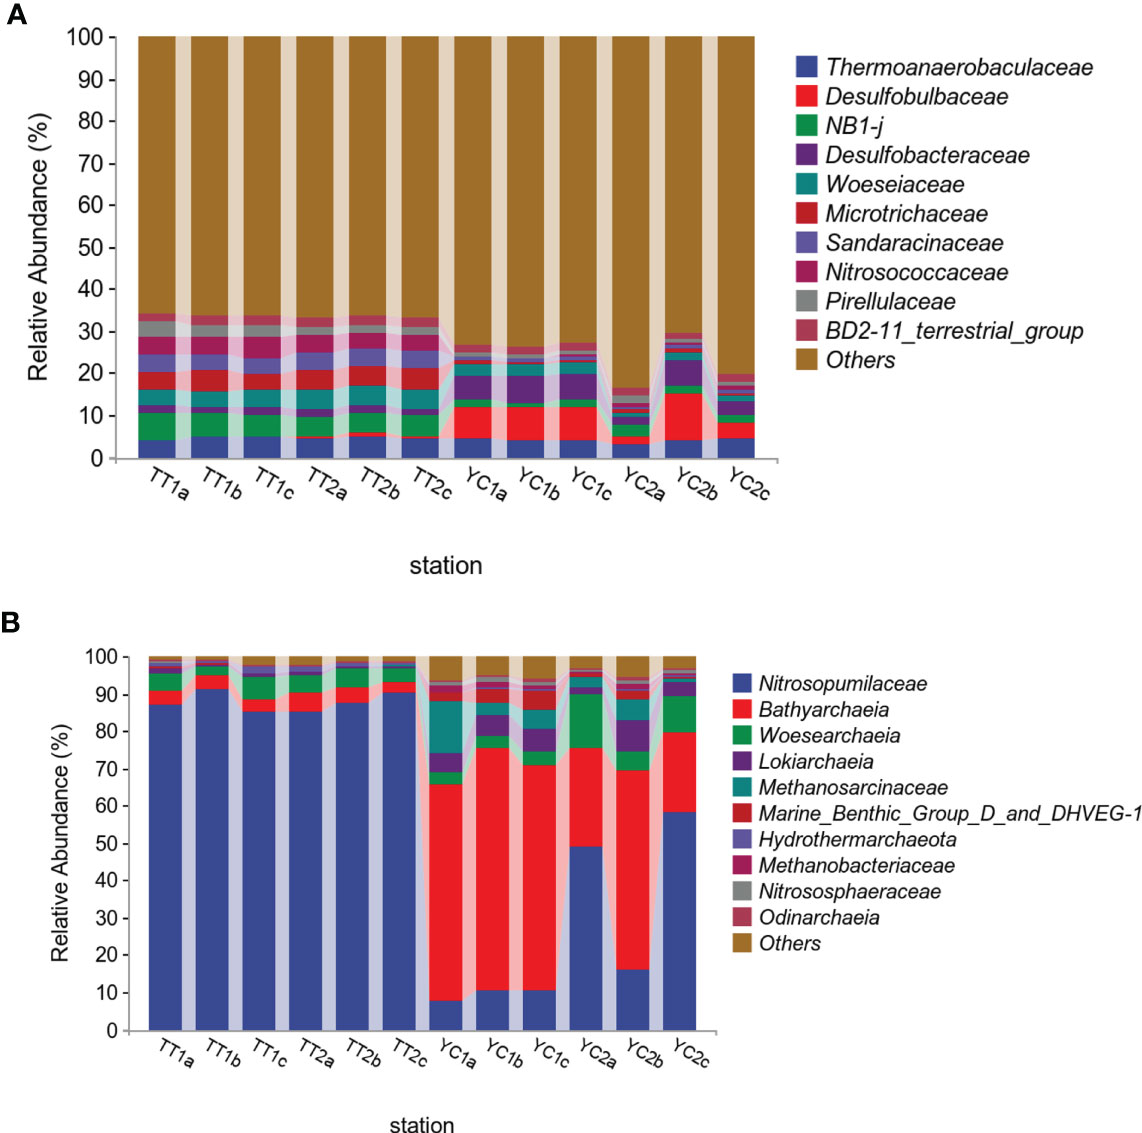
Figure 2 The bacteria (A) and archaea (B) assemblage composition on family level, threshold for showing the family names is top 10% in OTUs. Photo by Z-Y Zhu.
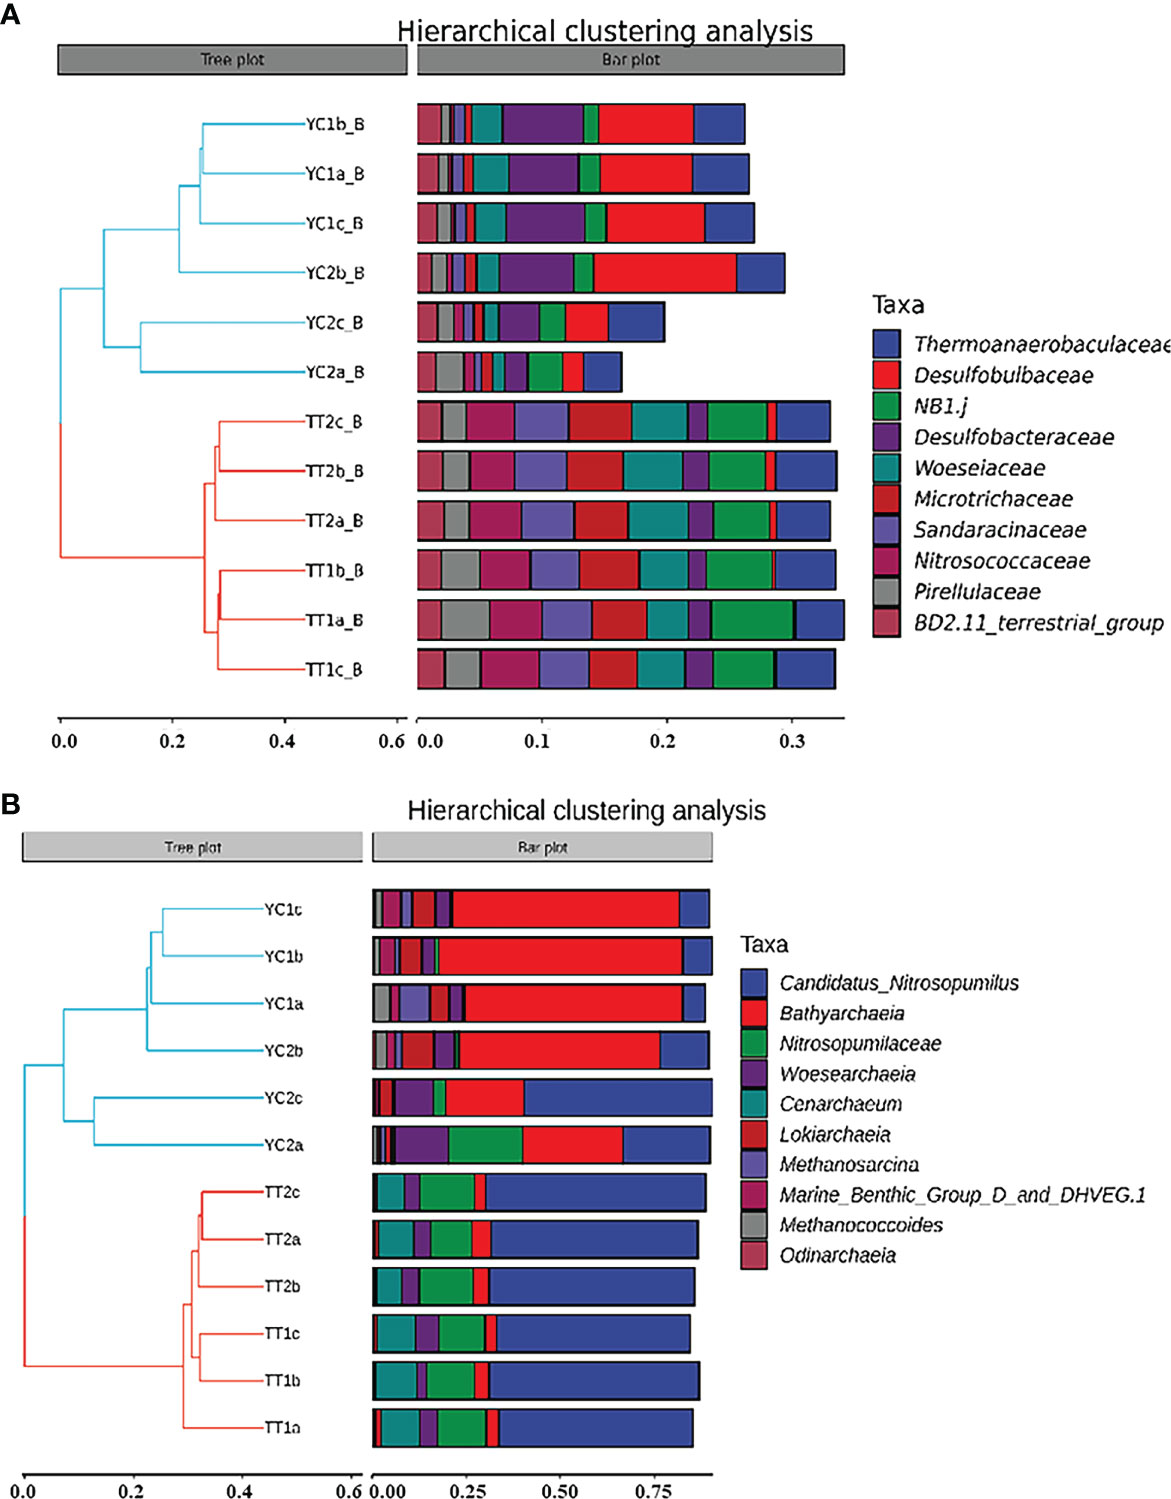
Figure 3 Hierarchical clustering analysis of (A) bacteria and (B) archaea on family level in this study. Photo by Z-Y Zhu.
For archaeal fraction, family Nitrososphaeria was the most abundant archaeal group in R. philippinarum sites, followed by Bathyarchaeia and Woesearchaeia. The top two most abundant communities belonged to Bathyarchaeia and Nitrososphaeria, followed by Woesearchaeia, Methanosarcinaceae and Lokiarchaeia (Figure 3B). Bathyarchaeia were very abundant in samples from S. constricta sites, but showed a much lower abundance in R. philippinarum sites (Figure 2B). Similarly, a clear assemblage difference was observed between the R. philippinarum and S. constricta sites based on hierarchical clustering analysis (Figure 3B).
The db-RDA was applied to archaea and bacteria, and yielded a good r2 (both r2 > 0.8 for archaea and bacteria; Figure 4). For bacteria, DI and explained 38% and 15% of the variation, respectively (Figure 4A). For archaea, DI explained 42%, and 22% of the variation (Figure 4B). Both archaea and bacteria are primarily constrained by DI and . Instead, the carbon source as quantified via δ13C was not the key influencing factor (Figure 4).

Figure 4 The db-RDA analysis of bacteria (A) and archaea (B) in this study. Photo by Z-Y Zhu.
At family level, the relation between OTUs and DI is shown in Figure 5. For bacteria, 22 out of 350 families showed a negative relationship with DI (i.e., the OTU was negatively related to DI), with a subtotal OTU reading of 270,636 in comparison to a total bacterial OTU reading of 541,048. That is, 22% of bacteria families occupied 50% of the total OTU readings (Figure 5A). The remaining 78% families contributed to the rest 50% of OTUs (Figure 5A), and their OTUs were either positively related to DI or showed no relationship with DI (Figure 5A). With respect to archaea, the unbalanced composition was even more pronounced (Figure 5B). Namely, only two out of 85 families showed a logical OTU relationship with DI, which accounted for 57% of OTUs (Figure 5B). The top two families of archaea were Nitrosopumilaceae (OTU = 329001) and an unidentified family of Desulfurococcales (OTU = 644).
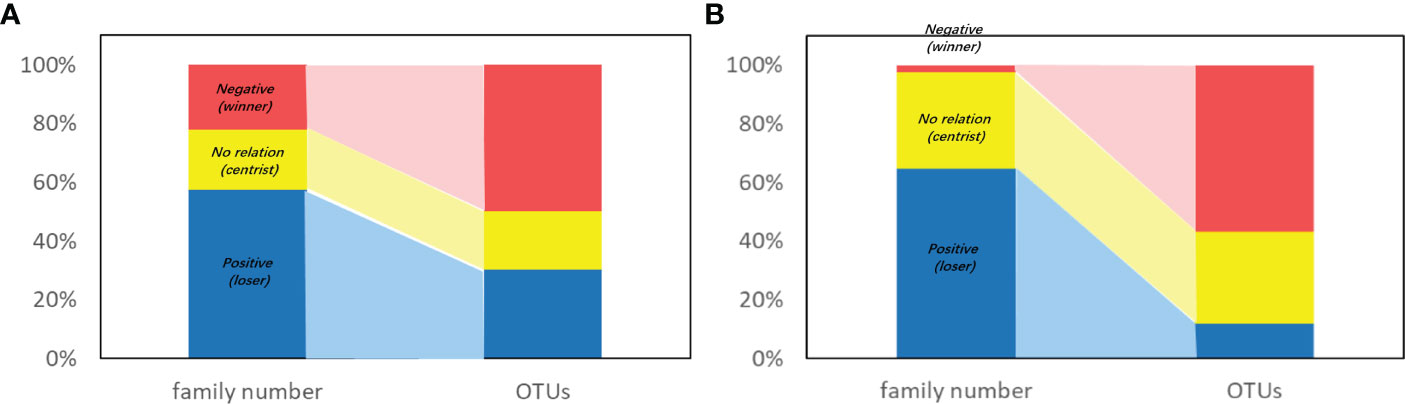
Figure 5 Percentage of family and corresponding OTUs of (A) bacteria and (B) archaea viewed with relation with DI. Color indicates the relation between OTUs and DI: Red-negative, yellow-positive, blue-no relation. Note that OTU<100 is not considered here to avoid fake relations due to too less data. Photo by Z-Y Zhu.
Network analysis result is shown as Figure 6. Edges in the network (lines that connect nodes) indicate the statistical relationship between two given nodes. They can be negative (np; brown in color) or positive (pp; cyan in color) (Figure 6). A first look at the network is complicated (Figure 6A). Given that carbon degradation is the result of microorganism utilization, and by this utilization microorganisms grow and reproduce, an increase in microorganism biomass should be logically accompanied with advanced carbon degradation. Therefore, microorganism that showed negative relation with DI is termed as winner in the network analysis. On the opposite, microorganism that showed positive relation with DI is termed as loser, and microorganism that showed no relation with DI is termed as centrist. Accordingly, the nodes in the network analysis were further grouped into red (winner), yellow (loser), and blue (centrist) according to their relation with DI (Table 3, Figure 6B). The negative edges (brown lines) were the dominant connections for winner external relations in the network (Figure 6B). But the highest positive versus negative edge ratio was observed for loser external relations (513 pp vs. 356 np; pp-positive edge, np-negative edge; Table 3). That is, the ratio (513/356) is higher when compared to that of centrist and winner (457/425 and 247/717, respectively; Table 3).
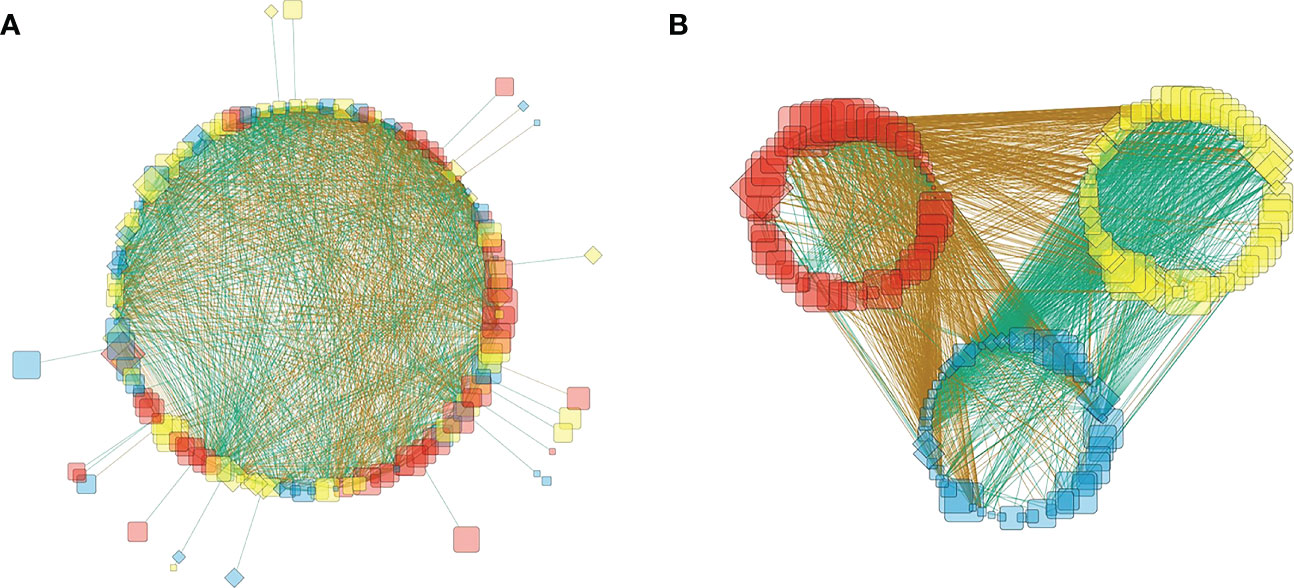
Figure 6 Network analysis of bacteria together with archaea on the family level in the form of (A) circled layout and (B) grouped layout (B). Every node represents a family of either bacteria (diamond) or archaea (round rectangle). The node size is proportional to its OTU readings. Nodes are marked as red, yellow and blue, which means the winner, loser and centrist in this work. Brown edges (lines between nodes) means the connected two nodes are negatively related to each other and cyan edges means the two nodes are positively related. Photo by Z-Y Zhu.
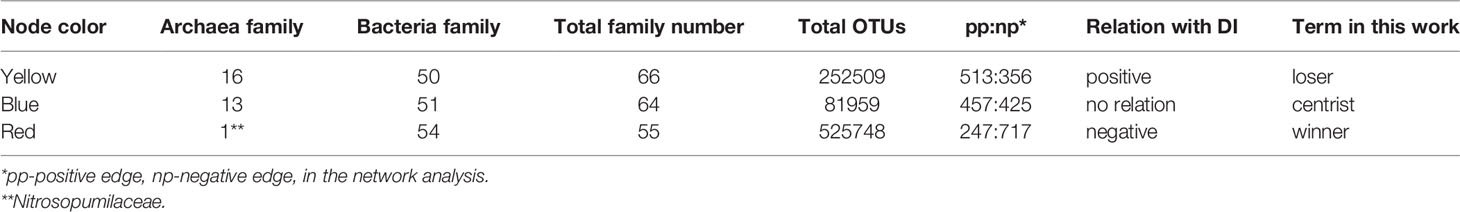
Table 3 The classification of microorganisms in the network analysis as grouped by relation with DI on family level.
AAs belong to the labile pool in bulk carbon, and their individual synthetic and metabolic pathways differ. Physiologically, some AAs (e.g., the simple-structured glycine) are at the base level (being the substrate) in many synthesis pathways while other AAs (e.g., the complex-structured phenylalanine) are the target product of several synthesis steps. In addition, individual AAs have varying associations with the cell wall or cytoplasm, or play different roles in embedding into structural matrices (Cowie and Hedges, 1996). As a result, during microorganism utilization and carbon degradation, certain AAs tend to accumulate (increase in mol%), whereas others tend to be lost (decrease in mol%) (Cowie and Hedges, 1992). Based on such varying accumulation/removal patterns, the AA-based molecular indicator, DI, is a statistical term that quantifies the carbon degradation degree based on individual AA mol% changes (Dauwe and Middelburg, 1998). It is much more specific to carbon degradation status relative to OC%, and has been widely applied in carbon degradation studies (Amon et al., 2001; Arnarson and Keil, 2001; Dittmar and Kattner, 2003; Amelung et al., 2008; Davis et al., 2009; Peter et al., 2012). AAs show a similar mol% distribution pattern among various organisms ranging from bacteria/fungi to plankton and vascular plant tissues (Cowie and Hedges, 1992). Fresh live matter, including bacteria, shows a DI value close to +1.5, while that of heavily degraded sedimentary carbon can be as low as -2.2 (Dauwe and Middelburg, 1998). Such feature means that DI is a good biomarker for quantifying carbon degradation status in marine organic biogeochemistry studies.
Bacteria biomass interference to bulk carbon is assessed via D-alanine concentration, assuming that all D-alanine is dominantly contributed by bacteria due to its key role in peptidoglycan construction. Using a conversion factor of 108 nmol/mg bacterial carbon (Kaiser and Benner, 2008), the fraction of bacterial carbon to bulk carbon in the tidal flats ranged from 7% to 15%, with a mean value of 10%. Therefore, bacterial carbon is one order of magnitude lower relative to bulk carbon. Given the additional D-AA sources in higher plants (Strauch et al., 2015), and algae (Yokoyama et al., 2003), the above estimated bacterial carbon fraction in bulk carbon would be even smaller. Furthermore, D-AAs have been detected in some archaea (Nagata, 1999), but their interference with bacteria carbon estimations, as well as the determination of archaea carbon contribution to bulk carbon, has not been assessed due to lack of a conversion factor.
The db-RDA analysis suggests that carbon degradation and related nitrogen cycling (e.g., ammonia-oxidation) are the dominant two processes that microorganisms were responding (Figure 4). It is not surprise to see the bacteria (Figure 2A) are related to carbon cycling as many of the bacteria are heterotrophic or related to carbon degradation. For example, thermoanaerobaculaceae prefer sugar, organic acids, and protein-like materials (Dedysh et al., 2021). Woeseiaceae are widely involved in the cycling of detrital proteins in marine benthic environments (Hoffmann et al., 2020). Sandaracinaceae may be related to utilization of ethanol and fatty acids (Probandt et al., 2017) and actinomarinales are usually characterized by their utilization of AAs as a carbon source (López-Pérez et al., 2020).
As nitrogen cycling process, the most abundant archaea, Nitrosopumilaceae, is related to nitrogen cycling (Figure 2B). Candidatus Nitrosopumilus were the most abundant archaea at the species level; these archaea are chemolithoautotrophic and grow by aerobic ammonia oxidation (Qin et al., 2016). The strong negative relation between Nitrosopumilaceae OTUs and DI (Table 3) indicates that the ammonia oxidizing archaea benefits from the carbon degradation. The source of ammonia in the sediment remains unknown in the present study, but the degradation of organic matter is a credible source, in which organic nitrogen is decomposed as the corresponding inorganic form ammonia.
The second most abundant archaea, Bathyarchaeia, are directly related to the carbon cycle. They are capable of utilizing a variety of organic carbon from labile to refractory sources (Zhou et al., 2018a), and some Bathyarchaeia are well-known for their growth being stimulated by lignin, a series of refractory and aromatic polymer compounds in higher plants, and such stimulation for growth is even higher compared to protein source stimulation (Yu et al., 2018). This is consistent with the extensive use of higher plant Miscanthus in S. constricta sites (Figure 1C).
Both uneven distribution between family numbers and OTUs (Figure 5) and contrasting external connections between winner, loser and centrist (Figure 6B) suggest severe competition among microbes during carbon utilization. On one hand, it is not surprising to see negative edges between winner and loser groups (Figure 6B) since these two groups had an opposite relationship with DI, but the edges between winner and centrist were also negative, with very few exceptions (Figure 6B). This means that the winner microorganisms that contributed to and reproduced under carbon degradation were overall suppressing both the losers (yellow nodes) and the centrists (blue nodes). On the other hand, the highest pp/np ratio for losers (Table 3) is achieved by establishing positive connections with centrists, which suggests the loser’s survival strategy: uniting centrists.
Regarding how microorganisms respond to changing organic matter, there are two hypotheses. The first one is the taxon-level accessibility model. This suggests that different microorganism populations specialize in the metabolism of certain carbon pools, and hence changes in carbon degradation status would be accompanied with observable changes in microorganism community structure (e.g., Teeling et al., 2012). The second is the cellular-level accessibility model. This suggests that cellular level processes are more important in dealing with variable carbon and hence microorganisms can process multiple carbon pools as needed, thereby observable microbial community changes can hardly be found with changing carbon degradation status on a short time scale (e.g., Mou et al., 2008). Although the microbial composition remained unchanged in the beginning of sedimentary carbon incubations, at a later stage (incubation 4–8 days), as the pool of available organic matter became more recalcitrant, an increasing abundance of bacterial taxa that were able to produce the enzymatic machinery for processing complex biopolymers was observed, supporting the taxon-level accessibility model (Mahmoudi et al., 2017). In sediment-derived dissolved carbon incubations, the microbial community in the early stages of incubation was influenced by relatively labile tannin- and protein-like compounds; while in later stages the community composition evolved to be most correlated with less labile lipid- and lignin-like compounds (Wu et al., 2018).
These previous findings (Mahmoudi et al., 2017; Wu et al., 2018) support the notion of competition being the feedback to carbon degradation status (Figures 5, 6). Two months after harvesting, the microorganism and labile carbon degradation coupling was expected to be closer to the steady state, rather than still at a unsteady or initial stage. In our work, the microorganisms showing a negative relationship with DI (red nodes; Figure 6) are the key implementors and hence beneficiaries of carbon degradation (winner). The winner gained the most energy and substrates from the degradation of carbon, which thereby placed them at an advantage in the competition of the entire microbial community. In contrast, the negative or poor performers in carbon degradation process (yellow and blue nodes) failed to gain maximum resources from carbon degradation and hence were at a competitive disadvantage in the community (Figure 6; Table 3). Within the winners (red nodes), it is expected that the most abundant archaea, Nitrosopumilaceae, occupy a unique niche, namely oxidization of carbon degradation products, which enables them to benefit from the carbon degradation process (Figure 2).
Most bacteria in the flats were also identified in previous incubation studies, so a comparison with previous work is at work. Variovorax, Methylotenera, Sphingomonas, and Rhodopseudomonas (specie level) were all identified in tidal flats (present study) and previous sediment-derived carbon incubations (Wu et al., 2018). However, these bacteria showed an increased abundance with advanced carbon degradation in previous incubations (Wu et al., 2018), whereas in tidal flats they either showed no relationship or a decrease abundance with advanced carbon degradation. In other words, these bacteria were winner in previous studies but became centrist or loser in current work. A similar discrepancy also occurred regarding Bacillales and Paenibacillaceae when comparing the findings of tidal flats results (present study) and previous sedimentary carbon degradation incubations (Mahmoudi et al., 2017). One possible explanation is that the chemical and biological habitats differed and hence so did the given bacteria performance. However, the varying performance of the same family or specie during carbon degradation process in different environments also implies that the microbial community structure under a certain carbon degradation situation is the specific outcome of that given competition, and there is no specific family or genus that can always beat others in the competition. If this assumption is correct, it is expected that the opportunity for a structure and network shift lies in changing external conditions (e.g., addition of new carbon sources), which creates another round of competition, while it is interesting to check the performance of microorganisms that occupy a unique niche in the competition, like Nitrosopumilaceae in this work.
Tidal flats of S. constricta sites stored carbon in a higher efficiency than R. philippinarum sites due to the higher carbon content (Table 2). However, from a carbon degradation perspective, S. constricta sites showed higher carbon degradation potential (higher DI values), whereas carbon in R. philippinarum sites were likely to lose less due to a more advanced degradation status (smaller DI values) (Table 2).
In microbial ecology, the bacteria competition strategy has been previously addressed following macroecology theory (Andrews et al., 1986; Klappenbach et al., 2000), namely that microorganisms can be regarded as r-strategists (copiotrophs) and K-strategists (oligotrophs). Oligotrophs have low growth rates and high resource use efficiency, and hence are characterized by an ability to grow under low substrate concentrations, whereas copiotrophs are the opposite, with higher growth rates and lower resource use efficiency. For young/disturbed ecosystems, the K/r ratio tends to be lower compared to mature/undisturbed ecosystems (Odum, 1969; Odum, 1985). It is indicated that Acidobacteria and Actinobacteria behave as K-strategists, whereas Proteobacteria and Bacteoidetes are r-strategists, based on their contrasting relationship between carbon mineralization rate and bacteria biomass (Fierer et al., 2007). Previous research has shown that the tracking of microorganisms at finer phylogenetic and taxonomic resolutions (e.g., family level or lower) is needed (Ho et al., 2017), but such classification remains lacking at present. Regarding phylum level, the K/r ratio for S. constricta sites and R. philippinarum sites was 0.27 ± 0.04 and 0.48 ± 0.03, respectively. Such a K/r ratio pattern indicates that microbial ecosystem of the S. constricta sites was younger and more disturbed, whereas that of R. philippinarum sites was more mature and less disturbed. In a forest ecosystem, the microbial system changes from a K-dominated to a r-dominated community stimulates carbon degradation (Zhou et al., 2018b), and if this is extrapolated to the tidal flat system, this would mean that S. constricta sites experience higher carbon degradation rates (and hence result in greater CO2 release to the atmosphere) compared to R. philippinarum sites. This is in agreement with the carbon degradation potential derived from DI (Table 2). It should be noted that the overall net CO2 release assessment in the respective aquacultural tidal flat sites requires additional direct CO2 gas measurements and sediment-water interface dissolved carbon flux observations.
Tidal flat aquaculture is an important form of natural tidal flat land utilization, and constitutes the most direct anthropogenic impact to this habitat. Studies on carbon-microorganism interactions in aquacultural tidal flats not only provide a scientific basis for the evaluation of the environmental impacts of aquaculture activities, but also provide an opportunity to explore the response and feedback of microorganisms to carbon.
Aquaculture activities have a significant impact on tidal flat carbon. For example, a much lower δ13C and a higher C/N ratio was observed in S. constricta site ridges compared to the other tidal flat sampling sites, indicating a significant terrestrial carbon source. This coincides with the utilization of Miscanthus. In this study, an amino-acid-based molecular indicator, DI, was used to quantify carbon degradation and an RDA analysis suggested that, while microorganisms were clustered into two groups based on S. constricta and R. philippinarum sites, DI and explained 80% of variations for both bacteria and archaea.
Our results suggest that the response of microorganisms to carbon degradation is community competition. Specifically, the microbes that grow under advanced carbon degradation (i.e., OTU numbers negatively related with DI) accounted for only 18% of the total family number but accounted for 54% of the total OTU numbers. Network analysis further revealed their suppressing (negative) relationship with other bacteria and archaea. Regarding the bacteria and archaea at a competitive disadvantage (losers), interestingly, the highest positive to negative edge ratio was observed, most of which was established between losers and centrist, suggesting the losers survival strategy of uniting centrist. Comparison with previous research further indicates that there seems no ever-victorious player at least on family level, and the observed bacterial community structure should be the outcome of that specific carbon-degradation-caused competition.
From both biogeochemical and microbial perspective, carbon in S. constricta sites had a higher degradation potential and hence may release more CO2, relative to R. philippinarum sites. More direct gas or liquid phase carbon-related parameters and observations in other seasons are needed to yield a more comprehensive CO2 release rate conclusion in order to assess the impact of aquaculture on the tidal flat carbon cycle.
The data of 16s rRNA gene raw sequence reads be downloaded in https://www.biosino.org/node/, ID of data is OER248290. The rest data is provided in the main text, or in the supplemental materials
MZ wrote the draft; F-TF participate the field sampling and laboratory measurement and analyzed the data; CZ discussed the microbial data and participated the manuscript writing; L-HZ conducted the laboratory measurement and part of manuscript discussion; C-XZ participated the field work and participated the manuscript discussion; Z-YZ funded the work, composed the idea, participated the field sampling and revised the manuscript. All authors contributed to the article and approved the submitted version.
This work is supported by the National Key Research and Development Program of China (2018YFD0900702), and by the National Natural Science Foundation of China (41976042 and 91951117).
The authors declare that the research was conducted in the absence of any commercial or financial relationships that could be construed as a potential conflict of interest.
All claims expressed in this article are solely those of the authors and do not necessarily represent those of their affiliated organizations, or those of the publisher, the editors and the reviewers. Any product that may be evaluated in this article, or claim that may be made by its manufacturer, is not guaranteed or endorsed by the publisher.
We are grateful to colleagues and students from Ningbo University, as well as Mr. Deng-Fu Chen from Baisheng Village, for their/his fieldwork assistance. The measurement of the sedimentary anion was conducted by Mr. Chen Tian in SOO/SJTU. We thank Na Yang in SOO/SJTU for her help in revising the microbe results. We are grateful to the anonymous reviewers whose comments improved the original manuscript.
The Supplementary Material for this article can be found online at: https://www.frontiersin.org/articles/10.3389/fmars.2022.880120/full#supplementary-material
Amelung W., Brodowski S., Sandhage-Hofmann A., Bol R. (2008). “Chapter 6 Combining Biomarker With Stable Isotope Analyses for Assessing the Transformation and Turnover of Soil Organic Matter,” in Advances in Agronomy. San Diego, USA: Academic Press, 155–250.
Amon R. M. W., Fitznar H. P., Benner R. (2001). Linkages Among the Bioreactivity, Chemical Composition, and Diagenetic State of Marine Dissolved Organic Matter. Limnol. Oceanogr. 46, 287–297. doi: 10.4319/lo.2001.46.2.0287
Andrews J. H., Harris R. F. (1986). “R- and K-Selection and Microbial Ecology,” in Advances in Microbial Ecology. Ed. M.K. C. (Boston, MS, USA: Springer), 99–147.
Arnarson T. S., Keil R. G. (2001). Organic–mineral Interactions in Marine Sediments Studied Using Density Fractionation and X-Ray Photoelectron Spectroscopy. Org. Geochem. 32, 1401–1415. doi: 10.1016/S0146-6380(01)00114-0
Bolyen E., Rideout J. R., Dillon M. R., Bokulich N. A., Abnet C. C., Al-Ghalith G. A., et al. (2019). Reproducible, Interactive, Scalable and Extensible Microbiome Data Science Using QIIME 2. Nat. Biotechnol. 37, 852–857. doi: 10.1038/s41587-019-0209-9
Cowie G. L., Hedges J. I. (1992). Sources and Reactivities of Amino Acids in a Coastal Marine Environment. Limnol. Oceanogr. 37, 703–724. doi: 10.4319/lo.1992.37.4.0703
Cowie G. L., Hedges J. I. (1996). Digestion and Alteration of the Biochemical Constituents of a Diatom (Thalassiosira Weisflogii) Ingested by an Herbivorous Zooplankton (Calanus Pacificus) Limnol. Oceanogr. 41, 581–594. doi: 10.4319/lo.1996.41.4.0581
Dauwe B., Middelburg J. J. (1998). Amino Acids and Hexosamines as Indicators of Organic Matter Degradation State in North Sea Sediments. Limnol. Oceanogr. 43, 782–798. doi: 10.4319/lo.1998.43.5.0782
Dauwe B., Middelburg J. J., Herman P. M. J., Heip C. H. R. (1999). Linking Diagenetic Alteration of Amino Acids and Bulk Organic Matter Reactivity. Limnol. Oceanogr. 44, 1809–1814. doi: 10.4319/lo.1999.44.7.1809
Davis J., Kaiser K., Benner R. (2009). Amino Acid and Amino Sugar Yields and Compositions as Indicators of Dissolved Organic Matter Diagenesis. Organic Geochem. 40, 343–352. doi: 10.1016/j.orggeochem.2008.12.003
Dedysh S. N., Losey N. A., Lawson P. (2021). “Thermoanaerobaculaceae,” in Bergey's Manual of Systematics of Archaea and Bacteria. Eds. Trujillo M.E., Dedys S., Devos P., Hedlund B., Kämpfer P., Rainey F.A., Whitman W.B.. New York, USA: John Wiley & Sons, Inc., 1–3.
Deng Y., Jiang Y.-H., Yang Y., He Z., Luo F., Zhou J. (2012). Molecular Ecological Network Analyses. BMC Bioinf. 13, 113. doi: 10.1186/1471-2105-13-113
Ding J., Zhang Y., Wang M., Sun X., Cong J., Deng Y., et al. (2015). Soil Organic Matter Quantity and Quality Shape Microbial Community Compositions of Subtropical Broadleaved Forests. Mol. Ecol. 24, 5175–5185. doi: 10.1111/mec.13384
Dittmar T., Kattner G. (2003). The Biogeochemistry of the River and Shelf Ecosystem of the Arctic Ocean: A Review. Mar. Chem. 83, 103–120. doi: 10.1016/S0304-4203(03)00105-1
Endo T., Otani S. (2019). “Carbon Storage in Tidal Flats,” in Blue Carbon in Shallow Coastal Ecosystems. Eds. Kuwae T., Hori M. (Singapore: Springer), 129–152.
Fierer N., Bradford M. A., Jackson R. B. (2007). Toward an Ecological Classification of Soil Bacteria. Ecology 88, 1354–1364. doi: 10.1890/05-1839
Figueroa D., Capo E., Lindh M. V., Rowe O. F., Paczkowska J., Pinhassi J., et al. (2021). Terrestrial Dissolved Organic Matter Inflow Drives Temporal Dynamics of the Bacterial Community of a Subarctic Estuary (Northern Baltic Sea) Environ. Microbiol. 23, 4200–4213. doi: 10.1111/1462-2920.15597
Fitznar H. P., Lobbes J. M., Kattner G. (1999). Determination of Enantiomeric Amino Acids With High-Performance Liquid Chromatography and Pre-Column Derivatisation With O-Phthaldialdehyde and N-Isobutyrylcysteine in Seawater and Fossil Samples (Mollusks). J. Chromatogr. A 832, 123–132. doi: 10.1016/S0021-9673(98)01000-0
Freese E., Köster J., Rullkötter J. (2008). Origin and Composition of Organic Matter in Tidal Flat Sediments From the German Wadden Sea. Organic Geochem. 39, 820–829. doi: 10.1016/j.orggeochem.2008.04.023
Glöckner F. O., Yilmaz P., Quast C., Gerken J., Beccati A., Ciuprina A., et al. (2017). 25 Years of Serving the Community With Ribosomal RNA Gene Reference Databases and Tools. J. Biotechnol. 261, 169–176. doi: 10.1016/j.jbiotec.2017.06.1198
Graue J., Kleindienst S., Lueders T., Cypionka H., Engelen B. (2012). Identifying Fermenting Bacteria in Anoxic Tidal-Flat Sediments by a Combination of Microcalorimetry and Ribosome-Based Stable-Isotope Probing. FEMS Microbiol. Ecol. 81, 78–87. doi: 10.1111/j.1574-6941.2011.01282.x
Ho A., Di Lonardo D. P., Bodelier P. L. E. (2017). Revisiting Life Strategy Concepts in Environmental Microbial Ecology. FEMS Microbiol. Ecol. 93: fix006. doi: 10.1093/femsec/fix006
Hoffmann K., Bienhold C., Buttigieg P. L., Knittel K., Laso-Pérez R., Rapp J. Z., et al. (2020). Diversity and Metabolism of Woeseiales Bacteria, Global Members of Marine Sediment Communities. ISME J. 14, 1042–1056. doi: 10.1038/s41396-020-0588-4
Jones S. E., Newton R. J., Mcmahon K. D. (2009). Evidence for Structuring of Bacterial Community Composition by Organic Carbon Source in Temperate Lakes Environ. Microbiol. 11, 2463–2472. doi: 10.1111/j.1462-2920.2009.01977.x
Jorgensen S. L., Hannisdal B., Lanzén A., Baumberger T., Flesland K., Fonseca R., et al. (2012). Correlating Microbial Community Profiles With Geochemical Data in Highly Stratified Sediments From the Arctic Mid-Ocean Ridge. Proc. Natl. Acad. Sci. 109, E2846. doi: 10.1073/pnas.1207574109
Kaiser K., Benner R. (2005). Hydrolysis-Induced Racemization of Amino Acids. Limnol. Oceanogr.: Methods 3, 318–325. doi: 10.4319/lom.2005.3.318
Kaiser K., Benner R. (2008). Major Bacterial Contribution to the Ocean Reservoir of Detrital Organic Carbon and Nitrogen. Limnol. Oceanogr. 53, 99–112. doi: 10.4319/lo.2008.53.1.0099
Klappenbach J. A., Dunbar J. M., Schmidt T. M. (2000). rRNA Operon Copy Number Reflects Ecological Strategies of Bacteria. Appl. Environ. Microbiol. 66, 1328–1333. doi: 10.1128/AEM.66.4.1328-1333.2000
Klindworth A., Pruesse E., Schweer T., Peplies J., Quast C., Horn M., et al. (2013). Evaluation of General 16S Ribosomal RNA Gene PCR Primers for Classical and Next-Generation Sequencing-Based Diversity Studies. Nucleic Acids Res. 41, e1–e1. doi: 10.1093/nar/gks808
Liu Y., Deng B., Du J., Zhang G., Hou L. (2019). Nutrient Burial and Environmental Changes in the Yangtze Delta in Response to Recent River Basin Human Activities. Environ. Pollut. 249, 225–235. doi: 10.1016/j.envpol.2019.03.030
López-Pérez M., Haro-Moreno J. M., Iranzo J., Rodriguez-Valera F., Bowman J. (2020). Genomes of the "Candidatus Actinomarinales" Order: Highly Streamlined Marine Epipelagic Actinobacteria. mSystems 5, e01041–e01020. doi: 10.1128/mSystems.01041-20
Mahmoudi N., Beaupré S. R., Steen A. D., Pearson A. (2017). Sequential Bioavailability of Sedimentary Organic Matter to Heterotrophic Bacteria. Environ. Microbiol. 19, 2629–2644. doi: 10.1111/1462-2920.13745
Matiasek S. J., Hernes P. J. (2019). The Chemical Fingerprint of Solubilized Organic Matter From Eroded Soils and Sediments. Geochim. Cosmochim. Acta 267, 92–112. doi: 10.1016/j.gca.2019.09.016
Mou X., Sun S., Edwards R. A., Hodson R. E., Moran M. A. (2008). Bacterial Carbon Processing by Generalist Species in the Coastal Ocean. Nature 451, 708–711. doi: 10.1038/nature06513
Nagata Y. (1999). “Chapter 19 - D-Amino Acids in Nature,” in Advances in BioChirality. Eds. Pályi G., Zucchi C., Caglioti L. (Amsterdam: Elsevier Science B.V), 271–283.
Odum E. P. (1969). The Strategy of Ecosystem Development. Science 164, 262–270. doi: 10.1126/science.164.3877.262
Odum E. P. (1985). Trends Expected in Stressed Ecosystems. BioScience 35, 419–422. doi: 10.2307/1310021
Ouyang X., Lee S. Y. (2014). Updated Estimates of Carbon Accumulation Rates in Coastal Marsh Sediments. Biogeosciences 11, 5057–5071. doi: 10.5194/bg-11-5057-2014
Peter S., Shen Y., Kaiser K., Benner R., Durisch-Kaiser E. (2012). Bioavailability and Diagenetic State of Dissolved Organic Matter in Riparian Groundwater. J. Geophys. Res.: Biogeosci. 117 (G4), G04006.
Probandt D., Knittel K., Tegetmeyer H. E., Ahmerkamp S., Holtappels M., Amann R. (2017). Permeability Shapes Bacterial Communities in Sublittoral Surface Sediments. Environ. Microbiol. 19, 1584–1599. doi: 10.1111/1462-2920.13676
Qin W., Martens-Habbena W., Kobelt J. N., Stahl D. A. (2016). “Candidatus Nitrosopumilaceae,” in Bergey's Manual of Systematics of Archaea and Bacteria. Eds. Trujillo M.E., Dedys S., Devos P., Hedlund B., Kämpfer P., Rainey F.A., Whitman W.B., John Wiley & Sons, Inc., New York, USA, 1–2.
Shannon P., Markiel A., Ozier O., Baliga N. S., Wang J. T., Ramage D., et al. (2003). Cytoscape: A Software Environment for Integrated Models of Biomolecular Interaction Networks. Genome Res. 13, 2498–2504. doi: 10.1101/gr.1239303
Sienkiewicz N., Bier R. L., Wang J., Zgleszewski L., Lutgen A., Jiang G., et al. (2020). Bacterial Communities and Nitrogen Transformation Genes in Streambank Legacy Sediments and Implications for Biogeochemical Processing. Biogeochemistry 148, 271–290. doi: 10.1007/s10533-020-00659-6
Strauch R. C., Svedin E., Dilkes B., Chapple C., Li X. (2015). Discovery of a Novel Amino Acid Racemase Through Exploration of Natural Variation in Arabidopsis Thaliana. Proc. Natl. Acad. Sci. 112, 11726–11731. doi: 10.1073/pnas.1503272112
Teeling H., Fuchs B. M., Becher D., Klockow C., Gardebrecht A., Bennke C. M., et al. (2012). Substrate-Controlled Succession of Marine Bacterioplankton Populations Induced by a Phytoplankton Bloom. Science 336, 608–611. doi: 10.1126/science.1218344
Unger D., Herbeck L. S., Li M., Bao H. Y., Wu Y., Zhang J., et al. (2013). Sources, Transformation and Fate of Particulate Amino Acids and Hexosamines Under Varying Hydrological Regimes in the Tropical Wenchang/Wenjiao Rivers and Estuary, Hainan, China. Cont. Shelf Res. 57, 44–58. doi: 10.1016/j.csr.2012.02.014
Wei J.-E., Chen Y., Wang J., Yan S.-B., Zhang H.-H., Yang G.-P. (2021). Amino Acids and Amino Sugars as Indicators of the Source and Degradation State of Sedimentary Organic Matter. Mar. Chem. 230, 103931. doi: 10.1016/j.marchem.2021.103931
Wilms R., Sass H., Kopke B., Koster J., Cypionka H., Engelen B. (2006). Specific Bacterial, Archaeal, and Eukaryotic Communities in Tidal-Flat Sediments Along a Vertical Profile of Several Meters Appl. Environ. Microbiol. 72, 2756–2764. doi: 10.1128/AEM.72.4.2756-2764.2006
Wu X., Wu L., Liu Y., Zhang P., Li Q., Zhou J., et al. (2018). Microbial Interactions With Dissolved Organic Matter Drive Carbon Dynamics and Community Succession. Front. Microbiol. 9, 1234. doi: 10.3389/fmicb.2018.01234
Yokoyama T., Kan-No N., Ogata T., Kotaki Y., Sato M., Nagahisa E. (2003). Presence of Free D-Amino Acids in Microalgae. Biosci. Biotechnol. Biochem. 67, 388–392. doi: 10.1271/bbb.67.388
Yu T., Wu W., Liang W., Lever M. A., Hinrichs K.-U., Wang F. (2018). Growth of Sedimentary Bathyarchaeota on Lignin as an Energy Source. Proc. Natl. Acad. Sci. 115, 6022–6027. doi: 10.1073/pnas.1718854115
Zhou Z., Pan J., Wang F., Gu J.-D., Li M. (2018a). Bathyarchaeota: Globally Distributed Metabolic Generalists in Anoxic Environments. FEMS Microbiol. Rev. 42, 639–655. doi: 10.1093/femsre/fuy023
Zhou Z., Wang C., Luo Y. (2018b). Effects of Forest Degradation on Microbial Communities and Soil Carbon Cycling: A Global Meta-Analysis Global Ecol. Biogeogr. 27, 110–124. doi: 10.1111/geb.12663
Keywords: organic carbon degradation, amino acids, bacteria, archaea, feedback, 16s rRNA sequencing, aquaculture
Citation: Zhou M, Fang F-T, Zeng C, Zhang L-H, Zhou C-X and Zhu Z-Y (2022) Community Competition Is the Microorganism Feedback to Sedimentary Carbon Degradation Process in Aquaculture Tidal Flats. Front. Mar. Sci. 9:880120. doi: 10.3389/fmars.2022.880120
Received: 21 February 2022; Accepted: 28 April 2022;
Published: 31 May 2022.
Edited by:
Chih-hao Hsieh, National Taiwan University, TaiwanReviewed by:
Tzu-Hsuan Tu, National Sun Yat-sen University, TaiwanCopyright © 2022 Zhou, Fang, Zeng, Zhang, Zhou and Zhu. This is an open-access article distributed under the terms of the Creative Commons Attribution License (CC BY). The use, distribution or reproduction in other forums is permitted, provided the original author(s) and the copyright owner(s) are credited and that the original publication in this journal is cited, in accordance with accepted academic practice. No use, distribution or reproduction is permitted which does not comply with these terms.
*Correspondence: Zhuo-Yi Zhu, emh1LnpodW95aUAxNjMuY29t; emh1LnpodW95aUBzanR1LmVkdS5jbg==
Disclaimer: All claims expressed in this article are solely those of the authors and do not necessarily represent those of their affiliated organizations, or those of the publisher, the editors and the reviewers. Any product that may be evaluated in this article or claim that may be made by its manufacturer is not guaranteed or endorsed by the publisher.
Research integrity at Frontiers
Learn more about the work of our research integrity team to safeguard the quality of each article we publish.