 Justine Courboulès
 Behzad Mostajir1*
 Thomas Trombetta
- 1MARBEC (Marine Biodiversity, Exploitation and Conservation), Univ Montpellier, CNRS, Ifremer, IRD, Montpellier, France
- 2MEDIMEER (Mediterranean platform for Marine Ecosystems Experimental Research), Observatoire de Recherche Méditerranéen de l’Environnement, Univ Montpellier, CNRS, IRD, INRAE, Sète, France
To assess the response of a natural plankton community to the future scenario of a warming of +3°C predicted for coastal Mediterranean regions, an in situ mesocosm experiment was carried out over 19 days in a Mediterranean coastal lagoon in 2018. During this experiment, a phytoplankton bloom occurred and the abundances of several cytometric groups of phytoplankton (cyanobacteria, picophytoplankton and nanophytoplankton) and bacteria (low- and high-nucleic acid bacteria), as well as their growth and grazing mortality rates and their carbon biomass, were studied over the course of the experiment. Experimental warming led to a significant reduction of 47% of the phytoplankton biomass in average, based on Chl-a concentrations. This reduction was also observed for nanophytoplankton abundances during the whole experiment and for eukaryotic picophytoplankton only during the bloom period. This result coincided with a significant decrease in orthophosphate concentrations under warming during the prebloom and bloom periods simultaneous to an increase in bacterial abundances. At the same time, the higher growth rates of bacteria and the lower ones of phytoplankton observed at the beginning of the bloom could suggest that competition between phytoplankton and bacteria for orthophosphate might have contributed to the phytoplankton biomass decrease under warming. In addition, higher grazing mortality rates of phytoplankton groups under warming, notably nanophytoplankton at the end of the bloom and in postbloom (by 59 to 626%), as well as eukaryotic picophytoplankton over the course of the experiment (by 58 to 255%) could also have contributed to the lower phytoplankton biomass under warming. Based on these results, estimations of average phytoplankton carbon biomass production and transfer showed reductions of 42 and 45%, respectively, under warming, whereas those of bacteria were enhanced by 13 and 8%, respectively. These results indicated that warming induced a shift at the base of the microbial food web, going toward a more bacteria-based system. This suggested that under future warming scenarios, the microbial food web could become less productive and could negatively affect the functioning of the whole food web in coastal waters.
Introduction
Phytoplankton and bacterioplankton (including archaea and heterotrophic bacteria) constitute ecologically important components forming the base of marine food webs and influencing fundamental biogeochemical cycles in marine ecosystems (Azam, 1998). Phytoplankton, as the major primary producers in the oceans (Field, 1998), and bacterioplankton, as a key contributor to the secondary production (Hoppe et al., 2008), mediate carbon fluxes in the microbial food web. Phytoplankton and bacterioplankton populations are modulated by their growth and loss rates, which are dependent on multiple biological interactions (Kordas et al., 2011). While growth rates directly reflect individual metabolic rates, they are heavily linked to resource availability, which itself is dependent on environmental inputs and mutualist or competition interactions between phytoplankton groups and with bacteria (Pomeroy and Wiebe, 1988; Aota and Nakajima, 2001; Løvdal et al., 2007). Simultaneously, microbial losses are also driven by multiple factors, mainly grazing mortality rates (Calbet and Landry, 2004) but also viral lysis (Baudoux et al., 2008) or sedimentation. Temperature is also a key parameter affecting phytoplankton and bacteria populations. Indeed, several studies have already shown that increasing the temperature by a few degrees generally enhanced the growth rates of phytoplankton and bacteria (Eppley, 1972; White et al., 1991; Savage et al., 2004). However, differential temperature dependence of phytoplankton and bacterial metabolisms (Lopez-Urrutia et al., 2006; Arandia-Gorostidi et al., 2017) can leads to different individual responses of these groups under warming and potentially affects their mutualist or competitive interactions in natural plankton assemblages. Similarly, previous studies also reported that grazing mortality rates of phytoplankton and bacteria generally increased under warming (Vázquez-Domínguez et al., 2012; Lewandowska et al., 2014). Because, heterotrophs temperature dependence is higher than for phytoplankton (Brown et al., 2004), warming could therefore affect the balance between heterotrophs grazing activity and phytoplankton growth, potentially leading to a depression in phytoplankton biomass (Lopez-Urrutia, 2008; Sommer and Lengfellner, 2008; Lewandowska et al., 2014). Furthermore, in the context of global warming, some regions, such as the Mediterranean Sea, are considered to be particularly sensitive to the predicted warming of the water temperature (Harley et al., 2006). This is the case for coastal Mediterranean lagoons, from which plankton are expected to undergo great changes in temperature in their environment in the future due to global warming (Harley et al., 2006; Vidussi et al., 2011).
Few studies have investigated the effects of experimental warming on coastal Mediterranean lagoon plankton communities. Pulina et al. (2020) and Courboulès et al. (2021) investigated two different lagoons in winter and autumn, respectively, but reported a similar positive effect of warming on small phytoplankton and bacteria abundances. In contrast, Vidussi et al. (2011) investigated the same lagoon as in Courboulès et al. (2021), but during the productive phytoplankton spring bloom, and reported very contrasting results, with no change in Chl-a concentration under warming and lower bacteria abundances. Despite the importance of the spring period, characterized by high production and transfer of carbon biomass through the microbial food web, there is still a large gap in the literature concerning the effects of warming on spring plankton assemblages in their natural environment (Vidussi et al., 2011; Pulina et al., 2016) and holistic descriptions encompassing different functional phytoplankton and bacteria group responses.
Therefore, an in situ mesocosm study was conducted in spring 2018 to determine the effects of warming on the microbial food web in the coastal Mediterranean Thau Lagoon. The experimental warming was realized by elevating the water temperature of half of the mesocosms by 3°C, mimicking the predicted temperature increase in the Mediterranean Sea under expected global warming (IPCC, 2014; Pörtner et al., 2019). In addition, special care was taken to closely reflect natural conditions, such as in situ nychthemeral temperature variations (Nouguier et al., 2007). During the experiment, the responses of picophytoplankton, nanophytoplankton and bacterioplankton (high and low nucleic acids; HNA and LNA) were specifically investigated. To achieve this, their daily abundances and growth and grazing mortality rates estimated by the dilution technique (Landry and Hassett, 1982; Chen, 2015a) six times during the experiment were compared between the control and warmed treatments to assess changes in the microbial community under warming. Additionally, daily biomass as well as biomass production and transfer were also estimated to quantify biomass fluxes driven by phytoplankton and bacteria through the microbial food web, allowing us to suggest potential consequences of warming on carbon fluxes.
Materials and Methods
In Situ Mesocosm Set Up
A mesocosm experiment was conducted from April 5th to 23rd, 2018, encompassing a natural phytoplankton spring bloom, to evaluate the effects of elevated temperature, as predicted for the Mediterranean region in 2100 (IPCC, 2014; Pörtner et al., 2019), on the plankton community. For this purpose, the mesocosms were immersed in situ in the Mediterranean Thau Lagoon near the floating pontoon of the MEDiterranean Platform for Marine Ecosystems Experimental Research (MEDIMEER, 43°24’00” N, 3°36’00” E) and the Coastal Mediterranean Thau Lagoon Observatory. Thau Lagoon, located in the northwestern Mediterranean Sea, is a shallow coastal lagoon (average depth: 4 m) and experiences naturally large temperature variations (Trombetta et al., 2019).
Mesocosms were filled on April 5th with subsurface lagoon water (1.5 m depth) that was gently pumped (SXM2/A SG, Flygt), then screened through a 1000-µm mesh and finally pooled before being distributed to simultaneously fill all of the mesocosms up to 2,200 L each. The mesocosms were transparent bags (1.2 m wide and 3 m long) made with 200-µm-thick vinylacetate mixed-polyethylene film reinforced by nylon mesh (Insinööritoimisto Haikonen Ky), set up on individual floating structures as described in Vidussi et al. (2011). All mesocosms were equipped with a dome cover made of transparent (crystal clear polyvinyl chloride, PVC) film to prevent any external inputs (dust, marine spray). Once filled, the water column of the mesocosms was 2 m deep and was gently mixed by a pump (Model 24, 12 V, Rule) installed in each mesocosm with a turnover time of 3.5 d-1 to avoid plankton sedimentation. Two treatments, each in triplicate, were applied: 1) the control (C) with the natural water temperature of the lagoon and 2) the warmed (T) treatment for which the water temperature was gradually elevated to +3°C compared to the control. Among the triplicate mesocosms, one mesocosm of each treatment had technical problems; thus, the results from daily mesocosm sampling correspond to the mean of duplicate mesocosms. The increase in water temperature was realized using a heating element (Galvatec), allowing the water temperature of the warmed treatment to be constantly adjusted and maintained at 3°C warmer than the control treatment using an automatic control system as detailed in Nouguier et al. (2007). The unique features of this experimental warming protocol allowed us to mimic natural variations (diurnal/nycthemeral and day-by-day) by maintaining a + 3°C temperature difference between the two treatments. To avoid a thermal shock for the natural community in the warmed treatment, the temperature was increased in two days, at a rate of 1.5°C per day, in concordance with natural daily temperature variations in the lagoon. Then, the temperature in the warmed treatment was maintained at + 3°C compared to the temperature in the control treatment from day 3 until the end of the experiment (day 18).
Chemical and Biological Variables Sampling and Analysis
Every mesocosm was sampled daily in the morning for chemical and biological variables. For nutrient analysis, a 5-liter Niskin bottle was deployed in each mesocosm, from which samples (13 mL) were taken and filtered through 0.45 µm prewashed filters (Agilent Technologies, 25 mm in diameter) before being stored at -20°C. The concentrations of nitrates (NO2-+NO3-), orthophosphates (PO43-) and silicates (SiO2) were then determined using a continuous flow analyzer (San++, Skalar).
For biological variables, water was sampled from every mesocosm into 10 L polycarbonate carboys using a low vacuum pump (Knf). For Chl-a measurements, subsamples (0.5 to 1 L) were filtered over glass-fiber filters (Whatman GF/F 25 mm in diameter, 0.7-µm nominal pore size), and filters were immediately frozen in liquid nitrogen before being stored at -80°C until Chl-a analysis. High-performance liquid chromatography (HPLC, Waters) analysis was performed to measure Chl-a concentrations, following the method in Zapata et al. (2000), with adjustment of the protocol described in Vidussi et al. (2011).
To follow phytoplankton, bacterioplankton and virus abundances over the course of the experiment, samples (1.5 mL) were taken for flow cytometry (FCM) analysis. Phytoplankton and bacteria samples were fixed with 60 µl of glutaraldehyde (grade 1, 3.8% final dilution), and virus samples were fixed with 30 µL of glutaraldehyde (grade 1, filtered over 0.02 µm, 1.9% final dilution) and kept at -80°C. Picophytoplankton (both eukaryotes and prokaryotes) and nanophytoplankton were analyzed using a CytoFLEX flow cytometer (Beckman Coulter) for 3 min at high speed. Phytoplanktonic picoprokaryotes were identified and enumerated based on their relative forward scatter (FSC) and orange fluorescence (542-585 nm). Phytoplanktonic picoeukaryotes and nanophytoplankton were counted based on their FSC and red fluorescence (650 nm). Bacterial samples were stained using SYBR Green I (2.6% final dilution) and analyzed with a FACSCalibur flow cytometer (Becton Dickinson) for 3 min at low speed following the procedure described in Marie et al. (1997). The counting and differentiation of bacterial groups were performed regarding their relative side scatter (SSC) and their green fluorescence (530/30 nm). Virus samples were stained with SYBR Green I (0.5 x 10⁻⁴ final dilution) and analyzed using a FACSCanto flow cytometer (Becton-Dickinson). Virus-like particles (hereafter referred to as viruses) were then enumerated regarding SSC and green fluorescence (530/30 nm) as described by Brussaard (2004). Cytometry beads of 1, 2, 6, 10 and 20 µm in diameter were added to the phytoplankton samples. Similarly, beads of 1 and 2 µm in diameter were used for bacterial samples, and beads of 0.5 µm were used for virus samples to determine the cell size and fluorescence level of the analyzed cells. TruCount™ (BD Biosciences) was also added to the samples before the analysis to better assess the volume of the analyzed sample.
FCM analysis revealed four groups of phytoplankton: one group of phytoplanktonic picoprokaryotes, namely, cyanobacteria (Cyano), which had a low cell concentration; one group of phytoplanktonic picoeukaryotes between 1-2 µm (Pico); a larger group of nanophytoplankton between 2 and 6 µm (Small Nano); and a final group between 6 and 10 µm (Large Nano). Two groups of bacteria were identified considering their fluorescence emissions, as low and high nucleic acid bacteria (LNA and HNA, respectively). Two groups of viruses of different relative sizes were also identified and are hereafter referred to as V1 and V2. A representation of the cytograms of the phytoplankton, bacteria and virus groups is available in the Supplementary Data (Supp. Figure 1). FCM analysis of the microbial and virus communities allowed us to estimate daily abundances for each of the identified groups expressed as cells mL-1.
Phyto- and Bacterioplankton Growth and Grazing Mortality Rate Estimation
Through the 19 days of the mesocosm experiment, six dilution experiments were performed on days 1, 5, 7, 9, 11 and 14 to estimate the growth and microzooplankton grazing mortality rates of phytoplankton and bacterioplankton. These series of dilution experiments were performed following a 2-point modified version of the original dilution method developed by Landry and Hassett (1982) using two levels of dilution prepared with 100% and 10% of 200 µm-filtered mesocosm water (Worden and Binder, 2003; Strom and Fredrickson, 2008; Menden-Deuer and Fredrickson, 2010; Chen, 2015a). For each dilution experiment, 20 L of one mesocosm for each treatment was sampled in the morning using gentle vacuum pumping (less than 200 mm Hg) and screened through a 200-µm mesh. One part of the 200 µm-screened water was gravity-filtered through 0.8 and then 0.2 µm filters (Whatman Polycap TC Filter Capsule 0.8/0.2 µm) to constitute a 0.2 µm-filtered sea water, while the other part (200 µm-screened sea water) was kept to constitute the different levels of the dilution. Triplicates of Whirlpack bags were then filled with 2 L of 200 µm-screened seawater to constitute the 100% level of dilution. To constitute the 10% level of dilution, another triplicate of incubation bags was filled with 1.8 L of 0.2 µm-filtered seawater and 0.2 L of 200 µm screened seawater. In an additional set of triplicates of 100% (hereafter referred to as 100% + NUT), nutrients were added at the Redfield ratio to evaluate and discuss the eventual nutrient limitations (final concentrations of 4, 0.25 and 4 µM for N, P and Si, respectively). Dilution bags were finally incubated for 24 h in two separate “incubation mesocosms” to minimize manipulation of the monitored mesocosms. These two “incubation mesocosms”, having the same characteristics as the monitored mesocosms, were also immersed in situ in the lagoon near the other mesocosms to have the same light and temperature conditions. One of the “incubation mesocosms” had the same temperature conditions as the control and surrounding lagoon water, while for the other “incubation mesocosm”, the water temperature was increased by 3°C, similar to the warmed treatment.
For Chl-a analysis, samples (from 0.5 to 1 L) were taken from 200 µm-screened water before incubation. After the 24 h incubation, 0.5 to 1 L of the 100% incubation bags and 1.5 to 1.8 L of the 10% incubation bags were filtered for Chl-a analysis using HPLC. These samples were prepared and analyzed as for the daily Chl-a measurements described previously. Additionally, phytoplankton and bacterioplankton samples (1.5 mL) were taken and fixed for flow cytometry (FCM) analysis, as previously described, before incubation (T0) from all bags at 100% without nutrients and after incubation (T24) for all bags (10%, 100% and 100% + NUT).
Instantaneous growth rates of phytoplankton based on Chl-a concentrations and those of small phytoplankton and bacterial groups based on the cytometric analysis were estimated from the dilution experiments, following Landry and Hassett (1982),
where k is the instantaneous growth rate (d-1), considering that NT0 and NT24 are the initial (T0) and final (T24) cell abundances or the Chl a concentration before and after incubation time t (d), respectively. The initial abundance of plankton as well as the initial Chl a concentration in the 10% bags were estimated based on the FCM cell counts or the Chl a concentration measured in the 100% bags. Then, the growth rate was considered equal to the instantaneous growth rate at the highly diluted level of 10%, while the grazing mortality rate was obtained from the difference between k at 10 and 100% (Worden and Binder, 2003; Strom and Fredrickson, 2008; Chen, 2015a). Mean growth and grazing mortality rates were then computed from triplicates of each dilution experiment.
In some cases, however, the cell abundance estimated from cytometry enumeration was considered too low (< 100 cells mL-1) (Vaquer et al., 1996) to accurately estimate rates; thus, the growth and grazing of some cytometry groups were not determined. This essentially concerned the Cyano group, for which rates were thus not estimated at several times during the experiment. In addition, estimation of growth and grazing mortality rates resulted, in a few cases (less than 5%), in negative growth rates and positive grazing mortality rates (inverted slope). Since growth by definition cannot be negative and grazing is considered a term of mortality, negative growth rates were set to 0.01 d-1 and positive grazing mortality rates were set to 0.00 d-1, following Calbet and Landry (2004) method of correction.
One particularity of the growth rate determination in this study is that rather than estimating the maximal growth rate of plankton as in the original Landry and Hassett method (1982), we sought to estimate a growth rate closer to the natural growth rate that occurs in the mesocosms without predation pressure. Thus, contrary to the classical dilution method for which inorganic nutrients are systematically added to avoid nutrient limitation (Landry and Hassett, 1982), we realized another set of undiluted incubation bags (100% + NUT) to highlight the eventual effects of nutrient addition and identify potential nutrient limitation (when the instantaneous growth rate increases after nutrient addition) instead of routinely correcting the growth rates regarding the nutrient addition effect (Landry et al., 2000). In this way, the growth rates estimated presently were representative of the natural growth rate limitations that occurred in a natural plankton assemblage as nutrient limitation or competition among plankton. Consequently, the phytoplankton and bacterial responses to warming resulted from both direct effects of warming on plankton metabolism and indirect effects through nutrient limitation.
Phyto- and Bacterioplankton Carbon Biomass Production and Transfer
Daily phytoplankton and bacterial carbon biomass (C-biomass) were estimated from daily Chl-a concentrations measured by HPLC and bacterial counts using cytometry. The Chl-a concentrations were converted to carbon (C)-biomass using a conversion factor of 57 mg C mg Chl-a-1 (Latasa et al., 2005). A conversion factor of 20 fg C bacterium-1 was used to convert bacterial abundances to C-biomass (Sime-Ngando et al., 1995). These conversion factors were previously used to estimate phytoplankton and bacterial C-biomasses in the same area (Mostajir et al., 2015) and were adapted for the plankton community in Thau Lagoon. Cyanobacterial abundances were converted to C- biomass using a conversion factor of 210 fg C cyanobacterium-1 (Kemp et al., 1993). Biovolumes of the phytoplanktonic cytometric groups were determined based on the mean diameters estimated from the cytometric group position related to cytometric beads of known diameters (Trombetta et al., 2019). The approximate diameters of Pico, Small Nano, and Large Nano were estimated to be 1.5, 4 and 8 µm, respectively. Then, the biovolumes were converted to C-biomass using a conversion factor of 0.22 pg C µm-3 (Kemp et al., 1993).
Additionally, phytoplankton and bacterial C-biomass production and transfer to higher trophic levels by microzooplankton were estimated based on the growth and grazing mortality rates following Equations 2, 3 and 4:
where P and T are the respective C-biomass production and transfer (µg C L-1 d-1) and µ and g are the respective growth and grazing mortality rates. Cm is the geometric mean of C-biomass during incubation time Δt, and NT0 is the biomass at the beginning of the incubation.
Statistical Analysis
Daily Chl-a and nutrient concentrations and daily microbial and virus abundances in the mesocosms were compared between the control and warmed treatments over the course of the experiment using repeated measures analysis of variance (RM-ANOVA, p value< 0.05). In the warmed mesocosms, the water temperature was progressively increased over two days (1.5°C day-1); therefore, data from day 0 to 1 were not included in the RM-ANOVA, as warming had not reached 3°C during these specific days.
Growth and grazing mortality rates as well as C-biomass production and transfer estimated from the dilution experiments were compared between the control and the warmed treatment using RM-ANOVA by excluding data prior to day 2. When assumptions of normality could not be met despite mathematical transformation (logarithmic or square root transformation), a Kruskal–Wallis test was used instead. Additionally, since plankton communities evolve rapidly, day-by-day comparisons between treatments were performed for each variable to identify planktonic responses on a short time scale. For this purpose, a nonparametric Kruskal–Wallis test (p value< 0.05) was performed because the small sample size did not allow accurate testing of the normality required for parametric tests. To assess the effect of the nutrient additions during the dilution experiment, instantaneous growth rates estimated from 100% incubation bags with and without inorganic nutrient addition were compared day by day using Kruskal–Wallis tests (p value< 0.05). All statistical analyses were performed with R software (R-project), version 3.6.1.
Results
Effect of Warming on Chl-a and Nutrient Concentrations in the Mesocosms
In the control mesocosms, the average temperature roughly increased during the experiment from 13.20°C on day 2 to 18.40°C on day 18 (Figure 1A). In the warmed treatment, the temperature was successfully raised by 2.66°C (± 0.47) compared to the control and throughout the whole experiment.
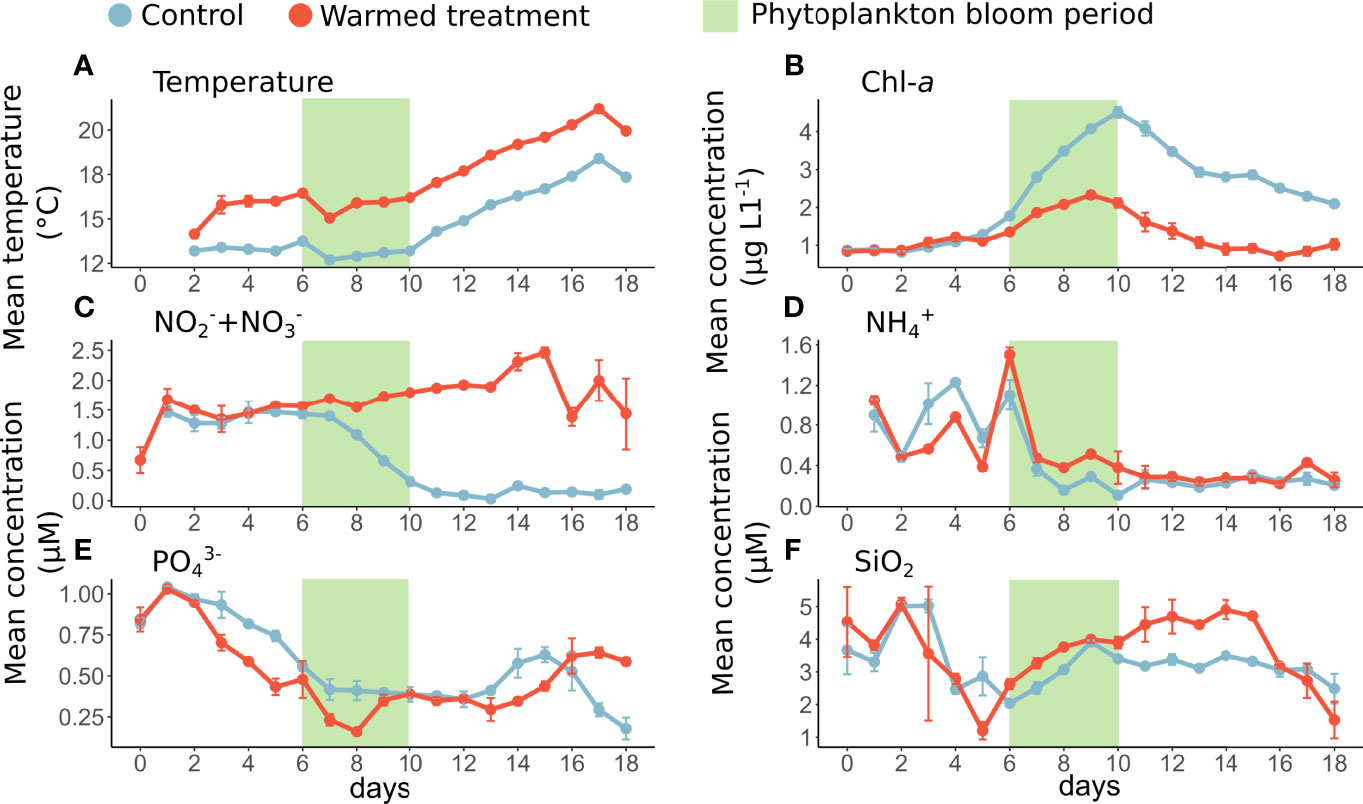
Figure 1 Daily mean temperature (A) and concentrations of Chl-a (B), nitrite + nitrate (C), ammonium (D), orthophosphate (E) and silicate (F) in the control (blue) and warmed treatments (red). The error bars represent the range of the observations, and the green rectangle represents the phytoplankton bloom period. Temperature measurements on days 0 and 1 were not available due to a technical issue as well as NO2-+NO3- data on day 0 in the control treatment and NH4+ data on day 0 in both treatments.
In the control mesocosms, the average Chl-a concentration was on average 0.87 µg L-1 at the beginning of the experiment (day 0). Then, it progressively increased from day 6 to 10, reaching its maximum average concentration of 4.51 µg L-1 on day 10 in the control, indicating a phytoplankton bloom from day 6 to 10 (Figure 1B). The periods before and after the bloom period were considered prebloom (from day 0 to 5) and postbloom (from day 11 to 18), respectively, and the later period was characterized by a drop in the Chl-a concentration (average 2.09 µg L-1 during this period in the control treatment).
In the warmed treatment, the mean Chl-a concentration was significantly lower than in the control treatment, although the Chl-a dynamics showed the same trend as in the control (Figure 1B and Table 1A). More specifically, the mean Chl-a concentration was on average 54% lower under warming over the bloom and postbloom periods.
In the control treatment, nitrite + nitrate (NO2-+NO3-) and ammonium (NH4+) mean concentrations were relatively high during the prebloom period (from day 0 to 5), with averages of 1.43 µM and 0.86 µM, respectively. Then, concentrations dropped during the bloom and reached their lower value during the postbloom period (days 11 to 18) with 0.13 µM NO2-+NO3- and 0.24 µM NH4+ on average (Figures 1C, D). Similarly, the orthophosphate (PO43-) mean concentrations were also high (1.04 µM on day 1) at the beginning of the experiment and then gradually decreased over time, reaching 0.18 µM on the last day of the experiment (day 18, Figure 1E). Silicate mean concentrations (SiO2) were relatively high in the control treatment over the whole period of the experiment, ranging from 2.04 to 5.01 µM (Figure 1F).
In the warmed treatment, the mean nitrite+nitrate concentrations were significantly higher than those in the control treatment, especially during the postbloom period (days 11 to 18), reaching concentrations 1311% higher than in the control treatment (Figure 1C). Similarly, the ammonium and silicate mean concentrations over the whole experiment were slightly higher by 8 and 11% on average in the warmed treatment than in the control. More specifically, silicates concentrations were significantly higher under warming from day 6 to 16 by 20%. In contrast, the mean orthophosphate concentrations was significantly lower under warming from day 2 to 10 by 24% and were on average 10% lower in the warmed treatment than in the control over the course of the experiment (Figure 1E; Table 1).
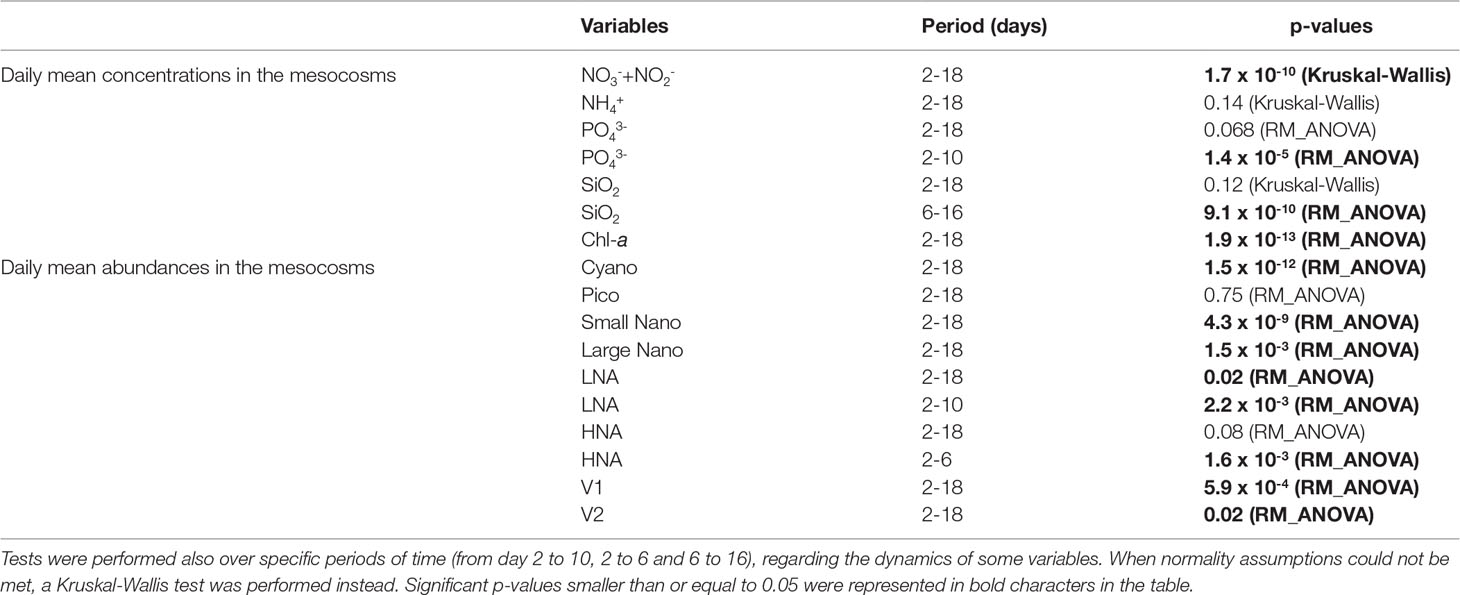
Table 1 Summary table of the p-values of the RM-ANOVA performed between the control and warmed treatment over the warmed period from days 2 to 18, for daily mean Chl-a and nutrient concentrations and daily mean abundance of phytoplankton, bacteria and viruses groups.
Effect of Warming on the Phytoplankton and Bacterioplankton Communities
Among phytoplankton< 10 µm, Pico was the most abundant group in the control treatment. Their abundances increased successively at two times, on day 2 reaching 3.7 ×10⁴ cells mL-1 and on day 6 reaching 2.4 ×10⁴ cells mL-1 (Figure 2B). Small Nano was the second most abundant group, with abundances strongly increasing in the control from the beginning of the bloom until the end of the experiment, reaching 1.1 ×10⁴ cells mL-1 on day 18. In parallel, Large Nano showed the strongest increase in abundance during the bloom, reaching an average of 1.3 × 10³ cells mL-1 ( ± 0.4 × 10³ cells mL-1), before decreasing postbloom. In the control treatment, Cyano was the least abundant group, with abundances slowly decreasing from 709 cells mL-1 on day 0 to an average of 46 cells mL-1 ( ± 15 cells mL-1) during the bloom and postbloom periods (Figure 2).
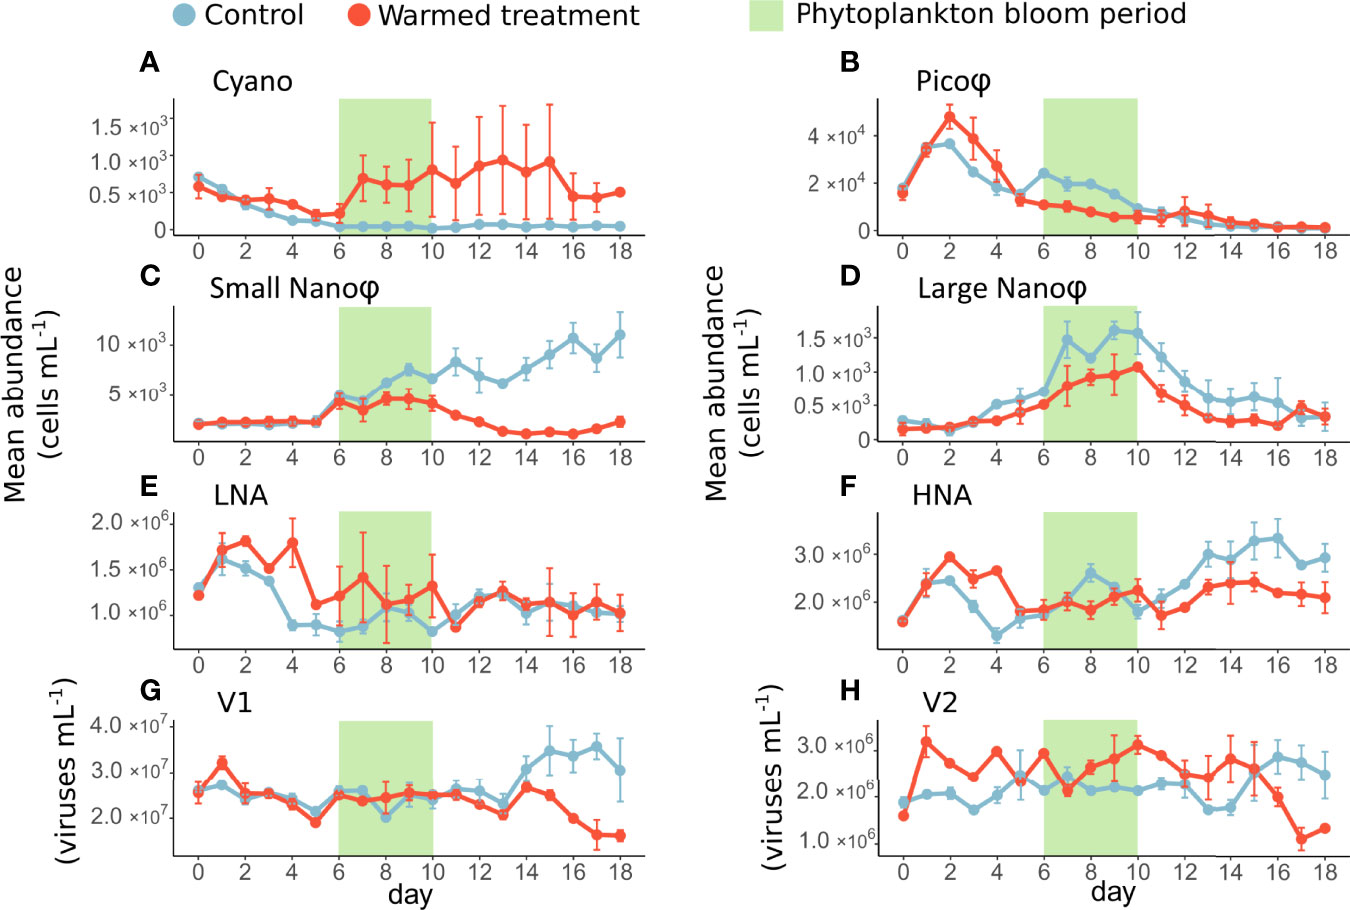
Figure 2 Daily average abundances (± range of the observations) of cyanobacteria (A), picophytoeukaryotes (B), nanophytoplankton (C, D), bacteria (E, F) and viruses (G, H) in the control (blue) and warmed (red) treatments. The green rectangle highlights the phytoplankton bloom period.
In the warmed treatment, there were lower abundances of Pico, Small and Large Nano with a different dynamic compared to the control treatment. More specifically, there was an increase in Pico abundance on day 2 similar to that in the control, which was 31% higher than in the control. However, there was no second increase in Pico abundance during the bloom as it was in the control, resulting in 54% lower Pico on average under warming. Similarly, Small and Large Nano abundances were significantly lower under warming compared to the control, respectively 55 and 36% on average over the course of the experiment. Cyano was the only group with significantly higher abundances in the warmed treatment than in the control (approximately four times higher) (Figure 2).
Among bacteria, HNA was the most abundant group in the control, with abundances ranging from 1.3 ×10⁶ to 3.3 ×10⁶ cells mL-1, while LNA abundances ranged from 0.9 ×10⁶ to 1.2 ×10⁶ cells mL-1 (Figures 2E, F).
Contrary to what was observed for the phytoplankton groups, LNA abundances were significantly higher in the warmed treatment than in the control by 26% during the phytoplankton prebloom and bloom periods. Their abundances were quite similar between treatments postbloom. From days 2 to 6 HNA abundances were significantly 30% higher in the warmed treatment than in the control, but thereafter (from days 7 to 18), their abundances were overall 19% lower in the warmed treatment than in the control (Figures 2E, F).
V1 abundances, ranging from 2.0 ×10⁷ to 3.6 ×10⁷ viruses mL-1, were higher than V2 abundances, which ranged from 1.7 ×10⁶ to 2.9 ×10⁶ viruses mL-1 (Figures 2G, H).
In the warmed treatment, the V1 abundance was significantly 12% lower than in the control, especially during the postbloom period. In contrast, V2 was significantly 11% more abundant under warming, except from days 16 to 18, where its abundance decreased by an average of 45% in the warmed treatment than in the control (Figures 2G, H).
Warming Effects on the Estimated Phytoplankton and Bacterial Carbon Biomass
The estimated total phytoplankton C-biomass based on HPLC analyses ranged from 50 to 257 µg C L-1 over the course of the experiment in the control treatment (Figure 3A). Phytoeukaryotes< 10 µm C-biomass estimated based on cytometric counts represented between 49 and 87% of the total phytoplankton C-biomass, thus the remaining C-biomass (13 to 51%) can be attributed to phytoplankton > 10 µm. Large Nano represented up to 54% of the phytoplankton C-biomass during the bloom (day 8), while Small Nano represented most of the phytoplankton C-biomass (68%) in the postbloom period. Cyanobacteria represented less than 1% of the phytoplankton C-biomass in the control with biomass ranging from 0.004 to 0.149 µg C L-1. The bacteria C-biomass ranged from 44 to 89 µg C L-1 (Figure 3A). At the beginning of the experiment, the bacteria C-biomass exceeded that of phytoplankton, while this trend was reversed during the bloom and postbloom periods. Bacteria C-biomass represented 17 to 63% of the total estimated C-biomass of bacteria and phytoplankton.
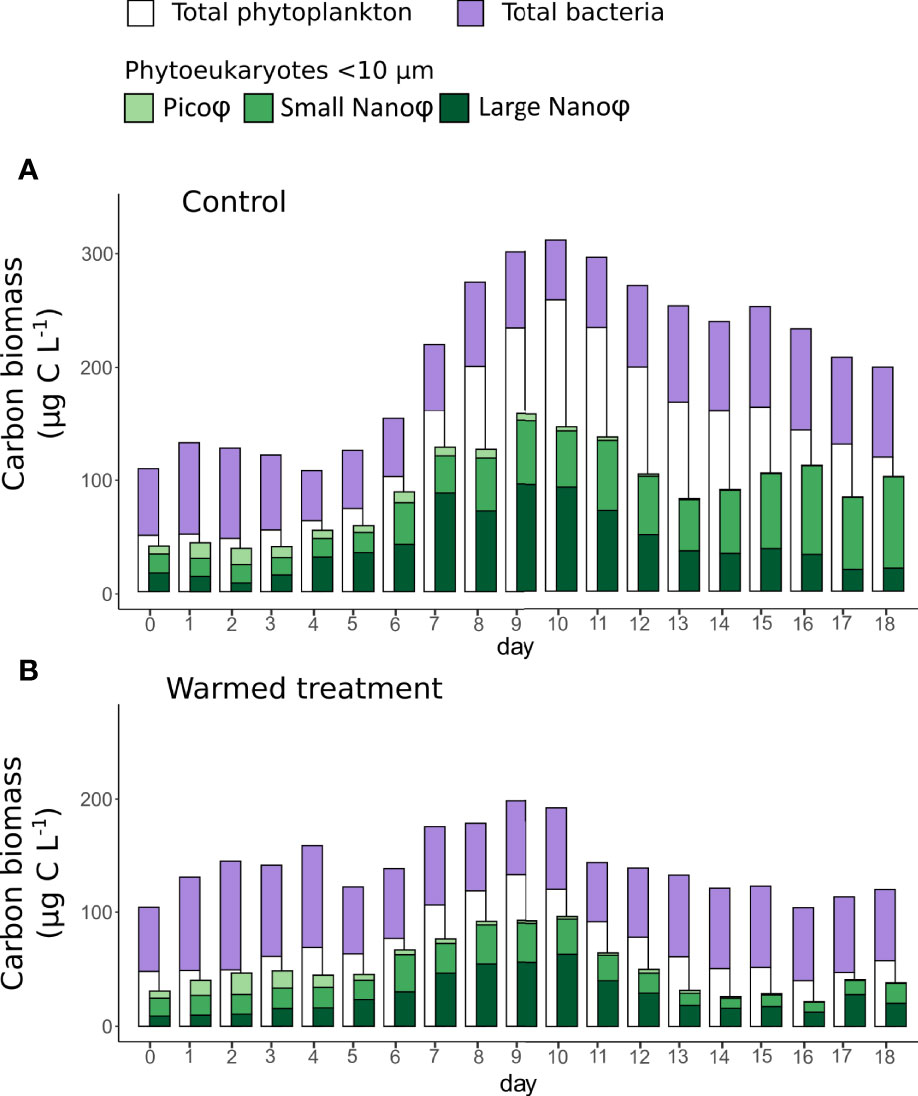
Figure 3 Histograms representing the average daily carbon biomass in the control (A) and in the warmed treatment (B) of the total phytoplankton community, estimated from Chl-a measurements (white), total bacteria community estimated from cytometric count (purple) and of different phytoeukaryotes groups< 10 µm: Pico, Small Nano and Large Nano (shade of green) estimated from cytometric counts. Note that cyanobacteria biomass was extremely low all along the experiment (< 0.20 µg C L-1) and therefore was not plotted individually on the figure; however, cyanobacteria biomass is accounted for through total phytoplankton community biomass.
Under warming, the phytoplankton C-biomass was significantly lower than in the control, ranging from 48 to 133 µg C L-1. The phytoeukrayotes< 10 µm groups generally represented a higher proportion of phytoplankton C-biomass than in the control, from 51% to 94%. However, Large Nano remained the main contributor (up to 59%) to phytoplankton C-biomass during the bloom and postbloom periods. In the warmed treatment, cyanobacteria represented also less than 1% of phytoplankton C-biomass with biomass ranging from 0.041 to 0.192 µg C L-1. Bacteria C-biomass, ranging from 52 µg C L-1 to 89 µg C L-1, was not significantly different from that in the control; however, it surpassed that of phytoplankton during both the prebloom and postbloom periods (Figure 3B).
Overall, the average phytoplankton C-biomass over the course of the experiment in the control and warmed treatments was 136.80 µg C L-1 (± 68.42 µg C L-1) and 72.42 µg C L-1 (± 28.35 µg C L-1), respectively, representing a decrease of 47% under warming. In contrast, the average bacteria C-biomass was similar in the control and warmed treatments, with 69.01 µg C L-1 (± 13.66 µg C L-1) and 68.74 µg C L-1 (± 11.24 µg C L-1), respectively.
Effect of Warming on Phytoplankton Growth and Grazing Mortality Rates
The highest phytoplankton growth rates, estimated on day 7, in the control treatment based on Chl-a concentrations as well as those of Pico, Small Nano and Large Nano, based on cytometry counts were systematically depressed by 25 to 58% under warming (Figures 4A, C, E, G; Table 2). During the postbloom period, the growth rates of Pico and Small Nano were significantly higher by 36 to 95% in the warmed treatment compared to the control. Cyano abundances were high enough only in the warmed treatment to calculate growth rates, which were relatively low, ranging from 0.005 to 0.13 d-1 during the bloom and postbloom periods (Figure 4I). The results related to the addition of inorganic nutrients to investigate a possible nutrient limitation of phytoplankton showed that nutrient limitation was sporadic, as among 48 estimated phytoplankton net growth rates, only 7 were significantly enhanced when nutrients were added, and among them, 6 were in the postbloom period (Supplementary Data; Supp. Figure 2).
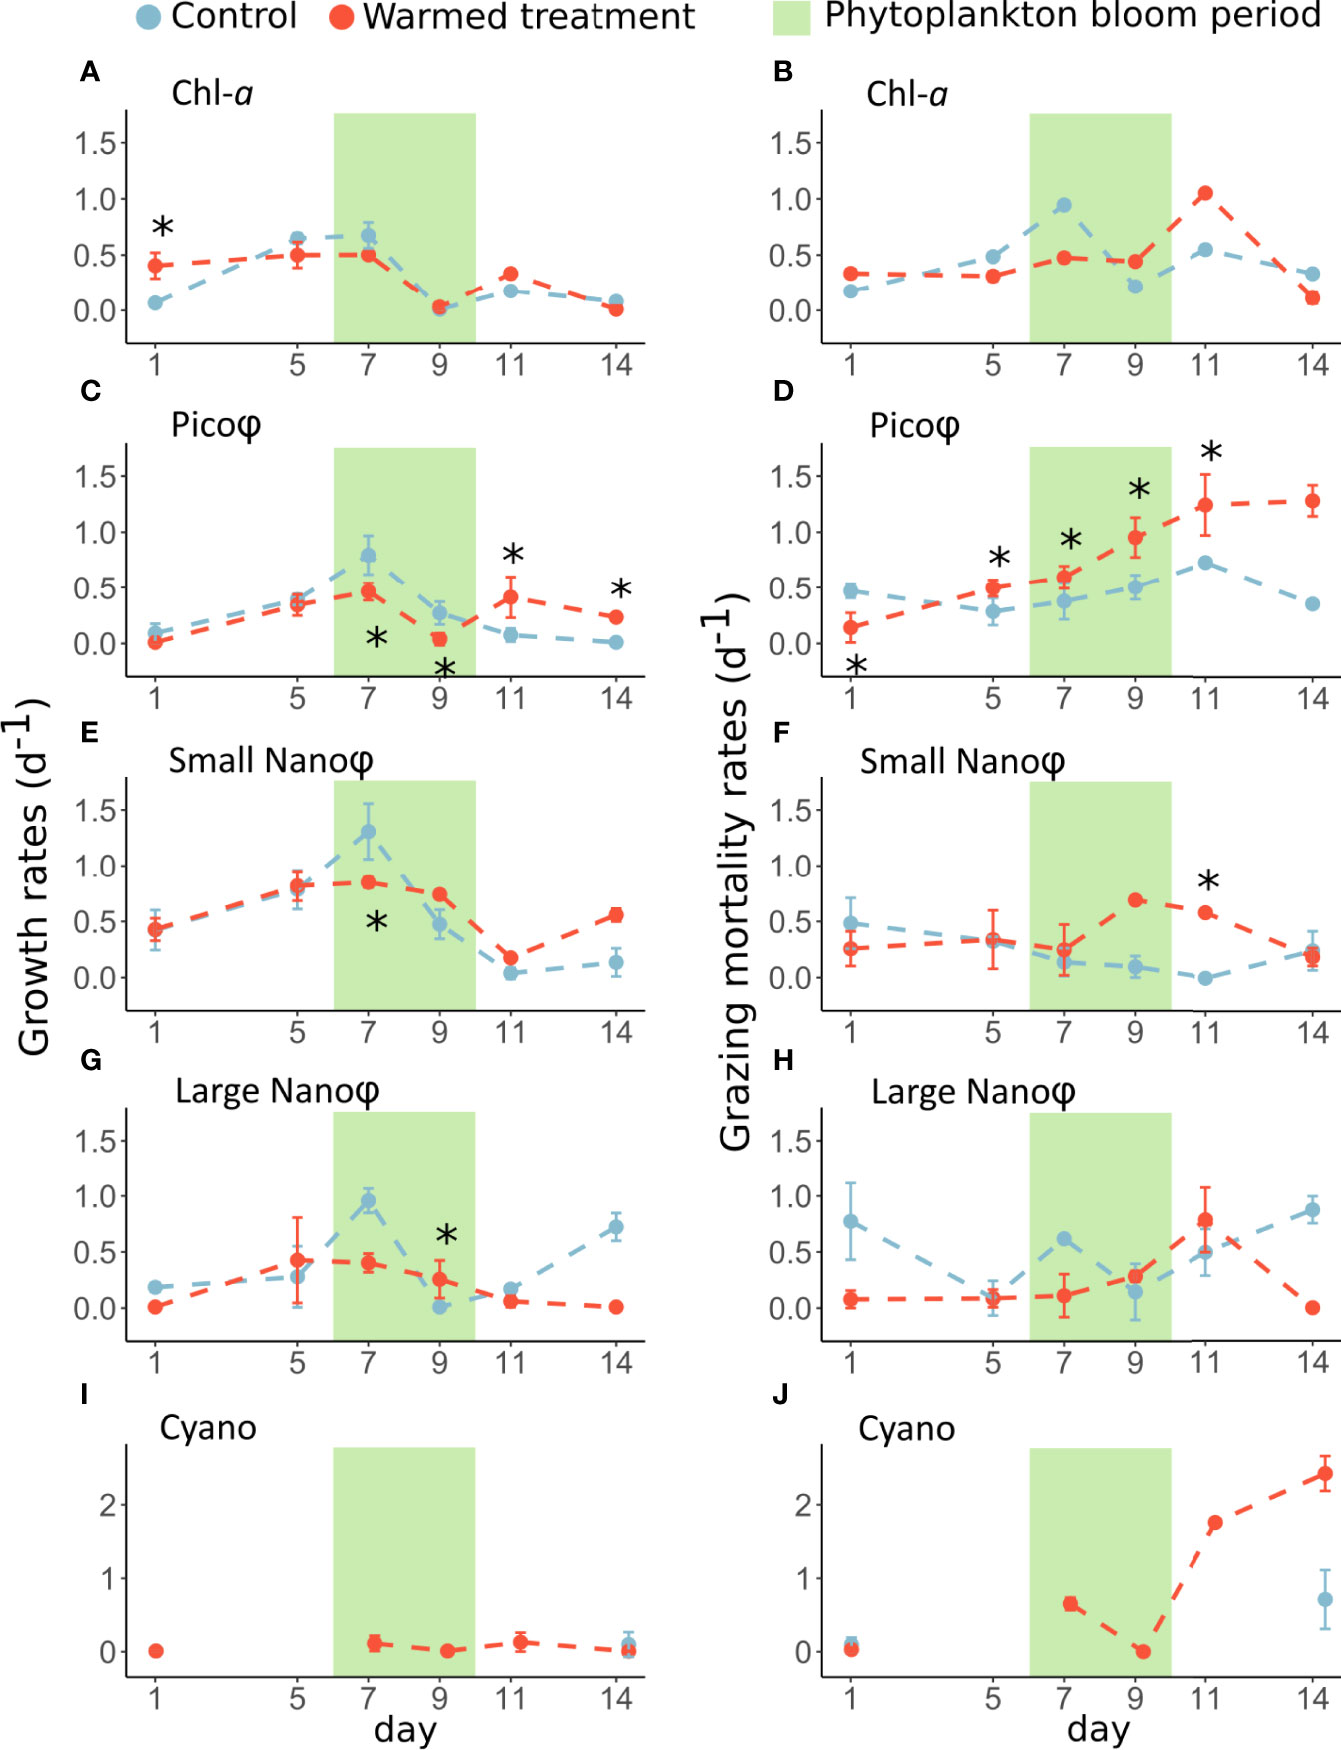
Figure 4 Dynamics of the mean (± standard deviations) of growth and grazing mortality rates in the left and right panels, respectively, based on Chl-a concentration (A, B) or based on cytometry count for eukaryotic picophytoplankton (C, D), small nanophytoplankton (E, F), large nanophytoplankton (G, H) and cyanobacteria (I, J) in the control (blue) and warmed (red) treatments. The stars (*) represent a significant difference ( p < 0.05) in the mean growth or grazing mortality rates between the control and warmed treatments. The green rectangle highlights the period of phytoplankton bloom.
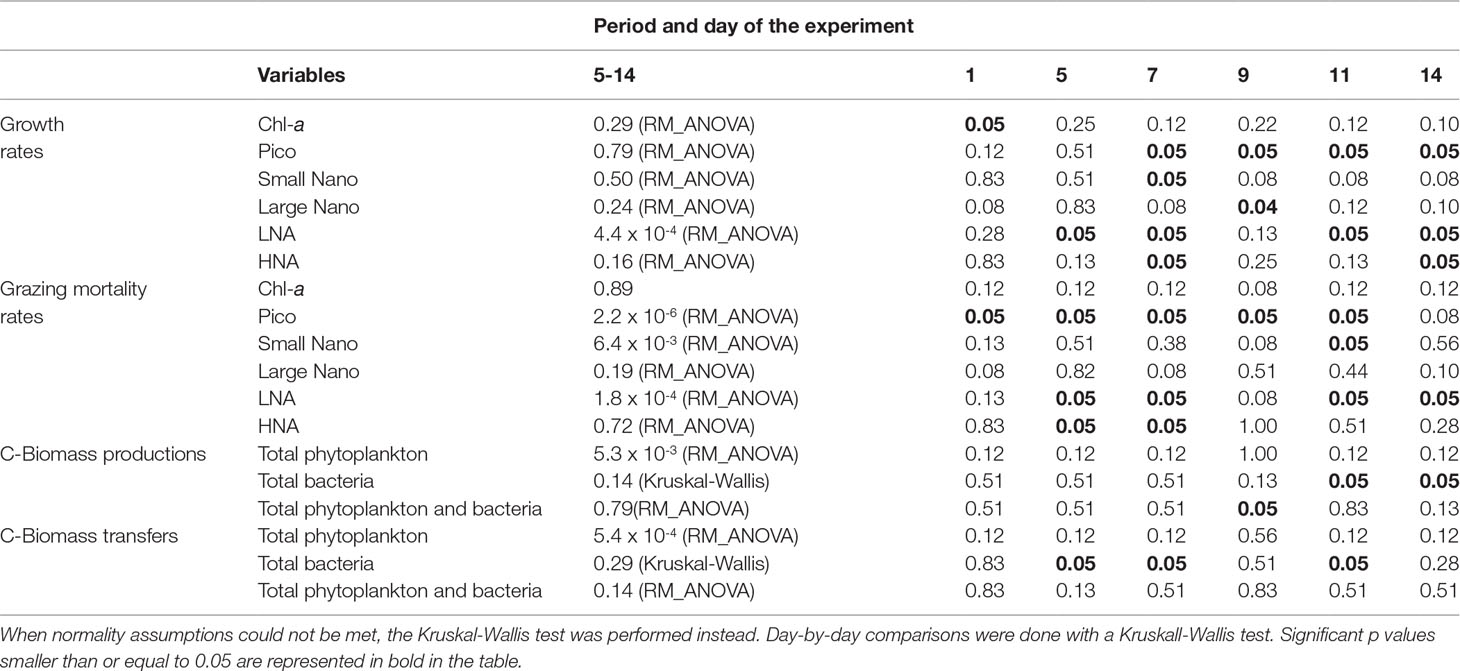
Table 2 Summary table of the p-values of the statistical comparison performed between the control and warmed treatments for the growth, grazing mortality rates, carbon biomass production and transfer of different phytoplankton and bacteria groups for each dilution day (days 1, 5, 7, 9, 11 and 14). RM-ANOVA was performed from days 5 to 14.
There were no significant differences in the grazing mortality rates of phytoplankton-Chl-a and on Large Nano between treatments, although we noticed a lower grazing mortality rate from days 1 to 7 and higher grazing mortality rates on days 9 and 11. In contrast, the grazing mortality rates of Pico and Small Nano were significantly higher by 55 up to 625% under warming, especially during the bloom and postbloom periods (Figures 4D, F; Table 2). The grazing mortality rate of Cyano was relatively high in the warmed treatment and increased through the postbloom period from 0.00 d-1 to 2.40 d-1 (Figure 4J).
Effect of Warming on Bacterioplankton Growth and Grazing Mortality Rates
Bacterial growth rates revealed that both HNA and LNA generally had significantly higher growth rates in the warmed treatment than in the control (Table 2). This was essentially the case during the phytoplankton bloom and postbloom periods, with growth rates 48 to 250% higher than those of the control for LNA and 13 to 39% higher for HNA (Figures 5A, C). In contrast to this general trend, in the phytoplankton prebloom period, bacterial growth rates were lower in the warmed treatment than in the control, especially on day 5, when rates were lower by 43% for LNA and 31% for HNA (Figures 5A, C). Note that the results related to the addition of nutrients to check a possible inorganic nutrient limitation of bacteria showed only 7 cases of significant differences over 24 total measurements between net growth rates measured with and without nutrient addition, 3 cases during the prebloom period and 4 cases in the postbloom period (Supplementary Data; Supp. Figure 2).
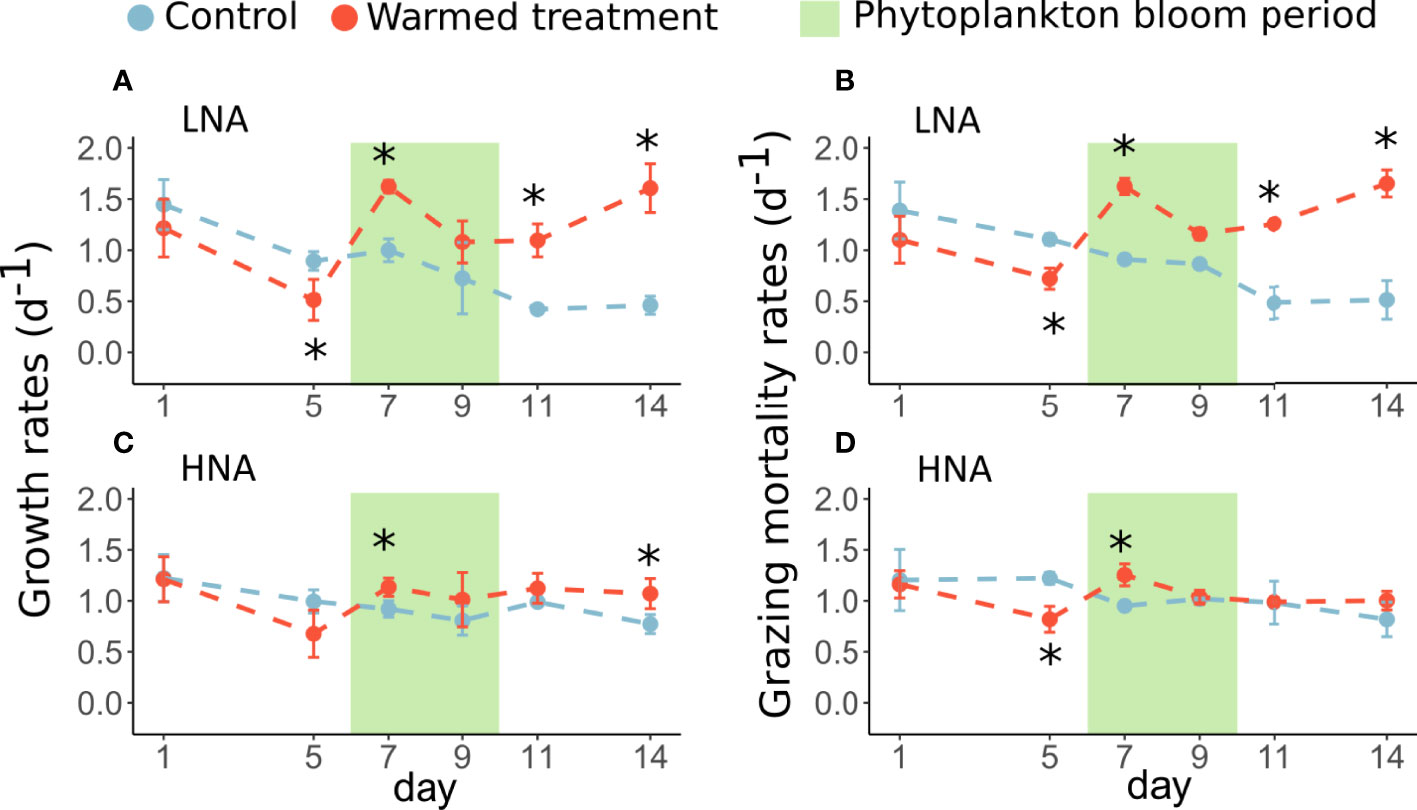
Figure 5 Dynamics of the mean (± standard deviations) growth and grazing mortality rates of LNA (A, B) and HNA (C, D) groups in the control (blue) and warmed (red) treatments estimated from the dilution method. The error bars represent the standard deviations from the means. The stars (*) represent a significant difference ( p < 0.05) in the mean growth or grazing mortality rates between the control and warmed treatments. The green rectangle highlights the period of phytoplankton bloom.
The comparison of the grazing mortality rates of bacteria between the treatments was similar to the comparison previously described for their growth rates. Indeed, the grazing mortality rates of the bacterial groups were higher in the warmed treatment than in the control during the bloom and postbloom periods. This trend was significant for LNA, with increasing rates from 35 to 224% from day 5 to 14, and was less marked for HNA, with grazing mortality rates reaching a maximum increase of 32% during the bloom (Figures 5B, D; Table 2).
Effect of Warming on Estimated Carbon Biomass Production and Transfer
Phytoplankton C-biomass production based on Chl-a measurements in dilution experiments in the control ranged from 2 to 103 µg C L-1, while the C-biomass transfer ranged from 8 to 144 µg C L-1 (Figures 6A, C). Bacteria C-biomass production in the control ranged from 28 to 101 µg C L-1, and bacterial C-biomass transfer ranged from 38 to 99 µg C L-1 (Figures 6A, C). Bacteria represented 36 to 98% of the total C-biomass production and 30 to 92% of the total C-biomass transfer in the control treatment.
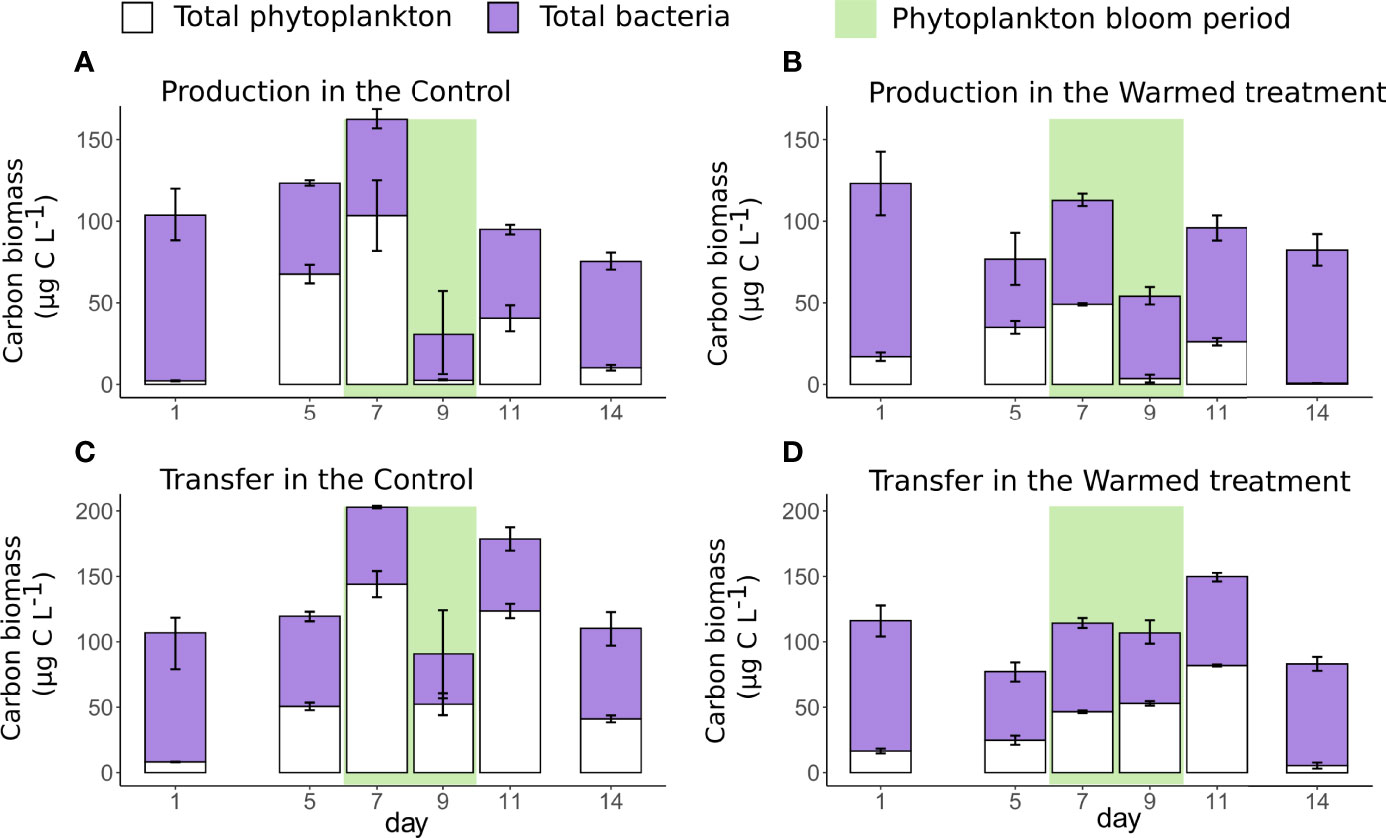
Figure 6 Mean (± standard deviations) of carbon biomass production (A, B) and carbon biomass transfer (C, D) of total phytoplankton (white), based on Chl-a measurements and total bacteria (purple), based on the cytometric analysis, in the control (left figure) and warmed (right figure) treatments. The green rectangle highlights the period of phytoplankton bloom.
Comparison of C-biomass production and transfer between treatments revealed that phytoplankton C-biomass production was significantly reduced by 36 to 95% under warming (Figure 6B; Table 2). Similarly, phytoplankton C-biomass transfer was also significantly depressed by 34 to 87% under warming (Figure 6D; Table 2). In contrast, bacterial C-biomass production and transfer were generally higher in the warmed treatment than in the control, especially during the bloom and postbloom by 8 to 80% and 13 to 40%, respectively (Figures 6B, D). Overall, in the warmed treatment, bacteria represented higher proportions of the total C-biomass production (54 to 99%) and higher proportions of the total C-biomass transfer (50 to 93%). Considering the 6 days during which phytoplankton and bacteria C-biomass production and transfer were estimated, the total C-biomass production and transfer were reduced by 8% and 20%, respectively.
Discussion
Warming Depressed Phytoplankton
A main result of the present in situ mesocosm study is that an increase of 3°C in the water temperature significantly depressed Chl-a concentrations, resulting in a 47% lower phytoplankton C-biomass, as well as 34 to 95% lower phytoplankton C-biomass production and transfer. The phytoplankton community biomass was dominated by the small phytoeukaryotes size fraction (< 10 µm), which represented at least half and up to 94% of the Chl-a biomass. Both eukaryotic picophytoplankton and nanophytoplankton abundances were depressed under warming, contrary to multiple previous studies showing that small phytoplankton usually benefit from warmer waters (Winder et al., 2009; Morán et al., 2010; Pulina et al., 2016; Trombetta et al., 2019). However, the stronger decrease in total phytoplankton Chl-a biomass compared to those of pico and nanophytoplankton abundances suggested that warming also affected negatively microphytoplankton. Indeed, microphytoplankton and nanophytoplankton contributed mostly to the bloom, as expected in the natural waters of the Thau lagoon during spring according to previous observations (Bec et al., 2005; Trombetta et al., 2019). This negative effect of warming on phytoplankton biomass coincided with a significant decrease in orthophosphate concentration during the prebloom and bloom periods which potentially resulted from bacteria assimilation. Indeed, in contrast to the phytoplankton biomass decrease, bacteria benefitted from warming as LNA abundances were significantly higher under warming in prebloom and bloom periods as well as HNA under warming in prebloom. Previous studies have reported that warming could accentuate competition between phytoplankton and bacteria for nutrients (Kordas et al., 2011; Courboulès et al., 2021). Even though the phytoplankton inorganic nutrient limitation estimated during the dilution experiments in prebloom and bloom periods was not stronger under warming (Supplementary Data; Supp. Figure 2), bacteria potentially outcompeted phytoplankton for orthophosphate assimilation under warming, leading to the lower phytoplankton biomass in the warmed treatment. In line with this, nitrite + nitrate and silicate concentrations were not consumed and were accumulated under warming, probably due to this negative effect of warming on phytoplankton groups including those relying on silicates as diatoms.
The grazing mortality rates of phytoplankton also tended to be higher under warming and could have contributed to the lower phytoplankton biomass. It was significantly the case for picophytoplankton from day 5 to 11, while larger phytoplankton displayed a non-significant trend of higher grazing mortality rates during the bloom and postbloom periods on days 9 and 11. It should be noted that in the present study, the statistical tests performed on dilution experiment data were limited due to a low amount of data points. However, the trend of higher grazing mortality rates of phytoplankton under warming is supported by a previous study showing that warming positively affects grazer activity (Rose et al., 2009), and mesocosm investigations suggesting that higher grazing in warmer water is the main factor explaining the decrease in phytoplankton biomass (Aberle et al., 2007; Sommer and Lengfellner, 2008; O’Connor et al., 2009).
In addition to the higher grazing mortality rates reported under warming, higher abundances of one virus group (V2) was observed in the present study under warming. Based on flow cytometry analysis, Marie et al. (1999) suggested that the larger V2 population could be infectious of phytoplankton while the smaller V1 population could be bacteriophages. Hence, it could be hypothesized that the higher abundance of V2 population under warming may have led to stronger viral lysis on phytoplankton that could have contributed to the diminution in phytoplankton biomass in the warmed treatment.
Furthermore, the growth rates estimated for eukaryotic picophytoplankton and small nanophytoplankton were significantly depressed under warming at the beginning of the bloom (day 7), notably when the growth rates attained their maximal values during the experiment. These results challenge previous findings, as it is widely known that an increase in temperature enhances growth rates in general (Eppley, 1972). As bacterial growth was enhanced by warming during the bloom simultaneously to the depression in phytoplankton growth, it further supports the previously emitted hypothesis that competition between phytoplankton and bacteria for available orthophosphate concentrations could have occurred under warming at the expense of phytoplankton (Rivkin and Anderson, 1997), causing the reduction of their growth rates at the beginning of the bloom period. Alternatively to this hypothesis the natural temperature variation observed in the control treatment, from 12.5 to 18.5°C, was typical of the Thau Lagoon during the spring period (Trombetta et al., 2019). Even with + 3°C in the warmed treatment, the temperature never exceeded the optimal temperature conditions for phytoplankton growth (Thomas et al., 2012; Chen, 2015b), and the high water temperature observed during this experiment cannot explain such an unexpected response to warming.
If the depression of growth rates under warming observed at the beginning of the bloom is unusual, the positive effect of warming on growth rates observed during the postbloom period is in complete agreement with previous studies. Notably, it is in agreement with results obtained during an identical mesocosm setup experiment in Thau Lagoon but in the autumnal season (Courboulès et al., 2021), and more generally, this result is in agreement with other studies reporting a general positive effect of warming on phytoplankton growth rates (Eppley, 1972; Savage et al., 2004; Lewandowska et al., 2014). Despite the very low abundances of cyanobacteria in our study, warming seemed to increase their abundances and growth rates. This result is in accordance with previous studies that reported positive correlations between cyanobacteria and temperature as described in mesocosm studies (Maugendre et al., 2015) and in situ (Chen and Laws, 2017), in agreement that due to high activation energy cyanobacteria prefer high water temperature (Chen and Laws, 2017).
Warming Favoured LNA but Not HNA
Bacteria were highly abundant during the experiment, as expected in Thau Lagoon (Mostajir et al., 2015; Trombetta et al., 2019; Courboulès et al., 2021). The high C-biomass of bacteria estimated during the study highlights the fact that bacteria play a major role in Thau Lagoon microbial community functioning. Among the wide range of marine bacterial growth rates (Ducklow, 1983), HNA and LNA depicted rather high growth rates, as well as high grazing mortality rates, similar to what has been previously described in the Mediterranean Sea (Ferrera et al., 2011) and more particularly in Thau Lagoon (Courboulès et al., 2021).
In contrast to the clear negative effect of warming on the phytoplankton community, there were almost no changes in total bacteria C-biomass between treatments. However, differences were reported between the LNA and HNA groups, with LNA being generally more abundant and HNA being less abundant under warming during the bloom and postbloom periods, suggesting different factors controlling the two groups. Both LNA and HNA growth rates increased under warming in the present investigation, in agreement with previous work of Piontek et al. (2009), reporting similar results in warmed indoor mesocosms and supporting the previously described positive relationship between bacteria growth rate and temperature (White et al., 1991). Regarding grazing mortality rates on LNA and HNA, the effect of warming on these bacterial groups differed. Grazing mortality of LNA increased under warming, underlying the potential positive effect of warming on their grazers in accordance with previous studies reporting higher grazing on bacteria in warmer incubation conditions (Vaqué et al., 2009; Vázquez-Domínguez et al., 2012; Tsai et al., 2015). However, this was not the case for HNA, suggesting that HNA may not have been preferentially grazed under warming or that their grazers were different from those of LNA and were consequently affected differently by warming. LNA and HNA growth and grazing mortality rates dynamics were remarkably similar over the course of the experiment and harbored an almost identical pattern of response under warming. This suggested a tight coupling between both bacterial groups and their corresponding grazers and a tight top-down control over bacteria in both treatments.
The contrasted response in phytoplankton and bacteria growth rates during the bloom period and more generally in their dynamics under warming suggests an uncoupling between phytoplankton and bacteria during this experiment, and seems to corroborate our hypothesis whereby there was a competitive interaction between phytoplankton and bacteria for orthophosphate assimilation under warming in the present study. This contrasts with previous studies reporting tighter phytoplankton-bacteria coupling during spring bloom in the Baltic Sea under warming (Hoppe et al., 2008; von Scheibner et al., 2014). However, in marine waters, bacteria and phytoplankton production can also be independent from each other and be uncoupled (Fouilland and Mostajir, 2010). Notably, grazing mortality rates which were enhanced under warming could provide carbon-rich organic matter that can be used by bacteria instead of fresh phytoplankton carbon release, as the latter is itself potentially lower under warming due to the strong depression observed in phytoplankton biomass. Therefore, this could contribute to the uncoupling between bacterial dynamics and phytoplankton bloom.
Warming Induced a Shift Toward a More Bacterial-Based Microbial Food Web Functioning
Warming greatly affected the estimated transfer of C-biomass through both phytoplankton and bacteria components. On the one hand, the estimated phytoplankton C-biomass production and transfer decreased under warming. On the other hand, bacterial C-biomass production and transfer were enhanced in the warmed treatment during the bloom and postbloom periods. This trend is consistent with previous studies reporting higher bacterial secondary production in warmer indoor mesocosms (Müren et al., 2005; Hoppe et al., 2008). In line with this, the increase in the bacterial C-biomass production:phytoplankton C-biomass production ratio under warming in our study is consistent with other studies reporting a positive relationship between temperature and the bacterial production:phytoplankton production ratio (Ducklow, 2000; Hoppe et al., 2002).
This trend toward bacterial-based production and transfer of biomass under warming was also reported in a high mountain Mediterranean lake (Durán-Romero et al., 2020), suggesting that bacteria tend to play a greater role in carbon fluxes in the microbial food web under warming. Relying more on bacteria, the microbial food web functioning would be considerably affected, favoring bacterivorous or omnivorous predators at the expense of herbivores. Even if both phytoplankton and bacteria grazing mortality rates were enhanced under warming, the depression in phytoplankton biomass might have a negative effect on herbivores while favoring bacterivorous or omnivorous predators, which would benefit from a more abundant food source in comparison. Ultimately, the total C-biomass transfer would be impacted as the pathway to transfer bacterial C-biomass up to the microzooplankton would be longer through smaller grazers and more levels of predators. (Legendre and Le Fevre, 1995; Berglund et al., 2007). As a potential consequence, the bacterial-based channelling of C-biomass through the microbial food web could be less efficient, with a greater quantity of material losses (Cushing, 1989; Legendre and Le Fevre, 1995). However, this shift towards a bacterial dominated biomass production cannot be sustained over time, as the organic carbon is mainly derived from phytoplankton in a steady state condition. Nevertheless, in coastal areas, the bacterial production can also be supported by allochthonous organic matter brought for example by terrestrial runoff (Robinson, 2008; Fouilland and Mostajir, 2010; Fouilland and Mostajir, 2011; Meunier et al., 2017).
In summary, the present investigation highlighted that under warming, phytoplankton biomasses as well as their estimated C-biomass production and transfer were depressed partly due to a potential competition with bacteria for orthophosphate assimilation and partly to their higher grazing mortality. In contrast, bacteria C-biomass production and transfer increased mainly due to their higher growth rates under warming during the bloom and postbloom periods. Based on these results, we hypothesize that under a future scenario of coastal water temperature increase, the microbial food web shifts from phytoplankton biomass-dominated production and transfer to bacterial biomass-dominated production and transfer, which would ultimately affect the whole food web functioning, including higher trophic levels.
Data Availability Statement
The raw data supporting the conclusions of this article will be made available by the authors, without undue reservation.
Author Contributions
BM, FV and SM conceived and designed the study and managed the mesocosm experiments. All authors participated in the daily sampling. TT and JC analyzed the phytoplankton and bacteria samples by flow cytometry. JC performed the dilution experiment, and wrote the original draft of the manuscript. All authors participated in the revision of the final manuscript. All authors contributed to the article and approved the submitted version.
Funding
This study was part of the Photo-Phyto project funded by the French National Research Agency (ANR-14-CE02-0018).
Conflict of Interest
The authors declare that the research was conducted in the absence of any commercial or financial relationships that could be construed as a potential conflict of interest.
Publisher’s Note
All claims expressed in this article are solely those of the authors and do not necessarily represent those of their affiliated organizations, or those of the publisher, the editors and the reviewers. Any product that may be evaluated in this article, or claim that may be made by its manufacturer, is not guaranteed or endorsed by the publisher.
Acknowledgments
We thank the MEDIMEER crew, and especially David Parin, for the electronic device and realization of the water temperature increase during the experiment as well as Solenn Soriano and Rémi Valdes for their participation in the setup of the mesocosm experiment and daily sampling. We thank Maria Protopapa for her help during the dilution experiments and Emilie le Floc’h, Katharina Bading, Katerina Symiakaki and Ariadna Garcia-Astillero for helping with daily sampling. We thank Julien Dupont and Jean-Francois Thevenot for the sampling and HPLC analysis. Cytometry analyses were done with the support of LabEx CeMEB, an ANR “Investissements d’avenir” program (ANR-10- LABX-04-01).
Supplementary Material
The Supplementary Material for this article can be found online at: https://www.frontiersin.org/articles/10.3389/fmars.2022.878938/full#supplementary-material
References
Aberle N., Lengfellner K., Sommer U. (2007). Spring bloom succession, grazing impact and herbivore selectivity of ciliate communities in response to winter warming. Oecologia 150, 668–681. doi: 10.1007/s00442-006-0540-y
Aota Y., Nakajima H. (2001). Mutualistic relationships between phytoplankton and bacteria caused by carbon excretion from phytoplankton. Ecol. Res. 16, 289–299. doi: 10.1046/j.1440-1703.2001.00396.x
Arandia-Gorostidi N., Huete-Stauffer T. M., Alonso-Sáez L., G. Morán X. A. (2017). Testing the metabolic theory of ecology with marine bacteria: different temperature sensitivity of major phylogenetic groups during the spring phytoplankton bloom. Environ. Microbiol. 19, 4493–4505. doi: 10.1111/1462-2920.13898
Azam F. (1998). OCEANOGRAPHY: Microbial Control of Oceanic Carbon Flux: The Plot Thickens. Science 80- ) 280, 694–696. doi: 10.1126/science.280.5364.694
Baudoux A. C., Veldhuis M. J. W., Noordeloos A. A. M., Van Noort G., Brussaard C. P. D (2008). Estimates of virus- vs. grazing induced mortality of picophytoplankton in the North Sea during summer. Aquat. Microb. Ecol. 52, 69–82. doi: 10.3354/ame01207
Bec B., Husseini-Ratrema J., Collos Y., Souchu P., Vaquer A., (2005) Phytoplankton Seasonal Dynamics in a Mediterranean Coastal Lagoon: Emphasis on the Picoeukaryote Community. J Plankton Res 27:881–894. doi:10.1093/plankt/fbi061
Berglund J., Müren U., Båmstedt U., Andersson A. (2007). Efficiency of a phytoplankton-based and a bacterial-based food web in a pelagic marine system. Limnol. Oceanogr. 52, 121–131. doi: 10.4319/lo.2007.52.1.0121
Brown J. H., Gillooly J. F., Allen A. P. VM, Savage VM, West G. B. (2004). Toward a Metabolic Theory of Ecology. Ecology 85, 1771–1789. doi: 10.1890/03-9000
Brussaard C. P. D. (2004). Optimization of Procedures for Counting Viruses by Flow Cytometry. Appl. Environ. Microbiol. 70, 1506–1513. doi: 10.1128/AEM.70.3.1506-1513.2004
Calbet A., Landry M. R. (2004). Phytoplankton growth, microzooplankton grazing, and carbon cycling in marine systems. Limnol. Oceanogr. 49, 51–57. doi: 10.4319/lo.2004.49.1.0051
Chen B. (2015a). Assessing the accuracy of the “two-point” dilution technique. Limnol. Oceanogr. Methods 13, 521–526. doi: 10.1002/lom3.10044
Chen B. (2015b). Patterns of thermal limits of phytoplankton. J. Plankton. Res. 37, 285–292. doi: 10.1093/plankt/fbv009
Chen B., Laws E. A. (2017). Is there a difference of temperature sensitivity between marine phytoplankton and heterotrophs? Limnol. Oceanogr. 62, 806–817. doi: 10.1002/lno.10462
Courboulès J., Vidussi F., Soulié T., Mas S., Pecqueur D., Mostajir B. (2021). Effects of experimental warming on small phytoplankton, bacteria and viruses in autumn in the Mediterranean coastal Thau Lagoon. Aquat. Ecol. 55, 647–666. doi: 10.1007/s10452-021-09852-7
Cushing D. H. (1989). A difference in structure between ecosystems in strongly stratified waters and in those that are only weakly stratified. J. Plankton. Res. 11, 1–13. doi: 10.1093/plankt/11.1.1
Ducklow H. W. (1983). Production and Fate of Bacteria in the Oceans. Bioscience 33, 494. doi: 10.2307/1309138
Ducklow H. (2000) Bacterial production and biomass in the oceans. Micro. Ecol. oceans, 1, 85-120. Wiley-Liss, New York
Durán-Romero C., Medina-Sánchez J. M., Carrillo P. (2020). Uncoupled phytoplankton-bacterioplankton relationship by multiple drivers interacting at different temporal scales in a high-mountain Mediterranean lake. Sci. Rep. 10, 1–11. doi: 10.1038/s41598-019-57269-y
Ferrera I., Gasol J. M., Sebastián M., Hojerová E., Koblížek M., & (2011). Comparison of Growth Rates of Aerobic Anoxygenic Phototrophic Bacteria and Other Bacterioplankton Groups in Coastal Mediterranean Waters. Applied and Environmental Microbiology, 77(21), 7451-7458.
Field C. B. (1998). Primary Production of the Biosphere: Integrating Terrestrial and Oceanic Components. Science 80- ) 281, 237–240. doi: 10.1126/science.281.5374.237
Fouilland E., Mostajir B. (2010). Revisited phytoplanktonic carbon dependency of heterotrophic bacteria in freshwaters, transitional, coastal and oceanic waters. FEMS Microbiol. Ecol. 73, 419–429. doi: 10.1111/j.1574-6941.2010.00896.x
Fouilland E., Mostajir B. (2011). Complementary support for the new ecological concept of ‘bacterial independence on contemporary phytoplankton production’ in oceanic waters. FEMS Microbiol. Ecol. 78, 206–209. doi: 10.1111/j.1574-6941.2011.01170.x
Harley C. D., Randall Hughes A., Hultgren K. M., Miner B. G., Sorte C. J., Thornber C. S., et al (2006). The impacts of climate change in coastal marine systems. Ecol. Lett. 9, 228–241. doi: 10.1111/j.1461-0248.2005.00871.x
Hoppe H. G., Breithaupt P., Walther K., Koppe R., Bleck S., Sommer U., Jürgens K. (2008). Climate warming in winter affects the coupling between phytoplankton and bacteria during the spring bloom: A mesocosm study. Aquat. Microb. Ecol. 51, 105–115. doi: 10.3354/ame01198
Hoppe H.-G., Gocke K., Koppe R., Begler C. (2002). Bacterial growth and primary production along a north–south transect of the Atlantic Ocean. Nature 416, 168–171. doi: 10.1038/416168a
Kemp P.F., Cole J.J., Sherr B.F., Sherr E.B., (1993) Handbook of Methods in Aquatic Microb. Ecol. CRC Press, Boca Raton.
IPCC (2014). Climate Change 2013 - The Physical Science Basis (Cambridge: Cambridge University Press).
Kordas R. L., Harley C. D. G., O’Connor M. I. (2011). Community ecology in a warming world: The influence of temperature on interspecific interactions in marine systems. J. Exp. Mar. Bio Ecol. 400, 218–226. doi: 10.1016/j.jembe.2011.02.029
Løvdal T., Eichner C., Grossart H. P., Carbonnel V., Chou L., Martin-Jézéquel V., et al (2007). Competition for inorganic and organic forms of nitrogen and phosphorous between phytoplankton and bacteria during an <I>Emiliania huxleyi</I> spring bloom (PeECE II). Biogeosciences. Discuss. 4, 3343–3375. doi: 10.5194/bgd-4-3343-2007
Landry M. R., Constantinou J.,, Latasa M., Brown S. L., Bidigare R. R., Ondrusek M. E. (2000). Biological response to iron fertilization in the eastern equatorial Pacific (IronEx II). III. Dynamics of phytoplankton growth and microzooplankton grazing. Mar. Ecol. Prog. Ser. 201, 57–72. doi: 10.3354/meps201057
Landry M. R., Hassett R. P. (1982). Estimating the grazing impact of marine micro-zooplankton. Mar. Biol. 67, 283–288. doi: 10.1007/BF00397668
Latasa M., Morán X. A. G., Scharek R., Estrada M. (2005). Estimating the carbon flux through main phytoplankton groups in the northwestern Mediterranean. Limnol. Oceanogr. 50, 1447–1458. doi: 10.4319/lo.2005.50.5.1447
Legendre L., Le Fevre J. (1995). Microbial food webs and the export of biogenic carbon in oceans. Aquat. Microb. Ecol. 9, 69–77. doi: 10.3354/ame009069
Lewandowska A. M., Boyce D. G., Hofmann M., Matthiessen B., Sommer U, Worm B (2014). Effects of sea surface warming on marine plankton. Ecol. Lett. 17, 614–623. doi: 10.1111/ele.12265
Lopez-Urrutia A. (2008). The metabolic theory of ecology and algal bloom formation. Limnol. Oceanogr. 53, 2046–2047. doi: 10.4319/lo.2008.53.5.2046
Lopez-Urrutia A., San Martin E., Harris R. P., Irigoien X. (2006). Scaling the metabolic balance of the oceans. Proc. Natl. Acad. Sci. 103, 8739–8744. doi: 10.1073/pnas.0601137103
Marie D., Brussaard C. P., Thyrhaug R., Bratbak G, Vaulot D (1999). Enumeration of Marine Viruses in Culture and Natural Samples by Flow Cytometry. Appl. Environ. Microbiol. 65, 45–52. doi: 10.1128/AEM.65.1.45-52.1999
Marie D., Partensky F., Jacquet S., Vaulot D. (1997). Enumeration and Cell Cycle Analysis of Natural Populations of Marine Picoplankton by Flow Cytometry Using the Nucleic Acid Stain SYBR Green I. Appl. Environ. Microbiol. 63, 186–193. doi: 10.1128/AEM.63.1.186-193.1997
Maugendre L., Gattuso J. P., Louis J., De Kluijver A., Marro S., Soetaert K., Gazeau F (2015). Effect of ocean warming and acidification on a plankton community in the NW Mediterranean Sea. ICES. J. Mar. Sci. 72, 1744–1755. doi: 10.1093/icesjms/fsu161
Menden-Deuer S., Fredrickson K. (2010). Structure-dependent, protistan grazing and its implication for the formation, maintenance and decline of plankton patches. Mar. Ecol. Prog. Ser. 420, 57–71. doi: 10.3354/meps08855
Meunier C. L., Liess A., Andersson A., Brugel S., Paczkowska J., Rahman H., Rowe O. F. (2017). Allochthonous Carbon Is a Major Driver of the Microbial Food Web–A Mesocosm Study Simulating Elevated Terrestrial Matter runoff. Marine environmental research, 129, 236-244.
Morán X. A. G., López-Urrutia Á, Calvo-Díaz A., LI W. K. W. (2010). Increasing importance of small phytoplankton in a warmer ocean. Glob. Chang. Biol. 16, 1137–1144. doi: 10.1111/j.1365-2486.2009.01960.x
Mostajir B., Roques C., Bouvier C., Bouvier T., Fouilland É., Got P., et al. (2015). Microbial food web structural and functional responses to oyster and fish as top predators. Mar. Ecol. Prog. Ser. 535, 11–27. doi: 10.3354/meps11429
Müren U., Berglund J., Samuelsson K., Andersson A. (2005). Potential Effects of Elevated Sea-Water Temperature on Pelagic Food Webs. Hydrobiologia 545, 153–166. doi: 10.1007/s10750-005-2742-4
Nouguier J., Mostajir B., Le Floc’h E., Vidussi F. (2007). An automatically operated system for simulating global change temperature and ultraviolet B radiation increases: application to the study of aquatic ecosystem responses in mesocosm experiments. Limnol. Oceanogr. Methods 5, 269–279. doi: 10.4319/lom.2007.5.269
O'Connor M. I., Piehler M. F., Leech D. M., Anton A., Bruno J. F. (2009). Warming and Resource Availability Shift Food Web Structure and Metabolism. PLos Biol. 7, e1000178. doi: 10.1371/journal.pbio.1000178
Piontek J., Händel N., Langer G., Wohlers J., Riebesell U.,, Engel A (2009). Effects of rising temperature on the formation and microbial degradation of marine diatom aggregates. Aquat. Microb. Ecol. 54, 305–318. doi: 10.3354/ame01273
Pomeroy L. R., Wiebe W. J. (1988). Energetics of microbial food webs. Hydrobiologia 159, 7–18. doi: 10.1007/BF00007363
Pörtner H.-O., Roberts D. C., Masson-Delmotte V., et al. (2019). The Ocean and Cryosphere in a Changing Climate Edited by Director of Science. IPCC Spec Rep Ocean Cryosph a Chang Clim Ed by Dir Sci.
Pulina S., Brutemark A., Suikkanen S., Padedda B. M., Grubisic L. M., Satta C. T., et al (2016). Effects of warming on a Mediterranean phytoplankton community. Web Ecol. 16, 89–92. doi: 10.5194/we-16-89-2016
Pulina S.,, Suikkanen S., Padedda B. M., Brutemark A., Grubisic L. M., Satta C. T., et al (2020). Responses of a Mediterranean coastal lagoon plankton community to experimental warming. Mar. Biol. 167, 22. doi: 10.1007/s00227-019-3640-z
Rivkin R. B., Anderson M. R. (1997). Inorganic nutrient limitation of ocean bacterioplankton42, 730–740.
Robinson C. (2008). “Heterotrophic Bacterial Respiration,” in Microb. Ecol. Ocean 2nd Edn, ed. Kirchman D. L. (Hoboken, NJ: Wiley), 299–334.
Rose J. M., Feng Y., Gobler C. J., Gutierrez R., Hare C. E., Leblanc K., Hutchins D. A. (2009). Effects of increased pCO2 and temperature on the North Atlantic spring bloom. II. Microzooplankton abundance and grazing. Mar. Ecol. Prog. Ser. 388, 27–40. doi: 10.3354/meps08134
Savage V. M., Gillooly J. F., Brown J. H., West G. B., Charnov E. L. (2004). Effects of Body Size and Temperature on Population Growth. Am. Nat. 163, 429–441. doi: 10.1086/381872
Sime-Ngando T., Gosselin M., Roy S., Chanut J. (1995). Significance of planktonic ciliated protozoa in the Lower St. Lawrence Estuary: comparison with bacterial, phytoplankton, and particulate organic carbon. Aquat. Microb. Ecol. 9, 243–258. doi: 10.3354/ame009243
Sommer U., Lengfellner K. (2008). Climate change and the timing, magnitude, and composition of the phytoplankton spring bloom. Glob. Chang. Biol. 14, 1199–1208. doi: 10.1111/j.1365-2486.2008.01571.x
Strom S. L., Fredrickson K. A. (2008). Intense stratification leads to phytoplankton nutrient limitation and reduced microzooplankton grazing in the southeastern Bering Sea. Deep. Res. Part II. Top. Stud. Oceanogr. 55, 1761–1774. doi: 10.1016/j.dsr2.2008.04.008
Thomas M. K., Kremer C. T., Klausmeier C. A., Litchman E. (2012). A Global Pattern of Thermal Adaptation in Marine Phytoplankton. Science 80- ) 338, 1085–1088. doi: 10.1126/science.1224836
Trombetta T., Vidussi F., Mas S., Parin D., Simier M., Mostajir B. (2019). Water temperature drives phytoplankton blooms in coastal waters. PLos One 14, e0214933. doi: 10.1371/journal.pone.0214933
Tsai A. Y., Gong G.-C., Shiau W. (2015). Viral lysis and nanoflagellate grazing on prokaryotes: effects of short-term warming in a coastal subtropical marine system. Hydrobiologia 751, 43–54. doi: 10.1007/s10750-014-2170-4
Vaqué D., Guadayol Ò., Peters F., Felipe J., Malits A., Pedrós-Alió C. (2009). Differential response of grazing and bacterial heterotrophic production to experimental warming in Antarctic waters. Aquat. Microb. Ecol. 54, 101–112. doi: 10.3354/ame01259
Vaquer A., Troussellier M., Courties C., Bibent B. (1996). Standing stock and dynamics of picophytoplankton in the Thau Lagoon (northwest Mediterranean coast). Limnol. Oceanogr. 41, 1821–1828. doi: 10.4319/lo.1996.41.8.1821
Vázquez-Domínguez E., Vaqué D., Gasol J. (2012). Temperature effects on the heterotrophic bacteria, heterotrophic nanoflagellates, and microbial top predators of the NW Mediterranean. Aquat. Microb. Ecol. 67, 107–121. doi: 10.3354/ame01583
Vidussi F., Mostajir B., Fouilland E., Le Floc'H E., Nouguier J., Roques C.. (2011). Effects of experimental warming and increased ultraviolet B radiation on the Mediterranean plankton food web. Limnol. Oceanogr. 56, 206–218. doi: 10.4319/lo.2011.56.1.0206
von Scheibner M., Dörge P., Biermann A., Sommer U., Hoppe H. G., Jürgens K (2014). Impact of warming on phyto-bacterioplankton coupling and bacterial community composition in experimental mesocosms. Environ. Microbiol. 16, 718–733. doi: 10.1111/1462-2920.12195
White P. A., Kalff J., Rasmussen J. B., Gasol J. M. (1991). The Effect of Temperature and Algal Biomass on Bacterial Production and Specific Growth Rate in Freshwater and Marine Habitats. Microb. Ecol. 21(1), 99-118.
Winder M., Reuter J. E., Schladow S. G. (2009). Lake warming favours small-sized planktonic diatom species. Proc. R. Soc. B. Biol. Sci. 276, 427–435. doi: 10.1098/rspb.2008.1200
Worden A. Z., Binder B. J. (2003). Application of dilution experiments for measuring growth and mortality rates among Prochlorococcus and Synechococcus populations in oligotrophic environments. Aquat. Microb. Ecol. 30, 159–174. doi: 10.3354/ame030159
Keywords: biomass production, biomass transfer, grazing mortality rate, growth rate, heterotrophic bacteria,in situ mesocosm, phytoplankton, warming
Citation: Courboulès J, Mostajir B, Trombetta T, Mas S and Vidussi F (2022) Warming Disadvantages Phytoplankton and Benefits Bacteria During a Spring Bloom in the Mediterranean Thau Lagoon. Front. Mar. Sci. 9:878938. doi: 10.3389/fmars.2022.878938
Received: 18 February 2022; Accepted: 09 June 2022;
Published: 14 July 2022.
Edited by:
Alberto Basset, University of Salento, FranceReviewed by:
Andrew J. Irwin, Dalhousie University, CanadaKalle Olli, Estonian University of Life Sciences, Estonia
Copyright © 2022 Courboulès, Mostajir, Trombetta, Mas and Vidussi. This is an open-access article distributed under the terms of the Creative Commons Attribution License (CC BY). The use, distribution or reproduction in other forums is permitted, provided the original author(s) and the copyright owner(s) are credited and that the original publication in this journal is cited, in accordance with accepted academic practice. No use, distribution or reproduction is permitted which does not comply with these terms.
*Correspondence: Justine Courboulès, anVzdGluZS5jb3VyYm91bGVzQGNucnMuZnI=; Behzad Mostajir, YmVoemFkLm1vc3RhamlyQHVtb250cGVsbGllci5mcg==