
95% of researchers rate our articles as excellent or good
Learn more about the work of our research integrity team to safeguard the quality of each article we publish.
Find out more
ORIGINAL RESEARCH article
Front. Mar. Sci. , 19 May 2022
Sec. Marine Fisheries, Aquaculture and Living Resources
Volume 9 - 2022 | https://doi.org/10.3389/fmars.2022.872537
 Natalia Petit-Marty1*
 Min Liu2
 Iris Ziying Tan1
 Arthur Chung1Bàrbara Terrasa3Beatriz Guijarro4
 Francesc Ordines4
 Sergio Ramírez-Amaro3,4Enric Massutí4
 Celia Schunter1*
Exploited fish species may have or are experiencing declines in population sizes coupled with changes in their environmental conditions owing to global change. Declining populations might lead to a decrease in genetic diversity, which in turn may produce losses of adaptive potential to face current and future environmental changes. Thus, this study aims to answer a simple, even naive question, given the complexity of the subject: Could we use a simple method to obtain information on the loss of genetic diversity in exploited fish species? We investigated the use of the levels of genetic diversity in the widely used genetic marker Cytochrome C Oxidase subunit I (COI) mitochondrial gene. Estimates of genetic diversity in COI were obtained for populations of seven fish species with different commercial importance from the East China Sea. These estimates were contrasted against large datasets of genetic diversity in COI for fish species (East-Asian N=118, and worldwide N=1425), and six control species with known biology and history. We found that estimates of genetic diversity in COI match the expectations from theoretical predictions and known declines by fishing pressures. Thus, the answer to our question is affirmative and we conclude that estimates of genetic diversity in COI provide an effective first diagnostic of the conservation status of exploited fish species.
The exploitation of species’ wild populations can produce declines in population sizes, and even drive species to extinction (Hutchings and Reynolds, 2004; Allendorf et al., 2008). Such exploitation has the potential to cause three types of genetic change: alteration of population structure and connectivity, selection induced genetic changes, and loss of genetic diversity (Allendorf et al., 2008; Gandra et al., 2021). Moreover, global-change related impacts on marine environments such as climate change and habitat degradation are already impacting fish populations, increasing their risk of local extinction (Sumaila and Tai, 2020). As genetic diversity is the raw material for natural selection allowing species to adapt to new environmental conditions, its loss will decrease species adaptive potentials (Spielman et al., 2004; Conover et al., 2006; Allendorf et al., 2008; Hare et al., 2011; Pinsky and Palumbi, 2014; Bernatchez et al., 2017; Gandra et al., 2021). Hence, exploited species with eroded genetic diversity can be threatened by the loss of their adaptive potential to respond to changes in their environments owing to global change.
Fish species have been exploited for several decades decreasing their population abundances and changing their age composition (Hutchings and Reynolds, 2004; FAO, 2020; Sumaila and Tai, 2020). However, the evidence of loss of genetic diversity by this exploitation has been rather contradictory with some studies showing decreased genetic diversity in exploited species (e.g. Hauser et al., 2002; Pinsky and Palumbi, 2014) but others did not (e.g. Pinsky et al., 2021). Pinsky and Palumbi (2014) addressed the question of the loss of genetic diversity in exploited fish species by a meta-analysis comparing genetic diversity estimates based on microsatellite genetic markers from exploited and non-exploited species, finding allelic richness loss in highly exploited fish populations. Moreover, Gandra et al. (2021) found a significant correlation between fish commercial importance and genetic structure, suggesting that commercially exploited species exhibit lower levels of genetic differentiation among populations. Nonetheless, genetics is rarely taken into account in fisheries management with the potential outcome of a hidden loss of adaptive potential to environmental changes in exploited fish species (Hauser and Carvalho, 2008; Allendorf et al., 2014; Pinsky and Palumbi, 2014; Ovenden et al., 2015; Casey et al., 2016; Bernatchez et al., 2017; Bryndum-Buchholz et al., 2021; Ovando et al., 2021; Gandra et al., 2021). Implementation of genetic evaluations for fish stocks in fisheries has been challenging. Reasons for this are that studies with more traditional microsatellite markers can be laborious and while new sequencing technologies are powerful to address these subjects (Hauser and Seeb, 2008; Bernatchez et al., 2017), specific training is required and high-throughput sequencing is costly, hence limiting the number of species to be studied.
Mitochondrial genetic markers have been used for phylogenetic and population genetics studies for many years. And more recently the use of Cytochrome Oxidase subunit I (COI) mitochondrial gene has widely increased for species identification (Ratnasingham and Hebert, 2007). Although the extensive use of this marker has raised some criticism because mitochondrial genome evolution has different characteristics than the nuclear genome such as haploidy, lack of recombination, and uniparental inheritance; the use of mitochondrial genetic markers gives very valuable information for under-studied species (Rubinoff and Holland, 2005). Therefore, if the differences and limitations of mitochondrial molecular markers are taken into account, their use can provide preliminary insights into population changes. For example, declines in population sizes are expected to decrease genetic diversity in both, mitochondrial and nuclear genomes as exhibited in threatened mammal species (e.g. Casas-Marce et al., 2017; van der Valk et al., 2018). Thus, despite uncertainties on how much mitochondrial genetic variation can inform on the overall evolutionary history of the species, it can inform on demographic changes, and especially on declines in population sizes. Petit-Marty et al. (2021) demonstrated that the level of genetic diversity in the COI mitochondrial gene can be used as a proxy of the species’ conservation status. By using a curated dataset of COI genetic diversity estimates for more than 4000 animal species, significant differences were revealed between threatened and non-threatened animal species assessed by the International Union of Conservation of Nature (IUCN). After accounting for many biases, differences in levels of genetic diversity in COI were associated with declines of population census in threatened species, because species assessed as threatened in IUCN show evidence of global decline whereas non-threatened species do not. Differences were especially significant for 1425 worldwide distributed fish species (Petit-Marty et al., 2021). Moreover, a more recent article found similar results in birds by using Cytochrome b mitochondrial gene (Canteri et al., 2021). Additionally, a positive correlation between mitochondrial and nuclear genetic diversity has been found for fish species (Piganeau and Eyre-Walker, 2009). Thereby, genetic diversity loss in mitochondrial genomes due to population declines correlates with the loss of genetic diversity in the nuclear genome and can therefore, inform on the conservation status of fish species populations.
Fisheries management, including fishing restrictions, varies widely across the globe (FAO, 2020; Bryndum-Buchholz et al., 2021; Ovando et al., 2021) as does the effect of fishing pressures, leading to the need for local assessments of fish populations. Data of stocks abundance and age composition for economically important species have been documented for decades (FAO, 2020; Ovando et al., 2021), yet fisheries statistics are poor for many fish species with minor economic importance. Ideally, the study of genetic diversity loss in wild populations would require samples from before and after species exploitation, however, such data is mostly not available for commercial fish species. Therefore, an alternative approach is to use comparative datasets of genetic diversity in related species (the so-called macro-genetics approach Blanchet et al., 2017). In this sense, the COI mitochondrial gene has the advantage to be widely studied as a barcode sequence in many species for their identification (Ratnasingham and Hebert, 2007). Therefore, hundreds of thousands of fish COI sequences are available in public databases (e.g. GenBank and Barcode of Life Data (BOLD) System), which can be used as comparative frameworks to assess the loss of genetic diversity under exploitation scenarios. Moreover, given its wide use as a genetic barcode, this molecular marker has the potential to be easily implemented in fisheries evaluations as getting sequences of many species does not require advanced training or huge budgets.
In this study we extend the results found in Petit-Marty et al. (2021) by evaluating populations of seven fish species accordingly to their levels of genetic diversity in COI. The evaluated fish species were collected from the East China Sea where there is evidence of an elevated exploitation (Chang et al., 2012; Liang and Pauly, 2017; Zhang et al., 2018; Sumaila, 2019; Teh et al., 2020; Zhang et al., 2020). The genetic diversity levels in COI were contrasted to large datasets of worldwide and East Asian fish species. As knowledge on the biology and population dynamics of the evaluated species is limited, we validate the results by a comparison to six control species with known biology and population dynamics. We aim to provide a first genetic approximation to the conservation status of a species’ population status which may be used as a guide to prioritizing management efforts.
Fixed nets were settled in 6 different locations within the Sansha Bay in Nindge, Fujian Province of China (East China Sea, Latitude: 119°43’-119°49’; Longitude: 26°34’-26°41’) once a month (full or new moon phase) from April to September of 2020. Fin clips were stored in alcohol 95% for the collected fish species. Overall, fin clips were stored for 43 species (Supplementary Table S1). We selected ten fish species with accumulated sample sizes larger than 30 individuals as representatives of the most abundant fish in Sansha Bay (Supplementary Table S1). One of the species, Larimichthys crocea, is not representative of wild populations but farmed resulting from long-term (since 2002), restocking activities in Sansha Bay after the natural populations were depleted in the 1980s (Liu and Sadovy de Mitcheson, 2008; Liu et al., 2020; Yuan et al., 2021), and it was taken as a negative control (i.e. expected low genetic diversity) in the evaluation of the other fish species. We also processed samples from another farmed species collected in Hong Kong waters, the hybrid Sabah grouper (Epinephelus fuscoguttatus females x E. lanceolatus males), which was also used as a negative control in the evaluation analysis. Both farmed species, L. crocea and sabah grouper very likely experienced a decrease in their levels of genetic diversity by the founder effect when starting the farms (Wang et al., 2012). Moreover, wild populations of L. crocea were assessed as critically endangered (Liu et al., 2020), while E. fuscoguttatus (female of the hybrid, Rhodes et al., 2018) had been assessed as vulnerable, and therefore both species presented evidence of decline in populations sizes >30% (i.e. the cut-off used in IUCN to classify a species as threatened) before starting farming. Additionally, we processed samples of four highly commercial fish species (Lophius budegassa, Merluccius merluccius, Mullus barbatus and Mullus surmuletus) from Balearic Islands (western Mediterranean, Latitude: 38°50’-40°50’; Longitude: 2°00’-4°50’) which present long-term managed fisheries and fishing restrictions. These species were collected during the MEDITS bottom trawl surveys in 2020, which are carried out annually during spring and early summer trough the Balearic Islands (for sampling protocol see Spedicato et al., 2019).
DNA was extracted from fin clips for 24 samples of the ten representative species from Fujian, 20 samples of the hybrid grouper from Hong Kong and among 19-45 samples from the four species of Balearic Islands using the DNAeasy blood and tissue Qiagen kit. COI mitochondrial gene was amplified by PCR following the protocol of Ivanova et al. (2007), with a final volume of 15 ul and 4 ul of DNA (1ng/ul) using the primers cocktail COI-3. PCR products were purified with the Qiagen PCR purifying kit and sequences were obtained by a Sanger sequencer from the Centre of PanorOmic Sciences of the University of Hong Kong using the same primers as in the PCR and 6-12 ng of purified PCR products. Sequences with average phred scores > 50 and samples sizes ≥ 19 were successfully achieved for nine out ten of the more abundant species collected in Fujian (i.e. all but C. oligolepis), the hybrid grouper, and the four species from Balearic Islands. All species were taxonomically identified by an expert and species identity by COI sequences was confirmed in BOLD system (http://www.boldsystems.org, Ratnasingham and Hebert, 2007). The taxonomic identity of the species was the same for the visual and molecular identification for all but one, S. fuscescens for which the identification at species level was not possible in BOLD system and therefore it was not included in further analyses.
Sequences were aligned using Muscle software (Edgar, 2004) and genetic diversity estimates (the average number of nucleotide differences per site between two sequences, π, Nei, 1987), and isolation index, FST, were obtained using DNAsp software (Rozas et al., 2017). We used π (Nei, 1987) genetic diversity estimates (COI-π) instead of Ɵ (Watterson, 1975) because the former is based in frequency and therefore, a better indicator of demographic changes (Tajima, 1989). Two different clades have been recognized by DNA barcoding in Trypauchen vagina (Thu et al., 2019), accordingly, the sequence identification in BOLD systems shows the presence of the two clades among our sequences. The two clades are genetically different (FST =0.97, pFst=0.018), and therefore, we only present the results for the major clade found in our dataset of T. vagina (N=15). Variation in estimates of genetic diversity based on samples sizes larger than 15 is lower than < 5e-4 in COI for species with COI-π < 0.01, (Petit-Marty et al., 2021), and thus, our estimates can be considered representative of the population. All sequences are deposited in NCBI nucleotide database with accession numbers: Collichthys lucidus: OL673515-OL673535; Crenimugil crenilabis: OL673809-OL673829; Harpadon nehereus: OL673927-OL673947; Larimichthys crocea: OL674152-OL674171; Lophius budegassa: OL674085-OL674103; Merluccius merluccius: OL684344-OL684384; Mullus barbatus: OL684891-OL684915; M. surmuletus: OL674197-OL674229; sabah-grouper: OL674054-OL674073; Stephanolepis cirrhifer: OL684530-OL684553; Takifugu oblongus: OL684869-OL684890; Thryssa vitrirostris: OL679101-OL679121; and Trypauchen vagina: OL684325-OL684339.
Overall trait data on the species, such as commercial importance, body size, geographic distribution, habitat, and generation times for the East Asia species were retrieved from Fishbase (https://www.fishbase.se; Froese and Pauly, 2021), IUCN species assessments (https://www.iucnredlist.org), and references of studies from individual species and fisheries assessments. Population trends and habitat information for Balearic Islands species was obtained from local assessments (Di Natale et al., 2011; Papakonstantinou et al., 2011; Guijarro et al., 2012; Guijarro et al., 2019a; Guijarro et al., 2019b), with the exception of L. budegassa, for which the Central Mediterranean data was used, the closest area where this stock has been assessed (Fiorentino et al., 2012).
Species were classified for their commercial importance as highly, minor, and not commercial. We considered highly commercial species those under fishing pressures in their whole distribution and traded in local, national, and international markets. Minor commercial, are species that are traded only in local and/or national markets and therefore, their levels of exploitation can vary across its distribution. Finally, not commercial are species not suitable for human consumption.
To investigate the confidence intervals (CIs) of COI genetic diversity values (COI-π) we used the dataset of fish species obtained by Petit-Marty et al. (2021) as a comparative framework (N=1425). As genetic diversity in fish has been related to latitude (Manel et al., 2020) and habitat preferences (Martinez et al., 2018), we also estimated regional 95% CIs filtering the worldwide dataset for species distribution (East Asia and Mediterranean) and habitats (Marine and Estuaries species for East-Asia, and Marine for Mediterranean). In order to get more conservative average estimates of genetic diversity in the regional datasets, the COI-π estimates based on sample sizes of N<15 or higher than the upper boundary of the mean 95% CI of the worldwide dataset were eliminated. The list of species and their estimated genetic diversity values used for the comparative frameworks of East-Asian and Mediterranean are presented in Supplementary Table S2. The 95% CI of the median and mean values of genetic diversity in COI were obtained by the boot package (Hesterberg, 2011) in R by bootstrapping 10,000 datasets of the mean and median values of π. The 95% CI of the mean and median values for a worldwide dataset of fish species (N= 1425) did not overlap between threatened (i.e. assessed as VU, EN, and CR in IUCN, N=112) and non-threatened fish species (i.e. assessed as LC at IUCN, N=1260) as previously showed in Petit-Marty et al., 2021 (Supplementary Figure S1). However, mean values are biased to high values owing to the not normal distribution of COI-π (Supplementary Figure S1). Thus, we used the more conservative 95% CI of median values calculated for East Asian fish species dataset (Supplementary Table S3) to set up the boundaries for the evaluation of East-Asia species. Thus, we took the 95% CI low and upper boundaries of East Asian species dataset to classify species according to the need of further research on their conservation status (First, Medium and Low Priority). The 95% CI of the COI-π median were slightly lower for Mediterranean than East-Asian species, while the 95% CI low boundary was coincident between East-Asia and worldwide distributed species (Supplementary Table S3).
Coalescent simulations are useful to inform on the expectations in decreases of genetic diversity by population declines under a neutral model of evolution. We used msms program to generate samples under a Wright-Fisher neutral model of genetic variation (Gutenkunst et al., 2009) simulating declines of population sizes. We evaluated a simple model that does not account for the complex dynamics of fish populations, but enhances the expectations of levels of genetic diversity under the effects of continued harvesting. In the simulations, the populations experienced a decline in population census in a given past time, with no recombination, no migration, and no further population expansion after declines. We used a value of starting genetic diversity of Ɵ=2.5 (~Neµ; Watterson, 1975) which is equivalent to the median value observed for East-Asian and worldwide fish species datasets (Supplementary Table S3). We tested different effective population sizes (10e4, 10e5, and 10e6), different degrees of declines in population sizes (10%, 30%, 50%, and 90%), and different times where the population decline occurs (1, 10, 100, 10e3, 10e4, and 10e5 generations ago) and evaluated the average values of the average pair-wise nucleotide differences among sequences of 650 base pairs for 1000 random samples of 20 individuals. Thus, 72 independent simulations were performed: three different effective population sizes; by four different magnitudes of population declines; and by six different times where declines happened in the past.
The evaluation of the species from Fujian (East China Sea) shows that four out of seven species (the two highly commercial: Harpadon nehereus, and Stephanolepis cirrhifer; and two minor commercial: Crenimugil crenilabis, and Trypauchen vagina) exhibit COI-π below those expected for 95% CI of the median for worldwide and East-Asian species (Figure 1 and Supplementary Table S3), and within the expectations for world-wide threatened species (Supplementary Figure S1). Therefore we classified these four species from Fujian with detected reduced values of COI-π as First Priority species for further research on their populations’ conservation status (Figure 1). The non-commercial fish Takifugu oblongus was the only species presenting COI-π levels higher than expected by the upper boundary of the 95% CI of the median for East-Asian species and was classified as Low Priority species, while the other two minor commercial species (T. vitrirostris, and C. Lucidus) showed averaged values of genetic diversity and were classified as Medium Priority species (Figure 1).
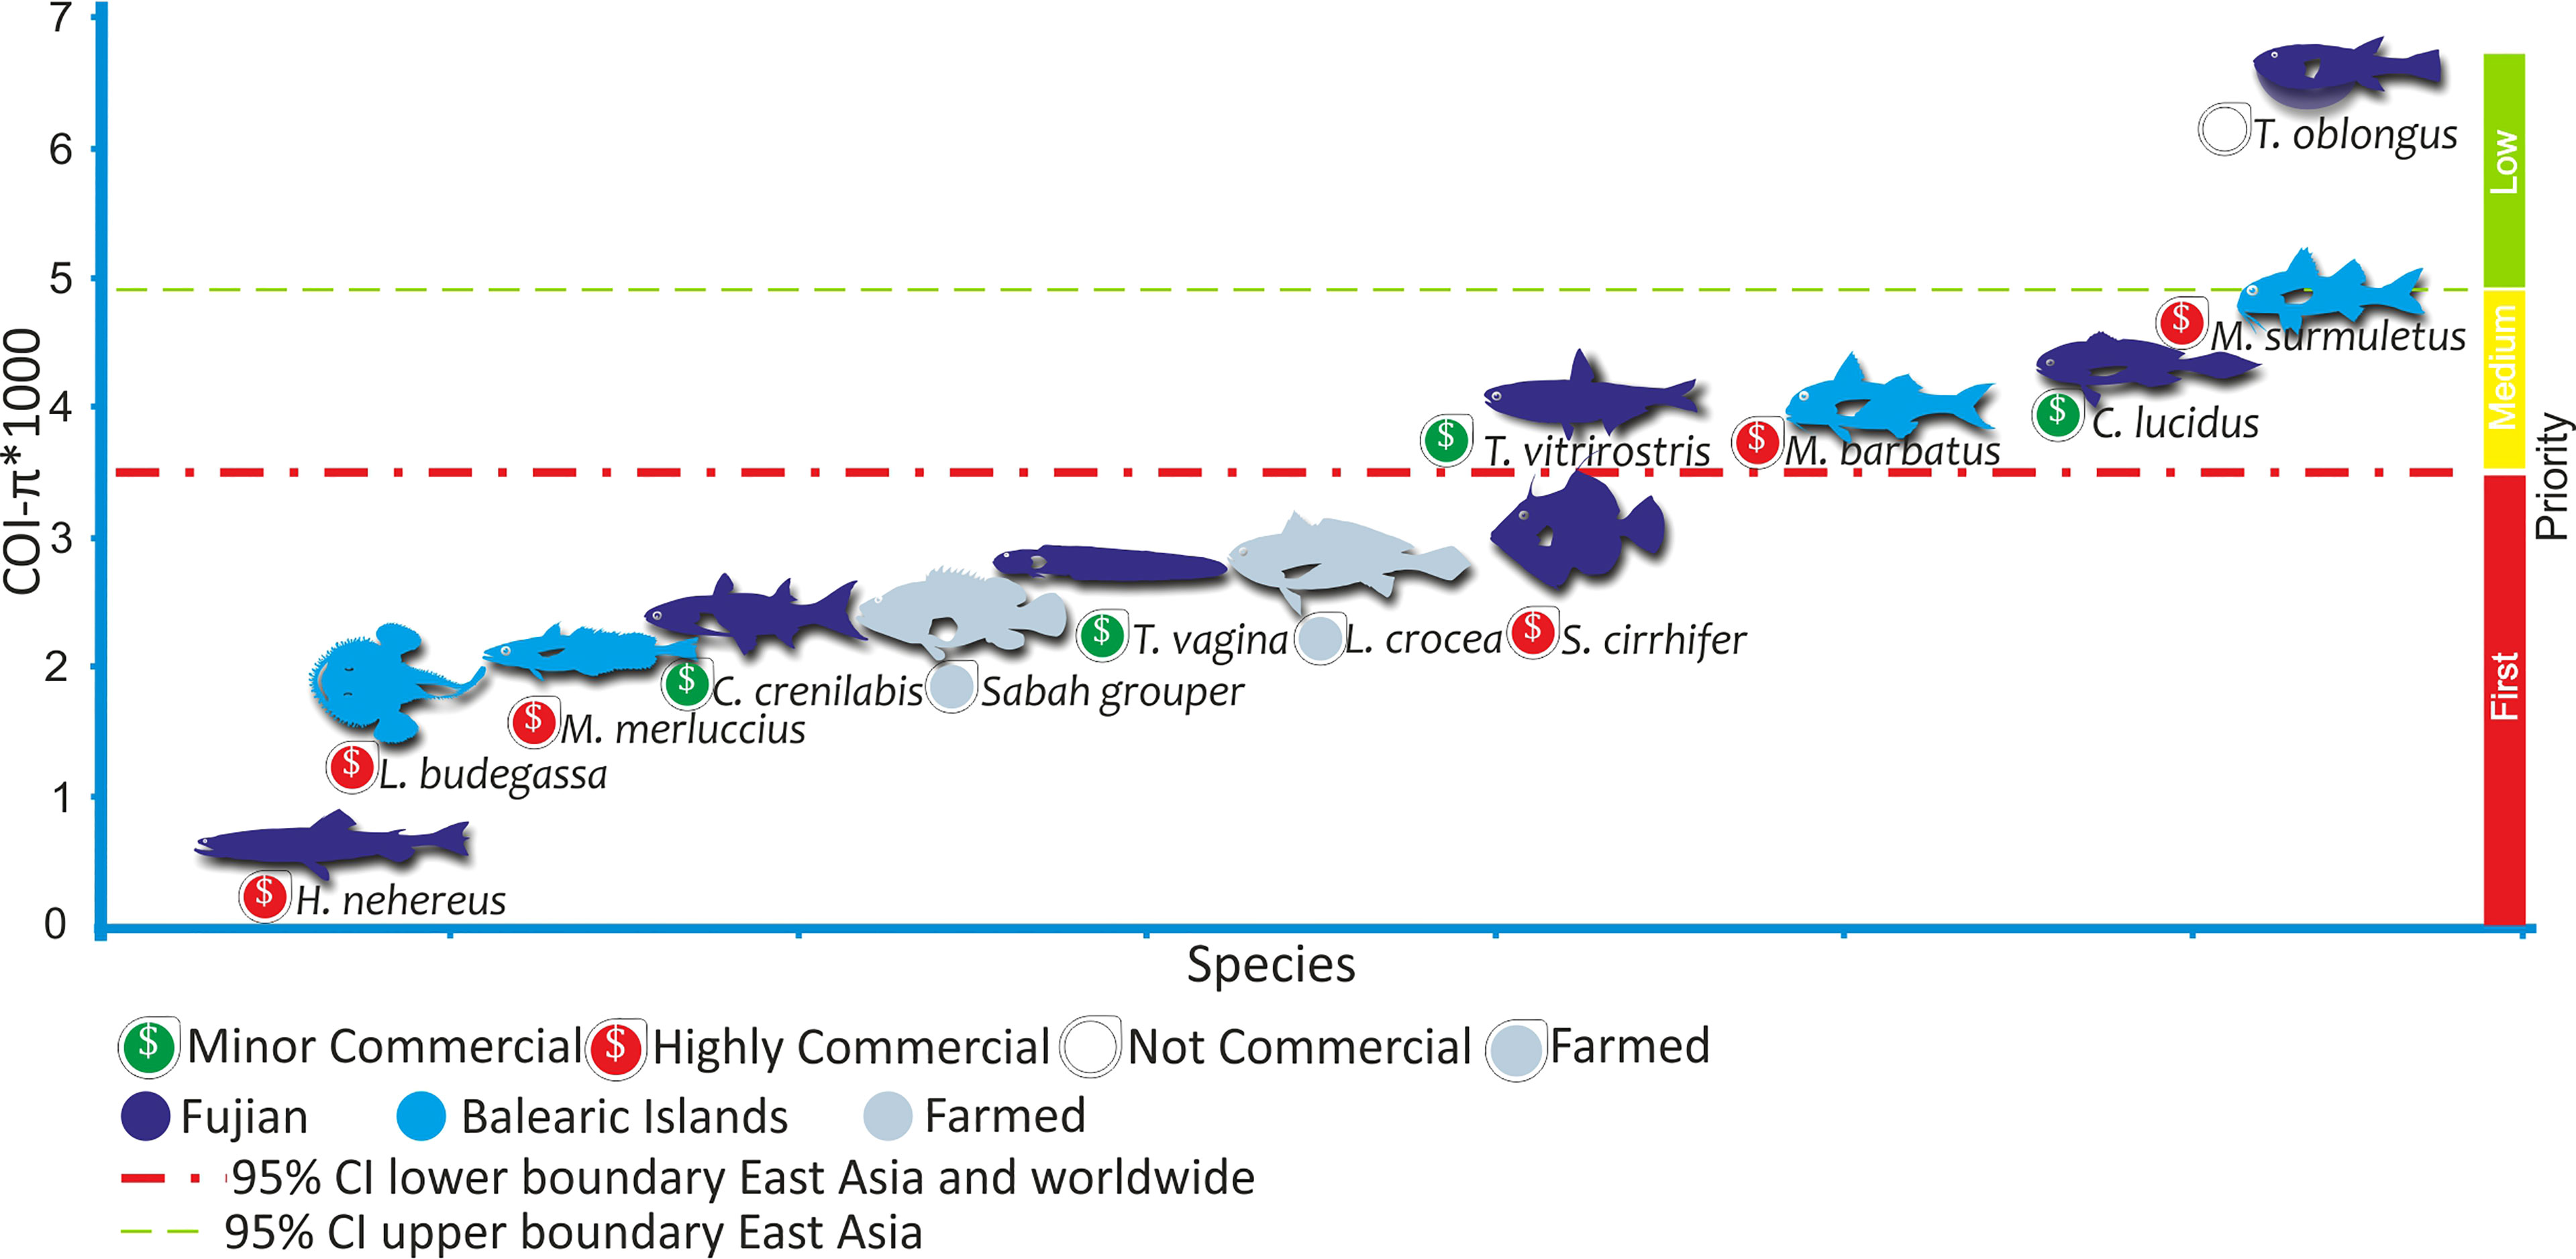
Figure 1 Levels of genetic diversity in COI mitochondrial gene (COI-π) of fish species. Species were ordered by their levels of COI-π and these were multiplied by 1,000 for graphical purposes. The red line shows the lower boundary of the 95%CI of the distribution of median genetic diversities values obtained by bootstrapping worldwide and East Asian fish datasets. The green line shows the upper boundary of the 95%CI of the median distribution of genetic diversity in East Asian fish. The upper-boundary of worldwide dataset was 0.004, while the 95%CI for Mediterranean species was 0.0028-0.0042 (Supplementary Table S3). Fish from Fujian are the evaluated species (dark blue) in this study. Both, fish from Balearic Islands (light blue) and farmed (grey) fishes were used as controls, as fish from the Balearic Islands are long-term managed species with known population dynamics, and the two farmed fish are expected to have low levels of genetic diversity. Highly commercial species are under fishing pressures in their whole distribution while fishing pressures are variable for minor commercial species. Credits for fish silhouettes: Gaston Petit.
We contrasted the levels of COI-π of these four First Priority species to those of two farmed species, L. crocea and the hybrid Sabah grouper, finding that the levels of COI-π in the farmed are lower than 95% CI low boundary of East-Asian species and similar or even higher than the First Priority species (Figure 1 and Table 1).
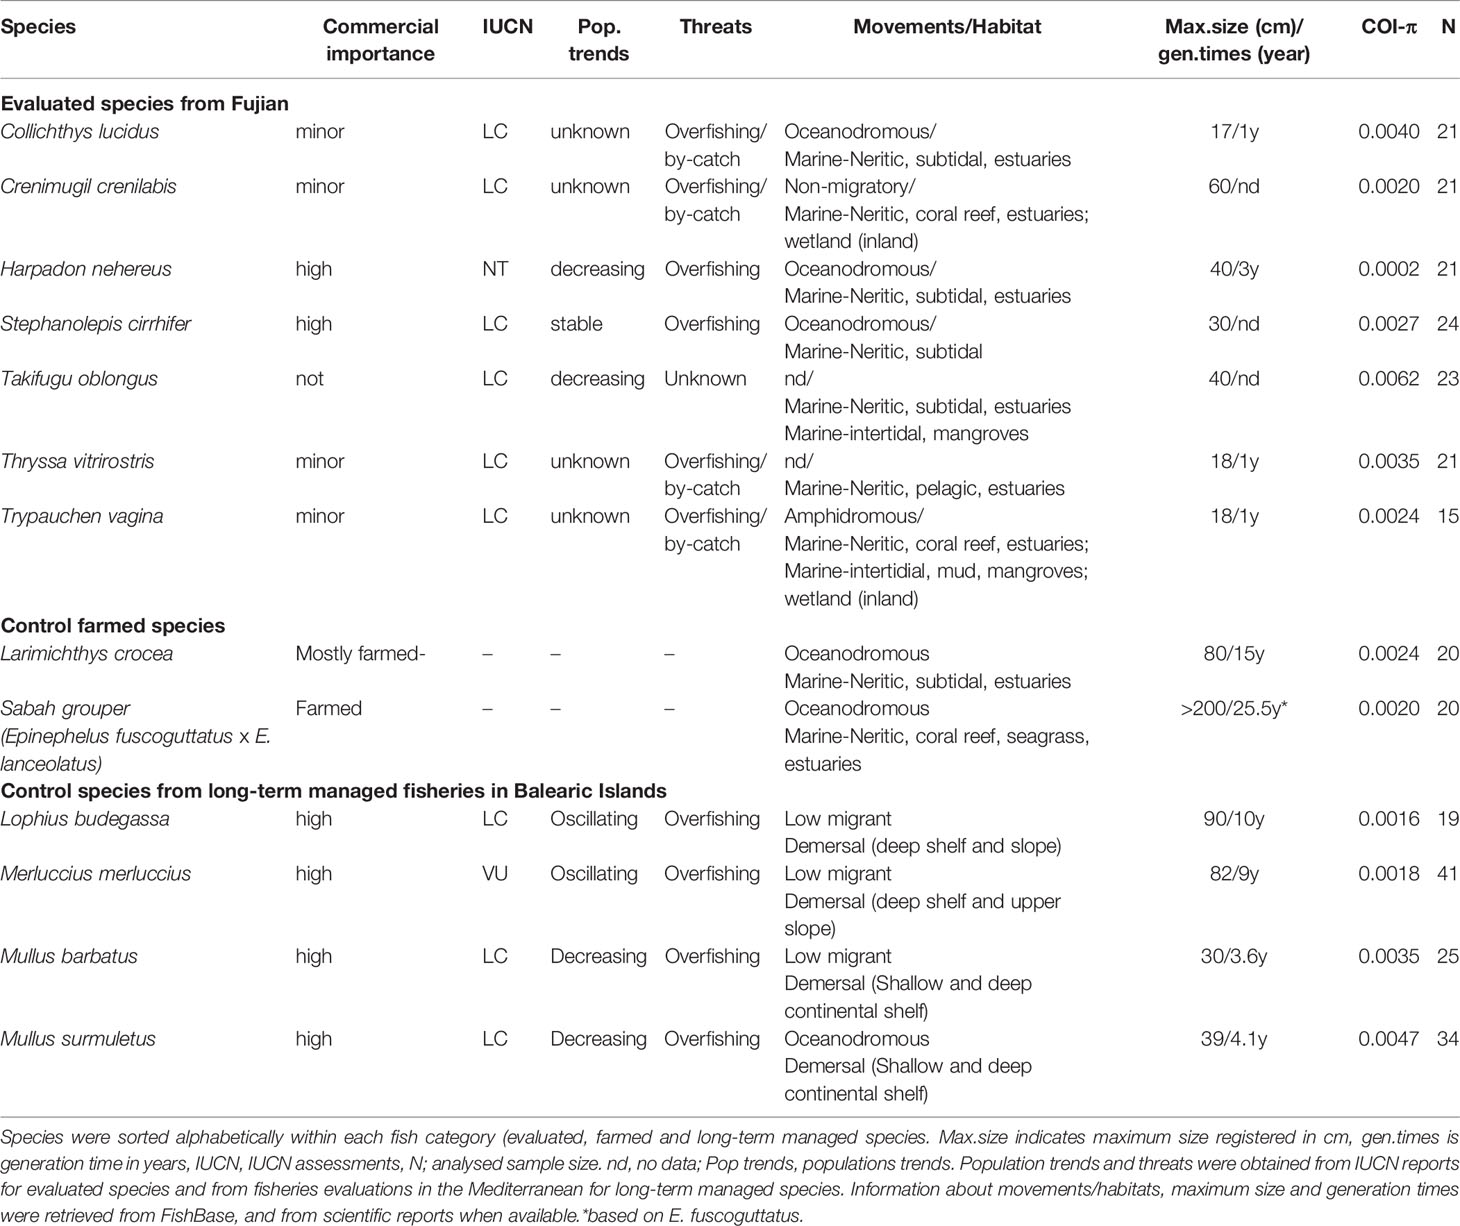
Table 1 Sampled fish species, their characteristics and genetic diversity estimates in COI mitochondrial gene (COI-π).
Comparing the levels of COI-π among the First Priority species and the long-term managed species from Balearic Islands show that the two species of Mullus (Mullus barbatus, and M. surmuletus; Table 1) presented levels of COI-π within the expected for the worldwide and Mediterranean dataset (Figure 1 and Supplementary Table S2). In contrast, the other two long-term managed species from Balearic Islands, M. merluccius and L. budegassa, show levels of COI-π below the low boundary of 95% CI for Mediterranean and worldwide species and similar to those of First Priority species (Figure 1 and Supplementary Table S2). The differences observed in the levels of COI-π among long-term managed species from Mediterranean Sea could be related to differences in generation times because M. merluccius and L. budegassa have longer generation times (~10 years) than the two small Mullus species (~4 years, Table 1) and First Priority species (≤ 3 years, for species with known generation times, Table 1).
Finally, we used coalescent simulations to find out what are the expectations in decreases of genetic diversity by population declines under a neutral model of evolution. The results of such simulations show that under a simple neutral model of molecular evolution and a reduction in population census, with no recombination, no migration and no population expansion after declines; the average decreases in levels of genetic diversity are proportional to the decline in population census produced in a time lapses smaller than Ne generations ago (i.e. in average nearly 10% of genetic diversity loss for 10% decline in census and so on, Figure 2). The time range when industrial exploitation of fish began is likely ≤ 100 generations ago. Within this time window (Figure 2) declines in genetic diversity produced by declines in population census are independent of the long-term Ne. We found that the average probability (among the three Ne tested) to find values of genetic diversity higher or equal to the starting value (i.e. Ɵ= 2.5) among 1000 generated neutral samples was p<0.005, 0.1, 0.2, and 0.4 for declines in populations census of 90%, 50%, 30%, and 10%, respectively. Therefore, strong declines in population census of 90% will significantly produce decreases in genetic diversity in all sampled populations, while softer population declines of around 50% could not show evidence of genetic diversity loss in around 10% of the sampled populations. Assuming that the average level of COI-π*1000 in fish is nearly 2.5, the simulations indicate that the species classified here as First Priority (Figure 1) could have experienced declines in population sizes from 23% in S. cirrhifer to 95% in H. nehereus.
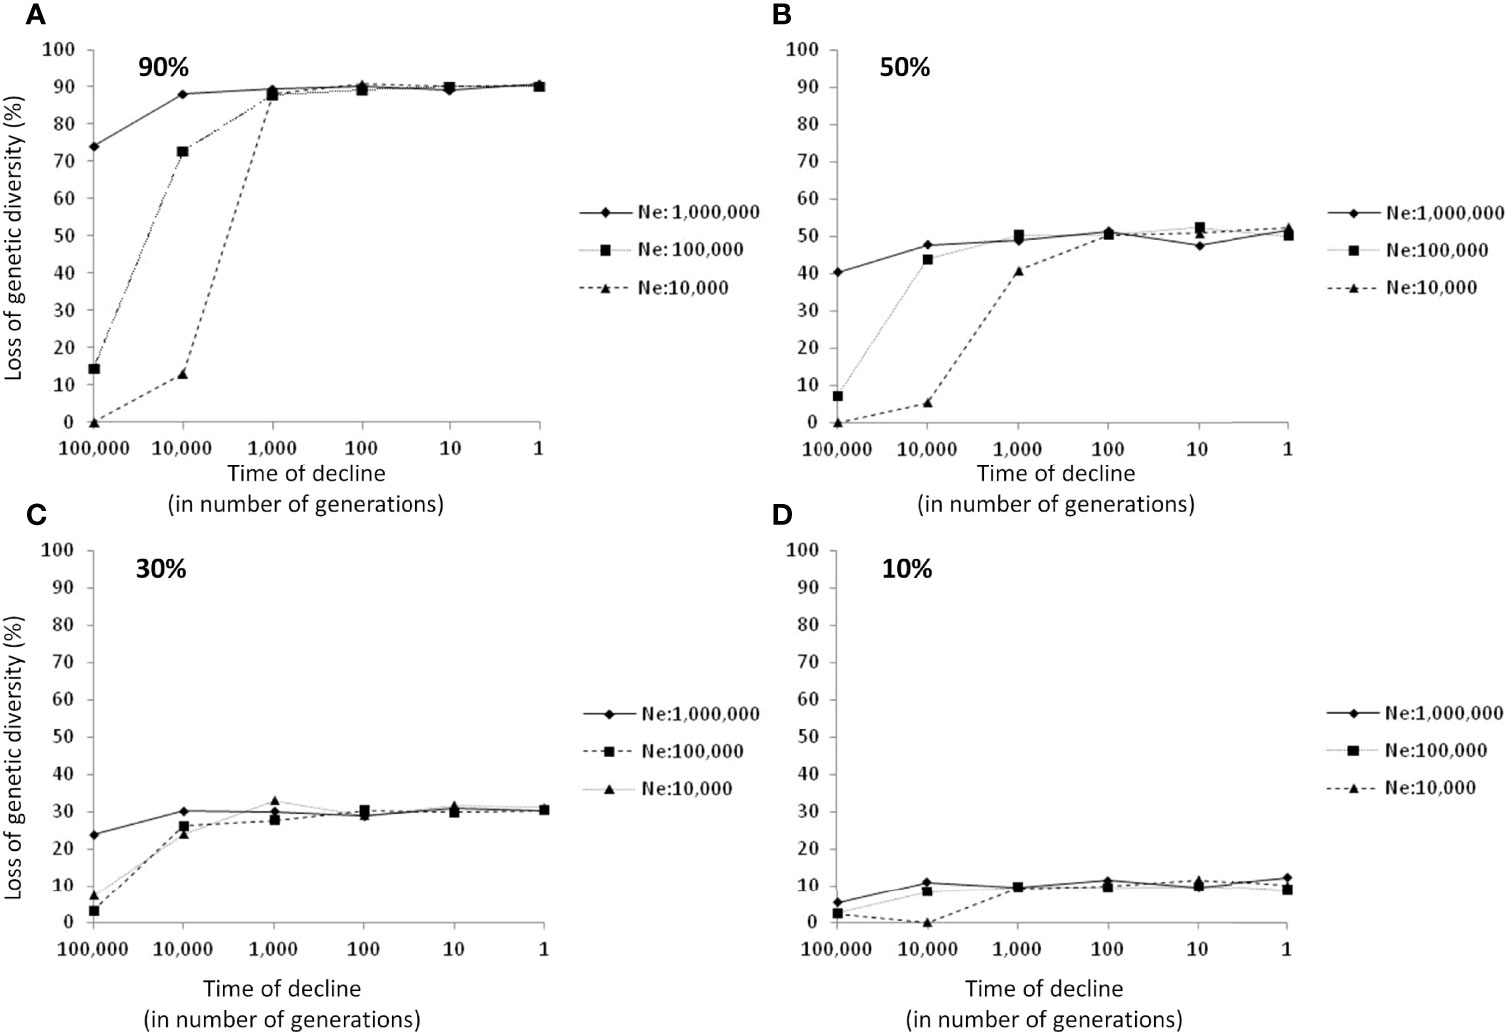
Figure 2 Average genetic diversity loss expected by declines in population census of 90% (A), 50% (B), 30% (C), and 10% (D) of its original size. Each mark represents the average loss of genetic diversity expected from 1000 random-generated samples that experienced a decline in population census at a different time (100,000; 10,000; 1,000; 100; 10; or 1 generations ago). Three different effective population sizes were simulated (Ne=10e6, 10e5 and 10e4) for each time of decline and each percentage of decline (N=72 simulations in total). The starting value of Ɵ was 2.5, which is an approximation to the median value of worldwide and East Asia fish datasets (Supplementary Table S2).
Contrasting the levels of COI genetic diversity (COI-π) of the fish collected in Fujian (East China Sea) against expected average levels for worldwide and East Asian species reveals only one species with elevated levels of genetic diversity above the expected average for East-Asian and worldwide species. This is Takifugu oblongus which is a poisonous species and not consumed in East China (Shao et al., 2014). In contrast, the two highly commercial species H. nehereus and S. cirrhifer, and two minor commercial species, T. vagina and C. crenilabis exhibit levels of genetic diversity below the expected average for East-Asian and worldwide species. Evidence of over-exploitation has been found for the two highly commercial Fujian’s species, H. nehereus, and S. cirrhifer (Matsuura et al., 2019; Russell et al., 2019), while artisanal fishing and by-catch are major threats for all minor commercial species evaluated in this study with the only exception of C. crenilabis which is under-studied (Hoese and Sparks, 2017; Dinh, 2018; Larson, 2019; Hata, 2020; Nguyen Van et al., 2020; Zhang et al., 2020). However, the lack of studies on biology and previous population census of these species likely excluded many of them being assessed as threatened. Thus, the first result emerging from our comparative analyses indicates that both high and minor commercial species from Fujian (East China Sea) could have experienced decreases in their levels of genetic diversity by fishing pressures declining their population census. This empirical data is also supported by simulations showing that the expected decrease in average genetic diversity in absence of migration and population expansion is proportional to the decline in population census happened in lapses of time smaller than Ne generations ago. Although, significant decreases in genetic diversity are expected when declines in population census are high (i.e. >50% of decline), we found more than 80% of the simulated samples showing a decrease in the levels of genetic diversity when declines in population census were ≥30% (i.e. cut off to be considered as threatened under IUCN criteria). The best example of expected genetic diversity decrease with a decline in population census is H. nehereus, the species with the strongest evidence of unmanaged exploitation across its whole distribution (Russell et al., 2019) among the evaluated species. We found that the levels of genetic diversity in COI for H. nehereus could be explained by a decline in population size of more than 90%. In fact, though local assessment in Fujian has not been performed for this species, the decline in global population census was already estimated to be larger than 30%, with detected local declines of nearly 80% in Indonesia (Russell et al., 2019). Therefore, the observed genetic diversity in COI found in H. nehereus mostly reflects the reported declines in population census in the IUCN assessments, indicating that the use of COI-π is a good proxy for the conservation status of its populations. The loss of genetic diversity in exploited fish species could compromise their adaptive potential to environmental changes. Therefore, priority in research and monitoring should be given to those species showing reduced levels of genetic diversity in COI.
Further case-study research should be performed for species with observed reduced genetic diversity in COI because beyond declines in population census by exploitation, the levels of genetic diversity are also affected by biological, ecological and evolutionary history characteristics of the species. Species traits such as, long-term effective population size (i.e. the effective population size of the species in equilibrium before demographic changes, Ne), generation times, variability in reproductive success, distortion in sex-proportion, connectivity among populations, age and stage-structured populations, geographic distribution and habitat preferences had been related to differences in levels of genetic diversity (Hauser and Carvalho, 2008; Hare et al., 2011; Pinsky and Palumbi, 2014; Martinez et al., 2018; Manel et al., 2020; Gandra et al., 2021). Moreover, adaptive selection in mitochondrial genome could produce decrease in genetic diversity (Bazin et al., 2006) and this effect can be only detected in case-study research (Lynch et al., 2006). The current knowledge of the evaluated species and the power of this study are not sufficient for a complete evaluation of all potential factors affecting genetic diversity, but we can have a preliminary evaluation of some of them by including knowledge from the species used as controls in this study.
Estimates of Ne are unavailable for the evaluated species but we can have a proxy by using body size which correlates negatively with Ne (Lynch and Conery, 2003; Pinsky and Palumbi, 2014). Most of First Priority species evaluated here have small sizes and therefore, they are comparable to the two species with short body sizes from Balearic Islands, M. barbatus and M. surmuletus which present higher levels of COI-π, despite a tendency to declining populations found for both species (Guijarro et al., 2012; Guijarro et al., 2019a). Moreover, the two farmed species with expected reduced Ne by large body sizes and known population declines by exploitation (Rhodes et al., 2018; Liu et al., 2020), and founder effects starting the farms (Wang et al., 2012), presented low levels of COI-π similar to First Priority species. Hence, these comparisons suggest that the reduced levels of COI-π found in the First Priority species are more likely a result of declines of population census by fishing pressures in East Asia than differences in long-term Ne.
Body size is also positively correlated to generation times (Lynch and Conery, 2003; Pinsky and Palumbi, 2014), and our results show the expected theoretical differences in the levels of genetic diversity in COI between large and small species with known differences in generation times from Balearic Islands. As the neutral theory of molecular evolution explains, the observed levels of genetic diversity account for events (demographic or selective) that happened between 1 and ~Ne generations ago (4Ne for nuclear markers, Lynch and Conery, 2003). Therefore, for species with long generation times, as is the case for the two large species from the Balearic Islands L. budegassa and M. merluccius (~10 years), if the long-term effective population size is Ne>~10e3, the levels of genetic diversity in these species may account for past events such as the last glacial period producing decreases in genetic diversity (Pinsky and Palumbi, 2014). Hence, for species with large generation times (i.e. > 5 years) and unknown long-term Ne, reduced levels of COI-π could reflect not only current exploitation but also historical events.
Migration is a likely source of genetic variation in fish populations from both, adults and pelagic larval stages, counteracting the effects of local declines (Hauser and Carvalho, 2008; Pinsky and Palumbi, 2014; Martinez et al., 2018). Three evaluated species from Fujian are known to be oceanodromous (i.e. seasonally migratory fishes). These species have different commercial values (i.e. Minor: C. lucidus vs High: H. nehereus and S. cirrhifer) and we observed the highest levels of COI-π in the species with minor commercial importance. This comparison suggests that for the Medium Priority species C. lucidus with minor commercial importance and likely variability in fishing pressures across its distribution, the levels of genetic diversity could be maintained owing to migration. However, for the highly commercially important species (H. nehereus and S. cirrhifer), which are under fishing pressures throughout its distribution range, the levels of genetic variation are likely decreasing globally for the whole species. Moreover, low COI-π observed for the non-migratory species C. crenilabis (First Priority) also suggests that migration may account for the differences in COI-π levels in minor commercial species. The same pattern is observed when comparing the two Mullus species from the Balearic Islands which also differ in their populations’ connectivity, with the highest COI-π in the migratory species M. surmuletus. Therefore, by taking into account migration of the species, it is suggested that for highly commercially important unmanaged species in Fujian the detected decrease in genetic diversity in COI seems to be directly linked to their global fishing pressures. In contrast, for minor commercial species, differences in connectivity among populations may account for the differences in genetic diversity.
Beyond the differences in population connectivity among the two Mullus species, different habitat preferences may also lead to differences in the levels of COI-π. M. surmuletus prefers narrow shelf areas with rocky substrates while M. barbatus is more abundant in areas where shelf becomes wider with muddy bottoms (Lombarte et al., 2000; Tserpes et al., 2019). Because rocky areas are not accessible by bottom trawling, a significant proportion of the M. surmuletus population is not directly affected by this threat. Thus, when considering habitat preferences, the level of fishing pressures is also reflected in the genetic diversity levels of both long-term managed Mullus species.
Overall, the results of this study indicate that differences in the levels of genetic diversity in COI might be preliminarily explained by differences in fishing pressures causing declines in population census. Although the limitations of this approach should be taken into account (see Leigh et al., 2021 for a review); it can be very useful to prioritize urgent research on loss of genetic diversity in unmanaged exploited fisheries with scarce biological and population knowledge. As genetic diversity in the mitochondrial genome is higher than in nuclear genes (Lynch et al., 2006) using COI-π gives strong statistical power to detect potential genetic diversity loss than surveying genetic variation in the nuclear genome. For example, estimates of nuclear genetic diversity in cod from samples of more than 100 years ago were ~0.0008 (Pinsky et al., 2021) which would give few chances to detect genetic diversity loss using samples sizes of 20. Given the low economic cost of obtaining COI sequences, tens or hundreds of species could be evaluated with the same sampling effort, offering a first view of the conservation status of local fisheries.
Our results indicate that the estimates of genetic diversity in the mitochondrial gene COI account for: 1) differences in fishing pressures by commercial importance of the fish species, 2) theoretical predictions of decreases in genetic diversity produced by population decline, and 3) known declines in population census. We found that commercial importance could be a first factor affecting genetic diversity, whilst the connectivity among populations seems to be important in minor commercial species exploited locally. Accordingly, we conclude that COI genetic diversity levels can provide a much-needed simple first diagnostic of the conservation status of fish species under exploitation. This simple and cost-effective tool can help prioritize research, management, and conservation on species with suspected loss of genetic diversity potentially eroding their adaptive potential to global change.
The datasets presented in this study can be found in online repositories. The names of the repository/repositories and accession number(s) can be found in the methods section/Supplementary Material.
Sampling was carried out within monitoring programs of the fisheries. The sampling scheme followed a standardized protocol (Bertrand et al., 2002) approved by international authorities (EU/DG Mare, FAO/GFCM).
NP-M and CS conceived ideas and obtained specific funding. NP-M performed data analyses and led manuscript writing. NP-M, IT, AC performed laboratory work. ML, SR-A, FO, BG, BT, EM, and AC collected and processed fin clips samples. All authors critically discussed the results, collaborated in the manuscript writing, reviewed and approved the final version.
Funding for this study were provided by Ecology & Biodiversity Division, School of Biological Sciences (HKU) to NP-M and CS, and by Fujian Province Ocean and Fisheries Bureau of China to ML. The MEDITS surveys are co-funded by the European Union through the European Maritime and Fisheries Fund (EMFF), within the National Program of collection, management and use of data in the fisheries sector and support for scientific advice regarding the Common Fisheries Policy. SR-A was supported by a postdoctoral contract co-funded by the Regional Government of the Balearic Islands and the European Social Fund. A pre-print of this article can be found in bioRxiv with doi: https://doi.org/10.1101/2021.12.16.472909.
The authors declare that the research was conducted in the absence of any commercial or financial relationships that could be construed as a potential conflict of interest.
All claims expressed in this article are solely those of the authors and do not necessarily represent those of their affiliated organizations, or those of the publisher, the editors and the reviewers. Any product that may be evaluated in this article, or claim that may be made by its manufacturer, is not guaranteed or endorsed by the publisher.
The Supplementary Material for this article can be found online at: https://www.frontiersin.org/articles/10.3389/fmars.2022.872537/full#supplementary-material
COI-π, genetic diversity in Cytochrome C Oxidase subunit I (COI) mitochondrial gene.
Allendorf F. W., Berry O., Ryman N. (2014). So Long to Genetic Diversity, and Thanks for All the Fish. Mol. Ecol. 23 (1), 23–25. doi: 10.1111/mec.12574
Allendorf F. W., England P. R., Luikart G., Ritchie P. A., Ryman N. (2008). Genetic Effects of Harvest on Wild Animal Populations. Trends Ecol. Evol. 23 (6), 327–337. doi: 10.1016/j.tree.2008.02.008
Bazin E., Glémin S., Galtier N. (2006). Population Size Does Not Influence Mitochondrial Genetic Diversity in Animals. science 312 (5773), 570–572. doi: 10.1126/science.1122033
Bernatchez L., Wellenreuther M., Araneda C., Ashton D. T., Barth J. M., Beacham T. D., et al. (2017). Harnessing the Power of Genomics to Secure the Future of Seafood. Trends Ecol. Evol. 32 (9), 665–680. doi: 10.1016/j.tree.2017.06.010
Bertrand J. A., Gil deSola L., Papaconstantinou C., Relini G., Souplet A. (2002). The General Specifications of the MEDITS Surveys. Scientia Marina, 66 (2), 9–17. doi: 10.3989/scimar.2002.66s29
Blanchet S., Prunier J. G., De Kort H. (2017). Time to Go Bigger: Emerging Patterns in Macrogenetics. Trends Genet. 33 (9), 579–580. doi: 10.1016/j.tig.2017.06.007
Bryndum-Buchholz A., Tittensor D. P., Lotze H. K. (2021). The Status of Climate Change Adaptation in Fisheries Management: Policy, Legislation and Implementation. Fish Fish 22, 1248–1273. doi: 10.1111/faf.12586
Canteri E., Fordham D. A., Li S., Hosner P. A., Rahbek C., Nogués-Bravo D. (2021). IUCN Red List Protects Avian Genetic Diversity. Ecography 44, 1808–1811. doi: 10.1111/ecog.05895
Casas-Marce M., Marmesat E., Soriano L., Martinez-Cruz B., Lucena-Perez M., Nocete F., et al. (2017). Spatiotemporal Dynamics of Genetic Variation in the Iberian Lynx Along Its Path to Extinction Reconstructed With Ancient DNA. Mol. Biol. Evol. 34 (11), 2893–2907. doi: 10.1093/molbev/msx222
Casey J., Jardim E., Martinsohn J. T. (2016). The Role of Genetics in Fisheries Management Under the EU Common Fisheries Policy. J. Fish Biol. 89 (6), 2755–2767. doi: 10.1111/jfb.13151
Chang N. N., Shiao J. C., Gong G. C. (2012). Diversity of Demersal Fish in the East China Sea: Implication of Eutrophication and Fishery. Continental Shelf Res. 47, 42–54. doi: 10.1016/j.csr.2012.06.011
Conover D. O., Clarke L. M., Munch S. B., Wagner G. N. (2006). Spatial and Temporal Scales of Adaptive Divergence in Marine Fishes and the Implications for Conservation. J. Fish Biol. 69, 21–47. doi: 10.1111/j.1095-8649.2006.01274.x
Di Natale A., Molinari A., Őztűrk B., Srour A., Pollard D. (2011). “Merluccius merluccius,” in The IUCN Red List of Threatened Species 2011, e.T198562A9031395
Dinh Q. M. (2018). Population Dynamics of the Goby Trypauchen vagina (Gobiidae) at Downstream of Hau River, Vietnam. Pakistan J. Zool 50 (1), 105–110. doi: 10.17582/journal.pjz/2018.50.1.105.110
Edgar R. C. (2004). MUSCLE: Multiple Sequence Alignment With High Accuracy and High Throughput. Nucleic Acids Res. 32 (5), 1792–1797. doi: 10.1093/nar/gkh340
FAO. (2020). “The State of World Fisheries and Aquaculture 2020,” in Sustainability in Action (Rome). Available at: https://www.fao.org/documents/card/es/c/ca9229en
Fiorentino F., Gancitano V., Colloca F., Knittweis L. (2012). Stock Assessment of Black Bellied Angler (Lophius budegassa) From the Trawl Fishery Off the GFCM-GSA15-16 (Malta and Italy: Scientific Advisory Committee, Sub-Committee on Stock Assessment (SCSAGeneral Fisheries Commission for the Mediterranean (GFCM). Available at: https://www.fao.org/3/ax859e/ax859e.pdf.
Froese R., Pauly D. (Eds.) (2022). FishBase (World Wide Web Electronic Publication). Available at: www.fishbase.org,version.
Gandra M., Assis J., Martins M. R., Abecasis D. (2021). Reduced Global Genetic Differentiation of Exploited Marine Fish Species. Mol. Biol. Evol. 38 (4), 1402–1412. doi: 10.1093/molbev/msaa299
Guijarro B., Farré M., González N., Ordines F. (2019a). A. Stock Assessment of Striped Red Mullet (Mullus surmuletus) From the Trawl Fishery Off the GFCM-Gsa05 (Balearic Islands: Scientific Advisory Committee, Sub-Committee on Stock Assessment (SCSAGeneral Fisheries Commission for the Mediterranean (GFCM). Available at: https://gfcmsitestorage.blob.core.windows.net/website/5.Data/SAFs/DemersalSpecies/2019/MUR_GSA_5_2019_ESP.pdf.
Guijarro B., Farré M., González N., Ordines F., Massutı́ E., et al (2019b). B. Stock Assessment of Hake (Merluccius merluccius) From the Trawl Fishery Off the GFCM-Gsa05 (Balearic Islands: Scientific Advisory Committee, Sub-Committee on Stock Assessment (SCSAGeneral Fisheries Commission for the Mediterranean (GFCM). Available at: https://gfcmsitestorage.blob.core.windows.net/documents/SAC/SAFs/DemersalSpecies/2019/HKE_GSA_5_2019_ESP.pdf.
Guijarro B., Rubio V., Ordines F., Quetglas A. (2012). Stock Assessment of Red Mullet (Mullus barbatus) From the Trawl Fishery Off the GFCM-Gsa05 (Balearic Islands: Scientific Advisory Committee, Sub-Committee on Stock Assessment (SCSAGeneral Fisheries Commission for the Mediterranean (GFCM). Available at: https://gfcmsitestorage.blob.core.windows.net/documents/SAC/SAFs/DemersalSpecies/2012/SAF_MUT_GSA05.pdf.
Gutenkunst R. N., Hernandez R. D., Williamson S. H., Bustamante C. D. (2009). Inferring the Joint Demographic History of Multiple Populations From Multidimensional SNP Frequency Data. PloS Genet. 5 (10), e1000695. doi: 10.1371/journal.pgen.1000695
Hare M. P., Nunney L., Schwartz M. K., Ruzzante D. E., Burford M., Waples R. S., et al. (2011). Understanding and Estimating Effective Population Size for Practical Application in Marine Species Management. Conserv. Biol. 25 (3), 438–449. doi: 10.1111/j.1523-1739.2010.01637.x
Hata H. (2020). “Thryssa vitrirostris,” in The IUCN Red List of Threatened Species 2020, e.T171339401A171342135. doi: 10.2305/IUCN.UK.2020-2.RLTS.T171339401A171342135.en
Hauser L., Adcock G. J., Smith P. J., Ramirez J. H., Carvalho G. R. (2002). Loss of Microsatellite Diversity and Low Effective Population Size in an Overexploited Population of New Zealand Snapper (Pagrus Auratus). Proc. Natl. Acad. Sci. 99 (18), 11742– 11747. doi: 10.1073/pnas.172242899
Hauser L., Carvalho G. R. (2008). Paradigm Shifts in Marine Fisheries Genetics: Ugly Hypotheses Slain by Beautiful Facts. Fish Fish 9 (4), 333–362. doi: 10.1111/j.1467-2979.2008.00299.x
Hauser L., Seeb J. E. (2008). Advances in Molecular Technology and Their Impact on Fisheries Genetics. Fish Fish 9 (4), 473–486. doi: 10.1111/j.1467-2979.2008.00306.x
Hesterberg T. (2011). Bootstrap. Wiley Interdiscip. Reviews: Comput. Stat 3 (6), 497– 526. doi: 10.1002/wics.182
Hoese D., Sparks J. S. (2017). “Crenimugil crenilabis,” in The IUCN Red List of Threatened Species 2017, e.T196421A96230856. doi: 10.2305/IUCN.UK.2017-3.RLTS.T196421A96230856.en
Hutchings J. A., Reynolds J. D. (2004). Marine Fish Population Collapses: Consequences for Recovery and Extinction Risk. BioScience 54 (4), 297–309. doi: 10.1641/0006-3568(2004)054[0297:MFPCCF]2.0.CO;2
Ivanova N. V., Zemlak T. S., Hanner R. H., Hebert P. D. (2007). Universal Primer Cocktails for Fish DNA Barcoding. Mol. Ecol. Notes 7 (4), 544–548. doi: 10.1111/j.1471-8286.2007.01748.x
Larson H. (2019). “Trypauchen vagina,” in The IUCN Red List of Threatened Species 2019, e.T166935A1154326. doi: 10.2305/IUCN.UK.2019-3.RLTS.T166935A1154326.en
Leigh D. M., van Rees C. B., Millette K. L., Breed M. F., Schmidt C., Bertola L. D., et al. (2021). Opportunities and Challenges of Macrogenetic Studies. Nat. Rev. Genet. 22 (12), 791–807. doi: 10.1038/s41576-021-00394-0
Liang C., Pauly D. (2017). Fisheries Impacts on China's Coastal Ecosystems: Unmasking a Pervasive ‘Fishing Down’effect. PloS One 12 (3), e0173296. doi: 10.1371/journal.pone.0173296
Liu M., Cheng J.-H., Nguyen Van Q., Sasaki K., Hoshino K., Sakai T., et al. (2020). “Larimichthys crocea,” in The IUCN Red List of Threatened Species 2020, e.T49182559A49239394. doi: 10.2305/IUCN.UK.2020-1.RLTS.T49182559A49239394.en
Liu M., Sadovy de Mitcheson Y. S. (2008). Profile of a Fishery Collapse: Why Mariculture Failed to Save the Large Yellow Croaker. Fish Fish 9 (3), 219–242. doi: 10.1111/j.1467-2979.2008.00278.x
Lombarte A., Recasens L., Gonzalez M., Gil de Sola L. (2000). Spatial Segregation of Two Species of Mullidae (Mullus surmuletus and M. barbatus) in Relation to Habitat. Marine Ecol. Prog. Ser. 206, 239–249. doi: 10.3354/meps206239
Lynch M., Conery J. S. (2003). The Origins of Genome Complexity. Science 302 (5649), 1401–1404. doi: 10.1126/science.1089370
Lynch M., Koskella B., Schaack S. (2006). Mutation Pressure and the Evolution of Organelle Genomic Architecture. Science 311 (5768), 1727–1730. doi: 10.1126/science.1118884
Manel S., Guerin P. E., Mouillot D., Blanchet S., Velez L., Albouy C., et al. (2020). Global Determinants of Freshwater and Marine Fish Genetic Diversity. Nat. Commun. 11 (1), 1–9. doi: 10.1038/s41467-020-14409-7
Martinez A. S., Willoughby J. R., Christie M. R. (2018). Genetic Diversity in Fishes is Influenced by Habitat Type and Life-History Variation. Ecol. Evol. 8 (23), 12022–12031. doi: 10.1002/ece3.4661
Matsuura K., Motomura H., Khan M. (2019). “Stephanolepis cirrhifer,” in The IUCN Red List of Threatened Species 2019, e.T79803245A79803253. doi: 10.2305/IUCN.UK.2019-1.RLTS.T79803245A79803253.en
Nguyen Van Q., Sasaki K., Hoshino K., Sakai T., Yang C.-H., Chen M.-H., et al. (2020). “Collichthys lucidus,” in The IUCN Red List of Threatened Species 2020, ,e.T49171768A49225265. doi: 10.2305/IUCN.UK.2020-1.RLTS.T49171768A49225265.en
Ovando D., Hilborn R., Monnahan C., Rudd M., Sharma R., Thorson J. T., et al. (2021). Improving Estimates of the State of Global Fisheries Depends on Better Data. Fish Fish 221377–, 1391. doi: 10.1111/faf.12593
Ovenden J. R., Berry O., Welch D. J., Buckworth R. C., Dichmont C. M. (2015). Ocean's Eleven: A Critical Evaluation of the Role of Population, Evolutionary and Molecular Genetics in the Management of Wild Fisheries. Fish Fish 16 (1), 125–159. doi: 10.1111/faf.12052
Papakonstantinou C., Pollard D., Massuti E., Palmeri A., Keskin Ç. (2011). “Lophius budegassa,” in The IUCN Red List of Threatened Species 2011, e.T198609A21911220. doi: 10.2305/IUCN.UK.2015-4.RLTS.T198609A21911220.en
Petit-Marty N., Vázquez-Luis M., Hendriks I. E. (2021). Use of the Nucleotide Diversity in COI Mitochondrial Gene as an Early Diagnostic of Conservation Status of Animal Species. Conserv. Lett. 14 (1), e12756. doi: 10.1111/conl.12756
Piganeau G., Eyre-Walker A. (2009). Evidence for Variation in the Effective Population Size of Animal Mitochondrial DNA. PloS One 4 (2), e4396. doi: 10.1371/journal.pone.0004396
Pinsky M. L., Eikeset A. M., Helmerson C., Bradbury I. R., Bentzen P., Morris C., et al. (2021). Genomic Stability Through Time Despite Decades of Exploitation in Cod on Both Sides of the Atlantic. Proc. Natl. Acad. Sci. 118 (15), e2025453118. doi: 10.1073/pnas.2025453118
Pinsky M. L., Palumbi S. R. (2014). Meta-Analysis Reveals Lower Genetic Diversity in Overfished Populations. Mol. Ecol. 23 (1), 29–39. doi: 10.1111/mec.12509
Ratnasingham S., Hebert P. D. N. (2007). BOLD: The Barcode of Life Data System (https://Www.Barcodinglife.Org). Mol. Ecol. Notes 7, 355–364. doi: 10.1111/j.1471-8286.2007.01678.x
Rhodes K., Sadovy Y., Samoilys M. (2018). “Epinephelus fuscoguttatus,” in The IUCN Red List of Threatened Species 2018, e.T44673A100468078. doi: 10.2305/IUCN.UK.2018-2.RLTS.T44673A100468078.en
Rozas J., Ferrer-Mata A., Sanchez-DelBarrio J. C., Guirao-Rico S., Librado P., Ramos-Onsins S. E., et al. (2017). DnaSP 6: DNA Sequence Polymorphism Analysis of Large Data Sets. Mol. Biololgy Evol. 34 (12), 3299–3302. doi: 10.1093/molbev/msx248
Rubinoff D., Holland B. S. (2005). Between Two Extremes: Mitochondrial DNA is Neither the Panacea Nor the Nemesis of Phylogenetic and Taxonomic Inference. Syst Biol. 54 (6), 952–961. doi: 10.1080/10635150500234674
Russell B., Govender A., Borsa P. (2019). “Harpadon nehereus,” in The IUCN Red List of Threatened Species 2019, e.T75143569A75144431 doi: 10.2305/IUCN.UK.2019-2.RLTS.T75143569A75144431.en
Shao K., Liu M., Hardy G., Jing L., Leis J. L., Matsuura K. (2014). “Takifugu oblongus,” in The IUCN Red List of Threatened Species 2014, e.T193810A2280706. doi: 10.2305/IUCN.UK.2014-3.RLTS.T193810A2280706.en
Spedicato M. T., Massutí E., Mérigot B., Tserpes G., Jadaud A., Relini G. (2019). The MEDITS Trawl Survey Specifications in an Ecosystem Approach to Fishery Management. Sci Marina 83 (S1), 9–20. doi: 10.3989/scimar.04915.11X
Spielman D., Brook B. W., Frankham R. (2004). Most Species are Not Driven to Extinction Before Genetic Factors Impact Them. PNAS 101 (42), 15261– 15264. doi: 10.1073/pnas.0403809101
Sumaila U. R. (2019). Comparative Valuation of Fisheries in Asian Large Marine Ecosystems With Emphasis on the East China Sea and South China Sea LMEs. Deep Sea Res. Part II: Topical Stud. Oceanogr 163, 96–101. doi: 10.1016/j.dsr2.2018.12.008
Sumaila U. R., Tai T. C. (2020). End Overfishing and Increase the Resilience of the Ocean to Climate Change. Front. Marine Sci. 523. doi: 10.3389/fmars.2020.00523
Tajima F. (1989). Statistical Method for Testing the Neutral Mutation Hypothesis by DNA Polymorphism. Genetics 123 (3), 585–595. doi: 10.1093/genetics/123.3.585
Teh L. S., Cashion T., Cheung W. W., Sumaila U. R. (2020). Taking Stock: A Large Marine Ecosystem Perspective of Socio-Economic and Ecological Trends in East China Sea Fisheries. Rev. Fish Biol. Fish 30 (2), 269–292. doi: 10.1007/s11160-020-09599-8
Thu P. T., Huang W. C., Chou T. K., Van Quan N., Van Chien P., Li F., et al. (2019). DNA Barcoding of Coastal Ray-Finned Fishes in Vietnam. PloS One 14 (9), e0222631. doi: 10.1371/journal.pone.0222631
Tserpes G., Massutí E., Fiorentino F., Facchini M. T., Viva C., Jadaud A., et al. (2019). Distribution and Spatio-Temporal Biomass Trends of Red Mullets Across the Mediterranean. Sci. Marina 83 (S1), 43–55.doi: 10.3989/scimar.04888.21A
van der Valk T., Sandoval-Castellanos E., Caillaud D., Ngobobo U., Binyinyi E., Nishuli R., et al. (2018). Significant Loss of Mitochondrial Diversity Within the Last Century Due to Extinction of Peripheral Populations in Eastern Gorillas. Sci. Rep. 8 (1), 6551. doi: 10.1038/s41598-018-24497-7
Wang L., Shi X., Su Y., Meng Z., Lin H. (2012). Loss of Genetic Diversity in the Cultured Stocks of the Large Yellow Croaker, Larimichthys crocea, Revealed by Microsatellites. Int. J. Mol. Sci. 13 (5), 5584–5597. doi: 10.3390/ijms13055584
Watterson G. A. (1975). On the Number of Segregating Sites in Genetical Models Without Recombination. Theor. Population Biol. 7, 256–276. doi: 10.1016/0040-5809(75)90020-9
Yuan J., Lin H., Wu L., Zhuang X., Ma J., Kang B., et al. (2021). Resource Status and Effect of Long-Term Stock Enhancement of Large Yellow Croaker in China. Front. Marine Sci. 8, 743836. doi: 10.3389/fmars.2021.743836
Zhang L. L., Ren Q. Q., Liu M., Xu Q., Kang B., Jiang X. B. (2020). Fishery Stock Assessments in the Min River Estuary and its Adjacent Waters in Southern China Using the Length-Based Bayesian Estimation (LBB) Method. Front. Marine Sci. 7, 507. doi: 10.3389/fmars.2020.00507
Keywords: adaptive potential, COI barcode, conservation, fisheries, global change, over-fishing, resilience
Citation: Petit-Marty N, Liu M, Tan IZ, Chung A, Terrasa B, Guijarro B, Ordines F, Ramírez-Amaro S, Massutí E and Schunter C (2022) Declining Population Sizes and Loss of Genetic Diversity in Commercial Fishes: A Simple Method for a First Diagnostic. Front. Mar. Sci. 9:872537. doi: 10.3389/fmars.2022.872537
Received: 09 February 2022; Accepted: 21 April 2022;
Published: 19 May 2022.
Edited by:
Athanassios C. Tsikliras, Aristotle University of Thessaloniki, GreeceReviewed by:
Pablo Saenz-Agudelo, Austral University of Chile, ChileCopyright © 2022 Petit-Marty, Liu, Tan, Chung, Terrasa, Guijarro, Ordines, Ramírez-Amaro, Massutí and Schunter. This is an open-access article distributed under the terms of the Creative Commons Attribution License (CC BY). The use, distribution or reproduction in other forums is permitted, provided the original author(s) and the copyright owner(s) are credited and that the original publication in this journal is cited, in accordance with accepted academic practice. No use, distribution or reproduction is permitted which does not comply with these terms.
*Correspondence: Natalia Petit-Marty, bmF0YWxpYXBldGl0MkBnbWFpbC5jb20=; Celia Schunter, Y2VsaWFzY2h1bnRlckBnbWFpbC5jb20=
Disclaimer: All claims expressed in this article are solely those of the authors and do not necessarily represent those of their affiliated organizations, or those of the publisher, the editors and the reviewers. Any product that may be evaluated in this article or claim that may be made by its manufacturer is not guaranteed or endorsed by the publisher.
Research integrity at Frontiers
Learn more about the work of our research integrity team to safeguard the quality of each article we publish.