- 1School of Geography and Remote Sensing, Guangzhou University, Guangzhou, China
- 2State Key Laboratory of Satellite Ocean Environment Dynamics, Second Institute of Oceanography, Ministry of Natural Resources (MNR), Hangzhou, China
- 3Southern Marine Science and Engineering Guangdong Laboratory (Zhuhai), Zhuhai, China
- 4School of Marine Sciences, Sun Yat-Sen University, Zhuhai, China
- 5Institute of Deep-Sea Science and Engineering, Chinese Academy of Sciences, Sanya, China
- 6State Key Laboratory of Tropical Oceanography, South China Sea Institute of Oceanology, Chinese Academy of Sciences, Guangzhou, China
- 7Department of Ocean Science, The Hong Kong University of Science and Technology, Hong Kong, Hong Kong SAR, China
Observed different evolutions of SST anomalies in the South China Sea (SCS) between super and other El Niño events are revealed. The results suggest that the first (second) warming peak is warmer than the second (first) one for super (other) El Niño composite. Mixed layer heat budget analysis indicates that during the first warming period, the vertical advection induced by the anomalous anticyclone in the SCS (SCSAC) warms the SST in the central SCS through the basin-scale downwelling motion for super El Niño composite. In contrast, the positive shortwave radiation anomalies from atmosphere into ocean associated with the reduced total cloud cover contribute the most warming SST for other El Niño composite. During the cooling period, the horizontal linear cold advection associated with a large west-east SST gradient anomaly and climatological western boundary currents plays the most important role in rapid cooling SST for super El Niño composite. However, the nonlinear warm advection associated with the northward current anomalies and anomalous SST gradient in the western SCS maintains the SCS SST for other El Niño composite. During the second warming period, the net surface heat flux anomalies act as a damping process, while the warming process could be attributed to the vertical warm advection. Specially, the SCSAC weakens but the anomalous easterly winds strengthen to suppress the upwelling off the coast of southeast Vietnam for other El Niño composite. The anomalous ocean circulations and associated advections are related to the development of SCSAC, which could be largely attributed to the SST anomalies in the Indian Ocean. In contrast with previous studies, our results highlight the role of ocean dynamics in the evolution of SCS SST anomalies during El Niño of different intensities.
1 Introduction
The South China Sea (SCS), which is located between the western Pacific Ocean and the Indian Ocean, is the largest marginal sea in the northwest Pacific. Abundant water exchange and complex atmospheric processes make the SCS susceptible to the Pacific and Indian Oceans but quite different from them (Liu et al., 2004; Chiang et al., 2018). Observational analyses have shown that the sea surface temperature in the SCS (SCS SST) exhibit abundance of multiple timescales from seasonal to decadal variabilities, which are largely modulated by the East Asian monsoon, El Niño–Southern Oscillation (ENSO), Interdecadal Pacific Oscillation, and global warming (Shen and Lau, 1995; Tomita and Yasunari, 1996; Ose et al., 1997; Chu et al., 1999; Klein et al., 1999; Qu, 2001; Chen et al., 2003; Wang et al., 2006a; Yu and Qu, 2013; Wu et al., 2014; Cheng et al., 2016; Cheng et al., 2017; Cheng et al., 2019; Xiao et al., 2020a; Liang et al., 2021). Among them, the impact of ENSO on the SCS SST on the interannual timescale has been widely studied.
There are two main processes for ENSO to affect the SCS SST. One is called the “atmospheric bridge”: the Walker circulation is weakened with the development of El Niño to modulate the SCS SST through surface heat flux (Trenberth et al., 1998; Klein et al., 1999; Wang et al., 2000; Alexander et al., 2002). Zhang et al. (1996) proposed that an anomalous anticyclone over the western North Pacific (WNPAC) could be a critical linkage between East Asian climate and El Niño. Wang et al. (2000) indicated that the formation of the WNPAC during the late fall of the El Niño developing phase and the local atmosphere–ocean interaction (wind–evaporation–SST feedback) could support the WNPAC to persistent. Xie et al. (2009) proposed another maintenance mechanism of the WNPAC via the Indian Ocean capacitor effect, namely the tropical Indian Ocean warming following the El Niño event could force a warm equatorial Kelvin wave to the east to maintain the WNPAC. These theories could explain the continuous warming SST in the SCS during El Niño decaying phase. Another process is called “oceanic channel”. The only deep channel that connects the SCS and the Pacific is the Luzon Strait (Qu et al., 2004; Tian et al., 2006). The SCS SST anomalies could be modulated by the ENSO-induced ocean dynamical processes through the Luzon Strait (Qu et al., 2004; Wang et al., 2006b). For example, Wang et al. (2002) found that the extreme warm event in 1997/1998 was triggered mainly by the warm advection caused by the southerly wind anomalies, but the weakened throughflow from the Luzon Strait maintained the warming SST. Xiao et al. (2018) reported two subsurface extreme warming events, which were related to the warm water advected from the Kuroshio current.
According to the above theories, some features and mechanisms of the SCS SST associated with the El Niño were proposed. Wang et al. (2006a) pointed out that following an El Niño event the evolution of the SCS SST shows a double-peak feature. The net heat flux anomalies contribute to the first warming peak, while geostrophic heat advection is the major factor in producing the second warming peak. Chen et al. (2007) demonstrated that the rapid warming of the SCS during fall of a strong El Niño was mainly attributed to the increased solar heating in October and decreased latent heat flux in November–December, respectively, which are both induced by the evolution of the WNPAC. The influence of the different types of El Niño on SCS SST has also been studied (Liu et al., 2014; Tan et al., 2016; Liang et al., 2021). For instance, the SCS may warm throughout the basin during the eastern Pacific El Niño, while during the central Pacific El Niño the SCS warming only occurs to the west of 115°E. Tan et al. (2016) investigated the influences of three types of El Niño on the SCS during developing autumn. They pointed that the positive latent heat flux (positive anomalous Qnet and its components indicate that the ocean gains heat from the atmosphere to warm the SST, and vice versa) contributed to the warm SCS SST anomalies for canonical El Niño and El Niño Modoki I, whereas the cold SST anomalies are found for El Niño Modoki II induced by negative latent heat flux.
As summarized above, previous studies mainly focused on the impact of the El Niño and its diversity on the SCS SST. Yet little is known about the impacts of El Niño of different intensities on the SCS SST. The purpose of this study is to investigate different evolutions of SCS SST anomalies between super and other El Niño events and the corresponding physical mechanisms. In addition, different from previous studies, this study focuses on the role of ocean advection in the evolution of SCS SST in response to the El Niño with different intensities.
The remainder of this paper is organized as follows. The data and methodology are set out in Section Data and Methods. In Section Results, we show the spatiotemporal difference of SCS SST in response to El Niño with different intensities, a detailed mixed layer heat budget analysis, and the large scale forcing from the Indian Ocean. Finally, a discussion and the main conclusions are given in Section Conclusions and Discussion.
2 Data and Methods
2.1 Data
In this study, observed monthly SST data are collected from the National Oceanic and Atmospheric Administration (NOAA) daily optimum interpolation SST datasets version 2 (OISSTv2, Reynolds et al., 2007). To detect the possible associated mechanisms for controlling the SST variation, the subsurface ocean temperature and three-dimensional currents from Simple Ocean Data Assimilation (SODA version 3.4.2) reanalysis data are used (Carton et al., 2018). The quality of SST in SODA3.4.2 has been validated against observations in OISSTv2 from previous studies (Xiao et al., 2020b; Xiao et al., 2020c). Atmospheric variables are obtained from the European Centre for Medium-Range Weather Forecasts Reanalysis Interim (ERA-Interim, Dee et al., 2011), namely, the longwave radiation, shortwave radiation, latent heat flux, sensible heat flux, total cloud cover, and horizontal wind fields. We choose ERA-Interim because the ocean model used to produce SODA was forced by ERA-Interim. All datasets covered the period of 1982–2018 and all anomalous values are calculated based on the climatological data for the period of 1982–2018. Linear trends for all variables have been moved before analyses.
According to monthly Niño3.4 index (area-averaged SST anomalies over 5°S–5°N, 120°–170°W) from 1982 to 2018, three strongest El Niño events with the Niño 3.4 index exceeding 2.5°C (referred to super El Niño events: 1982/83, 1997/98, 2015/16) and the remaining eight events (referred to other El Niño events 1986/87, 1987/88, 1991/92, 1994/95, 2002/03, 2006/07, 2009/10, 2014/15) are chosen for analysis.
2.2 Mixed Layer Heat Budget
In this study, mixed layer heat budget analysis is a very important method to examine the atmospheric heat flux and oceanic advection controlling changes in SST quantitatively. Following Li et al. (2002), the mixed layer temperature tendency equation is written as:
where Tm is the mixed layer averaged temperature, which is a good proxy for SST in the mixed layer heat budget analysis; V and W are the horizontal and vertical current velocities averaged in the mixed layer, respectively; ρ is the reference density for seawater (1,027 kg m−3); Cp is the specific heat capacity of seawater (4,007 J °C−1 kg−1); H denotes the mixed layer depth, which is defined here as the depth at which the temperature is 0.5°C lower than the SST (Monterey and Levitus, 1997); and R represents the residual term from unaccounted effects like diffusion, turbulent mixing, and errors in other terms. The overbar and prime denote the climatological mean and the deviation from the mean, respectively.
The Qnet is the net surface heat flux at the sea surface:
Where LWR is the net surface longwave radiation flux, LHF is the latent heat flux, SHF is the sensible heat flux, and SWR is the difference between the net surface shortwave radiation flux and unabsorbed shortwave radiation penetrating through the mixed layer base. Following Halliwell (2004), SWR is calculated as follows:
Where R is red light fraction, β1 and β2 are the penetration depth scales of red and blue light, respectively. In this study, coefficients R, β1, and β2 are chosen to be 0.58, 0.35, and 23, respectively, according to the water transparency properties in the SCS (Seow and Tozuka, 2019).
3 Results
3.1 Spatiotemporal Difference of SCS SST in Response to ENSOs
The 2-year evolutions of the monthly SST anomalies in the main part of SCS (10°–20°N, 109°–118°E) from developing to decaying phases of three super El Niño events are shown in Figure 1A. The results indicate that the SCS experienced continuous abnormal warming since developing summer to autumn. In contrast, the SCS SST anomalies reveal great differences among eight other El Niño events (Figure 1B). Each impact of El Niño on the SCS is expected to be unique.
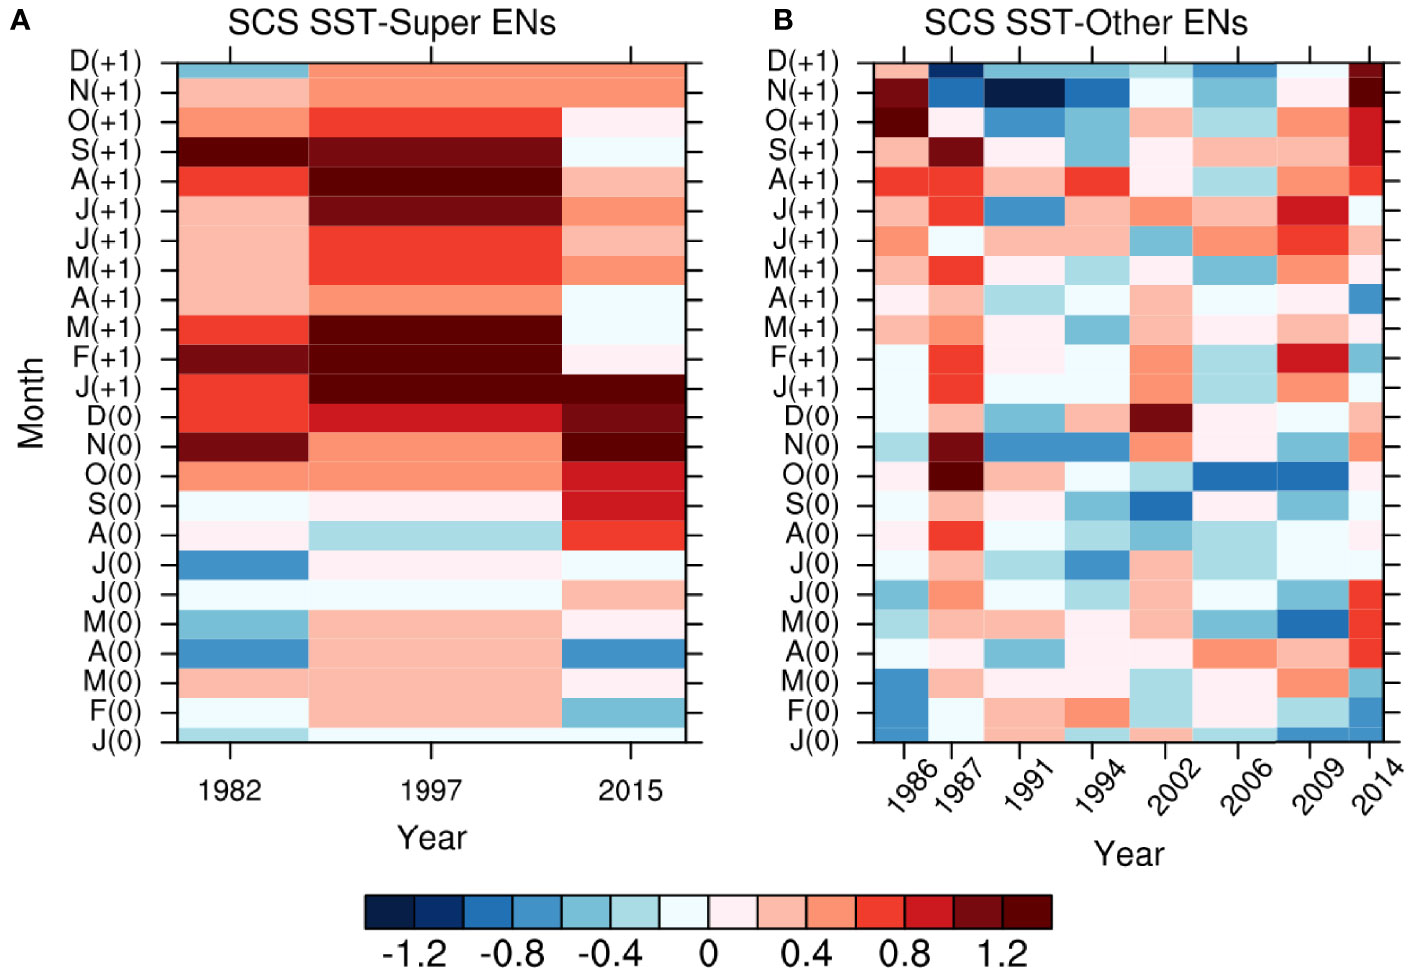
Figure 1 (A) Time series of the SST anomaly over the SCS (10–20°N, 109–118°E) during three super El Niño events (Unit: °C). (B) Same as in (A) but for eight other El Niño events. “(0) and (1)” indicate the developing year and the decaying year for El Niño.
In order to elucidate the temporal variations of SCS SST anomalies during El Niño events clearly, we averaged the SCS SST anomalies for three super El Niño events and eight other El Niño events, respectively (Figures 2A, B). We use years 0 and +1 to represent El Niño developing and decaying years, respectively. A prominent feature of the SCS SST anomalies is a double peak following super El Niño events, which is consistent with Wang et al. (2006a). The first and second peaks occur in January and August during subsequent year of the El Niño with the average SST anomalies of 0.99°C and 0.58°C in the boreal winter [D(0)JF(+1)] and summer [JJA(+1)], respectively (Figure 2C). From the standard deviation of the winter SST anomalies for these super El Niño events, the first peak has a larger standard deviation, indicating that each impact of super El Niño on the SCS also has its uniqueness (Figures 2A, C). For example, we discussed that the early and extreme SCS SST anomalies in boreal autumn 2015 were different from the other two super El Niño events, which were modulated by the Indian Ocean (Xiao et al., 2020b). For eight other El Niño events, the SCS SST anomalies also display a double peak, but the amplitudes are much weaker than those for super El Niño events (Figure 2B). The first and second peaks occur in March and August during subsequent year of the El Niño with the average SST anomalies of 0.14°C and 0.33°C in the boreal winter [D(0)JF(+1)] and summer [JJA(+1)], respectively (Figure 2D). Compared with the difference between Figures 2A, B, a continuous warming from Aug(0) to Jan(+1) (+0.94°C in 6 months) and a rapid cooling Feb(+1) to Apr(+1) (−0.83°C in 3 months) make the first peak warmer than the second one for super El Niño events. In contrast, a very slowly warming from Sep(0) to Mar(+1) (+0.36°C in 7 months) and a continuous warming from Apr(+1) to Aug(+1) (+0.47°C in 5 months) make the second peak warmer than the first one for other El Niño events.
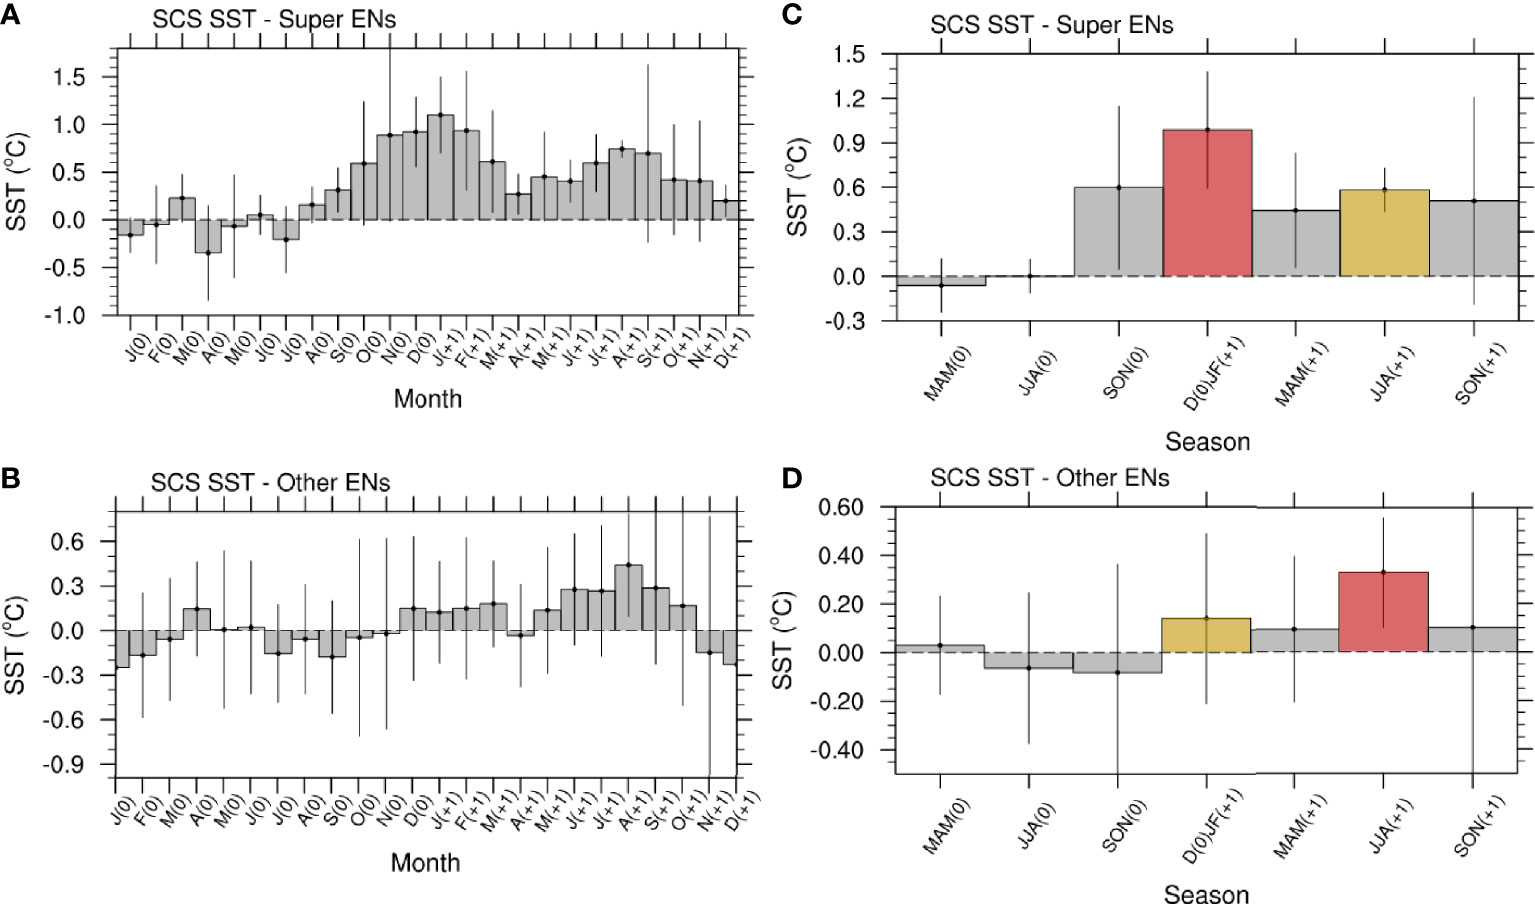
Figure 2 (A). Gray bars indicate two-year SST anomaly evolutions averaged over the SCS (10–20°N, 109–118°E) for super El Niño composite and the error bars indicate ±1 standard deviations of every month. (B) Same as in (A) but for the other El Niño composite. (C, D) Same as in (A, B) but for the seasonal mean. The red shading and yellow shading in (C, D) indicate the warming peaks, and the red one is the warmest.
The spatial distributions of the SCS SST and 975hPa wind anomalies for super and other El Niño events are shown in Figure 3. The anomalous anticyclone in the SCS (SCSAC) establishes in SON(0) and maintains until MAM(+1) for super El Niño events. A basin-scale warming occurs throughout the super El Niño life cycle. As mentioned above, the first peak in D(0)JF(+1) is much warmer than the second peak in JJA(+1) (Figures 3B, D). The maximum warming centers of the first and second peaks are located in the western and eastern SCS, respectively. For other El Niño events, the SCSAC establishes in D(0)JF(+1), about one season later than that for super El Niño events (Figure 3F). It appears that the warming center occurs in the southern SCS during first peak and develops to be a basin-scale warming pattern during second peak (Figures 3F, H). We can conclude that the first (second) peak was 0.41°C (0.19°C) warmer than the second (first) one for super (other) El Niño events, indicating that the impact of non-super El Niño events on the SCS mainly occurs in decaying summer of El Niño events (Figures 2C, D).
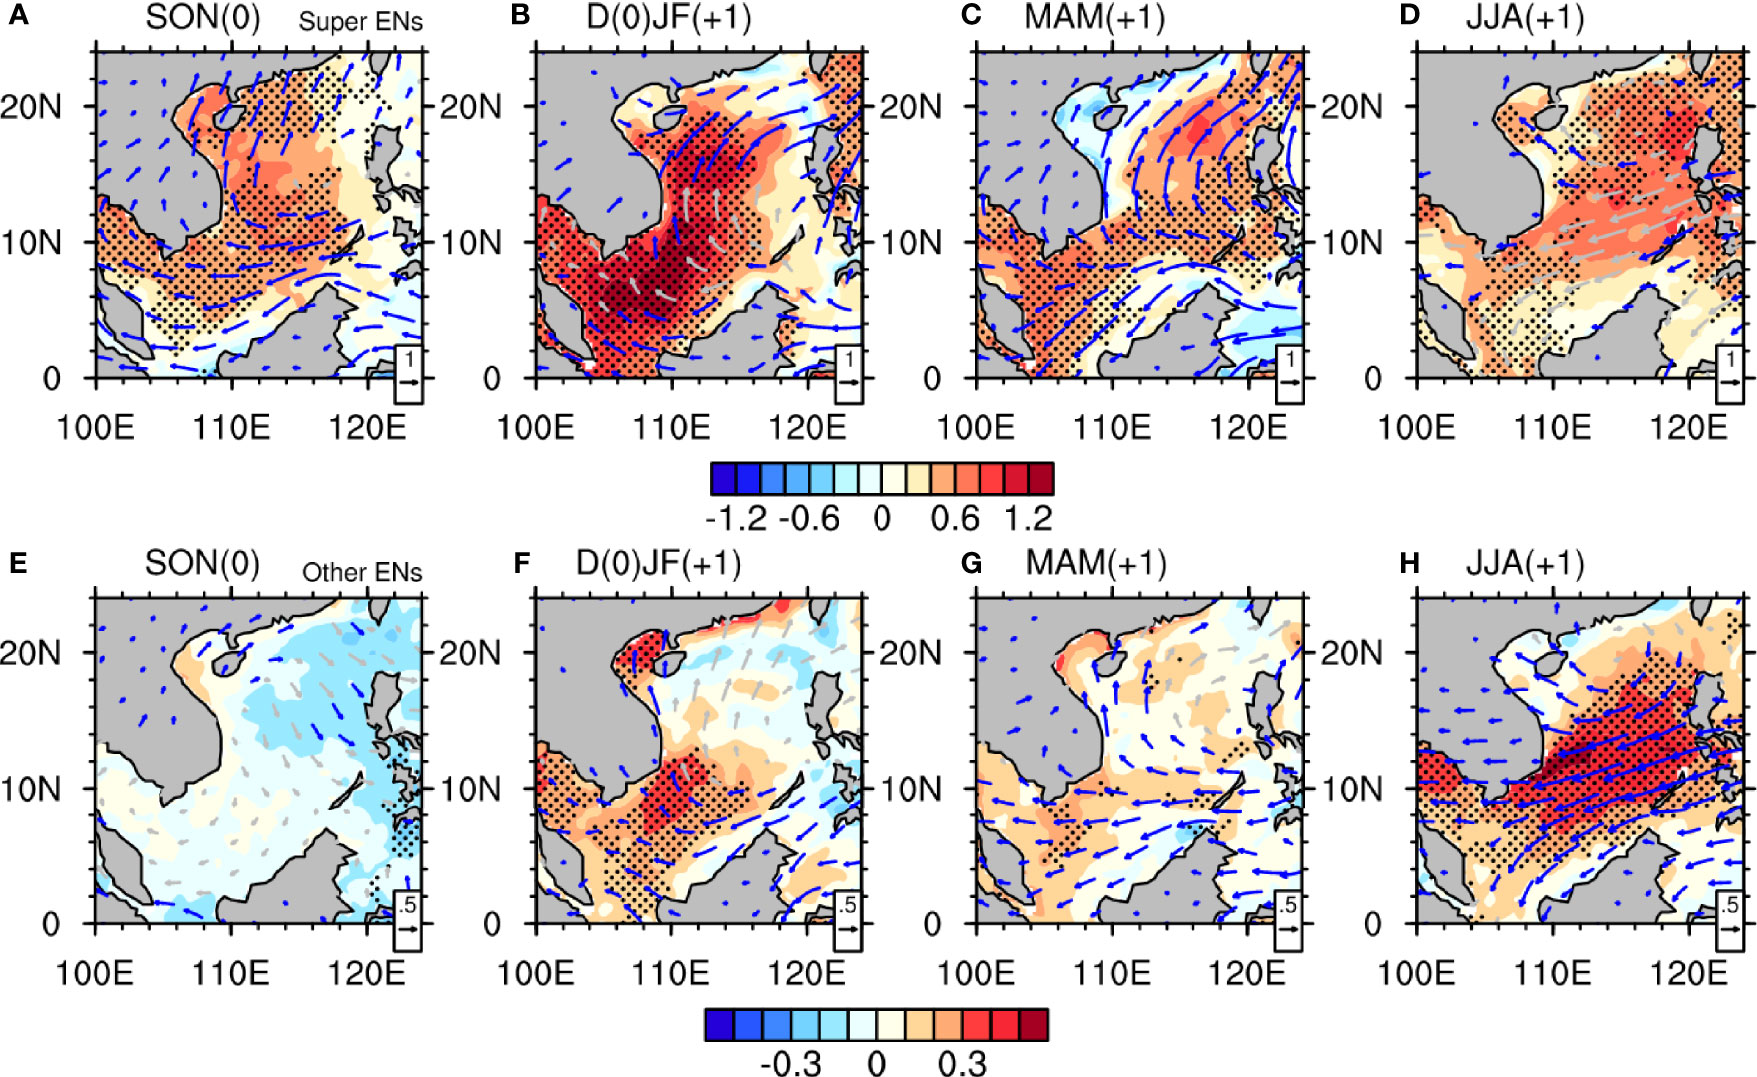
Figure 3 Composited SST anomalies (shading; unit: °C) and 975-hPa wind anomalies (vector; unit: m/s) during (A) SON(0), (B) D(0)JF(+1), (C) MAM(+1), and (D) JJA(+1) for super El Niño events. (E–H) Same as in (A–D) but for other El Niño events composite. The black dots and blue vectors indicate the composite exceeding the 90% significance level based on Student’s t-test.
3.2 Mixed Layer Heat Budget Analysis
To assess the local atmospheric and oceanic processes that contribute to the SCS SST anomalies during super and other El Niño years, the mixed layer heat budget is carried out based on Equations (1)–(3). For super El Niño composite, the cumulative SST tendencies are similar to the SST anomalies (Figures 2A, 4A). The three-dimensional oceanic advection and Qnet are positive contributions to warm the SCS SST until Dec(0), the contribution of oceanic warm advection is larger than the surface heat flux during the continuous warming period. Then oceanic advection serves to rapidly reduce in the SCS SST from Jan(+1) to Mar(+1) and turns to warm the SCS SST after Apr(+1) again. That the SST starts to cool down after second warming peak could be attributed to the negative Qnet anomalies. However, the positive Qnet seems to make the same contribution to SCS SST warming as the three-dimensional warm oceanic advection until Mar(+1) for other El Niño composite. The Qnet anomalies turn to be negative from Aug(+1) and contribute to the SCS SST cooling, although the advection still maintains a positive contribution. Compared with super El Niño events, the residual term in the mixed layer heat budget for other El Niño events is larger (Figures 4A, B). As mentioned above, we can divide the development of the SCS SST anomalies during super El Niño events into three stages. Period 1 is the rapid warming stage in OND(0), short for P1. Period 2 is the sharp cooling stage in JFM(+1), short for P2. Period 3 is the second warming stage in JJA(+1), short for P3.
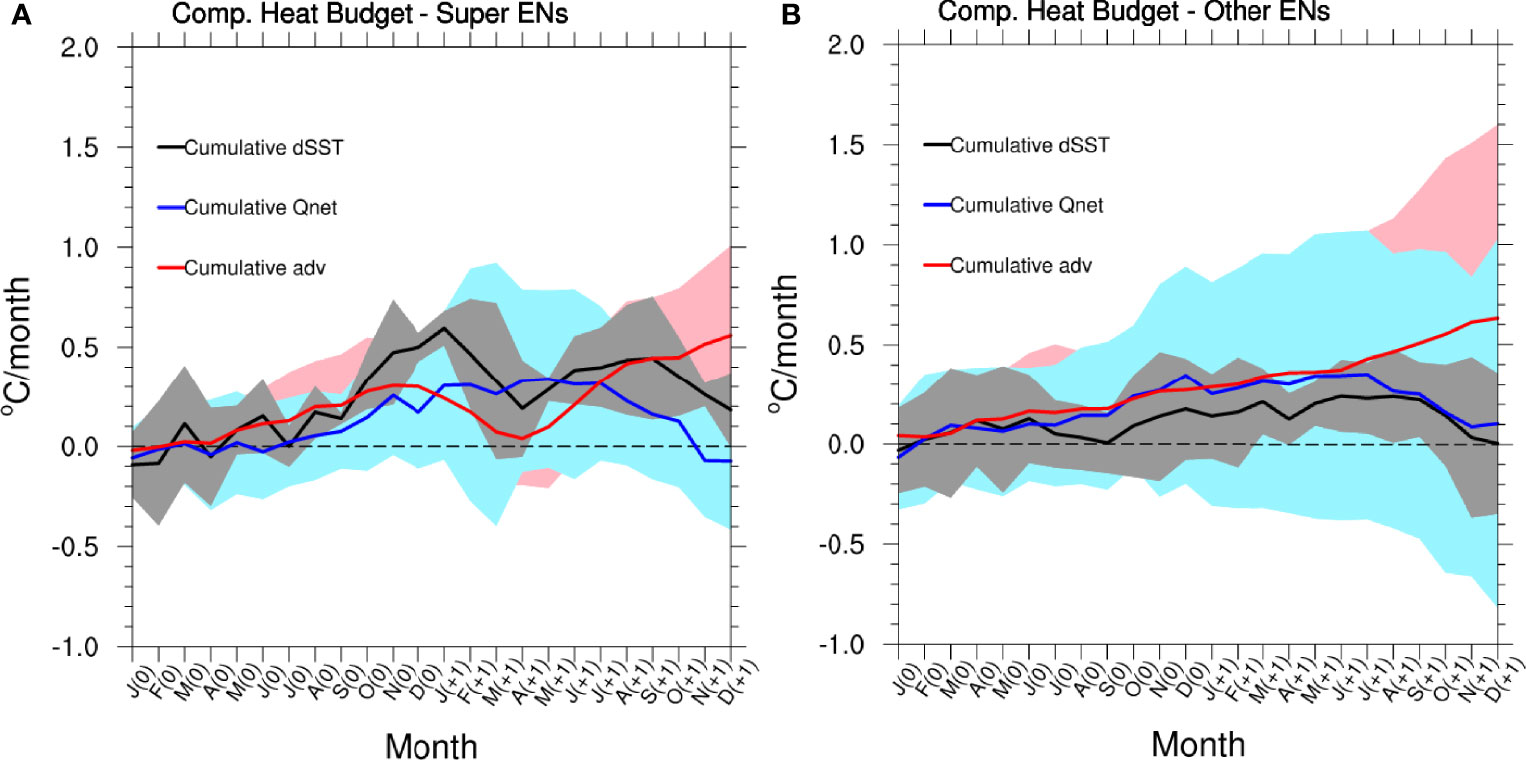
Figure 4 (A) Mixed layer heat budget results averaged over the SCS for super El Niño composite. The black line is the cumulative mixed layer temperature tendency (dSST), and the blue and red lines indicate the cumulative net surface heat flux (Qnet) and three-dimensional advections (adv), respectively. Shading indicates ±1 standard deviations of every month. (B) Same as in (A) but for other El Niño composite.
The components of Qnet and three-dimensional oceanic advection are discussed in detail. For P1, it is found that the LHF, SHF, and LWR anomalies act as thermodynamic damping terms in the Qnet. The positive SWR anomalies are responsible for the positive Qnet (Figure 5A). These results are inconsistent with Wang et al. (2006a); Liu et al. (2014) and Tan et al. (2016). They concluded that the LHF related to the wind speed was the most important contributor to Qnet averaged on the SCS basin-scale. In fact, their results also demonstrate that the LHF or Qnet only played an important role in the northern SCS, the importance of ocean circulation was reduced because their results were based on whole SCS (see Figure 5 of Liu et al., 2014 and Figure 8 of Tan et al., 2016). Therefore, the spatial distributions of Qnet, SWR, and LHF are shown in Figure 6. The positive Qnet anomalies occur in the northern SCS, weak positive and even negative Qnet anomalies occur over south of 16°N (Figure 6A). Interestingly, the SWR and LHF anomalies show opposite patterns in Figures 6B, C. The positive Qnet anomalies in the northern SCS are attributed to the positive LHF anomalies associated with reduced wind speed (Figure 7C). It is because the climatological wind during OND in the SCS is northeasterly, the anomalous southwesterly wind in the northern SCS related to the SCSAC could weaken the climatological northeasterly wind. Thus, the weakened surface wind speed reduces heat loss from the ocean to warm the SCS (Figures 3A–C). The positive SWR and negative LHF anomalies offset each other, which contributes to the weak positive or even negative Qnet anomalies over south of 16°N. It is seen that the positive SWR anomalies are also related to the SCSAC. The SCSAC-induced descending motion could suppress convective activity and significantly reduce the total cloud cover, leading to increased solar heating (Figure 7A). For other El Niño events, it is found that the LHF anomalies are positive instead of exerting the damping effect for super El Niño composite (Figure 5B). The positive Qnet anomalies occur over the whole SCS but concentrate over the eastern part (Figure 6D). The positive SWR anomalies associated with reduced total cloud cover play a dominant role in positive Qnet (Figures 6E, 7B). The LHF anomalies are weaker than that for super El Niño composite because the wind speed anomalies relative to climatology are insignificant (Figures 6F, 7D).
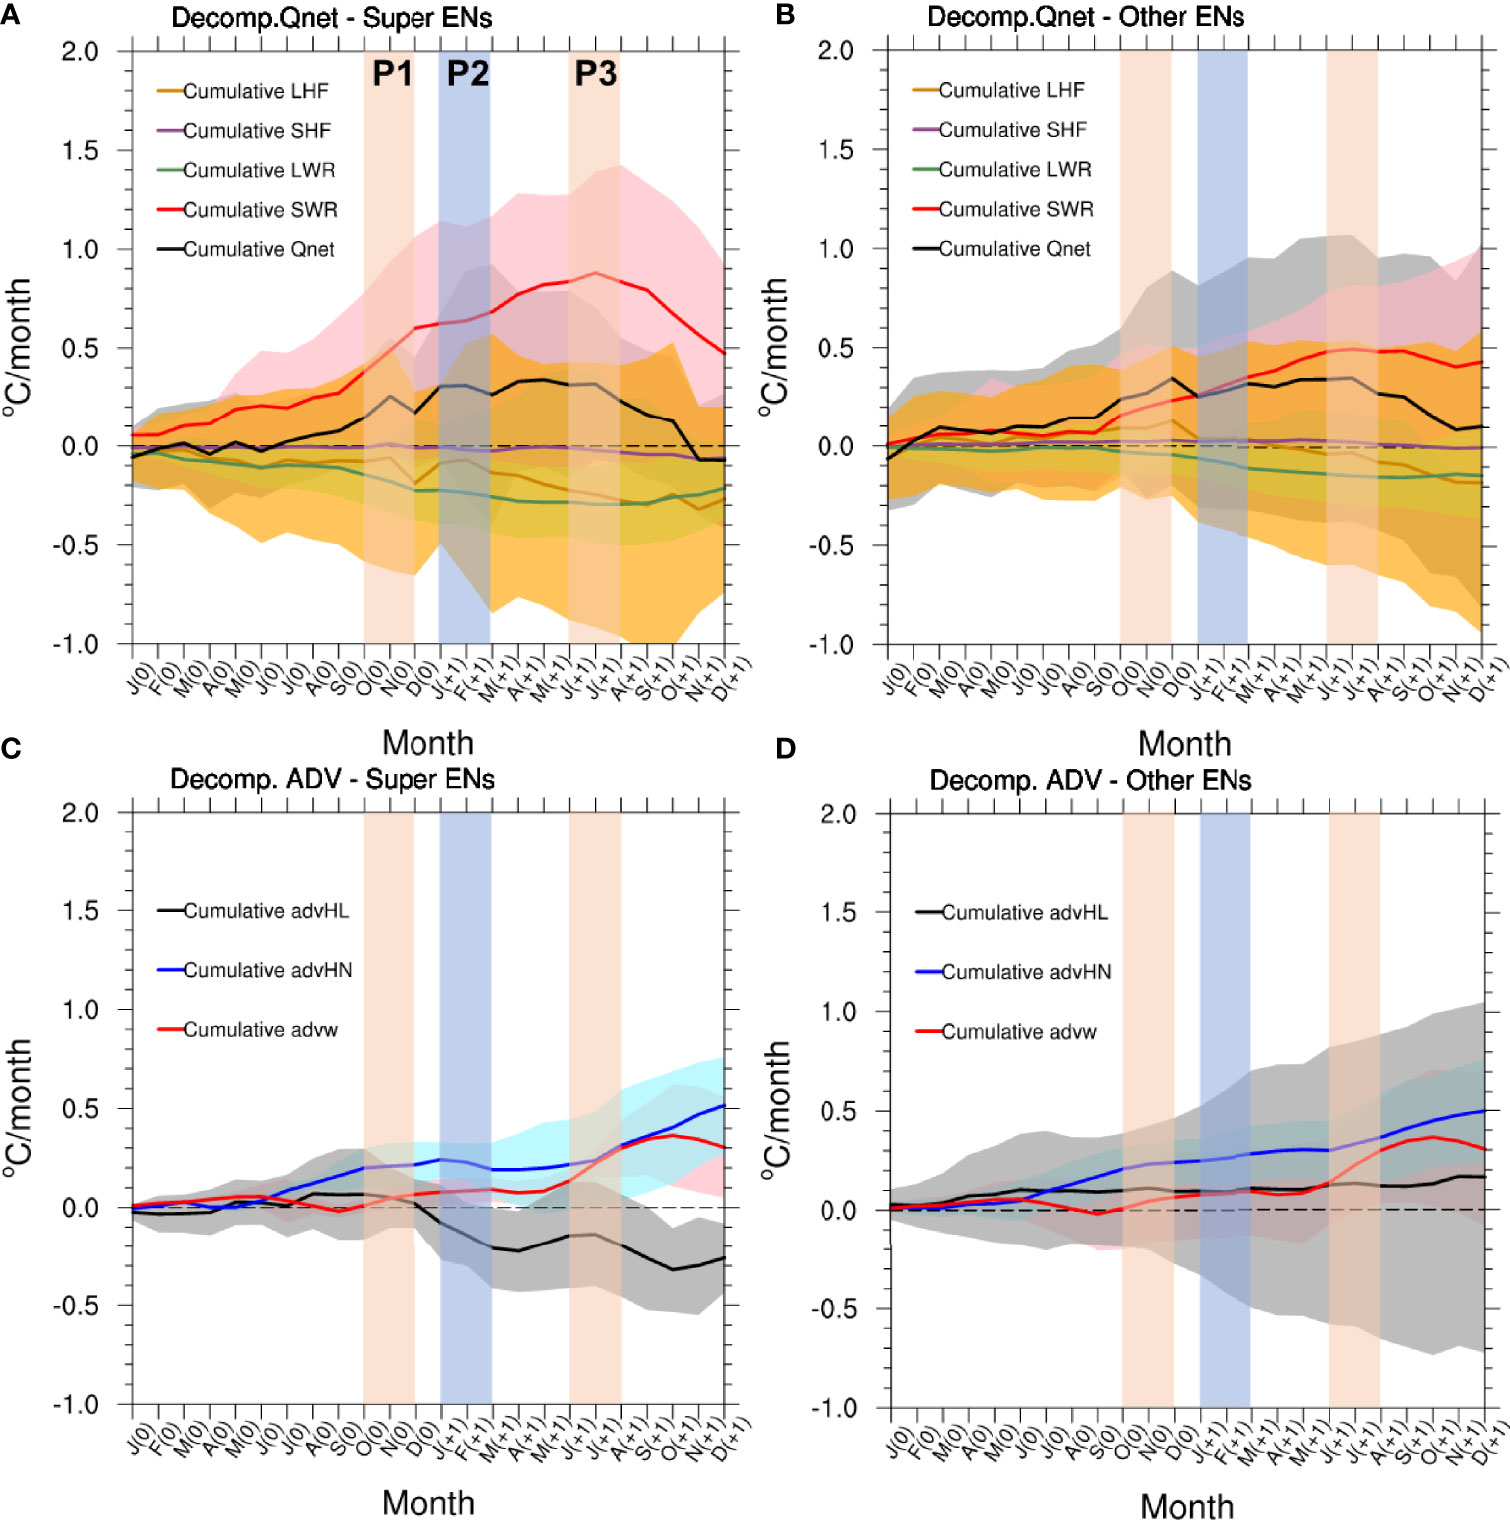
Figure 5 (A) The orange, purple, green, red, and black lines indicate the cumulative latent heat flux (LHF), sensible heat flux (SHF), longwave radiation flux (LWR), shortwave radiation flux (SWR), and net surface heat flux (Qnet) for super El Niño composite, respectively. (B) Same as in (A) but for other El Niño composite. (C) The black, blue, and red lines indicate the cumulative linear horizontal advection (advHL), nonlinear horizontal advection (advHN), and vertical advection (advw) for super El Niño composite, respectively. (D) Same as in (C) but for other El Niño composite. Shading indicates ±1 standard deviations of every month.
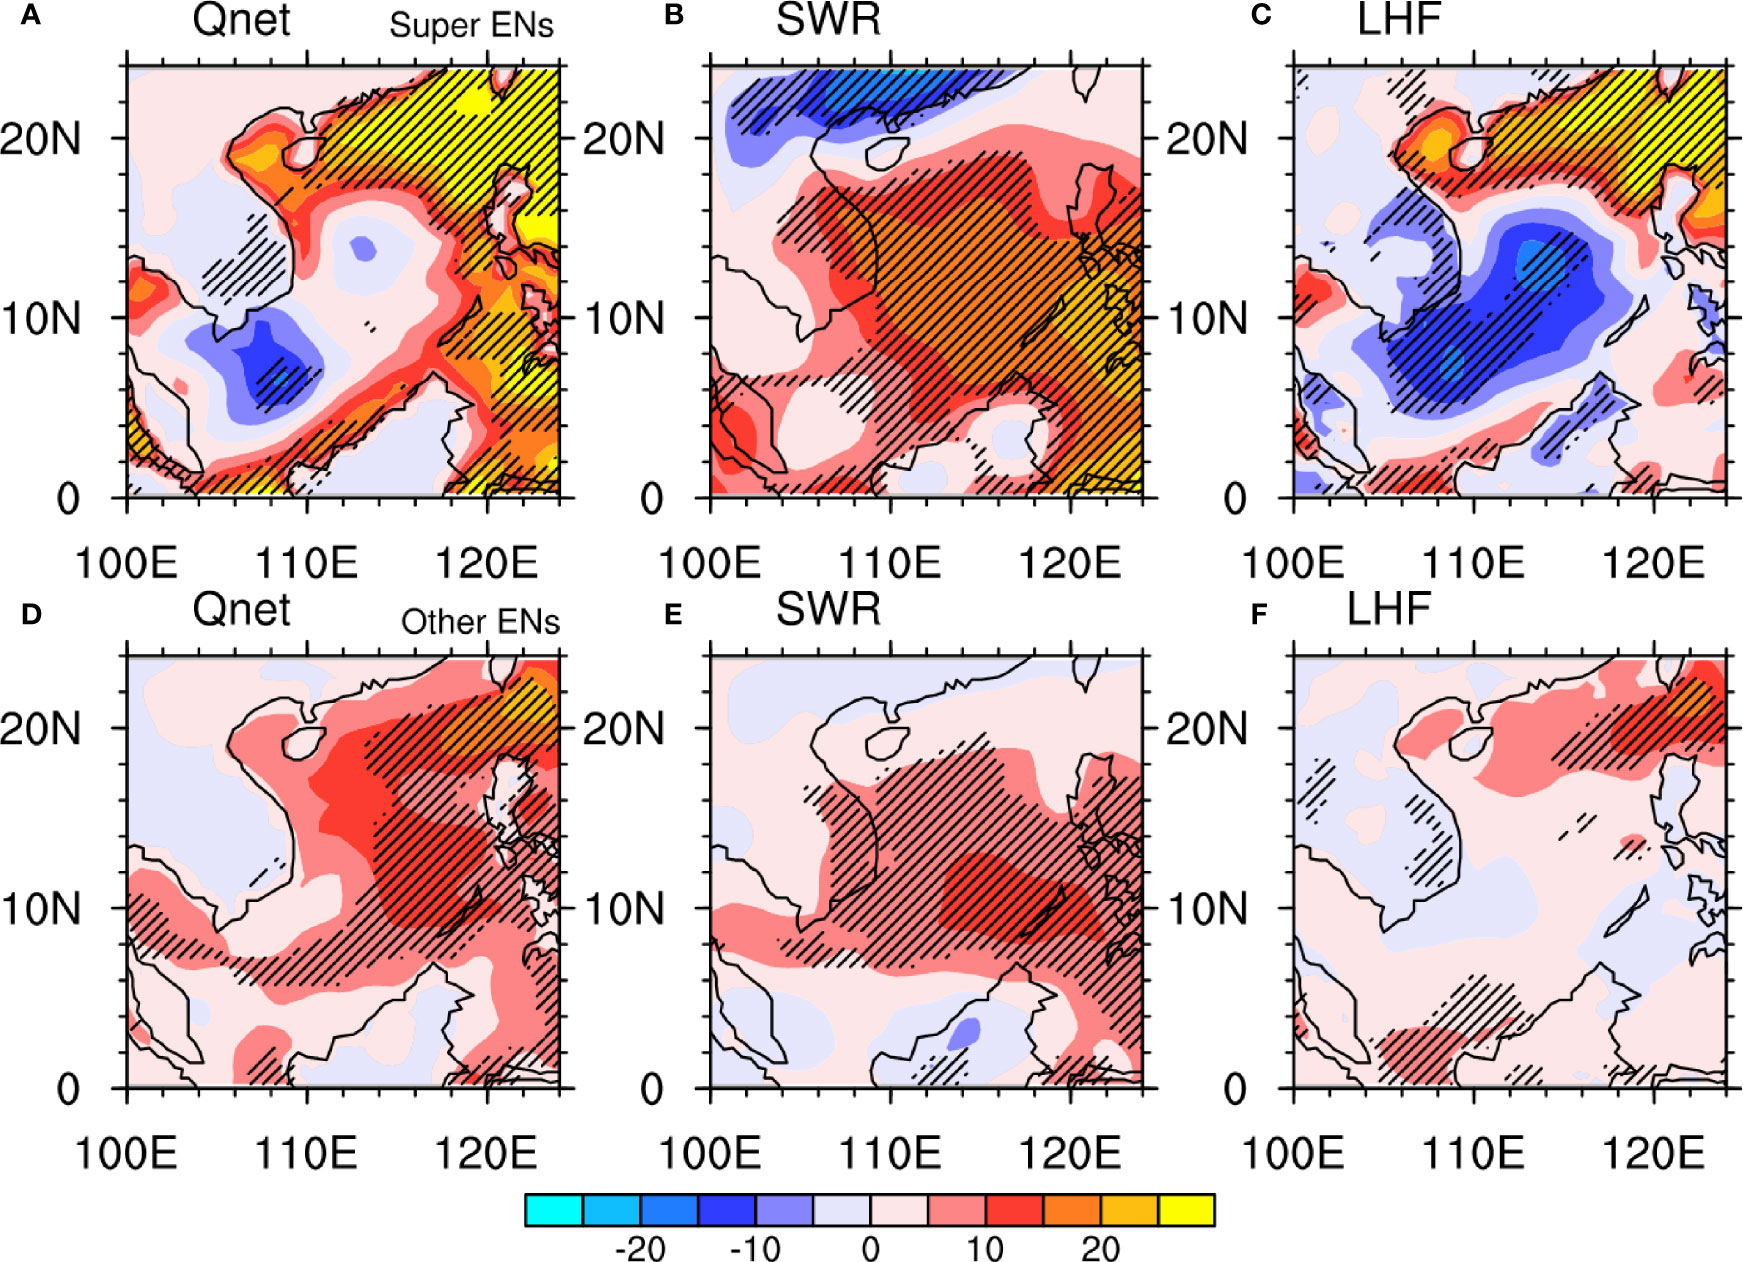
Figure 6 (A) The Qnet anomalies, (B) SWR, and (C) LHF anomalies averaged over OND(0) for super El Niño composite (Unit: W/m2). (D–F) Same as in (A–C) but for other El Niño composite. The composite results exceeding the 90% confidence level are hatched based on Student’s t-test.
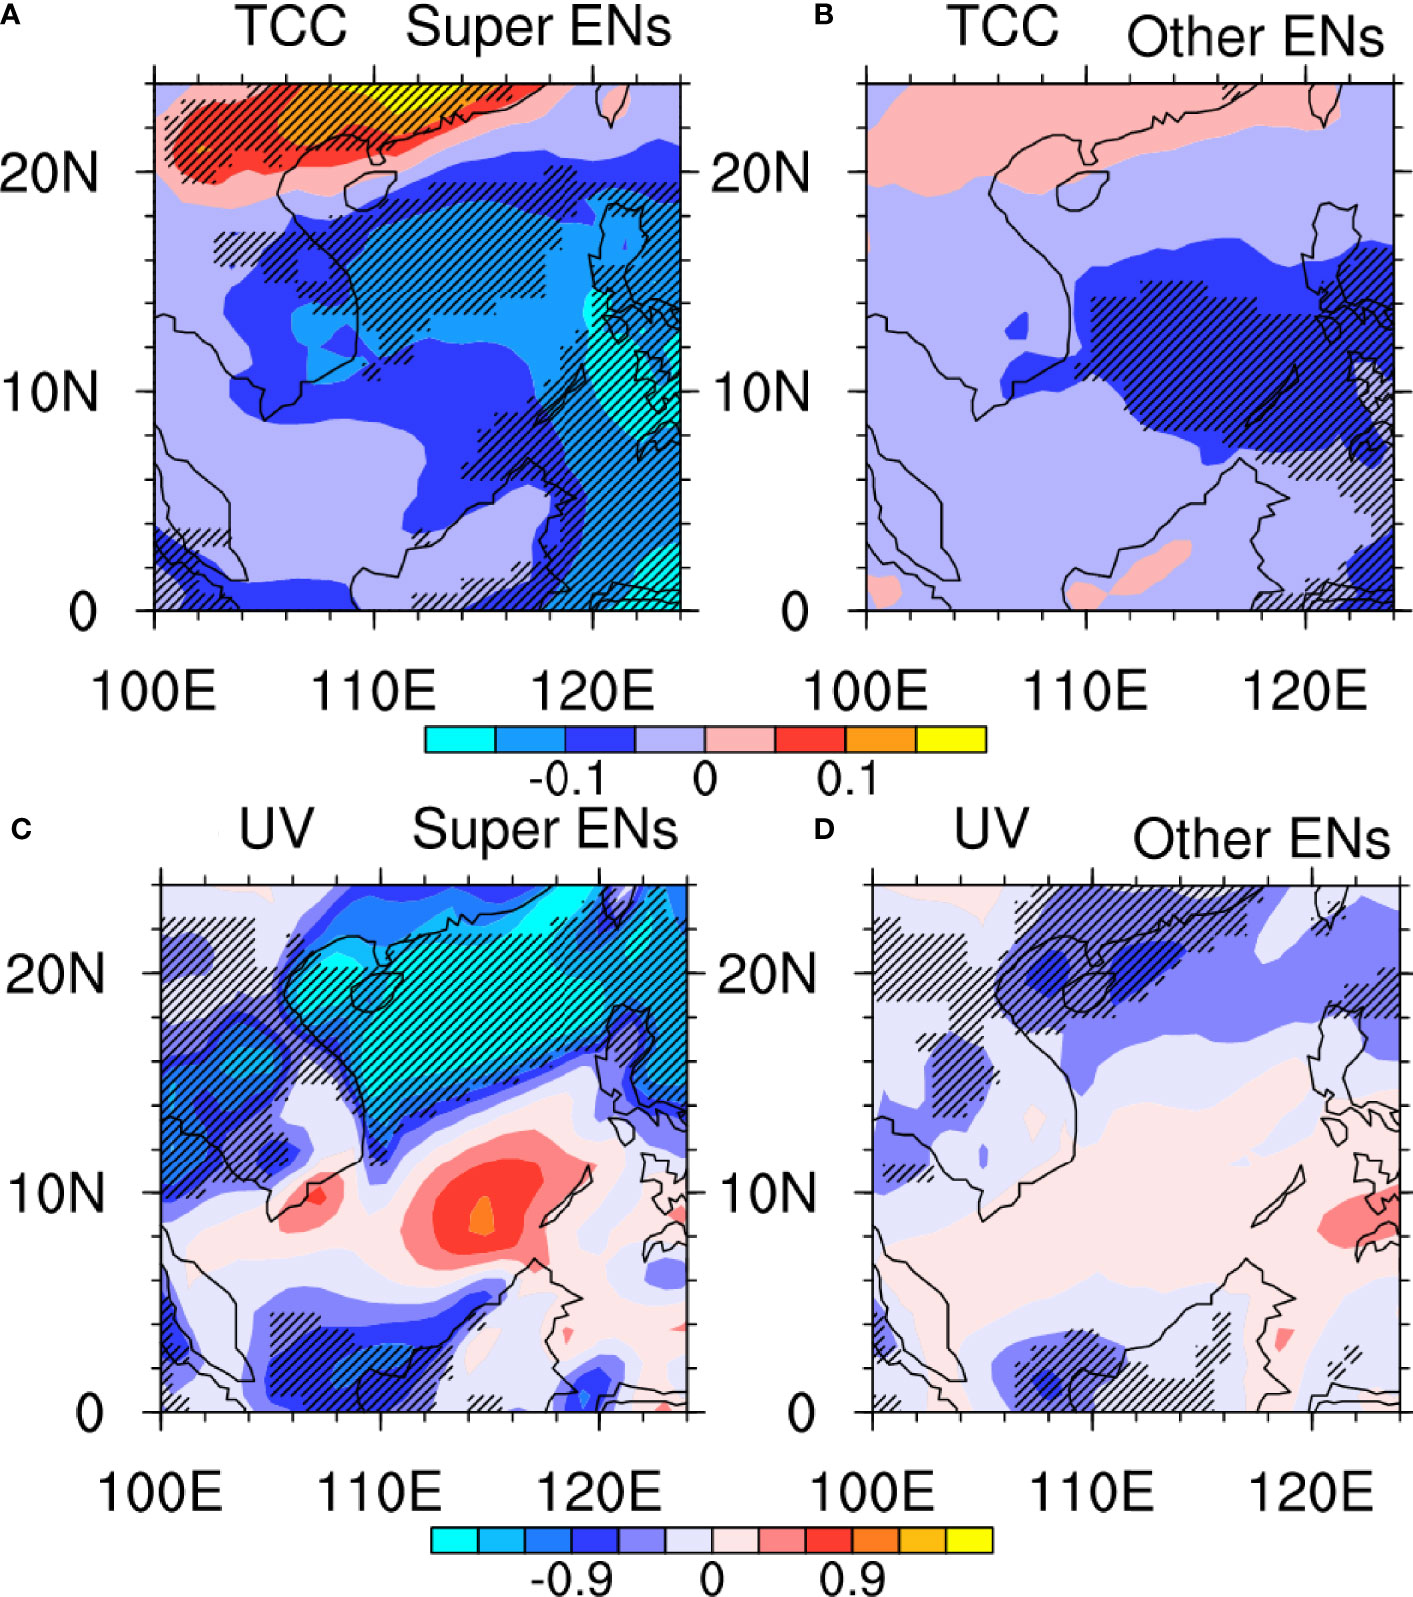
Figure 7 (A) The total cloud cover (TCC) anomalies averaged over OND(0) for super El Niño composite. (B) Same as in (A) but for other El Niño composite. (C) The wind speed anomalies averaged over OND(0) for super El Niño composite (Unit: m/s). (D) Same as in (C) but for other El Niño composite. The composite results exceeding the 90% confidence level are hatched based on Student’s t-test.
As a result, the thermodynamic process (Qnet) could only account for most rapid warming in the northern and eastern SCS for super El Niño composite. What causes the warming in the central-western SCS? To answer this question, the dynamic processes of the oceanic advection term are analyzed. Figure 5C displays that the vertical advection plays a positive role in warming the SST for super El Niño composite, while the horizontal linear advection plays a damping role. We further decompose the horizontal linear advection into horizontal advection of mean temperature by anomalous currents (MTAC) and horizontal advection of anomalous temperature by mean currents (ATMC). Although the horizontal advection of MTAC shows a warming effect, the horizontal advection of ATMC causes a stronger cooling in the western SCS (Figure 8A). Therefore, the net effect of ATMC and MTAC is that the linear horizontal advection plays a damping role during the first warming period (Figure 5C). The climatological wind stresses in the SCS are northeasterly and the wind stress curl in the central SCS is positive induced by the cyclonic circulation (Figure 9A). For super El Niño composite, it is clear that the significant SCSAC-induced negative wind stress curl occur in the central SCS (Figure 9B). The Sverdrup relation was used to connect the ocean circulation and wind stress curl in the SCS (Sverdrup, 1947; Liu et al., 2001; Xiao et al., 2018; Xiao et al., 2019). According to the Sverdrup theory, the anomalous Sverdrup transport is forced mainly by the negative wind stress curl anomalies and is balanced by weakened western boundary current transports, which forms an anomalous anticyclonic circulation in the SCS. The anomalous wind stress curl induced-anomalous anticyclone leads to basin-scale downwelling motion to make the SST warming in the central SCS, and this is why the vertical advection is the main contributor for warming the SCS SST. For other El Niño composite, the vertical advection is also important than the horizontal advection for warming the SST, but weaker than the contribution of Qnet (Figure 5D). The mechanism of the vertical advection is similar to that for super El Niño events, but the wind stress and its curl anomalies are weaker due to late establishment of SCSAC (Figures 3A, B, 9C).
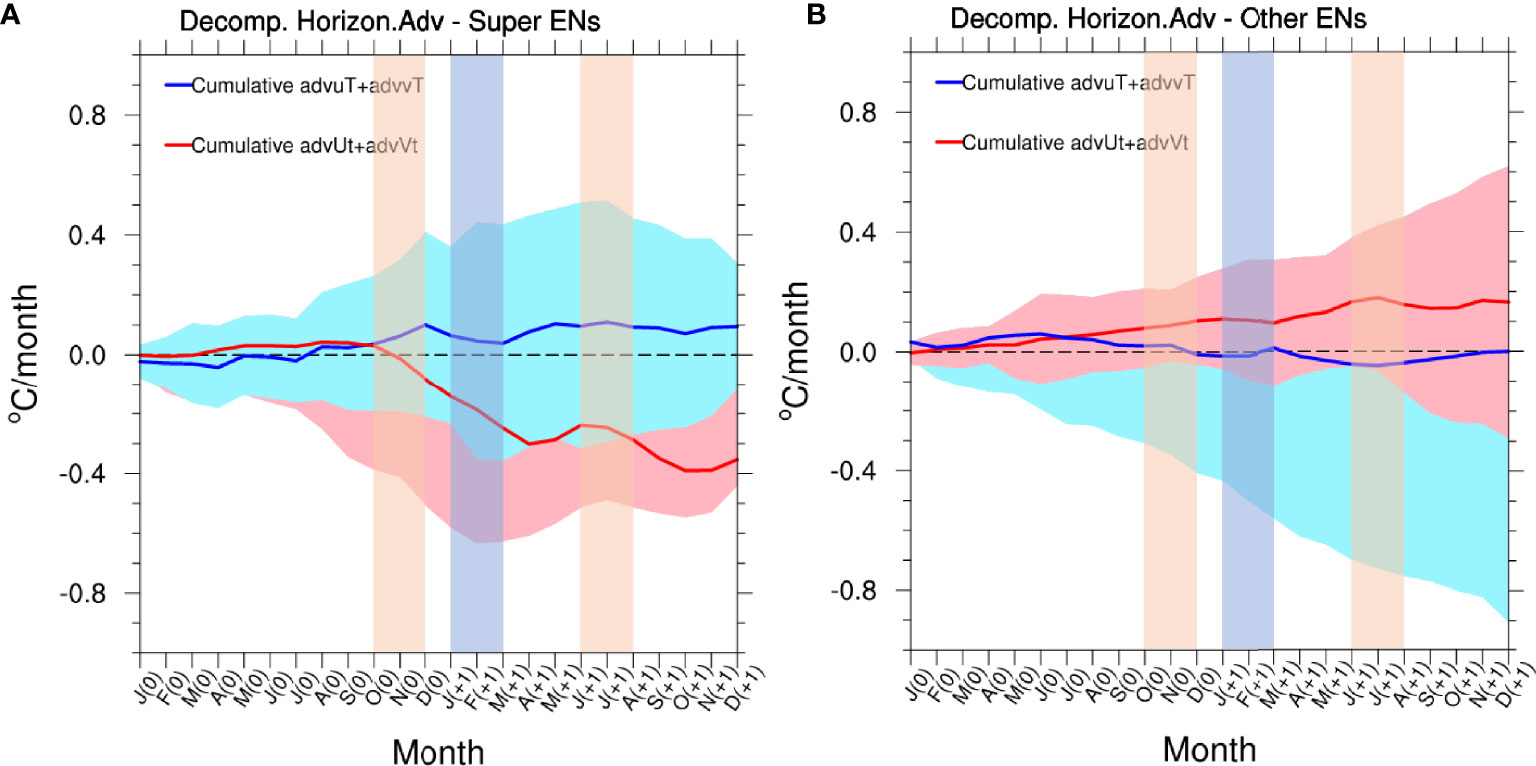
Figure 8 (A) The blue and red lines indicate the cumulative horizontal advection of mean temperature by anomalous currents (advuT + advvT) and horizontal advection of anomalous temperature by mean currents (advUt + advVt) for super El Niño composite, respectively. (B) Same as in (A) but for other El Niño composite. Shading indicates ±1 standard deviations of every month.
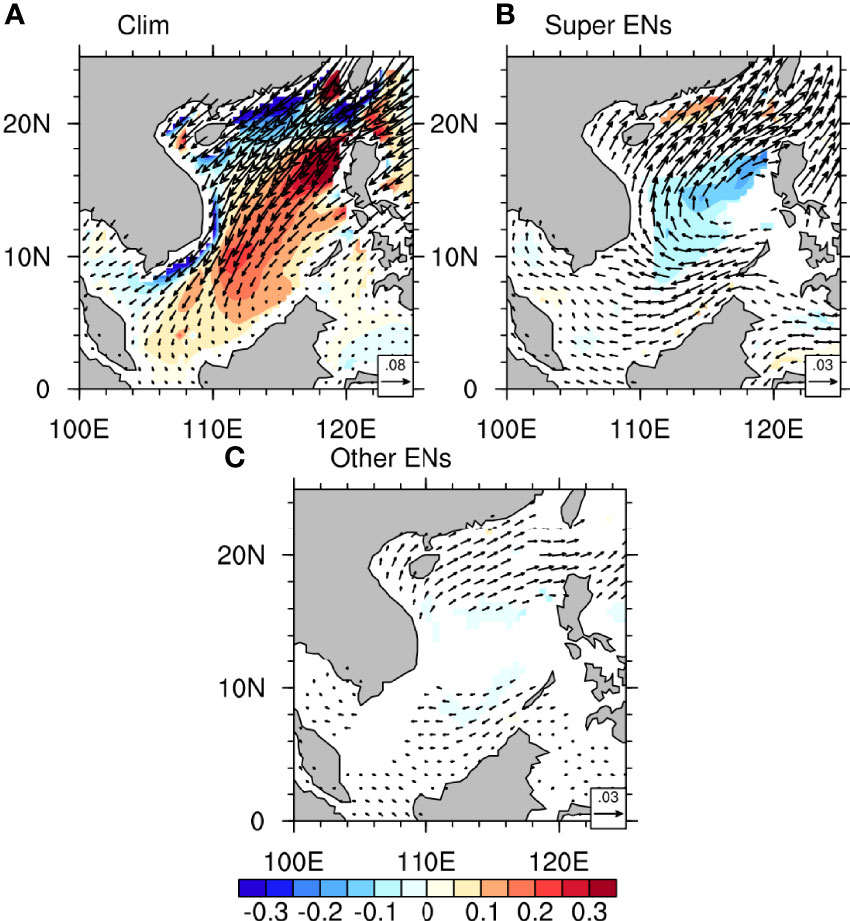
Figure 9 (A) Climatological wind stress (vectors, unit: N/m2) and wind stress curl (shading, unit: ×10−6 N/m3) over OND(0). (B) Same as in (A) but for the wind stress and wind stress curl anomalies for super El Niño composite. (C) Same as in (B) but for other El Niño composite. Shaded areas and vectors in (B, C) are only shown for the results exceeding the 90% confidence level based on Student’s t-test.
For P2, rapid cooling process occurs for super El Niño composite rather than other El Niños. This is mainly due to the difference in oceanic advection, the contribution of Qnet anomalies is very weak and can be ignored (Figure 4). Thus, only the role of oceanic advection will be discussed during P2. The decomposed advection terms show that the both the decreased horizontal linear and nonlinear advections cool the SST for super El Niño composite, especially the linear term (Figure 5C). Further decomposition indicates that the horizontal advection of ATMC is the major factor (Figure 8A). Then, the detailed analyses of the horizontal advection are clearly demonstrated by the distribution of the SST and mixed-layer averaged currents (Figures 10A–C). The SST anomalies and mean mixed layer averaged currents over JFM(+1) for super El Niño composite are shown in Figure 10A. Due to accelerated warming in previous months, the spatial distribution of the SST anomalies show a west-east gradient with the maximum warming SST concentrated in the western SCS. Then, the strong climatological western boundary currents drive more cool water from the northeastern and southeastern SCS to the central-western regions (Figure 10A). The mean SST and mixed layer averaged currents anomalies over JFM(+1) are shown in Figure 10C. The anomalous currents in the central SCS flow mainly along the isotherm, indicating that there is no thermal exchange between cold and warm water. However, there are anomalous southeasterly currents in the western part of the Luzon Strait bringing the cold water to the eastern SCS. Therefore, the horizontal linear advection of the MTAC remains as a negative contribution. Lastly, the SST anomalies and mixed layer averaged currents anomalies over JFM(+1) are shown in Figure 10E, indicating the horizontal nonlinear advection. As mentioned above, it is obviously seen that the anomalous southwesterly currents drive anomalous cold water from eastern SCS to the central part. Consistent with the decomposition of mixed layer heat budget analysis, the horizontal advection of ATMC is the largest contributor due to the strongly intensified ocean currents and large influence range. For other El Niño composite, the reduced SST only occurs in Apr(+1) which means the SST anomalies have been maintained during P2 (Figure 2B). As in previous analyses, only the role of oceanic advection is discussed. Further decomposition results demonstrate that the major contributor to maintaining the SST anomalies was the horizontal nonlinear advection, while the horizontal linear and vertical advections had little impact (Figure 5B). As the two components of the horizontal advection, the negative ATMC and positive MTAC offset each other during P2 (Figure 8B). Different configurations of SST and currents are shown in the right panels of Figure 10. The climatological western boundary currents drive a cold advection to cool the SST in the central and western SCS, which is similar to that of super El Niños, but the cold advection is weaker due to a weak west-east gradient in the northern-central SCS with the maximum warming SST concentrated in the southern SCS (Figure 10D). The mean SST and mixed layer averaged currents anomalies over JFM(+1) in Figure 10D display some obviously contrasts between Figure 10C. The anomalous currents in the western SCS flow across the isotherm, indicating that the warm advection drive warm water from the western SCS to the north, although the SST gradient in the western SCS is not as large as that in the eastern part (Figure 10D). Thus, the two components of linear advection counteract each other in the western SCS like those analyzed before. Lastly, both the northward currents anomalies and maximum SST gradient are located in the western SCS, resulting in warm advection effect to make the SCS SST unreduced during P2. Based on the above analyses, the rapid cooling in JFM(+1) for super El Niños could be attributed to the continuous warming-induced large SST gradient during the first warming peak.
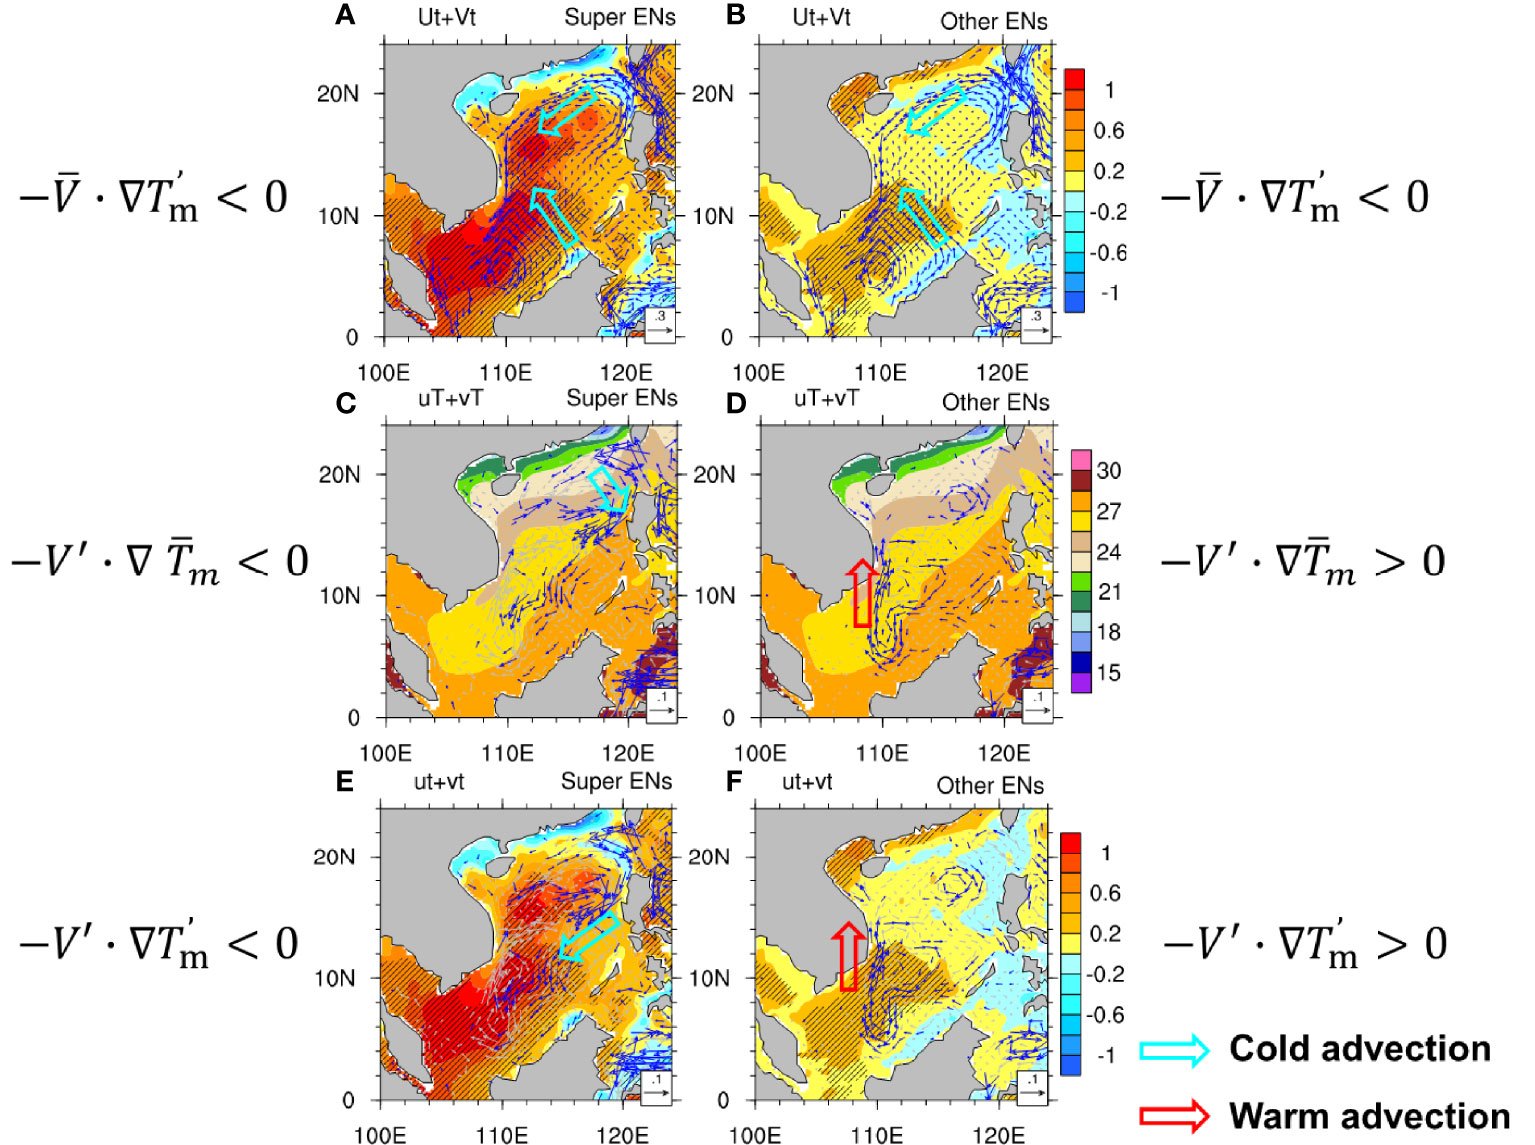
Figure 10 (A) The SST anomalies (shading, unit: °C) and mean mixed layer averaged currents (vectors, unit: m/s) over Jan–Feb–Mar [JFM(+1)] for super El Niño composite. (B) Same as in (A) but for other El Niño composite. (C) Mean SST (shading) and mixed layer averaged current anomalies (vectors) over JFM(+1) for super El Niño composite. (D) Same as in (C) but for other El Niño composite. (E) The SST anomalies (shading) and mixed layer averaged current anomalies (vectors) over JFM(+1) for super El Niño composite. (F) Same as in (E) but for other El Niño composite. The composite SST and current results exceeding the 90% confidence level are hatched and shown in blue vectors based on Student’s t-test.
For P3, the mechanisms for SST warming for super and other El Niños are very similar. The Qnet anomalies act as a damping role to cool the SST, so the second warming period in other El Niños could be attributed to the oceanic warm advection (Figure 4). Further decomposition results show that the vertical warm advection controls most of the total advection (Figures 5C, D). This process is very easy to understand: the SCSAC weakened but the anomalous easterly winds strengthened to reduce the upwelling over the SCS, especially off the coast of southeast Vietnam (Figures 3D, H, Xie et al., 2003). It is clear that the maximum warming center is located in the same region of easterly winds for other El Niños. The second warming rate for super El Niños is smaller than that of other El Niños because the horizontal advection of ATMC offsets the warming partially (Figure 8A).
3.3 Large-Scale Forcing From the Indian Ocean
Based on above analyses, it is understood that the thermodynamic and dynamic processes related to the SST warming and cooling are directly associated with SCSAC. Previous studies have demonstrated that the life cycle of the SCSAC is tightly tied to the phase of El Niño. On average, the SCSAC forms during El Niño developing fall and establishes during winter, maintains during the subsequent spring and summer, then decays (Wang et al., 2000; Wang and Zhang, 2002; Wang et al., 2003; Kim and An, 2019). It is shown that the warming SST anomalies in the central-eastern Pacific (CEP) reach maximum in OND(0) and gradually retreat eastward in following seasons for super El Niño events (Figures 11A–D). While the warming SST anomalies in the CEP also reach maximum in OND(0) but gradually retreat westward in following seasons for other El Niños (Figures 11E–H). It has been widely accepted that the establishment of SCSAC in OND(0) for super El Niño events could be largely attributed to the cold SST anomalies in the WNP associated with El Niño, especially in the Maritime Continent region, by a Rossby wave-like response (Figure 11A, Matsuno, 1966; Gill, 1980; Watanabe and Jin, 2002; Xiao et al., 2020b). In contrast, a weak SCSAC starts to establish in OND(0) for other El Niños. Relative vorticity is used to quantify the intensity of SCSAC. The evolution of the relative vorticity anomalies display that the rapid establishment of SCSAC in Oct(0) for super El Niños (Figure 12A). In JFM(+1), the SCSAC moves eastward, along with eastward withdrawal of the cyclonic anomalies extending from the CEP, indicating the formation of WNPAC for super El Niños (Figure 11B). This WNPAC could be maintained until AMJ(+1), then rapid weakens in JAS(+1) (Figures 11C, D, and 12A). In contrast, the SCSAC fully establishes in JFM(+1) for other El Niños, the relative vorticity over the SCS also reaches its minimum in Mar(+1) in Figure 12A. Then the continuous easterly wind anomalies extend from the central Pacific to the entire Indian Ocean for other El Niños, as opposed to a strong WNPAC for super El Niños (Figure 11F), and decay in JAS(+1). Xie et al. (2009) proposed one maintenance mechanism of the WNPAC via the Indian Ocean capacitor effect, namely the tropical Indian Ocean warming following the El Niño event could force a warm equatorial Kelvin wave to the east to maintain the WNPAC. In this study, the Indian Ocean also plays an important role in the discrepant evolutions of SST anomalies in the SCS between super and other El Niño events. The significantly Indian Ocean warming basin mode (IOBM) occurs from OND(0) to AMJ(+1) for super El Niño composite, IOBM could strengthen the SCSAC through the warm equatorial Kelvin wave, indicating its important role in establishment and maintenance of WNPAC (Figures 11A–C). The IOBM index (area-averaged SST anomalies over 20°S–20°N, 40°–100°E) in Figure 12B also shows a continuous warming until Apr(+1), which is consistent with the intensity of SCSAC (correlation coefficient is −0.84) for super El Niños, then the IOBM and SCSAC decay in JAS(+1). In contrast, the IOBM occurs from AMJ(+1) to JAS(+1) for other El Niño composite, and is later and weaker than that of super El Niños (Figures 11E–H). It is noteworthy that the IOBM reaches its peak in JAS(+1), indicating that the Indian Ocean is warmer than during super El Niños. The warm Indian Ocean enhances the SST gradient between the WNP and Indian Ocean to contribute the second warming stage though easterly wind anomalies in the SCS (Figures 11H, 12B).
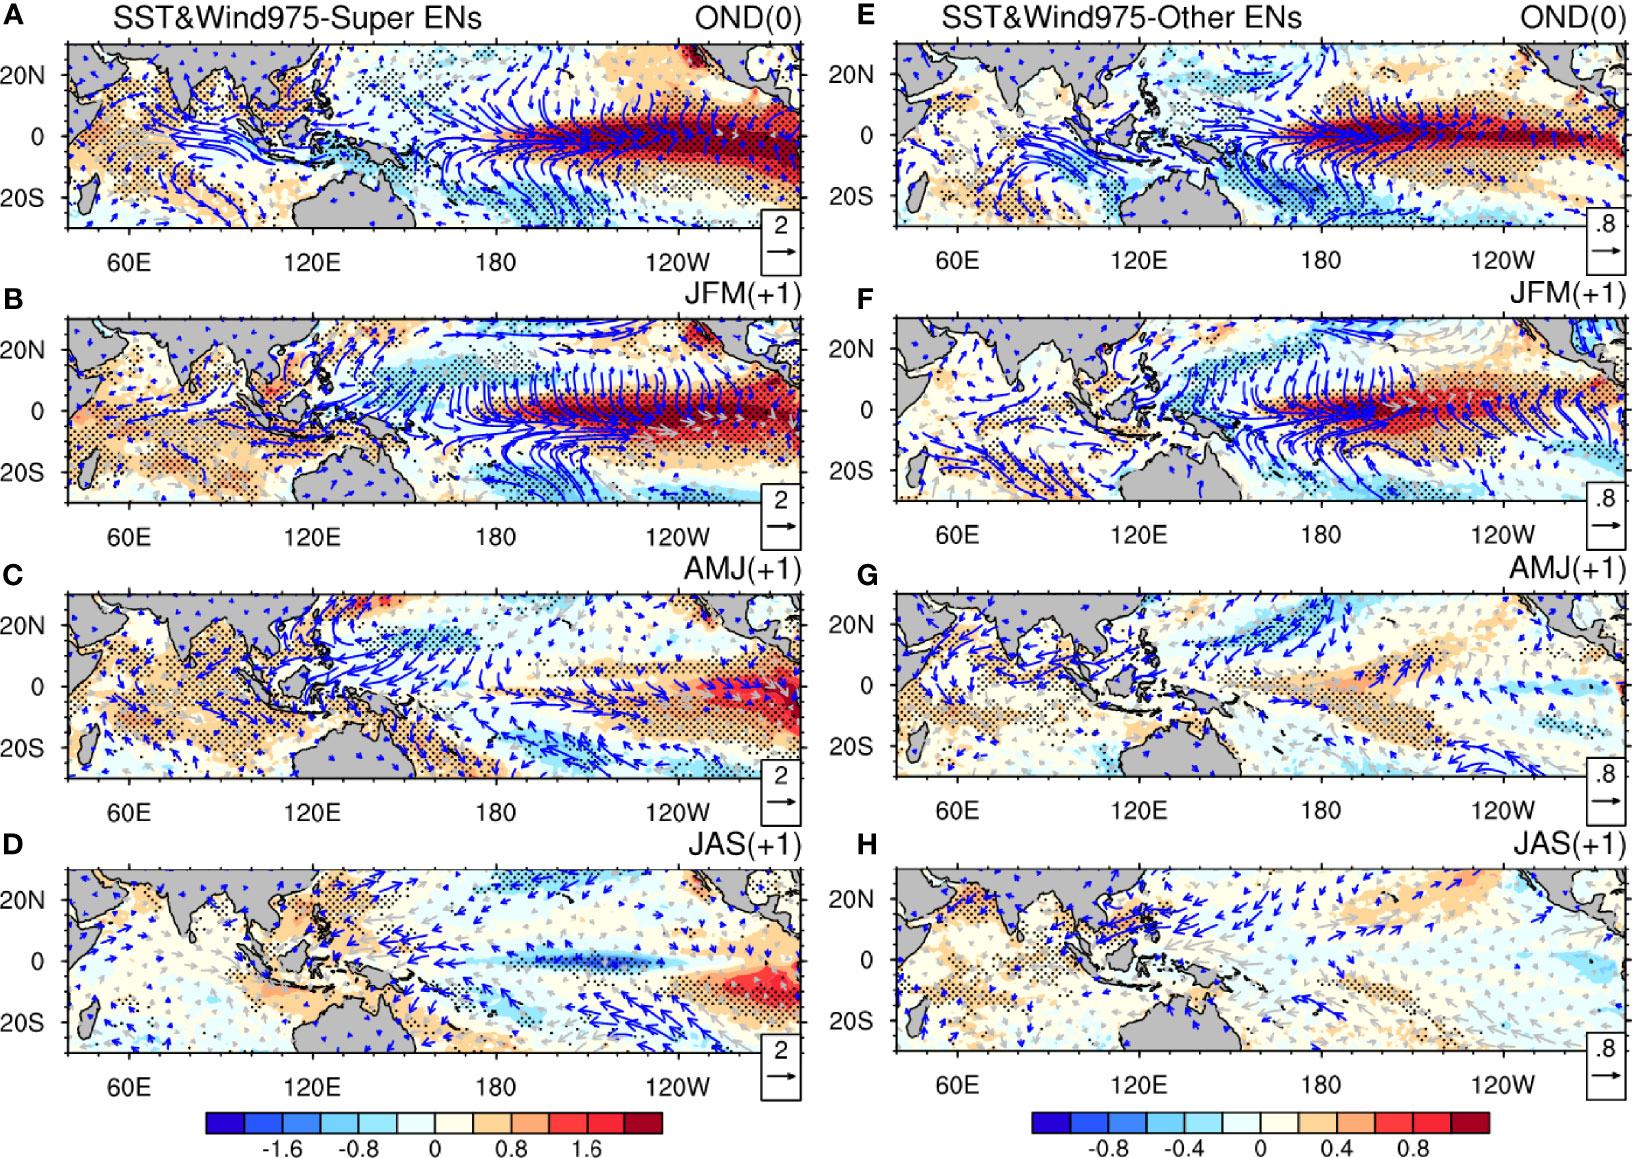
Figure 11 Composited SST anomalies (shading; unit: °C) and 975-hPa wind anomalies (vector; m/s) during (A) OND(0), (B) JFM(+1), (C) AMJ(+1), and (D) JAS(+1) for super El Niño events. (E–H) Same as in (A–D) but for other El Niño events composite. The black dots and blue vectors indicate the composite exceeding the 90% significance level based on Student’s t-test.
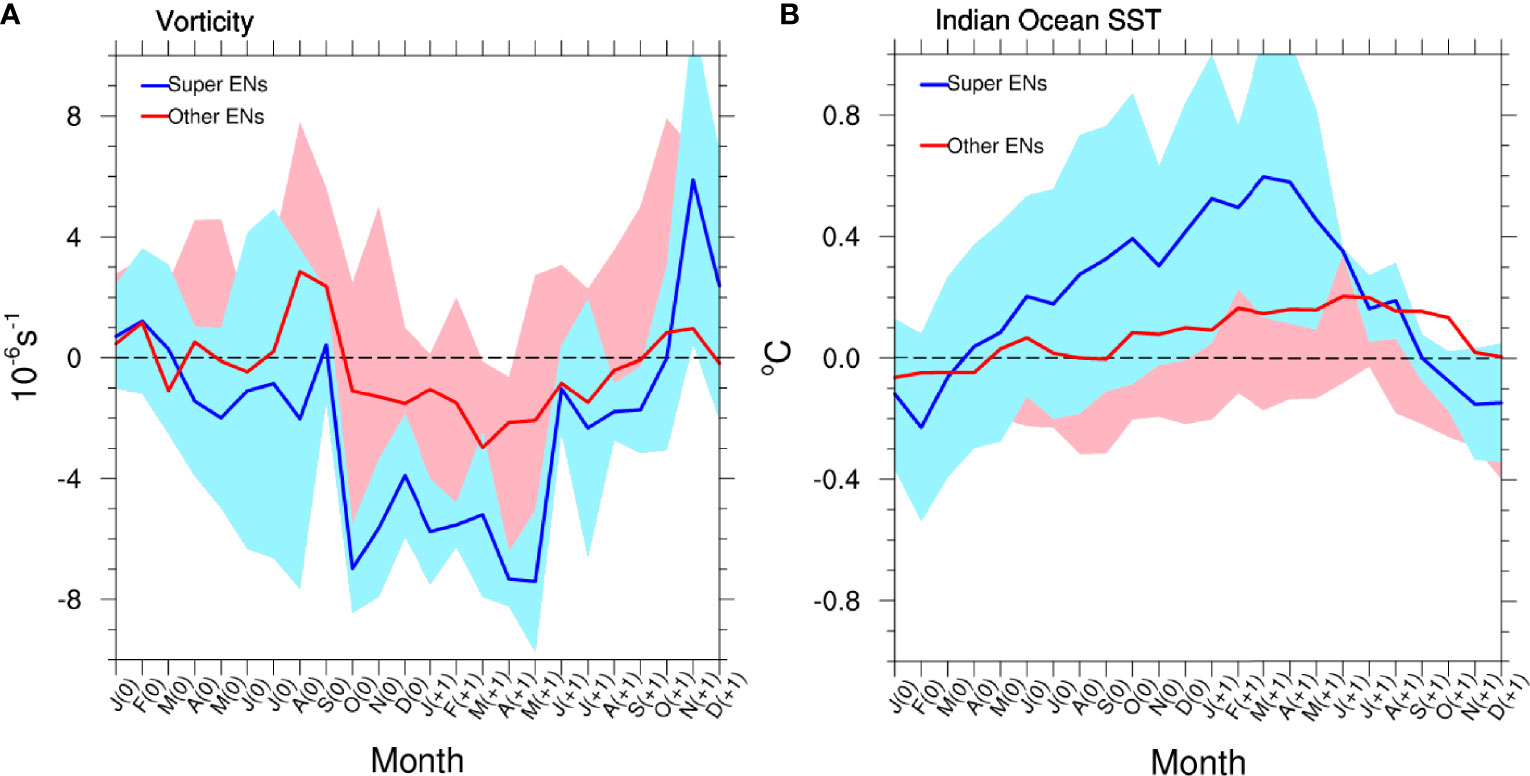
Figure 12 (A) The blue and red lines indicate the vorticity anomalies averaged over the SCS for super and other El Niño composite, respectively. (B) Same as in (A) but for the SST anomalies over the Indian Ocean (20°S–20°N, 40–100°E). Shading indicates ±1 standard deviations of every month.
4 Conclusions and Discussion
Previous studies mainly focused on the impact of the El Niño and its diversity on the SCS SST. In this study, observed different evolutions of SCS SST anomalies between super and other El Niño events were revealed by the composite analyses. The SCS SST anomalies have two warming peaks in the El Niño mature winter and decaying summer. The SCS starts to warm in Aug(0) and lasts more than one year for super El Niño composite. However, for other El Niño composite, the SCS warms later in Dec(0) and the warming intensity is weaker. Another prominent feature is that the first (second) warming peak warmer than the second (first) one for super (other) El Niños, indicating that the different impacts of El Niño with different intensities on the SCS SST. Then, according to the SCS SST variation, three different warming and cooling stages are compared by carrying out the mixed layer heat budget analysis.
During the first warming period, the positive LHF anomalies induced by reduction of wind speed could only account for the rapid warming in the northern SCS. The reduced total cloud cover-induced positive SWR anomalies and enhanced wind speed-induced negative LHF anomalies offset each other in the central SCS. Further analysis displays that the established SCSAC-induced vertical advection warms the SST in the central SCS through the basin-scale downwelling motion for super El Niños. In contrast, the positive SWR anomalies associated with the reduced total cloud cover contribute the most warming SST for other El Niños, and the vertical warm advection is less important.
During the cooling period, the oceanic advections are more important than the Qnet term. The horizontal linear advection of ATMC plays the most important role in rapid cooling SST for super El Niño composite. The SST anomalies show a west-east gradient with the maximum warming SST concentrated in the western SCS due to accelerated warming in previous months. The western boundary currents drive more cold water from the northeastern and southeastern SCS to the central-western regions to cool the SCS. In contrast, the cold advection of ATMC is weak due to small west-east SST gradient and offset by the warm advection of MTAC for other El Niño composite. Both the northward currents anomalies and maximum SST gradient are located in the western SCS, resulting in warm advection effect to make the SCS SST not reduce during this stage.
During the second warming period, the mechanisms for SST warming for super and other El Niños are very similar. The Qnet term acts as a damping term, while the warming process could be attributed to the vertical warm advection. Specially, the SCSAC weakened but the anomalous easterly winds strengthened to reduce the upwelling over the SCS, especially off the coast of southeast Vietnam for other El Niño composite. The second warming rate for super El Niño composite is smaller than that of other El Niños, because the horizontal advection of ATMC offsets the warming partially. The schematic map is shown in Figure 13.
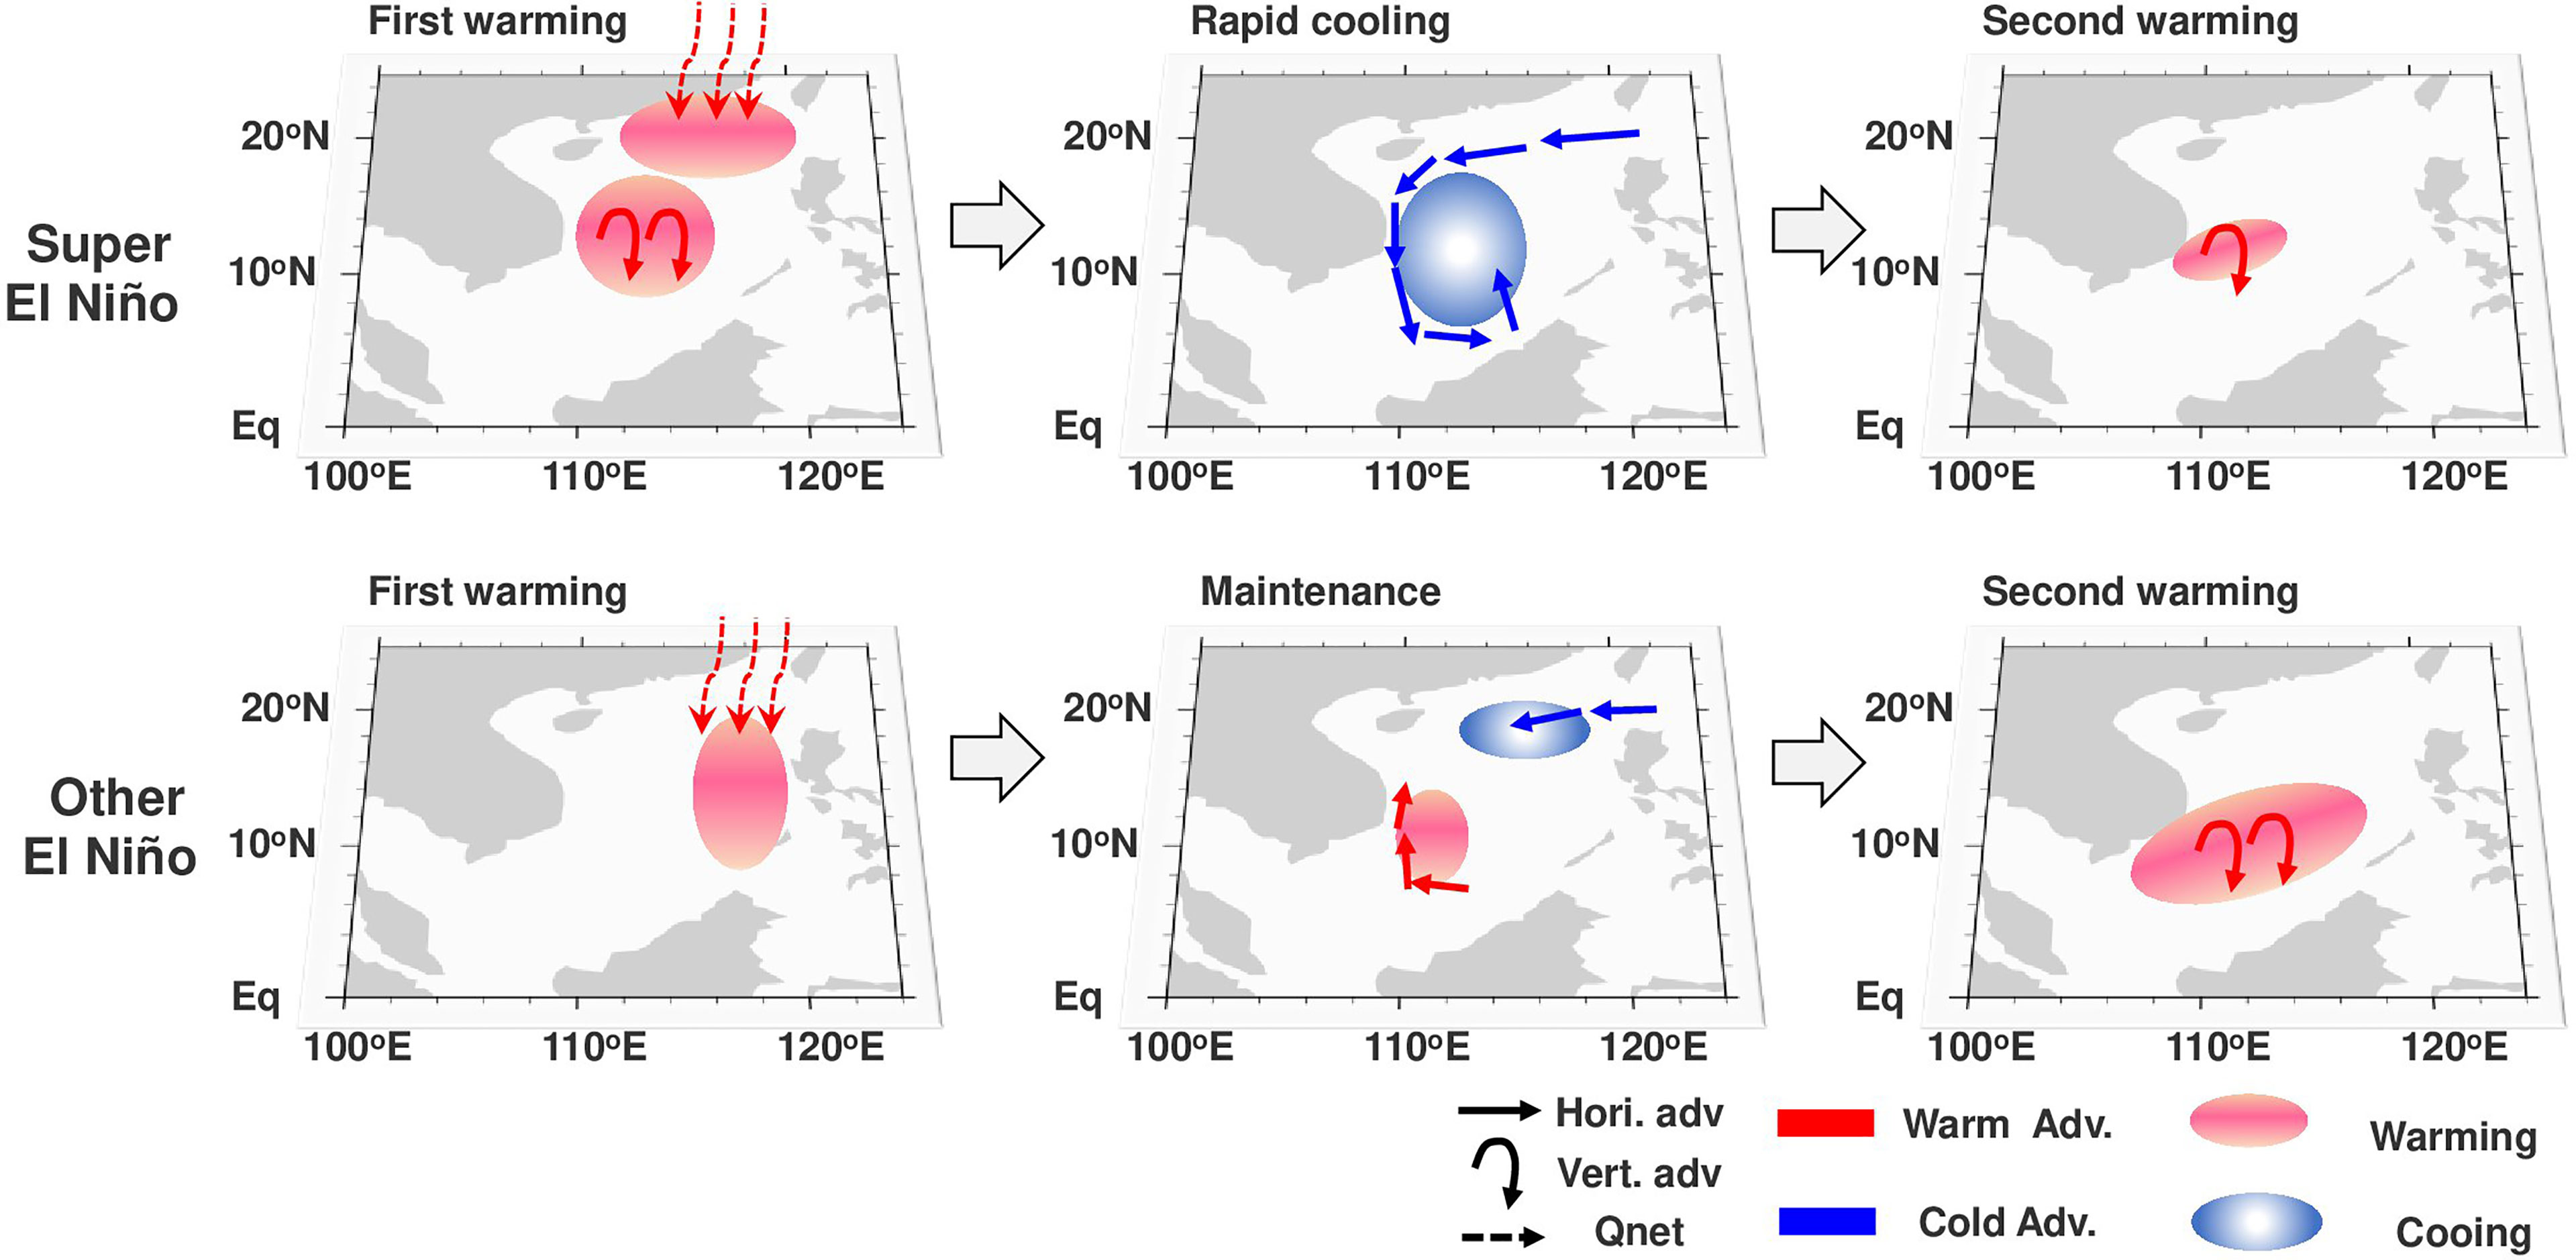
Figure 13 Schematic illustrating the discrepant effects of oceanic advection in the evolution of SCS SST anomalies during El Niño of different intensities.
From the above results, it is well understood the different influences of El Niño with different intensities on SCS SST were mainly exerted via oceanic advection. The different ocean circulations and associated advections are related to the development of SCSAC. Based on the previous studies, the atmospheric response associated with the Indian Ocean warming is a very important factor for SCSAC, especially for super El Niños and the correlation coefficient between the SCSAC and Indian Ocean SST reaches −0.84. It is noteworthy that weaker relationship between the Indian Ocean and SCSAC (r = −0.61) indicates that some other factor could impact the SCSAC for other El Niños, such as the Madden–Julian Oscillation (Xiao et al., 2020c). The evolutions of SCS SST anomalies differ in each El Niño, the monthly-scale characteristics of ENSO’s impact on SCS SST will be investigated in future work.
Data Availability Statement
The original contributions presented in the study are included in the article/supplementary material. Further inquiries can be directed to the corresponding author.
Author Contributions
FX conducted the analyses and wrote the manuscript. DW read through the manuscript and provided revisions. All authors listed have made a substantial, direct, and intellectual contribution to the work and approved it for publication.
Funding
This work was supported by the National Natural Science Foundation of China (Grant Nos. 92158204, 41806027, 42006035), the open fund of State Key Laboratory of Satellite Ocean Environment Dynamics, Second Institute of Oceanography, MNR (Grant No. QNHX2108), the Innovation Group Project of Southern Marine Science and Engineering Guangdong Laboratory (Zhuhai) (Grant No. 311020004), and the GuangzhouU-HKUST Joint Research Fund (Grant Nos. YH202101 and GZU21SC03).
Conflict of Interest
The authors declare that the research was conducted in the absence of any commercial or financial relationships that could be construed as a potential conflict of interest.
Publisher’s Note
All claims expressed in this article are solely those of the authors and do not necessarily represent those of their affiliated organizations, or those of the publisher, the editors and the reviewers. Any product that may be evaluated in this article, or claim that may be made by its manufacturer, is not guaranteed or endorsed by the publisher.
Acknowledgments
The authors would like to thank two reviewers for their valued criticism and suggestions.
References
Alexander M. A., Bladé I., Newman M., Lanzante J. R., Lau N. C., Scott J. D. (2002). The Atmospheric Bridge: The Influence of ENSO Teleconnections on Air–Sea Interaction Over the Global Oceans. J. Climate 15 (16), 2205–2231. doi: 10.1175/1520-0442(2002)015<2205:TABTIO>2.0.CO;2
Carton J. A., Chepurin G. A., Chen L. (2018). SODA3: A New Ocean Climate Reanalysis. J. Climate 31 (17), 6967–6983. doi: 10.1175/JCLI-D-18-0149.1
Chen J. M., Chang C. P., Li T. (2003). Annual Cycle of the South China Sea Surface Temperature Using the NCEP/NCAR Reanalysis. J. Meteorol. Soc Jpn. Ser. II 81 (4), 879–884. doi: 10.2151/jmsj.81.879
Cheng L., Abraham J., Hausfather Z., Trenberth K. E. (2019). How Fast are the Oceans Warming? Science 363 (6423), 128–129. doi: 10.1126/science.aav7619
Cheng L., Trenberth K. E., Fasullo J., Boyer T., Abraham J., Zhu J. (2017). Improved Estimates of Ocean Heat Content From 1960 to 2015. Sci. Adv. 3 (3), e1601545. doi: 10.1126/sciadv.1601545
Cheng X., Xie S. P., Du Y., Wang J., Chen X., Wang J. (2016). Interannual-To-Decadal Variability and Trends of Sea Level in the South China Sea. Clim. Dynam. 46 (9), 3113–3126. doi: 10.1007/s00382-015-2756-1
Chen J. M., Li T., Shih C. F. (2007). Fall Persistence Barrier of Sea Surface Temperature in the South China Sea Associated With ENSO. J. Climate 20 (2), 158–172. doi: 10.1175/JCLI4000.1
Chiang T. L., Hsin Y. C., Wu C. R. (2018). Multidecadal Changes of Upper-Ocean Thermal Conditions in the Tropical Northwest Pacific Ocean Versus South China Sea During 1960–2015. J. Climate 31 (10), 3999–4016. doi: 10.1175/JCLI-D-17-0394.1
Chu P. C., Edmons N. L., Fan C. (1999). Dynamical Mechanisms for the South China Sea Seasonal Circulation and Thermohaline Variabilities. J. Phys. Oceanogr. 29 (11), 2971–2989. doi: 10.1175/1520-0485(1999)029<2971:DMFTSC>2.0.CO;2
Dee D. P., Uppala S. M., Simmons A. J., Berrisford P., Poli P., Kobayashi S., et al. (2011). The ERA-Interim Reanalysis: Configuration and Performance of the Data Assimilation System. Q. J. R. Meteor. Soc. 137 (656), 553–597. doi: 10.1002/qj.828
Gill A. (1980). Some Simple Solutions for Heat-Induced Tropical Circulation. Q. J. R. Meteor. Soc. 106 (449), 447–462. doi: 10.1002/qj.49710644905
Halliwell G. R. (2004). Evaluation of Vertical Coordinate and Vertical Mixing Algorithms in the HYbrid-Coordinate Ocean Model (HYCOM). Ocean. Model 7 (3), 285–322. doi: 10.1016/j.ocemod.2003.10.002
Kim J. W., An S. I. (2019). Western North Pacific Anticyclone Change Associated With the El Niño–Indian Ocean Dipole Coupling. Int. J. Climatol. 39 (5), 2505–2521. doi: 10.1002/joc.5967
Klein S. A., Soden B. J., Lau N. C. (1999). Remote Sea Surface Temperature Variations During ENSO: Evidence for a Tropical Atmospheric Bridge. J. Climate 12 (4), 917–932. doi: 10.1175/1520-0442(1999)012<0917:RSSTVD>2.0.CO;2
Liang Z., Zeng L., Wang Q., Peng Q., Wang D. (2021). Interpretation of Interannual Variability of the Zonal Contrasting Thermal Conditions in the Winter South China Sea. Clim. Dynam. 1-19. doi: 10.1007/s00382-021-05968-6
Liu Q., Jiang X., Xie S.-P., Liu W.-T. L. (2004). A Gap in the Indo-Pacific Warm Pool Over the South China Sea in Boreal Winter: Seasonal Development and Interannual Variability. J. Geophys. Res.-Oceans 109 (C7). doi: 10.1029/2003JC002179
Liu Q.-Y., Wang D., Wang X., Shu Y., Xie Q., Chen J. (2014). Thermal Variations in the South China Sea Associated With Eastern and Central Pacific El Niño and Their Mechanisms. J. Geophys. Res.-Oceans 119, 8955–8972. doi: 10.1002/2014JC010429
Liu Z., Yang H., Liu Q. (2001). Regional Dynamics of Seasonal Variability in the South China Sea. J. Phys. Oceanogr. 31 (1), 272–284. doi: 10.1175/1520-0485(2001)031<0272:RDOSVI>2.0.CO;2
Li T., Zhang Y., Lu E., Wang D. (2002). Relative Role of Dynamic and Thermodynamic Processes in the Development of the Indian Ocean Dipole: An OGCM Diagnosis. Geophys. Res. Lett. 29 (23), 25–21. doi: 10.1029/2002GL015789
Matsuno T. (1966). Quasi-Geostrophic Motions in the Equatorial Area. J. Meteorol. Soc Jpn. Ser. II 44 (1), 25–43. doi: 10.2151/jmsj1965.44.1_25
Monterey G., Levitus S. (1997). Seasonal Variability of Mixed Layer Depth for the World Ocean. NOAA Atlas NESDIS 14. 100 pp. atl. Oceanicand Atmos. Admin., Silver Spring, Md.
Ose T., Song Y., Kitoh A. (1997). Sea Surface Temperature in the South China Sea. J. Meteorol. Soc Jpn. Ser. II 75 (6), 1091–1107. doi: 10.2151/jmsj1965.75.6_1091
Qu T. (2001). Role of Ocean Dynamics in Determining the Mean Seasonal Cycle of the South China Sea Surface Temperature. J. Geophys. Res.-Oceans 106 (C4), 6943–6955. doi: 10.1029/2000JC000479
Qu T., Kim Y. Y., Yaremchuk M., Tozuka T., Ishida A., Yamagata T. (2004). Can Luzon Strait Transport Play a Role in Conveying the Impact of ENSO to the South China Sea? J. Climate 17 (18), 3644–3657. doi: 10.1175/1520-0442(2004)017<3644:CLSTPA>2.0.CO;2
Reynolds R. W., Smith T. M., Liu C., Chelton D. B., Casey K. S., Schlax M. G. (2007). Daily High-Resolution-Blended Analyses for Sea Surface Temperature. J. Climate 20 (22), 5473–5496. doi: 10.1175/2007JCLI1824.1
Seow M. X. C., Tozuka T. (2019). Ocean Thermodynamics Behind the Asymmetry of Interannual Variation of South China Sea Winter Cold Tongue Strength. Clim. Dynam. 52, 3241–3253. doi: 10.1007/s00382-018-4320-2
Shen S., Lau K. M. (1995). Biennial Oscillation Associated With the East Asian Summer Monsoon and Tropical Sea Surface Temperatures. J. Meteorol. Soc Jpn. Ser. II 73 (1), 105–124. doi: 10.2151/jmsj1965.73.1_105
Sverdrup H. U. (1947). Wind-Driven Currents in a Baroclinic Ocean: With Application to the Equatorial Currents of the Eastern Pacific. P. Natl. Acad. Sci. U.S.A. 33, 318–326. doi: 10.1073/pnas.33.11.318
Tan W., Wang X., Wang W., Wang C., Zuo J. (2016). Different Responses of Sea Surface Temperature in the South China Sea to Various El Niño Events During Boreal Autumn. J. Climate 29 (3), 1127–1142. doi: 10.1175/JCLI-D-15-0338.1
Tian J., Yang Q., Liang X., Xie L., Hu D., Wang F., et al. (2006). Observation of Luzon Strait Transport. Geophys. Res. Lett. 33 (19). doi: 10.1029/2006GL026272
Tomita T., Yasunari T. (1996). Role of the Northeast Winter Monsoon on the Biennial Oscillation of the ENSO/monsoon System. J. Meteorol. Soc Jpn. Ser. II 74 (4), 399–413. doi: 10.2151/jmsj1965.74.4_399
Trenberth K. E., Branstator G. W., Karoly D., Kumar A., Lau N. C., Ropelewski C. (1998). Progress During TOGA in Understanding and Modeling Global Teleconnections Associated With Tropical Sea Surface Temperatures. J. Geophys. Res.-Oceans 103 (C7), 14291–14324. doi: 10.1029/97JC01444
Wang D., Liu Q., Huang R. X., Du Y., Qu T. (2006b). Interannual Variability of the South China Sea Throughflow Inferred From Wind Data and an Ocean Data Assimilation Product. Geophys. Res. Lett. 33 (14). doi: 10.1029/2006GL026316
Wang C., Wang W., Wang D., Wang Q. (2006a). Interannual Variability of the South China Sea Associated With El Niño. J. Geophys. Res.-Oceans 111, C03023. doi: 10.1029/2005JC003333
Wang B., Wu R., Fu X. (2000). Pacific–East Asian Teleconnection: How Does ENSO Affect East Asian Climate? J. Climate 13 (9), 1517–1536. doi: 10.1175/1520-0442(2000)013<1517:PEATHD>2.0.CO;2
Wang B., Wu R., Li T. I. M. (2003). Atmosphere–warm Ocean Interaction and its Impacts on Asian–Australian Monsoon Variation. J. Climate 16 (8), 1195–1211. doi: 10.1175/1520-0442(2003)16<1195:AOIAII>2.0.CO;2
Wang D., Xie Q., Du Y., Wang W., Chen J. (2002). The 1997–1998 Warm Event in the South China Sea. Chin. Sci. Bul. 47 (14), 1221–1227. doi: 10.1007/BF02907614
Wang B., Zhang Q. (2002). Pacific–East Asian Teleconnection. Part II: How the Philippine Sea Anomalous Anticyclone is Established During El Niño Development. J. Climate 15, 3252–3265. doi: 10.1175/1520-0442(2002)015,3252:PEATPI.2.0.CO;2
Watanabe M., Jin F. F. (2002). Role of Indian Ocean Warming in the Development of Philippine Sea Anticyclone During ENSO. Geophys. Res. Lett. 29 (10), 116–111. doi: 10.1029/2001GL014318
Wu R., Chen W., Wang G., Hu K. (2014). Relative Contribution of ENSO and East Asian Winter Monsoon to the South China Sea SST Anomalies During ENSO Decaying Years. J. Geophys. Res.-Atmoss 119 (9), 5046–5064. doi: 10.1002/2013JD021095
Xiao F., Wang D., Leung M. Y. (2020b). Early and Extreme Warming in the South China Sea During 2015/2016: Role of an Unusual Indian Ocean Dipole Event. Geophys. Res. Lett. 47 (17), e2020GL089936. doi: 10.1029/2020GL089936
Xiao F., Wang D., Yang L. (2020a). Can Tropical Pacific Winds Enhance the Footprint of the Interdecadal Pacific Oscillation on the Upper-Ocean Heat Content in the South China Sea? J. Climate 33 (10), 4419–4437. doi: 10.1175/JCLI-D-19-0679.1
Xiao F., Wang D., Zeng L., Liu Q.-Y., Zhou W. (2019). Contrasting Changes in the Sea Surface Temperature and Upper Ocean Heat Content in the South China Sea During Recent Decades. Clim. Dynam. 53 (3–4), 1597–1612. doi: 10.1007/s00382-019-04697-1
Xiao F., Wu Z., Lyu Y., Zhang Y. (2020c). Abnormal Strong Upwelling Off the Coast of Southeast Vietnam in the Late Summer of 2016: A Comparison With the Case in 1998. Atmosphere 11 (9), 940. doi: 10.3390/atmos11090940
Xiao F., Zeng L., Liu Q.-Y., Zhou W., Wang D. (2018). Extreme Subsurface Warm Events in the South China Sea During 1998/99 and 2006/07: Observations and Mechanisms. Clim. Dynam. 50 (1–2), 115–128. doi: 10.1007/s00382-017-3588-y
Xie S. P., Hu K., Hafner J., Tokinaga H., Du Y., Huang G., et al. (2009). Indian Ocean Capacitor Effect on Indo–western Pacific Climate During the Summer Following El Niño. J. Climate 22 (3), 730–747. doi: 10.1175/2008JCLI2544.1
Xie S. P., Xie Q., Wang D., Liu W. T. (2003). Summer Upwelling in the South China Sea and its Role in Regional Climate Variations. J. Geophys. Res.-Oceans 108 (C8). doi: 10.1029/2003JC001867
Yu K., Qu T. (2013). Imprint of the Pacific Decadal Oscillation on the South China Sea Throughflow Variability. J. Climate 26 (24), 9797–9805. doi: 10.1175/JCLI-D-12-00785.1
Keywords: South China Sea, sea surface temperature, El Niño intensity, ocean advection, anomalous anticyclone over the SCS, air–sea interaction, Indian Ocean
Citation: Xiao F, Wang D, Wu Q, Song W, Zeng L, Xie Q and Wang Y (2022) Discrepant Effects of Oceanic Advection in the Evolution of SST Anomalies in the South China Sea During El Niño of Different Intensities. Front. Mar. Sci. 9:871458. doi: 10.3389/fmars.2022.871458
Received: 08 February 2022; Accepted: 02 March 2022;
Published: 23 March 2022.
Edited by:
Meilin Wu, Chinese Academy of Sciences, ChinaCopyright © 2022 Xiao, Wang, Wu, Song, Zeng, Xie and Wang. This is an open-access article distributed under the terms of the Creative Commons Attribution License (CC BY). The use, distribution or reproduction in other forums is permitted, provided the original author(s) and the copyright owner(s) are credited and that the original publication in this journal is cited, in accordance with accepted academic practice. No use, distribution or reproduction is permitted which does not comply with these terms.
*Correspondence: Dongxiao Wang, ZHh3YW5nQG1haWwuc3lzdS5lZHUuY24=
 Fuan Xiao
 Dongxiao Wang
 Qiaoyan Wu2