 Yun-Chi Lin1
 Chien-Pang Chin2
 Wei-Ting Chen1,3Ching-Ting Huang1
 Gwo-Ching Gong1,4
 Kuo-Ping Chiang1,4*Xin-Bei Chen1
- 1Institute of Marine Environment and Ecology, National Taiwan Ocean University, Keelung, Taiwan
- 2Marine Fisheries Division, Fishery Research Institute, Keelung, Taiwan
- 3College of Ocean Science and Resource, National Taiwan Ocean University, Keelung, Taiwan
- 4Center of Excellence for the Oceans, National Taiwan Ocean University, Keelung, Taiwan
Globally, the continental shelf occupies less than 10% of the total sea surface, but supports substantial primary production and fisheries. Photosynthetic picoeukaryotes (PPE) are important primary producers in marine ecosystems, and chlorophytes make a significant contribution to PPE abundance. Although the distribution of chlorophytes has been widely studied, little is known about how their community composition varies along the coastal-offshore gradient in subtropical continental shelf waters. To better understand their spatial variations, we employed metabarcoding data of 18S rRNA V4 gene to examine chlorophyte composition within the surface and deep chlorophyll maximum (DCM) layers over the continental shelf in the East China Sea (ECS) with high-resolution sampling. Our results indicate a higher chlorophyte diversity in the surface layer than in the DCM. In addition, we found that chlorophytes in oligotrophic Kuroshio surface water were the most diverse, with a higher percentage of Chloropicophyceae, prasinophyte clade V, prasinophyte clade IX, Palmophyllophyceae and Chlorodendrophyceae. In more eutrophic waters along the coast and within the DCM layer, chlorophytes were dominated by Mamiellophyceae. A significant spatial variation in community composition occurred along the nutrient gradient in the subtropical continental shelf ecosystem, varying from Mamiellophyceae-dominant in coastal water to Chloropicophyceae-dominant in offshore water. Furthermore, at a low saline coastal station, which had the lowest chlorophyte diversity, Picochlorum (Trebouxiophyceae) was dominant. Overall, chlorophyte diversity was positively correlated with temperature, and negatively correlated with silicate concentration. This study revealed that terrestrial input into continental systems influences chlorophyte diversity in the subtropical northwestern Pacific Ocean.
Introduction
Phytoplankton, a primary producer in the ocean, may be responsible for half of the global oxygen production (Field et al., 1998). Based on cell-size, they can be roughly classified as either picophytoplankton (< 2 or 3 μm), nanophytoplankton (~2-20 μm) or microphytoplankton (~20-200 μm) (Sieburth et al., 1978). Picophytoplankton, which are composed of eukaryotes and prokaryotes, generally contribute a significant proportion of total phytoplankton biomass in the oligotrophic open ocean (Li, 1995). In marine ecosystems, photosynthetic picoeukaryotes (PPEs) are less abundant in terms of cell density than prokaryotes, but make a significant contribution to pico-size biomass and primary production due to their greater volume (Worden et al., 2004). Eukaryotes display greater genetic and morphologic variation than prokaryotes, reflecting their multiple functions in marine ecosystems (de Vargas et al., 2015; Caron, 2016). PPEs consist of taxonomically diverse categories, including Chlorophyta, Cryptophyta, Haptophyta (prymnesiophytes), and Orchrophyta (diatoms and chrysophytes). Of these, Chlorophyta have been better studied in terms of genomics (Derelle et al., 2006; Worden et al., 2009; Moreau et al., 2012; Lemieux et al., 2019) and ecological distribution (Not et al., 2004; Foulon et al., 2008; Limardo et al., 2017).
Characteristics of chlorophytes include the use of chlorophyll b as the main accessory pigment and chloroplasts which are surrounded by two membranes. In taxonomic classification, Chlorophyta comprise two major groups, namely core chlorophytes and prasinophytes. The former consists of the Ulvophyceae, Trebouxiophyceae and Chlorophyceae clade (the UTC clade), while the latter is a paraphyletic group consisting of more than 8 classes, including the common ocean chlorophytes, Mamiellophyceae, Nephroselmidophyceae, Pyramimonadales etc. (Guillou et al., 2004; Tragin et al., 2016; Dos Santos et al., 2017a). Chlorophyta have a widespread distribution and contribute more than half of total PPE abundance in many marine regions (Not et al., 2004; Not et al., 2005; Collado-Fabbri et al., 2011). However, its dominants vary with geographic location. The ecological distributions of Mamiellophyceae have been the most extensively researched. Micromonas was found to be an important component of eukaryotic picophytoplankton in Arctic water, Atlantic temperate regions and in a variety of coastal regions (Not et al., 2004; Lovejoy et al., 2007; Balzano et al., 2012; Lin et al., 2017), while Bathycoccus is important in the upwelling system of the eastern South Pacific and subarctic Northeastern Pacific (Limardo et al., 2017), and Osterococcus is important in Kuroshio fronts (Clayton et al., 2017). More recently, Chloropicophyceae (previously referred to as prasinophyte clade VII) has been established as another important class (Dos Santos et al., 2017b), but little is known about its ecological distribution in the oceans.
Many studies have revealed chlorophyte diversity, in particular for Mamiellophyceae. Micromonas, with 9 clades, exhibits greater species diversity than Ostreococcus and Bathycoccus (Tragin and Vaulot, 2019). 18S rRNA gene analysis has shown that Ostreococcus and Bathycoccus consist of four and two clades, respectively (Simmons et al., 2016; Limardo et al., 2017). The distribution patterns of Bathycoccus and Ostreococcus clades are clearer than that of Micromonas (Demir-Hilton et al., 2011; Simmons et al., 2016; Vannier et al., 2016; Clayton et al., 2017; Limardo et al., 2017). Coastal/oceanic ecotypes of Bathycoccus and Ostreococcus appear to occur independently of each other most of the time, except within mixing waters (Demir-Hilton et al., 2011; Clayton et al., 2017; Limardo et al., 2017). Chloropicophyceae comprise three genera, Chloropicon, Chloroparvula, and Picocystis (previously described as prasinophyte clade VIIA and VIIB and VIIC, respectively). A previous study found that Chloropicophyceae were better represented in warm offshore waters (Dos Santos et al., 2017a). However, little information is available about how environmental variables influence the distribution of Chlorophyta. A survey from coastal to offshore waters in a subtropical continental shelf system would thus be helpful in understanding their distribution patterns.
Although global surveys of eukaryotic composition have been carried out, such as in Ocean Sampling date (OSD) and Tara Oceans (Logares et al., 2018), relatively few sampling sites have been located in the subtropical Northwestern Pacific. Previous research reported that Mamiellophyceae were dominant in coastal waters, while Chloropicophyceae dominated in offshore waters (Tragin et al., 2016; Dos Santos et al., 2017a). The East China Sea (ECS) is one of the largest continental marginal seas in the northwest Pacific Ocean. The coastal region is influenced by the Changjiang (Yangtze) River discharge, while the offshore region is influenced by oligotrophic Kuroshio Water (Chen, 1996; Gong et al., 1996). Our study area was located in the northwestern Pacific Ocean and comprised a coastal-offshore gradient across a large continental shelf region in the ECS. We used 18S rRNA gene metabarcoding to study chlorophyte community composition in surface and DCM layers during summer 2019, and examined how this composition varied from coastal to offshore regions within these layers.
Methods
Sample Collection and Processing
Grid sampling was conducted in the East China Sea (ECS) at a total of 30 stations in July, 2019 (Figure 1). Surface water (4-6 m at 30 stations) and DCM water (15-85 m at 20 stations) were sampled. Seawater was collected using Go-Flo bottles mounted on a CTD rosette (Sea-Bird Electronics, USA). Ten liters of seawater was prefiltered using a 200 μm nylon mesh, and then processed with size-fractions (20-200 μm, 3-20 μm and 0.2-3 μm). For DNA collection, 20 μm pore size was collected on 90 mm-diameter nylon membranes (Millipore) while 3 μm- and 0.2 μm- pore sizes were collected on 142 mm-diameter polycarbonate membranes (Millipore). The filters were immediately preserved in liquid nitrogen and transferred and stored at -80°C until DNA extraction. In this study, chlorophyte composition was studied exclusively in pico-sized fractions (0.2-3 μm) due to the greater number of reads after subsampling.
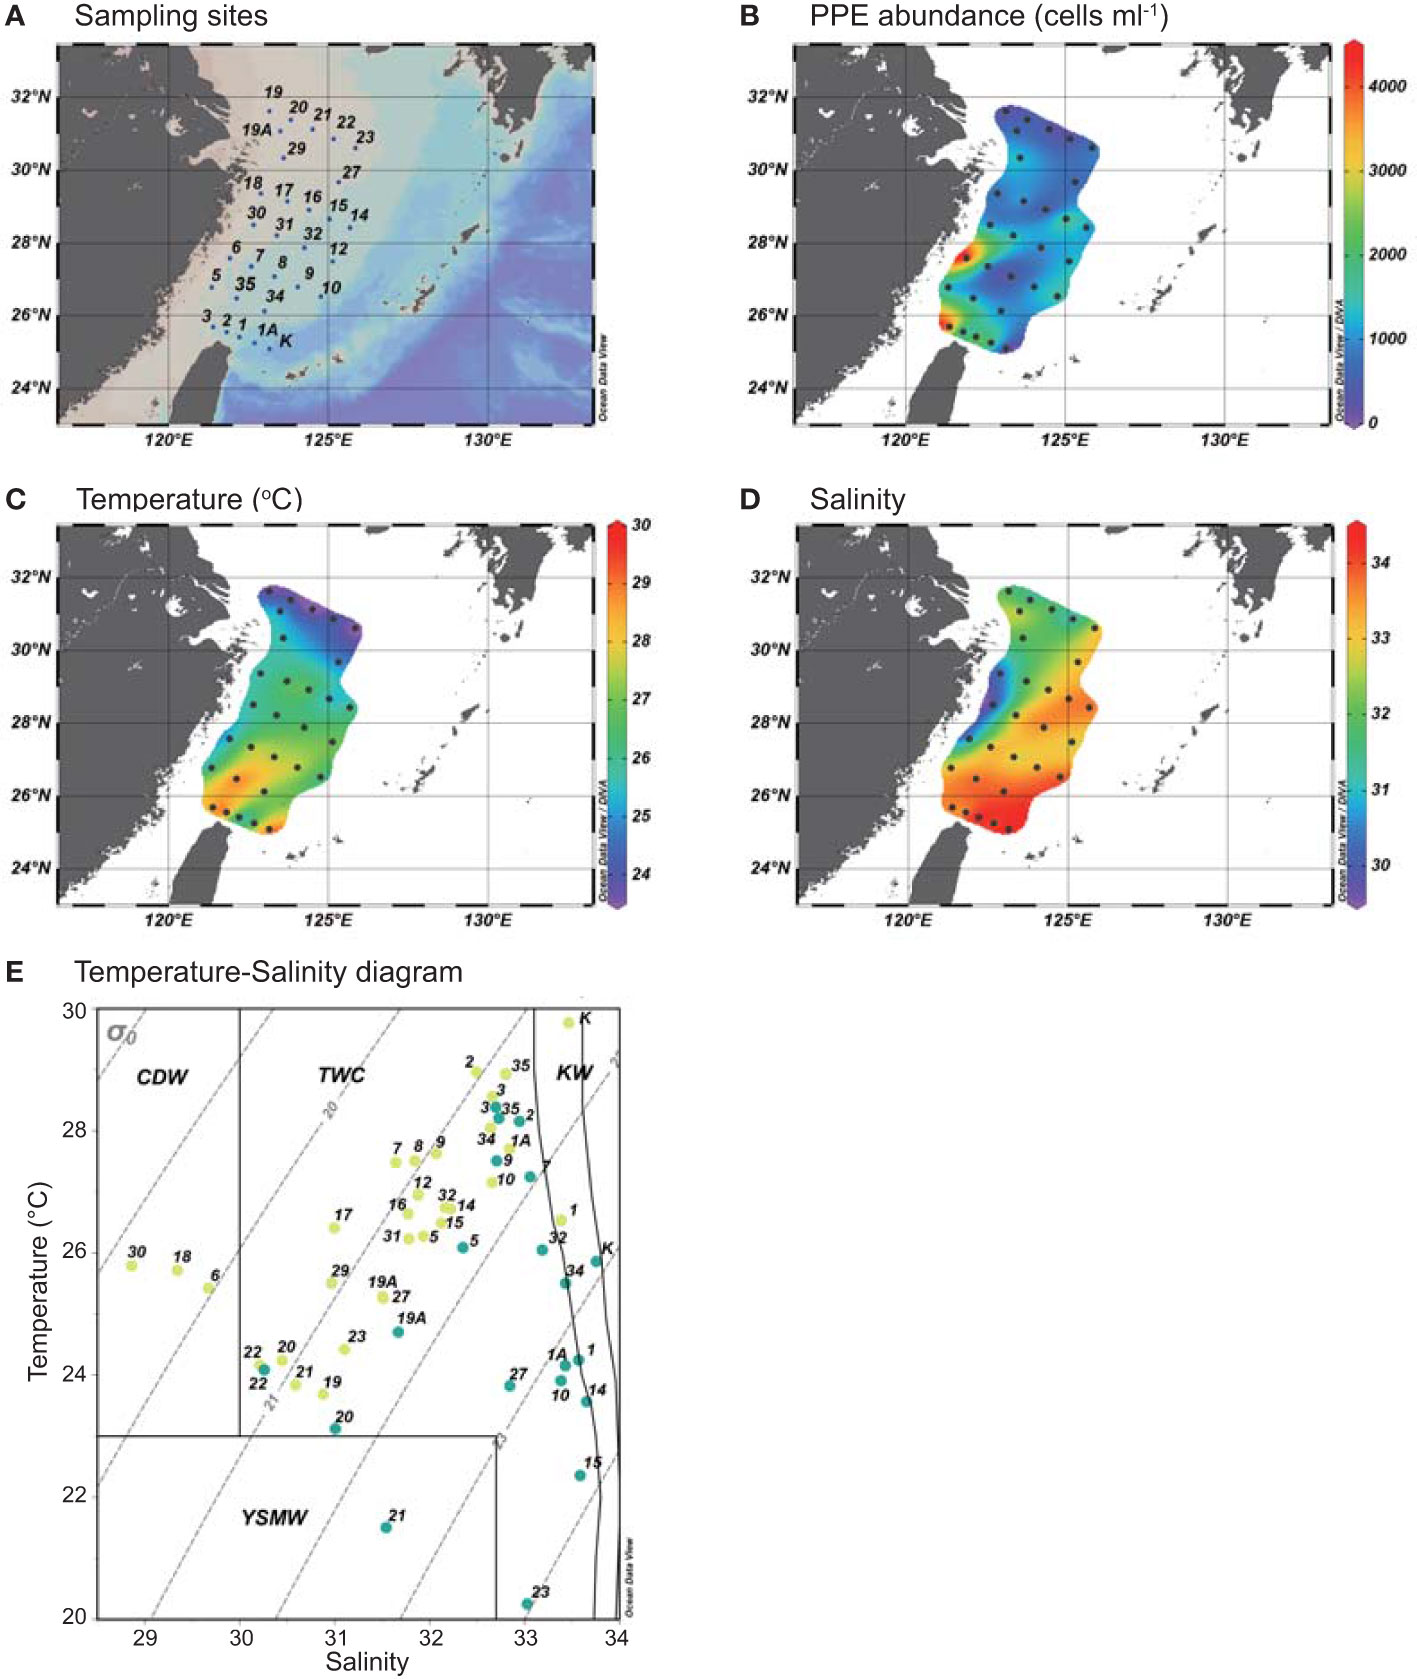
Figure 1 (A) Maps show the sampling stations. (B) The distribution of photosynthetic picoeukaryotes (PPEs, cells ml-1) (C) temperature (°C) and (D) salinity of surface water during July, 2019. (E) The Temperature-Salinity (T-S) diagram shows the water types as defined by Gong et al., 1996. The yellow and turquoise circles represent the surface water and DCM water, respectively. Dotted lines represent density (kg m -3). CDW, Changjiang Diluted Water; KW, Kuroshio Water; TWC, Taiwan Warm Current; YSMW, Yellow Sea Mixed Water.
Environmental Parameters
Temperature and salinity were measured using a CTD profiler. The concentrations of ammonium, nitrite, nitrate, phosphate and silicate were measured according to standard methods used in a previous study (Gong et al., 2000). To measure chlorophyll a concentration, 1 L of seawater was filtered through 47-mm- diameter GF/F filters and then stored at -20°C until analysis. The chlorophyll on the filters was extracted with 90% acetone and determined with a fluorometer (Gong et al., 2000). Flow cytometry samples were preserved with paraformaldehyde (0.2% final concentration), and stored at -80°C. PPEs were quantified with chlorophyll red fluorescence using flow cytometry at an excitation wavelength of 488 nm (CytoFLEX, Beckman Coulter).
18S Amplicon Sequencing
PCR conditions and methods of DNA extraction are described in Lin et al. (2021). Briefly, DNA was extracted using DNeasy PowerWater Kit (Qiagen) following the manufacturer’s instructions. The V4 region of the 18S rRNA gene was amplified with the eukaryotic universal primer set TAReuk454FWD1 (5’-[illumina adaptor]- CCAGCASCYGCGGTAATTCC-3’) and TAReukREV3 (5’- [illumina adaptor]- ACTTTCGTTCTTGATYRA-3’) (Stoeck et al., 2010). Amplicon sequencing was carried out on an Illumina MiSeq platform (pair-end 2 × 300 bp). The primers in raw paired-end reads were trimmed with Cutadapt (Martin, 2011), and the reads were analyzed using DADA2 pipeline (Callahan et al., 2016). The taxonomic annotation was carried out in accordance with PR2 version 4.12.0 database, resulting in 8 taxonomic levels: Kingdom, Supergroup, Division, Class, Order, Family, Genus and Species. DADA 2 infers exact amplicon sequence variants (ASVs) instead of operational taxonomic units (OTUs) to obtain an overall taxonomic composition for all samples (Supplemental File 1).
Analysis of Chlorophyte Communities
Chlorophyte ASVs were selected from the eukaryotic ASV table produced by DADA2 under Division level of “Chlorophyta” (Supplemental File 2). Subsequently, 400 chlorophyte ASVs were selected randomly and subsampled 100 times to avoid sequencing depth variations (Yeh et al., 2015). Four out of 50 samples with <400 chlorophyte reads were excluded from further analysis. We conducted multivariate and statistical analysis on the subsampled data. R package phyloseq was used to calculate the Chao1 and Shannon diversity indices. Chlorophyte composition was then clustered based on Bray-Curtis dissimilarity, used the Ward.D2 clustering method. Canonical correlation analysis (CCA) was then carried out to investigate the relationships between environmental variables and the 20 most abundant chlorophyte ASVs. To explore the relationships between niche distribution and environmental variables in each ASV, we performed a generalized additive model (GAM) to evaluate the 10 most abundant chlorophyte ASVs using a mgvc package. Prior to GAM modelling, ASV reads were natural log transformed. All statistical analyses were done with R 3.6.1.
To study the phylogenetic relationships in Chloropicophyceae and Mamiellophyceae, the 15 most abundant ASVs in each class were used to analyze the V4 region of 18S rRNA gene (Figure S1, S2). One ASV, O. tauri, was placed in Ostreococcus clade E based on phylogenetic analysis (Figure S1). The taxonomic annotation of this ASV was then updated throughout the manuscript. Raw amplicon data with three size fractions have been deposited in the NCBI Sequence Read Archive under the BioProject number: PRJNA738614. Samples of size 0.2-3 μm (library_ID contains F002) from surface and DCM waters (library_ID contains -S & -D) were analyzed in this BioProject.
Results
Hydrographic Conditions in the ECS in July, 2019
During the study period, temperature in the ECS increased north to south, varying from 23.6°C to 29.7°C in the surface layer and from 20.3°C to 28.3°C in the DCM layer (Figure 1, S3, S4). The maximum temperature was observed in oligotrophic Kuroshio Water (St. K). Salinity increased from northwest to southeast, ranging from 29.8 to 34.4 at the surface and from 31.3 to 34.8 in the DCM layer (Figure 1, S3, S4). Using a definition of water types (Gong et al., 1996), most sampling sites were influenced by the oligotrophic Taiwan Warm Current (TWC, temperature >23°C and salinity >31) (Figure 1E). In addition, southern offshore waters (Sts. K and 1) were influenced by Kuroshio Water (KW). A topography-induced upwelling of colder saline water caused by the westward subsurface intrusion of Kuroshio water was observed at St. 1 (Figures 1C, D). The northern ECS (St. 21) was influenced by eutrophic Yellow Sea Mixing Water (YSMW) with high phosphate concentrations (Figure S3). The freshest water appeared in the central coastal region of the ECS (Sts. 30, 18 and 6; Figure 1), defined as Changjiang Diluted Water (CDW) (Gong et al., 1996), which was located further south of the Changjiang river mouth during the sampling period. The average PPE abundance was 1.1 x 10³ cells ml-1 in the ECS with a maximum of 4,180 cells ml-1 on the central coast at St. 6 (Figure 1).
The Overall Composition of Small Eukaryotes (0.2-3 µm)
Following DADA2 pipeline, a total of 2,933,769 eukaryotic reads and 8,249 ASVs were obtained from 30 surface water samples and 20 DCM samples. After removing Opisthokonta reads, the major supergroups comprised Alveolata, Stramenopiles, Archaeplastida, Rhizaria etc. Rhizaria showed a higher amplicon contribution in the DCM than in the surface layer (12% vs 4%, Figure S5). We simplified PPEs into Orchrophyta, Chlorophyta, Haptophyta and Cryptophyta. Chlorophyta contributed a higher percentage of total PPE reads in DCM than in the surface layer (51% vs 40%, Figure S5), and were important components among pico-size PPEs. Overall, the amplicon of chlorophyta accounted for ~6% of total eukaryotic reads and 3% of total ASVs (196,467 reads and 189 ASVs prior to subsampling). The samples with low chlorophyte reads (<400 reads) were located in the northern ECS, where the temperature-salinity conditions were similar to those in Yellow Sea Mixing Water (Figure 1E). The following samples were excluded from further analysis: St. 20 (surface & DCM), St. 21 (DCM), St. 22 (surface).
Chlorophyte Composition
After subsampling, Mamiellophyceae (42%) and Chloropicophyceae (41%) contributed similar read numbers in the surface water layer. Mamiellophyceae contributed slightly higher reads in the DCM layer at the class level (67% in DCM layer, Figures 2A, B). At the genus level, Chloropicon (32%) and Chloroparvula (10%) were more important in surface water whereas Bathycoccus (28%) and Ostreococcus (22%) were more important in DCM water (Figures 2C, D). Micromonas reads were similar in both layers. With respect to genetic diversity, among Mamiellophyceae, Micromonas comprised 11 ASVs while Bathycoccus and Ostreococcus comprised 3 ASVs. Chloropicophyceae showed greater diversity than Mamiellophyceae on 18S V4 region, with Chloropicon and Chloroparvula comprising 16 and 22 ASVs, respectively. Apart from Mamiellophyceae and Chloropicophyceae, other chlorophyte classes included Palmophyllophyceae, prasinophyte clades V and IX, Pyramimonadales, and Trebouxiophyceae (Figure 2). The most abundant chlorophyte ASVs in this study, after subsampling, included Bathycoccus prasinos (ASV_11), Chloropicon roscoffensis (ASV_8), Micromonas commoda clade A1(ASV_10) and Ostreococcus clade B (ASV_13) (Figure 3).
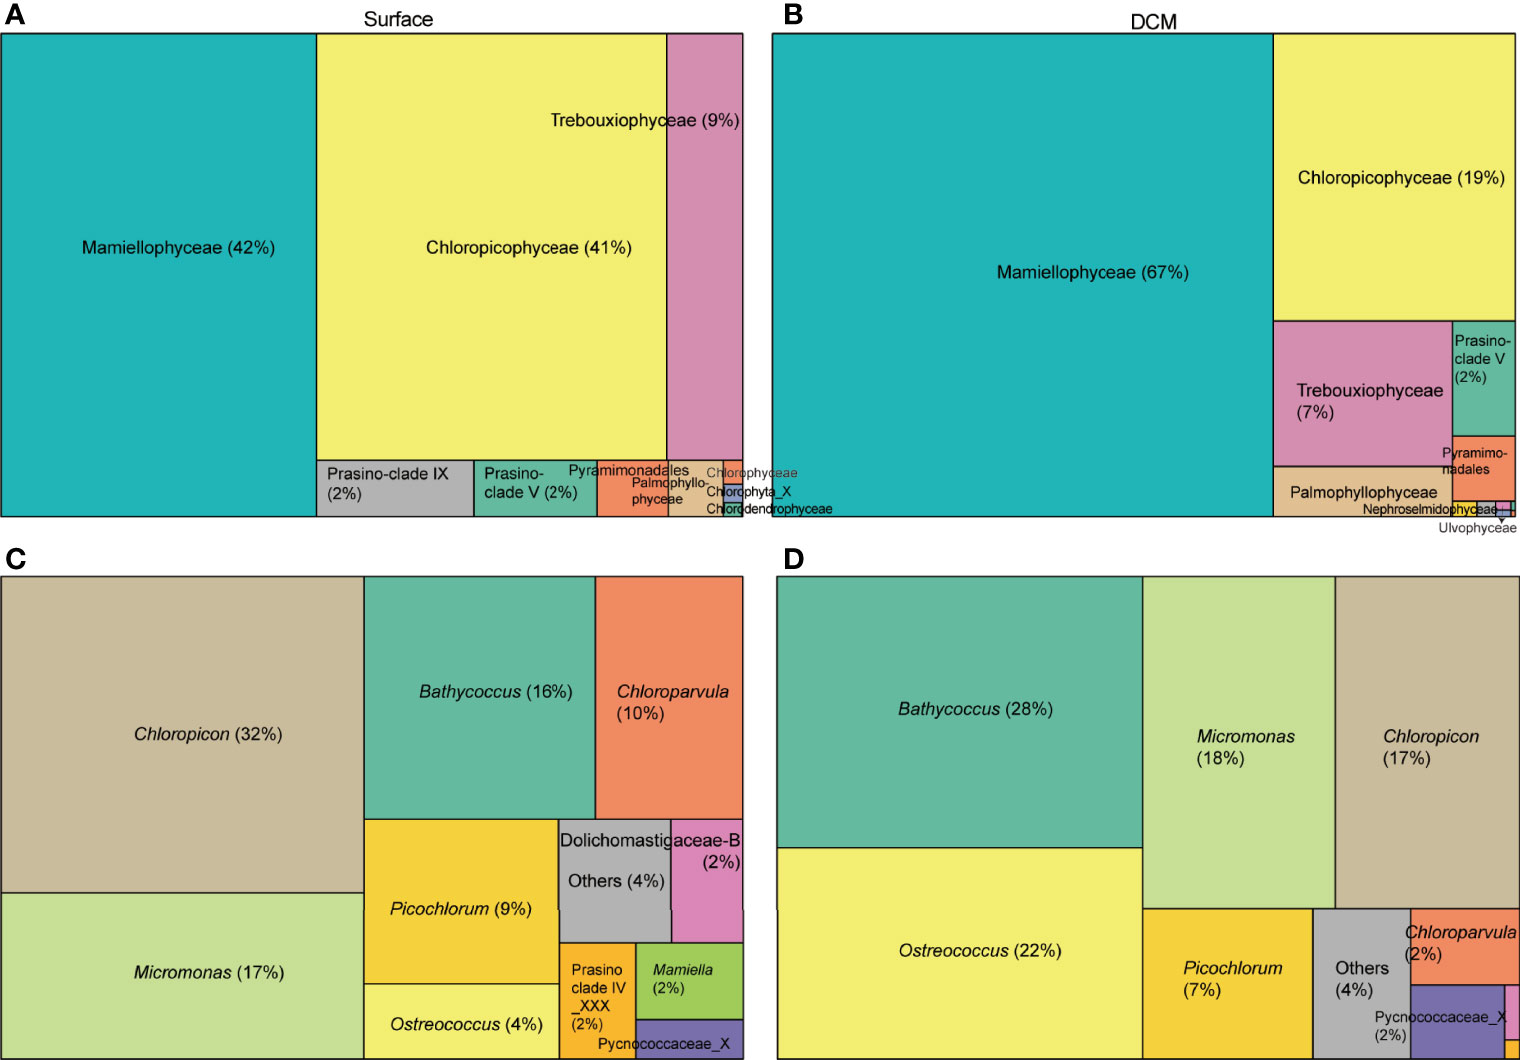
Figure 2 Treemaps show chlorophyte community composition in the (A, C) surface layer and (B, D) DCM layer at (A, B) class level and (C, D) genus level in PR2. The area of each taxonomic group is proportional to the number of reads after subsampling.
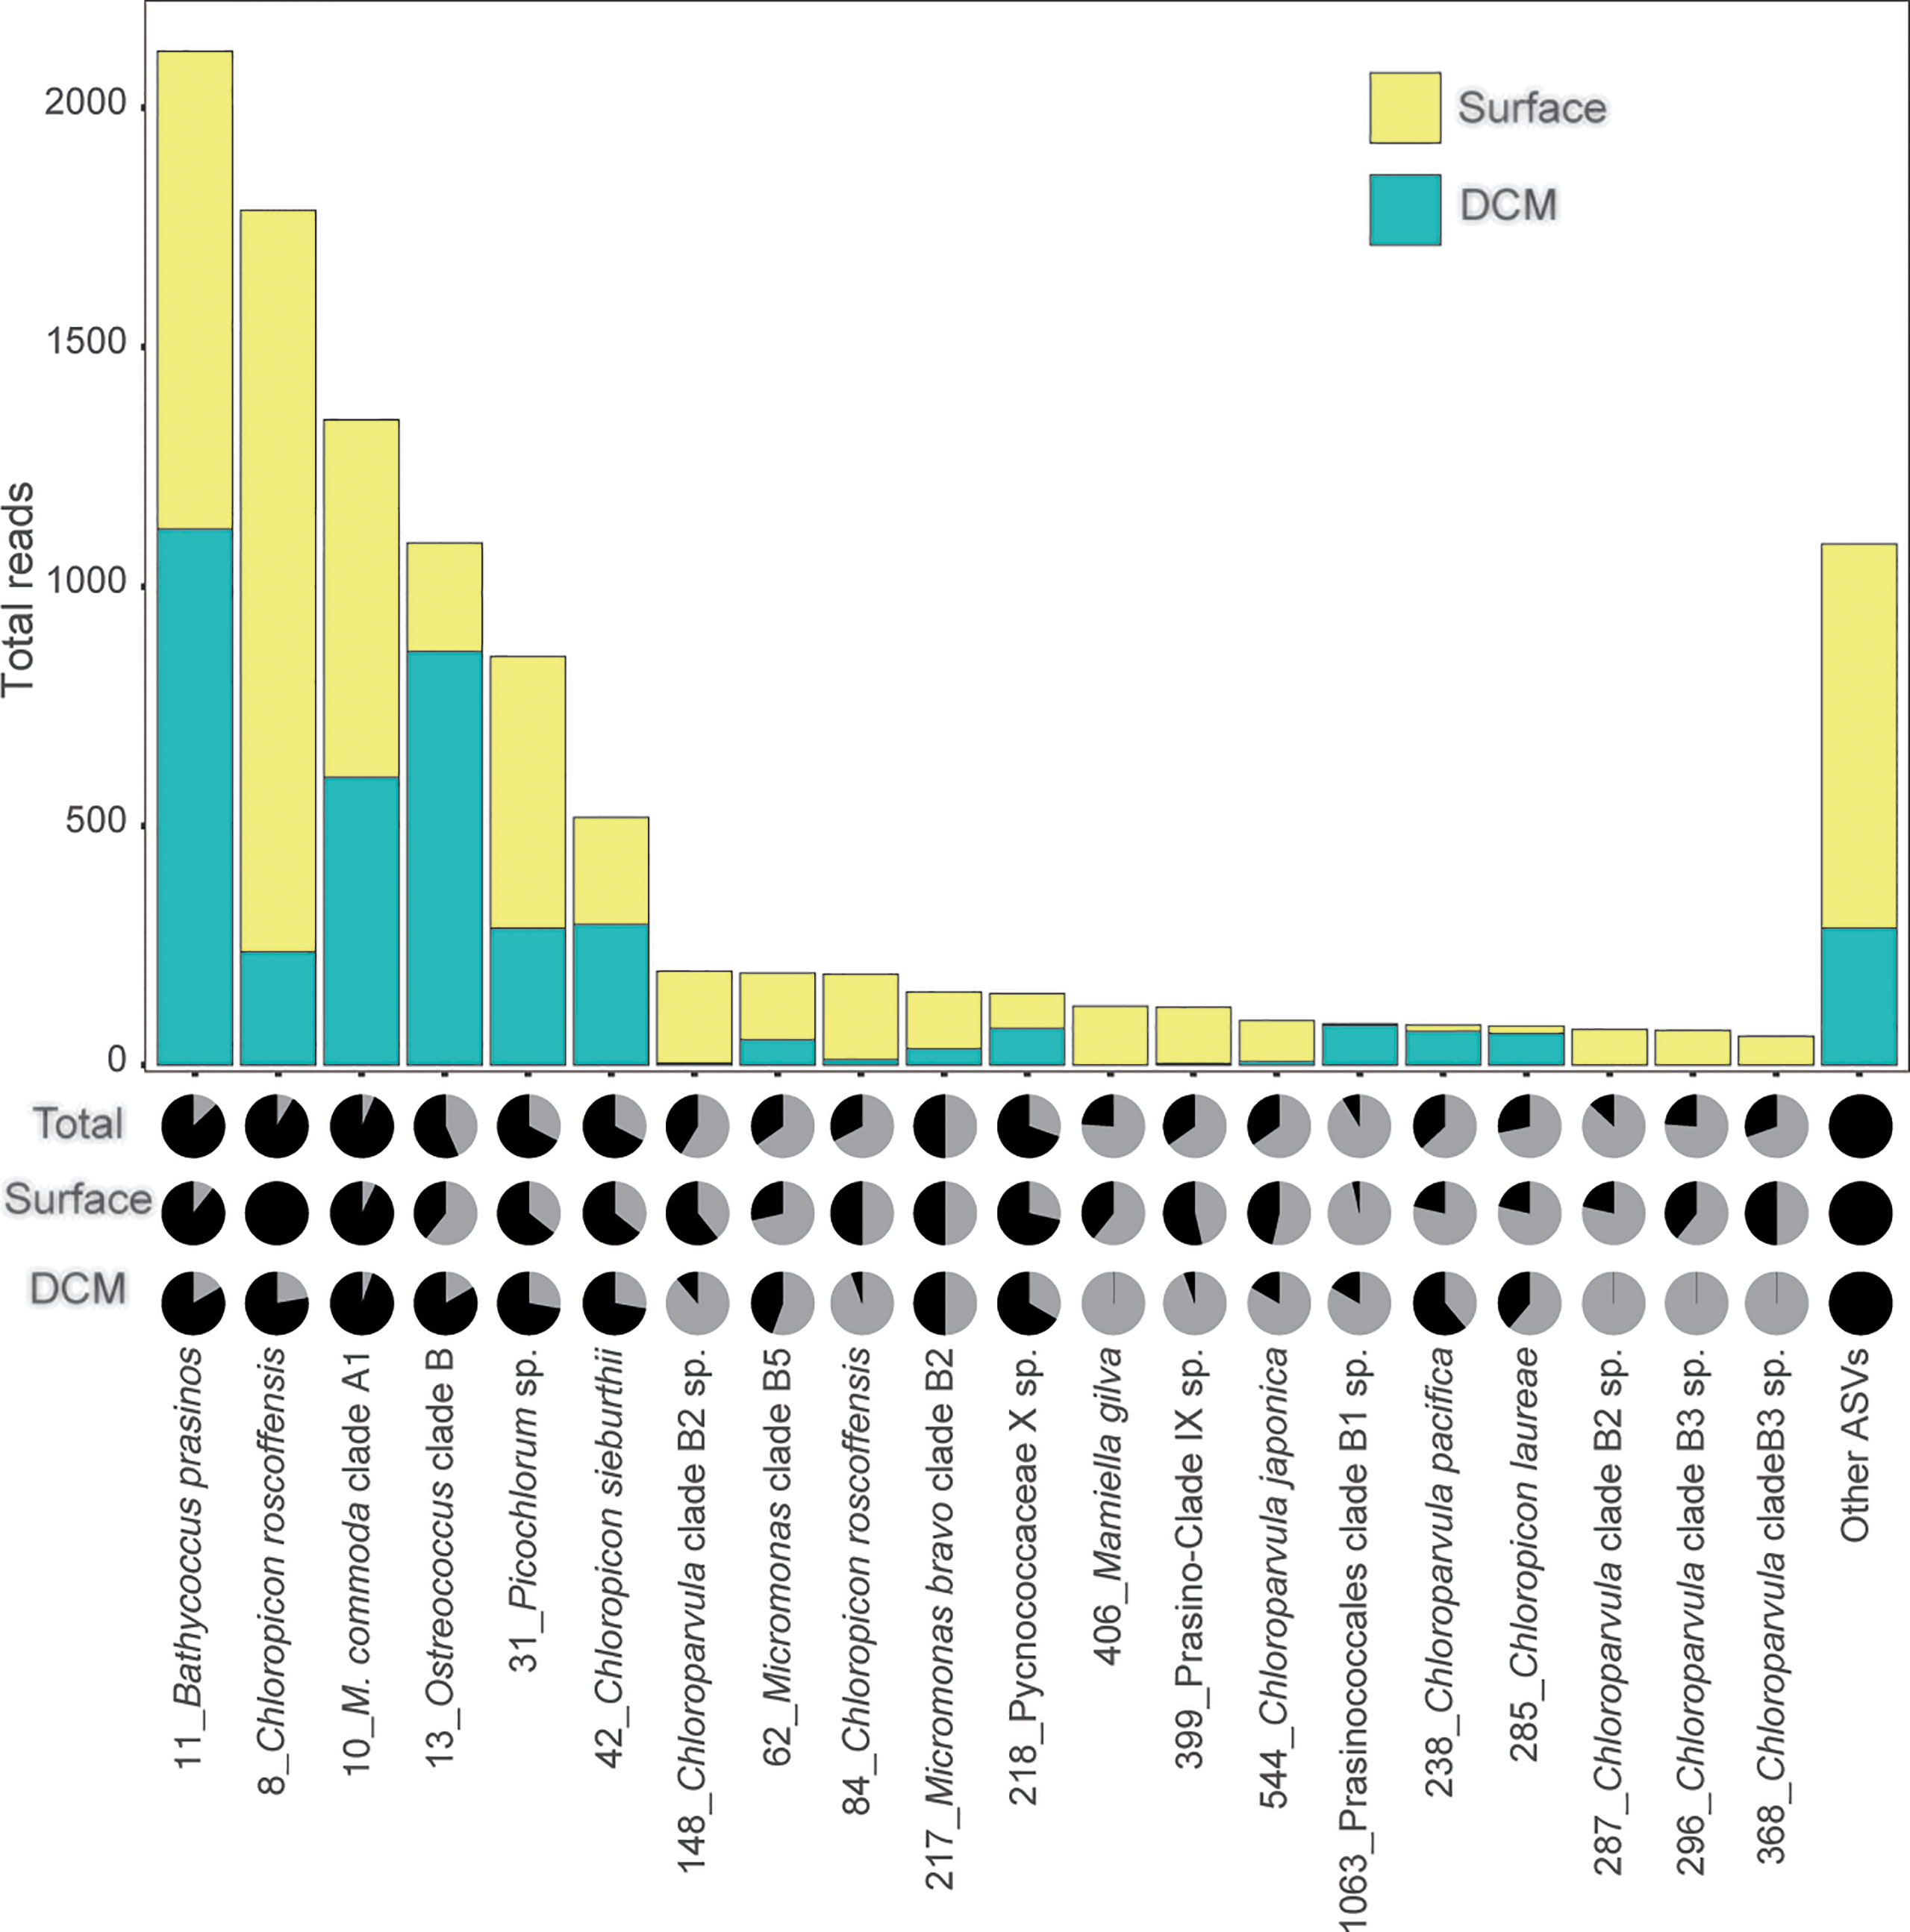
Figure 3 Rank-abundance for the 20 most abundant chlorophyte ASVs generated from the DNA of 0.2-3 μm size-fraction from the surface and DCM samples in the ECS, with a minimum of 400 reads subsampled 100 times. Surface subsamples (28 samples) are shown in yellow, while DCM subsamples (18 samples) are shown in turquoise. The pie charts show the reads prior to subsampling. The upper, middle and lower pie charts represent total (50 samples), surface (30 samples), and DCM (20 samples) samples respectively. The numbers next to the taxonomic annotations indicate the ASV.
Chlorophyte Diversity
The result of DADA2 pipeline produced a total of 189 chlorophyte ASVs, of which 156 ASVs were exclusively from the surface layer, 74 ASVs were exclusively from the DCM, and 41 ASVs were found in both layers. Prior to further analysis, subsampling was conducted to correct for variations in read numbers between samples. The Chao1 and Shannon indices were significantly higher in the surface layer than in the DCM (P < 0.01, Figure 4A). For surface water, the maximum Shannon index occurred in KW water (St. K). Both Chao1 and Shannon were at a minimum in the central ECS, in coastal water defined as CDW (St. 6) (Figure 4). Where the amplicon of Picochlorum sp. (ASV_31) among Trebouxiophyceae overwhelmingly dominated chlorophyte reads (~90%), it occurred alongside maximum chlorophyll a concentration and PPE abundance (chlorophyll a: 1.48 mg m-3 and PPEs: 4,180 cells ml-1, Figures 1, S3; Supplemental File 3). Other eukaryotic reads at St. 6 were dominated by Syndiniales in dinoflagellate (Supplemental File 1). Picochlorum might therefore be major contributors to chlorophyll a concentration and PPE abundance in our study.
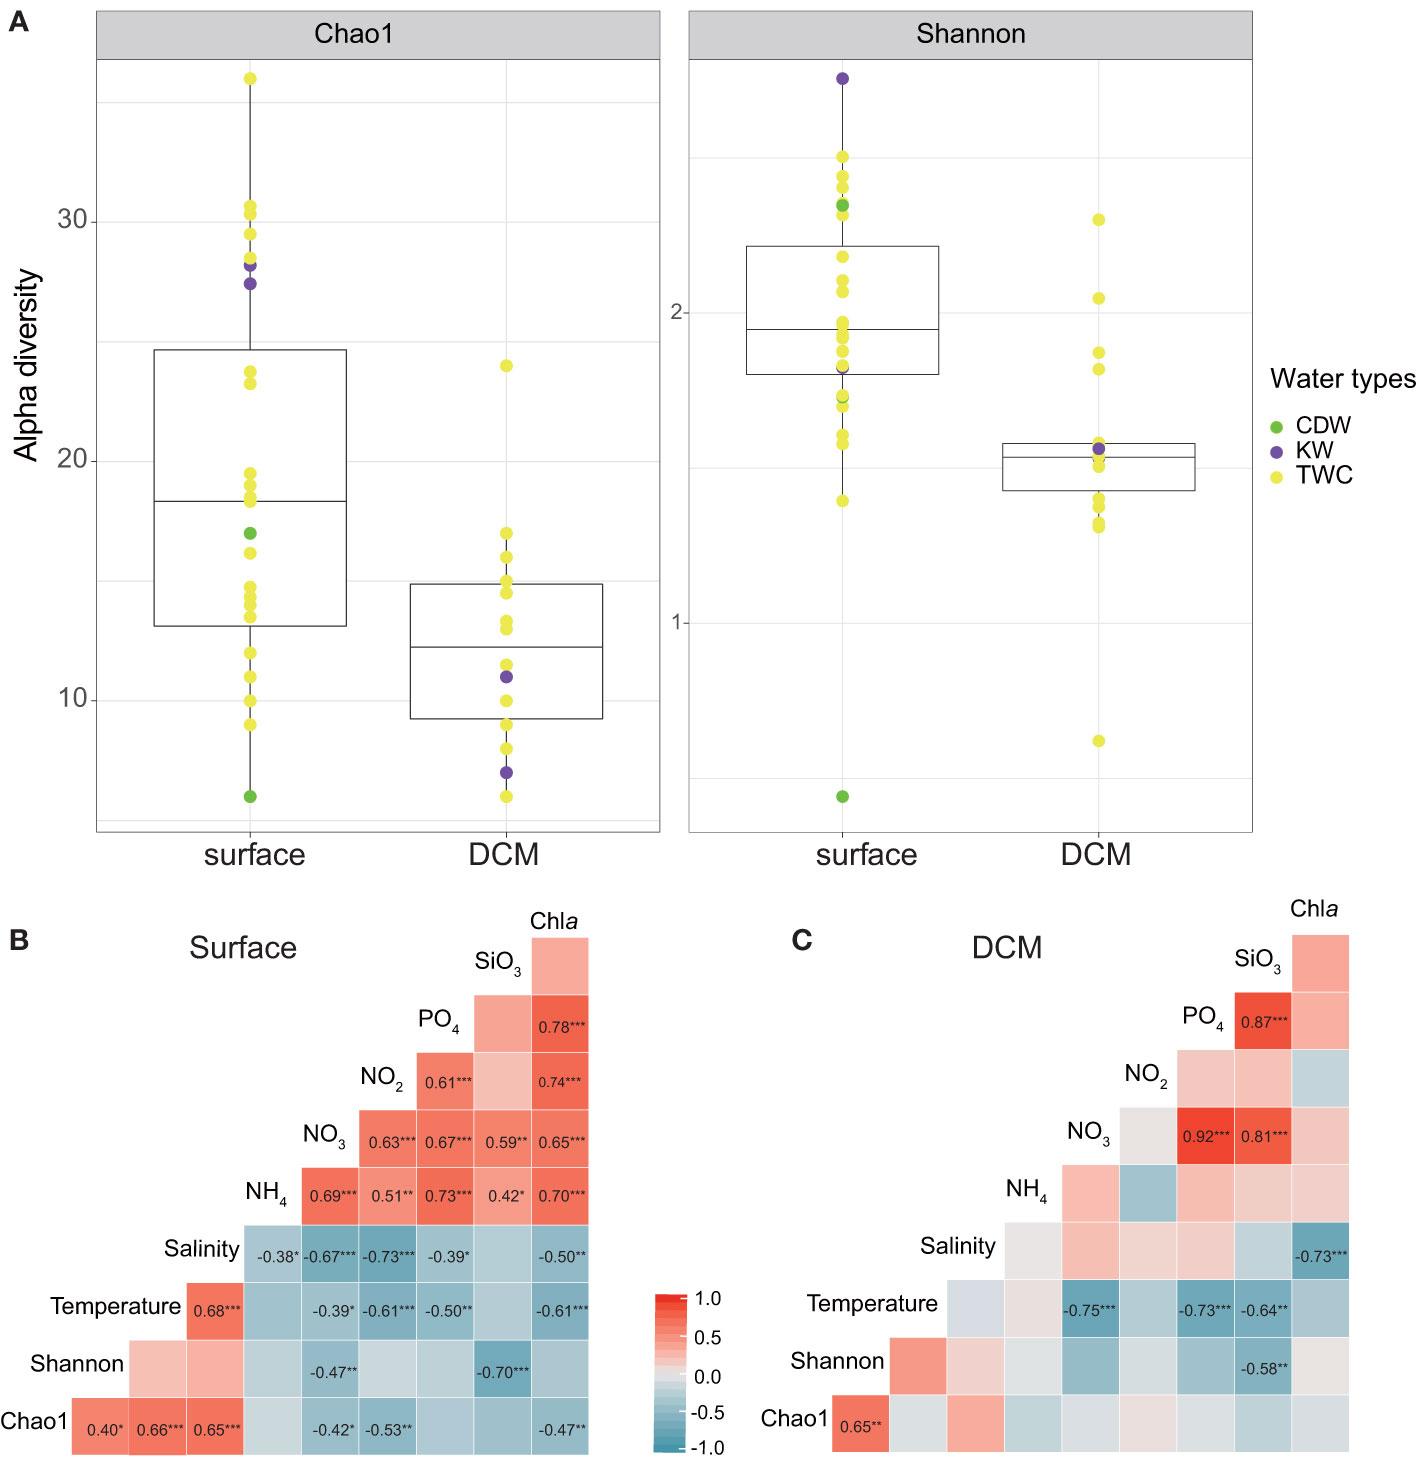
Figure 4 (A) Comparison of chlorophyte diversity in surface and DCM samples. Subsampling data was calculated using Chao1 and Shannon diversity, and is represented as box-whisker-plots with median values as horizontal lines, and interquartile ranges as boxes with whiskers extending to 1.5 times the interquartile range. The definition of water masses is based on Gong et al., 1996. Green indicates the Chiang Dilution Water (CDW); purple indicates the Kuroshio Water (KW); and yellow indicates the Taiwan Warm Current (TWC). (B, C) Pearson’s correlation coefficients between diversity indices and environmental variables for (B) surface data and (C) DCM data. The colors indicate the strength of positive (red) and negative (blue) coefficients, and *, ** and *** indicate statistical significance at P < 0.05, <0.01 and 0.001, respectively.
Chlorophyte Composition and Hydrographic Environments
To examine chlorophyte composition, we created a Bray-Curtis dissimilarity matrix and grouped samples based on hierarchical clustering (Ward.D2). The composition varied along the coastal-offshore gradient, and also with vertical depth in offshore samples. Based on geographic and vertical characteristics, four clusters were identified and named as follows: surface water (n=17), DCM water (n=15), coastal water (n=11) and Kuroshio Water (n=3) (Figure 5).
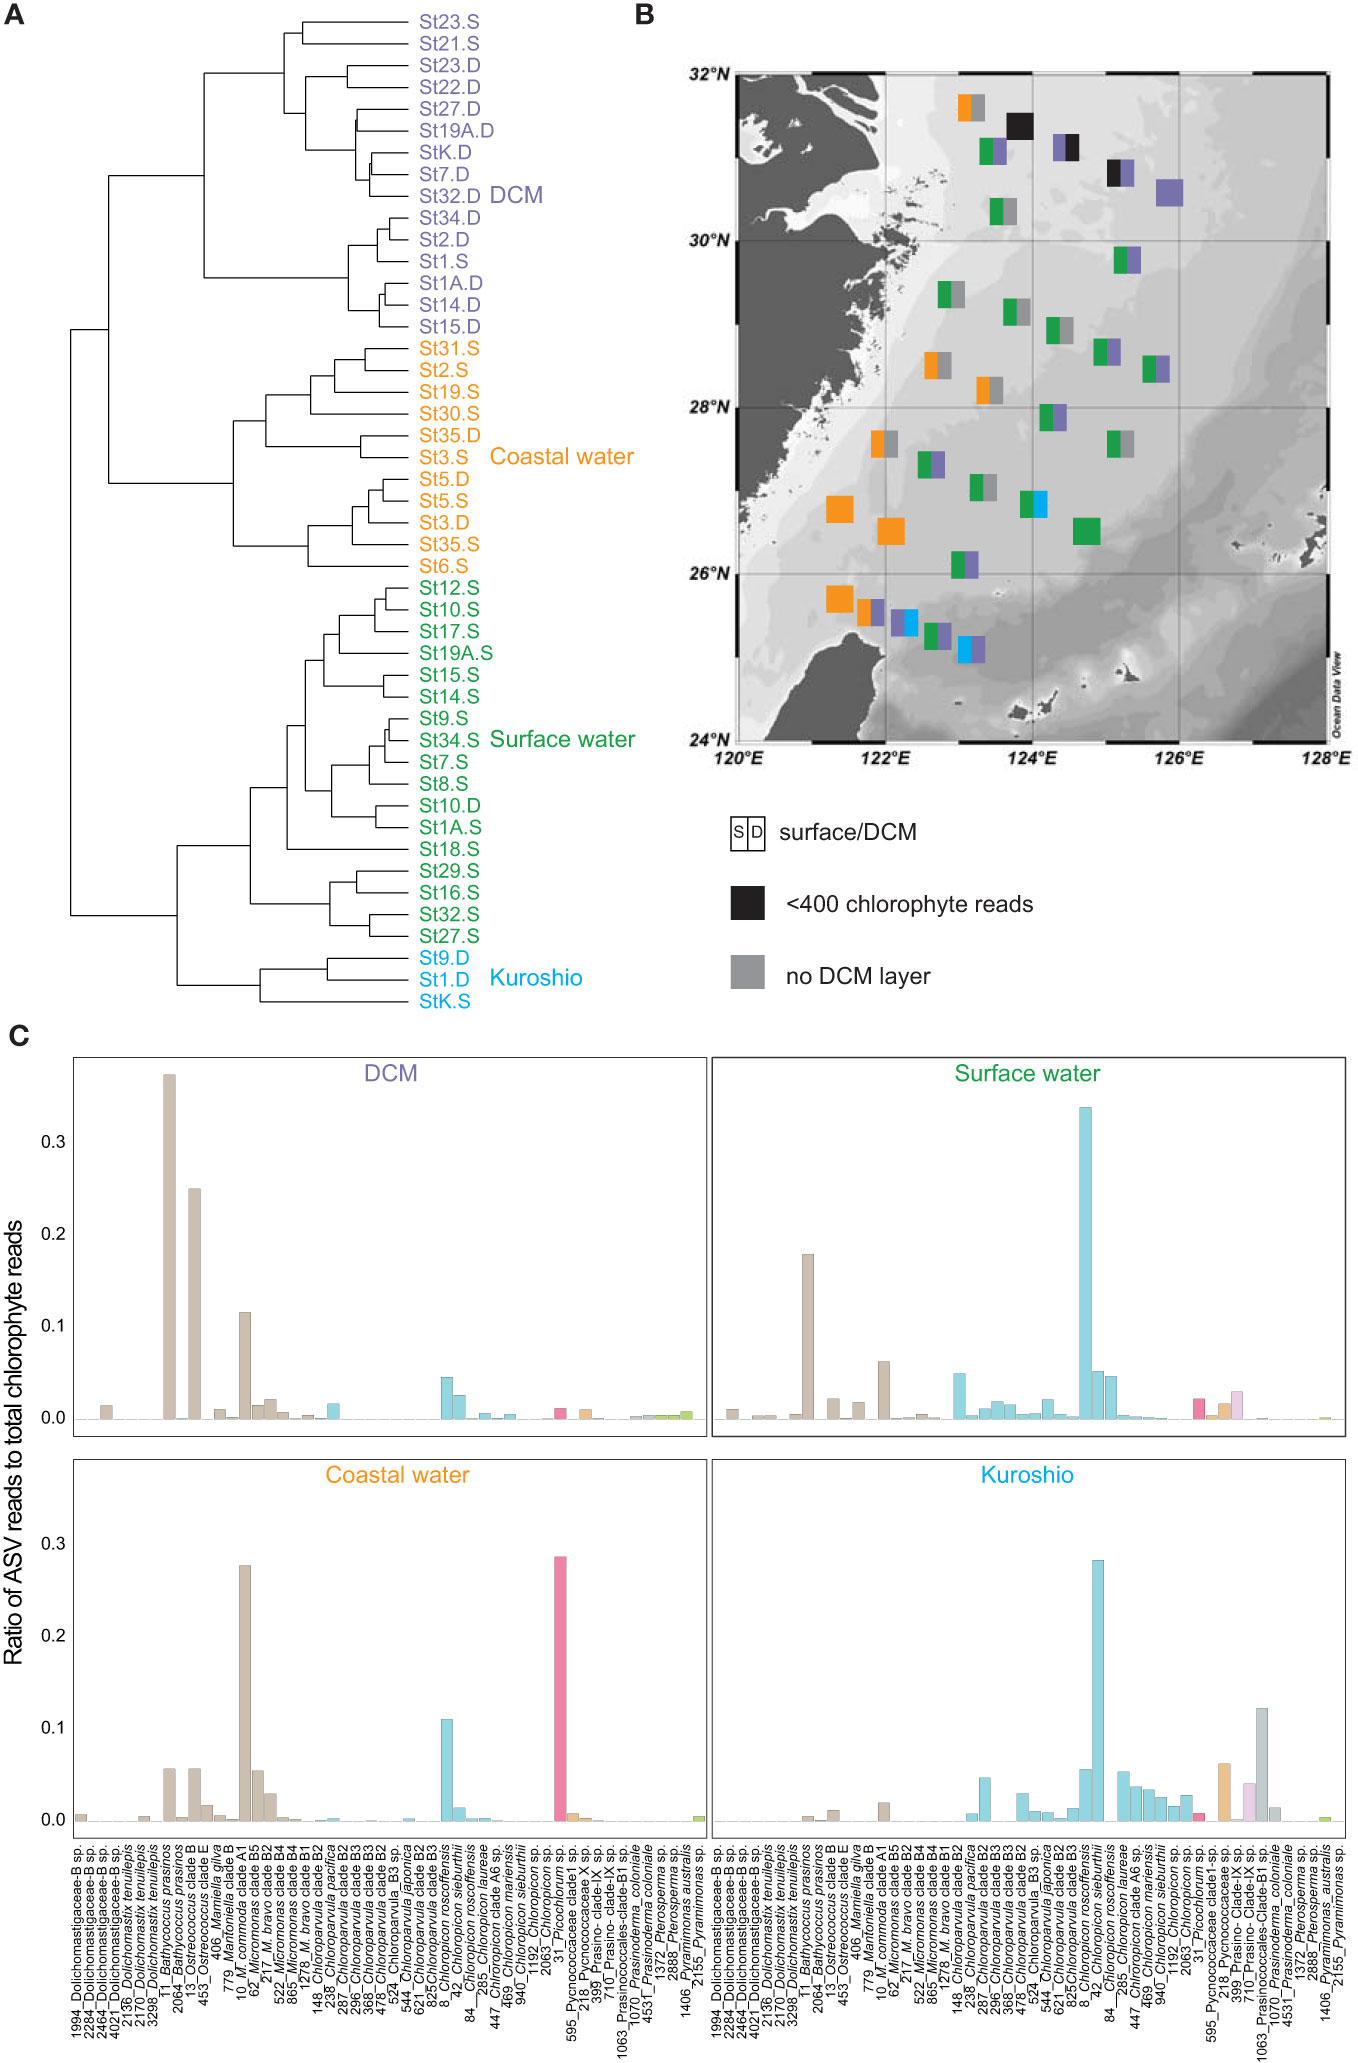
Figure 5 (A) The four clusters generated by hierarchical clustering of chlorophyte ASV table after subsampling. (B) The colors in squares represent the clusters from (A). The left and right half of each square represent surface and DCM samples, respectively. Black shows chlorophyte reads < 400 in amplicon data while grey indicates that no DCM layer was observed at that station. (C) The average fraction of total chlorophyte amplicon in each cluster for the 50 most abundant chlorophyte ASVs. The colors indicate the distinct classes and the numbers next to the taxonomic annotations indicate the ASV.
The Surface Water Cluster
Most of the samples came from surface water, except for those at St. 10 in DCM water (Figure 5). The samples in this cluster were broadly distributed over the ECS, with Chloropicophyceae and Mamiellophyceae together contributing a large proportion of total chlorophyte reads (Figure 6). Dolichomastigale (Mamiellophyceae) was slightly more abundant in this cluster than in other clusters.
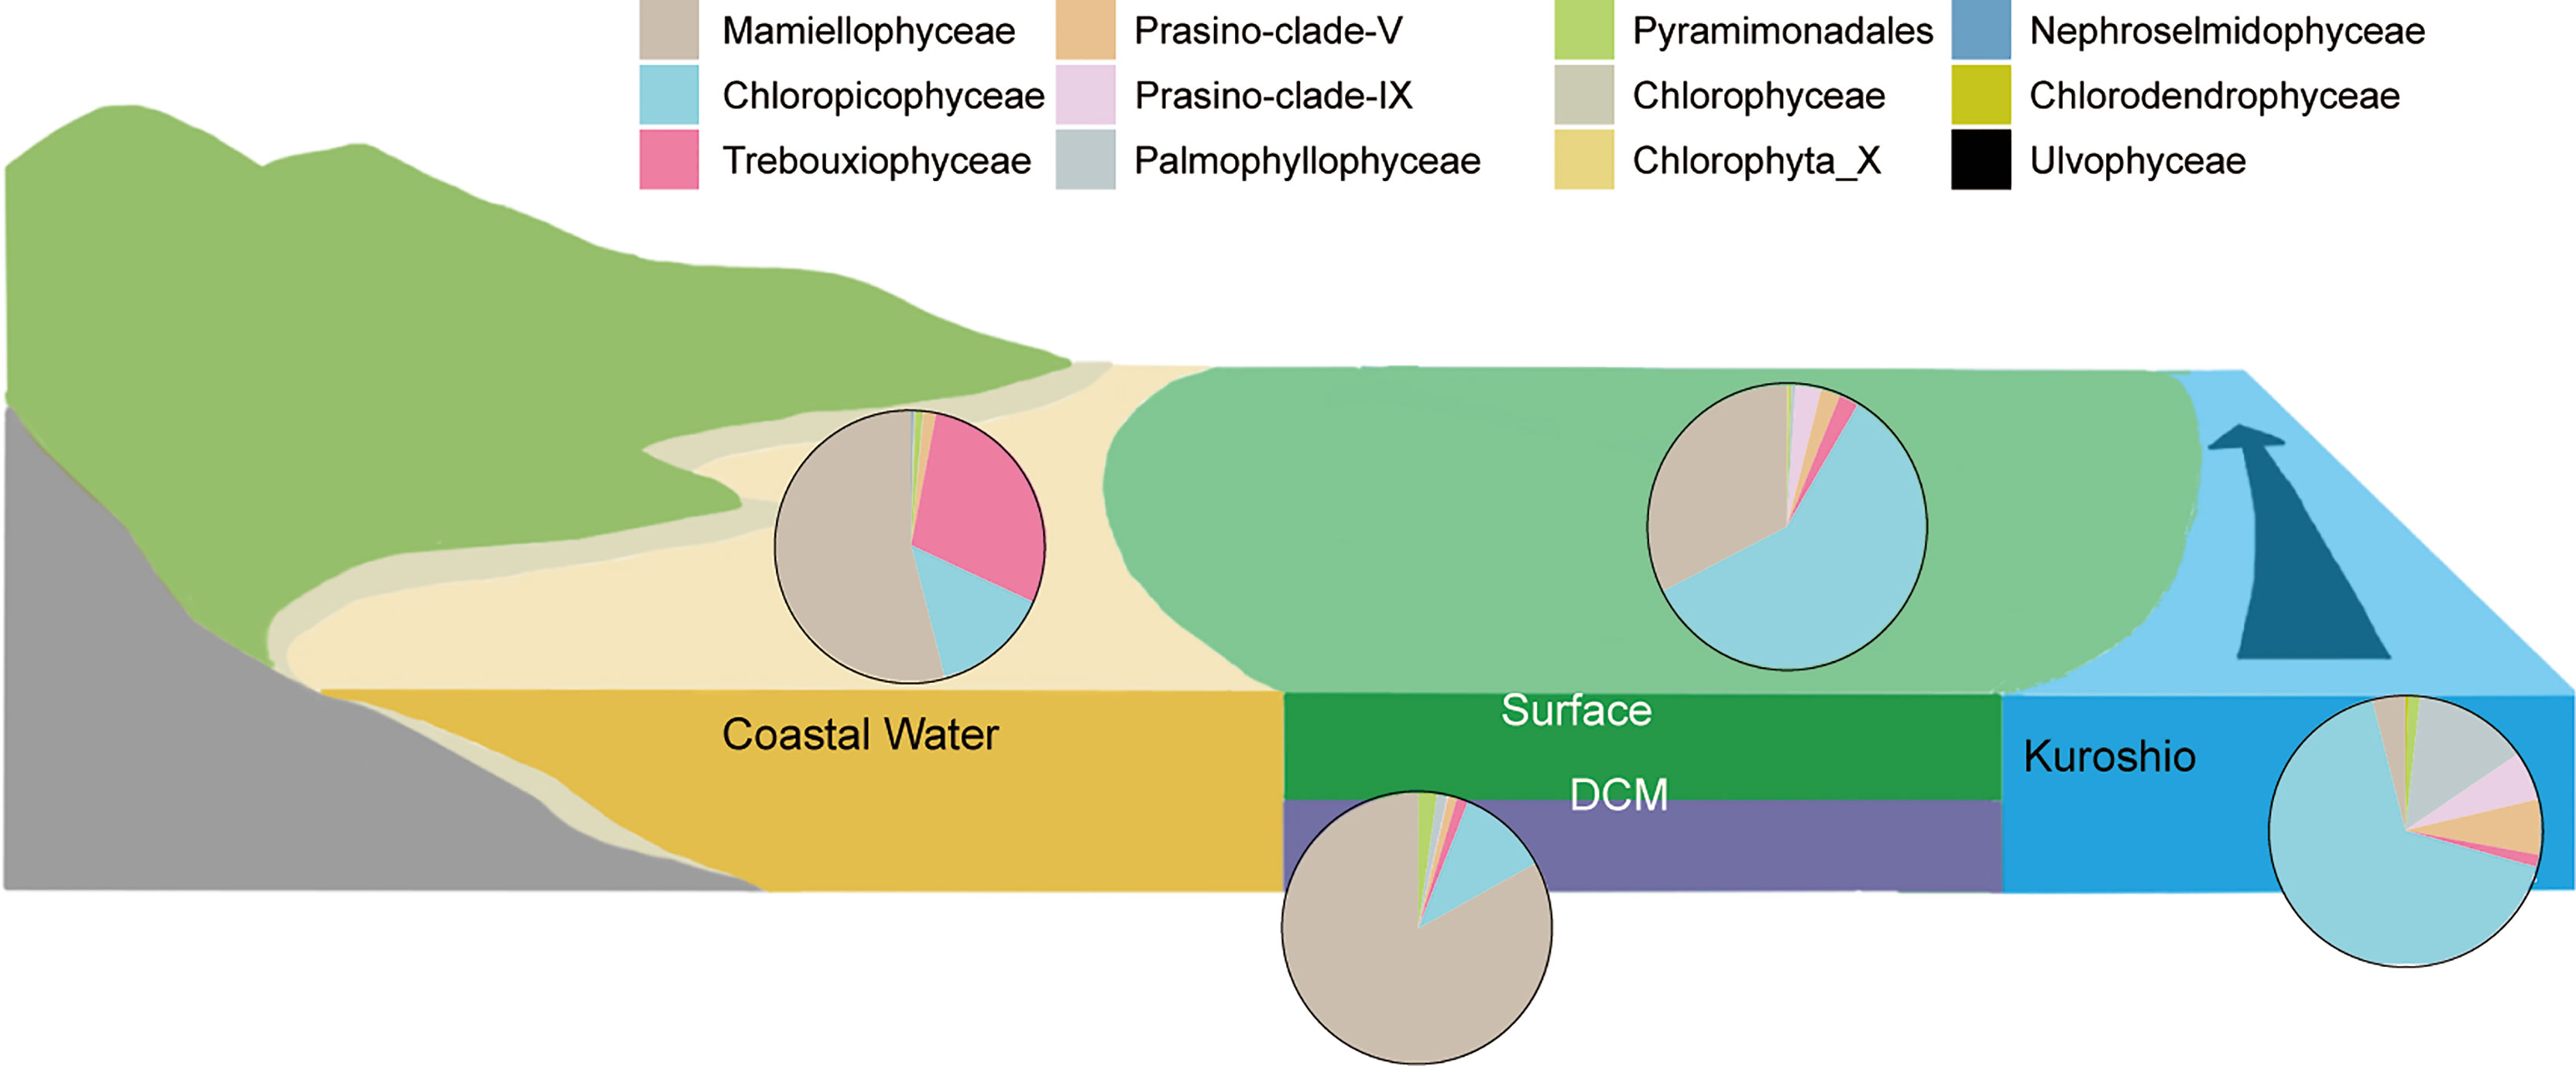
Figure 6 A schematic showing currents and chlorophyte composition for each cluster in Figure 5. Earthy yellow and gray blue indicate the coastal currents and offshore Kuroshio water, respectively. These two waters mixed on the shelf region over the East China Sea. The pie charts represent the average proportion of total chlorophyte composition in each cluster (in Figure 5) at the “class” level in PR2.
The DCM Cluster
This comprised mostly offshore DCM samples (Figure 5), with the addition of three surface samples, one an upwelling sample and the other two from the northern ESC. Mamiellophyceae accounted for ~80% of total chlorophyte reads in this cluster (Figure 6), with B. prasinos (ASV_11) and Ostreococcus clade B (ASV_13) being the most abundant. Pyramimonadales were more abundant here than in other clusters (Figure 5).
The Coastal-Water Cluster
This comprised 8 surface samples and 3 DCM samples at Sts. 3, 5, and 35 from the coastal region where depths of DCM layers were shallow (<30 m, Figure S6). The DCM samples were from the southwestern ECS. Mamiellophyceae was dominant, contributing ~50% of chlorophyte reads (Figure 6). The important ASVs in this cluster were M. commoda clade A1 (ASV_10), C. roscoffensis (ASV_8) and Picochlorum sp. (ASV_31) (Figure 5C).
The Kuroshio Cluster
This consisted of just three samples from the southeastern ECS, one surface sample (St. K) and two DCM samples (Sts. 1 and 9). St. K was characterized as typical Kuroshio water using Gong et al. (1996). Upwelling at St.1 was caused by the subsurface invasion of Kuroshio water. As a result, the chlorophyte composition in the DCM layer at St. 1 resembled that in Kuroshio water. The Temperature-Salinity diagram indicated that St. 9 belongs to TWC (Figure 1E). However, the water is characterized as high temperature and high salinity, and is therefore similar to Kuroshio water. The chlorophytes in this cluster were dominated by Chloropicophyceae, particularly the genus Chloroparvula. We also observed a higher amplicon number of prasinophyte clades V and IX, Palmophyllophyceae and Chlorodendrophyceae. Dolichomastigales and Mamiellales (Mamiellophyceae) were less important here than in other clusters (Figure 5).
We further examined and compared the environmental variables among these four clusters using One-way ANOVA and post-hoc Turkey HSD. There were significant differences in temperature, ammonium, phosphate and silicate (Figure S7). Also, we found that chlorophyte clustering patterns were more consistent with nutrient concentrations than with temperature, and that Kuroshio water samples clustered more closely with surface samples, while DCM samples clustered more closely with coastal samples (Figure 5).
Discussion
The Overall Distribution of Chlorophytes
There has been extensive discussion on the relative advantages of choosing operational taxonomic units (OTU) and ASVs from DADA2 (Xu et al., 2022). Generally, OTU is a consensus sequence which can represent different sequences from multiple species through clustering, typically using 97-99% similarity. In contrast, an ASV represents an exact sequence by running an error model to extract true sequences. The ASV method has been broadly accepted for chlorophytes due to their relatively low genetic diversity (Tragin and Vaulot, 2019). The operational taxonomic units (OTU) method is unable to discriminate the distinct Ostreococcus clades, even with a 99% identity threshold (Tragin and Vaulot, 2019). Thus, ASV is better than OTU at representing the taxonomic groups for chlorophytes. The distribution patterns of certain chlorophyte groups have already been demonstrated, for example that Mamiellophyceae is dominant in coastal water whereas Chloropicophyceae and prasinophytes clade IX are dominant in oceanic waters as well as in tropical regions (Tragin et al., 2016; Dos Santos et al., 2017a; Charvet et al., 2021). This study conducted grid sampling at surface and DCM layers on the continental shelf region to provide a high-resolution examination of chlorophyte community variation. Previous studies have not discussed the distribution of chlorophytes with respect to nutrient concentration. Our results show that the DCM layer was dominated by Mamiellophyceae, indicating that nutrient levels play an important role in determining their composition. In surface water, the dominance of both Mamiellophyceae and Chloropicophyceae might result from the mixing of coastal and Kuroshio waters on the continental shelf, with chlorophyte composition thus reflecting the hydrographic dynamics (Figure 6). Some ASVs in surface water resulted from the mixing of coastal and offshore water, e.g., C. roscoffensis (ASV_8), C. sieburthii (ASV_42) and Picochlorum. On the other hand, some ASVs appeared exclusively in the transitional mixing water and occupied a narrow ecological niche, e.g., some ASVs in Dolichomastigaceae-B sp, Chloroparvula clades B2 and B3 and prasinophyte clade IX (Figure 5). Collectively, chlorophyte composition reflects the hydrographic conditions and can thus be used as a model for studying the dynamics of water masses in the ECS shelf system.
Since the first Chloropicophyceae genome of Chloropicon primus has been published, the differentiation of ecological niches between Mamiellophyceae and Chloropicophyceae might be indicated by genomic features (Lemieux et al., 2019). Using genomic prediction, it has been hypothesized that C. primus might be a bacterivore since it possesses WASH complex and DNaes II genes which are associated with phagocytic capacity (Bock et al., 2021). Although C. primus was not an important species in the ECS, there is still little genomic information about other species in Chloropicophyceae. Additionally, visible vacuoles were observed in Chloropicon during ultrastructure inspection (Dos Santos et al., 2017b), but did not appear in either Bathycoccus or Ostreococcus (Limardo et al., 2017). These differences in genomic and physiological features might lead to Mamiellophyceae and Chloropicophyceae occupying different ecological niches.
Mamiellophyceae Community Composition
M. commoda clade A1, M. bravo clade B2 and Micromonas clade B5 appeared more frequently in the ECS (Figure 3), while Micromonas clade B3 and M. polaris were absent. A previous study indicated that Micromonas clade B3 and M. polaris were important in polar regions (Tragin and Vaulot, 2019). M. commoda clade A2 seems to be adapted to cold water at high latitudes (Tragin and Vaulot, 2019), but rarely appeared in the ECS, being present only in the northern Yellow Sea Mixing Water (St. 23). It was absent in a survey of the subtropical coastal water of Taiwan (Lin et al., 2017). M. commoda clade A1 was common in our study, and was detected in most of the samples. GAM prediction indicated that M. commoda clade A1 increased with temperature >25°C (Supplemental File 4). It has been suggested that Micromonas clade B5 is a warm-adapted clade as it is found in the warm waters of the South China Sea and off the Philippines and Taiwan (Wu et al., 2014; Lin et al., 2017; dela Peña et al., 2021). Our results support this, and in our study Micromonas clade B5 peaked at the edge of coastal water where salinity was 32-34 and silicate concentration was ~ 2 μM. (St. 5; Supplemental File 4). It occurred a little more frequently in the DCM layer than in surface samples, although the total number of reads was the same in the two layers (Figure 3). Overall, Micromonas clade B5 preferred nutrient-rich water.
Ostreococcus clade B was abundant in the ECS during the summer (Figure 3) and was an important component of chlorophyte composition in DCM water, appearing alongside Bathycoccus prasinos (Figure 5). It has been described as an oceanic ecotype, associated with low-light and deeper environments (Rodríguez et al., 2005; Demir-Hilton et al., 2011). Ostreococcus clade E, which has two bases different from clade B in 18S V4 region, was established more recently (Tragin and Vaulot, 2019). In our study, Ostreococcus clade E had low reads and peaked in more coastal waters (Figure 5; Supplemental File 2), implying a preference for eutrophic warm waters. On the other hand, O. lucimarinus belonged to a coastal ecotype (Simmons et al., 2016), and its related reads were detected only at St. 31 (Supplemental File 2). Although its sequences were found to be abundant in the Kuroshio front located off southeastern Japan (Clayton et al., 2017), it was almost absent in the ECS during the summer. Bathycoccus prasinos reads were negatively correlated with temperature in the ECS (Supplemental File 4), but there were no clear ecotypes based on 18S V4 amplicon data. Mamiella gilva comprised 6 ASVs here and the dominant ASV showed a preference for coastal surface water and was absent in the DCM layer (Figures 3 and Supplemental File 4). Mantoniella clade B was detected only in two offshore samples, represented by one ASV (Supplemental File 2). Overall, the majority of Mamiellophyceae ASVs seem to be more important in eutrophic waters.
Chloropicophyceae Community Composition
In marine environments, Chloropicophyceae comprises two main genera, Chloropicon and Chloroparvula, both of which were extensively represented in the ECS samples (Figures 3 and Supplemental File 4). Notably, the phylogeny in the Chloropicon species indicated by using V4 region of the 18S rRNA was inconsistent with the taxonomic annotation with DADA2 (Figure S2). Therefore, we have pointed out the ASV number among Chloropicon. So far, little is known about their distribution, particularly in tropical-subtropical regions. However, Dos Santos et al. (2017a) have reported that global surveys indicate Chloropicophyceae has a preference for oligotrophic and warm water. In our study, all clades in Chloropicon and Chloroparvula were detected, apart from Chloropicon maureeniae. C. roscoffensis (ASV_8) was the most abundant ASV (Figure 3) having a wide distribution over the continental shelf. In the ECS, C. roscoffensis reads correlated negatively with silicate concentration (Supplemental File 4). However, it was abundant in the Changjiang estuary at low nutrient levels. The next most abundant ASV among Chloropicophyceae was C. sieburthii (ASV_42), which was slightly more abundant in the DCM layer than in the surface layer (Figure 3), and was the most important ASV in KW (Figure 5). Different C. roscoffensis ASVs exhibited different distribution patterns. ASV_8 occurred in a wide range of salinity, whereas ASV_84 appeared only where salinity was >32. Chloroparvula clades B2 and B3 exhibited similar distribution patterns and were found mainly in the central offshore area of the ECS. Both clade B2 and clade B3 were absent in the DCM layer (Figure 3), and generally peaked in low chlorophyll a water (Supplemental File 4). A previous study indicated that Chloropicon and Chloroparvula were important in offshore water (Dos Santos et al., 2017a). Our results were consistent with that study as the majority of Chloropicophyceae ASVs were negatively correlated with silicate concentration and inhabited more oligotrophic surface water than other chlorophyte ASVs (Supplemental File 4).
Chlorophyte Composition and Environmental Variables
In this study, we observed that chlorophyte diversity varied with silicate concentrations in both surface and DCM layers. The results of CCA showed that salinity, temperature and silicate concentration had the greatest influence on the distribution of abundant chlorophyte ASVs (Figure 7). Since chlorophytes seldom uptake silicate directly, their diversity and communities might be influenced by the diatom. The pico- and nano-sized diatoms have been found to be important in many marine systems recently (Leblanc et al., 2018; Charvet et al., 2021), including in this study (Figure S5), and they might compete with the chlorophyte communities due to their similar size range. On the other hand, there may be other factors which covary with silicate concentration, e.g., turbidity. Turbidity and irradiance can significantly influence phytoplankton composition in estuarine systems since chlorophytes are photosynthetic organisms (Gameiro et al., 2011; Charvet et al., 2014). However, the sampling design of our study made it difficult to evaluate the impact of light. Nevertheless, we observed that certain chlorophyte ASVs showed a preference for specific water layers. Ostreococcus clade B, for example, was more significant in the DCM layer than at the surface based on read numbers (Figure 3), and its cultures were generally isolated in deep water. A previous study demonstrated that the growth rate of different Ostreococcus strains varied with light intensity (Rodríguez et al., 2005; Six et al., 2008). Additionally, some ASVs were nearly absent in DCM water, for example, Chloroparvular clades B2 and B3, Mamiella gilva and prasinophyte clade IX (Figure 3). On the other hand, an ASV in Pycnococcaceae (belonging to prasinophyte clade V, ASV_218), contributed moderate reads in both surface and DCM layers, and occurred frequently in the ECS summer, particular in KW (Figures 3, 5). According to BLAST search, this ASV is identical to a Pycnococcus provasolii sequence whose genome has been reported to encode unique dual photoreceptors of orange/far-red and blue to enable adaptation to a broad range of ocean depths (Makita et al., 2021). Overall, our data illustrated that chlorophyte communities seem to vary with terrestrial inputs of silicate concentration and salinity.
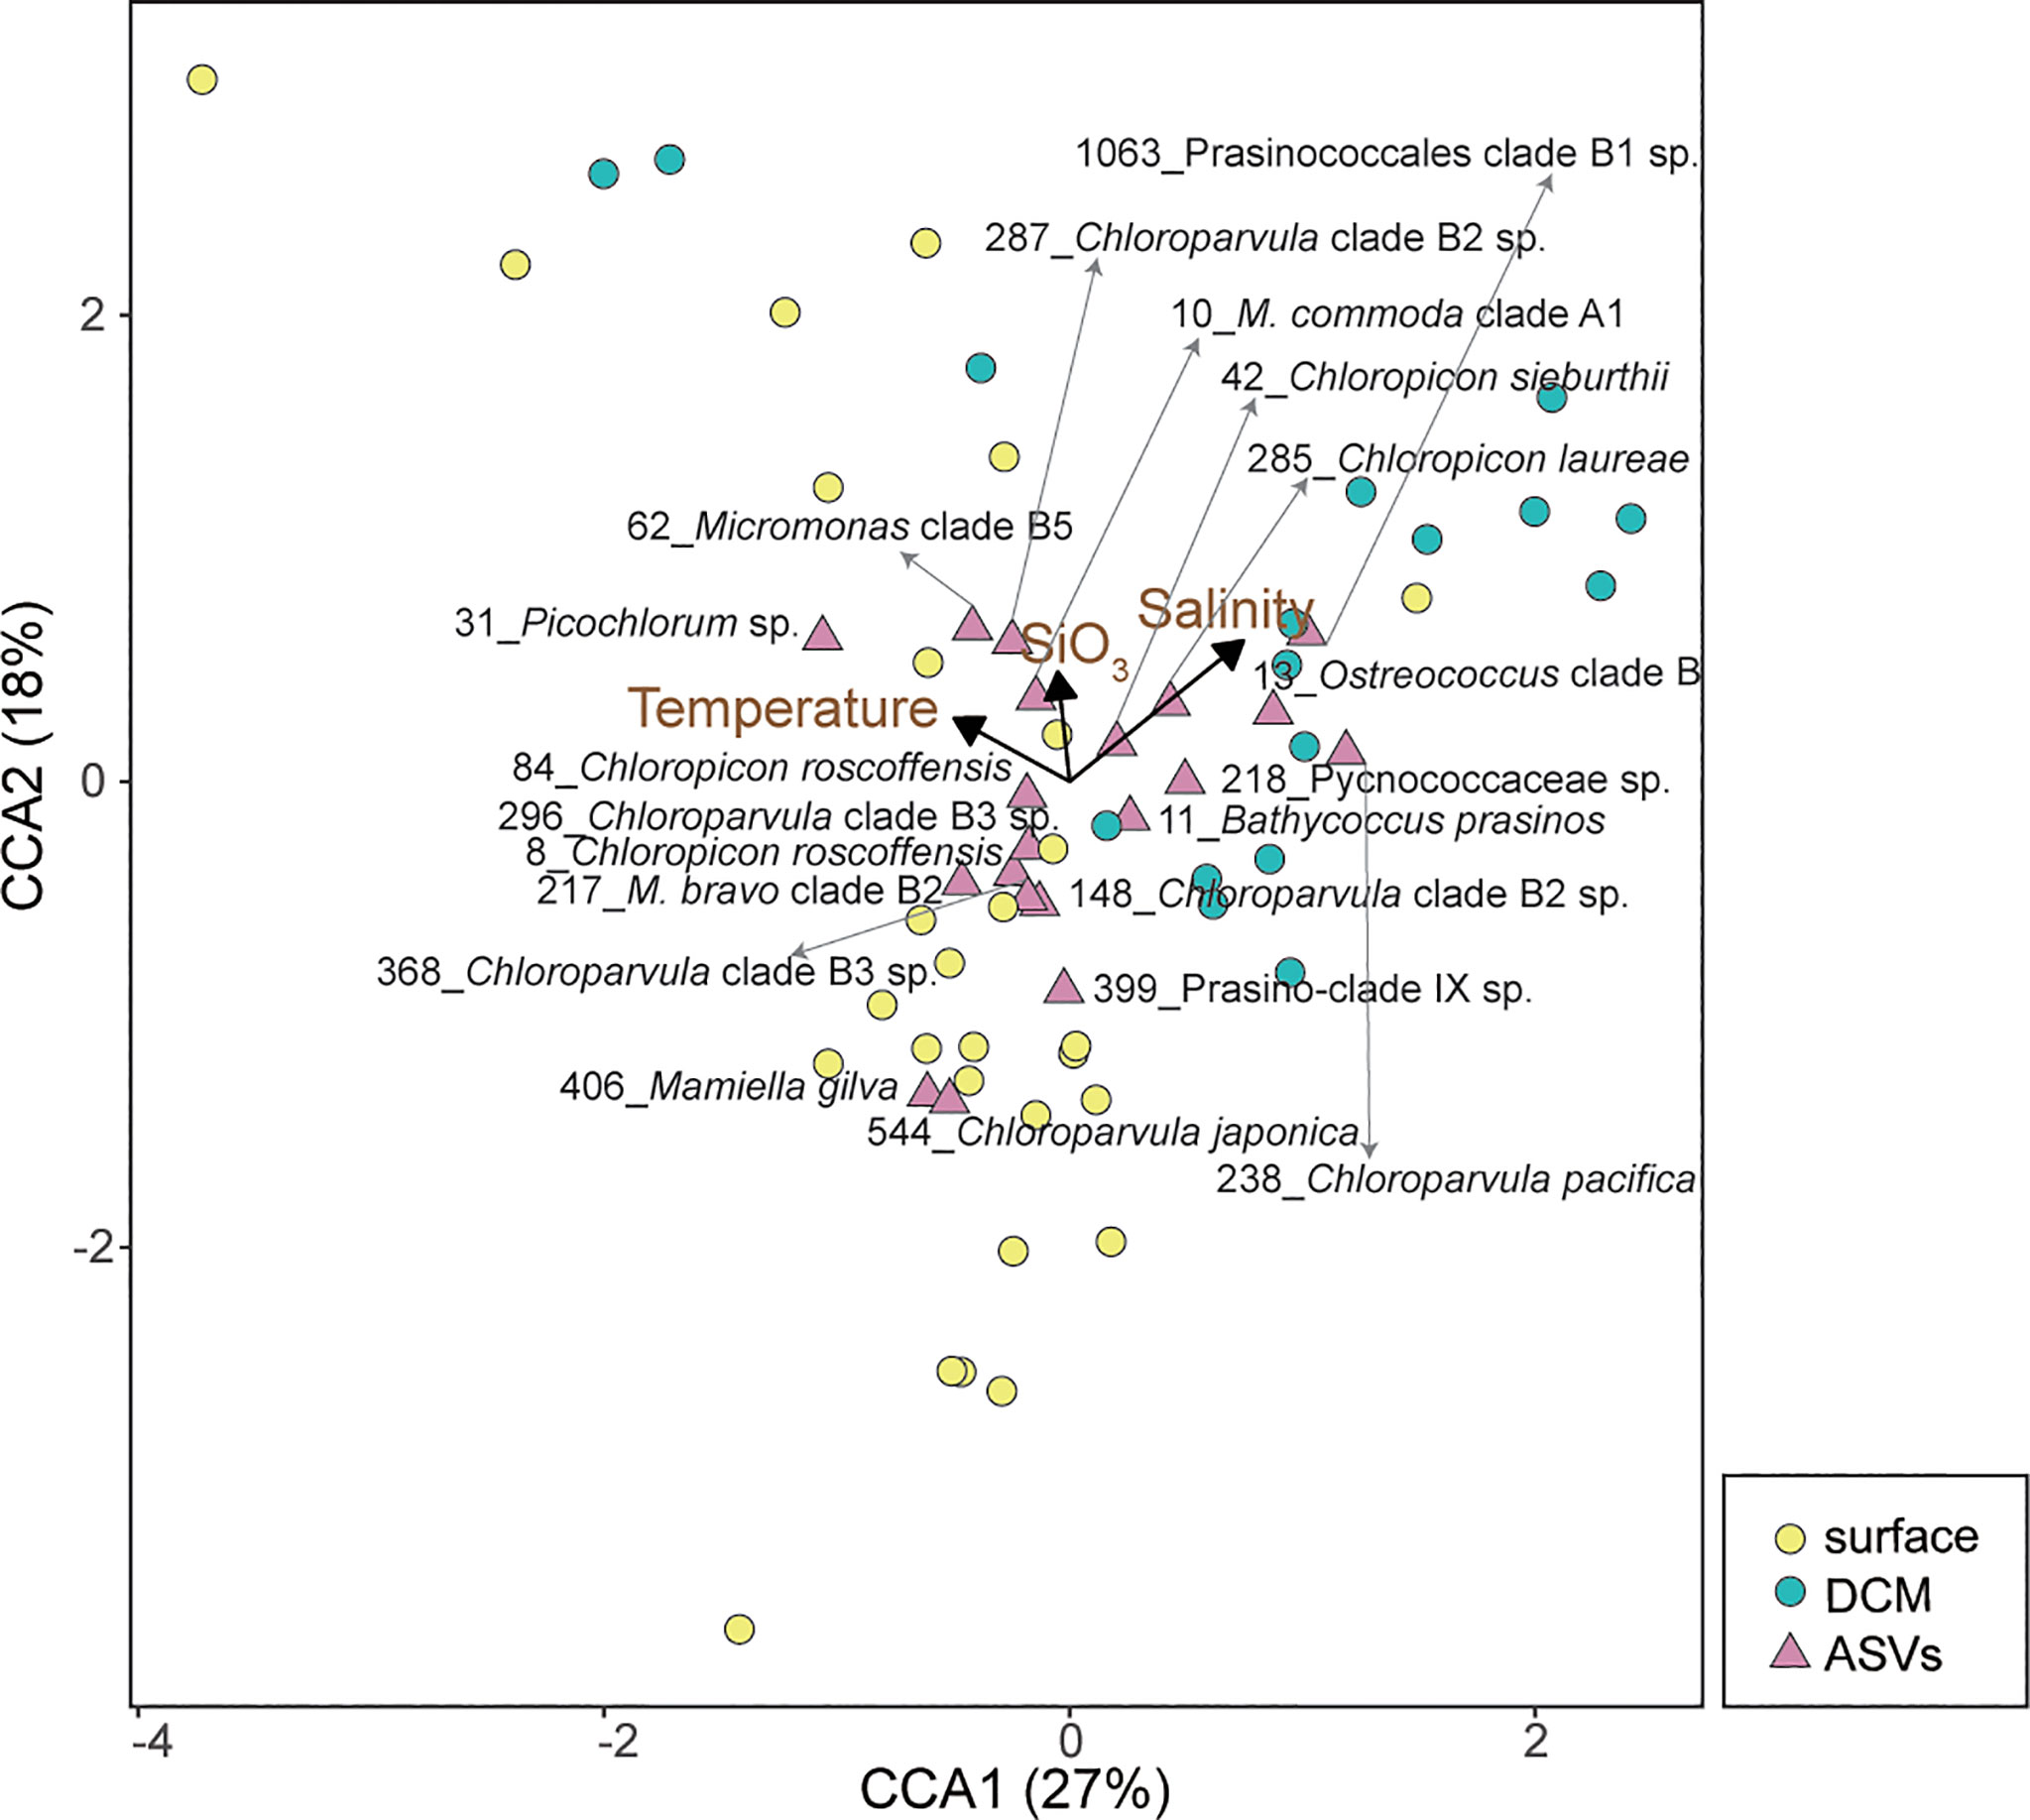
Figure 7 Canonical correspondence analysis (CCA) biplot illustrating the relationship between environmental variables and abundant chlorophyte ASVs. The arrows show significant environmental variables, the pink triangles represent the 20 most abundant chlorophyte ASVs, and the yellow and turquoise circles represent the surface and DCM samples, respectively. The CCA results show that salinity, temperature and silicate concentration are the most significant factors driving the chlorophyte communities. The numbers next to the taxonomic annotations indicate the ASV.
In the ECS, chlorophyte communities showed higher diversity in the surface layer than in the DCM layer. Chao1 and Shannon diversity indices were significantly correlated with nutrient concentrations, particular in surface water (Figure 4B). Temperature and salinity also play important roles in surface water (Figure 4B), with the Chao1 index being positively correlated with both temperature (r = 0.66, P < 0.001) and salinity (r= 0.65, P < 0.001) (Figure 4B). In the DCM layer, the diversity indices were related to few environmental factors, suggesting there might be other factors determining chlorophyte diversity, such as predators and irradiance levels (Charvet et al., 2014; Yang et al., 2018). Our data shows that the diversity indices were negatively correlated with silicate concentrations, indicating that terrestrial input to the ECS plays an important role in shaping chlorophyte diversity. A previous study indicated that sudden pulses of high nutrients can increase the growth of a single species, and thus decrease community diversity (Spatharis et al., 2007). In our study, the minimum chlorophyte diversity was observed in the coastal water (St. 6) of the central ECS dominated by Picochlorum (90% of total chlorophyte reads). We also observed high PPE abundance and chlorophyll a concentration. With global warming, Picochlorum might lead to harmful algal blooms since GAM indicates its reads correlate positively with temperature, ammonium and silicate concentrations (Supplemental File 4). Foflonker et al. (2015) have indicated that Picochlorum can acclimate to a wide range of salinity and that excessive ammonium enhances their growth, and that these ecological features can be explained by genomic data. A recent study indicated that Picochlorum can be grazers on picoplankton (Pang et al., 2022). More than that, some taxa among chlorophytes have been reported as potential mixotrophs, e.g., Chloropicon, Dolichomastix, Micromonas, Nephroselmis, Pterosperma and Pyramimonas (McKie-Krisberg and Sanders, 2014; Bock et al., 2021). These pico-size chlorophytes are also predators on picoplankton, which might result in an increase in the efficiency of energy flows (Ward and Follows, 2016). On the other hand, being an important prey for protists and zooplankton (Orsi et al., 2018; Ma et al., 2021), their composition will influence the community diversity of predators (Yang et al., 2018). Therefore, as primary producers and consumers, chlorophyte community structure plays a key role in determining the efficiency of energy and nutrient flows in microbial food webs.
Conclusion
This study examined the community composition of chlorophytes in surface and DCM layers in a subtropical North Pacific Ocean. Mamiellophyceae was dominant in relatively nutrient-rich coastal water and in the DCM layer, whereas Chloropicophyceae was dominant in Kuroshio waters. We demonstrated that the mixing of coastal and offshore waters played an important role in determining the chlorophyte composition in the shelf surface water of the ECS. Additionally, river input to continental systems enables certain chlorophyte species to outcompete others, lowering the overall chlorophyte diversity. For the purposes of coastal management, and to maintain a healthy ecosystem, it is therefore important to monitor excess nutrient input into the continental system.
Data Availability Statement
The datasets presented in this study can be found in online repositories. The names of the repository/repositories and accession number(s) can be found below: NCBI [accession: PRJNA738614].
Author Contributions
The study was conceived by K-PC; C-TH collected the field samples and performed the molecular laboratory work; Y-CL, C-PC, W-TC, X-BC contributed to data analysis; G-CG provided the chemical parameters; Y-CL wrote the draft of the manuscript; and all authors contributed substantially to revisions.
Funding
This research was supported by the Ministry of Science and Technology, Taiwan (MOST 107-2611-M-019 -002 -MY3 and MOST 109-2611-M- 019 -018).
Conflict of Interest
The authors declare that the research was conducted in the absence of any commercial or financial relationships that could be construed as a potential conflict of interest.
Publisher’s Note
All claims expressed in this article are solely those of the authors and do not necessarily represent those of their affiliated organizations, or those of the publisher, the editors and the reviewers. Any product that may be evaluated in this article, or claim that may be made by its manufacturer, is not guaranteed or endorsed by the publisher.
Acknowledgments
We thank Wenxue Wu for the constructive comments on manuscript and helping with revision, the captain and crew of the R/V Ocean Researcher I for sampling, Yu-Ting Tseng for organizing the environmental parameter data, and Naqwa Li for the artwork.
Supplementary Material
The Supplementary Material for this article can be found online at: https://www.frontiersin.org/articles/10.3389/fmars.2022.865081/full#supplementary-material
Supplementary Figure 1 | Phylogenetic relationship of Mamiellophyceae based on V4 region of 18S rRNA gene. The 15 most abundant Mamiellophyceae ASVs in this study are shown in bold. This tree was constructed using an alignment of 333 bp under PhyML. Bootstrap values are shown when > 0.7.
Supplementary Figure 2 | Phylogenetic relationship of Chloropicophyceae based on V4 region of 18S rRNA gene. The 15 most abundant Chloropicophyceae ASVs in this study are shown in bold. This tree was constructed using an alignment of 351 bp under PhyML. Bootstrap values are shown when > 0.7.
Supplementary Figure 3 | The distribution of temperature (°C), salinity, chlorophyll a (mg m-3) and nutrient concentrations (nitrite, nitrate, phosphate, silicate and ammonium, μM) in surface water in the ECS during 2019 July.
Supplementary Figure 4 | The distribution of temperature (°C), salinity, chlorophyll a (mg m-3) and nutrient concentrations (nitrite, nitrate, phosphate, silicate and ammonium, μM) in the DCM layer in the ECS during 2019 July.
Supplementary Figure 5 | Treemaps showing the (A, B) community composition of eukaryotes at supergroup level and (C, D) photosynthetic eukaryotes at division level in the (A, C) surface layer and (B, D) DCM layer. The area of each taxonomic group is proportional to the number of reads calculated from the average of the samples.
Supplementary Figure 6 | The vertical distribution of chlorophyll a concentrations (mg m-3) along east-west transects from the north to south in the ECS during 2019 July.
Supplementary Figure 7 | Distribution patterns of temperature (°C), salinity, nitrite, nitrate, phosphate and silicate concentrations (μM) in the DCM, surface, coastal water and Kuroshio clusters. Boxplots show the median values as horizontal lines, and interquartile ranges as boxes with whiskers extending to 1.5 times the interquartile range. Dots indicate the outliers. Significant differences between these clusters shown with ANOVA (*P < 0.05) and the clusters sharing different letters are significantly different according to Tukey’s post hoc test.
Supplemental File 1 | 18S ASV table produced from 30 surface samples and 20 DCM samples from the ECS continental shelf in 2019 July.
Supplemental File 2 | Chlorophyte ASV table filtered from 18S ASV table with a criterion of “Chlorophyta” in “division” level under PR2 then subsampled 400 reads for 100× in each sample.
Supplemental File 3 | Environmental data.
Supplemental file 4 | Predicted niche (colored lines) of the 20 most abundant chlorophyte ASVs with respect to temperature (°C), salinity, chlorophyll a concentration (mg m-3) nutrients (ammonium, nitrate, nitrite, phosphate and silicate [μM]). This prediction was based on generalized additive models (GAM) and grey shading represents 95% confidence. Note that ASV reads were transferred by Ln (reads+1).
References
Balzano S., Marie D., Gourvil P., Vaulot D. (2012). Composition of the Summer Photosynthetic Pico and Nanoplankton Communities in the Beaufort Sea Assessed by T-RFLP and Sequences of the 18S rRNA Gene From Flow Cytometry Sorted Samples. ISME J. 6, 1480–1498. doi: 10.1038/ismej.2011.213
Bock N. A., Charvet S., Burns J., Gyaltshen Y., Rozenberg A., Duhamel S., et al. (2021). Experimental Identification and In Silico Prediction of Bacterivory in Green Algae. ISME J. 15, 1987–2000. doi: 10.1038/s41396-021-00899-w
Callahan B. J., Mcmurdie P. J., Rosen M. J., Han A. W., Johnson A. J. A., Holmes S. P. (2016). DADA2: High-Resolution Sample Inference From Illumina Amplicon Data. Nat. Methods 13, 581. doi: 10.1038/nmeth.3869
Caron D. A. (2016). Mixotrophy Stirs Up Our Understanding of Marine Food Webs. Proc. Natl. Acad. Sci. 113, 2806–2808. doi: 10.1073/pnas.1600718113
Charvet S., Kim E., Subramaniam A., Montoya J., Duhamel S. (2021). Small Pigmented Eukaryote Assemblages of the Western Tropical North Atlantic Around the Amazon River Plume During Spring Discharge. Sci. Rep. 11, 1–14. doi: 10.1038/s41598-021-95676-2
Charvet S., Vincent W. F., Lovejoy C. (2014). Effects of Light and Prey Availability on Arctic Freshwater Protist Communities Examined by High-Throughput DNA and RNA Sequencing. FEMS Microbiol. Ecol. 88, 550–564. doi: 10.1111/1574-6941.12324
Chen C. (1996). The Kuroshio Intermediate Water is the Major Source of Nutrients on the East China Sea Continental Shelf. Oceanol. Acta 19, 523–527.
Clayton S., Lin Y. C., Follows M. J., Worden A. Z. (2017). Co-Existence of Distinct Ostreococcus Ecotypes at an Oceanic Front. Limnol. Oceanography 62, 75–88. doi: 10.1002/lno.10373
Collado-Fabbri S., Vaulot D., Ulloa O. (2011). Structure and Seasonal Dynamics of the Eukaryotic Picophytoplankton Community in a Wind-Driven Coastal Upwelling Ecosystem. Limnol. Oceanography 56, 2334–2346. doi: 10.4319/lo.2011.56.6.2334
dela Peña L. B. R. O., Tejada A. J. P., Quijano J. B., Alonzo K. H., Gernato E. G., Caril A., et al. (2021). Diversity of Marine Eukaryotic Picophytoplankton Communities With Emphasis on Mamiellophyceae in Northwestern Philippines. Philippine J. Sci. 150, 27–42.
Demir-Hilton E., Sudek S., Cuvelier M. L., Gentemann C. L., Zehr J. P., Worden A. Z. (2011). Global Distribution Patterns of Distinct Clades of the Photosynthetic Picoeukaryote Ostreococcus. ISME J. 5, 1095–1107. doi: 10.1038/ismej.2010.209
Derelle E., Ferraz C., Rombauts S., Rouze P., Worden A., Robbens S., et al. (2006). Genome Analysis of the Smallest Free-Living Eukaryote Ostreococcus Tauri Unveils Many Unique Features. Proc. Natl. Acad. Sci. 103, 11647. doi: 10.1073/pnas.0604795103
de Vargas C., Audic S., Henry N., Decelle J., Mahé F., Logares R., et al. (2015). Eukaryotic Plankton Diversity in the Sunlit Ocean. Science 348, 1261605. doi: 10.1126/science.1261605
Dos Santos A. L., Gourvil P., Tragin M., Noël M.-H., Decelle J., Romac S., et al. (2017a). Diversity and Oceanic Distribution of Prasinophytes Clade VII, the Dominant Group of Green Algae in Oceanic Waters. ISME J. 11, 512–528. doi: 10.1038/ismej.2016.120
Dos Santos A. L., Pollina T., Gourvil P., Corre E., Marie D., Garrido J. L., et al. (2017b). Chloropicophyceae, a New Class of Picophytoplanktonic Prasinophytes. Sci. Rep. 7, 14019. doi: 10.1038/s41598-017-12412-5
Field C. B., Behrenfeld M. J., Randerson J. T., Falkowski P. (1998). Primary Production of the Biosphere: Integrating Terrestrial and Oceanic Components. Science 281, 237–240. doi: 10.1126/science.281.5374.237
Foflonker F., Price D. C., Qiu H., Palenik B., Wang S., Bhattacharya D. (2015). Genome of the Halotolerant Green Alga Picochlorum Sp. Reveals Strategies for Thriving Under Fluctuating Environmental Conditions. Environ. Microbiol. 17, 412–426. doi: 10.1111/1462-2920.12541
Foulon E., Jalabert F., Cariou T., Massana R., Simon N. (2008). Ecological Niche Partitioning in the Picoplanktonic Green Alga Micromonas Pusilla: Evidence From Environmental Surveys Using Phylogenetic Probes. Environ. Microbiol. 10, 2433. doi: 10.1111/j.1462-2920.2008.01673.x
Gameiro C., Zwolinski J., Brotas V. (2011). Light Control on Phytoplankton Production in a Shallow and Turbid Estuarine System. Hydrobiologia 669, 249–263. doi: 10.1007/s10750-011-0695-3
Gong G.-C., Chen Y.-L. L., Liu K.-K. (1996). Chemical Hydrography and Chlorophyll a Distribution in the East China Sea in Summer: Implications in Nutrient Dynamics. Continental Shelf Res. 16, 1561–1590. doi: 10.1016/0278-4343(96)00005-2
Gong G.-C., Shiah F.-K., Liu K.-K., Wen Y.-H., Liang M.-H. (2000). Spatial and Temporal Variation of Chlorophyll a, Primary Productivity and Chemical Hydrography in the Southern East China Sea. Continental Shelf Res. 20, 411–436. doi: 10.1016/S0278-4343(99)00079-5
Guillou L., Eikrem W., Chrétiennot-Dinet M. J., Le Gall F., Massana R., Romari K., et al. (2004). Diversity of Picoplanktonic Prasinophytes Assessed by Direct Nuclear SSU rDNA Sequencing of Environmental Samples and Novel Isolates Retrieved From Oceanic and Coastal Marine Ecosystems. Protist 155, 193–214. doi: 10.1078/143446104774199592
Leblanc K., Queguiner B., Diaz F., Cornet V., Michel-Rodriguez M., Durrieu De Madron X., et al. (2018). Nanoplanktonic Diatoms Are Globally Overlooked But Play a Role in Spring Blooms and Carbon Export. Nat. Commun. 9, 1–12. doi: 10.1038/s41467-018-03376-9
Lemieux C., Turmel M., Otis C., Pombert J.-F. (2019). A Streamlined and Predominantly Diploid Genome in the Tiny Marine Green Alga Chloropicon Primus. Nat. Commun. 10, 4061. doi: 10.1038/s41467-019-12014-x
Li W. (1995). Composition of Ultraphytoplankton in the Central North Atlantic. Mar. Ecol. Prog. Ser. 122, 1–8. doi: 10.3354/meps122001
Limardo A. J., Sudek S., Choi C. J., Poirier C., Rii Y. M., Blum M., et al. (2017). Quantitative Biogeography of Picoprasinophytes Establishes Ecotype Distributions and Significant Contributions to Marine Phytoplankton. Environ. Microbiol. 19, 3219–3234. doi: 10.1111/1462-2920.13812
Lin Y. C., Chung C. C., Chen L. Y., Gong G. C., Huang C. Y., Chiang K. P. (2017). Community Composition of Photosynthetic Picoeukaryotes in a Subtropical Coastal Ecosystem, With Particular Emphasis on Micromonas. J. Eukaryotic Microbiol. 64, 349–359. doi: 10.1111/jeu.12370
Lin Y. C., Chin C. P., Yang J. W., Chiang K. P., Hsieh C. H., Gong G. C., et al. (2022). How Communities of Marine Stramenopiles Varied with Environmental and Biological Variables in the Subtropical Northwestern Pacific Ocean. Microb. Ecol. 83, 916–928. doi: 10.1007/s00248-021-01788-7
Logares R., Deutschmann I. M., Giner C. R., Krabberød A. K., Schmidt T. S., Rubinat-Ripoll L., et al. (2018). Different Processes Shape Prokaryotic and Picoeukaryotic Assemblages in the Sunlit Ocean Microbiome. bioRxiv 374298. doi: 10.1101/374298
Lovejoy C., Vincent W. F., Bonilla S., Roy S., Martineau M. J., Terrado R., et al. (2007). Distribution, Phylogeny, and Growth of Cold-Adapted Picoprasinophytes in Arctic Seas. J. Phycol. 43, 78–89. doi: 10.1111/j.1529-8817.2006.00310.x
Ma X., Jacoby C. A., Johnson K. B. (2021). Grazing by the Copepod Parvocalanus Crassirostris on Picochlorum Sp. At Harmful Bloom Densities and the Role of Article Size. Front. Mar. Sci. 8, 664154. doi: 10.3389/fmars.2021.664154
Makita Y., Suzuki S., Fushimi K., Shimada S., Suehisa A., Hirata M., et al. (2021). Identification of a Dual Orange/Far-Red and Blue Light Photoreceptor From an Oceanic Green Picoplankton. Nat. Commun. 12, 1–12. doi: 10.1038/s41467-021-23741-5
Martin M. (2011). Cutadapt Removes Adapter Sequences From High-Throughput Sequencing Reads. EMBnet 17, 10–12. doi: 10.14806/ej.17.1.200
McKie-Krisberg Z. M., Sanders R. W. (2014). Phagotrophy by the Picoeukaryotic Green Alga Micromonas: Implications for Arctic Oceans. ISME J. 8, 1953–1961. doi: 10.1038/ismej.2014.16
Moreau H., Verhelst B., Couloux A., Derelle E., Rombauts S., Grimsley N., et al. (2012). Gene Functionalities and Genome Structure in Bathycoccus Prasinos Reflect Cellular Specializations at the Base of the Green Lineage. Genome Biol. 13, R74. doi: 10.1186/gb-2012-13-8-r74
Not F., Latasa M., Marie D., Cariou T., Vaulot D., Simon N. (2004). A Single Species, Micromonas Pusilla (Prasinophyceae), Dominates the Eukaryotic Picoplankton in the Western English Channel. Appl. Environ. Microbiol. 70, 4064–4072. doi: 10.1128/AEM.70.7.4064-4072.2004
Not F., Massana R., Latasa M., Marie D., Colson C., Eikrem W., et al. (2005). Late Summer Community Composition and Abundance of Photosynthetic Picoeukaryotes in Norwegian and Barents Seas. Limnol. Oceanography 50, 1677–1686. doi: 10.4319/lo.2005.50.5.1677
Orsi W. D., Wilken S., Del Campo J., Heger T., James E., Richards T. A., et al. (2018). Identifying Protist Consumers of Photosynthetic Picoeukaryotes in the Surface Ocean Using Stable Isotope Probing. Environ. Microbiol. 20, 815–827. doi: 10.1111/1462-2920.14018
Pang M., Liu K., Liu H. (2022). Evidence for Mixotrophy in Pico-Chlorophytes From a New Picochlorum (Trebouxiophyceae) Strain. J. Phycol. 58, 80–91. doi: 10.1111/jpy.13218
Rodríguez F., Derelle E., Guillou L., Le Gall F., Vaulot D., Moreau H. (2005). Ecotype Diversity in the Marine Picoeukaryote Ostreococcus (Chlorophyta, Prasinophyceae). Environ. Microbiol. 7, 853–859. doi: 10.1111/j.1462-2920.2005.00758.x
Sieburth J. M., Smetacek V., Lenz J. (1978). Pelagic Ecosystem Structure: Heterotrophic Compartments of the Plankton and Their Relationship to Plankton Size Fractions. Limnol. Oceanography 23, 1256–1263. doi: 10.4319/lo.1978.23.6.1256
Simmons M. P., Sudek S., Monier A., Limardo A. J., Jimenez V., Perle C. R., et al. (2016). Abundance and Biogeography of Picoprasinophyte Ecotypes and Other Phytoplankton in the Eastern North Pacific Ocean. Appl. Environ. Microbiol. 82, 1693–1705. doi: 10.1128/AEM.02730-15
Six C., Finkel Z. V., Rodriguez F., Marie D., Partensky F., Campbell D. A. (2008). Contrasting Photoacclimation Costs in Ecotypes of the Marine Eukaryotic Picoplankter Ostreococcus. Limnol. Oceanography 53, 255–265. doi: 10.4319/lo.2008.53.1.0255
Spatharis S., Tsirtsis G., Danielidis D. B., Do Chi T., Mouillot D. (2007). Effects of Pulsed Nutrient Inputs on Phytoplankton Assemblage Structure and Blooms in an Enclosed Coastal Area. Estuarine Coastal. Shelf Sci. 73, 807–815. doi: 10.1016/j.ecss.2007.03.016
Stoeck T., Bass D., Nebel M., Christen R., Jones M. D., Breiner H. W., et al. (2010). Multiple Marker Parallel Tag Environmental DNA Sequencing Reveals a Highly Complex Eukaryotic Community in Marine Anoxic Water. Mol. Ecol. 19, 21–31. doi: 10.1111/j.1365-294X.2009.04480.x
Tragin M., Lopes Dos Santos A., Christen R., Vaulot D. (2016). Diversity and Ecology of Green Microalgae in Marine Systems: An Overview Based on 18S rRNA Gene Sequences. Perspect. Phycol. 3, 141–154. doi: 10.1127/pip/2016/0059
Tragin M., Vaulot D. (2019). Novel Diversity Within Marine Mamiellophyceae (Chlorophyta) Unveiled by Metabarcoding. Sci. Rep. 9, 5190. doi: 10.1038/s41598-019-41680-6
Vannier T., Leconte J., Seeleuthner Y., Mondy S., Pelletier E., Aury J.-M., et al. (2016). Survey of the Green Picoalga Bathycoccus Genomes in the Global Ocean. Sci. Rep. 6, 37900. doi: 10.1038/srep37900
Ward B. A., Follows M. J. (2016). Marine Mixotrophy Increases Trophic Transfer Efficiency, Mean Organism Size, and Vertical Carbon Flux. Proc. Natl. Acad. Sci. 113, 2958–2963. doi: 10.1073/pnas.1517118113
Worden A., Lee J., Mock T., Rouze P., Simmons M., Aerts A., et al. (2009). Green Evolution and Dynamic Adaptations Revealed by Genomes of the Marine Picoeukaryotes Micromonas. Science 324, 268. doi: 10.1126/science.1167222
Worden A. Z., Nolan J. K., Palenik B. (2004). Assessing the Dynamics and Ecology of Marine Picophytoplankton: The Importance of the Eukaryotic Component. Limnol. Oceanography 49, 168–179. doi: 10.4319/lo.2004.49.1.0168
Wu W., Huang B., Liao Y., Sun P. (2014). Picoeukaryotic Diversity and Distribution in the Subtropical-Tropical South China Sea. FEMS Microbiol. Ecol. 89, 563–579. doi: 10.1111/1574-6941.12357
Xu J., Han J., Su H., Zhu C., Quan Z., Wu L., et al. (2022). Diversity Patterns of Protists are Highly Affected by Methods Disentangling Biological Variants: A Case Study in Oligotrich (s.L.) Ciliates. Microorganisms 10, 913. doi: 10.3390/microorganisms10050913
Yang J. W., Wu W., Chung C.-C., Chiang K.-P., Gong G.-C., Hsieh C.-H. (2018). Predator and Prey Biodiversity Relationship and Its Consequences on Marine Ecosystem Functioning—Interplay Between Nanoflagellates and Bacterioplankton. ISME J. 12, 1532–1542. doi: 10.1038/s41396-018-0111-3
Keywords: amplicon sequencing, Chloropicophyceae, ecological distribution, Mamiellophyceae, NW Pacific Ocean
Citation: Lin Y-C, Chin C-P, Chen W-T, Huang C-T, Gong G-C, Chiang K-P and Chen X-B (2022) The Spatial Variation in Chlorophyte Community Composition From Coastal to Offshore Waters in a Subtropical Continental Shelf System. Front. Mar. Sci. 9:865081. doi: 10.3389/fmars.2022.865081
Received: 29 January 2022; Accepted: 20 May 2022;
Published: 13 July 2022.
Edited by:
Wei-Bo Chen, National Science and Technology Center for Disaster Reduction (NCDR), TaiwanReviewed by:
Yuyuan Xie, University of South Florida, United StatesLei Wang, Third Institute of Oceanography, Ministry of Natural Resources, China
Copyright © 2022 Lin, Chin, Chen, Huang, Gong, Chiang and Chen. This is an open-access article distributed under the terms of the Creative Commons Attribution License (CC BY). The use, distribution or reproduction in other forums is permitted, provided the original author(s) and the copyright owner(s) are credited and that the original publication in this journal is cited, in accordance with accepted academic practice. No use, distribution or reproduction is permitted which does not comply with these terms.
*Correspondence: Kuo-Ping Chiang, a3BjaGlhbmdAbWFpbC5udG91LmVkdS50dw==