 Zhipeng Jiang
 Dehai Song
 Qinsheng Wei
 Yang Ding
94% of researchers rate our articles as excellent or good
Learn more about the work of our research integrity team to safeguard the quality of each article we publish.
Find out more
ORIGINAL RESEARCH article
Front. Mar. Sci., 28 March 2022
Sec. Coastal Ocean Processes
Volume 9 - 2022 | https://doi.org/10.3389/fmars.2022.863540
This article is part of the Research TopicRiver Plumes and EstuariesView all 17 articles
The evolution of low-salinity water (LSW) detached from river plumes is critical to coastal systems and inner-shelf biogeochemical processes. In this study, the impact of wave–current interactions on the LSW detachment from the Changjiang River plume and its subsequent evolution is explored. Waves can advance the detachment of LSW through enhancing the vertical mixing, the northward intrusion of the inshore branch of the Taiwan Warm Current, and the upwelling. The wave-enhanced vertical mixing increases the core salinity of the initially isolated LSW and the growth rate of the core salinity during its subsequent evolution. Waves can lengthen the journey of the isolated LSW and accelerate its movement. Five wave–current interaction processes are compared and it is found that the wave-induced form drag contributes the most to the LSW detachment and its subsequent evolution. It enhances the vertical mixing and alters the wave-driven flow through the vertical transfer of wave-generated pressure to the momentum equation and the turbulent kinetic energy (TKE) equations. The wave dissipation working in the TKE equations weakens the northeastward flow off the Changjiang River estuary, which restrains the diluted water expansion. The current advection and refraction of wave energy contribute most to the enhancement of the double-core upwelling system.
The detachment of low-salinity water (LSW) from river plumes has been observed globally, such as the Changjiang River (Lie et al., 2003; Chen et al., 2008; Moon et al., 2010; Rong and Li, 2012; Xuan et al., 2012; Ge et al., 2015; Wei et al., 2017; Qu et al., 2019), the Yellow River (Yu et al., 2020), the Pearl River (Gan et al., 2009; Shu et al., 2011; Chen et al., 2016), the Block Island Sound (Liu et al., 2017), the Columbia River, and the Hudson River (Yankovsky et al., 2001; García Berdeal et al., 2002; Jurisa and Chant, 2012). After detachment, the isolated LSW still keeps some plume features with moderate nutrient concentration and sufficient light intensity and thus is often related to red tide patches or high chlorophyll-a patches in surrounding waters, which could further contribute to the formation of bottom hypoxia (Wei et al., 2017, 2020; Qu et al., 2019). Therefore, exploring the formation and expansion of detached LSW provides a better understanding of the dynamical and biogeochemical processes at river plume fronts. Several mechanisms on LSW detachment have been proposed, such as the bathymetry gradient (Chen et al., 2016), river discharge (Yankovsky et al., 2001; Jurisa and Chant, 2012), tide and tidal mixing (Moon et al., 2010; Rong and Li, 2012; Liu et al., 2017; Yu et al., 2020), wind and wind-induced upwelling (Jurisa and Chant, 2012; Xuan et al., 2012; Ge et al., 2015; Chen et al., 2016), and baroclinic instability (Chen et al., 2008).
The LSW detachment from the Changjiang River plume has been frequently reported in summer by regional surveys or real-case numerical simulations (Beardsley et al., 1985; Lie et al., 2003; Chen et al., 2008; Moon et al., 2010; Xuan et al., 2012; Zhang et al., 2014; Ge et al., 2015; Wei et al., 2017). However, this phenomenon was not captured every summer and the occurrence time and location reported in previous studies seems irregular. Southerly or southeasterly wind usually plays a crucial role on the LSW detachment at the Changjiang River plume. Chen et al. (2008) showed that the input of wind in numerical models is conducive to strengthening the offshore detachment. Xuan et al. (2012) suggested that wind mixing, wind-driven northward current, and wind-induced upwelling are three important driving forcings on the detachment; and a southeasterly wind speed of 8 ms–1 was given as a critical value for the detachment. Ge et al. (2015) showed that the LSW detachment can only be generated by a non-uniform wind in summer. However, Moon et al. (2010) found the detachment can also be generated under a constant uniform northwestward wind.
Intensified tide-induced vertical mixing during the spring tide is another explanation of the LSW detachment (Moon et al., 2010; Wu et al., 2011; Rong and Li, 2012; Zhang et al., 2014). Zhang et al. (2014) found that during the transition from neap tide to spring tide, the tidal mixing is strengthened more quickly in shallow water than that in deep water, and the surface salinity is thus increased more quickly in shallow water, which promotes the LSW detachment. Moon et al. (2010) showed that the stratification is destroyed at the slope region during spring tides; the bottom boundary layer can reach the surface here and well mix the water column, which separates the main body of the Changjiang diluted water (CDW) and the LSW. But Xuan et al. (2012) found that the tidal currents alone are not the main controlling factor due to the detachment events not always occurring on spring tides, and they also confirmed that tidal mixing at the detachment region could not lead to a completely mixed water column.
Large river discharge could promote the LSW offshore extending by intensifying the subsurface current (Chen et al., 2008). River discharge can affect the core salinity of the LSW and the detachment time, but not the pattern of the LSW (Zhang et al., 2014). Given a model with a horizontal resolution of less than 1 km, Chen et al. (2008) regarded the LSW detachment as a result of baroclinic instability, which could be strengthened by the southerly wind and formed a chain of anticyclonic eddies to carry the CDW offshore. But Xuan et al. (2012) found that baroclinic instability frequently occurs in the Changjiang River estuary (CRE) in summer while the detachment has been rarely observed. Wei et al. (2017) pointed out that the offshore LSW is induced by the double-core upwelling structure combined with the prevailing southerly wind and the anticyclonic eddy off the CRE. The double-core upwelling structure refers to the two upwelling zones off the CRE: the southern one correlated with the northward intrusion of the Taiwan Warm Current and the northern one at the boundary of the bottom cold-water mass in the northern East China Sea (ECS).
Despite some disputes still remaining on the detachment of LSW, winds and tides have been generally accepted as the main physical mechanisms. However, the waves’ effects on the detachment of LSW and its subsequent evolution have been less documented in previous studies, which may have important impacts on the detachment. Wave effects on the river plume have been studied in several estuaries. Gerbi et al. (2013) found that the breaking surface waves can cause the river plume to be thicker and narrower and to propagate offshore more slowly; in this situation the plume has much smaller vertical gradients of salinity and velocity, leading to the decreased importance of shear dispersion. Rong et al. (2014) investigated the wave–current interactions on the Mississippi-Atchafalaya River plume in the Texas-Louisiana Shelf and they found that wave-enhanced bottom stress can restrict the offshore transport in the Chenier Shelf; meanwhile, the wave mixing and three-dimensional wave forces can weaken the stratification in the Louisiana Bight. Delpey et al. (2014) found that wave-induced alongshore currents can hinder the fluvial outflow in a small bay in northwestern of France. Schloen et al. (2017) showed that wave-induced salt transport changes the horizontal salinity distribution in the coastal zone of the southern North Sea and wind waves can destroy the weak stratification and thus modify the estuarine circulation. Akan et al. (2017) studied the impacts of wave–current interactions on the Columbia River plume dynamics, and they found that the plume is shifted in the down-wave direction due to the Stokes velocity induced alongshore advection. Gong et al. (2018) found the enhancement of bottom stress is the most important process influencing the Pearl River plume. However, there are few studies focused on the wave effects on the Changjiang River plume, still less on the offshore detachment of LSW.
In this study, a two-way coupled wave–current model is applied to investigate the wave effects on the detachment of LSW from the Changjiang River plume in summer. Contributions of different wave–current interactions to the LSW detachment are quantified. The paper is organized as follows: the Section “Study Site and Observations” gives a brief description of the study area and the LSW detachment observed in July 2006. The model configuration and validation, as well as the numerical experiments, are given in Section “Model Configuration and Experiments.” The wave effects on river plumes and LSW detachment are discussed in Section “Discussion.” In “Conclusion” section, the conclusion of this study is presented.
The Changjiang River, more than 6,300 km in length, is the longest river in Asia and is the third-longest in the world. The CRE, a 90-km-wide river mouth, is divided by the Chongming Island into the South Branch and North Branch (Figure 1A). Due to the silted state of the North Branch, the South Branch becomes the main channel of the CDW. The CRE is characterized by its huge river discharge, large number of sediments, and considerable tidal range; thus, the CDW mixed with ambient saline water has a great influence on salinity distribution and flow field in the ECS. It has become one of the dominant hydrodynamic features in the ECS (e.g., Beardsley et al., 1985; Su and Wang, 1989; Wu et al., 2021).
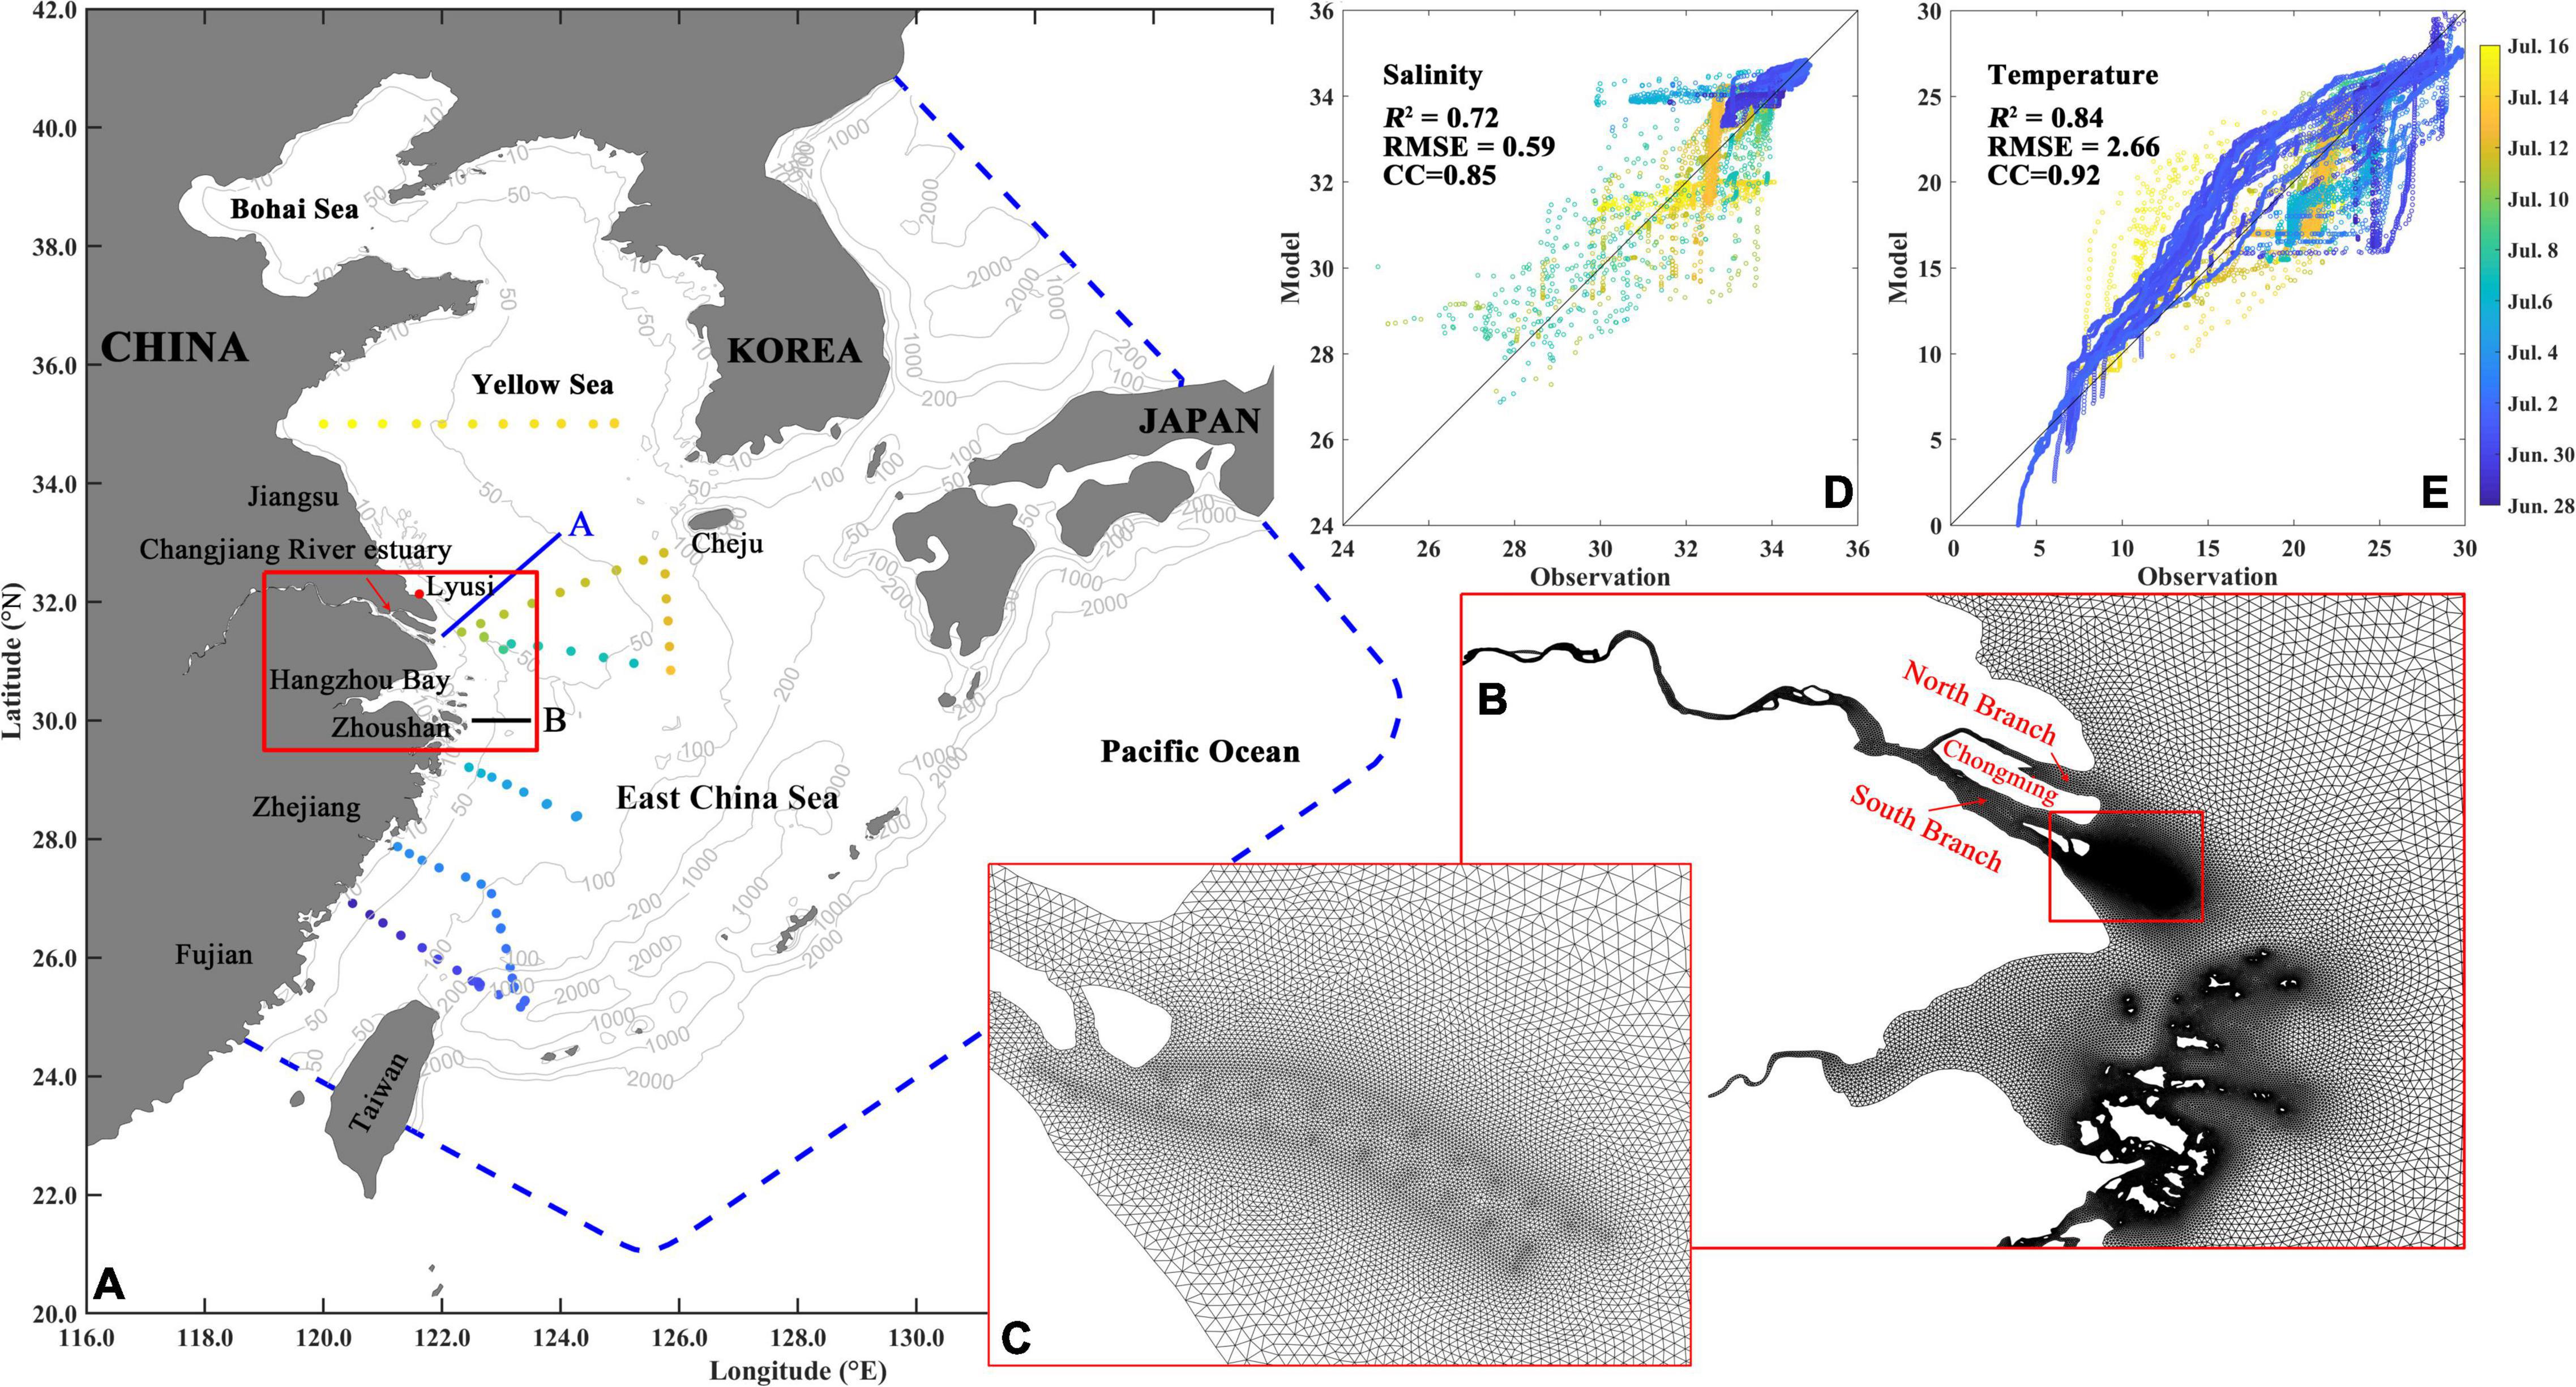
Figure 1. (A) The model coverage with the observation stations during the first cruise from June 28 to July 16, 2006, two cross-sections A/B in blue/black solid lines, and zoom-in mesh-grids in (B) the Changjiang River estuary [red box in panel (A)] and (C) the Deep Navigation Channel [red box in panel (B)]. The comparison between the observed and modeled (D) salinity and (E) temperature during the first cruise. Color in panels (A,D,E) indicate the date of measurements.
The circulation in the ECS is basically composed of the Kuroshio main stream in the Okinawa Trough, Kuroshio branch currents on the outer shelf, and coastal currents on the inner and middle shelves (Lie and Cho, 2016). The Taiwan Warm Current (TWC) flows off the southeastern Chinese coast with high temperatures and high salinity (Guan and Fang, 2006). It bifurcates into two branches near 28°N: the inshore branch flows northward along the 50 m isobath off the Zhejiang-Fujian coast and turns to the northeast of the CRE, and the offshore branch flows eastward and finally joins the western flank of the Kuroshio (Wang et al., 2019). Due to prevailing southeasterly wind in summer, the northward intrusion of the TWC inshore branch can reach the CRE and Jiangsu coast (Beardsley et al., 1985; Chen et al., 1994; Zhu et al., 2004). In summer, the coastal currents on the inner shelf tend to flow northward along the Jiangsu coast as a portion of the CDW plume. Although the magnitude of this branch is much smaller than the northeast branch, it could be an important nutrient source for the frequent algal bloom there (Pu, 1981; Pu and Xu, 1983; Zhao et al., 1995; Wu et al., 2014; Zhu and Wu, 2018). The coastal currents flow northeastward along the Zhejiang-Fujian coast, which intensifies the northeastward TWC, and flow northward or northeastward on the shallow Changjiang Bank (Lie and Cho, 2016). The structure and pathway of the CDW show significant seasonal variations. It is weak and generally trapped alongshore with a southward extension along the Zhejiang-Fujian coast in the winter, but is stronger and more unstable with a northeastward extension toward the Cheju Island in summer (e.g., Beardsley et al., 1985; Lie et al., 2003; Wu et al., 2014).
In the ECS, wind waves also exhibit significant seasonal variability: southward waves driven by the prevailing northerly winds in winter and northward waves by southerly winds in summer. In situ observations showed that the significant wave height (Hs) is larger in winter and autumn than that in summer and spring, with the maximum Hs occurring in winter; and the climatological monthly mean Hs from 1988 to 1999 was 1.20 m in July and 1.70 m in January (He et al., 2018). Furthermore, the ECS is well known for its significant tidal motions dominated by semi-diurnal tides, which propagate from the open ocean (Song et al., 2013). Strong tidal currents not only strengthen vertical mixing but also induce strong residual currents, which are comparable to wind-driven currents on the inner shelf (e.g., Guo and Yanagi, 1998; Kang et al., 1998).
In this study, two cruise measurements were collected. The first was conducted onboard the R/V Dongfanghong2 from June 28 to July 16, 2006 in the southern Yellow Sea and ECS (Figure 1A). The second was conducted onboard the R/V Beidou in the southern Yellow Sea (Figure 2A) from July 18 to 24, 2006. Both cruises measured the physical parameters (temperature, salinity, density) using the Seabird Series Conductivity-Temperature-Depth (CTD). The parameters were measured in full water depth with a 1-m vertical resolution during the first cruise, but we only obtained the surface, 10 m, 30 m, and bottom-layer data during the second cruise. During the second cruise, the measured sea surface salinity (SSS) shows two low-salinity patches (Figure 2C): one off the CRE with a salinity low to 24 psu and the other far away from the CRE with a salinity of 27 psu. The former was due to the northeastward extension of the Changjiang River plume and the latter was regarded as the detachment of LSW from the plume (Wei et al., 2017). Xuan et al. (2012) also found the same detachment event during this period using the satellite-derived sea surface temperature and a real-case numerical simulation. Based on the cruise time and the SSS pattern, we speculate that the isolated LSW had existed for several days, and the detachment should occur before July 17, which is consistent with Xuan et al. (2012). Based on the second cruise measurement, Wei et al. (2017) found a double-core upwelling system and an anticyclonic eddy off the CRE, which favors the LSW detachment from the CDW plume under the prevailing southerly winds.
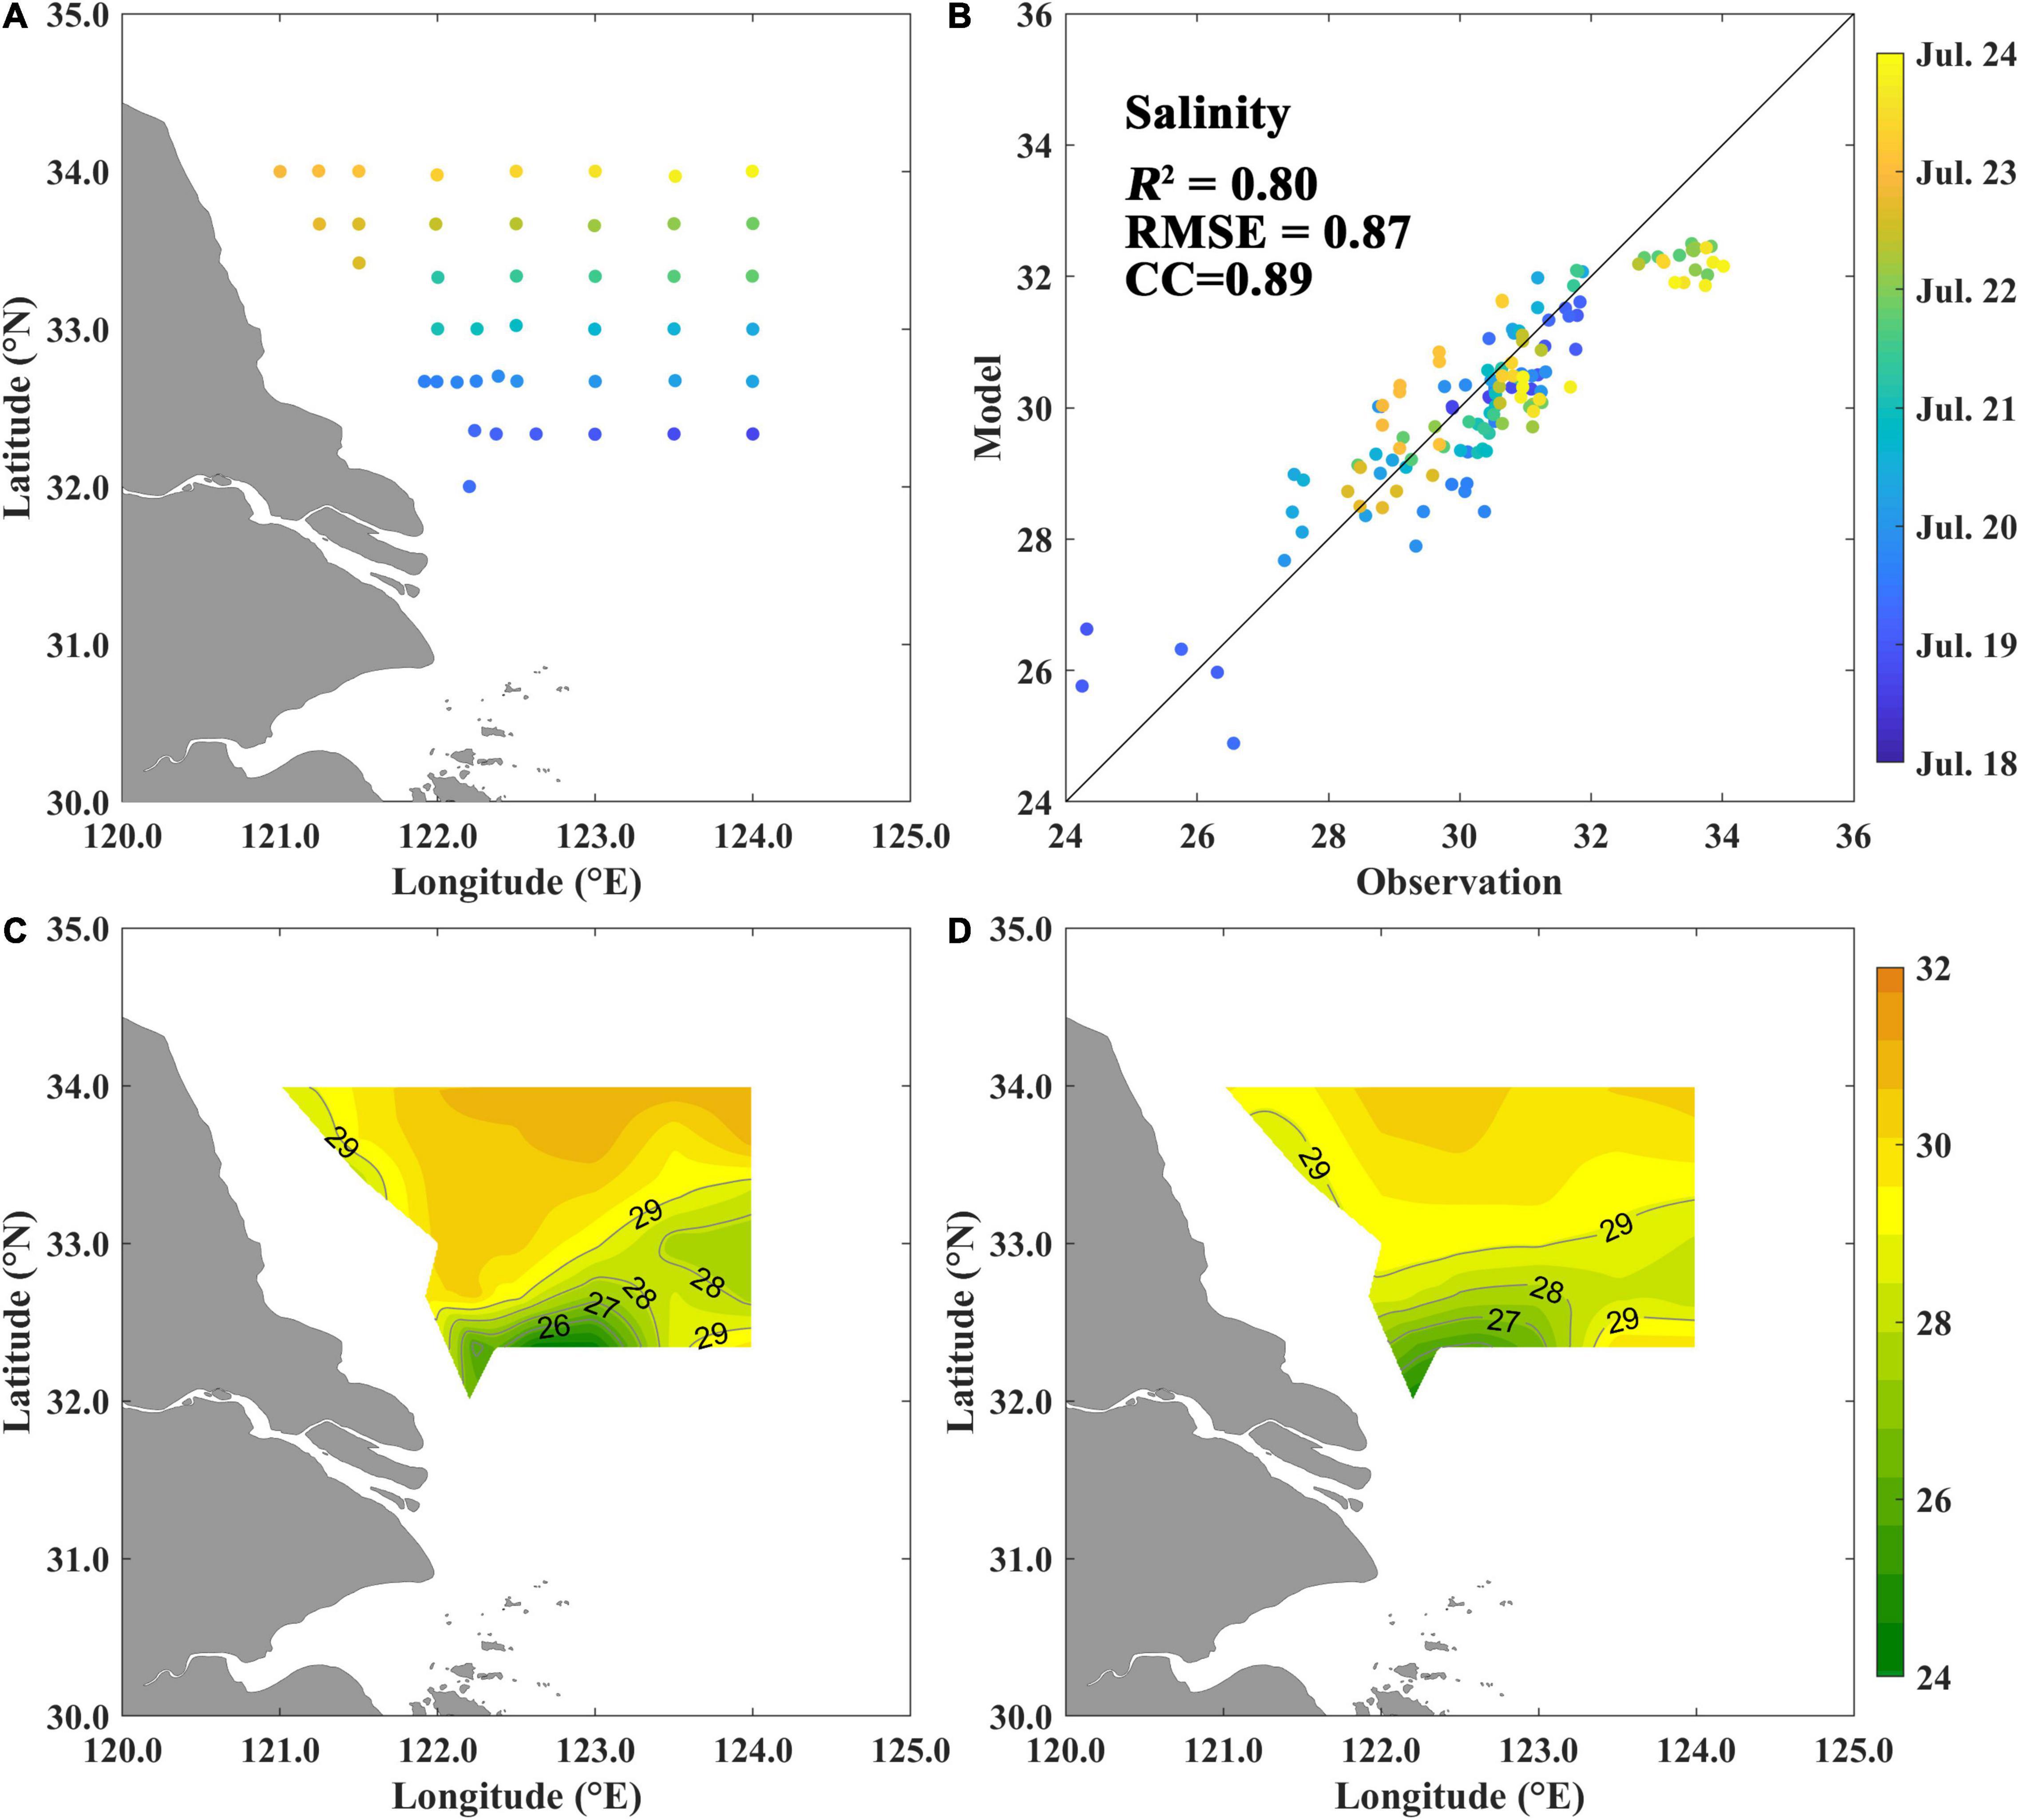
Figure 2. (A) Distribution of the observation stations and (B) the comparison between the (C) observed and (D) modeled salinity during the second cruise from July 18 to 24, 2006. Color in panels (A,B) indicate the date of measurement.
The circulation model used in this study is the unstructured-grid, Finite-Volume, primitive-equation Community Ocean Model (FVCOM, Chen et al., 2003). The ECS FVCOM was established by Ding et al. (2018) to study the Yellow Sea Warm Current, the synoptic current fluctuations in the Bohai Strait (Ding et al., 2019), and also the marine heatwaves in the ECS and southern Yellow Sea (Gao et al., 2020). In this study, we carry the ECS FVCOM forward with a refined mesh grid in the CRE. The model domain (21°N∼41°N, 117°E∼138°E) covers the Bohai Sea, the Yellow Sea, the ECS, and part of the northwest Pacific; the open boundary is exactly the same as those in previous studies (Figure 1A). However, to better represent the CDW, the Changjiang River is extended upstream from the Xuliujing hydrologic station to the Datong hydrologic station (approximately 620 km away from the estuary). There is a total of 81,411 nodes and 154,079 triangular elements in the model domain and 31 layers in the vertical. The horizontal resolution is 20 km at the open boundary and about 400 m in the CRE (Figure 1B), where the Deep Navigation Channel and the dykes can be well distinguished (Figure 1C). The bathymetry data reads from the China coastal sea marine charts and the DBDB5 database (US Naval Oceanographic Office, and the US Naval Ocean Research, and Development Activity, 1983). The daily Changjiang River discharge is derived from the Datong hydrologic station1 and employed in the model with a salinity of 0 psu. The tidal forcing at the open boundary is derived from the TPXO9-atlas-v2 global barotropic model2, consisting of three diurnal tides (K1, O1, Q1), three semi-diurnal tides (M2, S2, N2), and three shallow-water tides (M4, MS4, MN4). Daily temperature, salinity, non-tidal current, and sea surface height obtained from the Hybrid Coordinate Ocean Model (HYCOM3) are employed as corresponding boundary conditions. Surface forcing includes longwave and shortwave radiation, sea surface pressure, air temperature, evaporation and precipitation, and relative humidity, which are obtained from the National Centers for Environmental Prediction (NCEP) Climate Forecast System Reanalysis (CFSR) hourly products (Saha et al., 2010). The heat flux is thus calculated using the bulk formula (Fairall et al., 1996) based on the above datasets. The hourly surface wind is obtained from the fifth generation of atmospheric reanalysis (ERA5) in the European Center for Medium-Range Weather Forecasts (ECMWF4). The external forcings employed in this model are also the same as those used in previous studies (Ding et al., 2018, 2019). The model is cold started with the initial temperature and salinity obtained from the HYCOM and run from January 1, 2004 to January 1, 2007.
The Mellor-Donelan-Oey (MDO) wave model proposed by Mellor et al. (2008) is employed in this study and coupled with the abovementioned circulation model. The wave energy in the model is a function of the wave propagation direction θ, the horizontal coordinates (x, y), and time t; and the wave frequency σ is an independent variable but depends on θ. The MDO wave model adopts the spectrum of Donelan et al. (1985), which is based on the Joint North Sea Wave Project (JONSWAP) spectrum. The directionally dependent wave energy equation in a sigma coordinate system is given as (Mellor et al., 2008):
where Eθ is the spectrally integrated wave energy:
and Eθ ,S is the directional spectrum of the kinematic energy divided by the water density. xα and xβ is the horizontal coordinate (α = x, y and β = x, y); cg is the group speed, and the overbar represents a spectral average; uA is the Doppler velocity given by Mellor (2003, 2008); cθ is the refraction velocity; Uα is the ocean current plus the Stokes drift; is the sigma variable; D = h + η is the total water depth, with h the local water depth and η the water elevation. The three terms on the right-hand side (RHS) of Equation (1) are the wind growth source term Sθ in, the dissipation terms due to wave processes at the surface Sθ Sdis and bottom Sθ Bdis, respectively; details about the three source terms can be found in Mellor et al. (2008). Sα β is the depth-dependent wave radiation stress term given by Mellor (2015).
Considering the wave effects, the momentum and continuity equations in the circulation model can be rewritten as:
where ω is the vertical velocity in sigma coordinate; ρ is the water density; ρ0 is the reference density; Ff is the Coriolis force vector (–fv, fu) and f is the Coriolis parameter; g is the gravitational acceleration; Fh is the horizontal diffusion terms, calculated by the Smagorinsky eddy parameterization (Smagorinsky, 1963); τTα is the turbulent-viscous part of the wind stress or skin friction, defined as Km(∂Uα /∂), where Km is calculated using the Mellor-Yamada level 2.5 turbulence closure model (Mellor and Yamada, 1982); τPα is the wind stress induced by form drag (Mellor et al., 2008):
where Pw0 is the wind pressure at the surface; is the wave setup with a the amplitude and φ the phase.
Considering the input of τT and τP, the turbulence kinetic energy (TKE) equation can be rewritten as (Mellor, 2013):
where q2 is twice the turbulence energy and l is the turbulence length scale; Kq is the mixing coefficient and Kh is the vertical thermal diffusion coefficient; is the so-called wall proximity function defined in Mellor and Yamada (1982); Fq and Fl are the horizontal diffusion terms for the q2 and q2l; E1, E3, and B1 are empirical constants (Mellor and Yamada, 1982; Galperin et al., 1988).
The turbulence kinetic flux q2 induced by surface wave dissipation was given by Mellor and Blumberg (2004):
where αCB is a parameter related to wave age and uτ is the waterside friction velocity; κ = 0.41 is the von Karman number, and zw = 0.85Hs is the wave-related roughness. The turbulence kinetic flux q2 induced by the bottom wave dissipation was given by Mellor (2013):
Thus, the wave–current interacts through depth-dependent wave radiation stress, Stokes drift, vertical transfer of wave-generated pressure to the mean momentum equation caused by form drag, wave dissipation as a source term in the TKE equation, mean current advection, and refraction of wave energy (Mellor, 2003, 2015; Mellor et al., 2008). The combined wave–current induced bottom shear stress is also calculated using Soulsby’s (1995) method. More details on the model coupling can be found in Gao et al. (2018) and Song et al. (2021). The significant wave height, peak wave direction, and peak wave period are obtained from the WaveWatch III (WW3) global wave model5, which are employed to generate a full-wave spectrum along the open boundary as:
where Hs is the significant wave height, σθ is the wave direction-dependent frequency, Tp is the peak wave period, and fspr is the so-called spreading function:
with β = 2.2 and θw is the direction of incoming/outgoing waves. Details can be found in Mellor et al. (2008). It has been shown that it is better to recreate full-wave spectra from WW3 bulk parameters for accurate wave models (Kumar et al., 2017).
The two-way coupling between the MDO wave model and the FVCOM circulation model has been proved computationally efficient, based on which several works have been published, e.g., the oil spills transport (Wang and Shen, 2010), the wave simulation in the Gulf of Mexico during Hurricane Katrina (Wang and Shen, 2012), the suspended sediment transport in Jiaozhou Bay, China (Gao et al., 2018), and the bay-shelf exchange in the northern South China Sea (Song et al., 2021).
In this study, seven numerical experiments are conducted to quantify the effect of the overall and individual wave–current interaction process (Table 1). Exp1 is the control run (CR), which considers all the wave–current interaction processes. Exp2 (NoWave) is the same as Exp1 but the exclusion of waves. This and the following experiments are hot started from 2006 based on the first-2 year run in Exp1. In Exp3 (NoCWCBS), the impact of the combined wave–current bottom stress (CWCBS) is replaced by current-induced bottom stress. In Exp4 (NoFormDrag), the form drag τPα is not considered, i.e., the last term on the RHS of Equation (4) and the third term on the RHS of Equations (6) and (7). In Exp5 (NoWDinTKE), the source term equal to wave dissipation is removed from the TKE equation, and thus Equations (8) and (9) is changed to:
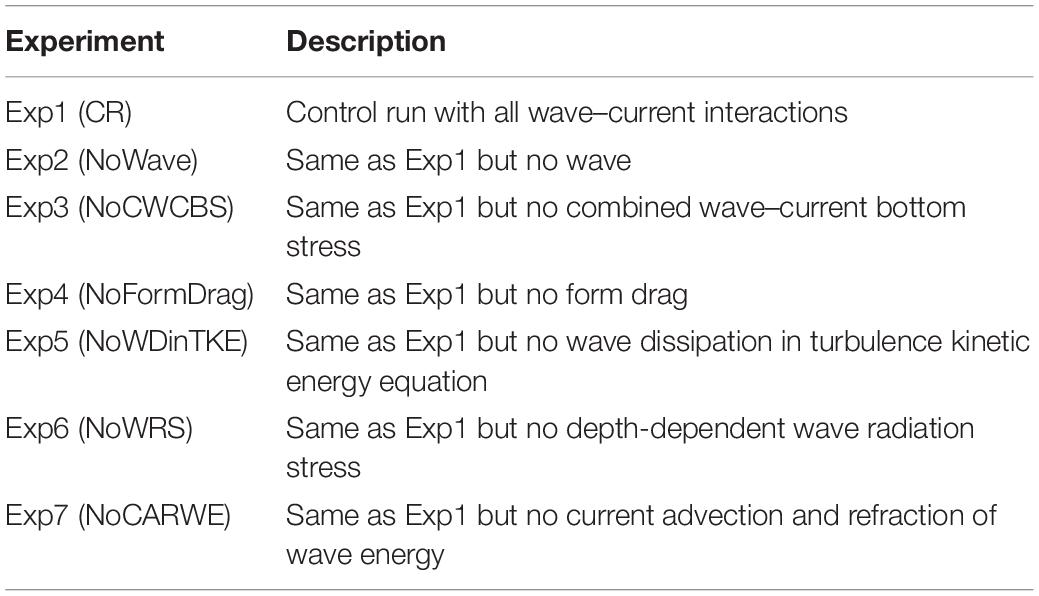
Table 1. Summary of experiment settings.
In Exp6 (NoWRS), the depth-dependent wave radiation stress (WRS) is removed from the momentum equation, i.e., the third term on the left-hand side (LHS) of Equation (4). In Exp7 (NoCARWE), the current advection and refraction of wave energy (CARWE) is excluded in Equation (1), i.e., the second and third terms on the LHS of Equation (1).
The configurations of each experiment are summarized in Table 1. In this study, the Stokes drift is not discussed as it is not separated from the ocean current in the MDO wave model (Mellor et al., 2008).
The ECS FVCOM has been well-validated in Ding et al. (2018, 2019) and Gao et al. (2020). In this study, the model result of the control run is further validated for the wave performance and the accuracy to reproduce the detachment of LSW. Three methods are employed to quantify the differences between the observations and simulations: the determination coefficient R2, the root mean square error (RMSE), and the correlation coefficient (CC) with a 95% confidence interval.
The modeled salinity and temperature according to the observation time, station, and water depth are given in Figures 1, 2. The comparison between the model results and measured profiles during the first cruise gives R2 = 0.72, RMSE = 0.59 psu, and CC = 0.85 for salinity (Figure 1D) and R2 = 0.84 RMSE = 2.66°C, and CC = 0.92 for temperature (Figure 1E). The comparison between the model results and in situ measurement during the second cruise gives R2 = 0.80, RMSE = 0.87 psu, and CC = 0.89 for salinity (Figure 2B). The simulated SSS (Figure 2D) has a similar pattern to the observations (Figure 2C), with the river plume expanding north-eastward and an isolated LSW at the eastern part of the cruise route. But the isolated LSW is slightly southward with a little higher salinity and a smaller salinity gradient, compared to the observations. The salinity distribution in the four cross-sections along 32.3°N, 32.7°N, 33.0°N, and 33.3°N (Figure 3) is also compared to the observations (see Figure 5 in Wei et al., 2017). It indicates the model can also reproduce the vertical structure of the CDW and reproduces the detachment of LSW.
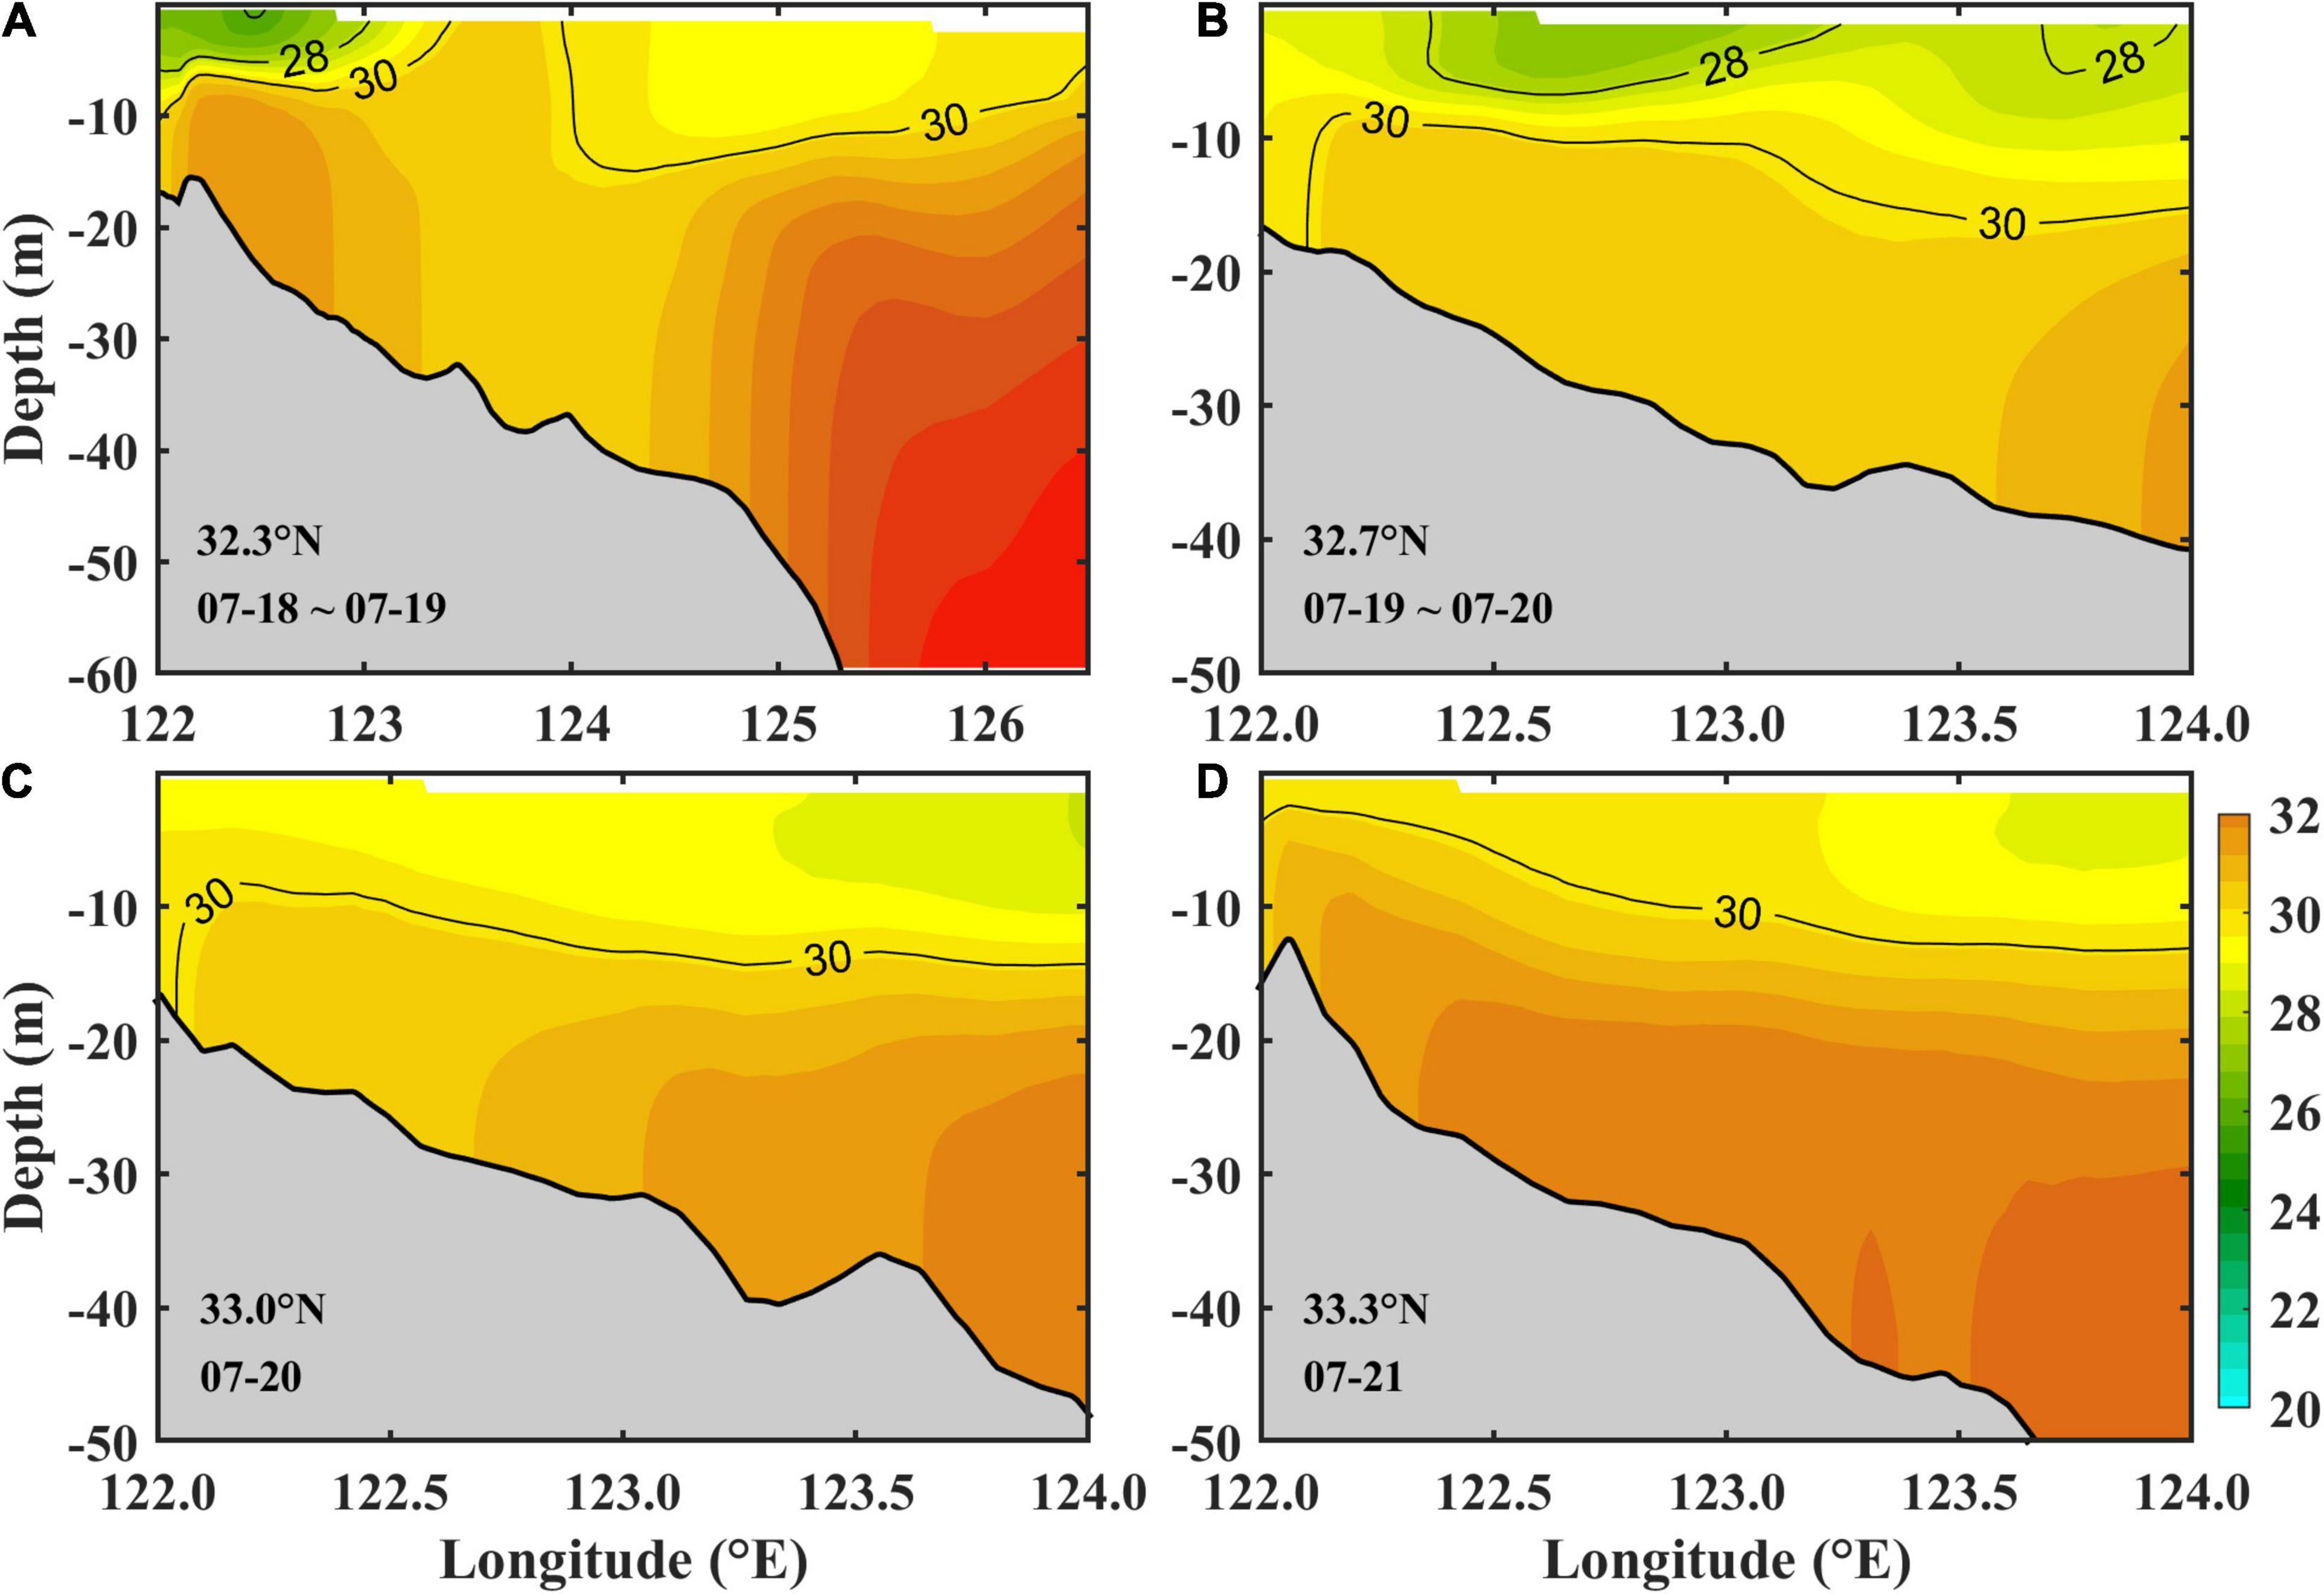
Figure 3. The model result of the cross-sectional distribution of salinity corresponding to the observations in Wei et al. (2017) with (A) along 32.3°N during July 18 and 19, (B) along 32.7°N during July 19 and 20, (C) along 33.0°N on July 20, and (D) along 33.3°N on July 21.

Figure 4. (A) The distribution of observation points along the satellite orbit over the East China Sea during July 2006. (B,C) The comparison between the observed and simulated significant wave height (Hs).
To evaluate the performance of wave simulation, the simulated Hs is compared with the remote-sensed Hs by Jason-16. The satellite-derived wave data is fixed on the specific orbit in the study area (Figure 4A). A total of 857 samples of the along-tracked Hs is collected during July 2006 and compared with the model results (Figures 4B,C). The comparison indicates a reasonable model performance on wave simulation, with R2 = 0.80, RMSE = 0.33 m, and CC = 0.91. Overall, we think the model results are reasonable and agree well with the observations; thus, the model can be used to study the wave effects on the detachment of LSW.
The daily averaged SSS in the control run shows two LSW detachment events started on July 13 and July 28, respectively, when the 24 psu (25 psu for the second event) isohaline closed and just disconnected with the river plume front. Xuan et al. (2012) also confirmed these two events happened in July, but they used the date of “complete detachment,” which is usually some days later after the detachment begins. As the first event was more obvious and this isolated LSW existed longer than the second one, in this study, we will focus on the first detachment event from July 11 to July 19. The wind turned southerly on July 10 and kept increasing until July 15, and then decreased gradually until July 19 (Figure 5A). Correspondingly, the wave propagated from south to north, and the Hs increased from July 13 to 15 but then decreased.
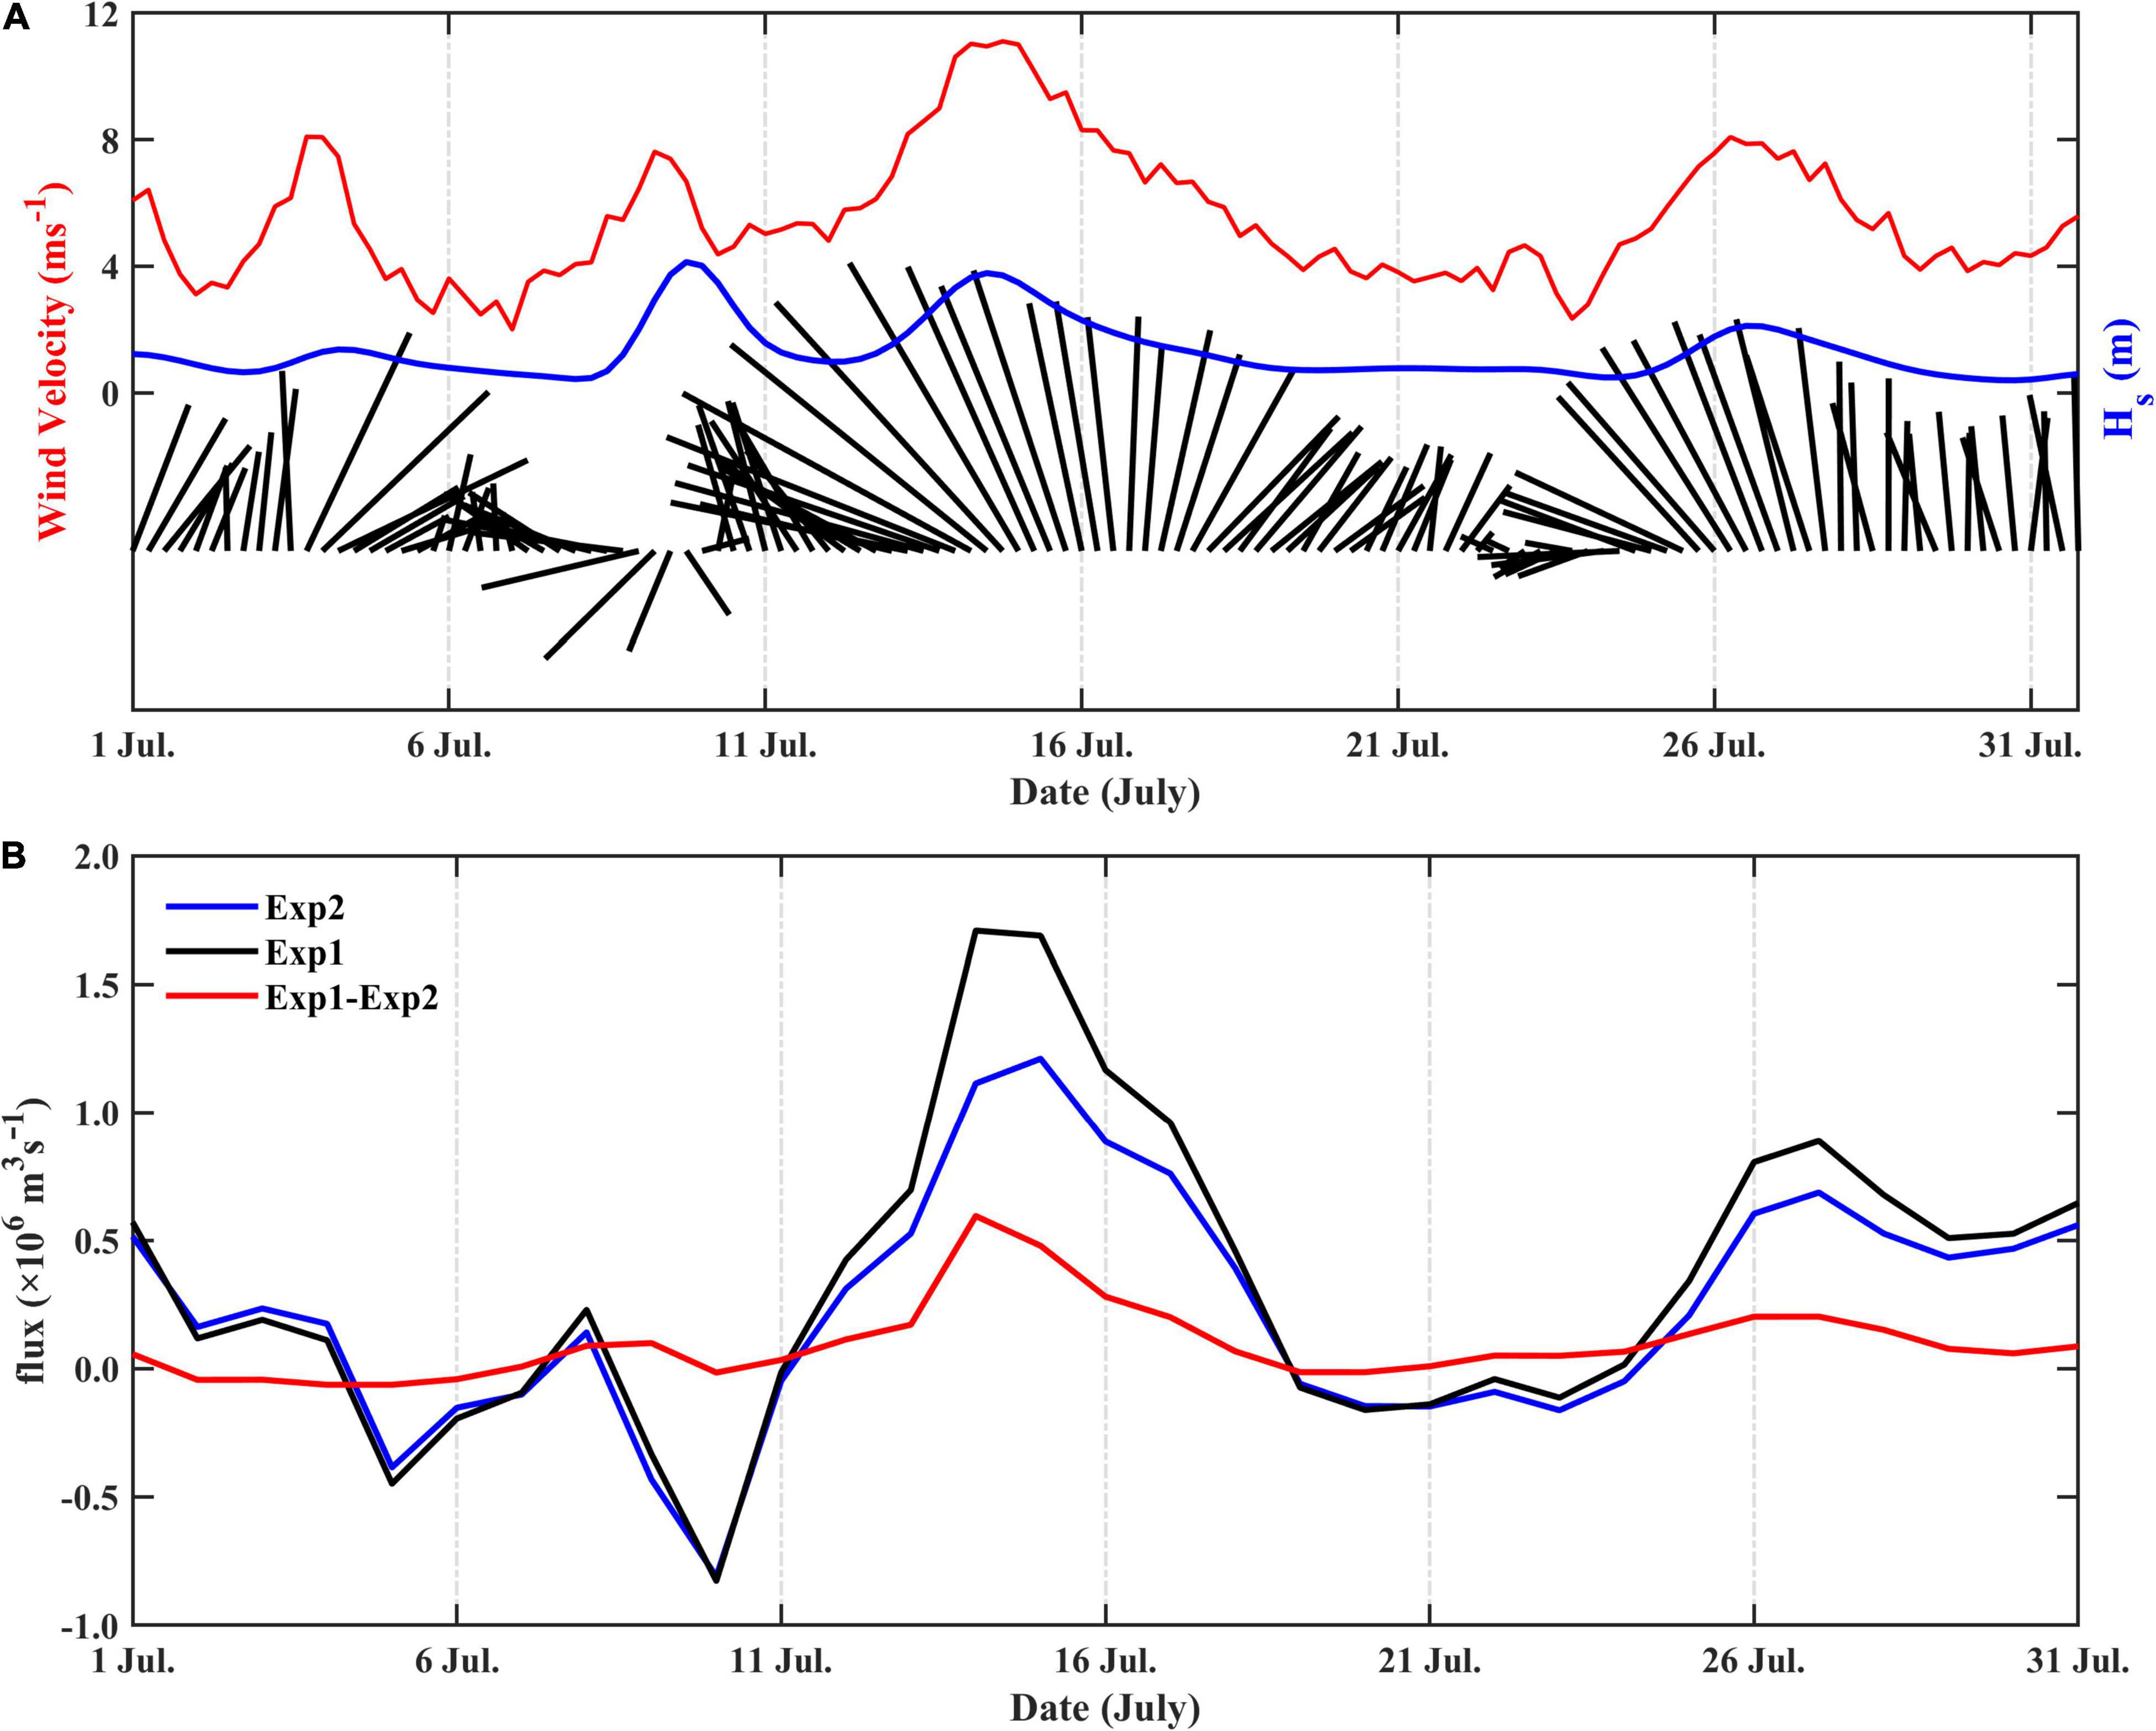
Figure 5. (A) The wind vector (black), magnitude (red), and simulated significant wave height (blue) in the Changjiang River estuary (spatially-averaged within the range of Figure 4A) during July 2006. (B) The daily-averaged current flux across the cross-section B (30°N, 122.5∼123.5°E) during July 2006. Positive indicates northward flux.
Before the occurrence of the LSW detachment, the CDW main body extended northward under the southerly winds on July 11 (Figure 6A). Due to the Coriolis force, the CDW front turned to the southeast (Figure 6G). The TWC flowed northeastward and its inshore branch was rather weak (Figure 6M). As the wind speed began to increase on July 12 (Figure 6B), the CDW main body turned northeast and extended further northeastward (Figure 6H). The CDW with salinity less than 26 psu evidently covered a much larger area than that on July 11 and its front reached 123°E. The southeastward extension of the CDW front was also weakened. The TWC inshore branch was slightly increased (Figure 6N). In the next day, wind speed continued to grow and the wind direction was almost unchanged (Figure 6C). A strong wind speed of 12 ms–1 prevailed south of the river estuary, and the wind speed was over 8 ms–1 in the north of the river estuary. The CDW front with 26 psu moved further northeastward and became narrow, which was more easily extruded and penetrated by saline water. As proposed by Xuan et al. (2012), an isolated low-salinity lens was detached from the CDW front under a critical wind speed of 8 ms–1, with a core salinity of 23.96 psu; and the CDW less than 20 psu retreated sharply (Figure 6I). The TWC was enhanced due to the enlarged southeasterly wind, and the northward flow pushed the CDW to the north (Figure 6O).
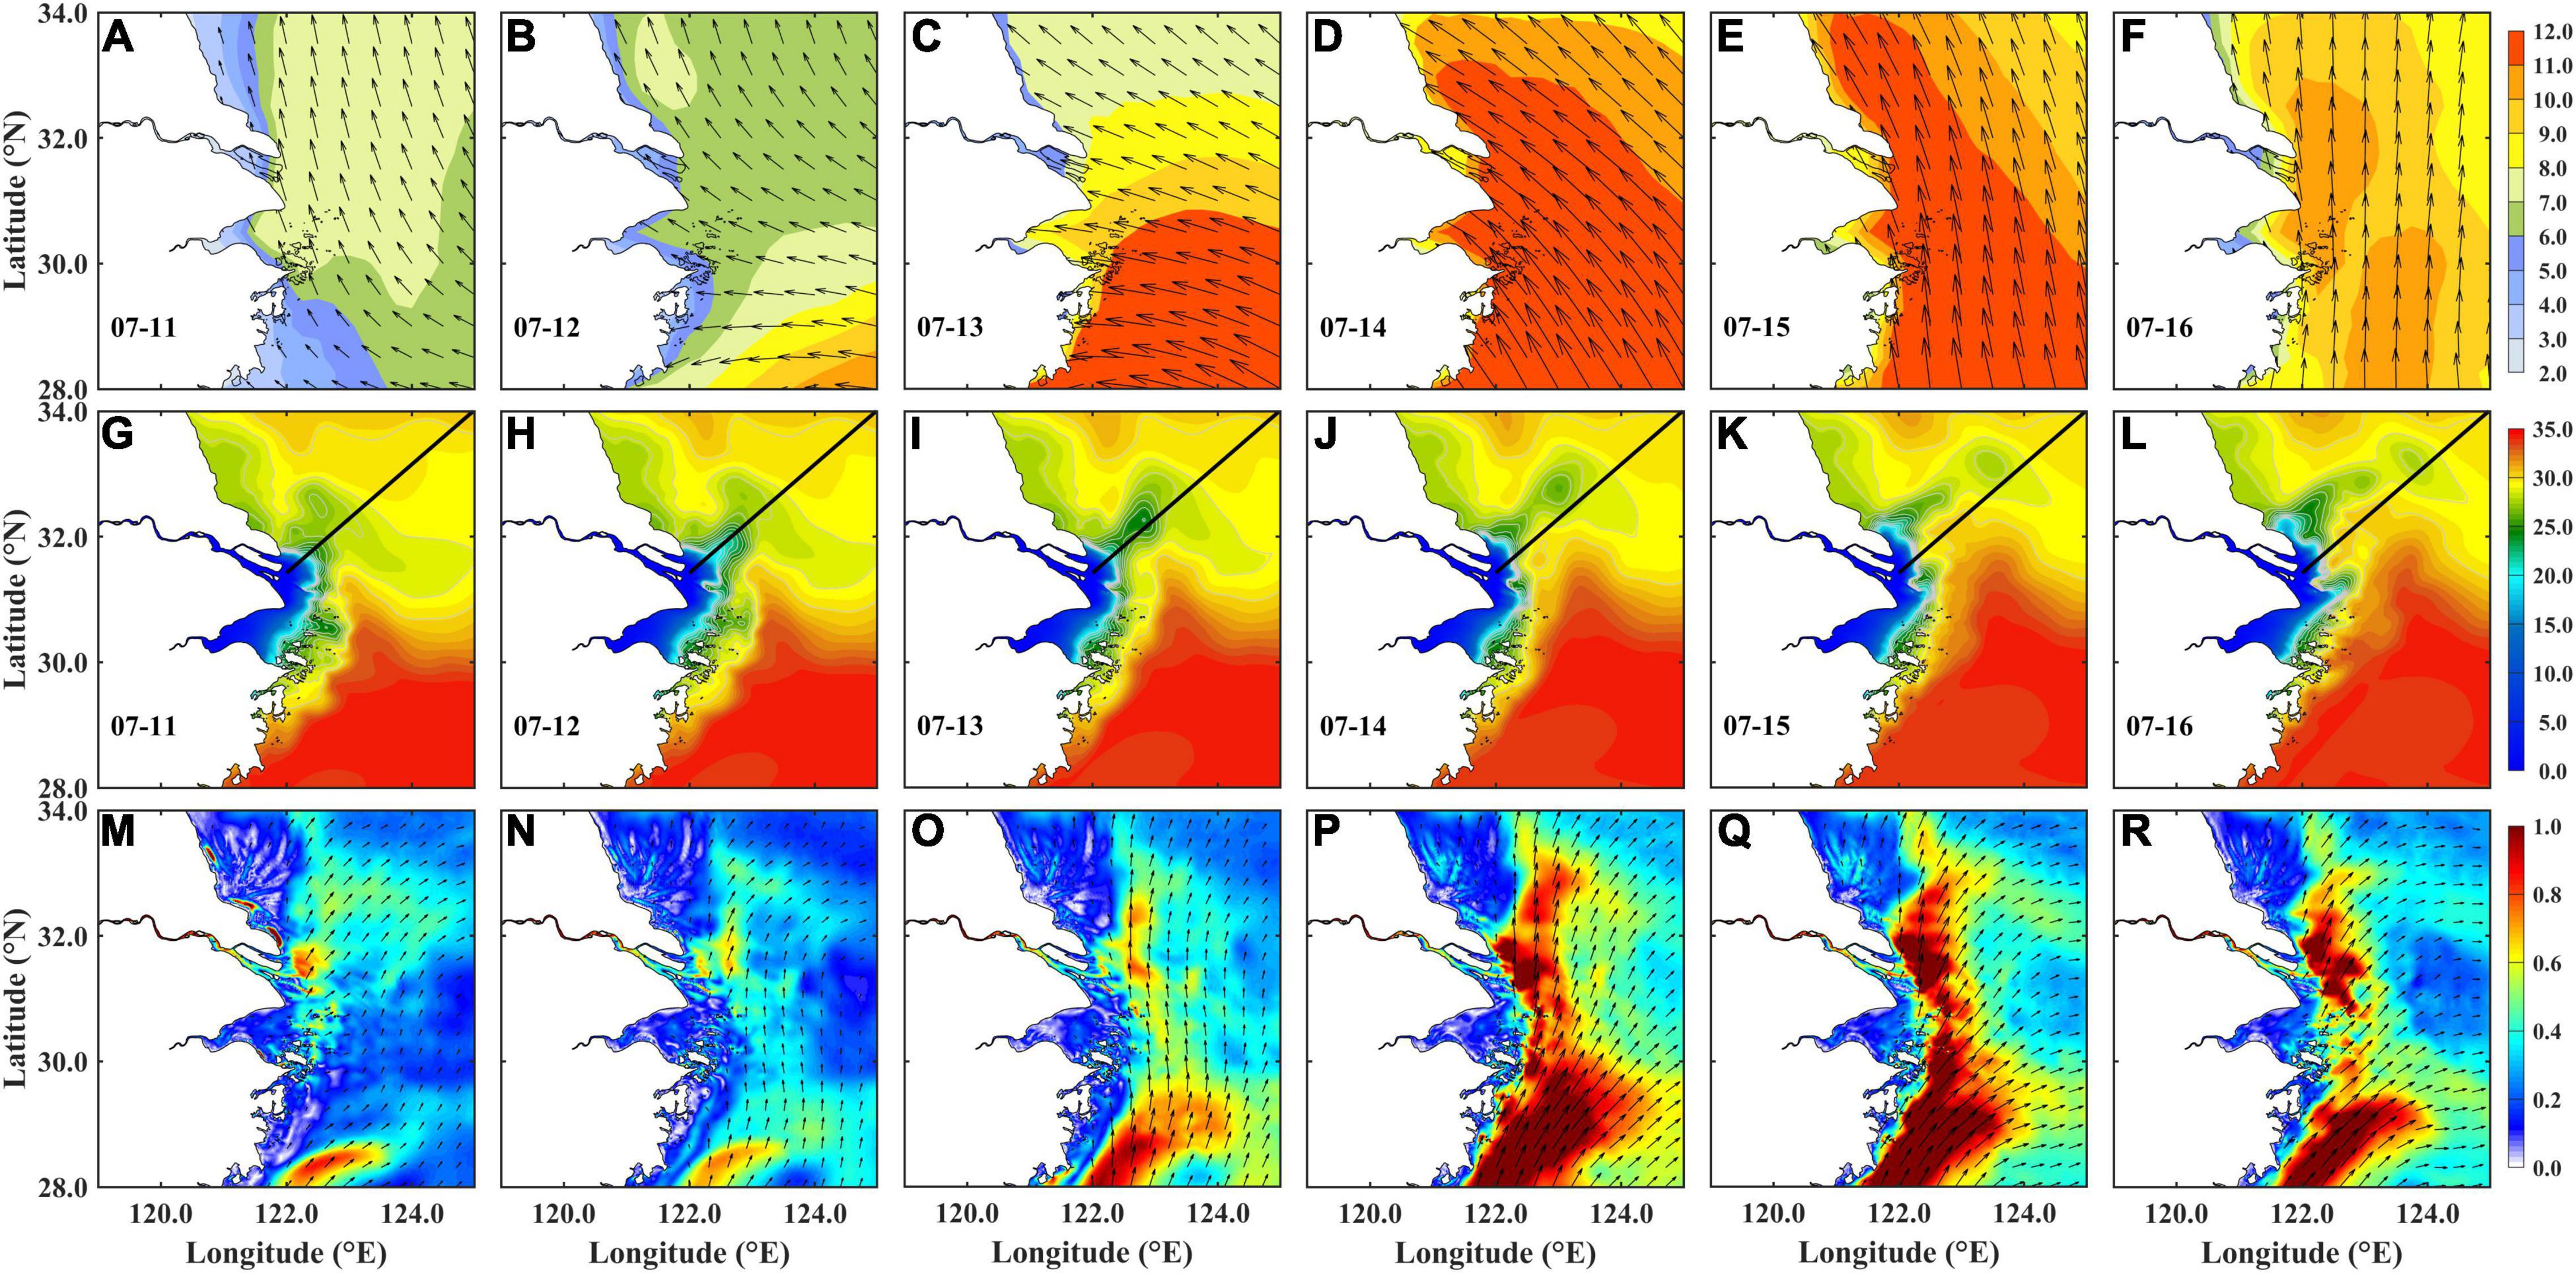
Figure 6. The daily-averaged (A–F) wind (unit: ms–1), (G–L) surface salinity, and (M–R) surface current (unit: ms–1) from July 11 to 16, 2006 in Exp1. The black line indicates the cross-section A; color indicates magnitude and arrow for direction.
The wind speed reached a maximum on July 14 and a wind speed over 12 ms–1 prevailed in most study areas on July 14 (Figure 6D). The isolated LSW kept developing and moving northeastward under the strong southeasterly wind (Figure 6J). The TWC was obviously enhanced and widened, but the direction of its inshore branch gradually turned northeastward (Figure 6P). The core salinity of the LSW was a bit higher (26.14 psu), and its size was also significantly increased. Then on July 15, the wind speed was still high (∼11 ms–1) but the direction turned from southeasterly to southerly (Figure 6E). The TWC was still strong, but the direction of its inshore branch mostly turned to northeastward (Figure 6Q). The CDW main body became narrower with a northward movement and the core salinity of the LSW was increased to 27.42 psu (Figure 6K). The wind speed quickly decreased to below 10 ms–1 and the wind kept southerly until July 16 (Figure 6F). It was still conducive to the LSW detachment. The TWC also began to decrease (Figure 6R). The CDW main body became narrower and further northward. The size of the LSW became smaller and its core salinity reached 27.75 psu (Figure 6L). In addition, another small isolated low-salinity lens was detached from the plume front. After July 16, the isolated LSW still existed for a long time. The salinity of the LSW kept increasing.
The LSW detachment can be seen more clearly through the cross-sectional view (Figures 7A–F). From July 11 to 13, the CDW extended offshore and became thinner. The LSW was detached from the main body on July 13 with a core salinity of 23.96 psu. The CDW main body retreated on July 14 with the plume front of about 28 psu and the isolated LSW moved further offshore with the core salinity rising to 26.14 psu. On July 15, the CDW main body moved back to the estuary, and the high salinity water over 30 psu pushed the CDW northward. The isolated LSW became thicker and moved away from the selected cross-section A.
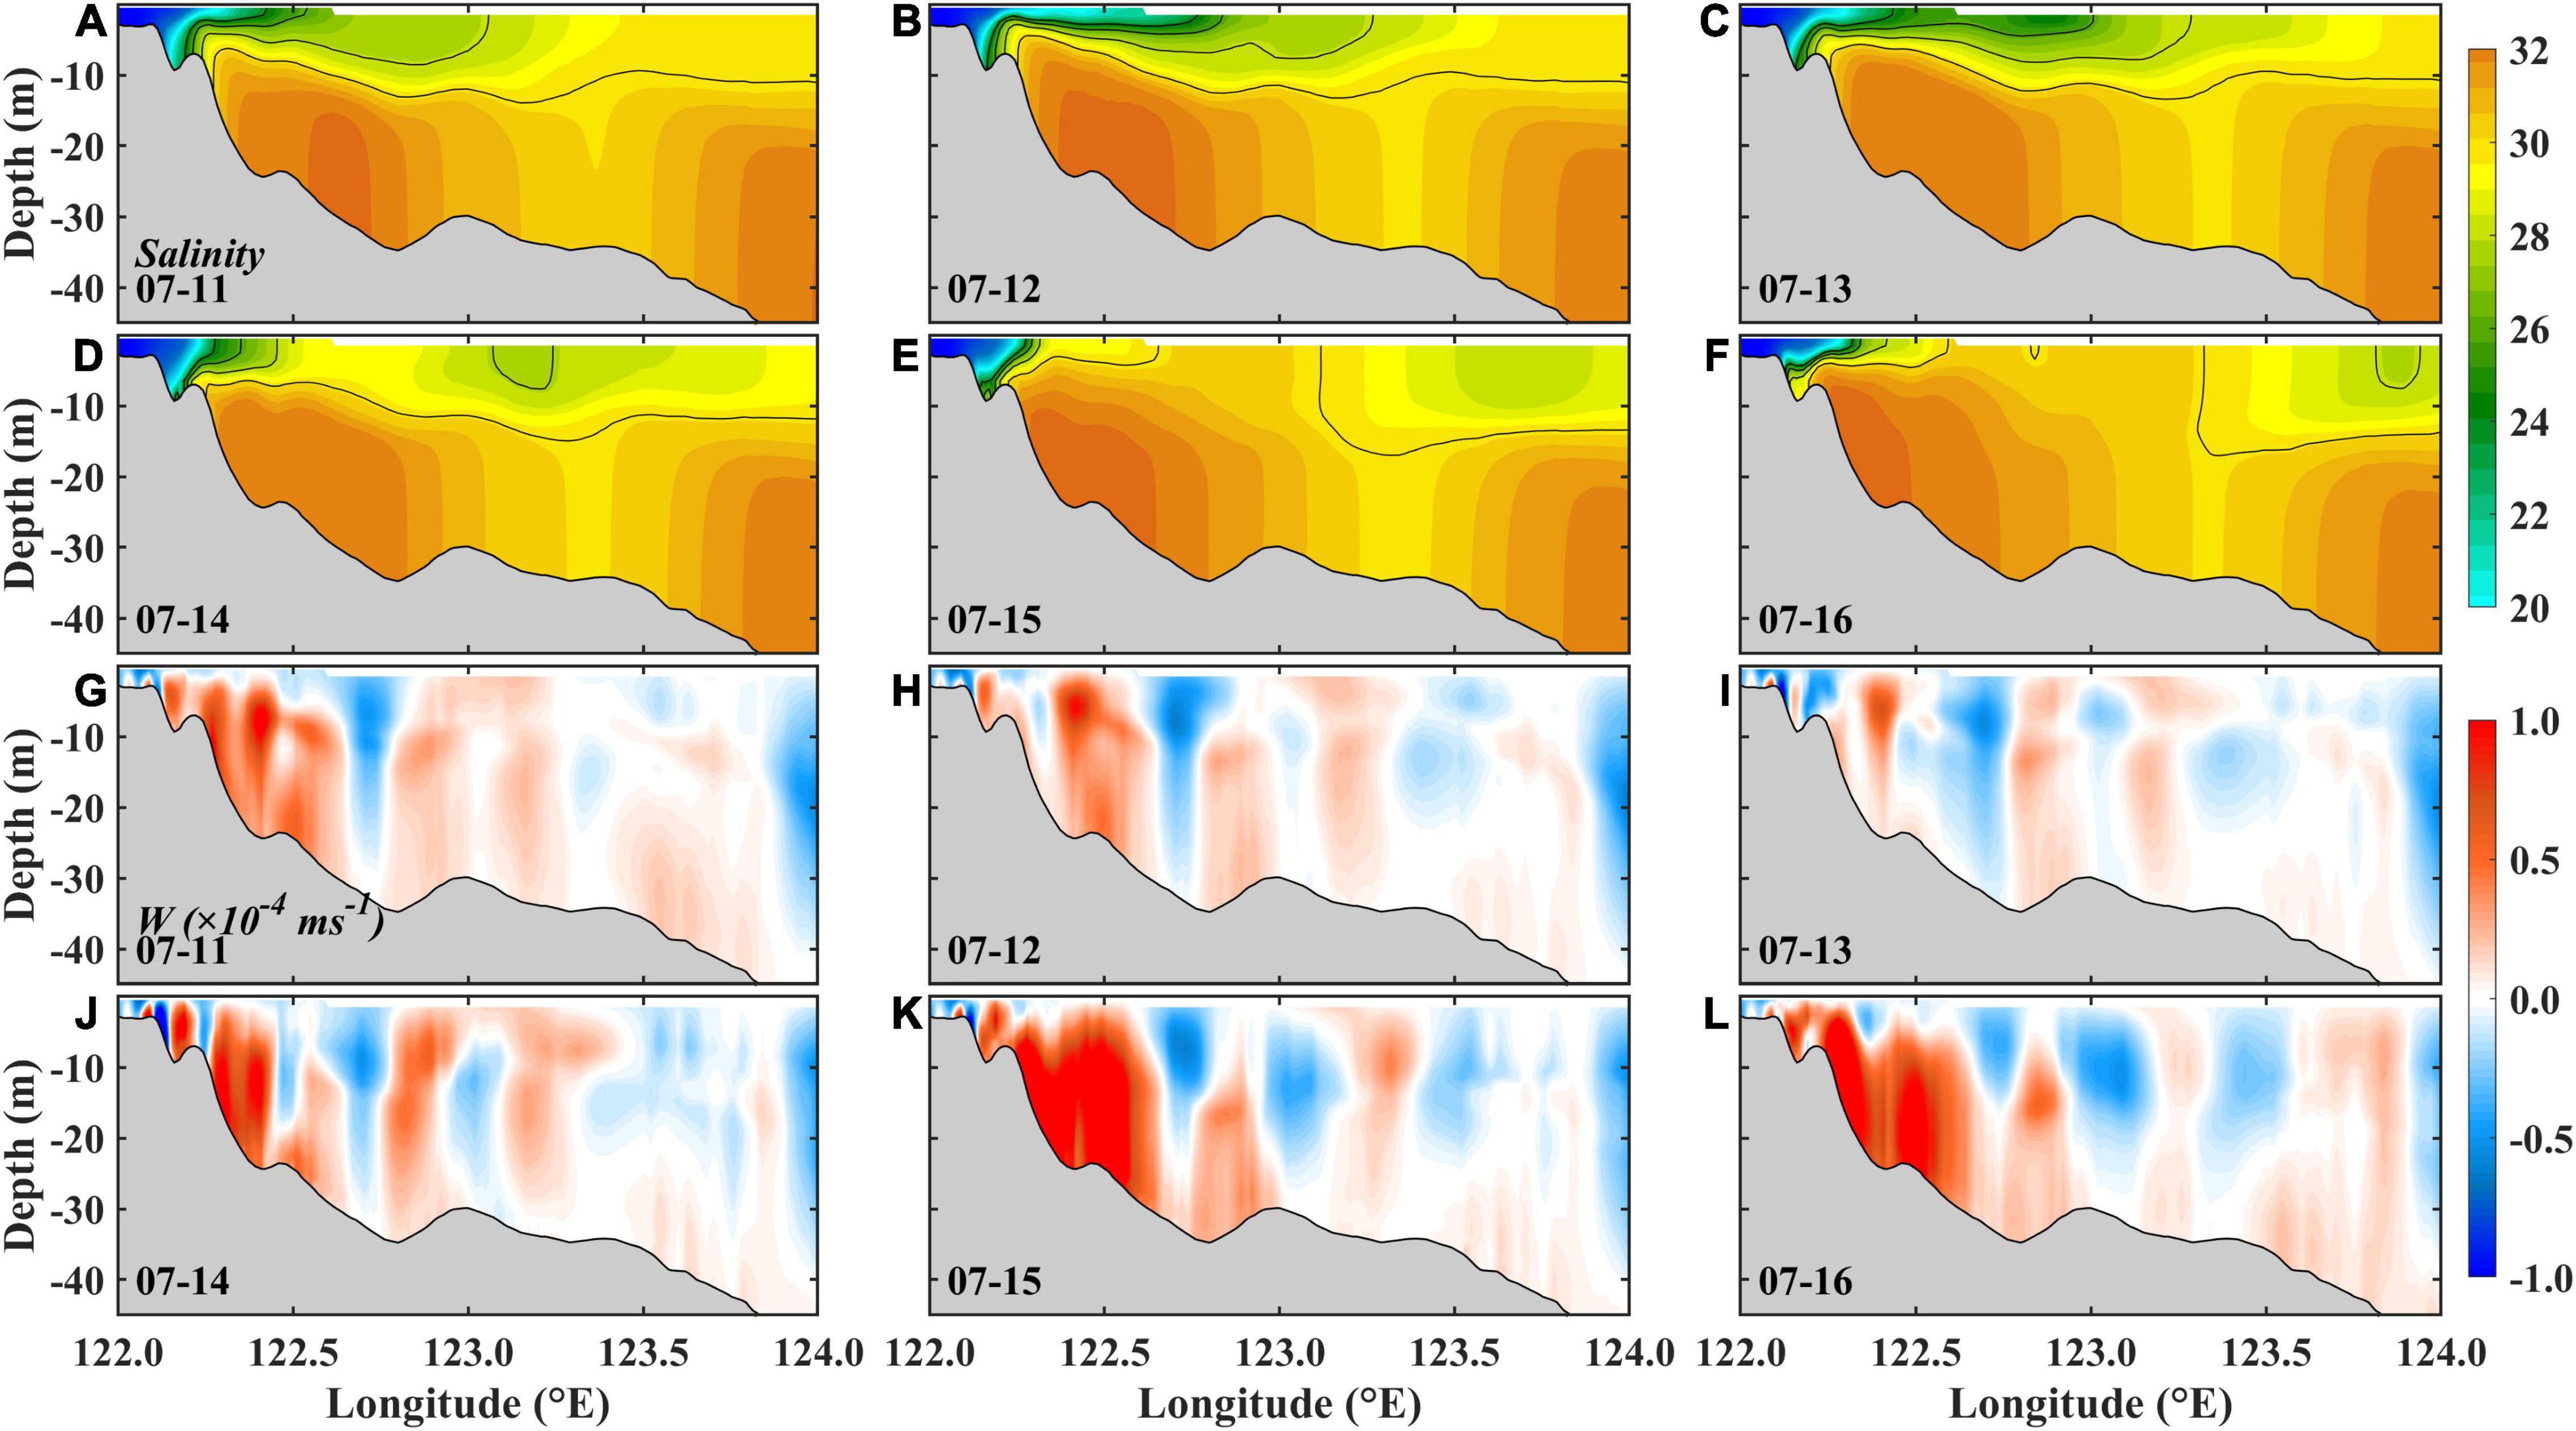
Figure 7. (A–F) The daily-averaged salinity (black lines indicate 24, 26, 28, and 30 psu) and (G–L) vertical velocity (unit: ×10–4ms–1) along the cross-section A from July 11 to 16, 2006.
The snapshot of vertical velocity along the cross-section A is given in Figures 7G–L. An upwelling was formed on July 11 with a strong core of 122.3°E. The system became weak from July 11 to July 13 but then was enhanced from July 14. A double-core upwelling system was formed on July 15, with one core on 122.3°E and another on 122.5°E. The two upwelling cores were clearer on July 16.
In Exp1, the control run, the averaged SSS between July 11 and 19 shows a northeastward extension of the CDW due to the prevailing southerly wind during the same period (Figure 8A). The waves enhanced the surface mixing, which increases the surface salinity but slightly decreases the salinity below the nearshore surface; thus, the CDW main body is less extended (Figures 8A,B). The difference of SSS between Exp1 and Exp2 (Exp1–Exp2) illustrates that the SSS is notably increased off the CRE and the Hangzhou Bay, but decreased on the southern Jiangsu coast due to the northward migration of the CDW (Figure 8C).
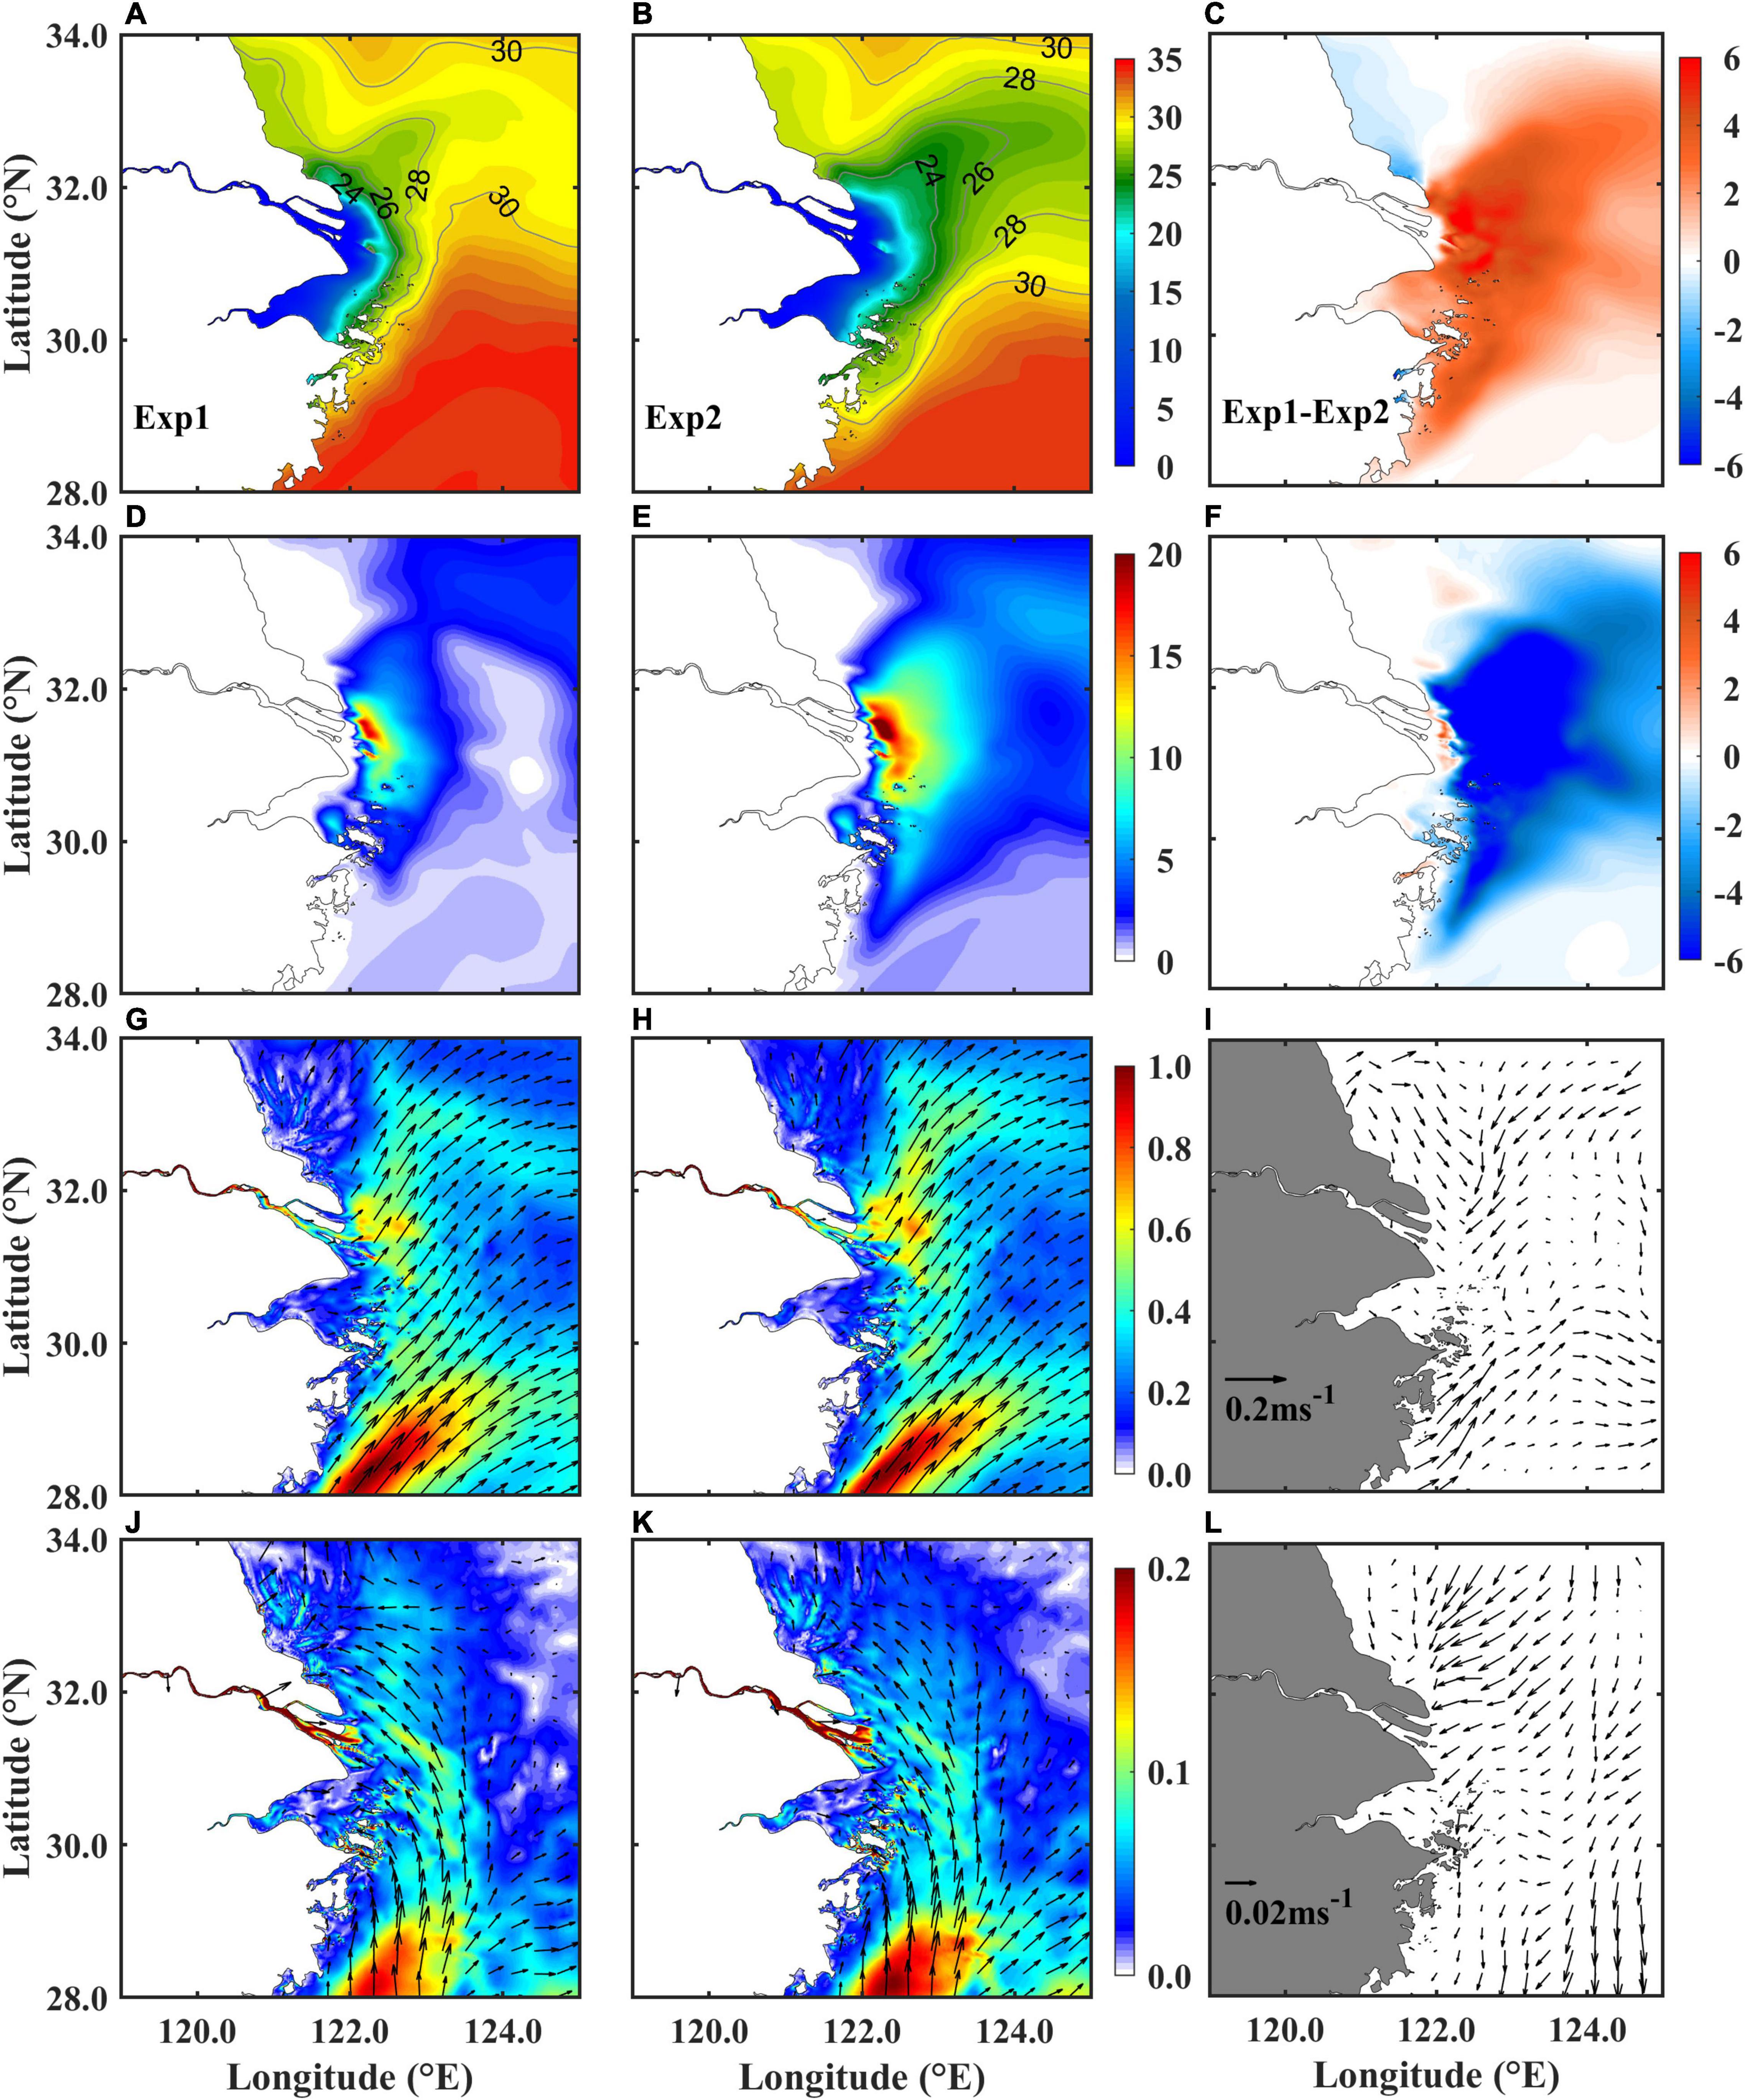
Figure 8. The (A–C) surface salinity, (D–F) difference between the bottom and surface salinity (bottom minus surface), (G–I) surface current, and (J–L) bottom current (unit: ms–1) averaged from July 11 to 19 in (A,D,G,J) Exp1 (CR), (B,E,H,K) Exp2 (NoWave), and (C,F,I,L) Exp1–Exp2. Color indicates magnitude and arrows for direction.
Here, ΔS is used to represent the vertical mixing in the water column, which is calculated as the bottom salinity minus surface salinity. Compared to Exp2, the retreated CDW reduces the surface salinity in the river estuary and thus increases ΔS there in Exp1 (Figures 8D,E). The ΔS is reduced due to the wave-induced surface mixing in the most inner-shelf region, but increased off the southern Jiangsu coast. The difference of ΔS between Exp1 and Exp2 (Figure 8F) is similar to that of SSS (Figure 8C), which indicates that the surface salinity varies more than the bottom salinity due to the inclusion of waves in the model. The bottom salinity is increased nearshore from the CRE to the Zhejiang coast but slightly decreased offshore, and the difference between Exp1 and Exp2 is less than 3 psu (not shown).
The wave-driven surface flow (Exp1-Exp2) enhances the northward TWC inshore branch (Figures 8G–I), which brings the high salinity water northward, and thus the CDW is migrated northward (Figure 8C). Influenced by the adjustment of the CDW plume structure, the northeastward surface flow is reduced along the CDW pathway, which is consistent with the restrained CDW plume (Figures 8A,B). Meanwhile, the bottom current is generally enhanced in Exp2 due to the removal of combined wave–current bottom stress (Figures 8J,K). However, the bottom wave-driven flow is less than 0.05 ms–1 in magnitude, which is much smaller than the surface wave-driven flow (Figure 8L).
The flux of wave-driven flow through the cross-section B is calculated to show its daily variation. On most days, the wave-driven flow traveled along the coast from south to north, which reached a maximum of 5.9 × 10⁵ m3s–1 on July 14 (Figure 5B), when the southerly wind also reached a maximum (Figure 5A). During the second LSW detachment event, the flux of wave-driven flow also increased as the wind speed increasing. The flux through cross-section B well correlates to the wind with a CC = 0.83 (95% confidence interval). It indicates the wave-driven flow benefits for the detachment of LSW.
The vertically-averaged vertical velocity is calculated along the cross-section A between 122°E and 123°E, and its temporal variation from July 11 to 19 is plotted in Figure 9. It illustrates that the upwelling is enhanced and the double-core structure is formed during the detachment event, which is consistent with the observations by Wei et al. (2017). The temporal variation of the upwelling is similar in Exp1 (Figure 9A) and Exp2 (Figure 9B), which indicates the double-core structure is determined by winds rather than waves, i.e., the wind-enhanced TWC inshore branch. However, compared to Exp2, the upwelling can be further enhanced by 30% during the detachment events in Exp1 (Figure 9C) due to the enhanced onshore bottom wave-driven flow along this cross-section (Figure 8L).

Figure 9. The vertically-averaged vertical velocity (unit: ×10–4ms–1, upward positive) along the cross-section A during from July 11 to 19, 2006 in (A) Exp1 (CR), (B) Exp2 (NoWave), (C) Exp1–Exp2, (D) Exp1–Exp4 (NoFormDrag), (E) Exp1–Exp5 (NoWDinTKE), and (F) Exp1–Exp7 (NoCARWE).
Both the SSS in Exp1 and Exp2 (NoWave) show that the wave effects can greatly affect the detachment of LSW (compare Figures 6I,J, 10A,G). Exclusion of waves in the model, the detachment of LSW is 16 h delayed with a lower core salinity of the isolated LSW. As the isolated LSW lens still has a non-negligible impact on the surrounding seawater, attention is still paid to its evolution after the detachment. According to the simulated daily SSS distribution, the core salinity and position of the isolated LSW are employed to represent its evolution (Figure 11A). In Exp1 the core salinity of the LSW was 23.96 psu on July 13 and 28.81 psu on July 31; while in Exp2, it was 21.47 psu on July 14 and 26.55 psu on July 31. As the waves can affect the salinity distribution in the entire region, the growth rate of the core salinity is divided by the bottom-surface salinity difference. The average growth rate of the core salinity was 0.052 from July 13 to 31 in Exp1 and 0.039 from July 14 to 31 in Exp2. It indicates that the core salinity was increased more quickly in Exp1 than that in Exp2 due to the wave-enhanced vertical mixing. Due to the wave effects, the isolated LSW moves more northward in Exp1 than that in Exp2. Compared to their initial detachment position, the LSW lens moved northeastward from July 13 to July 31 in Exp1, but southeastward in Exp2 (Figure 11A). The trajectory of the isolated LSW is almost dominated by the wind direction; and when the wind turned to easterly on July 22, the LSW also traveled westward. The isolated LSW moved a total of 427 km (22.47 km⋅d–1) in distance (not displacement) from July 13 to July 31 in Exp1 and 373 km (20.72 km⋅d–1) from July 14 to July 31 in Exp2 along the trajectory. It indicates that the wave effects lengthen the LSW journey and accelerate its movement.
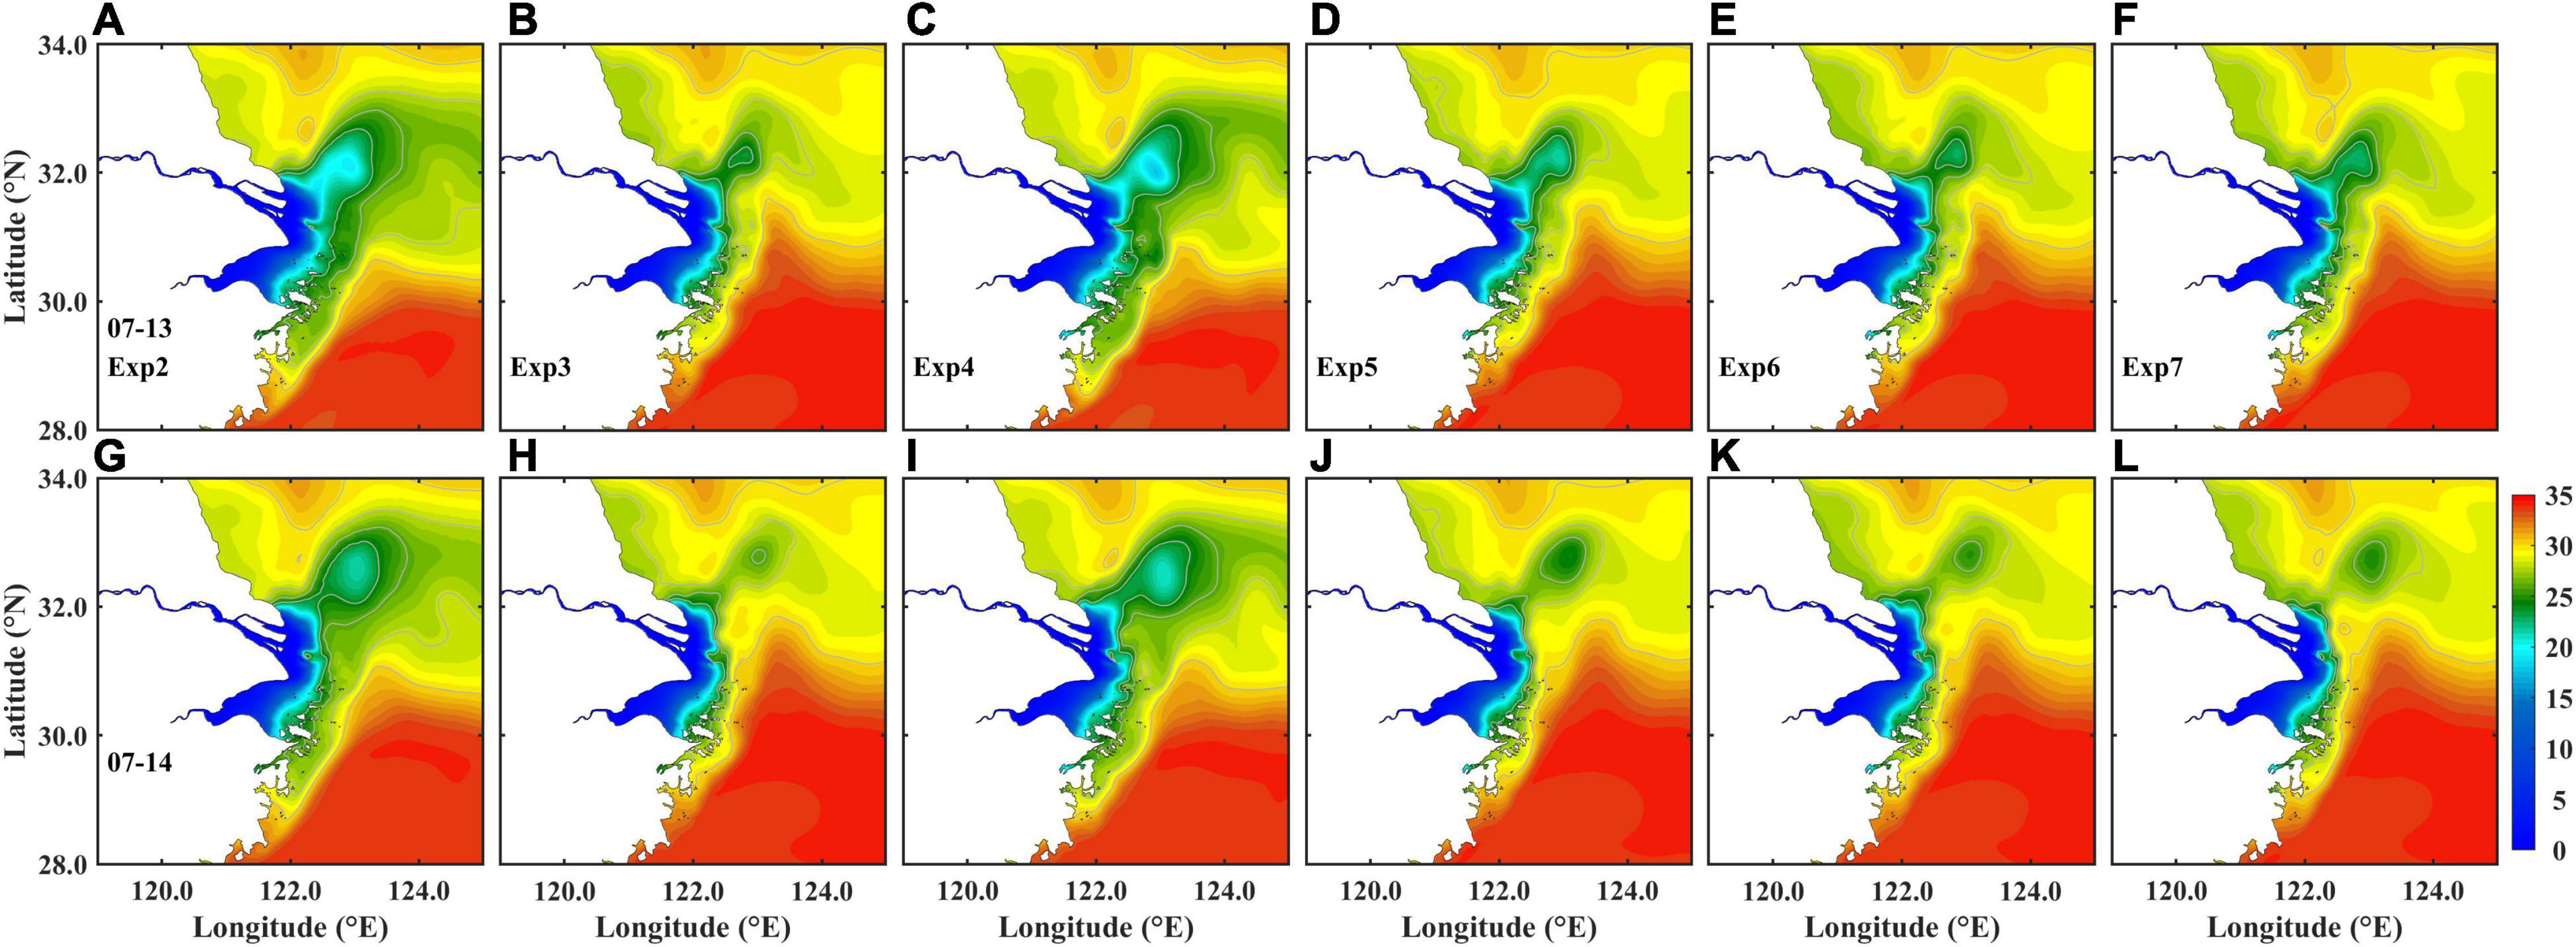
Figure 10. The daily-averaged surface salinity (gray lines indicate 24, 26, 28, and 30 psu) on July 13 (upper panel) and 14 (lower panel) in (A,G) Exp2 (NoWave), (B,H) Exp3 (NoCWCBS), (C,I) Exp4 (NoFormDrag), (D,J) Exp5 (NoWDinTKE), (E,K) Exp6 (NoWRS), and (F,L) Exp7 (NoCARWE), respectively.
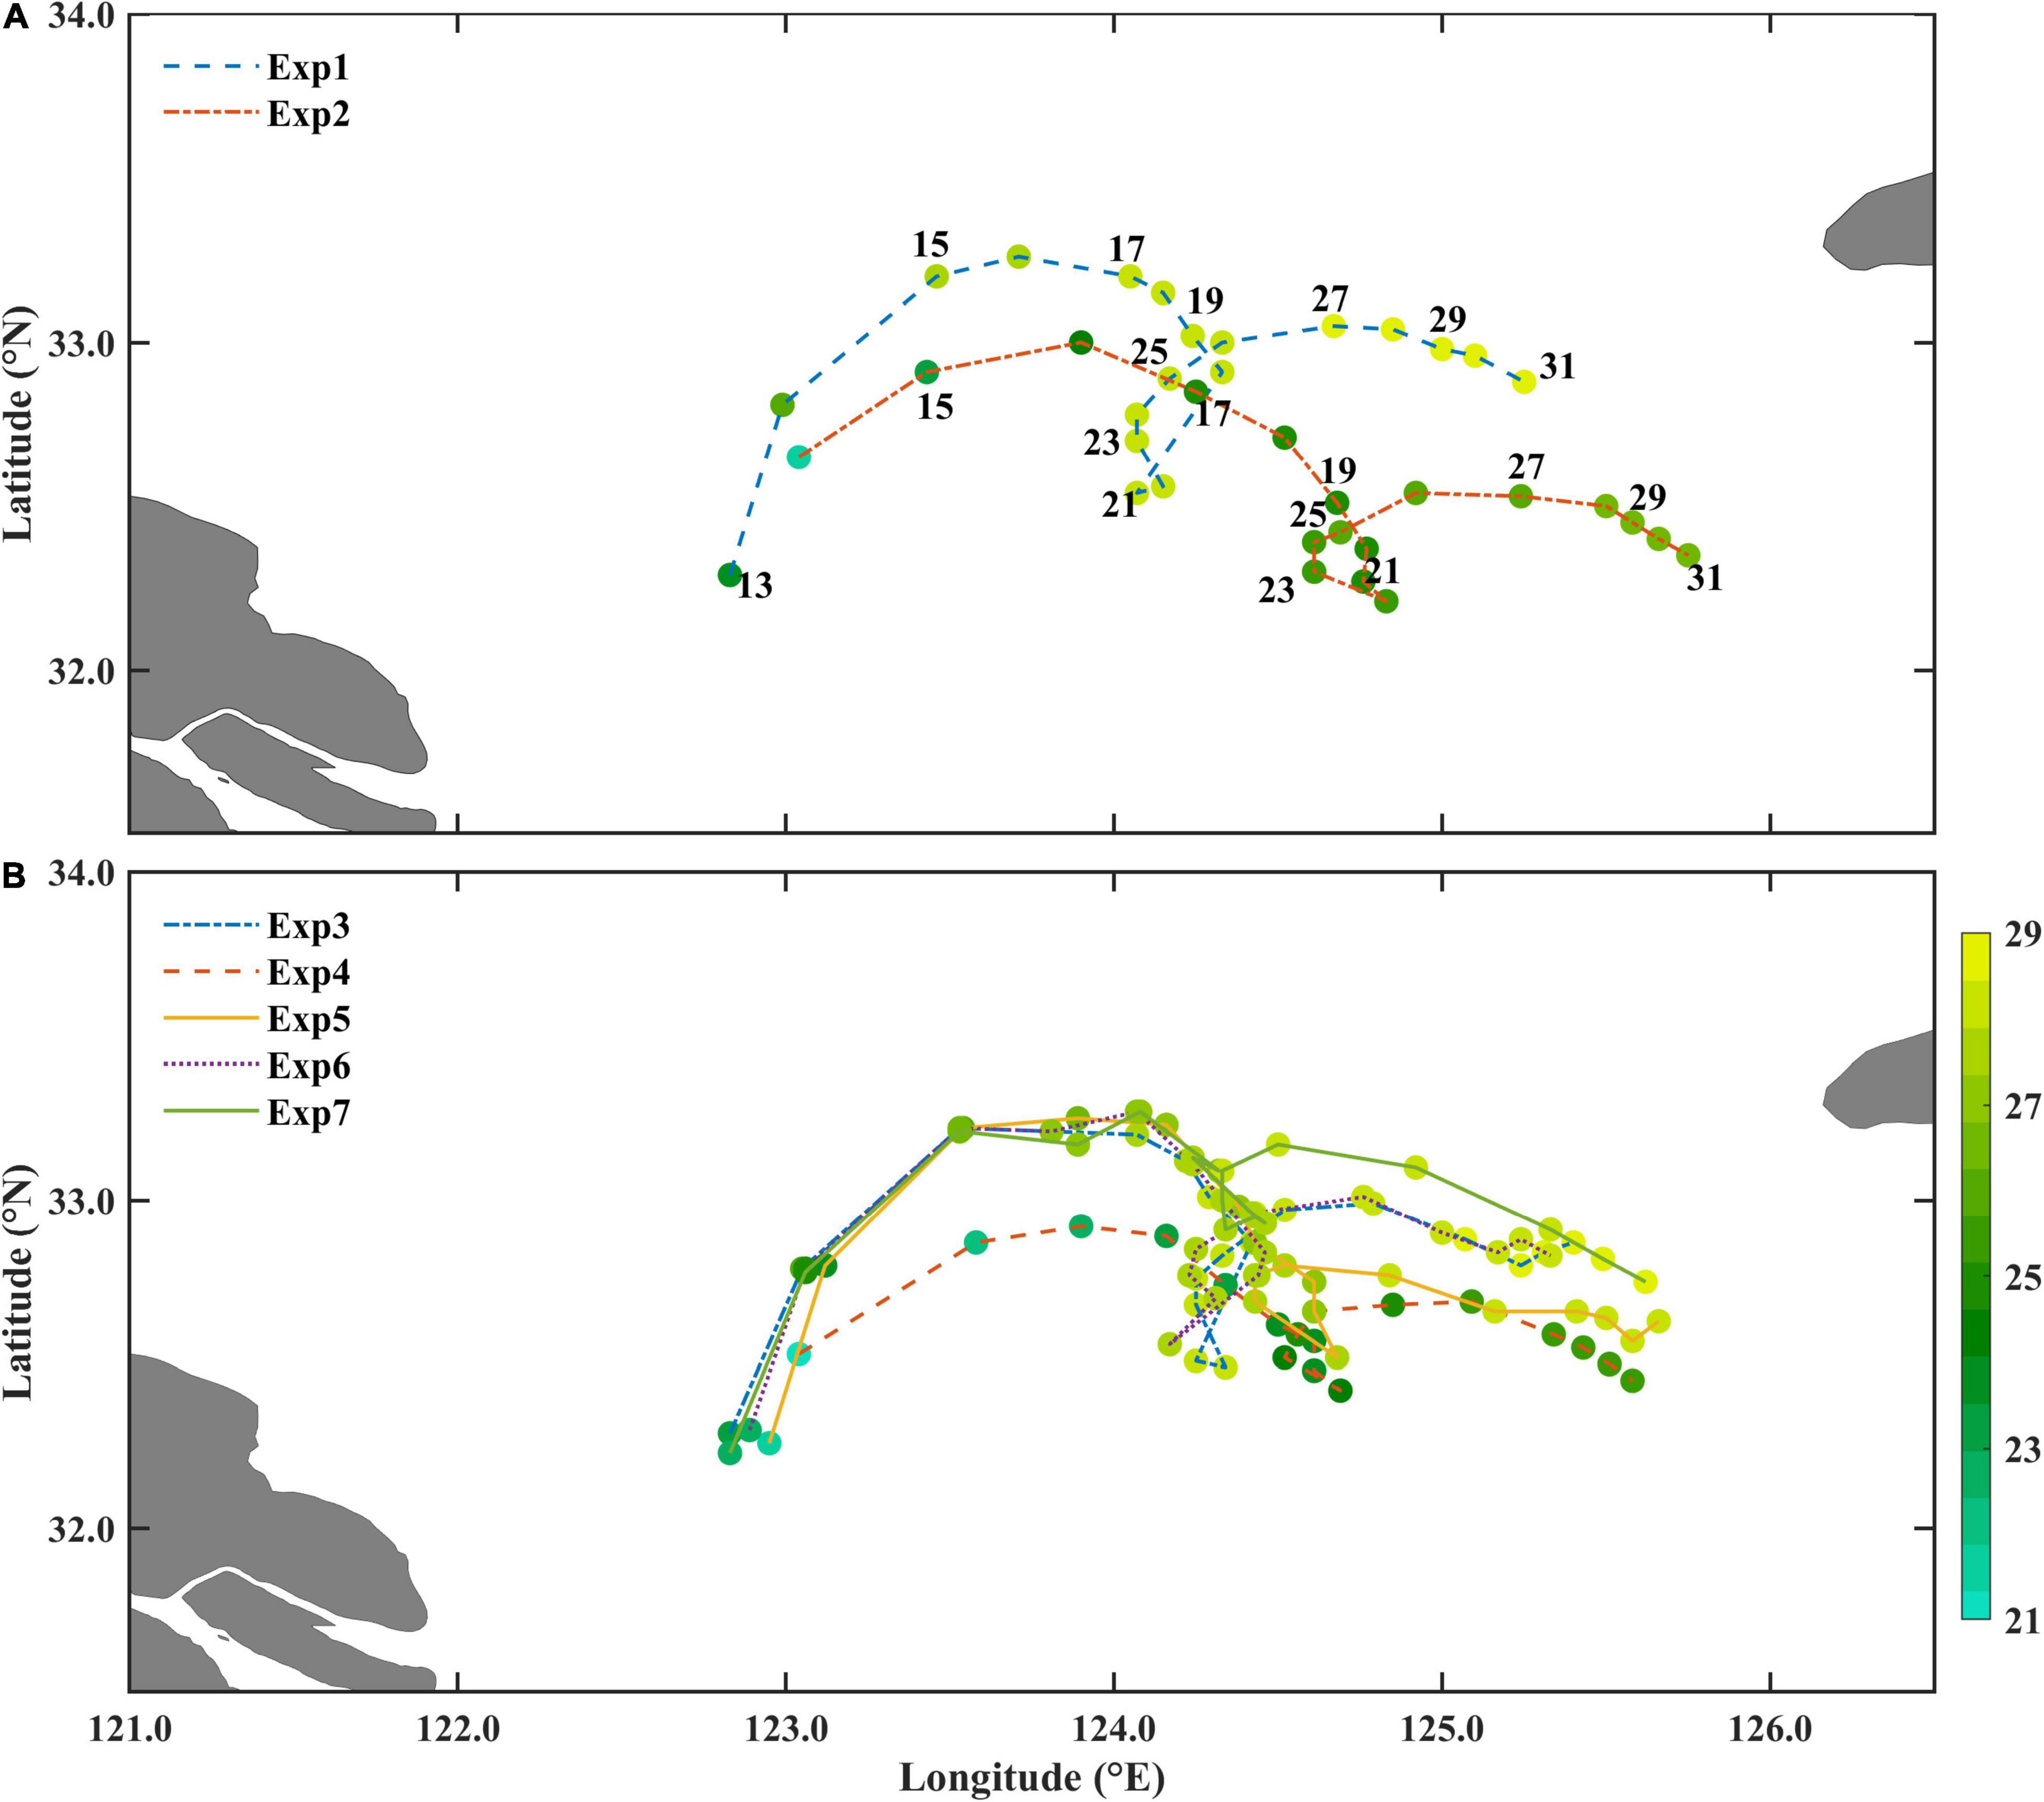
Figure 11. The trajectory of the LSW center since the detachment in (A) Exp1 (CR) and Exp2 (NoWave), and (B) Exp3 (NoCWCBS), Exp4 (NoFormDrag), Exp5 (NoWDinTKE), Exp6 (NoWRS), and Exp7 (NoCARWE), respectively. Color circles indicate the core salinity of the LSW and the numbers indicate the day of July.
The potential energy anomaly (PEA) proposed by Simpson (1981) is calculated to explain the detachment:
where
The PEA reflects the energy required for mixing the water column to be vertically homogeneous, and a higher PEA indicates a stronger stratification. As we only concern the mixing in the upper layer of the water column, h is set to be 10 m for deep water. The 10 m is selected according to the thickness of CDW with a salinity less than 30 psu and the thickness of the isolated low-salinity lens, which is consistent with the snapshot of salinity along the cross-section A (Figures 7A–F). If Φ is calculated as the integration from the bottom to the surface, the bottom water will largely affect the PEA than the surface LSW. The snapshots of the PEA distribution are given in Figure 12. It shows the CDW has the highest PEA when leaving the river estuary. The isolated LSW companied with a relative higher PEA when detached from the river plume. Apparently, the ambient well-mixed surface water (low PEA) began to squeeze the CDW from both sides since July 11, and the CDW front became narrower in the horizontal and thinner in the vertical. Then the low PEA water worked like a scalpel cutting off the CDW front and the high PEA lens was completely detached on July 15.
Figure 12. The daily-averaged surface salinity (black lines indicate 24, 26, 28, and 30 psu) and PEA (unit: kg⋅m–1s–2) calculated from July 11 to 16 in (A–F) Exp1 (CR) and (G–L) Exp2 (NoWave).
The vertical mixing, the northward flow, and the upwelling, all enhanced by waves, promote the detachment of the LSW. Comparison between Exp1 and Exp2 shows the CDW has a higher PEA in Exp2 than that in Exp1. The squeezing between the northward flow and the Subei coastal water becomes more difficult in Exp2 and thus it needs 16 h more to finish the detachment. Furthermore, the isolated LSW also has a higher PEA in Exp2 than that in Exp1.
Comparison between the five wave–current interaction processes on SSS indicates the form drag (Exp1–Exp4, CR–NoFormDrag) varied the SSS most (Figure 13B). It increases the SSS by 1∼4 psu following the CDW pathway and in Hangzhou Bay; and the SSS in the southern Jiangsu coast and the CRE is decreased. The combined wave–current bottom stress (CWCBS), calculated as Exp1-Exp3 (CR-NoCWCBS), increases the SSS by 2∼3 psu off the CRE and in Hangzhou Bay, and by about 1 psu on the shelf. The SSS is decreased in some small bays at the south of Hangzhou Bay (Figure 13A). The wave dissipation on turbulence, calculated as Exp1-Exp5 (CR–NoWDinTKE), shows the SSS is increased off the river estuary by more than 1 psu but decreased off the Lyusi area (Figure 13C). The wave radiation stress (WRS), calculated as Exp1–Exp6 (CR–NoWRS), raises the SSS in almost the study area (Figure 13D), but the increment is the least among Exp3∼Exp7. The SSS variation induced by the current advection and refraction of wave energy (CARWE), calculated as Exp1–Exp7 (CR–NoCARWE), is quite similar to that induced by the wave dissipation on turbulence (Figure 13E). To quantify the contribution of each wave–current interaction process on SSS, the root mean square (RMS) of the SSS difference between the control run and each experiment is calculated (Table 2). A larger RMS indicates a more inhomogeneous difference and thus a greater impact of the wave–current interaction process. The results in Table 2 indicate the form drag has the most significant impact on the SSS distribution in the studied area, followed by the wave dissipation on turbulence, the CARWE, the CWCBS and the WRS.
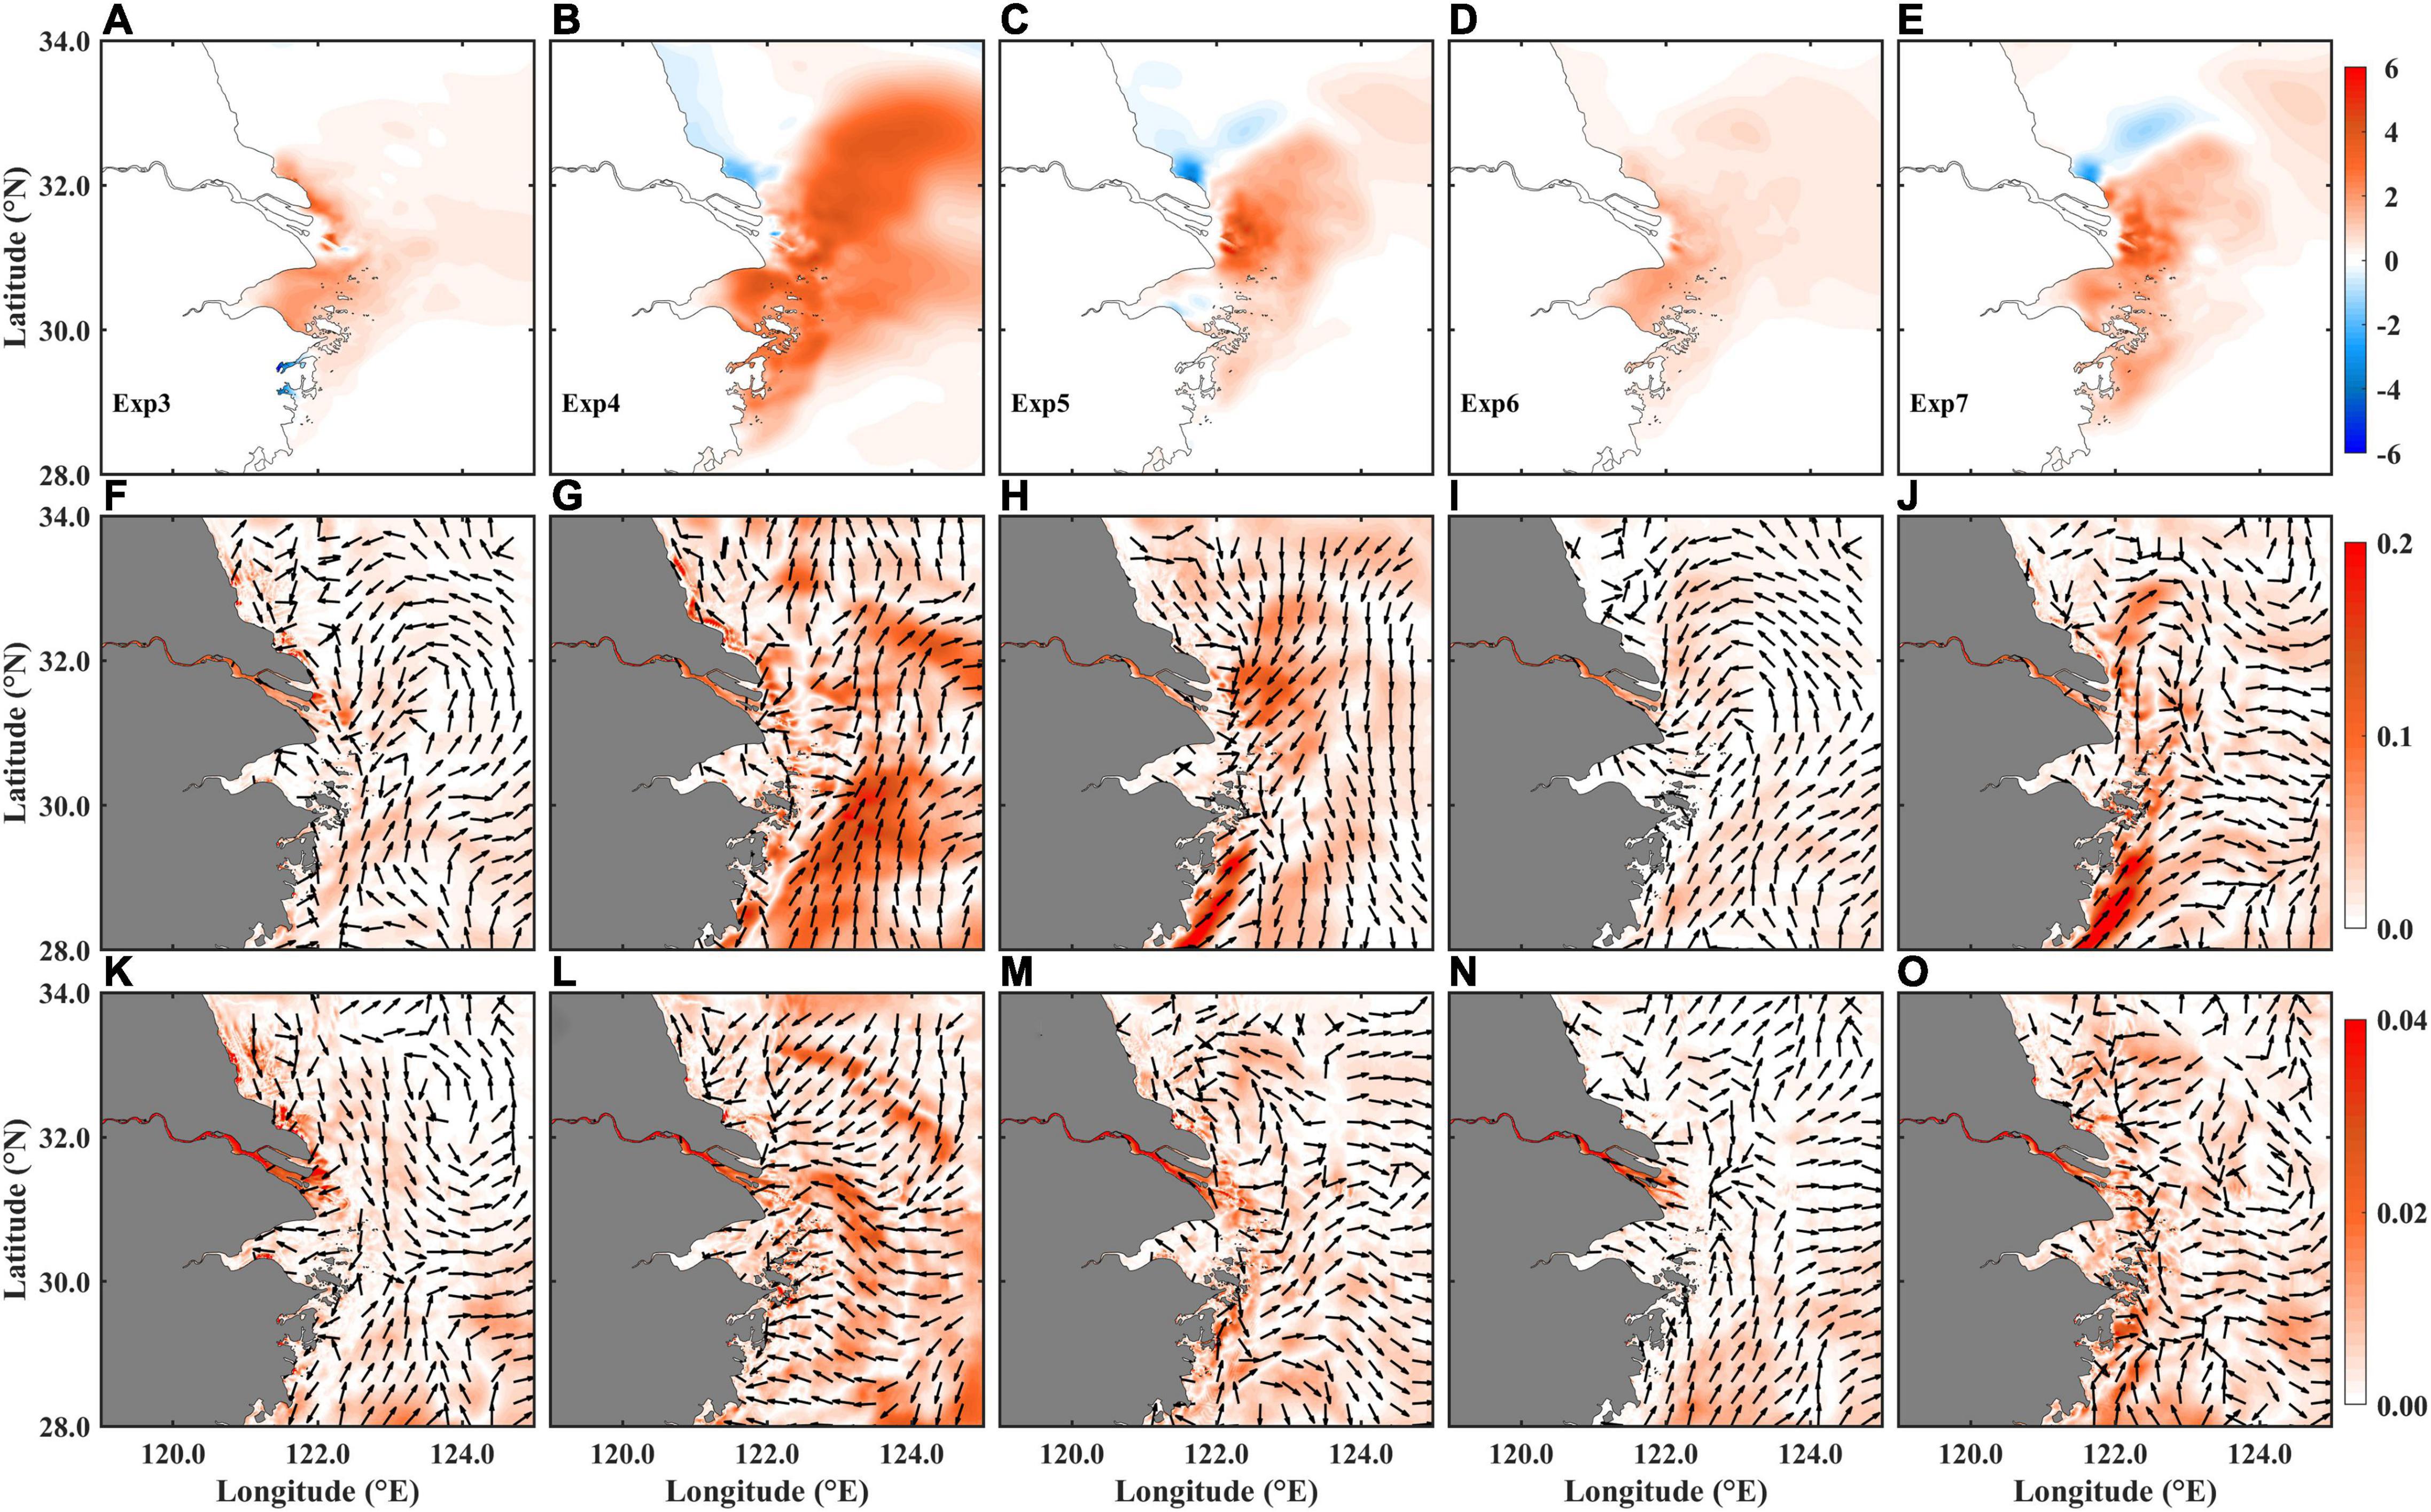
Figure 13. The difference of (A–E) surface salinity, (F–J) surface current, and (K–O) bottom current (unit: ms–1) averaged from July 11 to 19, 2006 in (A,F,K) Exp1 (CR) –Exp3 (NoCWCBS), (B,G,L) Exp1–Exp4 (NoFormDrag), (C,H,M) Exp1–Exp5 (NoWDinTKE), (D,I,N) Exp1–Exp6 (NoWRS), and (E,J,O) Exp1–Exp7 (NoCARWE). Color indicates magnitude and arrows for direction.
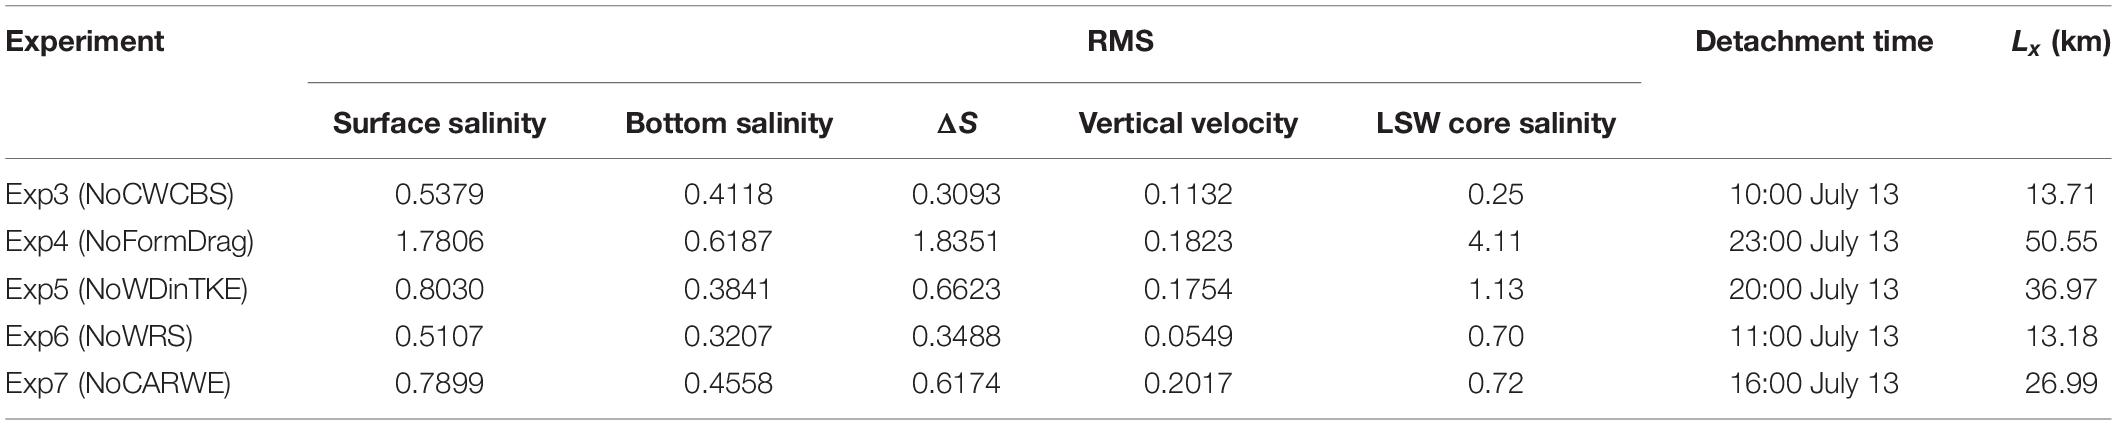
Table 2. The root mean square (RMS) of the difference between the control run and each experiment on surface salinity, bottom salinity, ΔS, vertical velocity, and low-salinity water (LSW) core salinity, and the detachment time and Lx calculated by Equation (13) in each experiment.
Compared to the SSS, the bottom salinity varies less in all five experiments (not shown). It has a relatively large difference nearshore but a small difference in deep water. The RMSs of the bottom salinity difference between the control run and each experiment are also given in Table 2. It indicates the wave effects on the bottom salinity are much less than those on SSS; and the form drag still has the greatest impact on the bottom salinity distribution.
The difference of vertical mixing represented by ΔS between the control run and the five experiments is similar to the SSS difference (not shown), but a positive SSS difference (enhanced SSS) usually indicated a negative ΔS difference (enhanced vertical mixing). The RMSs of the ΔS difference between the control run and each experiment (Table 2) indicate the form drag has the major contribution to the vertical mixing, followed by the wave dissipation on turbulence, the CARWE and the WRS. The CWCBS has a minor contribution to the vertical mixing.
The CWCBS (Exp1-Exp3) generates northward currents along the coast and a weakly anticlockwise circulation off the CRE (Figure 13F). The largest CWCBS-induced surface flow is about 0.07 ms–1 along the Jiangsu coast. The form drag (Exp1–Exp4) can generate the largest surface flow (0.14 ms–1 in maximum), which flows northward to northeastward (Figure 13G). The wave dissipation in the TKE equation (Exp1–Exp5) can induce southward surface flow with a magnitude of 0.10 ms–1, which is basically opposite to that induced by the form drag (Figure 13H). The WRS (Exp1–Exp6) also generates weak surface flow in the study area. Similar to the flow induced by the CWCBS, the WRS can generate an anticlockwise circulation off the CRE (Figure 13I). The CARWE (Exp1–Exp7) generates northeastward surface flow along the Zhejiang coast but southward flow along the Jiangsu coast (Figure 13J). There is also a northward surface flow from the Hangzhou Bay to the CRE along 122°E until 33°N, which turns sharply to the southward on 123°E. All the wave–current interaction processes can enhance the TWC inshore branch. The CWCBS, the wave dissipation on turbulence, and the WRS work together to weaken the northeastward surface flow along the CDW pathway (Figure 8I), which in turn is enhanced by the form drag and the CARWE.
The wave-driven flow in the bottom layer is much weaker in magnitude, only about 19% of the surface wave-driven flow in average. The bottom flow generated by the CWCBS is similar to that on the surface (Figure 13K). The form drag induces a landward bottom flow, which has a relatively large speed of 0.02 ms–1 compared to the other experiments (Figure 13L). The bottom flow induced by the wave dissipation on turbulence (Figure 13M) and the WRS (Figure 13N) have similar patterns, which enhances the TWC inshore branch. The CARWE generates a southward coastal flow from the Jiangsu coast to the Hangzhou Bay and an anticlockwise circulation offshore (Figure 13O). The combination of the flow driven by each wave–current interaction process differs from the wave-driven flow calculated by Exp1-Exp2 (Figures 8I,L), which indicates the strong non-linear interactions between those individual processes.
The difference of the vertical-averaged vertical velocity along the cross-section A between the control run and each wave–current interaction experiment is calculated from July 11 to 19 (Figures 9D–F). The CWCBS and the WRS only enhanced the upwelling on 122.1°E from July 13 to 15 (not shown), which cannot support the double-core upwelling system. The wave dissipation (Figure 9E) and CARWE (Figure 9F) have a similar impact on the upwelling. They strengthened the upwelling from July 13 to 15, when the double-core upwelling was formed: one core was on 122.2°E and the other one was initially formed on 122.4°E but gradually moved eastward and decayed. It indicates the retreat of TWC inshore branch due to decrease of southerly wind (Wang et al., 2019). The effect of form drag on upwelling is complicated (Figure 9D). It enhanced the cores on 122.1°E and 122.2°E from July 14 until July 19; and another core appeared on 122.3°E from July 14 to 19 and it extended eastward on July 16.
Similarly, the RMSs of the wave-induced upwelling difference between the control run and each experiment are also given in Table 2. It indicates the CARWE has the largest impact on the wave-induced upwelling in five experiments. The form drag and the wave dissipation have less but comparable impact on the upwelling, followed by the CWCBS and WRS.
To compare the effect of individual wave–current interaction process on the LSW detachment, the occurrence time of the detachment in each experiment is compared in Table 2. The SSS on July 13 and 14 in each experiment is also plotted in Figure 10. It shows that the LSW closed by 22 psu isohaline was detached on 23:00 July 13 in Exp2, meanwhile the LSW closed by 24 psu isohaline was detached on 07:00 July 13 in Exp1. Excluding the form drag in Exp4, the LSW closed by 22 psu isohaline left the CDW main body on 23:00 July 13 (Figures 10C,I); meanwhile in the other experiments, the LSW was detached with a closed 24 psu isohaline (Figure 10). Compared to the control run, it was 3 h, 13 h, 4 h, and 9 h delayed in Exp3 (NoCWCBS), Exp5 (NoWDinTKE), Exp6 (NoWRS) and Exp7 (NOCARWE), respectively. It indicates the form drag affects the detachment most, followed by the wave dissipation on turbulence, the CARWE, the WRS and the CWCBS.
The trajectories of the isolated LSW in Exp3∼Exp7 are shown in Figure 11B. The trajectory in Exp4 (NoFormDrag) is most similar to that in Exp2 (NoWave), while the others are similar to that in Exp1 (CR). To quantify the difference between the experiments, the following calculation is used:
where Lxi is the location of the isolated LSW center on the ith day in experiment x, i.e., Exp3∼Exp7; L1i is the location of the isolated LSW center on the ith day in Exp1; and N is the total days since the LSW detached to July 31. Lx represents the similarity of trajectory between the individual wave–current interaction experiment and the control run; and a larger Lx indicates the wave–current interaction process plays a more important role in the LSW migration. The result is given in Table 2. It indicates the form drag (Exp4) is the most important process to impact the LSW migration, followed the wave dissipation on turbulence (Exp5), the CARWE (Exp7). The CWCBS (Exp3) and WRS (Exp6) have the least influence on the LSW movement.
Similarly, the RMSs of daily-averaged LSW core salinity difference after the detachment between the control run and individual wave–current interaction process experiment are calculated and listed in Table 2. Also, a larger RMS indicates the wave–current interaction process has a more important effect on the variation of LSW core salinity. The results indicate the form drag (Exp4) has the greatest influence on the core salinity, followed by the wave dissipation on turbulence (Exp5), the CARWE (Exp7) and the WRS (Exp6). The CWCBS (Exp3) has the least influence on the LSW core salinity.
In this paper, the wave effects on LSW detachment from the Changjiang River plume are evaluated in the view of wind-enhanced vertical mixing, northward flows intrusion and upwelling. Further comparison between the experiments considering and not considering waves indicates waves are not the controlling factor of the LSW detachment, but they can accelerate the detachment of LSW from the river plume. Using PEA, the detachment of LSW can be explained as the low PEA water squeezing the high PEA water. Influenced by the waves’ adjustment to the shelf circulation, wave-enhanced double-core upwelling squeezes the CDW vertically and reduces the thickness of CDW; strengthened northward flow brings south saline seawater here and intrudes the CDW front; and the enhanced vertical mixing increases the surface salinity. To summarize, the non-uniform impacts of waves promote the non-uniform variations at the CDW front, which is conducive to the LSW detachment. The wave-enhanced vertical mixing will enlarge the core salinity of the isolated LSW when detached; furthermore, it will accelerate the growth rate of the core salinity during its subsequent evolution. Waves also affect the trajectory of the isolated LSW, which is moved further northward and travels faster.
The comparison among experiments driven by different wave–current interaction processes illustrates the form drag almost dominates the wave effects on the river plume, the detachment, and the movement of LSW. It works through the wind-induced pressure and the wave setup in the momentum Equation (4) and the TKE Equations (6) and (7). The wave-weakened northeastward surface flow along the CDW pathway, which confines the CDW extension, is mainly caused by the wave dissipation in the TKE equations. The CARWE obviously enhances the magnitude of the double-core upwelling system. But this effect declines with the decaying wave-driven flow. It indicates the interrelationship between those individual wave–current interactions. The waves affect the salinity mainly on the CDW pathway, but the wave-driven flow and the wave-enhanced upwelling are dramatical within 50 m isobath. The wave effects on the isolated LSW continue until the LSW disappears. Previous work to quantify the individual wave–current interaction process by using the FVCOM-MDO model shows that the CWCBS plays the most important role in suspended sediment transport in coastal seas (Gao et al., 2018), and the WRS dominates the bay-shelf exchange (Song et al., 2021). However, in this study, it shows that form drag is the most significant wave effect on the detachment and movement of the LSW, mostly because it occurs in the surface layer. It also confirms that waves are important to several ocean processes, but the dominant wave–current interaction mechanisms are different (Song et al., 2021).
As the offshore LSW is significant to inner-shelf biogeochemical processes (Wei et al., 2017, 2020; Qu et al., 2019), the existence duration and pathway of the isolated LSW seems important to the water quality and the harmful algae bloom. Therefore, the impact of wave effects on the biogeochemical process will be further explored.
The datasets presented in this study can be found in online repositories. The names of the repository/repositories and accession number(s) can be found below: https://doi.org/10.6084/m9.figshare.13649780.v2.
ZJ contributed to the software, formal analysis, and writing – original draft. DS contributed to the conceptualization, methodology, and writing – review and editing. QW contributed to the investigation and resources. YD contributed to the software and writing – review and editing. All authors contributed to the article and approved the submitted version.
This study was financially supported by the National Natural Science Foundation of China (Grant Numbers 41876088 and 41876085) and the Ocean University of China and Woods Hole Oceanographic Institution Collaborative Project (Grant Number 23427).
The authors declare that the research was conducted in the absence of any commercial or financial relationships that could be construed as a potential conflict of interest.
All claims expressed in this article are solely those of the authors and do not necessarily represent those of their affiliated organizations, or those of the publisher, the editors and the reviewers. Any product that may be evaluated in this article, or claim that may be made by its manufacturer, is not guaranteed or endorsed by the publisher.
The numerical simulation was conducted at the High-Performance Scientific Computing and System Simulation Platform of Pilot National Laboratory for Marine Science and Technology (Qingdao).
Akan, Ç, Moghimi, S., Özkan-Haller, H. T., Osborne, J., and Kurapov, A. (2017). On the dynamics of the Mouth of the Columbia River: results from a three-dimensional fully coupled wave-current interaction model. J. Geophys. Res. Oceans 122, 5218–5236. doi: 10.1002/2016jc012307
Beardsley, R. C., Limeburner, R., Yu, H., and Cannon, G. A. (1985). Discharge of the Changjiang (Yangtze River) into the East China Sea. Continental Shelf Res. 4, 57–76. doi: 10.1016/0278-4343(85)90022-90026
Chen, C., Beardsley, R. C., Limeburner, R., and Kim, K. (1994). Comparison of winter and summer hydrographic observations in the Yellow and East China Seas and adjacent Kuroshio during 1986. Continental Shelf Res. 14, 909–929. doi: 10.1016/0278-4343(94)90079-90075
Chen, C., Liu, H., and Beardsley, R. C. (2003). An unstructured grid, finite-volume, three-dimensional, primitive equations ocean model: application to coastal ocean and estuaries. J. Atmospheric Oceanic Technol. 20, 159–186. doi: 10.1175/1520-0426(2003)020<0159:augfvt>2.0.co;2
Chen, C., Xue, P., Ding, P., Beardsley, R. C., Xu, Q., Mao, X., et al. (2008). Physical mechanisms for the offshore detachment of the Changjiang Diluted Water in the East China Sea. J. Geophys. Res. 113, 1–17. doi: 10.1029/2006jc003994
Chen, Z., Pan, J., and Jiang, Y. (2016). Role of pulsed winds on detachment of low salinity water from the Pearl River Plume: upwelling and mixing processes. J. Geophys. Res. Oceans 121, 2769–2788. doi: 10.1002/2015jc011337
Delpey, M. T., Ardhuin, F., Otheguy, P., and Jouon, A. (2014). Effects of waves on coastal water dispersion in a small estuarine bay. J. Geophys. Res. Oceans 119, 70–86. doi: 10.1002/2013JC009466
Ding, Y., Bao, X., Yao, Z., Bi, C., Wan, K., Bao, M., et al. (2019). Observational and model studies of synoptic current fluctuations in the Bohai Strait on the Chinese continental shelf. Ocean Dynam. 69, 323–351. doi: 10.1007/s10236-019-01247-1245
Ding, Y., Bao, X., Yao, Z., Song, D., Song, J., Gao, J., et al. (2018). Effect of coastal-trapped waves on the synoptic variations of the Yellow Sea Warm Current during winter. Continental Shelf Res. 167, 14–31. doi: 10.1016/j.csr.2018.08.003
Donelan, M. A., Hamilton, J., Hui, W. H., and Stewart, R. W. (1985). Directional spectra of wind-generated ocean waves. Philos. Trans. R. Soc. London. Series A Mathematical Phys. Sci. 315, 509–562. doi: 10.1098/rsta.1985.0054
Fairall, C. W., Bradley, E. F., Rogers, D. P., Edson, J. B., and Young, G. S. (1996). Bulk parameterization of air-sea fluxes for tropical ocean-global atmosphere coupled-ocean atmosphere response experiment. J. Geophys. Res. Oceans 101, 3747–3764. doi: 10.1029/95JC03205
Galperin, B., Kantha, L. H., Hassid, S., and Rosati, A. (1988). A quasi-equilibrium turbulent energy model for geophysical flows. J. Atmospheric Sci. 45, 55–62. doi: 10.1175/1520-0469(1988)045<0055:aqetem>2.0.co;2
Gan, J., Li, L., Wang, D., and Guo, X. (2009). Interaction of a river plume with coastal upwelling in the northeastern South China Sea. Continental Shelf Res. 29, 728–740. doi: 10.1016/j.csr.2008.12.002
Gao, G. D., Wang, X. H., Song, D., Bao, X., Yin, B. S., Yang, D. Z., et al. (2018). Effects of wave-current interactions on suspended-sediment dynamics during strong wave events in Jiaozhou Bay, Qingdao, China. J. Phys. Oceanography 48, 1053–1078. doi: 10.1175/jpo-d-17-0259.1
Gao, G., Marin, M., Feng, M., Yin, B., Yang, D., Feng, X., et al. (2020). Drivers of Marine Heatwaves in the East China Sea and the South Yellow Sea in Three Consecutive Summers During 2016-2018. J. Geophys. Res. Oceans 125, 1–19. doi: 10.1029/2020jc016518
García Berdeal, I., Hickey, B. M., and Kawase, M. (2002). Influence of wind stress and ambient flow on a high discharge river plume. J. Geophys. Res. Oceans 107:13-11-13-24. doi: 10.1029/2001JC000932.
Ge, J., Ding, P., and Chen, C. (2015). Low-salinity plume detachment under non-uniform summer wind off the Changjiang Estuary. Estuarine Coastal Shelf Sci. 156, 61–70. doi: 10.1016/j.ecss.2014.10.012
Gerbi, G. P., Chant, R. J., and Wilkin, J. L. (2013). Breaking surface wave effects on river plume dynamics during upwelling-favorable winds. J. Phys. Oceanography 43, 1959–1980. doi: 10.1175/jpo-d-12-0185.1
Gong, W., Lin, Z., Chen, Y., Chen, Z., Shen, J., and Zhang, H. (2018). Effect of waves on the dispersal of the Pearl River plume in winter. J. Mar. Systems 186, 47–67. doi: 10.1016/j.jmarsys.2018.05.003
Guan, B., and Fang, G. (2006). Winter counter-wind currents off the southeastern China coast: a review. J. Oceanography 62, 1–24. doi: 10.1007/s10872-006-0028-28
Guo, X., and Yanagi, T. (1998). Three-dimensional structure of tidal current in the East China Sea and the Yellow Sea. J. Oceanography 54, 651–668. doi: 10.1007/BF02823285
He, H., Song, J., Bai, Y., Xu, Y., Wang, J., and Bi, F. (2018). Climate and extrema of ocean waves in the East China Sea. Sci. China Earth Sci. 61, 980–994. doi: 10.1007/s11430-017-9156-9157
Jurisa, J. T., and Chant, R. (2012). The coupled Hudson River estuarine-plume response to variable wind and river forcings. Ocean Dynamics 62, 771–784. doi: 10.1007/s10236-012-0527-527
Kang, S. K., Lee, S.-R., and Lie, H.-J. (1998). Fine grid tidal modeling of the Yellow and East China Seas. Cont. Shelf Res. 18, 739–772. doi: 10.1016/S0278-4343(98)00014-4
Kumar, N., Cahl, D. L., Crosby, S. C., and Voulgaris, G. (2017). Bulk versus spectral wave parameters: implications on stokes drift estimates, regional wave modeling, and HF radars applications. J. Phys. Oceanography 47, 1413–1431. doi: 10.1175/JPO-D-16-0203.1
Lie, H.-J., and Cho, C.-H. (2016). Seasonal circulation patterns of the Yellow and East China Seas derived from satellite-tracked drifter trajectories and hydrographic observations. Prog. Oceanography 146, 121–141. doi: 10.1016/j.pocean.2016.06.004
Lie, H.-J., Cho, C.-H., Lee, J.-H., and Lee, S. (2003). Structure and eastward extension of the Changjiang River plume in the East China Sea. J. Geophys. Res. 108, 1–14. doi: 10.1029/2001jc001194
Liu, Q., Rothstein, L. M., and Luo, Y. (2017). A periodic freshwater patch detachment process from the Block Island Sound estuarine plume. J. Geophys. Res. Oceans 122, 570–586. doi: 10.1002/2015JC011546
Mellor, G. (2003). The three-dimensional current and surface wave equations. J. Phys. Oceanography 33, 1978–1989. doi: 10.1175/1520-0485(2003)033<1978:ttcasw>2.0.co;2
Mellor, G. (2015). A combined derivation of the integrated and vertically resolved, coupled wave-current equations. J. Phys. Oceanography 45, 1453–1463. doi: 10.1175/jpo-d-14-0112.1
Mellor, G. L. (2008). The depth-dependent current and wave interaction equations: a revision. J. Phys. Oceanography 38, 2587–2596. doi: 10.1175/2008JPO3971.1
Mellor, G. L. (2013). Pressure-slope momentum transfer in ocean surface boundary layers coupled with gravity waves. J. Phys. Oceanogr. 43, 2173–2184. doi: 10.1175/JPO-D-13-068.1
Mellor, G. L., and Yamada, T. (1982). Development of a turbulence closure model for geophysical fluid problems. Rev. Geophys. Space Phys. 20, 851–875. doi: 10.1029/RG020i004p00851
Mellor, G. L., Donelan, M. A., and Oey, L.-Y. (2008). A surface wave model for coupling with numerical ocean circulation models. J. Atmospheric Oceanic Technol. 25, 1785–1807. doi: 10.1175/2008jtecho573.1
Mellor, G., and Blumberg, A. (2004). Wave breaking and ocean surface layer thermal response. J. Phys. Oceanography 34, 693–698. doi: 10.1175/2517.1
Moon, J.-H., Hirose, N., Yoon, J.-H., and Pang, I.-C. (2010). Offshore detachment process of the low-salinity water around Changjiang Bank in the East China Sea. J. Phys. Oceanography 40, 1035–1053. doi: 10.1175/2010jpo4167.1
Pu, Y. (1981). Surface water mass and circulation in the northern East China Sea. Mar. Sci. Bull. 5, 23–36.
Pu, Y., and Xu, X. (1983). The expansion of diluted water in the Changjiang (Yangtz River) as seen from the variations in the runoff, water level and salinity. Mar. Sci. Bull. 2, 1–7.
Qu, D., Yu, H., Sun, Y., Zhao, Y., Wei, Q., Yu, H., et al. (2019). Numerical study on the summertime patches of red tide in the adjacent sea of the Changjiang (Yangtze) River Estuary, China. Mar. Pollution Bull. 143, 242–255. doi: 10.1016/j.marpolbul.2019.04.027
Rong, Z., and Li, M. (2012). Tidal effects on the bulge region of Changjiang River plume. Estuarine Coastal Shelf Sci. 97, 149–160. doi: 10.1016/j.ecss.2011.11.035
Rong, Z., Hetland, R. D., Zhang, W., and Zhang, X. (2014). Current-wave interaction in the Mississippi-Atchafalaya river plume on the Texas-Louisiana shelf. Ocean Modell. 84, 67–83. doi: 10.1016/j.ocemod.2014.09.008
Saha, S., Moorthi, S., Pan, H. L., Wu, X., Wang, J., Nadiga, S., et al. (2010). The NCEP climate forecast system reanalysis. Bull. Am. Meteorol. Soc. 91, 1015–1058. doi: 10.1175/2010bams3001.1
Schloen, J., Stanev, E. V., and Grashorn, S. (2017). Wave-current interactions in the southern North Sea: the impact on salinity. Ocean Modell. 111, 19–37. doi: 10.1016/j.ocemod.2017.01.003
Shu, Y., Wang, D., Zhu, J., and Peng, S. (2011). The 4-D structure of upwelling and Pearl River plume in the northern South China Sea during summer 2008 revealed by a data assimilation model. Ocean Modell. 36, 228–241. doi: 10.1016/j.ocemod.2011.01.002
Simpson, J. H. (1981). The shelf-sea fronts: implications of their existence and behaviour. Philos. Trans. R. Soc. London. Series A Mathematical Phys. Sci. 302, 531–546. doi: 10.1098/rsta.1981.0181
Smagorinsky, J. (1963). General circulation experiments with the primitive equations: I. the basic experiment. Monthly Weather Rev. 91, 99–164. doi: 10.1175/1520-0493(1963)091<0099:gcewtp>2.3.co;2
Song, D., Wang, X. H., Zhu, X., and Bao, X. (2013). Modeling studies of the far-field effects of tidal flat reclamation on tidal dynamics in the East China Seas. Estuarine Coastal Shelf Sci. 133, 147–160. doi: 10.1016/j.ecss.2013.08.023
Song, D., Wu, W., and Li, Q. (2021). Effects of wave-current interactions on bay-shelf exchange. J. Phys. Oceanography 51, 1637–1654. doi: 10.1175/JPO-D-20-0222.1
Soulsby, R. L. (1995). “Bed shear-stresses due to combined waves and currents,” in Advances in Coastal Morphodynamics, eds M. Stive, J. Fredsøe, L. Hamm, R. Soulsby, C. Teisson, and J. Winterwerp (Delft: Delft Hydraulics).
Su, J., and Wang, K. (1989). Changjiang river plume and suspended sediment transport in Hangzhou Bay. Continental Shelf Res. 9, 93–111. doi: 10.1016/0278-4343(89)90085-X
US Naval Oceanographic Office, and the US Naval Ocean Research, and Development Activity (1983). DBDB5 (Digital Bathymetric Data Base-5 minute grid). Bay St. Louis: US N.O.O.
Wang, J., and Shen, Y. (2010). Modeling oil spills transportation in seas based on unstructured grid, finite-volume, wave-ocean model. Ocean Modell. 35, 332–344. doi: 10.1016/j.ocemod.2010.09.005
Wang, J., and Shen, Y. (2012). On the development and verification of a parametric parallel unstructured-grid finite-volume wind wave model for coupling with ocean circulation models. Environ. Modell. Software 37, 179–192. doi: 10.1016/j.envsoft.2012.03.019
Wang, J., Yu, F., Ren, Q., Si, G., and Wei, C. (2019). The observed variations of the north intrusion of the bottom Taiwan Warm Current Inshore Branch and its response to wind. Reg. Stud. Mar. Sci. 30:100690. doi: 10.1016/j.rsma.2019.100690
Wei, Q., Wang, B., Zhang, X., Ran, X., Fu, M., Sun, X., et al. (2020). Contribution of the offshore detached Changjiang (Yangtze River) Diluted Water to the formation of hypoxia in summer. Sci. Total Environ. 764:142838. doi: 10.1016/j.scitotenv.2020.142838
Wei, Q., Yu, Z., Wang, B., Wu, H., Sun, J., Zhang, X., et al. (2017). Offshore detachment of the Changjiang River plume and its ecological impacts in summer. J. Oceanography 73, 277–294. doi: 10.1007/s10872-016-0402-400
Wu, H., Shen, J., Zhu, J., Zhang, J., and Li, L. (2014). Characteristics of the Changjiang plume and its extension along the Jiangsu Coast. Continental Shelf Res. 76, 108–123. doi: 10.1016/j.csr.2014.01.007
Wu, H., Zhu, J., Shen, J., and Wang, H. (2011). Tidal modulation on the Changjiang River plume in summer. J. Geophys. Res. 116, 1–21. doi: 10.1029/2011jc007209
Wu, R., Wu, H., and Wang, Y. (2021). Modulation of shelf circulations under multiple river discharges in the East China Sea. J. Geophys. Res. Oceans 126:e2020JC016990. doi: 10.1029/2020JC016990
Xuan, J.-L., Huang, D., Zhou, F., Zhu, X.-H., and Fan, X. (2012). The role of wind on the detachment of low salinity water in the Changjiang Estuary in summer. J. Geophys. Res. Oceans 117:C10004. doi: 10.1029/2012jc008121
Yankovsky, A. E., Hickey, B. M., and Münchow, A. K. (2001). Impact of variable inflow on the dynamics of a coastal buoyant plume. J. Geophys. Res. Oceans 106, 19809–19824. doi: 10.1029/2001JC000792
Yu, X., Guo, X., and Gao, H. (2020). Detachment of low-salinity water from the Yellow River plume in summer. J. Geophys. Res. Oceans 125:e2020JC016344. doi: 10.1029/2020jc016344
Zhang, W.-J., Zhu, S.-X., Li, X.-Q., Ruan, K., Guan, W.-B., and Peng, J. (2014). Numerical simulation and dynamical analysis for low salinity water lens in the expansion area of the Changjiang diluted water. China Ocean Eng. 28, 777–790. doi: 10.1007/s13344-014-0060-61
Zhao, B., Fang, G., and Cao, D. (1995). Characteristics of tidal residual currents and their relations with coastal current transports in the Bohai Sea. Yellow Sea and East China Sea. Stud. Mar. Sin. 36, 1–11.
Zhu, J., Chen, C., Ding, P., Li, C., and Lin, H. (2004). Does the Taiwan warm current exist in winter? Geophys. Res. Lett. 31:L12302. doi: 10.1029/2004GL019997
Keywords: low-salinity water, Changjiang River plume, wave–current interactions, form drag, detachment
Citation: Jiang Z, Song D, Wei Q and Ding Y (2022) Impact of Wave–Current Interactions on the Detachment of Low-Salinity Water From Changjiang River Plume and Its Subsequent Evolution. Front. Mar. Sci. 9:863540. doi: 10.3389/fmars.2022.863540
Received: 27 January 2022; Accepted: 25 February 2022;
Published: 28 March 2022.
Edited by:
Alexander Yankovsky, University of South Carolina, United StatesReviewed by:
Hui Wu, East China Normal University, ChinaCopyright © 2022 Jiang, Song, Wei and Ding. This is an open-access article distributed under the terms of the Creative Commons Attribution License (CC BY). The use, distribution or reproduction in other forums is permitted, provided the original author(s) and the copyright owner(s) are credited and that the original publication in this journal is cited, in accordance with accepted academic practice. No use, distribution or reproduction is permitted which does not comply with these terms.
*Correspondence: Dehai Song, c29uZ2RoQG91Yy5lZHUuY24=
Disclaimer: All claims expressed in this article are solely those of the authors and do not necessarily represent those of their affiliated organizations, or those of the publisher, the editors and the reviewers. Any product that may be evaluated in this article or claim that may be made by its manufacturer is not guaranteed or endorsed by the publisher.
Research integrity at Frontiers
Learn more about the work of our research integrity team to safeguard the quality of each article we publish.