 Qiang Wang1,2*
 Sergey Danilov1,3,4
- 1Alfred Wegener Institute Helmholtz Centre for Polar and Marine Research (AWI), Bremerhaven, Germany
- 2Laboratory for Regional Oceanography and Numerical Modeling, Pilot National Laboratory for Marine Science and Technology, Qingdao, China
- 3Department of Mathematics and Logistics, Jacobs University, Bremen, Germany
- 4A. M. Obukhov Institute of Atmospheric Physics, Russian Academy of Science, Moscow, Russia
Major changes have occurred in the Arctic Ocean during 2000–2019, including the unprecedented spin-up of the Beaufort Gyre and the emergence of Arctic Atlantification in the eastern Eurasian Basin. We explored the main drivers for these changes by synthesizing numerical simulations and observations in this paper. The Arctic atmospheric circulation was unusual in some years in this period, with strongly negative wind curl over the Canada Basin. However, the wind-driven spin-up of the Beaufort Gyre would have been much weaker had it not been for Arctic sea ice decline. The sea ice decline not only fed the ocean with meltwater, but also made other freshwater components more available to the Beaufort Gyre through mediating the ocean surface stress. This dynamical effect of shifting surface freshwater from the Eurasian Basin towards the Amerasian Basin also resulted in the Arctic Atlantification in the eastern Eurasian Basin, which is characterized by halocline salinification and the uplift of the boundary between the halocline and the Atlantic Water layer. Contemporarily, the sea ice decline caused a strong warming trend in the Atlantic Water layer. The Empirical Orthogonal Function (EOF) analysis of Arctic annual sea surface height for this period reveals that the first two modes of the upper ocean circulation have active centers associated with the Arctic Oscillation and Beaufort High variability, respectively. In the presence of sea ice decline the first two EOFs can better distinguish the ocean variability driven by the two atmospheric circulation modes. Therefore, the major changes in the Arctic Ocean in the past two decades are indicators of climate change as is the sea ice retreat. Our synthesis could help assess how the Arctic Ocean might change in future warming climate.
1 Introduction
The Arctic has seen an amplified climate change with considerable sea ice decline (Comiso et al., 2017; Kwok, 2018) and an atmosphere warming rate much higher than the global mean (Screen and Simmonds, 2010; Cohen et al., 2014). Dramatic changes have also been observed in the Arctic Ocean. An unprecedented amount of low salinity surface water was accumulated in the Amerasian Basin during the first two decades of the 21st century as shown by observations (Polyakov et al., 2013; Rabe et al., 2014; Wang et al., 2019b), especially in the Beaufort Gyre region (Proshutinsky et al., 2009; Proshutinsky et al., 2019). Accordingly, the Beaufort Gyre circulation accelerated (McPhee, 2013), presumably with enhanced eddy activity (Armitage et al., 2020). In the eastern Eurasian Basin, a weakening of the halocline and an uplift of the lower halocline boundary have been observed (Polyakov et al., 2020b). These changes have strong implications for the impact of the Arctic Ocean on the Earth system. For example, the accumulation and release of Arctic freshwater can modify the upper ocean salinity in the subpolar North Atlantic, thus influencing the ocean stratification, deep water formation and Atlantic meridional overturning circulation (Aagaard et al., 1985; Zhang et al., 2021); The weakening of the Arctic halocline may facilitate the ocean heat in the Arctic Atlantic Water layer to reach the surface mixed layer, thus enhancing sea ice retreat (Polyakov et al., 2020a); The chemical constituents in the Arctic freshwater are very different from those in the North Atlantic, so changes in the status of Arctic freshwater storage can influence the ecosystems in both the Arctic Ocean and North Atlantic (Azetsu-Scott et al., 2010; Carmack et al., 2016). Therefore, understanding the changes in the Arctic Ocean and their causes is of crucial importance.
In this paper we will explore the changes of the large-scale circulation in the upper Arctic Ocean in the 2000s and 2010s by reconciling recent studies with the support of numerical simulations and observations. Because the changes in this period are unprecedented for at least the past century and possibly are indicators of the emergence of respective climate change signals (Rudels, 2015; Timmermans and Marshall, 2020), a synthesized view of the main drivers for these changes is required for better understanding and predicting the new Arctic. We will review the literature and then use a set of numerical simulations to explain the Arctic Ocean circulation changes. Our focus in this paper will be on the large-scale upper ocean circulation in the Arctic deep basin area and the Arctic Atlantification in the eastern Eurasian Basin.
1.1 Upper Arctic Ocean Circulation
On average, the Arctic Ocean has a strong halocline because it receives freshwater from river runoff, net precipitation minus evaporation and Pacific Water which has relatively low salinity (Serreze et al., 2006; Haine et al., 2015; Carmack et al., 2016). The surface water in the Arctic Ocean is much fresher than that in the North Atlantic, where it is exported to, so it is traditionally called Arctic freshwater, and the amount of freshwater is often quantified with the so-called freshwater content (FWC). The major upper ocean circulation in the Arctic basin, basically the surface geostrophic flow, is mainly determined by the halosteric contribution to sea surface height because the temperature-induced ocean density change is relatively small (Carmack, 2007). Understanding the changes in the large-scale circulation in the upper Arctic Ocean is thus by large equivalent to understanding the changes in the spatial distribution and magnitude of the FWC in the Arctic Ocean (see Figure S1 in the Supplementary Material). The FWC at each location can be computed as
where S is ocean salinity, Sref is a reference salinity and D is the isohaline depth of S = Sref. FWC (in meter) represents the amount of freshwater contained in the ocean column. It is equivalent to the amount of pure (zero-salinity) water required to be taken out from an ocean column so that the mean salinity in the ocean column is changed to the reference salinity. In this paper Sref = 34.8 psu if not otherwise stated. Integrating FWC laterally in a region we can get the volumetric FWC (with a unit km3).
1.1.1 Temporal-Mean Circulation in the Upper Arctic Ocean
The mean circulation in the upper Arctic Ocean is characterized by the anticyclonic Beaufort Gyre circulation over the Canada Basin and the Transpolar Drift Stream connecting the Eurasian coast with Fram Strait (Figure 1). These dominant ocean circulation features are sustained by the atmospheric mean circulation in the Arctic (Figure 2). The high sea level pressure over the Canada Basin, called Beaufort High (Figure 2A), induces negative curl of winds centered over the Beaufort Gyre region (Figure 2B), which can drive Ekman convergence and downwelling in the ocean. The spatial pattern of sea ice drift largely reflects the spatial pattern of winds, with an anticyclonic gyre circulation in the Canada Basin and the Transpolar Drift Stream across the central Arctic (as demonstrated by the satellite-derived sea ice drift in Figure 2C). The convergence of surface freshwater to the central Canada Basin, which is driven by the Beaufort High and mediated by sea ice, leads to a sea surface height dome associated with large FWC, thus causing the anticyclonic Beaufort Gyre circulation (as demonstrated by satellite-derived surface geostrophic current in Figure 2D). As the temporal-mean wind curl over the Canada Basin is negative, some processes that impede the deepening of isohaline and freshwater accumulation must exist, including eddy fluxes (e.g., Manucharyan and Spall, 2016; Yang et al., 2016) and the negative feedback of ice-ocean stress coupling (e.g., Kwok and Morison, 2017; Meneghello et al., 2018b; Wang et al., 2019a, see Section 1.2). The sea surface height gradient between the Canada and Eurasian basins sustains the oceanic Transpolar Drift Stream. Averaged over the 2010s, a cyclonic circulation confined to the Nansen Basin is only marginally recognizable (Figure 2D).
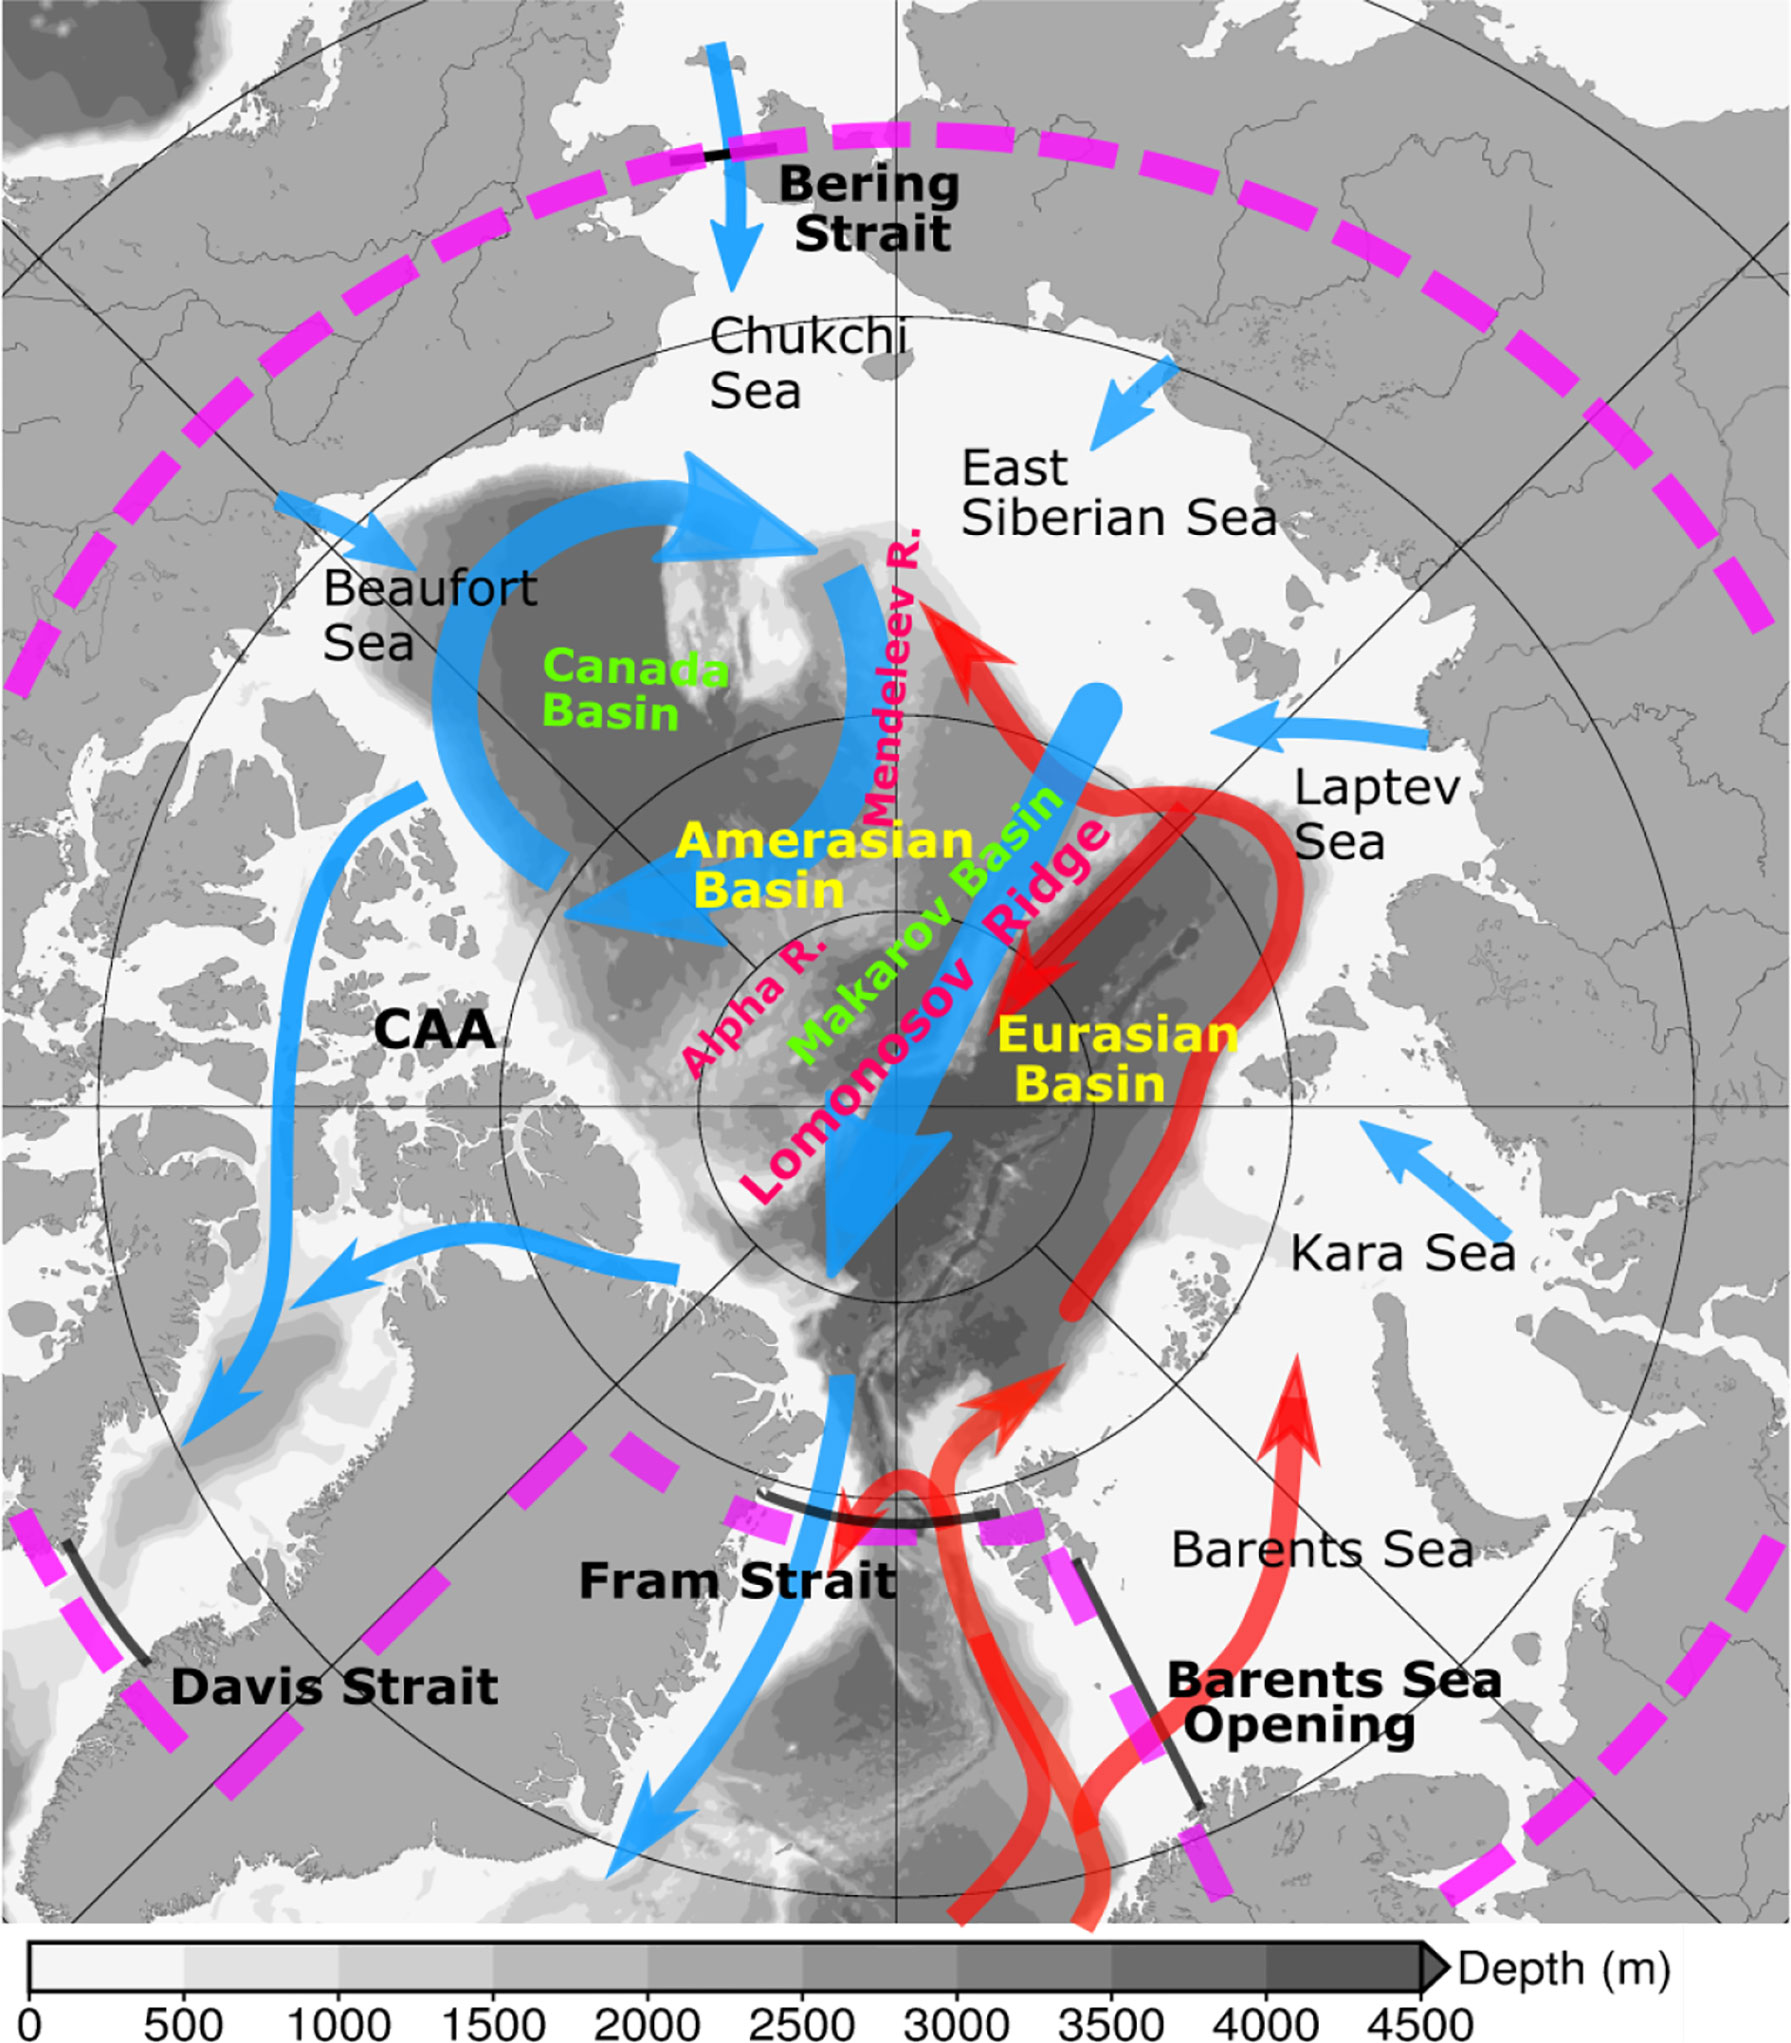
Figure 1 Schematic of Arctic Ocean circulation. The blue arrows denote upper ocean circulation, and red arrows denote Atlantic Water circulation. The background gray color denotes bottom bathymetry. The magenta dashed line indicates the Arctic boundary for replacing atmospheric forcing in the sensitivity experiments used in Section 3.
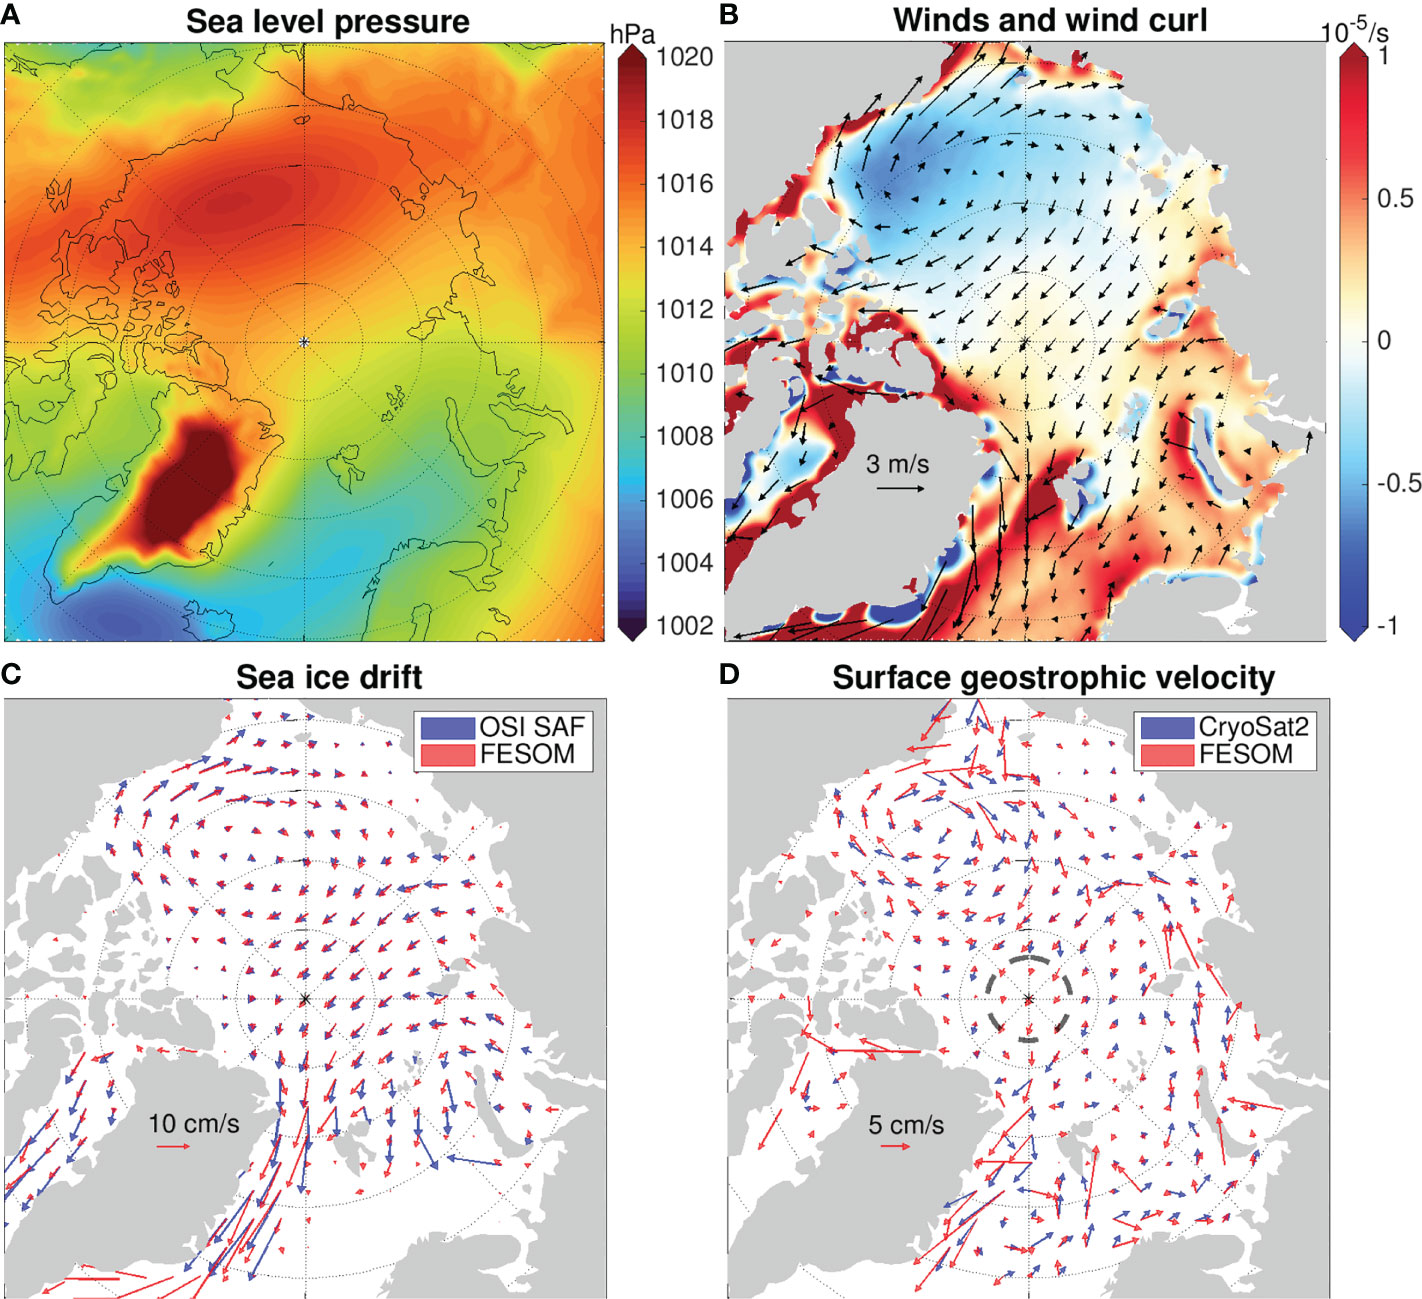
Figure 2 Mean circulation of atmosphere, sea ice and upper ocean in the Arctic. (A) Annual mean sea level pressure (SLP). (B) Annual mean winds [vectors] and curl of winds [color]. The SLP and winds are taken from JRA55-do reanalysis (Tsujino et al., 2018) and averaged over the period 2000–2019. (C) Winter (October to April) sea ice drift for 2010–2019 from the OSI-SAF observation (Lavergne et al., 2010) and FESOM simulation. (D) Annual mean ocean surface geostrophic velocity for 2011–2019 estimated from the dynamic ocean topography observed by CryoSat2 (Armitage et al., 2016; Armitage et al., 2017) and simulated in FESOM. The dashed circle close to the North Pole indicates the area where the CryoSat2-derived dynamic ocean topography is not available.
1.1.2 Changes in Transpolar Drift and Cyclonic Circulation
The Transpolar Drift Stream, which roughly indicates the location of the front between Pacific- and Atlantic-derived waters, varies on interannual and decadal time scales. The Arctic Oscillation has the strongest impacts on the location of the Transpolar Drift Stream than other major atmospheric modes (Zhang et al., 2003; Condron et al., 2009; Wang, 2021). It is the leading mode of the Arctic large-scale atmospheric circulation and characterized by lower-than-normal Arctic sea level pressure in its positive phase and by higher-than-normal Arctic sea level pressure in its negative phase (Thompson and Wallace, 1998). A strongly positive Arctic Oscillation can shift the Transpolar Drift Stream from its climatological location near the Lomonosov Ridge to the Alpha-Mendeleev Ridge, thus expanding the Eurasian Basin cyclonic circulation and Atlantic-derived water through the Makarov Basin and limiting the spatial extent of the anticyclonic circulation and Pacific-derived water; the location where Eurasian runoff enters the Arctic basin also moves eastwards following the Transpolar Drift Stream. This situation happened in the 1990s as revealed by hydrography observations (Carmack et al., 1995; Morison et al., 1998; Steele and Boyd, 1998; Ekwurzel et al., 2001; McLaughlin et al., 2002) and model simulations (Maslowski et al., 2000), which can be explained by the highest Arctic Oscillation of the longest duration (from 1989 to the mid 1990s) at least for the past six decades (Figure 3A). Dynamically, an eastward shift of the Transpolar Drift Stream is a result of the reduction in the halosteric height (that is, reduction in the liquid FWC) in the Makarov Basin induced by strongly positive Arctic Oscillation (Wang et al., 2021b).
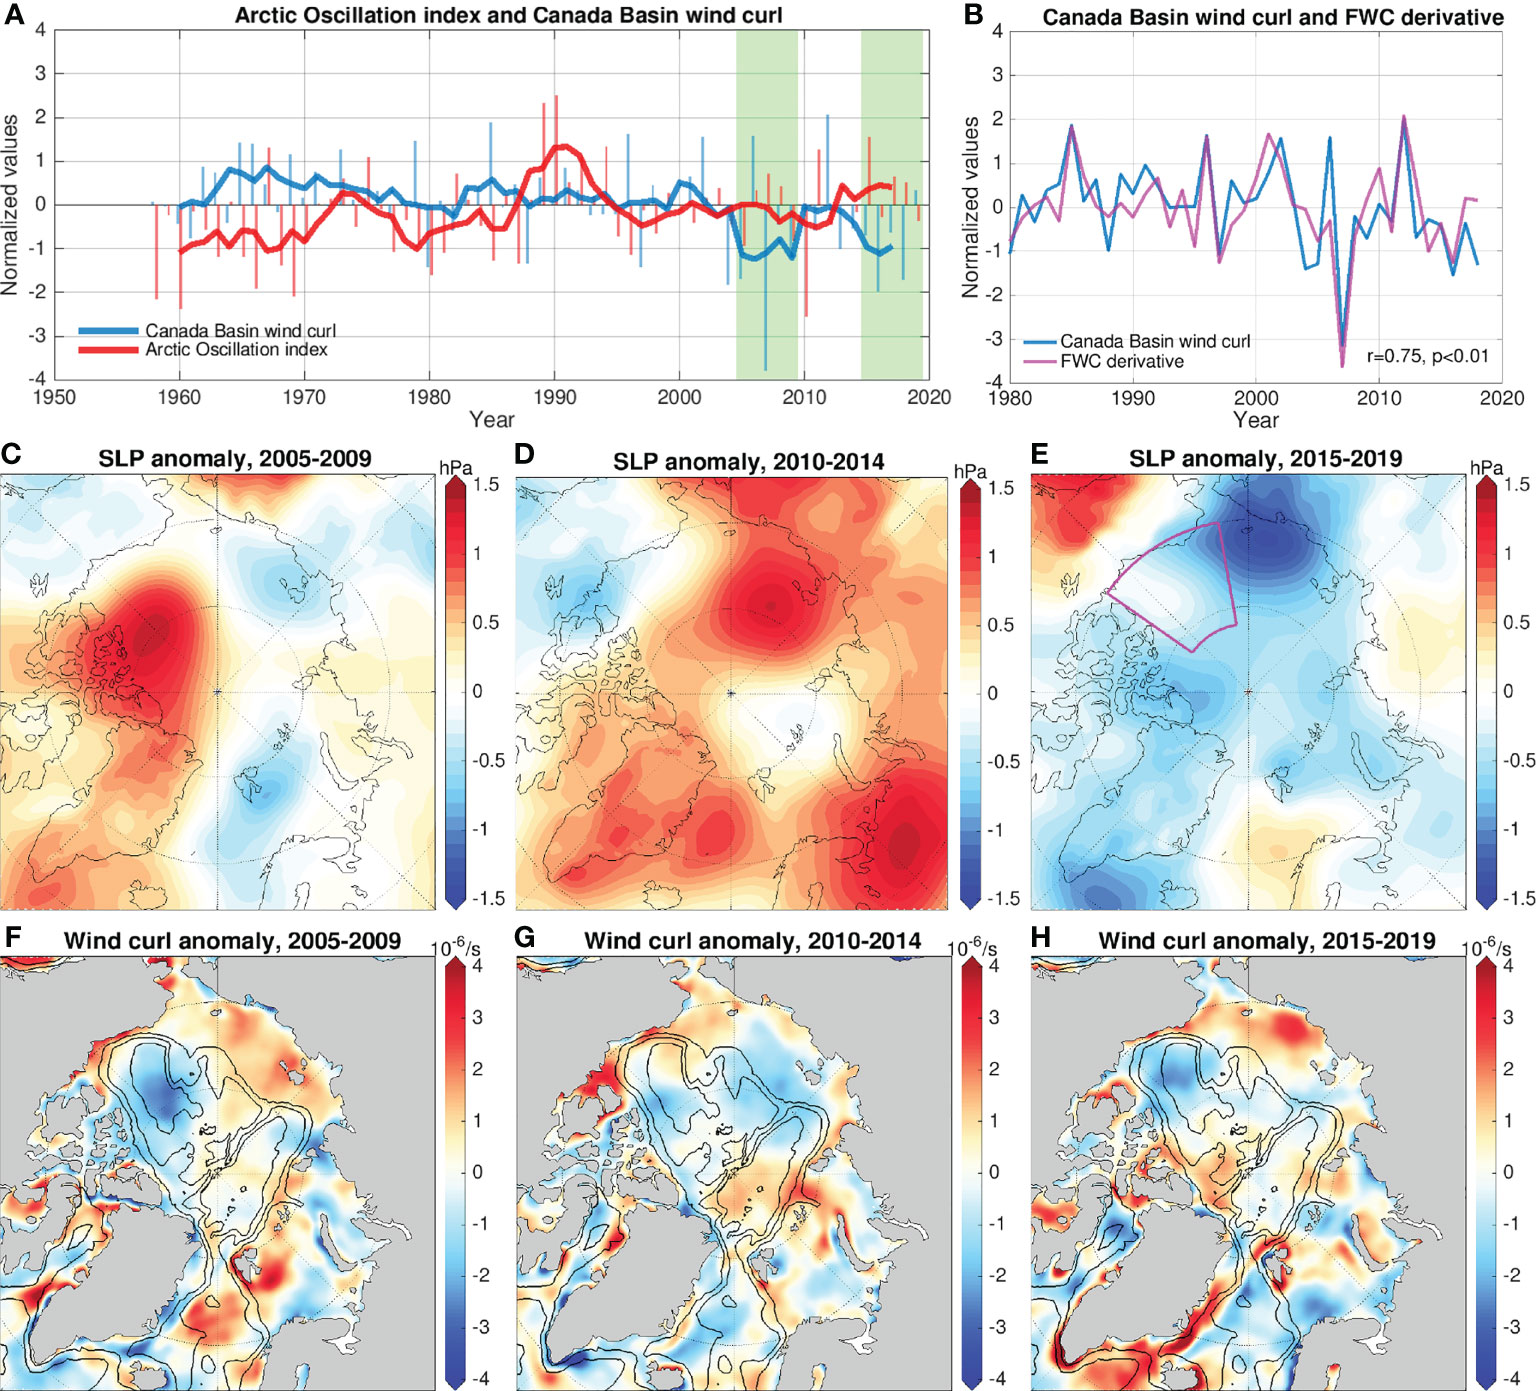
Figure 3 Atmospheric circulation conditions in the 2000s and 2010s. (A) Normalized Arctic Oscillation index (red) and wind curl averaged over the Canada Basin (CB, blue). Annual means are shown with bars and five years running means are shown with solid lines. (B) Normalized wind curl averaged over the CB (blue) and the inversed derivative of freshwater content (FWC) in the CB, indicating that the wind curl is a good indicator of CB FWC changes. (C–E) Sea level pressure (SLP) anomaly relative to the 1980–2019 mean for (C) 2005–2009, (D) 2010–2014 and (E) 2015–2019. (F–H) Wind curl anomaly in the three corresponding periods. The two periods with green background in (A) correspond to (C, F) and (E, H) respectively. In both the periods, the CB is featured with large negative wind curl (A), although the SLP anomalies are very different. The wind curl in (A) is averaged in the region denoted by the magenta box in (E).
Following the weakening of the Arctic Oscillation in the second half of the 1990s, the ocean condition became similar to the pre-1990s climatology after 2000, with the Transpolar Drift Stream moving back to the Lomonosov Ridge as revealed by hydrography and chemical tracer observations (Steele et al., 2004; Morison et al., 2006; Alkire et al., 2007). For the time period after 2000, there were no published observations indicating abnormal changes in the location of the Transpolar Drift Stream and water front as observed in the 1990s. The Arctic Oscillation, however, did induce strong interannual variability in the upper ocean circulation in the Makarov Basin in this period as revealed by satellite-observed dynamic ocean topography (Morison et al., 2021). We note that “dynamic ocean topography”, a terminology often used in the satellite-observation community, refers to sea surface height (relative to the Earth’s geoid) which is often used in the ocean modeling community.
1.1.3 Changes in Anticyclonic Circulation
The anticyclonic circulation of the Beaufort Gyre, which is a large freshwater reservoir, has strengthened considerably along with the increase in its FWC in the 2000s and 2010s. The wind curl averaged over the Canada Basin is a very good predictor for changes in the FWC in the Beaufort Gyre region (Figure 3B, see also Wang et al., 2018a). The wind curl had a record low in 2007 (Figure 3A), consistent with the timing of the rapid increase in the Beaufort Gyre FWC as observed in both satellite-derived altimetry data and ocean hydrography (McPhee et al., 2009; Proshutinsky et al., 2009; Giles et al., 2012; Morison et al., 2012; Krishfield et al., 2014). The accumulation of freshwater is also manifested in the deepening of the isohalines in the upper ocean of the central Canada Basin (Zhang et al., 2016; Wang et al., 2018a). In the period 2010–2014, the wind curl over the Canada Basin changed back to a neutral state on average (Figure 3A). After 2014, the wind curl anomaly over the Canada Basin was predominantly negative again (Figure 3A). Thus, as expected, the FWC in the Beaufort Gyre region further increased in this period (Proshutinsky et al., 2019). In total, from 2003 to 2018, the observed FWC in the Beaufort Gyre region increased by 6,400km3, a growth of 40% relative to the climatology in the 1970s (Proshutinsky et al., 2019). Observations also indicated that the sea surface height doming associated with the increase in the FWC in the Canada Basin caused an intensification of the anticyclonic surface geostrophic current, a spin-up of the Beaufort Gyre (McPhee, 2013; Armitage et al., 2017; Armitage et al., 2020).
The wind forcing over the Canada Basin in the early 21st century was unusual compared to the prior few decades. The wind curl over the Canada Basin averaged over 2005–2009 and 2015–2019 was much lower than the long-term mean (Figures 3A, F, H). However, the sea level pressure anomalies in these two periods are quite different. The negative wind curl anomaly in the 2000s was associated with a positive sea level pressure anomaly over the Canada Basin (Figure 3C), while in the 2010s the sea level pressure is close to the climatology over the Canada Basin and lower than the climatology around the Canada Basin (Figure 3E). Therefore, the sea level pressure over the Canada Basin alone cannot serve as a predictor for the evolution of the Beaufort Gyre.
1.1.4 Considering Cyclonic and Anticyclonic Circulation Modes on an Equal Footing
Recently there were a collection of studies focusing on the anticyclonic Beaufort Gyre circulation (Proshutinsky et al., 2020). One reason for the increased attention to the anticyclonic circulation is the relatively higher concentration of in situ observations in the western Arctic Ocean, which also provides a nice testbed for numerical model assessment and intercomparison (Proshutinsky et al., 2020). In addition, the unprecedented changes in the Beaufort Gyre region in the last two decades naturally attracted more attention from the scientific community. Nevertheless, a few recent studies did attempt to understand the Arctic upper ocean circulation with the anticyclonic circulation, Transpolar Drift Stream and cyclonic circulation on an equal footing. Empirical Orthogonal Function (EOF) analysis of sea surface height derived from hydrography and satellite observations reveals that the leading mode (as EOF1) of the interannual variability corresponds to a cyclonic mode (sea surface height depression) centered over the Russian side of the Arctic deep basin (Morison et al., 2021). When just considering the short period of satellite altimeter observations (2004–2019), an anticyclonic mode (sea surface height dome) centered over the Canada Basin appears in the second EOF and explains a significant part of the total sea surface height variance (Morison et al., 2021).
Model studies also demonstrate that the Arctic Oscillation can influence the strength and spatial extent of the cyclonic ocean circulation, which further impacts the location of the Transpolar Drift Stream and the spatial extent of the anticyclonic circulation (Wang et al., 2021b). The strength of the Beaufort High mainly influences the anticyclonic circulation, and it can influence the location of the Transpolar Drift Stream only when the Arctic Oscillation has been strongly positive for a long time so that the Transpolar Drift Stream has been shifted close to the Alpha-Mendeleev Ridge (Wang et al., 2021b). The cyclonic and anticyclonic ocean circulations are not isolated from each other by the Transpolar Drift Stream, but possibly interconnected through mesoscale eddies as suggested by both observations and idealized model simulations (Timmermans et al., 2008; Spall, 2020).
1.2 Impact of Sea Ice on the Upper Ocean Circulation
When understanding the wind-driven circulation in the Arctic Ocean, the impact of sea ice should be considered. Sea ice mediates momentum transfer from the atmosphere to the ocean due to its seasonally strong internal stress (Hibler, 1979; Martin et al., 2014). As sea ice declines, the response of the upper ocean circulation to winds can be strengthened due to enhancement in ocean surface stress (Davis et al., 2014; Wang et al., 2021c). Through dedicated numerical simulations it was found that the sea ice decline in the 2000s dramatically modified the ocean surface stress so that more surface freshwater was shifted toward the converging Beaufort Gyre region, thus contemporarily reducing the amount of freshwater in the Eurasian and Makarov basins (Wang et al., 2019b). The rapid freshwater accumulation in the Beaufort Gyre region in the 2000s can be attributed to both sea ice meltwater and other freshwater components that were made more available to the Beaufort Gyre by sea ice decline (Wang et al., 2018a), including Mackenzie River runoff and Pacific Water (Proshutinsky et al., 2019). That is, Arctic sea ice decline has amplified the effect of wind forcing on freshwater distribution and upper ocean circulation, which is clearly demonstrated by using numerical simulations in Wang (2021). Wang (2021) shows that, in comparison to the sea ice condition in the 1980s, the sea ice condition in the 2010s increases the response of the Arctic Ocean to Arctic Oscillation and Beaufort High wind perturbations by up to 50% for integrated FWC and up to about 100% for upper ocean velocity regionally. The nature that the Arctic FWC and upper ocean circulation are dynamically driven by winds implies their predictability (Marshall et al., 2017; Johnson et al., 2018; Cornish et al., 2020). However, because Arctic sea ice is in a rapid decline, a quantitative prediction of Arctic FWC will very possibly fail without considering the changes in sea ice (Wang et al., 2018a).
Another important aspect of the dynamic impact of sea ice on the Arctic Ocean is its stabilization effect on the Beaufort Gyre. Previously transport by mesoscale eddies was thought to be the main process that stabilizes the Beaufort Gyre FWC and circulation (Manucharyan and Spall, 2016; Yang et al., 2016; Armitage et al., 2020). Recent studies suggested that the status of the Beaufort Gyre FWC and circulation should be viewed as a result of three-way balance: wind stress, eddy flux and the so-called ice-ocean governor (Meneghello et al., 2018a; Doddridge et al., 2019; Wang et al., 2019a; Meneghello et al., 2020). The ocean surface stress that drives the Ekman convergence of surface freshwater in the Beaufort Gyre region depends on the velocity difference between sea ice and surface ocean. A decrease (an increase) in FWC in the Beaufort Gyre results in a decrease (an increase) in the anticyclonic ocean surface geostrophic current, which induces an anticyclonic (a cyclonic) anomaly in the ocean surface stress; The latter functions to stabilize the Beaufort Gyre, as its effect is to oppose the further decrease (increase) of the Beaufort Gyre FWC. This negative feedback relies on large sea ice internal stress in wintertime (Kwok and Morison, 2017) and is dubbed ice-ocean governor (Meneghello et al., 2018a). Its stabilization effect on the Beaufort Gyre was clearly demonstrated using observations (Dewey et al., 2018; Meneghello et al., 2018b; Zhong et al., 2018) and realistic Arctic Ocean modeling (Wang et al., 2019a).
1.3 Atlantic Water Layer in the Arctic Ocean
Below the Arctic halocline the modified Atlantic Water circulates cyclonically in the intermediate depth range along topography slopes (Woodgate et al., 2001; Karcher and Oberhuber, 2002; Schauer et al., 2002; Gerdes et al., 2003). The focus of this paper is on the upper Arctic Ocean, but the halocline changes in the eastern Eurasian Basin are closely linked to the changes in the underlying Atlantic Water layer in the process of Arctic Atlantification. Therefore, we briefly allude to Atlantic Water inflow related to our topic here. See Timmermans and Marshall (2020) for a recent comprehensive review on Arctic Ocean circulation dynamics including the Atlantic Water layer.
Warm, saline Atlantic Water enters the Arctic Ocean through both the Barents Sea Opening and Fram Strait (Figure 1). The ocean heat transport through the Barents Sea Opening is higher, but most of the ocean heat in this branch is lost to the atmosphere within the Barents Sea in the climate condition of the 20th century (Smedsrud et al., 2013), while this situation will change with time in a future warming climate (Årthun and Eldevik, 2016; Shu et al., 2021). In the 2000s and 2010s, a warming trend together with an increase in volume transport in the West Spitzbergen Current (WSC) was found in observations (Beszczynska-Moeller et al., 2012; von Appen et al., 2016; Wang et al., 2020, also see Figure S2) and model simulations (Wang et al., 2020). Different mechanisms could drive the Atlantic Water inflow, including wind-driven mixing interior to the Arctic that draws water in and winds exterior to the Arctic that drive water into the Arctic following bathymetry contours (Timmermans and Marshall, 2020). Ascertaining what drives the Atlantic Water inflow remains to be a subject of active research, but model simulations have proved that Arctic sea ice decline has caused an enhanced ocean heat transport through Fram Strait and considerably contributed to the warming of the Atlantic Water layer in the eastern Eurasian Basin (Wang et al., 2020).
The Atlantic Water heat can relatively easily reach sea ice and produce ice-free areas around Svalbard in winter (Ivanov et al., 2016; Athanase et al., 2020). However, along the cyclonic circulation pathway of Atlantic Water towards the eastern Eurasian Basin and Amerasian Basin, the halocline thickens and strengthens, thus insulating the mixed layer and sea ice from the warm Atlantic Water layer (Rudels et al., 1996). Observations reveal that the halocline in the eastern Eurasian Basin has experienced remarkable changes in the early 21st century, becoming weaker along with an uplift of the underlying Atlantic Water layer (Polyakov et al., 2018; Polyakov et al., 2020b). It is unclear if this phenomenon of Atlantification in the eastern Eurasian Basin represents a typical trend under climate change, or a decadal variability that was possibly enhanced by climate change. At least the analysis of paleoceanographic records has indicated that the aforementioned ocean warming in the Fram Strait in the early 21st century is unprecedented for the past 800 years (Tesi et al., 2021).
Changes in Arctic sea surface height and the associated barotropic geostrophic circulation can influence the Atlantic Water layer circulation located beneath the halocline on different time scales as illustrated by model simulations (Lique et al., 2015; Hinrichs et al., 2021). Observations of chemical tracers indicate that both the strong cyclonic surface circulation in the mid-1990s associated with the strongly positive Arctic Oscillation and the strengthened anticyclonic Beaufort Gyre circulation in the past two decades left an imprint on the Atlantic Water layer circulation (e.g., Karcher et al., 2012; Smith et al., 2021). Therefore, observing and understanding the upper ocean circulation are also crucial for interpreting the ocean circulation changes at depth.
1.4 Paper Outline
Previous studies based on observations and model simulations have significantly improved our understanding of the ocean dynamics in the Arctic Ocean as described above. However, considering the major changes in the large-scale circulation of the upper Arctic Ocean during 2000-2019, the previous studies mostly focused on part of the period or part of the Arctic basin. In this paper we will provide a synthesized view of these changes based on numerical simulations with support of satellite-derived dynamic ocean topography and observed FWC estimates. We will consider interannual, pentadal and decadal time scales with the cyclonic and anticyclonic ocean circulations on an equal footing. The focal aspect will be quantifying how strongly Arctic sea ice decline influences the wind-driven large-scale circulation in the Arctic and the Arctic Atlantification in the eastern Eurasian Basin.
We note that this paper does not cover all aspects of the Arctic Ocean dynamics. Recently some other Arctic Ocean topics have also been reviewed, including ocean circulation dynamics in general (Timmermans and Marshall, 2020), freshwater in the 2010s (Solomon et al., 2021), ocean heat transports in relation to Arctic sea ice (Docquier and Koenigk, 2021; Smedsrud et al., 2022), and Arctic Atlantification and Borealization (Polyakov et al., 2020a; Ingvaldsen et al., 2021).
In Section 2, we present a few idealized wind-perturbation numerical simulations to demonstrate how the ocean responds to Arctic Oscillation and Beaufort High forcing. The results underpin the explanation of the wind-driven circulation changes presented in Section 3. In Section 3 we disentangle the individual role of winds and sea ice decline in driving the upper Arctic Ocean changes. Discussions and summaries are provided in Section 4 and 5, respectively.
2 Arctic Ocean Response to Idealized Wind Perturbations
2.1 Experimental Setup
To underpin the discussion in the next section, results from three wind-perturbation numerical simulations will be presented here to demonstrate how the Arctic Ocean circulation responds to different wind forcing. The employed model is the global Finite Element Sea-ice Ocean Model (FESOM, Wang et al., 2014; Danilov et al., 2015; Wang et al., 2018b) with 4.5 km horizontal resolution in the Arctic Ocean. First, the model was spun up for 20 years starting from the PHC3 hydrography climatology (Steele et al., 2001). The wind forcing used to drive the model is the normal year (1-year repeating) version of the Coordinated Ocean-ice Reference Experiments Phase II (CORE2) atmospheric forcing (Large and Yeager, 2009). Then four simulations were conducted for 5 years each, using either the same wind forcing as during the spin-up (as a control run) or modified winds with some idealized perturbations added to this forcing (wind-perturbation experiments). All these experiments started from the same ocean and sea ice conditions obtained from the spinup simulation.
The winds in the three wind-perturbation experiments were perturbed with wind anomalies representing the cases of the positive Beaufort High anomaly, positive phase of the Arctic Oscillation and their combination, respectively (Table 1). Figures 4A–C show the corresponding wind anomalies and associated sea level pressure anomalies. The Beaufort High perturbation (Figure 4A) is the same as that used by Marshall et al. (2017) and Wang et al. (2019a), and its magnitude is similar to the anomaly of the Beaufort High in 2007, when it was abnormally high. The magnitude of the Arctic Oscillation perturbation (Figure 4B) is similar to that of the first EOF of the Northern Hemisphere sea level pressure, the Arctic Oscillation pattern. Note that for the purpose to explore the effect of the wind perturbations, other atmospheric forcing fields and the ocean-ice model configurations were kept the same in all the simulations.
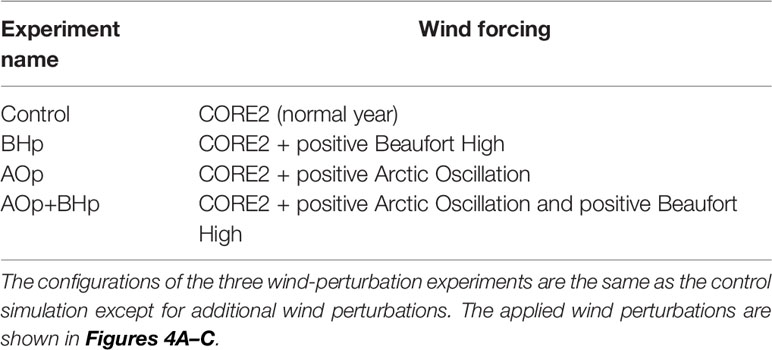
Table 1 List of simulations used in Section 2.
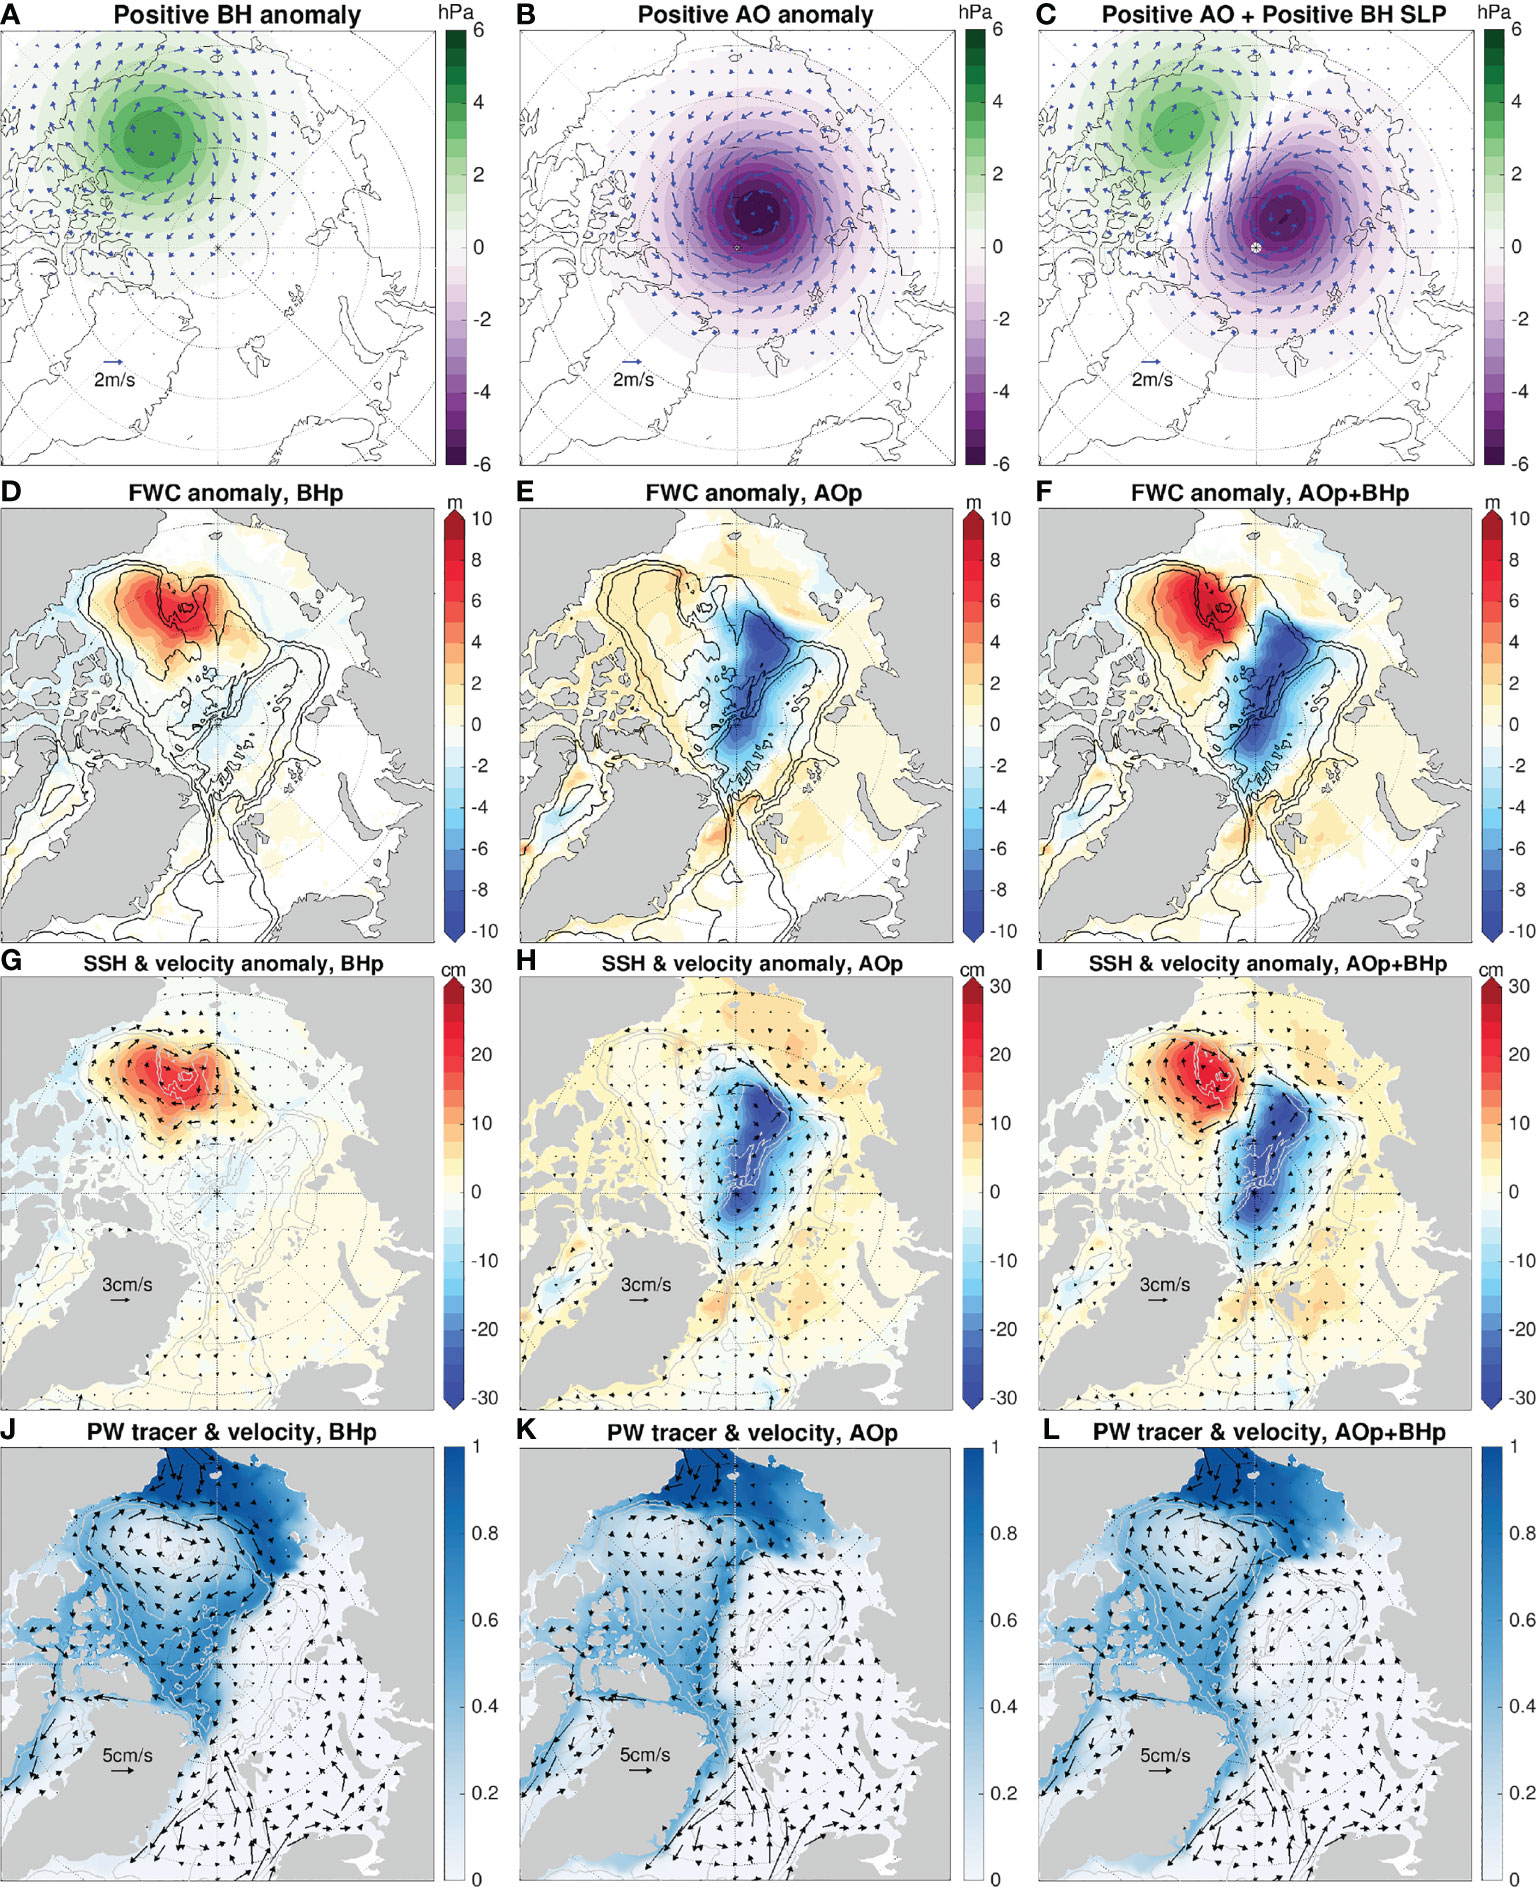
Figure 4 Idealized wind perturbation experiments showing the response of freshwater content (FWC, m), sea surface height (SSH) and upper ocean circulation to winds. (A–C) Sea level pressure [SLP, (color)] and winds [vectors] anomalies representing idealized forcing used in wind perturbation experiments: (A) positive Beaufort High (BH), (B) positive Arctic Oscillation (AO), and (C) positive AO plus positive BH. (D–F) The corresponding FWC anomalies in the last model year. (G–I) The corresponding SSH anomalies [color] and upper 150 m velocity anomalies [vectors]. The anomalies are calculated as the difference between the wind perturbation experiments and the control simulation. (J–L) The corresponding Pacific Water (PW) passive tracer concentration [color] and ocean velocity [vectors] averaged over the upper 150 m in the last model year; The control simulation is shown in Figure S3 for reference.
2.2 Results
The difference of the model results between the wind-perturbation experiments and the control run reveals the response of the ocean to the wind perturbations. The positive Beaufort High forcing causes the Beaufort Gyre to accumulate freshwater, with some minor reduction in the FWC around the Beaufort Gyre (Figure 4D). Therefore, the total FWC integrated over the Arctic Ocean is increased. The doming of the sea surface height resembles the spatial pattern of the FWC anomaly, resulting in a spin-up of the anticyclonic Beaufort Gyre (Figure 4G).
With the positive-phase Arctic Oscillation forcing, the Makarov Basin and part of the Eurasian Basin are drained, but the surrounding regions, including the Beaufort Sea, have some freshwater gain (Figure 4E). The magnitudes of the FWC increase in these surrounding regions are relatively small, so the total FWC integrated over the Arctic Ocean is reduced under positive Arctic Oscillation (not shown). In accordance with the drop of the FWC in the Makarov and Eurasian basins, the sea surface height depression leads to a cyclonic circulation anomaly centered over the Makarov Basin (Figure 4H). The effect of the positive Arctic Oscillation demonstrated here is consistent with established understanding based on observations and models (Maslowski et al., 2000; Zhang et al., 2003; Steele et al., 2004; Condron et al., 2009; Morison et al., 2021). We note that the increase of the sea surface height over the Eurasian continental shelf is unproportionally large when considering the FWC anomaly (cf. Figures 4E, H). This indicates that the change of the sea surface height over the shallow shelf is more determined by mass change (reflected in bottom pressure change), rather than the halosteric effect which plays a major role in the deep basin area. In this paper our focus is on the ocean dynamics in the deep basin area.
In the third experiment both the positive Beaufort High and positive-phase Arctic Oscillation perturbations are enforced, which is motivated by the atmospheric conditions in the second half of the 2000s and 2010s (Figure 3A). In these periods, the Arctic Oscillation was positive in some of the years, though on average not as strong as in the period from 1989 to the mid 1990s. In this experiment, the changes in FWC and sea surface height are roughly the sum of the two cases when only one of the forcing is applied (Figures 4F, I). In particular, the inflation of the Beaufort Gyre is slightly stronger, but spatially confined on its northwest side, compared with the case when positive Arctic Oscillation forcing is absent (Figures 4D, G). On the other hand, it is also clear that the ocean convergence driven by the positive Beaufort High forcing has a stronger impact on the Beaufort Gyre. That is, the positive Arctic Oscillation alone could facilitate the accumulation of freshwater in the Beaufort Gyre by discharging freshwater from the Makarov Basin, but an efficient spin-up of the Beaufort Gyre needs ocean convergence in the Canada Basin.
The impact of the wind forcing on the upper ocean circulation is illustrated with a dye tracer injected in the Bering Strait representing Pacific Water and the velocity averaged over the upper 150 m (Figures 4J–L). In comparison with the control simulation (Figure S3), the positive Beaufort High forcing mainly strengthens the anticyclonic Beaufort Gyre circulation without significant effect on the location of the Transpolar Drift Stream (Figure 4J). The positive Arctic Oscillation forcing can shift the Transpolar Drift Stream and the front between Pacific- and Atlantic-derived waters from the Lomonosov Ridge to the Alpha-Mendeleev Ridge, thus expanding the cyclonic circulation to the Makarov Basin and reducing the spatial extent of the anticyclonic circulation (Figure 4K). Although the exact location of the Transpolar Drift Stream depends on the magnitude and duration of the Arctic Oscillation forcing, the ocean response revealed here clearly represents the ocean changes under positive Arctic Oscillation as observed in the 1990s (Carmack et al., 1995; Morison et al., 1998; Steele and Boyd, 1998; McLaughlin et al., 2002). The responses of the Pacific Water circulation and spatial distribution to the Beaufort High and Arctic Oscillation forcing presented here are also consistent with other model simulations (Aksenov et al., 2016; Hu et al., 2019). In the presence of both the positive Beaufort High and Arctic Oscillation, the location of the Transpolar Drift Stream is the result of the competition between the two atmospheric modes (Figure 4L).
We note that the applied wind perturbations also lead to changes in sea ice thickness (that is, solid freshwater), sea ice concentration and drift (Figure S4). Both the ocean circulation and sea ice state respond to the wind perturbations as a coupled system with interaction between them, which is investigated in Wang et al. (2021a) and not the focus of the current study. The results shown in this section will serve as a reference when understanding the role of winds in impacting the upper Arctic Ocean changes during 2000–2019 in the next section.
3 Circulation Changes in the Early 21ST Century
3.1 Experimental Setup
In this section a historical (hindcast) model simulation and two sensitivity experiments (Table 2), synthesized with some related observations, will be used to explain the upper Arctic Ocean changes in the 2000s and 2010s. FESOM on the same model grid as used in the last section is employed here. The historical simulation was driven by the JRA55-do v.1.4 atmospheric data sets (Tsujino et al., 2018) from 1958 to 2019. To disentangle the role of Arctic sea ice decline, we conducted a sensitivity experiment in which the historical thermal forcing fields (near-surface air temperature, shortwave and longwave radiation fluxes) over the Arctic Ocean were replaced with climatological forcing. The one-year-long climatological thermal forcing was obtained by averaging the JRA55-do data from 1970 to 1999 for each time step (3-hourly). This experiment used the same historical winds as in the historical simulation, and is called wind_vari run hereafter. In the other sensitivity experiment, the thermal forcing was the same as in the historical simulation, but winds were kept the same every year. We followed the recommendation of Stewart et al. (2020) to use the one-year-long winds compiled from 1st May 1990 to 30th April 1991 of JRA55-do, which represent a neutral state of the atmospheric circulation from a global perspective. This experiment is called thermal_vari simulation. Both the sensitivity simulations were conducted from 2001 to 2019 starting from the end state of the historical simulation in 2000. The Arctic domain over which the atmospheric forcing was replaced in the sensitivity simulations is indicated by the magenta lines in Figure 1. These simulations are similar to those used in Wang et al. (2018a; 2019b; 2020), but with the simulations extended to 2019 to cover the full length of the past two decades.
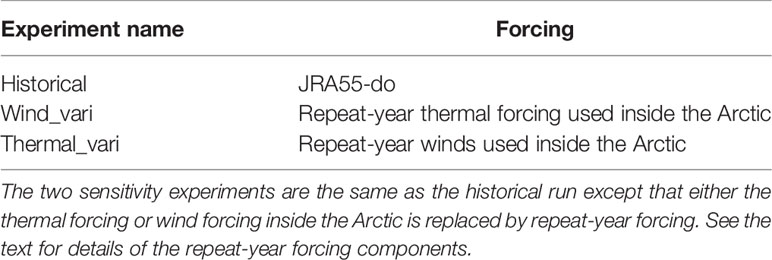
Table 2 List of simulations used in Section 3.
The historical simulation has a reasonable performance in reproducing the observed mean sea ice drift, concentration and thickness (Figure 2C and Figures S5, 6), mean upper ocean circulation (Figure 2D), the pentadal changes in sea surface height (Figures 6D–I), the variation of the liquid FWC (Figure 7), the trend and variability of Arctic sea ice volume (Figure 8A) and the trend and variability of Atlantic Water temperature in Fram Strait (Figure S2). Despite some noticeable model biases, the simulation can serve as a basis for discussing the Arctic Ocean changes in the past two decades. We will first use the historical simulation to illustrate the upper ocean circulation changes in relation to winds, and then use the sensitivity simulations to demonstrate the extremely important role of Arctic sea ice decline in setting the changes in the upper Arctic Ocean circulation and in enhancing the Arctic Atlantification of the eastern Eurasian Basin.
3.2 Circulation Changes in Relation to Wind Forcing
3.2.1 EOF Analysis of Annual Sea Surface Height
To investigate the variability of the upper ocean circulation in the Arctic Ocean, we performed an EOF analysis of the annual sea surface height in the Arctic Ocean for the period 2004–2019 following that by Morison et al. (2021) for satellite-derived dynamic ocean topography for the same period. Although the period is too short for analyzing the Arctic Ocean variability representing the long-term climatology condition, this analysis allows us to identify major circulation modes and the amount of variance they explain in the period considered. Here we will first show the results from the historical simulation. In Section 3.3 we will explore how sea ice decline influences the circulation modes revealed by the EOF analysis.
The leading EOF (EOF1) of the annual sea surface height in the Arctic Ocean for 2004–2019 from the historical simulation shows negative values in the Makarov and Eurasian basins and positive values in the surrounding area including continental shelves and the Beaufort Sea (Figure 5A). This mode resembles the spatial pattern of the ocean response to the positive Arctic Oscillation perturbation in the idealized simulation (Figure 4H), and explains 45% of the total variance. However, there is a clear difference in the spatial patterns between EOF1 (Figure 5A) and the ocean response to the positive Arctic Oscillation perturbation (Figure 4H) in the Eurasian Basin. EOF2 shows positive values in the Beaufort Gyre region and negative values in the eastern Eurasian Basin and over the Siberian shelf (Figure 5B). It explains 21% of the total variance. The strongly positive values in the Beaufort Gyre region in EOF2 indicate that this mode largely represents the ocean changes driven by the Beaufort High (see Figure 4G). However, the negative values over the wide Siberian shelf in EOF2 do not represent the ocean response to the Beaufort High forcing (as shown by the wind-perturbation experiments in Section 2).
Figure 5 EOFs and principal components of annual sea surface height (SSH). (A, B) The first two SSH EOFs and (C) their corresponding principal components for the 2004–2019 period of the historical simulation. (D–F) The same as (A–C), but for the wind_vari simulation.
Our result is consistent with the EOF analysis based on satellite-derived dynamic ocean topography described by Morison et al. (2021) for the physical interpretation of the two modes. First, the major variability of the Arctic upper ocean circulation on the interannual time scale is driven by the Arctic Oscillation and manifested by a mode of cyclonic circulation centered over the Russian side of the deep basin. Second, the variability driven by the Beaufort High is also important but less prominent in terms of explained variance. Despite the major consistency, there are some differences in the details of the EOFs and the corresponding principal component time series (Figure 5C) between our model simulation and the satellite-derived dynamic ocean topography described by Morison et al. (2021). This could be attributed to model biases and the smaller spatial and temporal data coverage used in observational analysis (only for the deep basin area and springtime) as well. There are also differences in details between the EOFs and the spatial patterns of the ocean response to Arctic Oscillation and Beaufort High forcing obtained using wind-perturbation experiments (cf. Figures 4G, H, 5A, B). This implies that the EOF analysis does not fully separate the impacts of other wind variability or distinguish the effect of sea ice changes. The latter is our focus in Section 3.3.
3.2.2 Pentadal to Decadal Changes
In the following we will look into the pentadal changes in FWC and upper ocean circulation for the three periods shown in Figures 3C–H. From 2004 to 2009, the Canada Basin accumulated a large amount of freshwater (Figures 6A, 7D), as also observed in altimetry data and hydrography (McPhee et al., 2009; Proshutinsky et al., 2009; Giles et al., 2012; Morison et al., 2012; Krishfield et al., 2014), in line with the negative wind curl anomaly over the Canada Basin averaged over this period (Figure 3F). The accumulation occurred mainly from 2006 to 2008 (Figure 7D), consistent with the abnormally negative wind curl in 2007 (Figure 3A). The total FWC in the Arctic deep basin area had the largest increase in the period of 2004–2009 for the past two decades (Figure 7A). It can be mainly attributed to the freshwater accumulation in the Amerasian Basin (Figures 7B, C).
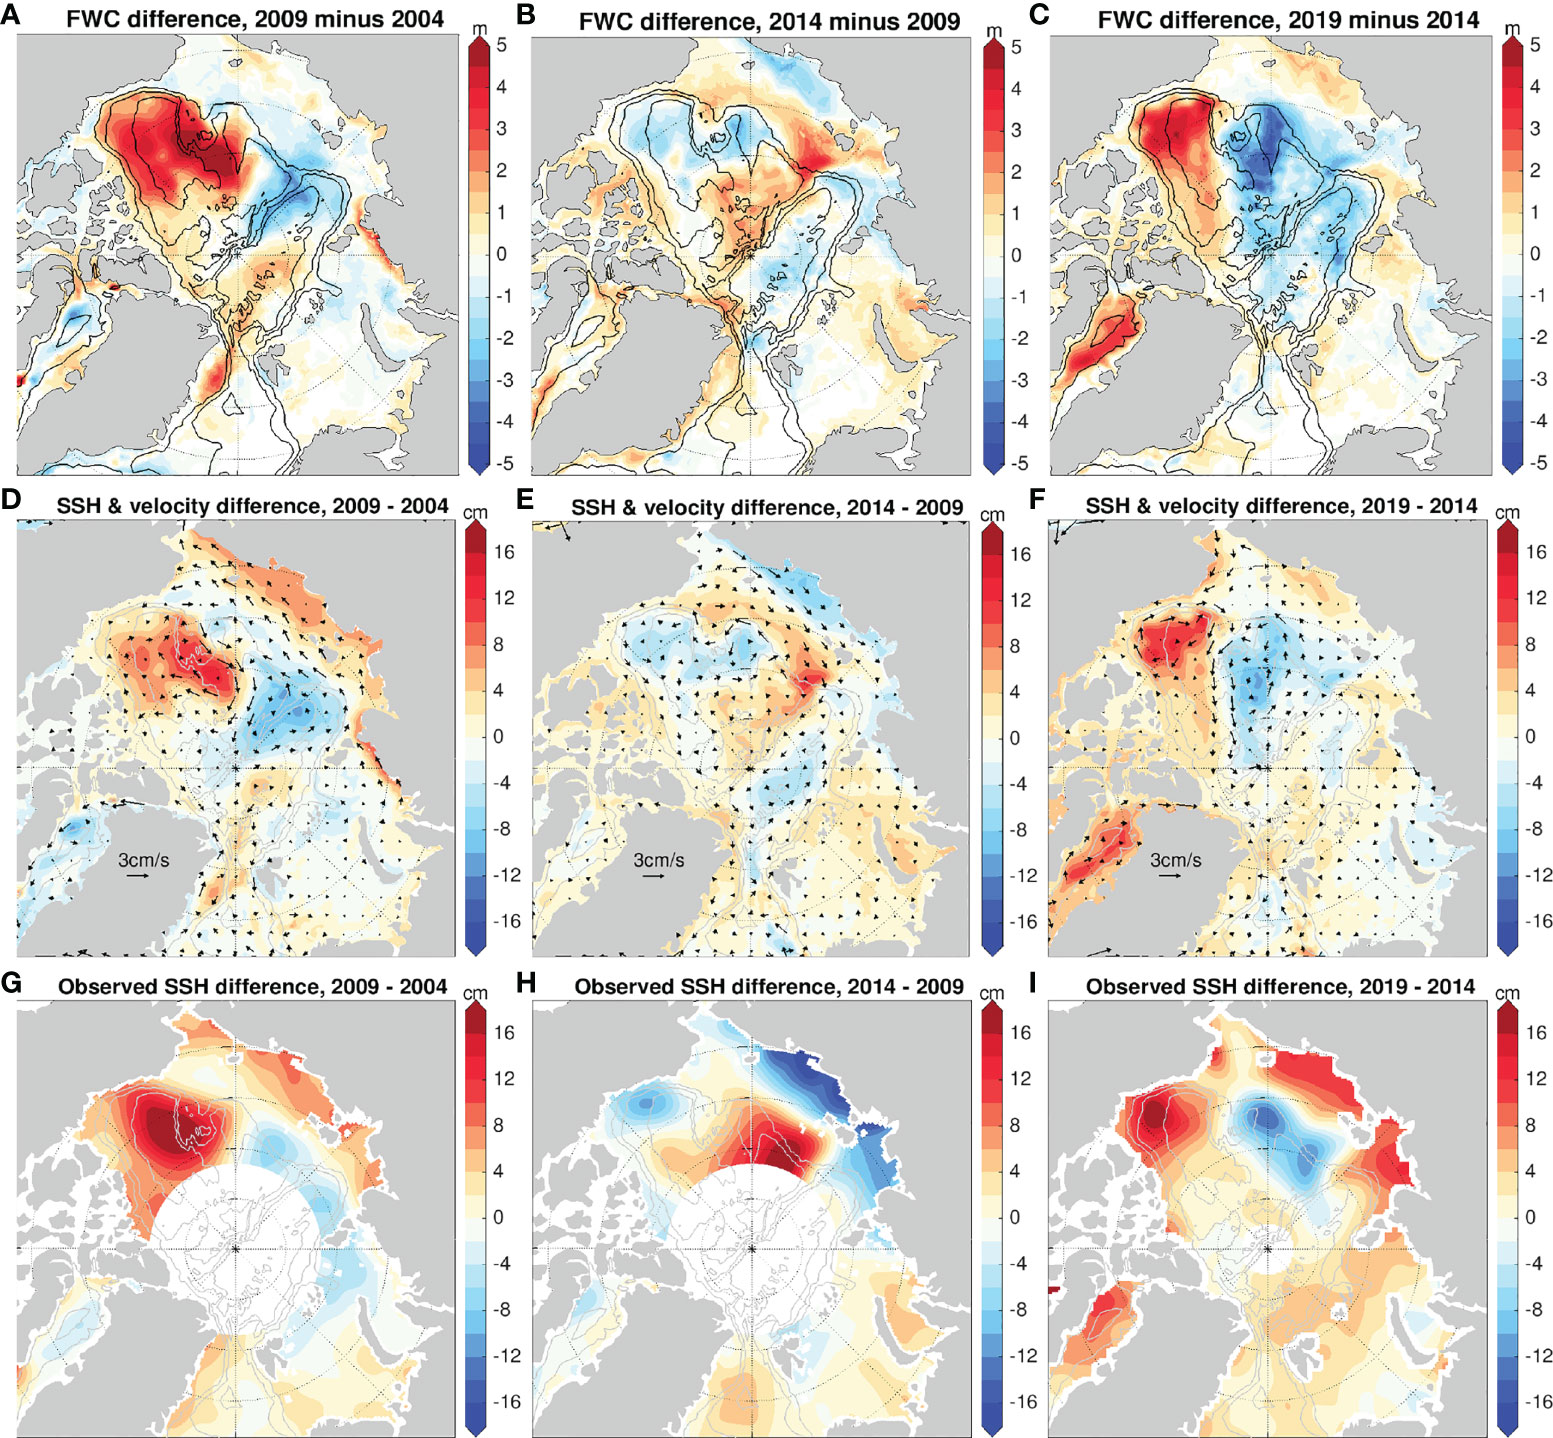
Figure 6 Changes of Arctic freshwater content (FWC, m), sea surface height (SSH) and upper ocean circulation in different periods. Changes in FWC in the FESOM historical simulation: (A) between 2004 and 2009, (B) between 2009 and 2014, and (C) between 2014 and 2019. (D–F) The same as (A–C) respectively, but for SSH [color] and upper 150 m velocity [vectors]. Satellite-derived changes in SSH (Envisat and CryoSat2, Armitage et al., 2016) are shown in (G–I) for the corresponding periods.

Figure 7 Observed and simulated liquid freshwater content (FWC, 103 km3) anomalies in the Arctic Ocean. FWC anomaly in the (A) Arctic deep basin [sum of Amerasian Basin (AB) and Eurasian Basin (EB)], (B) AB, (C) EB, and (D) Beaufort Gyre region in the FESOM historical simulation and observations (Rabe et al., 2014; Proshutinsky et al., 2019). Hydrography-observation uncertainties are indicated with error bars. In (A–C) a reference salinity of 35 was used in the observational estimates (Rabe et al., 2014). This different reference salinity influences the absolute value of FWC, but has minor impacts on the FWC anomaly (not shown).
The accumulation of freshwater in the Beaufort Gyre region in the period of 2004–2009 corresponds to the spin-up of the Beaufort Gyre as shown by the model results (Figure 6D) and the satellite-observed dynamic ocean topography (Figure 6G, Armitage et al., 2016). Both the model and observation show a negative difference of sea surface height (cyclonic circulation anomaly) between 2009 and 2004 in the Makarov and Eurasian basins near the Siberian shelf, as a result of FWC reduction in this area (Figure 6A). The magnitude of the sea surface height increase in the Canada Basin is underestimated in the model compared to satellite observations (Figure 6D, G). The simulated total FWC increase in the Beaufort Gyre region is also underestimated compared to the estimate from hydrography observations, but it is still within the uncertainty range of observations (Figure 7D).
In the second period from 2009 to 2014, both the Beaufort High and Arctic Oscillation are close to neutral states on average, although strong interannual variability exists (Figure 3A). There is a positive sea level pressure (negative wind curl) anomaly centered over the outer shelf of the East Siberian Sea (Figure 3D, G), which does not characterize either of the two major modes considered here. With the Beaufort High relaxed to the neutral state, the FWC in the Beaufort Gyre region tended to level off (Figures 6B, 7D), and the strongest interannual change occurred in 2013 following the very positive wind curl anomaly in 2012 (Figure 3A). The FWC increased in the Makarov Basin and over the outer shelf of the East Siberian Sea (Figure 6B), consistent with the mean negative wind curl mentioned above. The observation shows a FWC growth in the Amerasian Basin in this period, but this is not simulated in the model (Figure 7B). One possible reason could be that the model has too low sensitivity to this wind forcing anomaly as indicated by the underestimation of the sea surface height doming in the Makarov Basin (cf. Figures 6E, H).
In the period 2014–2019, the unusual sea level pressure pattern led to negative wind curl anomalies in the southern part of the Canada Basin (Figures 3E, H). Consistent with the wind forcing, the Beaufort Gyre continued to inflate as shown by both the observation and model simulation (Figures 7D and 6C). In comparison with the situation in the period 2004–2009, the spin-up of the Beaufort Gyre was more confined to the southern Canada Basin in the period 2014–2019 (compare Figures 6D, G with Figures 6F, I), consistent with the location of the negative wind curl anomalies (Figures 3F, H). The expansion of the Beaufort Gyre in the 2000s was associated with a westward movement of the Beaufort Gyre center (Regan et al., 2019), while the increase of the sea surface height in the southern Canada Basin in the period 2014–2019 was associated with an eastward relaxation of the Beaufort Gyre (Wang, 2021). The Arctic Oscillation is predominantly positive in this period (Figure 3A), but the wind curl is close to neutral in the Makarov Basin (Figure 3H), which could be because other atmospheric variability masks the Arctic Oscillation averaged over this period. Nevertheless, the sea level pressure anomaly pattern implies that the Ekman transport anomaly is directed from the Makarov Basin toward the Beaufort Gyre region (Figure 3E), so the flushing of the Makarov Basin feeds the Canada Basin. The satellite observation indicates a weak sea level drop mainly in the Makarov Basin close to the Siberian shelf break (Figure 6I). The model reproduced this drop, but with a larger area extending to the basin interior (Figure 6F). The model simulation and the satellite observation agree that the cyclonic circulation anomaly is not large enough to shift the Transpolar Drift Stream to be close to the Mendeleev Ridge as exampled by the extreme case in the idealized experiment (Figures 4K, L).
The model simulation and observations consistently show that the upper ocean circulation in the deep basin area varies with wind forcing on interannual to decadal time scales. However, as we will show below, winds alone are far from being sufficient for explaining the observed ocean changes.
3.3 Impact of Sea Ice Decline on Circulation Changes
We will compare the sensitivity experiments with the historical simulation to demonstrate the individual impact of sea ice decline and winds on the upper Arctic Ocean changes in the early 21st century.
The historical simulation reasonably reproduces the sea ice decline as compared with the PIOMAS sea ice volume (Figure 8A, Schweiger et al., 2011). In the wind_vari simulation, the trend of the Arctic sea ice is eliminated, albeit wind-driven variability remains (Figure 8A). The historical simulation has thinner, less compact and more mobile sea ice than the wind_vari simulation (Figure S7). As a result, the ocean surface stress is larger in the historical simulation nearly everywhere in the Arctic basin (Figure 8B). The ocean-ice stress depends on both the sea ice drift and ocean surface velocity, while the ocean surface velocity changes with sea surface height which can be influenced by the ocean surface stress. With such a feedback, it is not surprising that the direction of the ocean surface stress difference between the two simulations does not follow their sea ice drift difference (Figure 8B vs. Figure S7). Averaged over the period 2001–2019, the associated Ekman transport difference between the two simulations (historical minus wind_vari) is directed from the Eurasian continental shelf towards the Eurasian Basin and from the Lomonosov Ridge towards the Makarov Basin (Figure 8C). We will see below that this dynamic impact of the sea ice decline is crucial for determining the FWC spatial distribution, salinity and depth of the halocline, and the upper ocean circulation.
Figure 8 Arctic sea ice decline increases ocean surface stress. (A) Arctic sea ice volume anomaly in different FESOM simulations and in PIOMAS estimate (Schweiger et al., 2011). (B) Difference of ocean surface stress between the historical simulation and wind_vari simulation (the former minus latter) averaged over 2001-2019. The color patch shows the difference of the surface stress magnitude while the arrows indicate the vector difference of the surface stress. (C) The same as (B), but for surface Ekman transport.
The Arctic surface freshwater flux had a significant upward trend in the past two decades, with sea ice melting accounting for about 40% of the trend (Figure 9A). Integrated over the last 20 years, sea ice meltwater accounts for about 70% of the total anomalous surface freshwater (Figure 9B). In the wind_vari simulation, the anomalous sea ice meltwater is eliminated, while other surface freshwater budget terms remain nearly the same as in the historical simulation (Evaporation could be influenced by sea ice coverage, but we found that its change is much smaller than the overall trend of other freshwater fluxes). Therefore, the difference in the surface freshwater flux between the historical and wind_vari simulations is mainly due to the difference in the sea ice thermodynamic growth rate, which is shown in Figure 9C. Positive values indicate that the historical simulation has larger surface freshwater flux into the ocean over most of the area inside the Arctic Ocean.
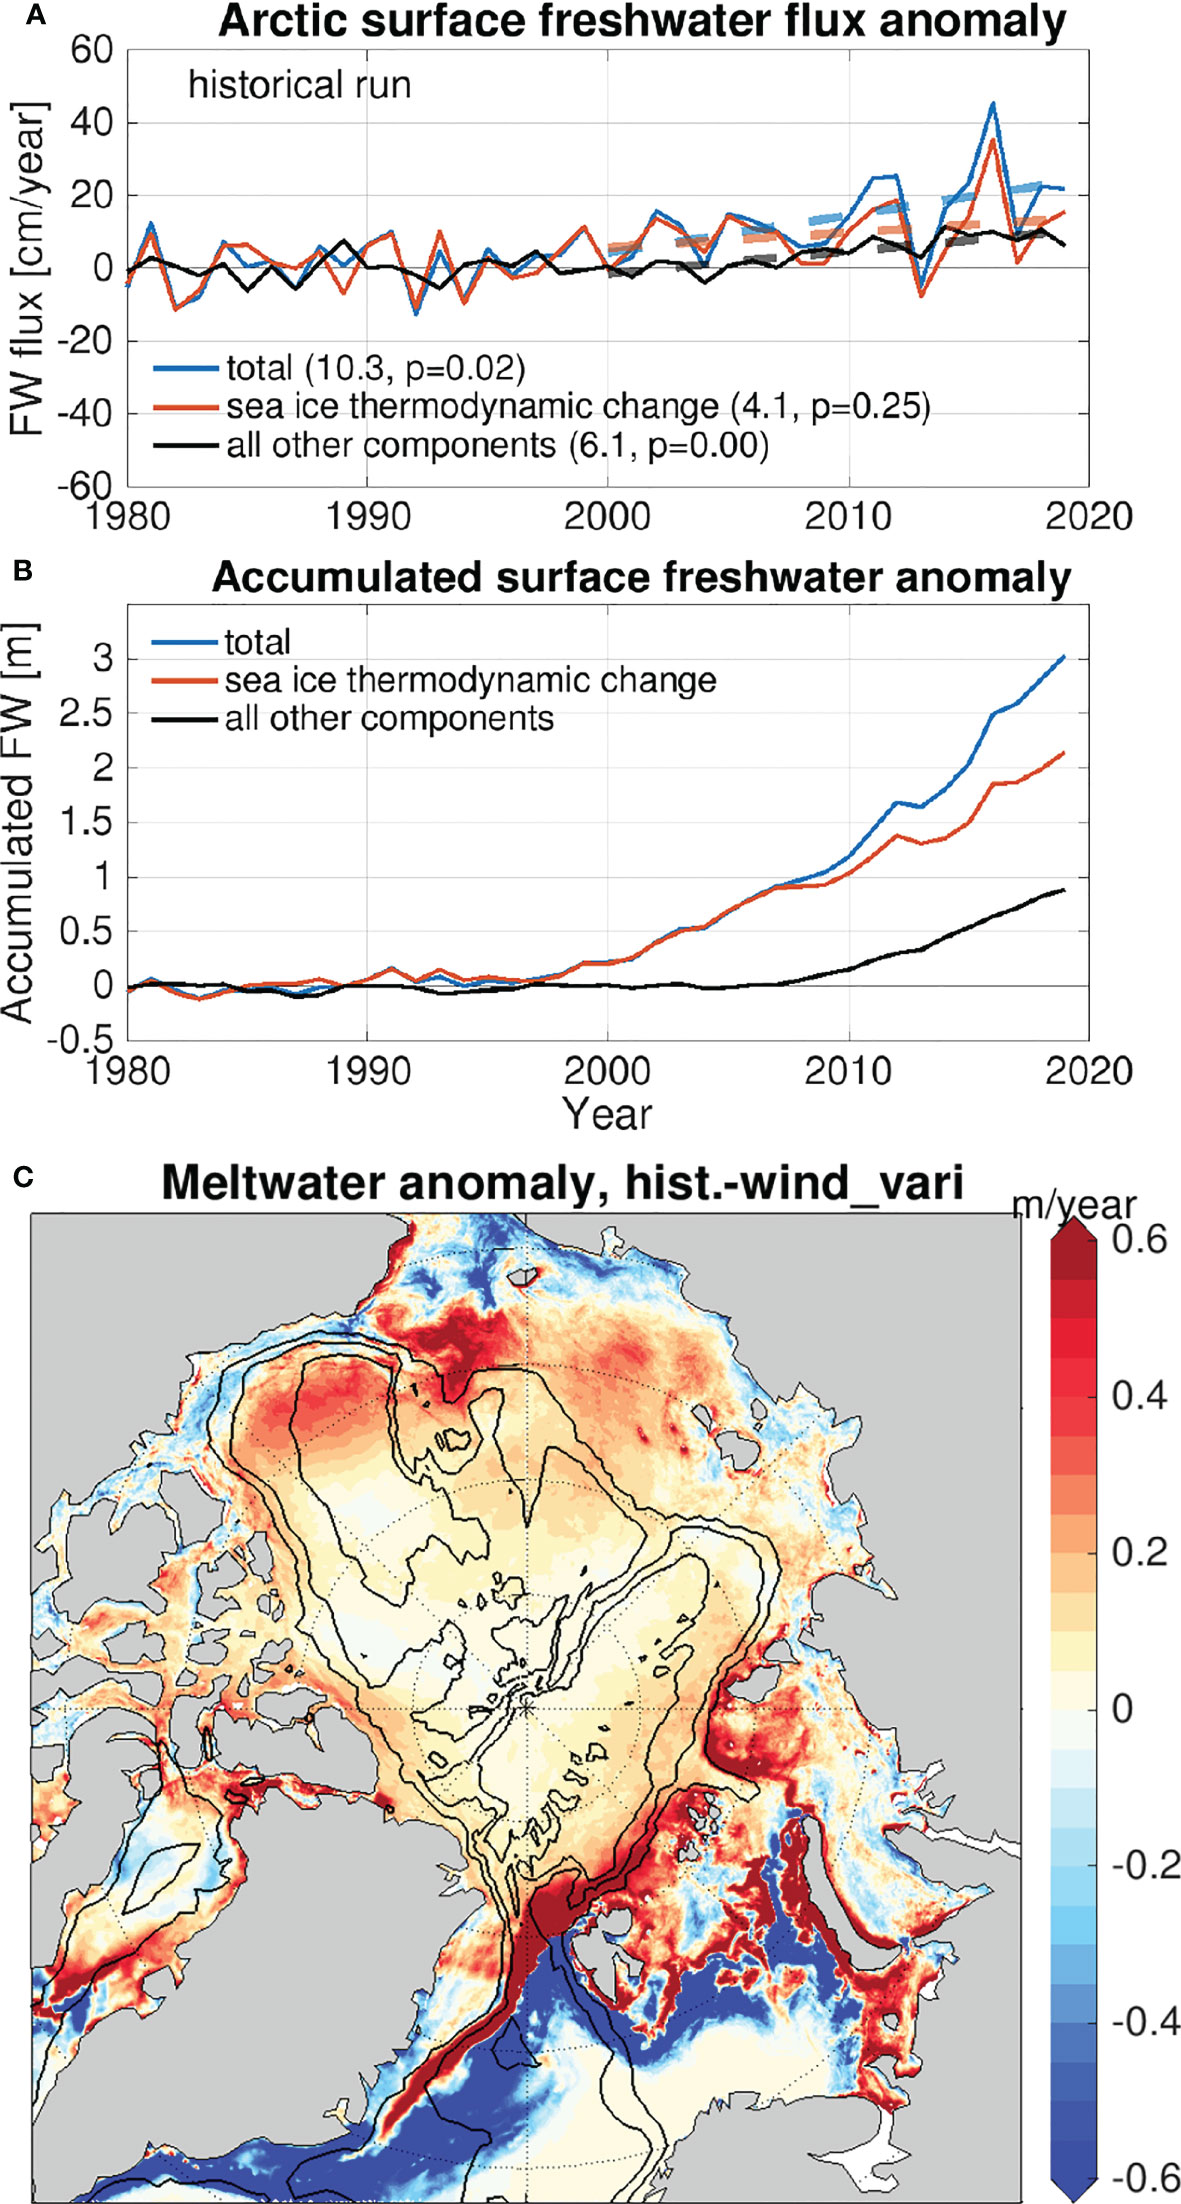
Figure 9 Arctic sea ice decline increases ocean surface freshwater flux. (A) Arctic surface freshwater flux in the historical simulation: total [blue], the component associated with sea ice thermodynamic growth rate [orange], and the sum of all other components [black]. Their anomalies relative to the 1980s mean are shown. Their trends (cm/year/decade) over the last 20 years are indicated in the legend. (B) The accumulated Arctic surface freshwater anomaly in the historical simulation for different components, that is, the accumulative sum of the time series shown in (A). Integrated over the last 20 years, sea ice meltwater accounts for about 70% of the total anomalous surface freshwater. (C) Difference of ocean surface freshwater flux between the historical simulation and wind_vari simulation averaged over 2001–2019, which is mainly due to the difference in sea ice thermodynamic growth rate. Positive values denote freshwater source for the ocean.
3.3.1 EOF Analysis of Annual Sea Surface Height
Interestingly, the EOFs of the Arctic annual sea surface height for 2004–2019 from the wind_vari simulation are very different from those obtained from the historical simulation (Figure 5). Although EOF1 also shows anomalies opposite between the shallow shelf and deep basin area, it does not show a contrast between the Makarov Basin and Beaufort Sea as in the EOF1 of the historical simulation (cf. Figures 5A, D). EOF2 from the wind_vari simulation shows a positive anomaly in the Canada Basin, but it does not well resemble the Beaufort Gyre pattern as obtained from the historical simulation (cf. Figures 5B, E). Therefore, our aforementioned conclusion that EOF1 mainly represents the Arctic Oscillation driven circulation and EOF2 mainly represents the Beaufort Gyre driven circulation is only valid when sea ice decline amplifies these circulations. Without sea ice decline, for the considered period, the first two EOFs do not well distinguish the ocean circulation modes driven by the major atmospheric modes considered here from other ocean variability, although these EOFs contain the signals induced by the major atmospheric modes. The latter is indicated by visible correlation of the corresponding principal component time series between the two simulations, especially for EOF1 (cf. Figures 5C, F).
By using historical hydrography observations, Morison et al. (2021) showed that the EOF2 for the period before 1990 has a dipole pattern with similar magnitudes in the Eurasian Basin and Amerasian Basin, while the active center over the Canada Basin became more prominent than that in the Eurasian Basin in the 21st century. Comparing our two simulations reveals that the increase in the variability in the Canada Basin was fostered by sea ice decline.
3.3.2 Pentadal to Decadal Changes
In the following we will revisit the three periods analyzed in Section 3.2, but for both the historical and wind_vari simulations. In all the periods, the spatial patterns of the FWC changes are similar between the two simulations, but the magnitudes are very different (Figure 10). When sea ice decline is eliminated in the wind_vari simulation, the accumulation of freshwater in the Beaufort Gyre between 2004 and 2009 is only about half that in the historical simulation (Figures 10A, D). The difference between the two simulations (Figure 10G) represents the effect of sea ice decline, consisting of both supplying sea ice meltwater and convergence of other freshwater components (Wang et al., 2018a). The FWC drop in the Makarov and eastern Eurasian basins induced by the sea ice decline (Figure 10G) clearly indicates that sea ice decline not only supplies meltwater, but also modifies ocean surface stress so that surface freshwater is flushed out from these areas.
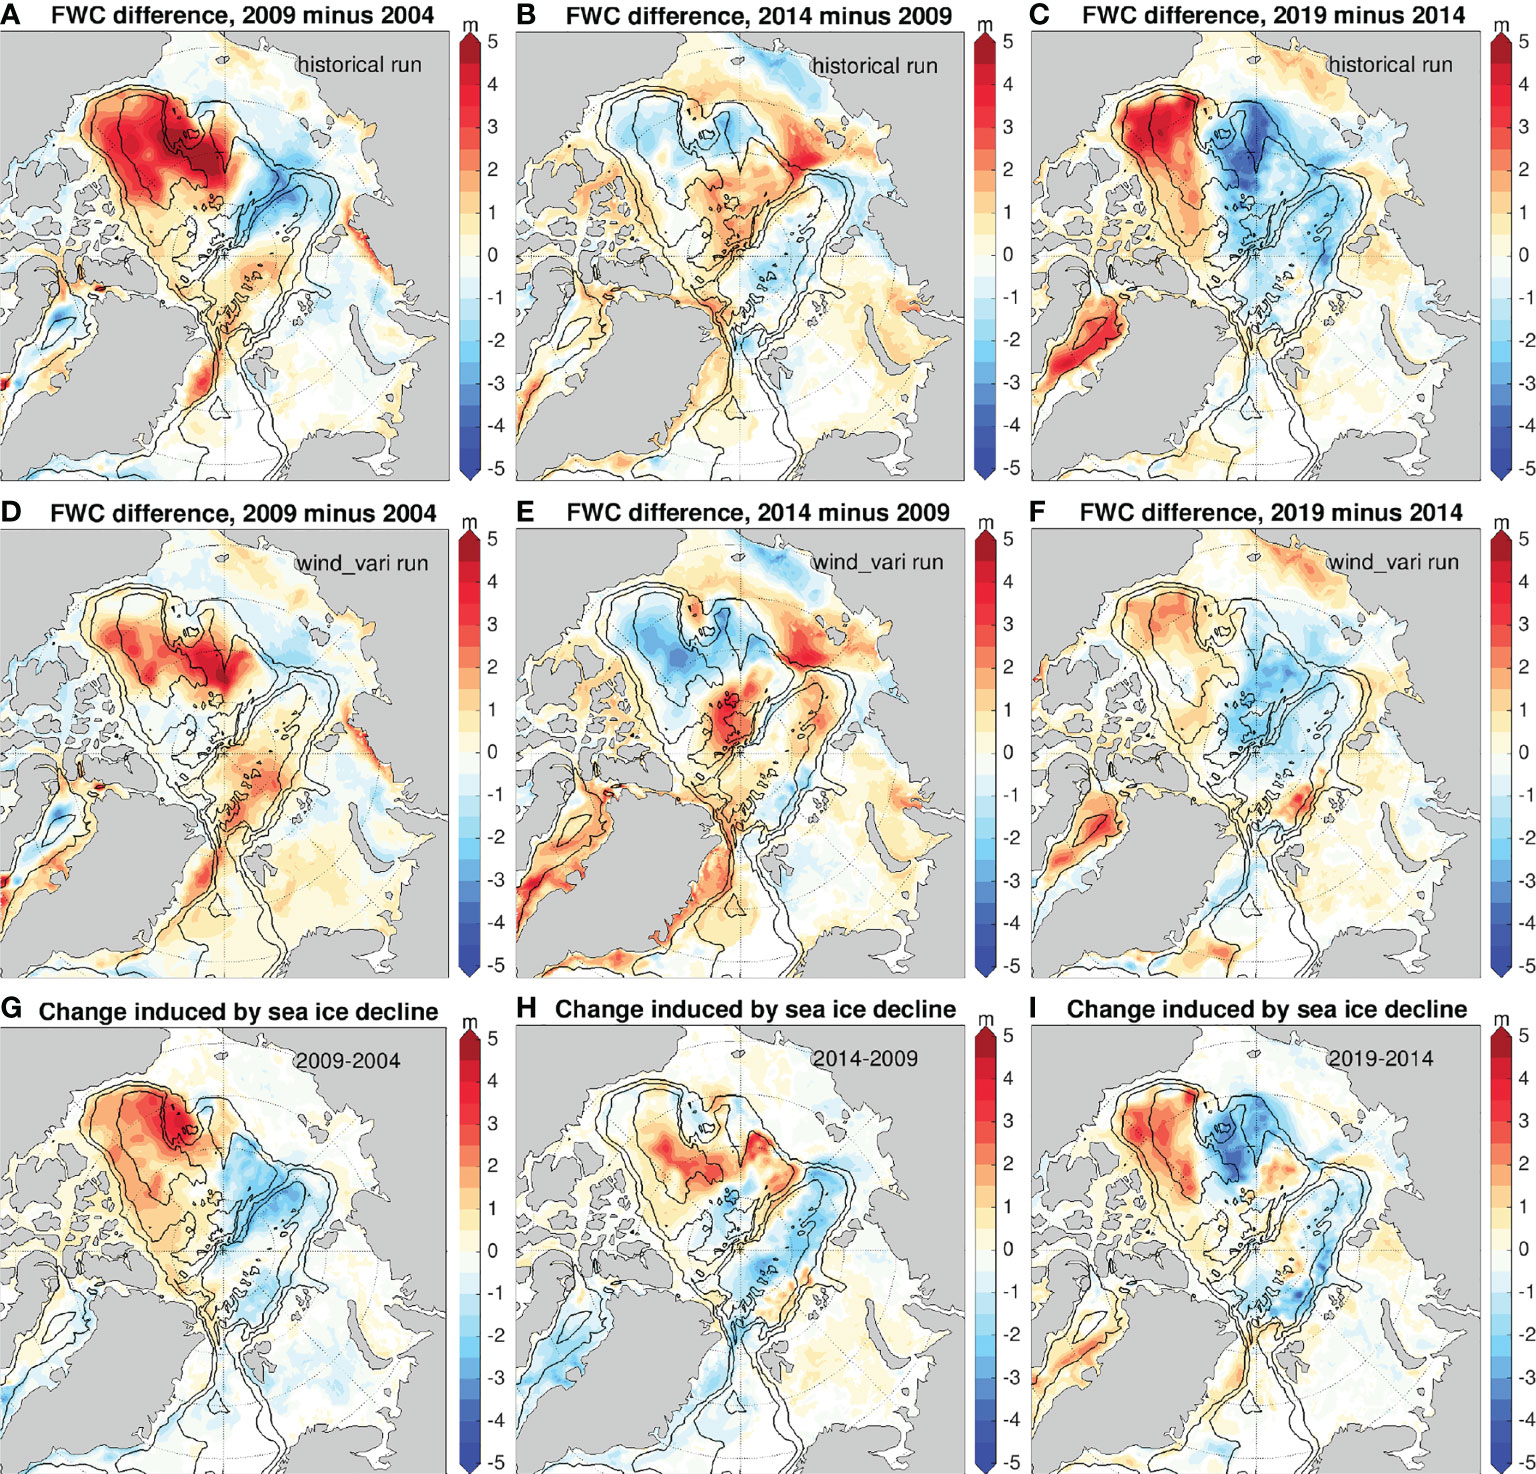
Figure 10 Separated impacts of winds and sea ice decline on freshwater content (FWC, m) on pentadal time scales. (A–C) Changes of FWC in the historical simulation: (A) between 2004 and 2009, (B) between 2009 and 2014, and (C) between 2014 and 2019. (D–F) The same as (A–C), but for the wind_vari simulation. (G–I) The changes due to sea ice decline in the corresponding period, which are calculated as the difference between the historical simulation (first row) and wind_vari simulation (second row).
From 2009 to 2014, the FWC in the Beaufort Gyre region stabilized with a very small decrease in the historical simulation (Figure 10B) and in observations as well (Figure 7D). In contrast, when eliminating sea ice decline in wind_vari, the FWC has a clear drop in the Canada Basin in this period (Figure 10E). Relative to the condition in the period 2004–2009, the wind curl over the Canada Basin is higher (less negative) in the period 2009–2014 (Figure 3A), which should allow the Beaufort Gyre to deflate. The stabilization of the Beaufort Gyre in this period is thus sustained by sea ice meltwater. The sea ice decline also has an effect to decrease FWC in the Eurasian Basin and increase FWC in the Makarov Basin (Figure 10H). The FWC drop in the Eurasian Basin cannot be explained by the increase of surface freshwater flux (Figure 9C), so it should be due to water mass spatial redistribution associated with modification of ocean surface stress by sea ice decline (Figures 8B, C).
In the period 2014–2019, the wind_vari simulation also simulates a FWC rise in the southern Canada Basin (Figure 10F) as a response to the negative wind curl anomaly (Figure 3H). However, the rise is much lower than in the historical simulation (Figure 10C). The sea ice decline induces a dipole pattern in the FWC change (Figure 10I), indicating enhanced flushing of freshwater from the western Canada Basin towards the Beaufort Gyre, an effect on Beaufort Gyre inflation in addition to meltwater supply. Similar to other periods, the sea ice decline has an overall effect to reduce FWC in the Eurasian Basin.
The total change of the FWC over the three periods considered above in the historical simulation is shown in Figure 11A. It is characterized by the large rise in the Canada Basin and the drop in the eastern Eurasian Basin and along the shelf break of the East Siberian Sea. Without sea ice decline, the magnitude of the FWC rise in the Canada Basin is much lower (Figure 11B), less than one third of that in the historical simulation. And the FWC drop in the eastern Eurasian Basin is also absent. In the thermal_vari simulation, in which the sea ice decline resembles the historical simulation (Figure 8A), the spatial pattern of the FWC change has even less similarity to the historical simulation (cf. Figures 11A, C). In this simulation, the wind forcing as indicated by the associated sea level pressure anomaly in Figure 11D was repeatedly applied, so the FWC change reflects the joint effect of sea ice decline and this particular wind forcing. That is, with an arbitrary wind forcing different from the historical one, the same sea ice decline may not produce decadal FWC changes as large as the observed. Therefore, it is the sea ice decline and the particular Arctic winds in the early 21st century that jointly set the upper ocean changes in terms of FWC and surface geostrophic currents.
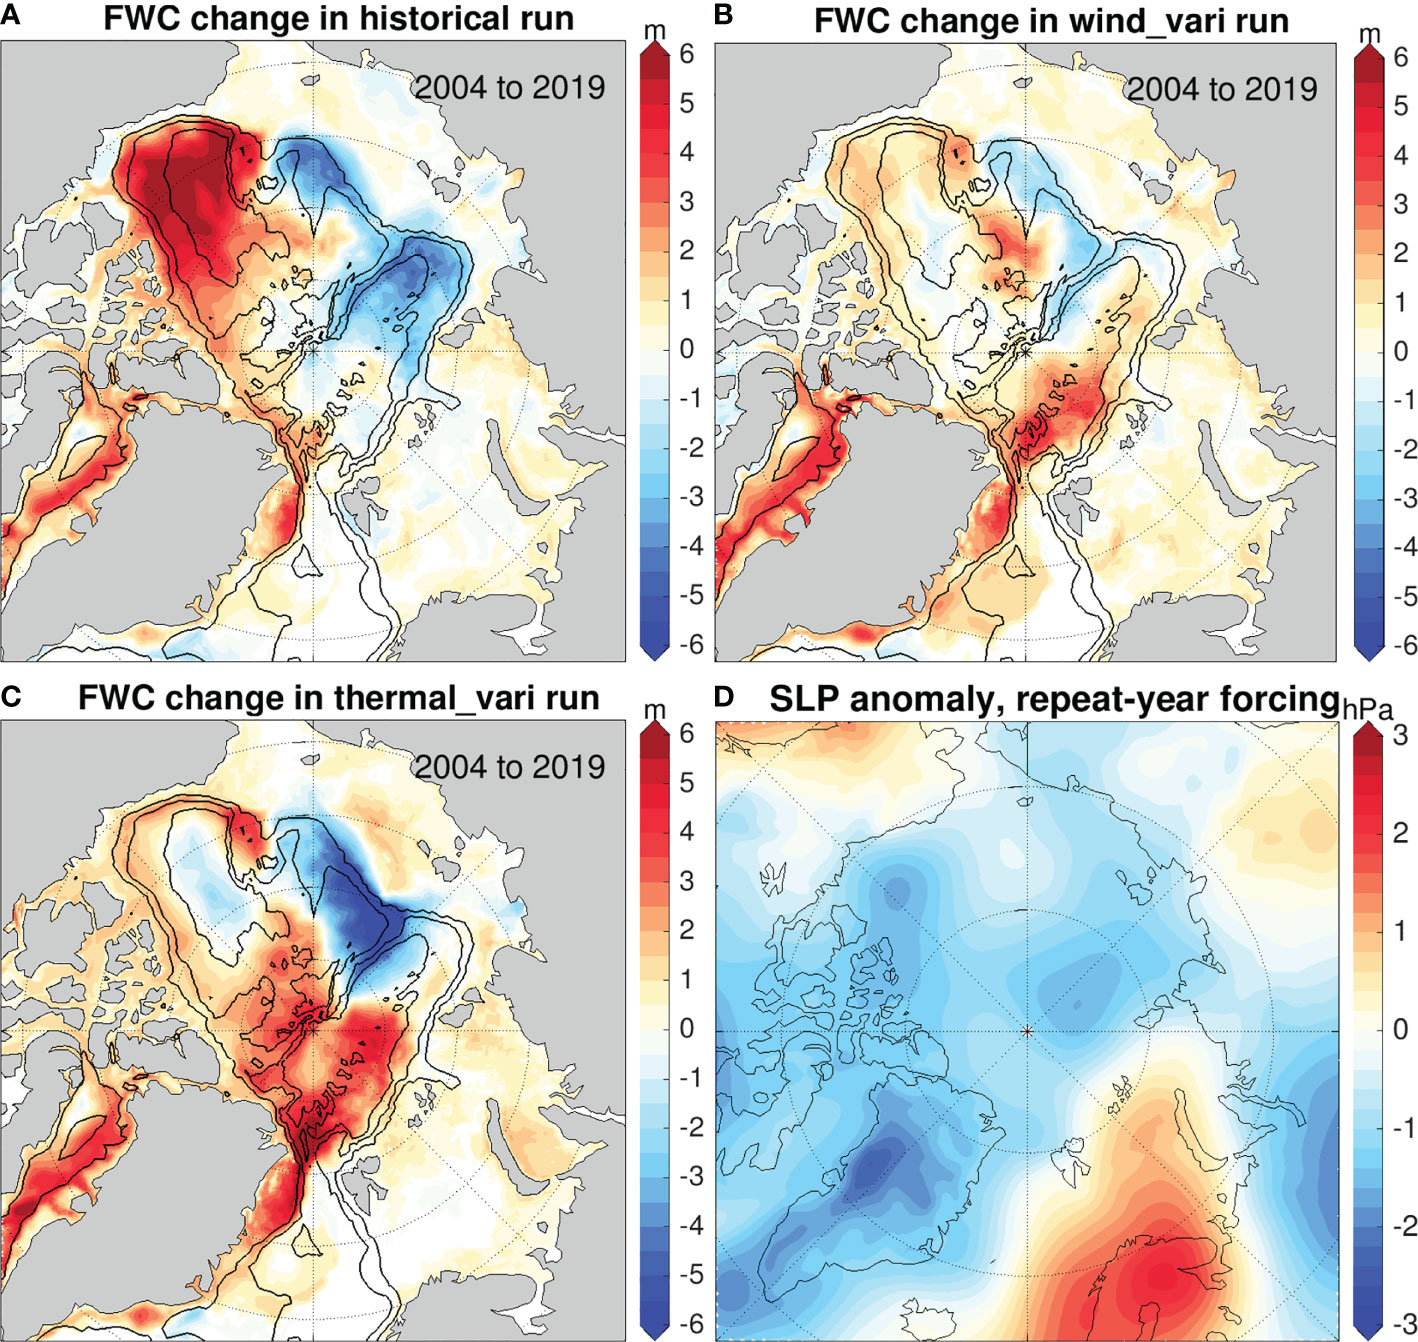
Figure 11 The unusual winds and sea ice decline jointly drove the freshwater content change in the early 21st century. (A) Change in freshwater content (FWC, m) from 2004 to 2019 in the historical simulation. (B) The same as (A), but in the wind_vari simulation. (C) The same as (A), but for the thermal_vari simulation. (D) The annual mean sea level pressure (SLP) anomaly in the repeat-year forcing relative to the 1980–2019 mean SLP of the reanalysis data; Winds from this forcing are used in the thermal_vari simulation. This figure shows that the spatial pattern of Arctic Ocean FWC will become very different without either of the two controlling factors (unusual winds and sea ice decline).
Although other components of the surface freshwater flux (river runoff plus net precipitation) also increased in the last decade (Figures 9A, B), their contribution to the overall FWC and circulation changes is relatively small, because the wind_vari simulation, which retained the increase of these freshwater components, only produced small FWC changes (Figure 11B).
3.3.3 Comment on Ice-Ocean Governor
A comment on the role of ice-ocean governor (Dewey et al., 2018; Meneghello et al., 2018b; Zhong et al., 2018; Doddridge et al., 2019; Wang et al., 2019a) for the Beaufort Gyre is due here. It was found that the Ekman pumping velocity averaged over the whole Beaufort Gyre region is nearly the same between the historical simulation and the simulation with sea ice decline eliminated (Wang et al., 2018a). First, this leads to the conclusion that the sea ice decline enhances the inflation of the Beaufort Gyre by increasing the availability of freshwater (both meltwater and other freshwater components), not mainly by increasing Ekman downwelling inside the Beaufort Gyre region (Wang et al., 2018a). Second, this nicely proves the presence of the ice-ocean governor. The weaker and thinner sea ice in the historical simulation has faster anticyclonic drift over the Canada Basin than in the wind_vari simulation, which potentially can induce stronger Ekman downwelling. The fact that the Ekman downwelling in the historical simulation is not significantly stronger can only be explained by the strengthened surface geostrophic current, that is, the effect of the ice-ocean governor. In another word, the ice-ocean governor did limit the accumulation of freshwater in the Beaufort Gyre when sea ice decline tended to inflate it. The contribution of the ice-ocean governor could be quantified using specific techniques with additional numerical simulations [for example, the method used by Wang et al. (2019b)], which is beyond the scope of this paper. The presence of the ice-ocean governor was also demonstrated in freshwater-perturbation simulations by Wang et al. (2021c). They doubled and tripled river runoff in the Arctic Ocean without changing wind forcing in model simulations and found that the Ekman downwelling over the Canada Basin weakens. The increase in surface freshwater flux causes a spin-up of the anticyclonic Beaufort Gyre circulation because the Canada Basin can accumulate more additional freshwater than other area, which thus weakens the Ekman downwelling through the ice-ocean governor.
3.4 Impact of Sea Ice Decline on Arctic Atlantification
Another important change in the upper Arctic Ocean in the early 21st century is the weakening of the halocline and the shoaling of the lower halocline boundary in the eastern Eurasian Basin found from the analysis of hydrography observations (Polyakov et al., 2017; Polyakov et al., 2018; Polyakov et al., 2020a; Polyakov et al., 2020b). The concern about this phenomenon, Arctic Atlantification, is due to its potential role in accelerating sea ice decline through reducing the insulation between the warm Atlantic Water layer and sea ice. The main driver of this phenomenon needs a better understanding.
In Figures 12A–I, the changes of FWC, mean salinity in the upper 150m and the depth of the 0°C isotherm (the lower halocline boundary) between 2000 and 2019 are shown for both the historical and wind_vari simulations and their differences. For the whole two decades from 2000 to 2019, the FWC in the eastern Eurasian Basin is slightly reduced (Figure 12A). In the period from 2000 to 2004, which is not investigated above, there is an increase in the FWC in the eastern Eurasian Basin and the impact of sea ice decline is relatively small (Figure S8). Without sea ice decline, there would have been a strong increase in the FWC in the Eurasian Basin over the past two decades (Figure 12B). The sea ice decline reduces the FWC in the Eurasian Basin (Figure 12C) and this effect slightly overweighs the otherwise FWC increase in the eastern Eurasian Basin (Figure 12B), leading to the FWC reduction there (Figure 12A).
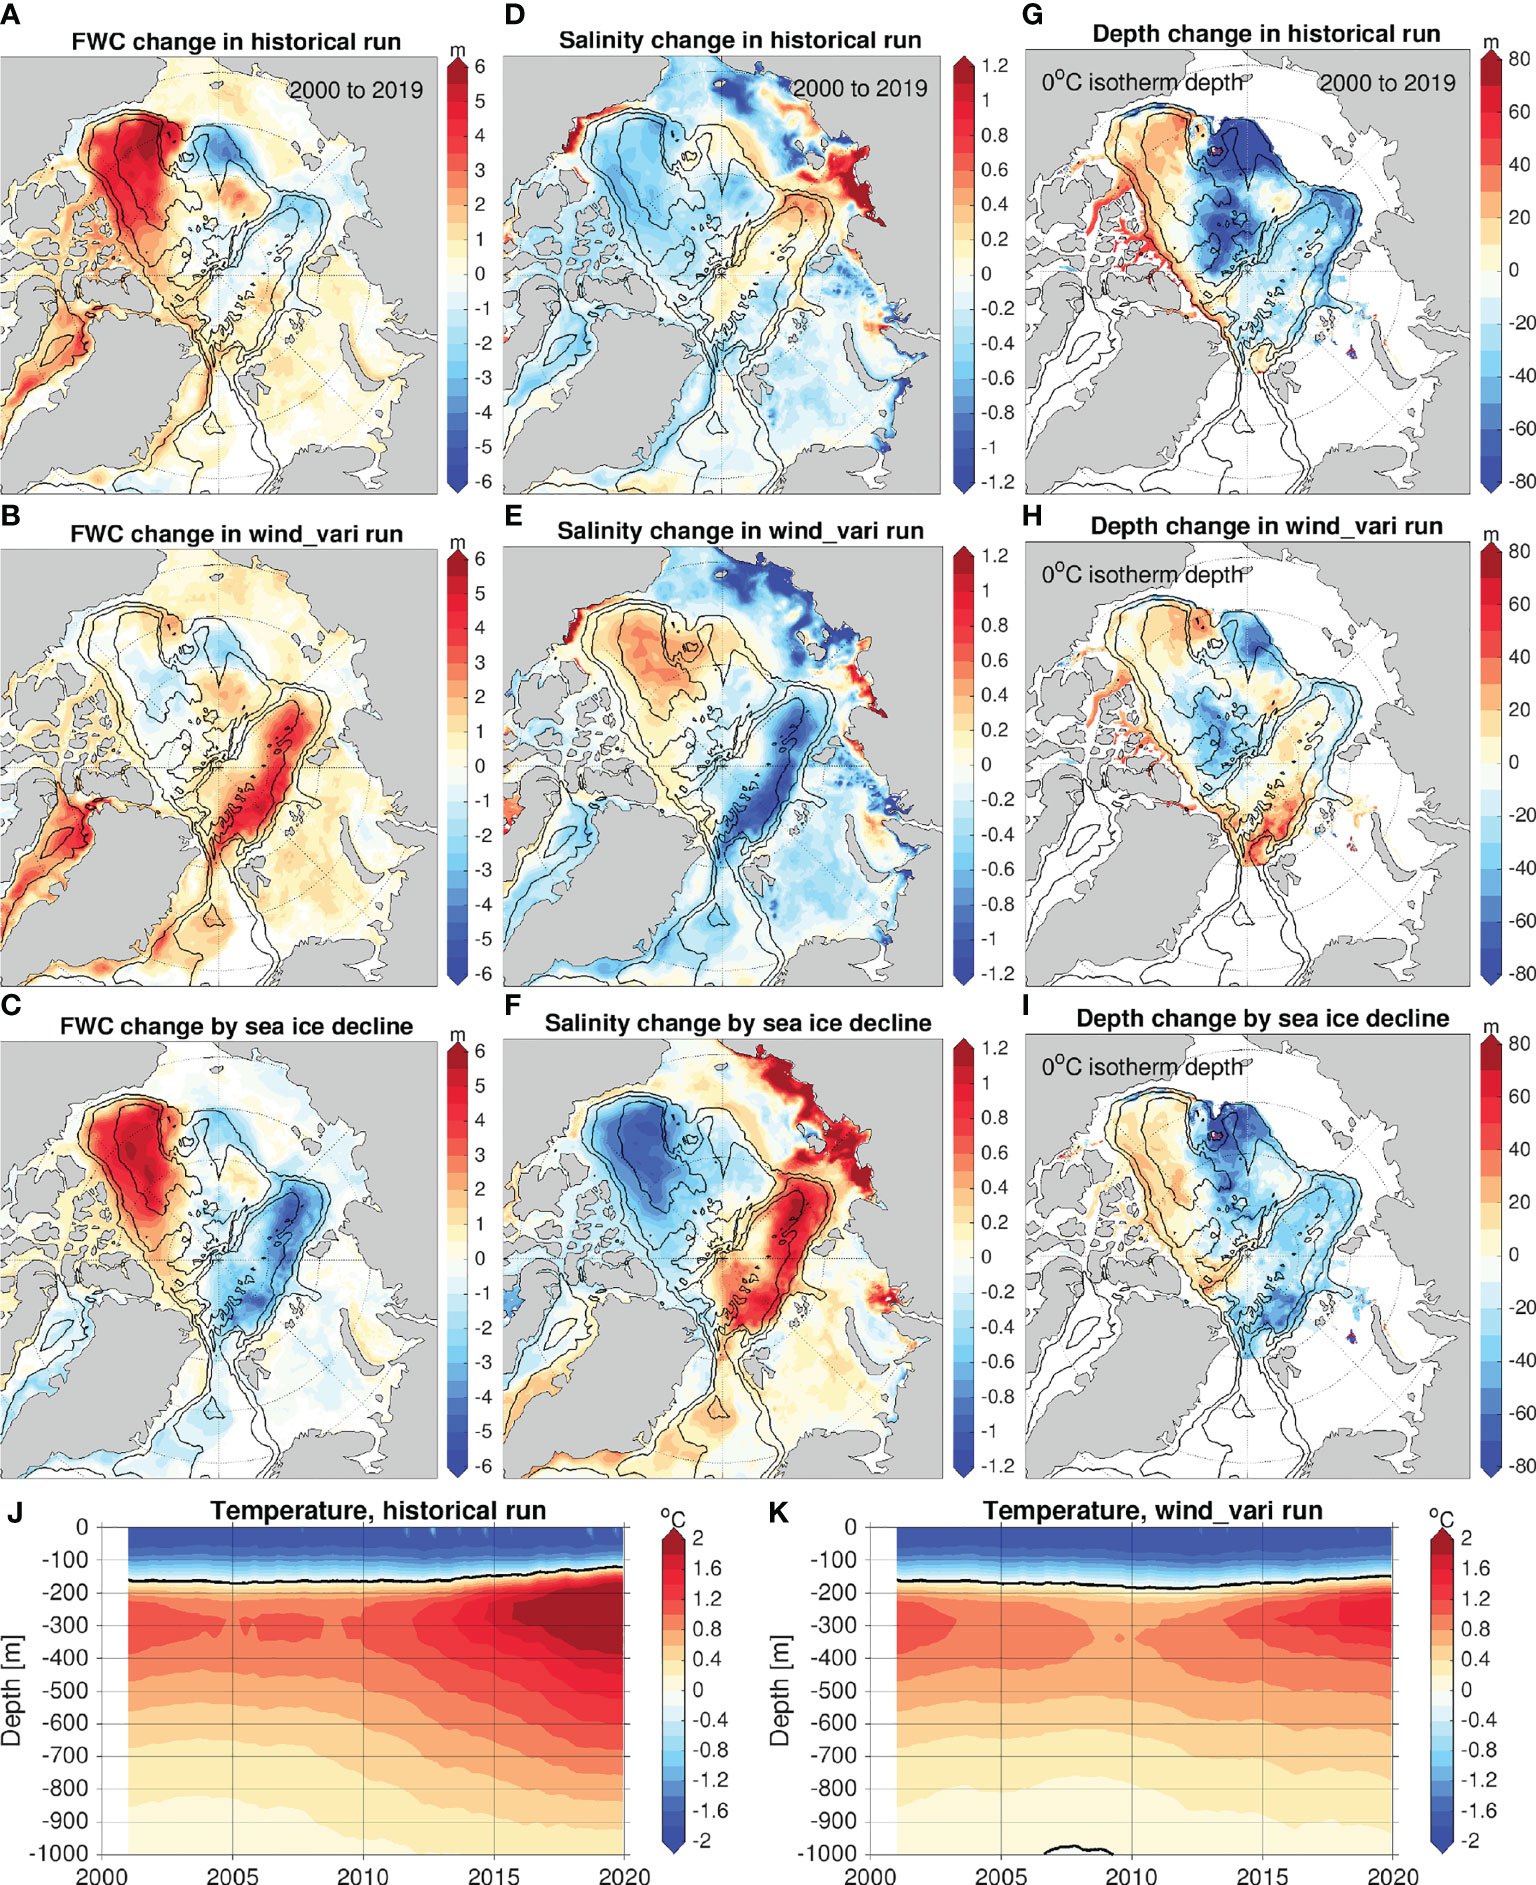
Figure 12 Sea ice decline considerably contributed to Arctic Atlantification. (A) Change of freshwater content (FWC, m) from 2000 to 2019 in the historical simulation. (B) The same as (A), but in the wind_vari simulation. (C) FWC change due to sea ice decline in this period, which is calculated as the difference between the historical simulation and wind_vari simulation. (D–F) The same as (A–C), but for salinity averaged over the upper 150 m. (G–I) The same as (A–C), but for the depth of the 0°C isotherm. (J) Time-depth plot (Hovmöller diagram) of monthly ocean temperature in the eastern Eurasian Basin between 80°E and 143°E where bottom topography is deeper than 500 m in the historical simulation. (K) The same as (J), but for the wind_vari simulation.
The impact of the sea ice decline on the upper ocean salinity in the eastern Eurasian Basin is consistent with its impact on the FWC. That is, the sea ice decline is responsible for the salinification in the halocline, the halocline weakening in the eastern Eurasian Basin (Figure 12F). The depth of the boundary between the halocline and the Atlantic Water layer in the eastern Eurasian Basin has little change in the wind_vari simulation (Figure 12H), but it shallows for about 30-40 m due to sea ice decline (Figures 12G, I). The shoaling of the boundary is similar to the observed changes in this region (Polyakov et al., 2020b). The sea ice decline enhances the Ekman transport directing from the Eurasian Basin toward the Amerasian Basin on average (Figure 8C), which flushes surface freshwater out of the Eurasian Basin, thus increasing the halocline salinity and causing the uplift of the lower halocline boundary in the Eurasian Basin (Figures 12F, I).
Budget analysis has shown that the eastward shift of the surface freshwater from the eastern Eurasian Basin in the last decades was accompanied by an increase in the concentration of saline Atlantic Water, being the main reason for the increase in halocline salinity in the Eurasian Basin (Wang et al., 2019b). It was also found that only about 20% of the increased Atlantic Water concentration above the 34.8 isohaline in the Eurasian Basin can be attributed to the Fram Strait branch (Wang et al., 2019b). Therefore, although sea ice decline can increase vertical mixing (e.g., Rainville and Woodgate, 2009; Polyakov et al., 2020b; Rippeth and Fine, 2022), thus increasing halocline salinity through mixing saline Atlantic Water upwards, this process is not the major contribution to the salinification of the halocline in the Eurasian Basin. In addition, the positive salinity anomaly in the Barents Sea induced by sea ice decline could contribute to the positive salinity anomaly in the eastern Eurasian Basin too, but the larger salinity anomaly associated with sea ice decline in the eastern Eurasian Basin than in the upstream Barents Sea implies that this contribution is small (Figure 12F).
There were upward trends in the temperature and poleward volume transport of the Atlantic Water in the Fram Strait in the past two decades (Figure S2). It was found that the Arctic sea ice decline has contributed to these trends possibly through modifying the Nordic Seas circulation (Wang et al., 2020), thus considerably intensifying the Atlantic Water layer warming in the eastern Eurasian Basin (cf. Figures 12G, K). The warming of the Atlantic Water layer with an uplifted upper boundary also has impacts on the downstream region, especially at the Chukchi Plateau (Figure 12I).
Our above analysis demonstrates that the Arctic Atlantification in the eastern Eurasian Basin in the past two decades is largely a consequence of Arctic sea ice decline. Using a set of numerical simulations with different atmospheric warming levels prescribed, it was shown that a further sea ice decline in a future warming climate can potentially cause even stronger salinification of the upper ocean and uplift of the Atlantic Water layer in the Eurasian Basin (Wang et al., 2021c). However, the future stratification in the Arctic Ocean also depends on how different freshwater sources will change.
The analysis in Figure 12 also provides insights for the Canada Basin in contrast to the Eurasian Basin. Without sea ice decline, the salinity in the upper 150 m increases in the Canada Basin and decreases in the Eurasian Basin (Figure 12E). This can be explained by the weak but positive sea level pressure anomaly in the central Arctic basin averaged over the past 20 years (Figure S9). The sea level pressure anomaly roughly resembles a negative Arctic Oscillation pattern, which tends to shift the surface freshwater circulation pathway from the Amerasian Basin towards the Eurasian Basin (Wang et al., 2021b). The sea ice decline completely changes this tendency. It considerably reduces the upper ocean salinity and deepens the halocline in the Canada Basin, and has an opposite effect in the Eurasian Basin (Figures 12F, I).
At the end we need to comment on the thermal_vari experiment with respect to the Atlantification in the Eurasian Basin. In this experiment, saline anomaly was absent in most parts of the eastern Eurasian Basin as implied by the plot of the FWC anomaly (Figure 11C). The repeat-year wind forcing used in this experiment does not represent the climatology as indicated by the sea level pressure anomaly (Figure 11D). The thermal_vari result shows that the sea ice decline together with an arbitrary wind forcing may not reproduce the observed halocline changes in the eastern Eurasian Basin. On the other hand, although the sea level pressure anomaly over the Eurasian Basin averaged over the last two decades is positive (Figure S9) and causes a strong freshening in the Eurasian Basin (in the wind_vari experiment, Figure 12E), adding the sea ice decline in the model can reverse the trend, leading to salinification in the halocline of the eastern Eurasian Basin (in the historical run, Figure 12D). This indicates that the sea ice decline is the main driver for the observed Atlantification in the eastern Eurasian Basin.
4 Discussion
It is not clear whether the unusual winds in the 2000s and 2010s are due to natural variability or climate change, but sea ice decline is at least partially forced by increasing greenhouse gas concentration. Therefore, the unprecedented spin-up of the Beaufort Gyre, the Arctic Atlantification in the eastern Eurasian Basin, and the fact that the Beaufort Gyre variability could explain a significant part of the total variance of the upper Arctic Ocean circulation (as EOF2) in the past two decades, were very likely the consequence of climate change.
Winds can influence ocean salinity through influencing sea ice thermodynamics. On average, sea ice is transported from the Siberian shelf toward the Fram Strait (Figure 2C). An offshore wind anomaly can enhance the export of sea ice from the shelf to the deep basin. In the winter season, this can increase sea ice growth over the shelf, thus increasing brine rejection and ocean salinity over the shelf. An onshore wind anomaly has an opposite impact. The Arctic Dipole Anomaly drives strong variability in sea ice export from the Siberian shelf (Wu et al., 2006; Wang et al., 2009), so it can influence the ocean salinity over the shelf and in the deep basin area that the shelf water flows through (Wang, 2021). Therefore, although the most prominent decadal changes and strongest interannual variability of the Arctic upper ocean circulation in the past two decades are associated with the Arctic Oscillation and the Beaufort High, some of the Arctic upper ocean variability could be attributed to the Dipole Anomaly, which can effectively change sea ice thermodynamics besides its dynamic impact on the ocean. However, it was found that the impact of the Dipole Anomaly on the freshwater spatial pattern in the Arctic Ocean has weakened in the 2010s compared to the last century (Wang, 2021), possibly due to weaker sea ice thermodynamic response to offshore/onshore winds with warmer atmosphere.
Changes in ocean inflow from the North Pacific and North Atlantic could also influence the upper ocean circulation in the Arctic Ocean (Spall, 2020; Karami et al., 2021; Wang et al., 2021b). For example, stronger Pacific Water inflow through the Bering Strait can increase the sea surface height along the continental slope of the Canada Basin so that the ocean circulation towards the Canadian Arctic Archipelago and Fram Strait is strengthened (Spall, 2020; Wang et al., 2021b). Because the strength of the Pacific Water inflow is determined by winds both inside and outside the Arctic (Danielson et al., 2014; Peralta-Ferriz and Woodgate, 2017; Zhang et al., 2020), some regional variability in Arctic upper ocean circulation could be induced by the wind variability over the North Pacific. Observations indicate an increase in Pacific Water inflow through the Bering Strait over the last decades (Woodgate, 2018), but our historical simulation did not simulate such a trend (not shown). Therefore, the potential impact of the increasing Pacific Water inflow is absent in our simulations. To our knowledge, the issue of lacking the observed upward trend in Pacific Water inflow is common in numerical models, the reason for which remains a research topic. We also found that Arctic sea ice decline does not significantly change the Pacific Water inflow by comparing our historical and wind_vari simulations (not shown).
The Arctic Oscillation index had an upward trend in the past and will continue increasing with climate warming (Fyfe et al., 1999; Shindell et al., 1999), while the wind curl over the Canada Basin had a downward trend in the past (Figure 3A). If the wind curl over the Canada Basin continues decreasing in the future, the Arctic upper ocean circulation will very possibly be featured with both stronger cyclonic circulation and stronger anticyclonic circulation than today as depicted in Figures 4I, L. In this regime, the variability of the Transpolar Drift Stream might become more vulnerable to both the atmospheric modes as the anticyclonic and cyclonic ocean circulations are in close proximity. The possible future development of the wind curl over the Canada Basin remains to be studied. It was shown that the Beaufort High itself exhibited a weakening due to increased cyclone activity in a warming Arctic in the past (Moore et al., 2018; Kenigson and Timmermans, 2021).
In a future warming climate, the surface freshwater flux over the Arctic Ocean will continue to increase due to the strengthening of the hydrologic cycle, although the contribution from sea ice melting will decrease at some stage along with the reduction in remaining sea ice volume (Carmack et al., 2016; Shu et al., 2018). The future increase in ocean surface freshwater flux could strongly influence the Arctic upper ocean stratification and circulation (Pemberton and Nilsson, 2016; Nummelin et al., 2017; Wang et al., 2021c).
To better predict future changes of the Arctic Ocean, a good model representation of all the related processes is required. Despite a reasonable model performance, model biases relative to observations do exist in the simulation employed in this paper. Model biases in Arctic Ocean simulations in state-of-the-art models (e.g., Jahn et al., 2012; Aksenov et al., 2016; Ilicak et al., 2016; Wang et al., 2016; Khosravi et al., 2022) suggest a need for concerted efforts in future development of numerical models, which are important tools for understanding and predicting the ocean and climate.
5 Summary
In this paper we reviewed the major changes in the large-scale circulation in the upper Arctic Ocean in the 2000s and 2010s and demonstrated that the Arctic sea ice decline and the unusual winds together caused the observed changes on different time scales in the upper Arctic Ocean. We also showed that the sea ice decline was the main driver for the Arctic Atlantification in the eastern Eurasian Basin in the last two decades. Our synthesis was based on dedicated historical and sensitivity model simulations with the support of observations.
We addressed the following key points:
● Arctic sea ice decline strongly influences the ocean through both increasing surface freshwater flux (via melting, or reduction in net sea ice thermodynamic growth rate) and modifying water mass spatial distribution (via mediating ocean surface stress, Wang et al., 2018a; Wang et al., 2019b). Without these effects of Arctic sea ice decline, changes of the Arctic Ocean in the past two decades would not have been as prominent as what have really happened. In comparison with the impact of sea ice retreat, the increase in the river runoff and net precipitation over the last decade did not have large impact on the Arctic freshwater content (FWC) and upper ocean circulation.
● One outstanding change in the upper Arctic Ocean circulation in the 2000s and 2010s is the unprecedented spin-up of the anticyclonic Beaufort Gyre associated with the accumulation of liquid freshwater in the Canada Basin (Proshutinsky et al., 2019). The wind curl over the Canada Basin was unusually low on average in the second half of both the 2000s and 2010s (the two periods indicated with green background in Figure 3A), which was the dynamic driver of freshwater accumulation in these periods. However, without sea ice decline, the increase of FWC in the Canada Basin in these two periods would have been much lower, and there would have been a strong FWC drop between these two periods (2009 to 2014). Therefore, the strengthened anticyclonic circulation in the Canada Basin in the last two decades was induced jointly by the unusual winds and sea ice decline.
● Arctic Atlantification, indicated by the weakening and thinning of the halocline together with the warming of the Atlantic Water layer, emerged in the eastern Eurasian Basin (Polyakov et al., 2020a). Our historical simulation reproduced this phenomenon. When sea ice decline was eliminated in the numerical simulation, Arctic Atlantification became only marginally visible in the eastern Eurasian Basin. Although sea ice meltwater tends to freshen the upper ocean throughout the deep basin area including the Eurasian Basin, the overall effect of sea ice decline on the eastern Eurasian Basin is rather to increase the upper ocean salinity, indicating that the dynamic effect of sea ice decline dominates. The warming of the Atlantic Water layer in the eastern Eurasian Basin is accompanied by intensified ocean heat inflow at Fram Strait, which is associated with Arctic sea ice decline (Wang et al., 2020).
● On the interannual time scale, the upper Arctic Ocean circulation has a leading mode centered over the Russian side of the deep basin driven by the Arctic Oscillation, and a second mode with a dominating active center over the Canada Basin driven by the Beaufort High variability, as revealed by the first two EOFs of the Arctic annual sea surface height from 2004 to 2019. This agrees with the analysis of satellite observations described in Morison et al. (2021), despite some discrepancy in the details of the EOF patterns.
● Our sensitivity simulation reveals that the first two EOFs of Arctic sea surface height can well represent the ocean variability driven by the two major atmospheric modes because sea ice decline considerably amplifies the ocean response to wind variability, especially to the Beaufort High variability. Without sea ice decline, the first two EOFs cannot distinguish the ocean variability driven by the major atmospheric modes from other ocean variability as clearly as in reality. Therefore, sea ice decline is also an important controlling factor for the magnitude and spatial extent of the wind-driven ocean variability on the interannual time scale.
Data Availability Statement
The raw data supporting the conclusions of this article will be made available by the authors, without undue reservation.
Author Contributions
QW conceived the study, performed the simulations and data analysis, and wrote the first draft of the paper. SD contributed to the interpretation of model results and improving the manuscript.
Funding
This work was supported by the Helmholtz Climate Initiative REKLIM (Regional Climate Change) and the EPICA project in the research theme “MARE:N - Polarforschung/MOSAiC” funded by the German Federal Ministry for Education and Research with funding number 03F0889A.
Conflict of Interest
The authors declare that the research was conducted in the absence of any commercial or financial relationships that could be construed as a potential conflict of interest.
Publisher’s Note
All claims expressed in this article are solely those of the authors and do not necessarily represent those of their affiliated organizations, or those of the publisher, the editors and the reviewers. Any product that may be evaluated in this article, or claim that may be made by its manufacturer, is not guaranteed or endorsed by the publisher.
Supplementary Material
The Supplementary Material for this article can be found online at: https://www.frontiersin.org/articles/10.3389/fmars.2022.863204/full#supplementary-material
References
Aagaard K., Swift J. H., Carmack E. (1985). Thermohaline Circulation in the Arctic Mediterranean Seas. J. Geophys. Res. - Ocean. 90, 4833–4846. doi: 10.1029/JC090iC03p04833
Aksenov Y., Karcher M., Proshutinsky A., Gerdes R., de Cuevas B., Golubeva E., et al. (2016). Arctic Pathways of Pacific Water: Arctic Ocean Model Intercomparison Experiments. J. Geophys. Res. - Ocean. 121, 27–59. doi: 10.1002/2015JC011299
Alkire M. B., Falkner K., Rigor I., Steele M., Morison J. (2007). The Return of Pacific Waters to the Upper Layers of the Central Arctic Ocean. Deep-sea. Res. I 54, 1509–1529. doi: 10.1016/j.dsr.2007.06.004
Armitage T., Bacon S., Ridout A., Petty A., Wolbach S., Tsamados M. (2017). Arctic Ocean Surface Geostrophic Circulation 2003–2014. Cryosph. 11, 1767–1780. doi: 10.5194/tc-11-1767-2017
Armitage T., Bacon S., Ridout A., Thomas S., Aksenov Y., Wingham D. (2016). Arctic Sea Surface Height Variability and Change From Satellite Radar Altimetry and GRACE 2003-2014. J. Geophys. Res. - Ocean. 121, 4303–4322. doi: 10.1002/2015JC011579
Armitage T. W. K., Manucharyan G. E., Petty A. A., Kwok R., Thompson A. F. (2020). Enhanced Eddy Activity in the Beaufort Gyre in Response to Sea Ice Loss. Nat. Commun. 11, 761. doi: 10.1038/s41467-020-14449-z
Årthun M., Eldevik T. (2016). On Anomalous Ocean Heat Transport Toward the Arctic and Associated Climate Predictability. J. Clim. 29, 689–704. doi: 10.1175/JCLI-D-15-0448.1
Athanase M., Provost C., Pérez-Hernández M. D., Sennéchael N., Bertosio C., Artana C., et al. (2020). Atlantic Water Modification North of Svalbard in the Mercator Physical System From 2007 to 2020. J. Geophys. Res.: Ocean. 125, e2020JC016463. doi: 10.1029/2020JC016463
Azetsu-Scott K., Clarke A., Falkner K., Hamilton J., Jones E. P., Lee C., et al. (2010). Calcium Carbonate Saturation States in the Waters of the Canadian Arctic Archipelago and the Labrador Sea. J. Geophys. Res.: Ocean. 115, C11021. doi: 10.1029/2009JC005917
Beszczynska-Moeller A., Fahrbach E., Schauer U., Hansen E. (2012). Variability in Atlantic Water Temperature and Transport at the Entrance to the Arctic Ocean 1997-2010. ICES. J. Mar. Sci. 69, 852–863. doi: 10.1093/icesjms/fss056
Carmack E. C. (2007). The Alpha/Beta Ocean Distinction: A Perspective on Freshwater Fluxes, Convection, Nutrients and Productivity in High-Latitude Seas. Deep. Sea. Res. Part II: Top. Stud. Oceanog. 54, 2578–2598. doi: 10.1016/j.dsr2.2007.08.018
Carmack E. C., Macdonald R., Perkin R. G., McLaughlin F. A., Pearson R. J. (1995). Evidence for Warming of Atlantic Water in the Southern Canadian Basin of the Arctic Ocean: Results From the Larsen-93 Expedition. Geophys. Res. Lett. 22, 1061–1064. doi: 10.1029/95GL00808
Carmack E., Yamamoto-Kawai M., Haine T., Bacon S., Bluhm B. A., Lique C., et al. (2016). Freshwater and Its Role in the Arctic Marine System: Sources, Disposition, Storage, Export, and Physical and Biogeochemical Consequences in the Arctic and Global Oceans. J. Geophys. Res. Biogeosci. 121, 675–717. doi: 10.1002/2015JG003140
Cohen J., Screen J. A., Furtado J. C., Barlow M., Whittleston D., Coumou D., et al. (2014). Recent Arctic Amplification and Extreme Mid-Latitude Weather. Nat. Geosci. 7, 627–637. doi: 10.1038/ngeo2234
Comiso J. C., Meier W. N., Gersten R. (2017). Variability and Trends in the Arctic Sea Ice Cover: Results From Different Techniques. J. Geophys. Res. - Ocean. 122, 6883–6900. doi: 10.1002/2017JC012768
Condron A., Winsor P., Hill C., Menemenlis D. (2009). Simulated Response of the Arctic Freshwater Budget to Extreme NAO Wind Forcing. J. Climate 22, 2422–2437. doi: 10.1175/2008JCLI2626.1
Cornish S. B., Kostov Y., Johnson H. L., Lique C. (2020). Response of Arctic Freshwater to the Arctic Oscillation in Coupled Climate Models. J. Climate 33, 2533–2555. doi: 10.1175/JCLI-D-19-0685.1
Danielson S. L., Weingartner T. J., Hedstrom K. S., Aagaard K., Woodgate R., Curchitser E., et al. (2014). Coupled Wind-Forced Controls of the Bering–Chukchi Shelf Circulation and the Bering Strait Throughflow: Ekman Transport, Continental Shelf Waves, and Variations of the Pacific–Arctic Sea Surface Height Gradient. Prog. Oceanog. 125, 40–61. doi: 10.1016/j.pocean.2014.04.006
Danilov S., Wang Q., Timmermann R., Iakovlev N., Sidorenko D., Kimmritz M., et al. (2015). Finite-Element Sea Ice Model (FESIM), Version 2. Geosci. Model Dev. 8, 1747–1761. doi: 10.5194/gmd-8-1747-2015
Davis P. E. D., Lique C., Johnson H. L. (2014). On the Link Between Arctic Sea Ice Decline and the Freshwater Content of the Beaufort Gyre: Insights From a Simple Process Model. J. Climate 27, 8170–8184. doi: 10.1175/JCLI-D-14-00090.1
Dewey S., Morison J., Kwok R., Dickinson S., Morison D., Andersen R. (2018). Arctic Ice-Ocean Coupling and Gyre Equilibration Observed With Remote Sensing. Geophys. Res. Lett. 45, 1499–1508. doi: 10.1002/2017GL076229
Docquier D., Koenigk T. (2021). A Review of Interactions Between Ocean Heat Transport and Arctic Sea Ice. Environ. Res. Lett. 16, 123002. doi: 10.1088/1748-9326/ac30be
Doddridge E. W., Meneghello G., Marshall J., Scott J., Lique C. (2019). A Three-Way Balance in the Beaufort Gyre: The Ice-Ocean Governor, Wind Stress, and Eddy Diffusivity. J. Geophys. Res.: Ocean. 124, 3107–3124. doi: 10.1029/2018JC014897
Ekwurzel B., Schlosser P., Mortlock R. A., Fairbanks R. G., Swift J. H. (2001). River Runoff, Sea Ice Meltwater, and Pacific Water Distribution and Mean Residence Times in the Arctic Ocean. J. Geophys. Res.: Ocean. 106, 9075–9092. doi: 10.1029/1999JC000024
Fyfe J. C., Boer G. J., Flato G. M. (1999). The Arctic and Antarctic Oscillations and Their Projected Changes Under Global Warming. Geophys. Res. Lett. 26, 1601–1604. doi: 10.1029/1999GL900317
Gerdes R., Karcher M. J., Kauker F., Schauer U. (2003). Causes and Development of Repeated Arctic Ocean Warming Events. Geophys. Res. Lett. 30, 1980. doi: 10.1029/2003GL018080
Giles K. A., Laxon S. W., Ridout A. L., Wingham D. J., Bacon S. (2012). Western Arctic Ocean Freshwater Storage Increased by Wind-Driven Spin-Up of the Beaufort Gyre. Nat. Geosci. 5, 194–197. doi: 10.1038/ngeo1379
Haine T., Curry B., Gerdes R., Hansen E., Karcher M., Lee C., et al. (2015). Arctic Freshwater Export: Status, Mechanisms, and Prospects. Global Planet. Change 125, 13–35. doi: 10.1016/j.gloplacha.2014.11.013
Hibler W. (1979). A Dynamic Thermodynamic Sea Ice Model. J. Phys. Oceanogr. 9, 815–846. doi: 10.1175/1520-0485(1979)009<0815:ADTSIM>2.0.CO;2
Hinrichs C., Wang Q., Koldunov N., Mu L., Semmler T., Sidorenko D., et al. (2021). Atmospheric Wind Biases: A Challenge for Simulating the Arctic Ocean in Coupled Models? J. Geophys. Res.: Ocean. 126, e2021JC017565. doi: 10.1029/2021JC017565
Hu X., Myers P. G., Lu Y. (2019). Pacific Water Pathway in the Arctic Ocean and Beaufort Gyre in Two Simulations With Different Horizontal Resolutions. J. Geophys. Res.: Ocean. 124, 6414–6432. doi: 10.1029/2019JC015111
Ilicak M., Drange H., Wang Q., Gerdes R., Aksenov Y., Bailey D., et al. (2016). An Assessment of the Arctic Ocean in a Suite of Interannual CORE-II Simulations. Part III: Hydrography and Fluxes. Ocean. Modell. 100, 141–161. doi: 10.1016/j.ocemod.2016.02.004
Ingvaldsen R. B., Assmann K. M., Primicerio R., Fossheim M., Polyakov I. V., Dolgov A. V. (2021). Physical Manifestations and Ecological Implications of Arctic Atlantification. Nat. Rev. Earth Environ. 2, 874–889. doi: 10.1038/s43017-021-00228-x
Ivanov V., Alexeev V., Koldunov N. V., Repina I., Sandø A. B., Smedsrud L. H., et al. (2016). Arctic Ocean Heat Impact on Regional Ice Decay: A Suggested Positive Feedback. J. Phys. Oceanog. 46, 1437–1456. doi: 10.1175/JPO-D-15-0144.1
Jahn A., Aksenov Y., de Cuevas B. A., de Steur L., Hakkinen S., Hansen E., et al. (2012). Arctic Ocean Freshwater: How Robust are Model Simulations? J. Geophys. Res. - Ocean. 117, C00D16. doi: 10.1029/2012JC007907
Johnson H. L., Cornish S. B., Kostov Y., Beer E., Lique C. (2018). Arctic Ocean Freshwater Content and Its Decadal Memory of Sea-Level Pressure. Geophys. Res. Lett. 45, 4991–5001. doi: 10.1029/2017GL076870
Karami M. P., Myers P. G., de Vernal A., Tremblay L. B., Hu X. (2021). The Role of Arctic Gateways on Sea Ice and Circulation in the Arctic and North Atlantic Oceans: A Sensitivity Study With an Ocean-Sea-Ice Model. Climate Dynam. 57, 2129–2151. doi: 10.1007/s00382-021-05798-6
Karcher M. J., Oberhuber J. M. (2002). Pathways and Modification of the Upper and Intermediate Waters of the Arctic Ocean. J. Geophys. Research-oceans. 107, 3049. doi: 10.1029/2000JC000530
Karcher M., Smith J., Kauker F., Gerdes R., Smethie W. (2012). Recent Changes in Arctic Ocean Circulation Revealed by Iodine-129 Observations and Modeling. J. Geophys. Res. - Ocean. 117, C08007. doi: 10.1029/2011JC007513
Kenigson J. S., Timmermans M. L. (2021). Arctic Cyclone Activity and the Beaufort High. J. Climate 34, 4119–4127. doi: 10.1175/JCLI-D-20-0771.1
Khosravi N., Wang Q., Koldunov N., Hinrichs C., Semmler T., Danilov S., et al. (2022). Arctic Ocean in Cmip6 Models: Historical and Projected Temperature and Salinity in the Deep Basins. Earth’s. Future 10, e2021EF002282. doi: 10.1029/2021EF002282
Krishfield R. A., Proshutinsky A., Tateyama K., Williams W. J., Carmack E. C., A M. F., et al. (2014). Deterioration of Perennial Sea Ice in the Beaufort Gyre From 2003 to 2012 and Its Impact on the Oceanic Freshwater Cycle. J. Geophys. Res. Ocean. 119, 1271–1305. doi: 10.1002/2013JC008999
Kwok R. (2018). Arctic Sea Ice Thickness, Volume, and Multiyear Ice Coverage: Losses and Coupled Variability, (1958–2018). Environ. Res. Lett. 13, 105005. doi: 10.1088/1748-9326/aae3ec
Kwok R., Morison J. (2017). Recent Changes in Arctic Sea Ice and Ocean Circulation. US CLIVAR. Variat. (Summer. 2017) 15, 1–6. doi: 10.5065/D6833QQP
Large W. G., Yeager S. G. (2009). The Global Climatology of an Interannually Varying Air-Sea Flux Data Set. Climate Dynam. 33, 341–364. doi: 10.1007/s00382-008-0441-3
Lavergne T., Eastwood S., Teffah Z., Schyberg H., Breivik L.-A. (2010). Sea Ice Motion From Low-Resolution Satellite Sensors: An Alternative Method and Its Validation in the Arctic. J. Geophys. Res.: Ocean. 115, C10032. doi: 10.1029/2009JC005958
Lique C., Johnson H. L., Davis P. E. D. (2015). On the Interplay Between the Circulation in the Surface and the Intermediate Layers of the Arctic Ocean. J. Phys. Oceanog. 45, 1393–1409. doi: 10.1175/JPO-D-14-0183.1
Manucharyan G., Spall M. (2016). Wind-Driven Freshwater Buildup and Release in the Beaufort Gyre Constrained by Mesoscale Eddies. Geophys. Res. Lett. 43, 273–282. doi: 10.1002/2015GL065957
Marshall J., Scott J., Proshutinsky A. (2017). ‘‘Climate Response Functions” for the Arctic Ocean: A Proposed Coordinated Modelling Experiment. Geosci. Model Dev. 10, 2833–2848. doi: 10.5194/gmd-10-2833-2017
Martin T., Steele M., Zhang J. (2014). Seasonality and Long-Term Trend of Arctic Ocean Surface Stress in a Model. J. Geophys. Res. - Ocean. 119, 1723–1738. doi: 10.1002/2013JC009425
Maslowski W., Newton B., Schlosser P., Semtner A., Martinson D. (2000). Modeling Recent Climate Variability in the Arctic Ocean. Geophys. Res. Lett. 27, 3743–3746. doi: 10.1029/1999GL011227
McLaughlin F., Carmack E., Macdonald R., Weaver A. J., Smith J. (2002). The Canada Basin 1989–1995: Upstream Events and Far-Field Effects of the Barents Sea. J. Geophys. Res.: Ocean. 107, 3082. doi: 10.1029/2001JC000904
McPhee M. G. (2013). Intensification of Geostrophic Currents in the Canada Basin, Arctic Ocean. J. Climate 26, 3130–3138. doi: 10.1175/JCLI-D-12-00289.1
McPhee M. G., Proshutinsky A., Morison J. H., Steele M., Alkire M. B. (2009). Rapid Change in Freshwater Content of the Arctic Ocean. Geophys. Res. Lett. 36, L10602. doi: 10.1029/2009GL037525
Meneghello G., Doddridge E., Marshall J., Scott J., Campin J.-M. (2020). Exploring the Role of the “Ice–Ocean Governor”And Mesoscale Eddies in the Equilibration of the Beaufort Gyre: Lessons From Observations. J. Phys. Oceanog. 50, 269–277. doi: 10.1175/JPO-D-18-0223.1
Meneghello G., Marshall J., Campin J., Doddridge E., Timmermans M.-L. (2018a). The Ice-Ocean Governor: Ice-Ocean Stress Feedback Limits Beaufort Gyre Spin-Up. Geophys. Res. Lett 45, 11,293–11,299. doi: 10.1029/2018GL080171
Meneghello G., Marshall J., Timmermans M., Scott J. (2018b). Observations of Seasonal Upwelling and Downwelling in the Beaufort Sea Mediated by Sea Ice. J. Phys. Oceanogr. 48, 795–805. doi: 10.1175/JPO-D-17-0188.1
Moore G. W. K., Schweiger A., Zhang J., Steele M. (2018). Collapse of the 2017 Winter Beaufort High: A Response to Thinning Sea Ice? Geophys. Res. Lett. 45, 2860–2869. doi: 10.1002/2017GL076446
Morison J., Kwok R., Dickinson S., Andersen R., Peralta-Ferriz C., Morison D., et al. (2021). The Cyclonic Mode of Arctic Ocean Circulation. J. Phys. Oceanog. 51, 1053–1075. doi: 10.1175/JPO-D-20-0190.1
Morison J., Kwok R., Peralta-Ferriz C., Alkire M., Rigor I., Andersen R., et al. (2012). Changing Arctic Ocean Freshwater Pathways. Nature 481, 66–70. doi: 10.1038/nature10705
Morison J., Steele M., Andersen R. (1998). Hydrography of the Upper Arctic Ocean Measured From the Nuclear Submarine U.S.S. Pargo. Deep-Sea. Res. I 45, 15–38. doi: 10.1016/S0967-0637(97)00025-3
Morison J., Steele M., Kikuchi T., Falkner K., Smethie W. (2006). The Relaxation of Central Arctic Ocean Hydrography to Pre-1990s Climatology. Geophys. Res. Lett. 33, L17604. doi: 10.1029/2006GL026826
Nummelin A., Li C., Hezel P. (2017). Connecting Ocean Heat Transport Changes From the Midlatitudes to the Arctic Ocean. Geophys. Res. Lett. 44, 1899–1908. doi: 10.1002/2016GL071333
Pemberton P., Nilsson J. (2016). The Response of the Central Arctic Ocean Stratification to Freshwater Perturbations. J. Geophys. Res.: Ocean. 121, 792–817. doi: 10.1002/2015JC011003
Peralta-Ferriz C., Woodgate R. A. (2017). The Dominant Role of the East Siberian Sea in Driving the Oceanic Flow Through the Bering Strait—Conclusions From Grace Ocean Mass Satellite Data and In Situ Mooring Observations Between 2002 and 2016. Geophys. Res. Lett. 44 (11), 472–11,481. doi: 10.1002/2017GL075179
Polyakov I. V., Alkire M. B., Bluhm B. A., Brown K. A., Carmack E. C., Chierici M., et al. (2020a). Borealization of the Arctic Ocean in Response to Anomalous Advection From Sub-Arctic Seas. Front. Mar. Sci. 7. doi: 10.3389/fmars.2020.00491
Polyakov I., Bhatt U., Walsh J., Abrahamsen E. P., Pnyushkov A., Wassmann P. (2013). Recent Oceanic Changes in the Arctic in the Context of Long-Term Observations. Ecol. Appl. 23, 1745–1764. doi: 10.1890/11-0902.1
Polyakov I., Pnyushkov A. V., Alkire M. B., Ashik I. M., Baumann T. M., Carmack E. C., et al. (2017). Greater Role for Atlantic Inflows on Sea-Ice Loss in the Eurasian Basin of the Arctic Ocean. Science 356, 285. doi: 10.1126/science.aai8204
Polyakov I. V., Pnyushkov A. V., Carmack E. C. (2018). Stability of the Arctic Halocline: A New Indicator of Arctic Climate Change. Environ. Res. Lett. 13, 125008. doi: 10.1088/1748-9326/aaec1e
Polyakov I. V., Rippeth T. P., Fer I., Alkire M. B., Baumann T. M., Carmack E. C., et al. (2020b). Weakening of Cold Halocline Layer Exposes Sea Ice to Oceanic Heat in the Eastern Arctic Ocean. J. Climate 33, 8107–8123. doi: 10.1175/JCLI-D-19-0976.1
Proshutinsky A., Krishfield R., Timmermans M. L. (2020). Introduction to Special Collection on Arctic Ocean Modeling and Observational Synthesis (FAMOS) 2: Beaufort Gyre Phenomenon. J. Geophys. Res.: Ocean. 125, e2019JC015400. doi: 10.1029/2019JC015400
Proshutinsky A., Krishfield R., Timmermans M.-L., Toole J., Carmack E., McLaughlin F., et al. (2009). Beaufort Gyre Freshwater Reservoir: State and Variability From Observations. J. Geophys. Res. - Ocean. 114, C00A10. doi: 10.1029/2008JC005104
Proshutinsky A., Krishfield R., Toole J. M., Timmermans M. L., Williams W., Zimmermann S., et al. (2019). Analysis of the Beaufort Gyre Freshwater Content in 2003-2018. J. Geophys. Res. - Ocean. 124, 9658–9689. doi: 10.1029/2019JC015281
Rabe B., Karcher M., Kauker F., Schauer U., Toole J. M., Krishfield R. A., et al. (2014). Arctic Ocean Basin Liquid Freshwater Storage Trend 1992-2012. Geophys. Res. Lett. 41, 961–968. doi: 10.1002/2013GL058121
Rainville L., Woodgate R. A. (2009). Observations of Internal Wave Generation in the Seasonally Ice-Free Arctic. Geophys. Res. Lett. 36, L23604. doi: 10.1029/2009GL041291
Regan H. C., Lique C., Armitage T. W. K. (2019). The Beaufort Gyre Extent, Shape, and Location Between 2003 and 2014 From Satellite Observations. J. Geophys. Res. - Ocean. 124, 844–862. doi: 10.1029/2018JC014379
Rippeth T. P., Fine E. C. (2022). Turbulent Mixing in a Changing Arctic Ocean. Oceanography 35. doi: 10.5670/oceanog.2022.103
Rudels B. (2015). Arctic Ocean Circulation, Processes and Water Masses: A Description of Observations and Ideas With Focus on the Period Prior to the International Polar Year 2007–2009. Prog. Oceanog. 132, 22–67. doi: 10.1016/j.pocean.2013.11.006
Rudels B., Anderson L. G., Jones E. P. (1996). Formation and Evolution of the Surface Mixed Layer and Halocline of the Arctic Ocean. J. Geophys. Res.-Ocean. 101, 8807–8821. doi: 10.1029/96JC00143
Schauer U., Rudels B., Jones E. P., Anderson L. G., Muench R. D., Bjork G., et al. (2002). Confluence and Redistribution of Atlantic Water in the Nansen, Amundsen and Makarov Basins. Annal. Geophysicae 20, 257–273. doi: 10.5194/angeo-20-257-2002
Schweiger A., Lindsay R., Zhang J., Steele M., Stern H., Kwok R. (2011). Uncertainty in Modeled Arctic Sea Ice Volume. J. Geophys. Res. - Ocean. 116, C00D06. doi: 10.1029/2011JC007084
Screen J. A., Simmonds I. (2010). The Central Role of Diminishing Sea Ice in Recent Arctic Temperature Amplification. Nature 464, 1334–1337. doi: 10.1038/nature09051
Serreze M. C., Barrett A. P., Slater A. G., Woodgate R. A., Aagaard K., Lammers R. B., et al. (2006). The Large-Scale Freshwater Cycle of the Arctic. J. Geophys. Res. - Ocean. 111, C11010. doi: 10.1029/2005JC003424
Shindell D. T., Miller R. L., Schmidt G. A., Pandolfo L. (1999). Simulation of Recent Northern Winter Climate Trends by Greenhouse-Gas Forcing. Nature 399, 452–455. doi: 10.1038/20905
Shu Q., Qiao F., Song Z., Zhao J., Li X. (2018). Projected Freshening of the Arctic Ocean in the 21st Century. J. Geophys. Res.: Ocean. 123, 9232–9244. doi: 10.1029/2018JC014036
Shu Q., Wang Q., Song Z., Qiao F. (2021). The Poleward Enhanced Arctic Ocean Cooling Machine in a Warming Climate. Nat. Commun. 12, 2966. doi: 10.1038/s41467-021-23321-7
Smedsrud L. H., Esau I., Ingvaldsen R. B., Eldevik T., Haugan P. M., Li C., et al. (2013). The Role of the Barents Sea in the Arctic Climate System. Rev. Geophys. 51, 415–449. doi: 10.1002/rog.20017
Smedsrud L. H., Muilwijk M., Brakstad A., Madonna E., Lauvset S. K., Spensberger C., et al. (2022). Nordic Seas Heat Loss, Atlantic Inflow, and Arctic Sea Ice Cover Over the Last Century. Rev. Geophys. 60, e2020RG000725. doi: 10.1029/2020RG000725
Smith J. N., Karcher M., Casacuberta N., Williams W. J., Kenna T., Smethie W. M. Jr. (2021). A Changing Arctic Ocean: How Measured and Modeled 129i Distributions Indicate Fundamental Shifts in Circulation Between 1994 and 2015. J. Geophys. Res.: Ocean. 126, e2020JC016740. doi: 10.1029/2020JC016740
Solomon A., Heuzé C., Rabe B., Bacon S., Bertino L., Heimbach P., et al. (2021). Freshwater in the Arctic Ocean 2010–2019. Ocean. Sci. 17, 1081–1102. doi: 10.5194/os-17-1081-2021
Spall M. (2020). Potential Vorticity Dynamics of the Arctic Halocline. J. Phys. Oceanog. 50, 2491–2506. doi: 10.1175/JPO-D-20-0056.1
Steele M., Boyd T. (1998). Retreat of the Cold Halocline Layer in the Arctic Ocean. J. Geophys. Res. - Ocean. 103, 10419–10435. doi: 10.1029/98JC00580
Steele M., Morison J., Ermold W., Rigor I., Ortmeyer M., Shimada K. (2004). Circulation of Summer Pacific Halocline Water in the Arctic Ocean. J. Geophys. Res.: Ocean. 109, C02027. doi: 10.1029/2003JC002009
Steele M., Morley R., Ermold W. (2001). Phc: A Global Ocean Hydrography With a High Quality Arctic Ocean. J. Climate 14, 2079–2087. doi: 10.1175/1520-0442(2001)014<2079:PAGOHW>2.0.CO;2
Stewart K. D., Kim W. M., Urakawa S., Hogg A. M., Yeager S., Tsujino H., et al. (2020). Jra55-Do-Based Repeat Year Forcing Datasets for Driving Ocean–Sea-Ice Models. Ocean. Modell. 147, 101557. doi: 10.1016/j.ocemod.2019.101557
Tesi T., Muschitiello F., Mollenhauer G., Miserocchi S., Langone L., Ceccarelli C., et al. (2021). Rapid Atlantification Along the Fram Strait at the Beginning of the 20th Century. Sci. Adv. 7, eabj2946. doi: 10.1126/sciadv.abj2946
Thompson D. W. J., Wallace J. M. (1998). The Arctic Oscillation Signature in the Wintertime Geopotential Height and Temperature Fields. Geophys. Res. Lett. 25, 1297–1300. doi: 10.1029/98GL00950
Timmermans M.-L., Marshall J. (2020). Understanding Arctic Ocean Circulation: A Review of Ocean Dynamics in a Changing Climate. J. Geophys. Res.: Ocean. 125, e2018JC014378. doi: 10.1029/2018JC014378
Timmermans M.-L., Toole J., Proshutinsky A., Krishfield R., Plueddemann A. (2008). Eddies in the Canada Basin, Arctic Ocean, Observed From Ice-Tethered Profilers. J. Phys. Oceanog. 38, 133–145. doi: 10.1175/2007JPO3782.1
Tsujino H., Urakawa S., Nakano H., Small R. J., Kim W. M., Yeager S. G., et al. (2018). JRA-55 Based Surface Dataset for Driving Ocean–Sea-Ice Models (JRA55-Do). Ocean. Model. 130, 79–139. doi: 10.1016/j.ocemod.2018.07.002
von Appen W.-J., Schauer U., Hattermann T., Beszczynska-Möller A. (2016). Seasonal Cycle of Mesoscale Instability of the West Spitsbergen Current. J. Phys. Oceanog. 46, 1231–1254. doi: 10.1175/JPO-D-15-0184.1
Wang Q. (2021). Stronger Variability in the Arctic Ocean Induced by Sea Ice Decline in a Warming Climate: Freshwater Storage, Dynamic Sea Level and Surface Circulation. J. Geophys. Research-Ocean. 126, e2020JC016886. doi: 10.1029/2020JC016886
Wang Q., Danilov S., Mu L., Sidorenko D., Wekerle C. (2021a). Lasting Impact of Winds on Arctic Sea Ice Through the Ocean’s Memory. Cryosph. 15, 4703–4725. doi: 10.5194/tc-15-4703-2021
Wang Q., Danilov S., Sidorenko D., Timmermann R., Wekerle C., Wang X., et al. (2014). The Finite Element Sea Ice-Ocean Model (FESOM) V.1.4: Formulation of an Ocean General Circulation Model. Geosci. Model Dev. 7, 663–693. doi: 10.5194/gmd-7-663-2014
Wang Q., Danilov S., Sidorenko D., Wang X. (2021b). Circulation Pathways and Exports of Arctic River Runoff Influenced by Atmospheric Circulation Regimes. Front. Mar. Sci. 8, 1153. doi: 10.3389/fmars.2021.707593
Wang Q., Ilicak M., Gerdes R., Drange H., Aksenov Y., Bailey D. A., et al. (2016). An Assessment of the Arctic Ocean in a Suite of Interannual CORE-II Simulations. Part II: Liquid Freshwater. Ocean. Model. 99, 86–109. doi: 10.1016/j.ocemod.2015.12.009
Wang Q., Marshall J., Scott J., Meneghello G., Danilov S., Jung T. (2019a). On the Feedback of Ice - Ocean Stress Coupling From Geostrophic Currents in an Anticyclonic Wind Regime Over the Beaufort Gyre. J. Phys. Oceanogr. 49, 369–383. doi: 10.1175/JPO-D-18-0185.1
Wang S., Wang Q., Shu Q., Song Z., Lohmann G., Danilov S., et al. (2021c). Nonmonotonic Change of the Arctic Ocean Freshwater Storage Capability in a Warming Climate. Geophys. Res. Lett. 48, e2020GL090951. doi: 10.1029/2020GL090951
Wang Q., Wekerle C., Danilov S., Koldunov N., Sidorenko D., Sein D., et al. (2018a). Arctic Sea Ice Decline Significantly Contributed to the Unprecedented Liquid Freshwater Accumulation in the Beaufort Gyre of the Arctic Ocean. Geophys. Res. Lett. 45, 4956–4964. doi: 10.1029/2018GL077901
Wang Q., Wekerle C., Danilov S., Sidorenko D., Koldunov N., Sein D., et al. (2019b). Recent Sea Ice Decline did Not Significantly Increase the Total Liquid Freshwater Content of the Arctic Ocean. J. Climate 32, 15–32. doi: 10.1175/JCLI-D-18-0237.1
Wang Q., Wekerle C., Danilov S., Wang X., Jung T. (2018b). A 4.5 Km Resolution Arctic Ocean Simulation With the Global Multi-Resolution Model FESOM 1.4. Geosci. Model Dev. 11, 1229–1255. doi: 10.5194/gmd-11-1229-2018
Wang Q., Wekerle C., Wang X., Danilov S., Koldunov N., Sein D., et al. (2020). Intensification of the Atlantic Water Supply to the Arctic Ocean Through Fram Strait Induced by Arctic Sea Ice Decline. Geophys. Res. Lett. 47, e2019GL086682. doi: 10.1029/2019GL086682
Wang J., Zhang J., Watanabe E., Ikeda M., Mizobata K., Walsh J. E., et al. (2009). Is the Dipole Anomaly a Major Driver to Record Lows in Arctic Summer Sea Ice Extent? Geophys. Res. Lett. 36, L05706. doi: 10.1029/2008GL036706
Woodgate R. (2018). Increases in the Pacific Inflow to the Arctic From 1990 to 2015, and Insights Into Seasonal Trends and Driving Mechanisms From Year-Round Bering Strait Mooring Data. Prog. Oceanogr. 160, 124–154. doi: 10.1016/j.pocean.2017.12.007
Woodgate R. A., Aagaard K., Muench R. D., Gunn J., Björk G., Rudels B., et al. (2001). The Arctic Ocean Boundary Current Along the Eurasian Slope and the Adjacent Lomonosov Ridge: Water Mass Properties, Transports and Transformations From Moored Instruments. Deep. Sea. Res. Part I: Oceanog. Res. Pap. 48, 1757–1792. doi: 10.1016/S0967-0637(00)00091-1
Wu B., Wang J., Walsh J. (2006). Dipole Anomaly in the Winer Arctic Atmosphere and Its Association With Sea Ice Motion. J. Climate 19, 210–225. doi: 10.1175/JCLI3619.1
Yang J., Proshutinsky A., Lin X. (2016). Dynamics of an Idealized Beaufort Gyre: 1. The Effect of a Small Beta and Lack of Western Boundaries. J. Geophys. Res. - Ocean. 121, 1249–1261. doi: 10.1002/2015JC011296
Zhang X., Ikeda M., Walsh J. E. (2003). Arctic Sea Ice and Freshwater Changes Driven by the Atmospheric Leading Mode in a Coupled Sea Ice–Ocean Model. J. Clim. 16, 2159–2177. doi: 10.1175/2758.1
Zhang J., Steele M., Runciman K., Dewey S., Morison J., Lee C., et al. (2016). The Beaufort Gyre Intensification and Stabilization: A Model-Observation Synthesis. J. Geophys. Res. - Ocean. 121, 7933–7952. doi: 10.1002/2016JC012196
Zhang W., Wang Q., Wang X., Danilov S. (2020). Mechanisms Driving the Interannual Variability of the Bering Strait Throughflow. J. Geophys. Res.: Ocean. 125, e2019JC015308. doi: 10.1029/2019JC015308
Zhang J., Weijer W., Steele M., Cheng W., Verma T., Veneziani M. (2021). Labrador Sea Freshening Linked to Beaufort Gyre Freshwater Release. Nat. Commun. 12, 1229. doi: 10.1038/s41467-021-21470-3
Keywords: Arctic Ocean circulation, sea ice decline, Arctic Oscillation, Beaufort High, geostrophic current
Citation: Wang Q and Danilov S (2022) A Synthesis of the Upper Arctic Ocean Circulation During 2000–2019: Understanding the Roles of Wind Forcing and Sea Ice Decline. Front. Mar. Sci. 9:863204. doi: 10.3389/fmars.2022.863204
Received: 26 January 2022; Accepted: 08 April 2022;
Published: 18 May 2022.
Edited by:
David Docquier, Royal Meteorological Institute of Belgium, BelgiumReviewed by:
Karen M. Assmann, Norwegian Institute of Marine Research (IMR), NorwayPasha Karami, Swedish Meteorological and Hydrological Institute, Sweden
Copyright © 2022 Wang and Danilov. This is an open-access article distributed under the terms of the Creative Commons Attribution License (CC BY). The use, distribution or reproduction in other forums is permitted, provided the original author(s) and the copyright owner(s) are credited and that the original publication in this journal is cited, in accordance with accepted academic practice. No use, distribution or reproduction is permitted which does not comply with these terms.
*Correspondence: Qiang Wang, UWlhbmcuV2FuZ0Bhd2kuZGU=