 Zhe Xu1,2,3
 Shuo-Zeng Dou
 Shao-Xiong Ding
 Jin-Xian Liu
95% of researchers rate our articles as excellent or good
Learn more about the work of our research integrity team to safeguard the quality of each article we publish.
Find out more
ORIGINAL RESEARCH article
Front. Mar. Sci. , 28 April 2022
Sec. Marine Evolutionary Biology, Biogeography and Species Diversity
Volume 9 - 2022 | https://doi.org/10.3389/fmars.2022.861840
Almost all the commercial fishery stocks have been overexploited, resulting in dramatic populations decline and phenotypic change. Understanding the genetic effects of overexploitation have important implications for the conservation and management of fishery resources. In the present study, we investigated temporal changes of genetic diversity and spatio-temporal genetic structure in the heavily exploited large yellow croaker (Larimichthys crocea) in the East China Sea, through microsatellite analysis of historical and contemporary samples. Despite the drastic population decline, we found no significant decline in measures of genetic diversity (Ar, He and FIS). The contemporary effective population sizes were still large enough and genetic drift was not strong enough to reduce the genetic diversity of large yellow croaker significantly in the East China Sea. Furthermore, no evidence of spatio-temporal genetic structure was detected. All the analysis of genetic structure indicated that the proportion of variance explained by temporal factors was small and similar with that of spatial factors. We therefore concluded that the genetic structure of the large yellow croaker in the East China Sea has been essentially stable over the time-span of 60 years. These results suggested that the drastic population declines did not change genetic composition of large yellow croaker in the East China Sea. Based on the long-term stable temporal pattern of genetic composition, we suggested that fishing restrictions and habitat restoration should be the most direct and effective management strategy for the recovery of large yellow croaker stocks.
Genetic diversity is important for both short-term fitness of individuals and long-term survival of populations by facilitating adaptation of organisms to changing environmental conditions (Danish et al., 2021). Anthropogenic activities might lead to changes of genetic diversity in many species (Hendry et al., 2017), however, the magnitude and extent remain poorly understood. Since last century, commercial overfishing strongly impacted the target fishes’ biomass and quickly exhausted the fishery resources in many commercially important stocks (Ludwig et al., 1993; Botsford et al., 1997). It was estimated that 31% of marine fish stocks were under overfishing (FAO, 2016). Because individuals of the overexploited populations with reduced population size may unable to maintain the full range of the original genetic variability, genetic erosion was observed in some overexploited fish stocks (Hauser et al., 2002; Lage and Kornfield, 2006). Genetic drift has a greater effect on small populations and would result in loss of alleles and reduction of heterozygosity (Hoelzel et al., 2006; Allendorf et al., 2008). Reduction in genetic diversity has been associated with inbreeding depression, accumulation of deleterious alleles, reduced adaptive potential and ultimately increased risk of extinction (Frankham et al., 2002). Long-term overexploitation has also been shown to alter life-history traits of fish, such as faster growth rate and reduction in age and size at maturity etc. (Enberg et al., 2012). These rapid changes of life history traits may result from phenotypic plasticity, small allele frequency changes at many loci, or a combination of the two (Pinsky et al., 2021). Intact genetic diversity can preserve the genetic basis for phenotypic reversal and the potential for recovery of previous traits after the population recovers toward unfished biomass (Pinsky et al., 2021). In terms of management perspectives, the aim of long-term fisheries management plans should be designed to conserve genetic diversity of wild stocks (Danish et al., 2021).
However, reduction of genetic diversity in over-exploited fish populations is not universally supported (Hauser et al., 2002). Generally, genetic diversity is reduced only in very small populations (Nei et al., 1975), and the so called “collapsed” stocks might still contain abundant individuals to maintain the genetic diversity from declining (Ryman et al., 1995). Indeed, some studies detected no depletion of genetic variability after decades of overexploitation (Hoarau et al., 2005; Cuveliers et al., 2011; Pinsky et al., 2021). Due to the lack of suitable pre-overexploitation samples, it is often complicated to verify whether genetic diversity declined or not in wild stocks after intensive exploitation. Archived otoliths and scales collected by fisheries scientists decades or even centuries ago form an ideal source of historical DNA that could provide invaluable insight into the baseline genetic patterns of the past (Nielsen and Hansen, 2008). Combined with a detailed knowledge on demography, genetic analyses by using historical archived otoliths and scales could test whether there were temporal changes of genetic diversity for fish stocks under long-term overfishing pressure (Hauser et al., 2002; Lage and Kornfield, 2006; Poulsen et al., 2006; Cuveliers et al., 2011; Marie et al., 2010; Cuveliers et al., 2011; Caudron et al., 2014; Pita et al., 2017). The Northwestern Pacific Ocean is one of the most exploited fishing regions of the world with over 53% of fishery stocks facing overexploitation or recession (Cao et al., 2017). However, few studies have comprehensively monitored temporal genetic diversity changes of fish stocks in the area so far.
The large yellow croaker (Larimichthys crocea) is an economically essential marine fish species endemic to the Northwestern Pacific Ocean. It was once one of the three top commercial fish species in China (Liu and Mitcheson, 2008). Unfortunately, wild stocks of large yellow croaker had severely suffered from overexploitation and abruptly decreased from 1950s onwards (Liu et al., 2020). After peaking at about 200 000 tonnes of harvest in the mid-1970s, the stocks were roughly exhausted by the mid-1980s to 1990s. Due to the sharp decrease of population size, harvests of the large yellow croaker in China declined by over 90% within just two decades (Liu and Mitcheson, 2008). The wild stock yields dropped to 9 000 tonnes in the 1990s and less than 1 000 tonnes in recent years (Liu et al., 2020). The estimates of stock size for large yellow croaker was about 430 000 tonnes between the late1950s and early1970s and dropped to a fairly low level (about 36 000 tonnes) in the early1980s (Kong, 1985; Kong and Zhu, 1988). Recent fishery investigations demonstrated that wild large yellow croaker is rare in the East China Sea where both spawning and over-wintering aggregations disappeared (Zhao et al., 2002; Xu and Zhou, 2003). Meanwhile, life-history traits changes due to overexploitation have been observed in large yellow croaker (Liu and Mitcheson, 2008). For example, reduction in age and size at maturation and faster growth were detected in the overexploited stocks of large yellow croaker between the 1950s and 1990s (Liu et al., 2020). Wild stocks of L. crocea are on the brink of extinction and it is categorised as a critically endangered species in the IUCN Red List (Liu et al., 2020). Between the 1950s and early 1980s, about 90% of global yields (by weight) of large yellow croaker were from the East China Sea (Liu and Mitcheson, 2008). Thus, the sharp depletion of large yellow croaker stocks in the East China Sea provides a unique opportunity to investigate genetic impact of overexploitation in an overexploited fishery species.
To investigate the effect of long-term overexploitation on the genetic diversity of large yellow croaker populations in the East China Sea, we analysed the genetic diverisy of both historical and contemporary samples by using microsatellite markers. The aim of the present study was twofold: (1) whether the overexploitation resulted in depletion of genetic diversity that could lead to a adverse effect in evolutionary potential; and (2) whether the spatio-temporal genetic structure was stable under the sustaining overexploited pressure. The results could be important for the design of management strategies for large yellow croaker in the East China Sea.
Samples of archived otoliths for large yellow croaker were collected through a series of research surveys by the Institute of Oceanology, Chinese Academy of Science (IOCAS, China) in 1960s and 1980s. Otoliths were preserved dry in paper envelopes at room temperature. Contemporary samples were collected from 2016 to 2020 and fin clips or muscular tissue of each individual were preserved in 95% ethanol. All the samples were collected from different locations in the East China Sea (Figure 1). A total of 130 archived otoliths and 67 contemporary specimens were collected (Table 1 and Figure 1).
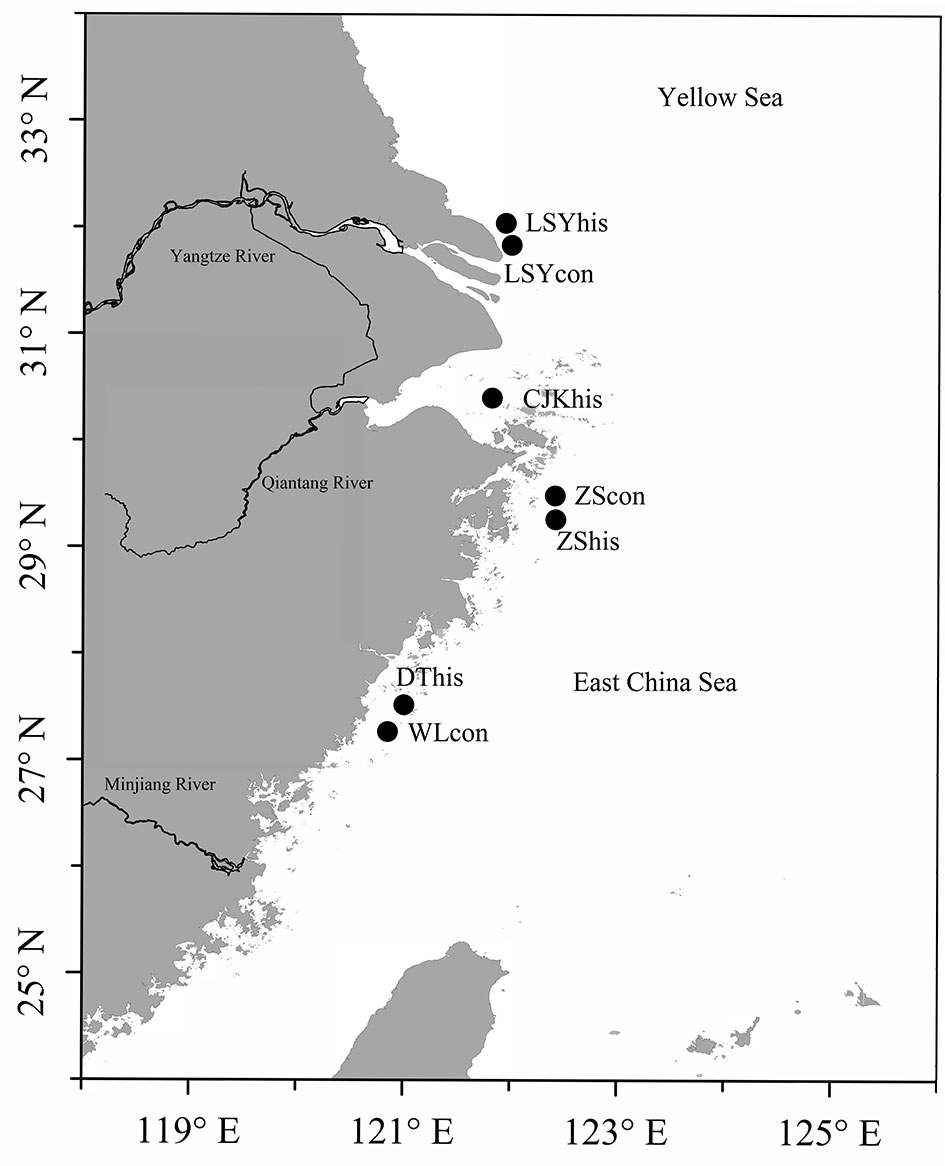
Figure 1 Map showing sampling locations (approximate position). The solid circle indicates the location of the large yellow croaker collected between 1960 and 2020.
Table 1 Summary of sample details, including code name, location, year of sampling, sample sizes and source of DNA.
Genomic DNA was extracted from the archived otoliths using the EDTA-SDS extraction protocol (Firidin et al., 2017) and subsequently stored at -20°C. For contemporary samples, DNA was extracted from fin or muscular tissue by standard phenol-chloroform extraction and ethanol precipitation (Taggart et al., 1992). Microsatellite discovery and primer design were performed with QDD 3.1.2 (Meglecz et al., 2010) by using the large yellow croaker reference genome (GenBank assembly accession: GCA_000972845.2) on a local Galaxy plarform with default parameters (Afgan et al., 2016). In order to enhance the ability to amplify degraded historical DNA and ensure polymorphism of microsatellite loci, sequences with microsatellites (pure tandem repeats of di- nucleotide motif with at least eleven uninterrupted repeats) and targeted length ranging from 100-180 bases were selected for primers design. To ensure that the analysed microsatellite loci were unlinked, we selected loci on different chromosomes in the large yellow croaker genome (Table S1). Finally, 7 polymophic microsatellite loci were selected for subsequent analysis (Table S1). The amplification of the 7 microsatellite loci was performed by the PCR protocol described in Xue et al. (2017). All the amplified loci were analysed through an automated capillary sequencer ABI (Applied Biosystems) and allele sizes were determined with the GS500-ROX size standard GeneMarker 2.2.0 (SoftGenetics, State College, USA).
Historical DNA is particularly prone to genotyping errors due to its degradation and potential contamination from exogenous DNA, which increases the risks for allele dropout and null alleles. To address these issues, a standardized protocol was used for DNA extraction and genotyping. Firstly, all extractions and preparation of PCRs for historical samples were carried out in a laminar flow clean bench equipped with periodic sterilization. Negative controls were included at all stages. Secondly, DNA extractions and PCRs were performed independently for different samples, in order to avoid potential contamination of DNA between samples. In addition, extraction and genotyping of contemporary samples were conducted after historical samples. Specimens that were failed in genotyping after three trials were discarded.
Microstellites were tested for potential presence of genotyping errors due to large allele dropout, stuttering and null alleles by using Microchecker 2.2.1 (Van Oosterhout et al., 2004). Genetic diversity indices including number of alleles (Na), average observed heterozygosity (Ho), average expected heterozygosity (He) were calculated for each sample using the GENALEX 6.5 (Peakall and Smouse, 2006). Measures of genetic diversity including allelic richness (Ar) based on the smallest population size and inbreeding coefficient (FIS) were calculated using FSTAT 2.9.3 (Goudet, 2001). In order to test whether there was temporal changes of genetic diversity, one-way analysis of variance (ANOVA) were performed on Ar, He, FIS among temporal samples. Departure from Hardy-Weinberg equilibrium (HWE) were tested using Genepop 4.3 (Rousset, 2014). A sequential Bonferroni correction of p-values was applied to account for an increase in type-I error from multiple comparisons (Rice, 1989).
As a precautionary measure against low sample sizes and the limited number of microsatellite loci employed in this study, we used POWSIM 4.1 (Ryman and Palm, 2006) to assess the statistical power of our dataset (Table S2). Different levels of FST values (0.001 to 0.05) were generated using an effective population size of 2000 with 200 runs of 1000 iterations. The null hypothesis of genetic homogeneity was tested with Fisher exact test and chi-square test. The proportion of significances (p < 0.05) represented an estimate of the power.
Global and pairwise FST values were calculated using Genepop 4.3 (Rousset, 2014) and GENALEX 6.5 (Peakall and Smouse, 2006) respectively. The significance of each pairwise FST was assessed by 10,000 bootstrap permutations. The p value of pairwise FST was adjusted using a Bonferroni correction (Rice, 1989). Population genetic structure was assessed through Bayesian clustering of microsatellite genotypes as implemented in STRUCTURE 2.3.4 (Pritchard et al., 2000). Ten independent runs were conducted for different numbers of genetic clusters (K=1 to K=7), each with a burn-in period of 50,000 chains followed by 500,000 MCMC iterations, and with no prior knowledge of sampling locations. Admixture models with correlated allele frequencies were applied. To determine the most probable value of K, the Delta K method was used as implemented in Structure Selector (Li and Liu, 2018). Subsequently, the software CLUMPAK (Kopelman et al., 2015) was used to create a graphical representation of STRUCTURE outputs. Principle Components Analysis (PCA) was also conducted to assess genetic structure based on allele frequencies by R package adegenet 1.2-2 (Jombart, 2008).
Analysis of molecular variance (AMOVA) was performed in GENALEX 6.5 (Peakall and Smouse, 2006) to check how the genetic variations was partitioned temporally (among periods) and spatially (among locations). We conducted two AMOVA tests, which partitioned genetic variation (1) among the three sampling periods (1960s, 1980s and contemporary samples), emphasizing temporal variation, and (2) among the two geographic groups (historical Lvsiyang, historical Zhoushan, historical Yangtze River Estuary, contemporary Lvsiyang, contemporary Zhoushan vs. historical Dongtou, contemporary Wenling), focussing on spatial variation.
A redundancy analysis (RDA) was performed to investigate the relationships between genetic structure and spatio-temporal factors (latitude and longitude, year of sample collection) (Lepš, 2003). A set of spatial factors (Spatial1, Spatial 2 and Spatial 3) were generated using the distance-based Moran’s eigenvector maps (dbMEM), based on Cartesian coordinates generated from latitude and longitude coordinates. In addition, temporal factor was confirmed by using sampling time directly. Variation partitioning analysis (VPA) was conducted to address the relative contribution of the spatial and temporal factors and their conbined effect on shaping genetic structure (Peres-Neto et al., 2006). The relative contribution of both components could be explained by pure spatial variables (S|T), pure temporal variables (T|S), spatial variables (S), temporal variables (T) and the combined effects of both spatial and temporal variables (S∩T), respectively. The residual proportion represents the unexplained variance. Significance testing for each variable were conducted with permutation test. All these analyses were performed in the R software (R Core Team, 2019).
Effective population size (Ne) is an important element in efforts to conserve genetic diversity (Poulsen et al., 2006). Ne determines levels of inbreeding and magnitude of genetic diversity erosion for populations due to random genetic drift (Poulsen et al., 2006). Therefore, obtaining reliable estimates of Ne for large yellow croaker populations is of primary importance to evaluate whether populations are able to maintain sufficient genetic variation.
Ne was calculated based on linkage disequilibrium (LD) method implemented in NeEstimator v2 (Waples and Do, 2008; Do et al., 2013), which was considered to be an estimator of inbreeding Ne (Luikart et al., 2010). The method calculates the correlation among alleles at unlinked loci and corrects for downward bias associated with small sample sizes (Waples, 2006). Confidence intervals were determined by jackknifing on loci and the allowed frequency of observed alleles was set at 0.05 because alleles occurring at low frequencies may lead to biased results (Waples and Do, 2008).
Missing genotypes accounted for 0.073% of the overall dataset. There was a lack of allele dropout and stuttering throughout the entire dataset. The occurrence of null alleles was detected in 15 of 49 tests, involving both contemporary (6 instances) and historical samples (9 instances). Since no loci showed systematic presence of null alleles, all loci were used for subsequent analyses. Out of 49 locus-population pairs, 10 pairs were significantly deviated from HWE after Bonferroni correction (n=49, α=0.00102).
The seven microsatellite loci analysed were highly polymorphic across all the samples (Table 2). Average Ar ranged from 8.704 in historical Yangtze River Estuary to 10.725 in historical Dongtou. Average expected heterozygosity (He) across all loci ranged from 0.725 in historical Zhoushan to 0.837 in contemporary Wenling. Average observed heterozygosity (Ho) ranged from 0.875 in historical Zhoushan to 0.707 in contemporary Lvsiyang. The inbreeding coefficient (FIS) varied from -0.02 in historical Yangtze River Estuary to 0.169 in contemporary Lvsiyang. No statistically significant difference were detected for the average Ar among temporal samples (p = 0.211 for 1960s vs. contemporary samples; p = 0.106 for historical vs. contemporary samples). Average He was similar among all temporal samples (p = 0.204 for 1960s vs. contemporary samples; p = 0.153 for historical vs. contemporary samples). In addition, we found no significant temporal changes for FIS (p = 0.452 for 1960s vs. contemporary populations; p = 0.249 for historical vs. contemporary samples). These results indicated that there was no depletion of genetic diversity for large yellow croaker stocks in the East China Sea despite overexploitation.
Table 2 Summary statistics of genetic variations by populations: number of alleles (Na), Allelic richness (Ar) (based on smallest population size of 19), average observed heterozygosity (Ho), average expected heterozygosity (He), inbreeding coefficient (FIS) and effective population size Ne [95% CI].
The POWSIM analyses showed that the combination of the 7 microsatellite loci and sample sizes provided a statistical power sufficient to detect a low level of differentiation. Indeed FST = 0.005 or larger could be detected with a probability of at least 96% across all samples (Chi and Fisher exact test; Table S2) and the estimated FST in our data set ranged from 0.005 to 0.027. Thus the microsatellite loci were powerful enough to differentiate populations.The global FST was 0.0144, which reflected a shallow genetic differentiation across samples in the East China Sea. The pairwise FST were low, ranging from 0.005 to 0.027 and significant genetic differentiation was detected for only six comparisons (Table 3). The STRUCTURE analysis showed highest support for two (K = 2 with the highest Delta K) clusters among the samples, with three historical samples (LSYhis, ZShis and CJKhis) forming one genetic group and the rest four samples grouping into another one (Figure 2). Most of the significant genetic differentiation were from comparisons between historical and contemporary samples, which was consistent with the estimates of FST. No significant genetic differentiation was observed among contemporary populations, suggesting the existence of a single panmictic population across its distribution. However, the PCA analysis showed that all the 7 samples formed a single cluster and overlapped with each other, which was consistent with the low FST estimates (Figure 3). The two hierarchical (temporal grouping and geographical grouping) AMOVA demonstrated that over 98% of genetic variation was within populations and only 0.76% and 0.72% of the total genetic variation was attributed to temporal structure and spatial structure, respectively (Table 4). FCT was non-significant among either geographic groups (p = 0.076) or periods groups (p = 0.134).
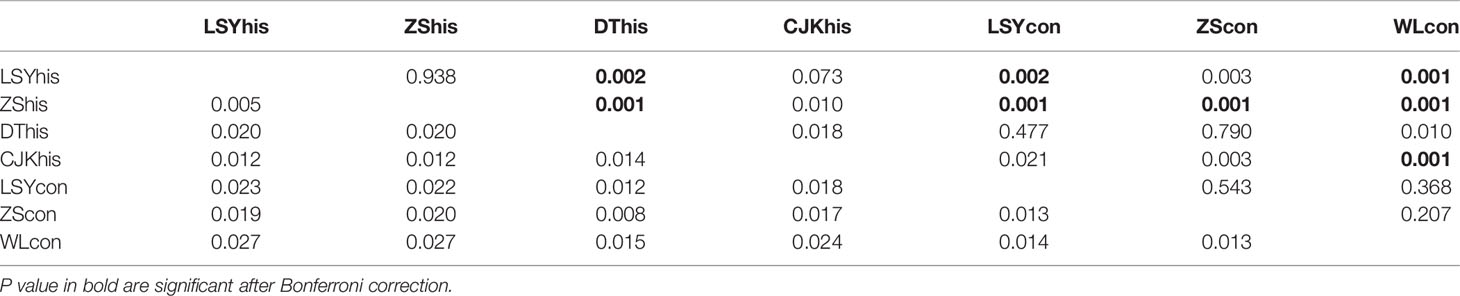
Table 3 Pairwise estimates of FST (below diagonal) and P value (above diagonal) for seven populations of large yellow croaker.
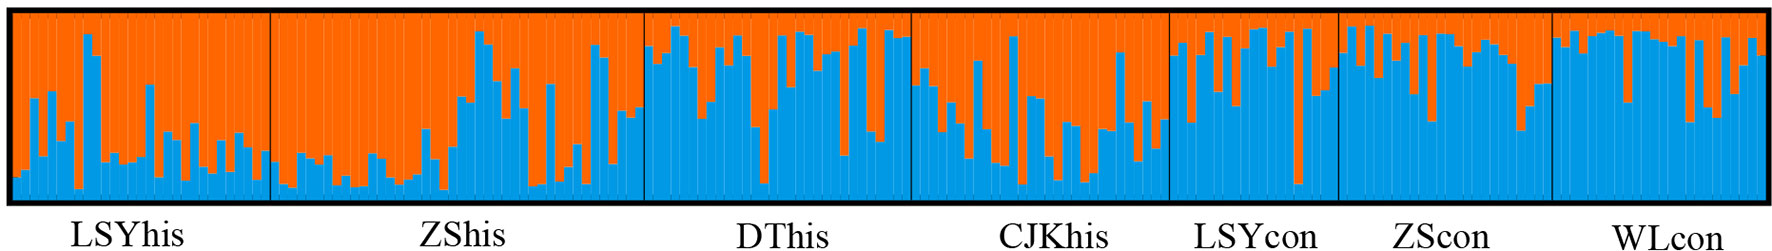
Figure 2 Population genetic structure analysis for microsatellite genotypes of large yellow croaker implemented in STRUCTURE. Structure clustering results obtained at K=2 was shown. Barplots showing posterior probabilities of individual genotypes (as bars) assigned to each population.
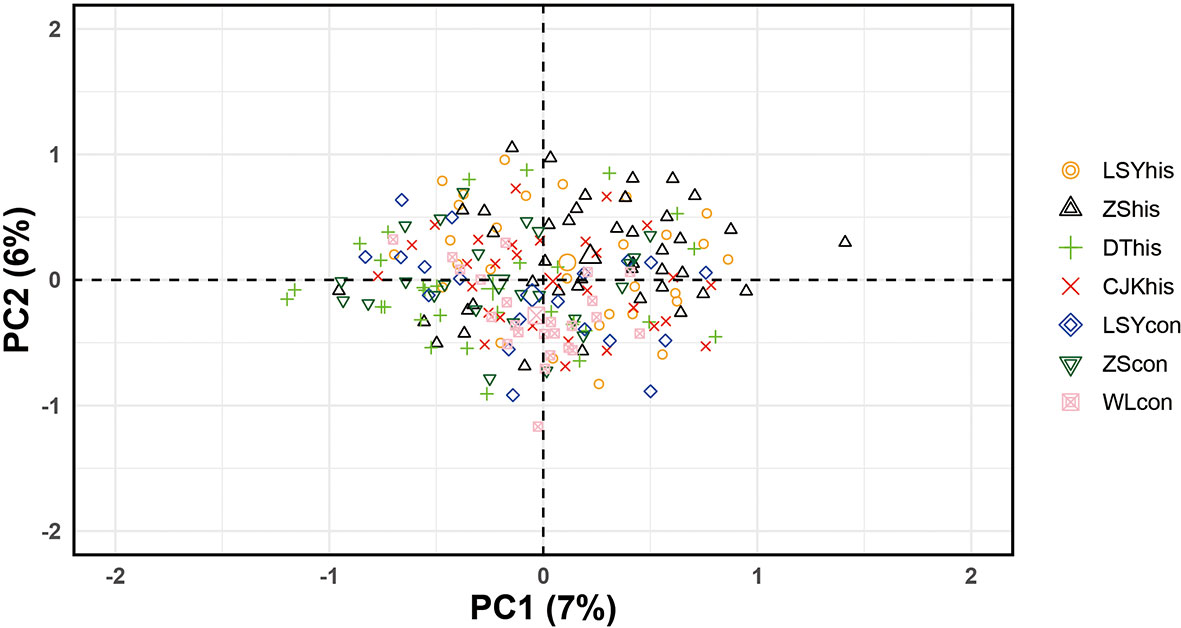
Figure 3 Principal Components Analysis biplot for large yellow croaker populations: axis 1 versus axis 2. The x axis explains 7% and the y axis 6% of variation. The oval outlines represent 95% confidential intervals and are colored for each population.
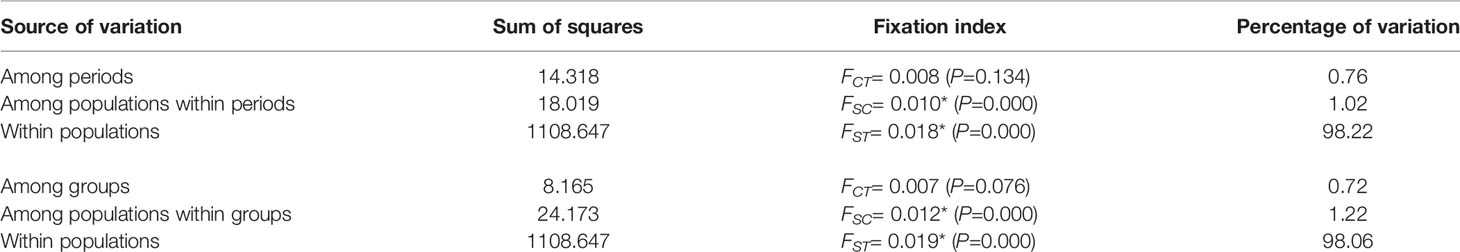
Table 4 Results of hierarchical AMOVA, showing the distribution of genetic variation among three sampling periods (1960s, 1980s, Current) and among the geographic groups. Significant F-statistics were indicated with an asterisk.
The results of RDA suggested that temporal factors played a similar role in explaining genetic structure compared with spatial factors (Figure 4A). VPA (Figure 4B) revealed that the proportion of pure temporal variation (2.1%) among all samples basically coincided with that of pure spatial factors (1.6%). Remarkably, a large amount of variation (96%) could not be explained by spatial or temporal factors, implying that spatio-temporal factors did not have a significant impact on genetic structure. Although the likelihood of not detecting temporal genetic differentiation could not be excluded, the real degree of temporal genetic differentiation must, nevertheless, had been very small.
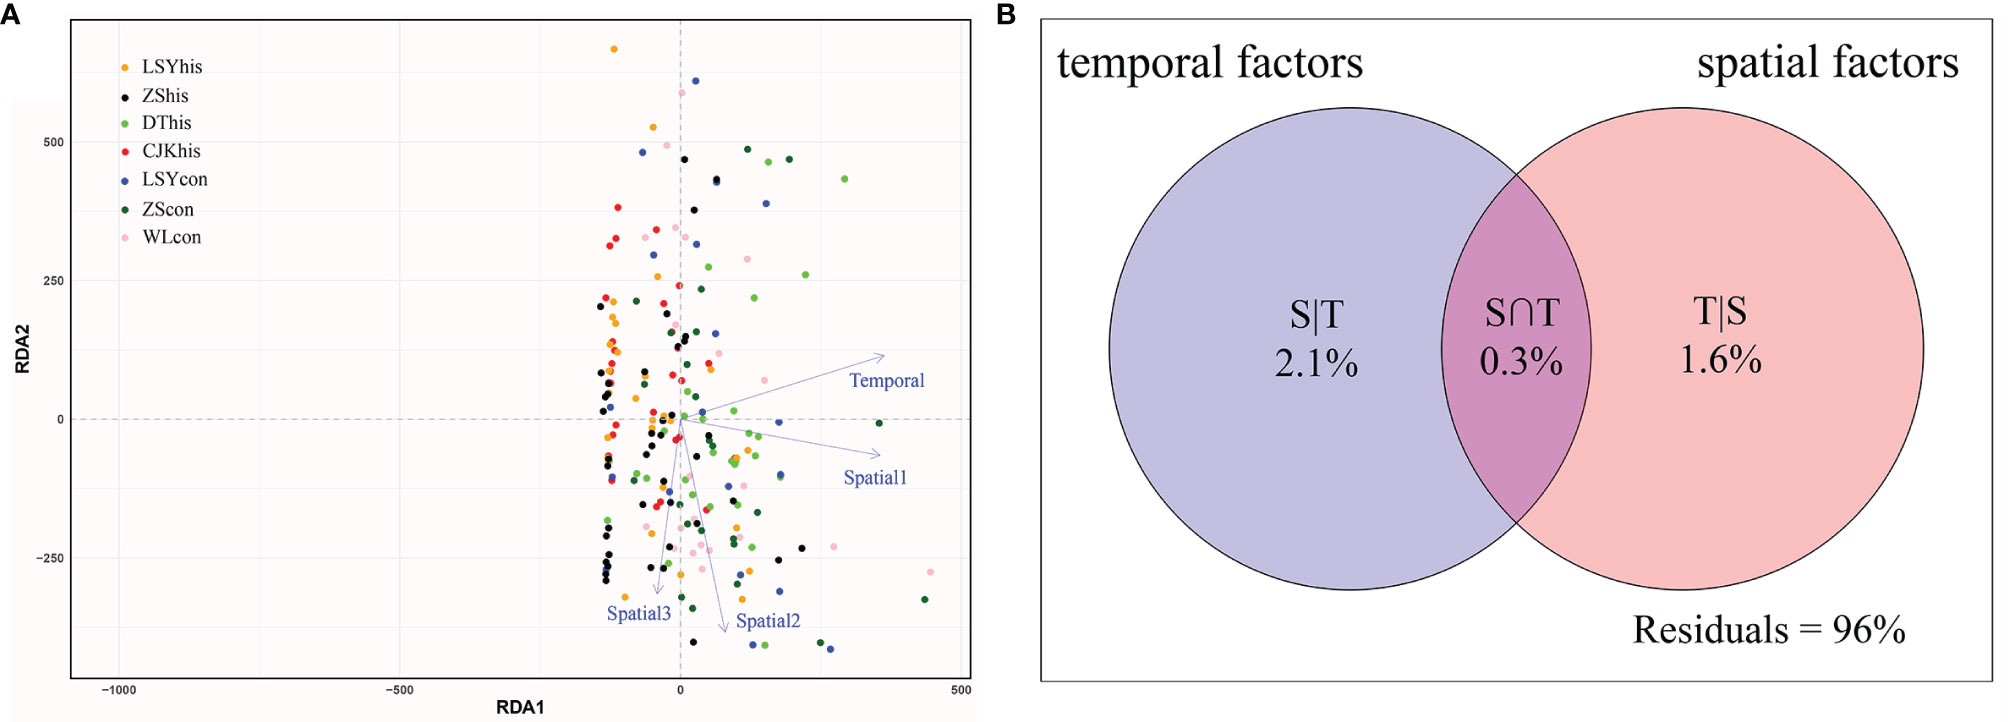
Figure 4 Influence of temporal and spatial factors as shown by (A) the redundancy analysis (RDA) and (B) variation partitioning analysis (VPA). RDA was conducted to show significant temporal and spatial factors in governing the shaping of genetic structure of large yellow croaker. VPA was performed to quantify the contribution of temporal and spatial factors to genetic structure. Spatial factors were generated using the distance-based Moran’s eigenvector maps (dbMEM). Dot color indicates samples from different localities.
Estimates of effective population size using LD method were listed in Table 2. The Ne estimates for 1960s samples ranged from 120.8 to infinite with lower bounds of confidence interval (CI) ranging from 28.7 to 388.3. Ne estimate for historical Yangtze River Estuary in 1980s was 95.7 with a lower bound of CI of 28.6. For the three contemporary samples, Ne estimates was infinite for Lvsiyang and Wenling, and 176.1 for Zhoushan, with the lower bounds of CI ranging from 34.6 to 82.6. The upper bounds of CI were infinite for all the 7 samples.
Analysis of long-term temporal genetic changes for fish stocks has so far been limited in the Northwestern Pacific Ocean, even though many stocks were overexploited. In the present study, we conducted a large scale genetic analysis by comparing both historical and contemporary samples of large yellow croaker in the East China Sea using polymorphic microsatellites. We provided a comprehensive spatio-temporal framework to understand evolutionary process of large yellow croaker stocks in the East China Sea, in the context of continuous overexploitation. We clearly demonstrated that the long-term overexploitation had not yet lead to detectable decrease of genetic diversity and the genetic structure was spatio-temporal stable. Our results provided new insights into genetic effects of overexploitation on fishery stocks, which could be informative for future conservation efforts of this overexploited species.
Estimates of genetic diversity from both historical and contemporary samples enable us to understand the evolutionary effects of overfishing for overexploited fishery resources. The historical samples in 1960s and 1980s corresponded to large yellow croaker stocks under initial lower fishing stress and population exhaustion after higher fishing stress respectively. Despite sharp decrease in stock size and rapid changes of life-history traits over several decades, no signal of depletion for genetic diversity (Ar, He and FIS) was detected for large yellow croaker in the East China Sea. The results suggested that neither genetic drift nor gene flow from allopatric populations had strongly altered the genetic composition of stocks in the East China Sea over this time-span. Consistent with our results, a recent genetic study with three molecular markers also detected relatively high genetic diversity in wild populations of large yellow croaker, which was comparable to those of othermarine fishes (Yuan et al., 2021). Our result was also consistent with previous results of temporal genetic analysis in Atlantic salmon, Brown trout, North Sea sole and Copper redhorse, which also documented temporal stability of genetic diversity over decades of overexploitation (Hansen et al., 2002; Lippe et al., 2006; Cuveliers et al., 2011; Pinsky et al., 2021). For example, genetic erosion were detected neither in the Icelandic nor North Sea stocks of the North Sea sole despite stock crashes in the last century (Hoarau et al., 2005).
Changes of life-history traits together with population declines have been observed in many overexploited fishery stocks (Law, 2000). By contrast, loss of genetic diversity most likely happens when populations are both very small and isolated (Palstra and Ruzzante, 2008). For marine populations, the fishery would likely collapse before the decreased genetic diversity could be detected (Boehlert, 1996). In the classical conservation genetic context, an Ne≥50 is enough to maintain short-term genetic diversity, and an Ne≥500 is sufficient to maintain a longer-term genetic stability (Hoarau et al., 2005). No apparent decrease of Ne was detected for large yellow croaker stocks in the East China Sea over the last 60 years. All of the Ne estimates showed broad confidence intervals with infinite upper boudance of confidance interval. The contemporay effective population sizes were still large enough and genetic drift was probably not strong enough to deplete the genetic diversity. In addition, a mechanism of genetic compensation acting against the negative genetic effects from overexploitation might exist (Palstra and Ruzzante, 2008), which might be interpreted by the reduction of competition for mating partners or spawning sites with lower census population size, leading to more equal reproductive output and a more balanced sex ratio. In general, reproductive success in marine fish of high fecundity strongly depends on larger and older females, which could produce more eggs of good quality (Chambers and Leggett, 1996; Palumbi, 2004; Wright and Trippel, 2009). The removal of those older and larger females by a size-selective fishery might give many other less productive smaller females opportunity of becoming ‘reproductive winners’ (Cuveliers et al., 2011). This might in turn reduce the variance resulting from differences of reproductive success among individuals, so that the population could maintain more genetic diversity. Moreover, the large yellow croaker has high migration ability which facilitates high connectivity among populations (Ma et al., 2016), and gene flow from adjacent populations may be enough to buffer any loss of genetic variation.
Determining the genetic structure is essential for stock improvement and conservation plans (Danish et al., 2021). Results of population genetic analyses indicated that population genetic structure was shallow for large yellow croaker stocks in the East China Sea. The sporadic significant FST together with the result of STRUCTURE suggested marginal genetic differentiation among some comparisons between temporal samples. In contrast, the results of PCA indicated that all the temporal populations were clustered together, and no spatio-temporal genetic structure were observed, suggesting a low resolution power of this method for the shallow population structure as revealed by the low FST values. AMOVA together with RDA and VPA analysis proved that the proportion of variance explained by temporal factors was small and similar with that of spatial factors. The marginal temporal genetic variation was possibly due to a random genetic drift. It is likely that temporal variations in reproductive success led to random slight allele frequency shifts among generational cohorts and that cumulative genetic variation may be observed after several decades (Han et al., 2010). Especially under the impact of overfishing, the effects of genetic drift might be amplified due to the reduced census population size. However, technical factors could not be excluded. Statistically significant but biologically insignificant differentiation may easily occur at hypervariable markers such as microsatellites (Hansen et al., 2002). Besides, technical errors resulting from mis-scoring or the presence of null alleles remain a concern in historical samples and may lead to biased results. In conclusion, the spatio-temporal genetic structure of the large yellow croaker stocks has essentially been stable. Sporadic genetic differentiation among temporal samples might occur due to random genetic drift or technical errors. To a large extent, these results were in accordance with previous studies on populaiton genetic structure of large yellow croaker in which a single panmictic population were suggested across its distribution (Han et al., 2015; Yuan et al., 2021). Our results indicated that the population genetic structure of large yellow croaker was generally spatio-temporal stable and had not been changed substantially due to the fishing pressure. This had important implications for the potential local adaptation for large yellow croaker and its stock management.
Evolutionary consequences of harvesting must be incorporated into conservation and management strategies (Pandolfi, 2009). Neither significant loss in genetic diversity nor apparent changes in spatio-temporal genetic structure were detected in large yellow croaker stocks in the East China Sea. Genetic diversity plays an important role in phenotypic reversal (Pinsky et al., 2021). The maintanence of genetic diversity in large yellow croaker stocks suggested that potential for stock recovery might still be maintained. So far, no severe threat of losing evolutionary potential due to genetic drift was expected in large yellow croaker populations. However, this optimistic conclusion needed to be treated with caution. Results in the present study based on microsatellite markers mostly reflected neutral variations and the possibility of genetic erosion in adaptive genomic regions could not be excluded. If effective population size of large yellow croaker was indeed large, role of selection could be strong so that the adaptive genomic regions might be more prone to be selected (Cuveliers et al., 2011). Thus, potential selective changes of genetic composition imposed by fisheries might be potent factors making irreversible changes in large yellow croaker populations.
Due to its long generation length (about 15.5 years) and late sexual maturity (about 2-4 years), stock recovery of the large yellow croaker should be difficult after heavy exploitation (Liu et al., 2020). Benefiting from success of artificial mariculture since 1985, stock enhancement of large yellow croaker by release of artificial seedlings was extensively conducted in the East China Sea (Wang et al., 2013). Stock enhancement has been one of the conventional strategies for stock recovery and management of large yellow croaker (Yuan et al., 2021). However, previous studies have shown that the ecological and genetic effects of hatchery releases are of real concern because of the potential in facilitating inbreeding depression and reducing the fitness of wild stocks (Grant et al., 2017), such as Atlantic salmon (Hagen et al., 2020), Salvelinus fontinalis (Marie et al., 2010), and Acanthopagrus schlegelii (Shan et al., 2020). Hatchery-reared large yellow croaker showed low genetic diversity, relaxed purifying selection and increased genetic loads, which might facilitate inbreeding depression and reduce the fitness of wild stocks (Yuan et al., 2021). So the effects of stock enhancement by release of hatchery seedlings should be carefully evaluated in the future. Our results suggested that the genetic diversity of contemporary large yellow croaker wild populations was still in an ideal condition. Considering its potential for self-resilience and the unknown effects of hatchery releases, avoidance of overfishing and habitat restoration should be the best management strategy for the recovery of large yellow croaker. In detail, fishery control measures, including controls of fishing effort and catch, temporal and spatial closures aimed at protecting spawning, nursery and over-wintering grounds and populations, should be regarded as specific actions toward the recovery of large yellow croaker stocks (Liu and Mitcheson, 2008).
The present study presented a comprehensive genetic survey on the long-term genetic effects for large yellow croaker in the East China Sea after long-term overexploitation. We did not detect signals of genetic erosion for large yellow croaker despite sporadic genetic differentiation for comparisons between historical and contemporary samples. We suggested that fishing restrictions and habitat restoration should be the most direct and effective management strategy for the recovery of large yellow croaker stocks.
There were still deficiencies in our study. Due to the difficulty in obtaining historical samples, sporadic historical samples in critical time point were used rather than a continuous time series samples, which may thus decrease the temporal resolution of genetic data. The restriction of genotyping technique makes it impossible to explore adaptive evolution in the process of overexploitation. Nevertheless, the historical genetic data could be served as an ideal baseline data set, which could be used to evaluate genetic effects of overexploitation. Further studies using advanced technology (e.g. high-throughout sequencing) and more historical samples would be necessary to distinguish and disentangle the fine genetic diversity changes and adaptive evolutionary changes of large yellow croaker after overexploitation.
The microsatellite data that support the findings of this study are openly available in Figshare with doi: 10.6084/m9.figshare.19403105.
The animal study was reviewed and approved by Animal Care Quality Assurance of the Institute of Oceanology, Chinese Academy of Sciences.
J-XL conceived the study. ZX performed the research. ZX analysed the data. S-ZD, S-XD provided samples. ZX and J-XL wrote the manuscript and all authors approved the final version of the manuscript. All authors contributed to the article and approved the submitted version.
This study was supported by National Natural Science Foundation of China (No. 41906080 and 42176133) and the National Key Research and Development Program of China (Grant No. 2018YFC1406301).
The authors declare that the research was conducted in the absence of any commercial or financial relationships that could be construed as a potential conflict of interest.
All claims expressed in this article are solely those of the authors and do not necessarily represent those of their affiliated organizations, or those of the publisher, the editors and the reviewers. Any product that may be evaluated in this article, or claim that may be made by its manufacturer, is not guaranteed or endorsed by the publisher.
We thank Yuqiang Li, Yulong Li, Mengyu Li and Tengfei Xing for their assistance with experiment and data analysis.
The Supplementary Material for this article can be found online at: https://www.frontiersin.org/articles/10.3389/fmars.2022.861840/full#supplementary-material
Afgan E., Baker D., van den Beek M., Blankenberg D., Bouvier D., Čech M., et al. (2016). The Galaxy Platform for Accessible, Reproducible and Collaborative Biomedical Analyses: 2016 Update. Nucleic Acids Res. 48, W395–W402. doi: 10.1093/nar/gkaa434
Allendorf F. W., England P. R., Luikart G., Ritchie P. A., Ryman N. (2008). Genetic Effects of Harvest on Wild Animal Populations. Trends Ecol. Evol. 23, 327–337. doi: 10.1016/j.tree.2008.02.008
Boehlert G. W. (1996). Biodiversity and the Sustainability of Marine Fisheries. Oceanography 9, 28–35. doi: 10.5670/OCEANOG.1996.24
Botsford L. W., Castilla J. C., Peterson C. H. (1997). The Management of Fisheries and Marine Ecosystems. Science 277, 509–515. doi: 10.1126/science.277.5325.509
Cao L., Chen Y., Dong S., Hanson A., Huang B., Leadbitter D., et al. (2017). Opportunity for Marine Fisheries Reform in China. Proc. Natl. Acad. Sci. U. S. A. 114, 435–442. doi: 10.1073/pnas.1616583114
Caudron A., Lasne E., Gillet C., Guillard J., Champigneulle A. (2014). Thirty Years of Reoligotrophication Do Not Contribute to Restore Self-Sustaining Fisheries of Arctic CharrSalvelinus Alpinus, In Lake Geneva. Fish. Res. 154, 165–171. doi: 10.1016/j.fishres.2014.01.023
Chambers R. C., Leggett W. C. (1996). Maternal Influences on Variation in Egg Sizes in Temperate Marine Fishes. Am. Zool. 36, 180–196. doi: 10.1093/icb/36.2.180
Cuveliers E., Volckaert F., Rijnsdorp A., Larmuseau M., Maes G. (2011). Temporal Genetic Stability and High Effective Population Size Despite Fisheries-Induced Life-History Trait Evolution in the North Sea Sole. Mol. Ecol. 20, 3555–3568. doi: 10.1111/j.1365-294X.2011.05196.x
Danish M., Badoni P., Rinya K., Maity S., Chowdhury A., Khanra T. S. (2021). Evaluation of Genetic Pollution and Genetic Diversity in Natural Fisheries and Aquaculture Through Molecular Tools. J. Entomol. Zool. Stud. 9, 2204–2211.
Do C., Waples R. S., Peel D., Macbeth G. M., Tillet B. J., Ovenden J. R. (2013). NeEstimator v2: re‐Implementation of Software for the Estimation of Contemporary Effective Population Size from Genetic Data. Mol. Ecol. Resour. 14, 209–214. doi: 10.1111/1755-0998.12157
Enberg K., Jorgensen C., Dunlop E. S., Varpe O., Boukal D. S., Baulier L., et al. (2012). Fishing-Induced Evolution of Growth: Concepts, Mechanisms and the Empirical Evidence. Mar. Ecol. 33, 1–25. doi: 10.1111/j.1439-0485.2011.00460.x
FAO (2016) The State of World Fisheries and Aquaculture. Available at: https://www.fao.org/publications/sofia/2016/en/ (Accessed July 7, 2016).
Firidin S., Eroglu O., Kutlu I. (2017). Optimizing DNA Extraction Method for Archived Otoliths. Genet. Aquat. Org. 1, 57–60. doi: 10.4194/2459-1831-v1_2_03
Frankham R., Briscoe D. A., Ballou J. D. (2002). Introduction to Conservation Genetics (Cambridge: Cambridge university press).
Goudet J. (2001). FSTAT, A Program to Estimate and Test Gene Diversities and Fixation Indices (version 2.9.3). Available at: http://www2.unil.ch/popge n/softw ares/fstat.htm [Accessed June 18, 2001].
Grant W. S., Jasper J., Bekkevold D., Adkison M. (2017). Responsible Genetic Approach to Stock Restoration, Sea Ranching and Stock Enhancement of Marine Fishes and Invertebrates. Rev. Fish. Biol. Fish. 27, 615–649. doi: 10.1007/s11160-017-9489-7
Hagen I. J., Ugedal O., Jensen A. J., Lo H., Holthe E., Bjøru B., et al. (2020). Evaluation of Genetic Effects on Wild Salmon Populations From Stock Enhancement. ICES J. Mar. Sci. 78, 900–909221–232.
Hansen M. M., Ruzzante D., Nielsen E. E., Bekkevold D., Mensberg K. L. D. (2002). Long-Term Effective Population Sizes, Temporal Stability of Genetic Composition and Potential for Local Adaptation in Anadromous Brown Trout (Salmo Trutta) Populations. Mol. Ecol. 11, 2523–2535. doi: 10.1046/j.1365-294X.2002.01634.x
Han Y., Hung C., Liao Y., Tzeng W. (2010). Population genetic structure of the Japanese eel Anguilla japonica: Panmixia at Spatial and Temporal Scales. Mar. Ecol. Prog. Ser. 401, 221–232. doi: 10.3354/meps08422
Han Z., Xu H., Shui B., Zhou Y., Gao T. (2015). Lack of Genetic Structure in Endangered Large Yellow Croaker Larimichthys Crocea From China Inferred From Mitochondrial Control Region Sequence Data. Biochem. Syst. Ecol. 61, 1–7. doi: 10.1016/j.bse.2015.04.025
Hauser L., Adcock G. J., Smith P. J., Ramírez J. H. B., Carvalho G. R. (2002). Loss of Microsatellite Diversity and Low Effective Population Size in an Overexploited Population of New Zealand Snapper (Pagrus Auratus). Proc. Natl. Acad. Sci. U. S. A. 99, 11742–11747. doi: 10.1073/pnas.172242899
Hendry A. P., Gotanda K. M., Svensson E. I. (2017). Human Influences on Evolution, and the Ecological and Societal Consequences. Philos. Trans. R. Soc Lond. B Biol. Sci. 372, 20160028. doi: 10.1098/rstb.2016.0028
Hoarau G., Boon E., Jongma D. N., Ferber S., Palsson J., Veer H. W. V., et al. (2005). Low Effective Population Size and Evidence for Inbreeding in an Overexploited Flatfish, Plaice (Pleuronectes Platessa L.). Proc. Royal. Soc B. Biol. Sci. 272, 497–503. doi: 10.1098/rspb.2004.2963
Hoelzel A. R., Shivji M. S., Magnussen J., Francis M. P. (2006). Low Worldwide Genetic Diversity in the Basking Shark (Cetorhinus Maximus). Biol. Lett. 2, 639–642.
Jombart T. (2008). Adegenet: A R Package for the Multivariate Analysis of Genetic Markers. Bioinformatics 24, 1403–1405. doi: 10.1093/bioinformatics/btn129
Kong X. Y. (1985). A Study on the Growth of Yellow Croaker Pseudosciaena Crocea (Richardson) in Zhejiang Offshore Fishing Ground. Donghai Mar. Sci. 3, 56–63.
Kong X., Zhu J. (1988). Study on the Change of the Individual Fecundity of the Large Yellow Croaker (Pseudosciaena Crocea Richardson) From Daijuyang, Zhejiang. Mar. Fish. 10, 198–204.
Kopelman N. M., Mayzel J., Jakobsson M., Rosenberg N. A., Mayrose I. (2015). Clumpak: A Program for Identifying Clustering Modes and Packaging Population Structure Inferences Across K. Mol. Ecol. Resour. 15, 1179–1191. doi: 10.1111/1755-0998.12387
Lage C., Kornfield I. (2006). Reduced Genetic Diversity and Effective Population Size in an Endangered Atlantic Salmon (Salmo Salar) Population From Maine, USA. Conserv. Genet. 7, 91–104. doi: 10.1007/s10592-005-8669-5
Law R. (2000). Fishing, Selection, and Phenotypic Evolution. ICES J. Mar. Sci. 57, 659–668. doi: 10.1006/jmsc.2000.0731
Lepš B. J. (2003). Multivariate Analysis of Ecological Data Using CANOCO 5 (Cambridge: Cambridge University Press).
Li Y., Liu J. (2018). StructureSelector: A Web-Based Software to Select and Visualize the Optimal Number of Clusters Using Multiple Methods. Mol. Ecol. Resour. 18, 176–177. doi: 10.1111/1755-0998.12719
Lippe C., Dumont P., Bernatchez L. (2006). High Genetic Diversity and No Inbreeding in the Endangered Copper Redhorse, Moxostoma Hubbsi (Catostomidae, Pisces): The Positive Sides of a Long Generation Time. Mol. Ecol. 15, 1769–1780. doi: 10.1111/j.1365-294X.2006.02902.x
Liu M., Cheng J. H., Nguyen V. Q., Sasaki K., Hoshino K., Sakai Y., et al. (2020). Larimichthys Crocea. The IUCN Red List of Threatened Species 2020 (Switzerland: International Union for Conservation of Nature). doi: 10.2305/IUCN.UK.2020-1.RLTS.T49182559A49239394.en
Liu M., Mitcheson Y. (2008). Profile of a Fishery Collapse: Why Mariculture Failed to Save the Large Yellow Croaker. Fish Fish. 9, 219–242. doi: 10.1111/j.1467-2979.2008.00278.x
Ludwig D., Hilborn R., Walters C. (1993). Uncertainty, Resource Exploitation, and Conservation: Lessons From History. Science 260, 17–36. doi: 10.1126/science.260.5104.17
Luikart G., Ryman N., Tallmon D. A., Schwartz M. K., Allendorf F. W. (2010). Estimation of Census and Effective Population Sizes: The Increasing Usefulness of DNA-Based Approaches. Conserv. Genet. 11, 355–373. doi: 10.1007/s10592-010-0050-7
Marie A. D., Bernatchez L., Garant D. (2010). Loss of Genetic Integrity Correlates With Stocking Intensity in Brook Charr (Salvelinus Fontinalis). Mol. Ecol. 19, 2025–2037. doi: 10.1111/j.1365-294X.2010.04628.x
Ma X., Zhou Y., Xu K. (2016). The Tagging Release of Great Yellow Croaker, Pseudosciaena Crocea in Zhejiang Coastal Waters. J. Zhejiang Ocean Univ. 35, 24–29. doi: 1008-830X(2016)01-0024-06
Meglecz E., Costedoat C., Dubut V., Gilles A., Malausa T., Pech N., et al. (2010). QDD: A User-Friendly Program to Select Microsatellite Markers and Design Primers From Large Sequencing Projects. Bioinformatics 26, 403–404. doi: 10.1093/bioinformatics/btp670
Nei M., Maruyama T., Chakraborty R. (1975). The Bottleneck Effect and Genetic Variability in Populations. Evolution 29, 1–10. doi: 10.1111/j.1558-5646.1975.tb00807.x
Nielsen E. E., Hansen M. M. (2008). Waking the Dead: The Value of Population Genetic Analyses of Historical Samples. Fish Fish. 9, 450–461. doi: 10.1111/j.1467-2979.2008.00304.x
Oosterhout C. V., Hutchinson W. F., Wills D. P. M., Shipley P. (2004). Micro-Checker: Software for Identifying and Correcting Genotyping Errors in Microsatellite Data. Mol. Ecol. Notes 4, 535–538. doi: 10.1111/j.1471-8286.2004.00684.x
Palstra F. P., Ruzzante D. E. (2008). Genetic Estimates of Contemporary Effective Population Size: What can They Tell Us About the Importance of Genetic Stochasticity for Wild Population Persistence? Mol. Ecol. 17, 3428–3447. doi: 10.1111/j.1365-294X.2008.03842.x
Pandolfi J. M. (2009). Evolutionary Impacts of Fishing: Overfishing’s ‘Darwinian Debt’. Biol. Rep. 1, 1–3. doi: 10.3410/B1-43
Peakall R., Smouse P. E. (2006). GENALEX 6: Genetic Analysis in Excel. Population Genetic Software for Teaching and Research. Mol. Ecol. Notes 6, 288–295. doi: 10.1111/j.1471-8286.2005.01155.x
Peres N. P. R., Legendre P., Dray S., Borcard D. (2006). Variation Partitioning of Species Data Matrices: Estimation and Comparison of Fractions. Ecology 87, 2614–2625. doi: 10.1890/0012-9658(2006)87[2614:VPOSDM]2.0.CO;2
Pinsky M. L., Eikeset A. M., Helmerson C., Bradbury I. R., Bentzen P., Morris C., et al. (2021). Genomic Stability Through Time Despite Decades of Exploitation in Cod on Both Sides of the Atlantic. Proc. Natl. Acad. Sci. U. S. A. 118, e2025453118. doi: 10.1073/pnas.2025453118
Pita A., Pérez M., Velasco F., Presa P. (2017). Trends of the Genetic Effective Population Size in the Southern Stock of the European Hake. Fish. Res. 191, 108–119. doi: 10.1016/j.fishres.2017.02.022
Poulsen N. A., Nielsen E. E., Schierup M. H., Loeschcke V., GrØnkjÆr P. (2006). Long-Term Stability and Effective Population Size in North Sea and Baltic Sea Cod (Gadus Morhua). Mol. Ecol. 15, 321–331. doi: 10.1111/j.1365-294X.2005.02777.x
Pritchard J. K., Stephens M., Donnelly P. (2000). Inference of Population Structure Using Multilocus Genotype Data. Genetics 155, 945–959. doi: 10.1093/genetics/155.2.945
R Core Team (2019). R: A Language and Environment for Statistical Computing (Vienna, Austria: R Foundation for Statistical Computing). Available at: https://www.R-project.org/.
Rice W. R. (1989). Analyzing Tables of Statistical Tests. Evolution 43, 223–225. doi: 10.1111/j.1558-5646.1989.tb04220.x
Rousset F. (2008). Genepop’007: A Complete Re-Implementation of the Genepop Software for Windows and Linux. Mol. Ecol. Resour. 8, 103–106. doi: 10.1111/j.1471-8286.2007.01931
Ryman N., Palm S. (2006). POWSIM: A Computer Program for Assessing Statistical Power When Testing for Genetic Differentiation. Mol. Ecol. Notes. 6, 600–602. doi: 10.1111/j.1471-8286.2006.01378.x
Ryman N., Utter F., Laikre L. (1995). Protection of Intraspecific Biodiversity of Exploited Fishes. Rev. Fish Biol. Fish. 5, 417–446. doi: 10.1007/BF01103814
Shan B., Liu Y., Song N., Ji D., Yang C., Zhao Y., et al. (2020). Genetic Diversity and Population Structure of Black Sea Bream (Acanthopagrus Schlegelii) Based on Mitochondrial Control Region Sequences: The Genetic Effect of Stock Enhancement. Reg. Stud. Mar. Sci. 35, 101188. doi: 10.1016/j.rsma.2020.101188
Taggart J. B., Hynes R., Prodouhl P. A., Ferguson A. (1992). A Simplified Protocol for Routine Total DNA Isolation From Salmonid Fishes. J. Fish Biol. 40, 963–965. doi: 10.1111/j.1095-8649.1992.tb02641.x
Wang L., Shi X., Su Y., Meng Z., Lin H. (2013). Genetic Divergence and Historical Demography in the Endangered Large Yellow Croaker Revealed by mtDNA. Biochem. Syst. Ecol. 46, 137–144. doi: 10.1016/j.bse.2012.09.021
Waples R. S. (2006). A Bias Correction for Estimates of Effective Population Size Based on Linkage Disequilibrium at Unlinked Gene Loci. Conserv. Genet. 7, 167–184. doi: 10.1007/S10592-005-9100-Y
Waples R. S., Do C. (2008). LDNE: A Program for Estimating Effective Population Size From Data on Linkage Disequilibrium. Mol. Ecol. Resour. 8, 753–756. doi: 10.1111/j.1755-0998.2007.02061.x
Wright P. J., Trippel E. A. (2009). Fishery-Induced Demographic Changes in the Timing of Spawning: Consequences for Reproductive Success. Fish Fish. 10, 283–304. doi: 10.1111/j.1467-2979.2008.00322.x
Xue D., Li Y., Liu J. (2017). A Rapid and Cost-Effective Approach for the Development of Polymorphic Microsatellites in Non-Model Species Using Paired-End RAD Sequencing. Mol. Genet. Genomics 292, 1165–1174. doi: 10.1007/s00438-017-1337-x
Xu H., Zhou Y. (2003). A Preliminary Study on Release and Enhancement of Large Yellow Croaker Pseudosciaena Crocea in the North Coast of Zhejiang. Mar. Fish 25, 69–72.
Yuan J., Lin H., Wu L., Zhuang X., Ma J., Kang B., et al. (2021). Resource Status and Effect of Long-Term Stock Enhancement of Large Yellow Croaker in China. Front. Mar. Sci. 8, 1–12 160–165 doi: 10.3389/fmars.2021.743836
Keywords: large yellow croaker, overexploitation, historical DNA, genetic diversity, spatio-temporal genetic structure
Citation: Xu Z, Dou S-Z, Ding S-X and Liu J-X (2022) Temporal Genetic Stability Despite Decades of Overexploitation for Large Yellow Croaker in the East China Sea. Front. Mar. Sci. 9:861840. doi: 10.3389/fmars.2022.861840
Received: 25 January 2022; Accepted: 29 March 2022;
Published: 28 April 2022.
Edited by:
Anna Rita Rossi, Sapienza University of Rome, ItalyReviewed by:
Paolo Franchini, Sapienza University of Rome, ItalyCopyright © 2022 Xu, Dou, Ding and Liu. This is an open-access article distributed under the terms of the Creative Commons Attribution License (CC BY). The use, distribution or reproduction in other forums is permitted, provided the original author(s) and the copyright owner(s) are credited and that the original publication in this journal is cited, in accordance with accepted academic practice. No use, distribution or reproduction is permitted which does not comply with these terms.
*Correspondence: Jin-Xian Liu, amlueGlhbmxpdUBnbWFpbC5jb20=
Disclaimer: All claims expressed in this article are solely those of the authors and do not necessarily represent those of their affiliated organizations, or those of the publisher, the editors and the reviewers. Any product that may be evaluated in this article or claim that may be made by its manufacturer is not guaranteed or endorsed by the publisher.
Research integrity at Frontiers
Learn more about the work of our research integrity team to safeguard the quality of each article we publish.