 Si-qing Yu
 Tian-qi Xiong
 Wei-dong Zhai
- 1Institute of Marine Science and Technology, Shandong University, Qingdao, China
- 2Key Laboratory of Biofuels, Shandong Provincial Key Laboratory of Energy Genetics, Qingdao Institute of Bioenergy and Bioprocess Technology, Chinese Academy of Sciences, Qingdao, China
- 3Frontier Research Center, Southern Marine Science and Engineering Guangdong Laboratory (Zhuhai), Zhuhai, China
To better understand seasonal acidification in the South Yellow Sea (SYS), four field surveys conducted in 2019 and the historical data obtained in 2018 were incorporated in this study. The lowest aragonite saturation state (Ωarag) value of 1.15 was observed in the central SYS in late autumn. Despite interannual variations in the rate of net community respiration, the quasi-synchronous accumulation of apparent oxygen utilization and excess dissolved inorganic carbon (DIC) relative to the air equilibrium were revealed in the SYS cold water mass (SYSCWM) from late spring to autumn. Correspondingly, the two acidification indexes (Ωarag and pH) decreased in logarithmic forms in the SYSCWM in warm seasons. To examine the potential influences of hydrological dynamics on seasonal acidification in the SYSCWM, a three-endmember water-mixing model was applied. The results showed that the cumulative effect of various non-conservative processes on DIC was comparable with the excess DIC relative to the air equilibrium. This implied that the summer and autumn carbonate dynamics and the acidification status of the cold water mass were almost free from the potential impacts of the weak water mixing and internal circulation in summer and autumn in a given year. The Yellow Sea Warm Current carries oceanic DIC into the SYS only in winter and early spring. This study also showed that the re-equilibrium with atmospheric CO2 at given temperature in early spring determined the initial Ωarag of the SYS before Ωarag declining in late spring, summer, and autumn. The sensitivity of coastal Ωarag changes to DIC addition is subject to both spatial and temporal variations.
1 Introduction
The global ocean has absorbed approximately 25% of total anthropogenic CO2 emissions since the Industrial Revolution (Friedlingstein et al., 2019), substantially mitigating atmospheric CO2 rise and global warming. As a result, the reduction in pH and calcium carbonate saturation in the CO2-absorbing ocean surface, ocean acidification (Doney et al., 2009), has caused a series of chemical changes in the ocean system, potentially affecting the growth and reproduction of marine organisms (Mora et al., 2013). In productive coastal zones, the seasonal acidification of subsurface waters has been recognized for more than 10 years and has been attributed more to eutrophication than to the atmospheric CO2 rise (Borges & Gypens, 2010; Feely et al., 2010; Cai et al., 2011). Eutrophication triggers algal blooms, and the biogenic particles formed settle and decompose through oxygen-consuming processes beneath the euphotic zone. The overall aerobic decomposition of biogenic particles can be roughly described using the traditional Redfield equation (Redfield et al., 1963): (CH2O)106(NH3)16H3PO4 + 138O2 → 106CO2 + 16HNO3 + H3PO4 + 122H2O.
Because of the seasonal stratification occurring in warm seasons, a large amount of CO2 generated by net community respiration accumulates beneath the thermocline, causing seasonal acidification in the subsurface water (e.g., Zhai et al., 2014; Zhai, 2018; Jiang et al., 2019), and pH values may drop by 0.2–0.3 in 2–3 months (e.g., Zhai et al., 2012). This rapid acidification process undoubtedly affects the coastal ecosystems. Marine-calcifying organisms, in particular, bear the brunt of environmental stress and exhibit a stress response (Kottmeier et al., 2016; Leung et al., 2020; Dong et al., 2020). The aragonite saturation (Ωarag), an indicator of the thermodynamic stability of aragonite CaCO3 minerals, is generally used to assess the ecological effects of ocean acidification. In this study, Ωarag = [Ca2+]· /Ksp*arag, where Ksp*arag represents the apparent solubility product for the mineral aragonite (Mucci, 1983). Chemically, Ωarag > 1 indicates that seawater is supersaturated for aragonite-type CaCO3; thus, the aragonite-type CaCO3 is in a stable condition in the seawater. In contrast, Ωarag < 1 implies that seawater is undersaturated for the aragonite-type CaCO3, where the aragonite-type CaCO3 will thermodynamically tend to dissolve.
The actual situation is far more complicated than the thermodynamic equilibrium. Many studies have shown that CaCO3 can dissolve in aragonite-supersaturated water. This may result from the intercalation of magnesium ions in the CaCO3 crystal lattice (Dickson, 2010) and/or from the surrounding local acidic microenvironment created by the metabolism of microorganisms that accumulated on the surface of CaCO3 particles (Wollast & Chou, 1998; Milliman et al., 1999). A study by Eyre et al. (2018) showed that global coral reefs shift from net precipitation to net dissolution when seawater Ωarag drops to 2.9. Many researchers regard an Ωarag of 1.5 as a critical threshold for the growth of marine shellfish being severely threatened by acidified seawater (e.g., Ekstrom et al., 2015; Waldbusser et al., 2015; Zhai, 2018). In the North Yellow Sea cold water mass, the net community calcification rate declines to zero when Ωarag reaches the critical level of 1.5–1.6 (Li and Zhai, 2019; Zhai et al., 2020).
Some researchers have suggested various negative correlations between Ωarag and total dissolved inorganic carbon (DIC) concentration (e.g., Liu et al., 2014; Zhai et al., 2014; Wang et al., 2017; Zhai, 2018). Recently, Huang et al. (2021) proposed a sensitivity index of coastal Ωarag decline to DIC addition; that is, the DIC addition of 100 μmol·kg–1 to an Ωarag decline of 1.0 in the northern Gulf of Mexico. They argued that this realistic and ecosystem-based sensitivity index was consistent with conditions revealed in the western Gulf of Maine. However, before this sensitivity index can be widely applied in diverse coastal seas, its validity should be further examined.
The South Yellow Sea (SYS) is a shallow and semi-enclosed marginal sea of the western North Pacific. It is productive and rich in biological resources (Sherman and Hempel, 2009). In its subsurface waters, seasonal acidification occurs every year (Zhai, 2018; Xiong et al., 2020). The lowest Ωarag has been observed to be approximately 1.0 at three sampling stations in the central SYS in late autumn (Choi et al., 2020). So far, research has focused on the data reporting and analyses of single and/or seasonal mapping cruises, lacking the calculation of the rate of acidification and ignoring the impact of potential hydrological dynamics. In this study, we attempted to better understand seasonal acidification in the SYS by combining the results of our seasonal field surveys from 2019 and the historical data from 2018. The goals of the study included (1) obtaining the regional acidification rate from spring to autumn and considering potential interannual variations; (2) examining the impact of potential hydrological dynamics on the SYS seasonal acidification; and (3) assessing the applicability of the sensitivity index of coastal Ωarag decline to DIC addition proposed by Huang et al. (2021).
2 Materials and Methods
2.1 Study Area
The SYS is located on the eastern shelf of China, covers an area of 3.09 × 10⁵ km2, and has an average depth of 44 m (mostly shallower than 100 m). It is adjacent to the North Yellow Sea to the north and is also adjacent to the East China Sea to the south. The SYS hydraulic residence time, based on 228Ra/226Ra measurements, has been estimated to be 5–6 years (Nozaki et al., 1991).
Climatic variations of the SYS are primarily dominated by the East Asian Monsoon (Chen, 2009). The rain-bearing southwest monsoon lasts from June to September, while the strong northeast monsoon prevails in winter, from November to March of the next year (Zhai et al., 2014). The winter circulation system consists of southward coastal currents and the northward Yellow Sea Warm Current (YSWC), while summer hydrography is characterized by the SYS cold water mass (SYSCWM). In winter and early spring, the Yellow Sea Coastal Current includes the LuBei Coastal Current and SuBei Coastal Current (Figure 1A). The LuBei Coastal Current is formed by the Bohai Sea outflow water (Chen, 2009; Zhai et al., 2014), which is transported outwards through the top of Laizhou Bay and into the North Yellow Sea. In the SYS, the coastal current from the north mixes with runoffs from the coast of China, forming the SuBei Coastal Current (Figure 1A). The YSWC originates from the Tsushima Warm Current, which is a branch of the Kuroshio. On the southwestern side of Jeju Island, it meets with the East China Sea shelf water and extends into the Yellow Sea (Figure 1A). The YSWC is a compensating current of the monsoon-driven Yellow Sea Coastal Current (Hsueh, 1988; Chen, 2009) and is the only passageway that introduces open-ocean waters and the Pacific Decadal Oscillation signals into the Yellow Sea (e.g., Li et al., 2022). It appears in late autumn and winter, recedes in late spring, and disappears in summer. In summer, a cold pool (i.e., the SYSCWM) develops below the thermocline in the central SYS from late spring to autumn (Yu et al., 2006), affecting biogeochemical processes there.
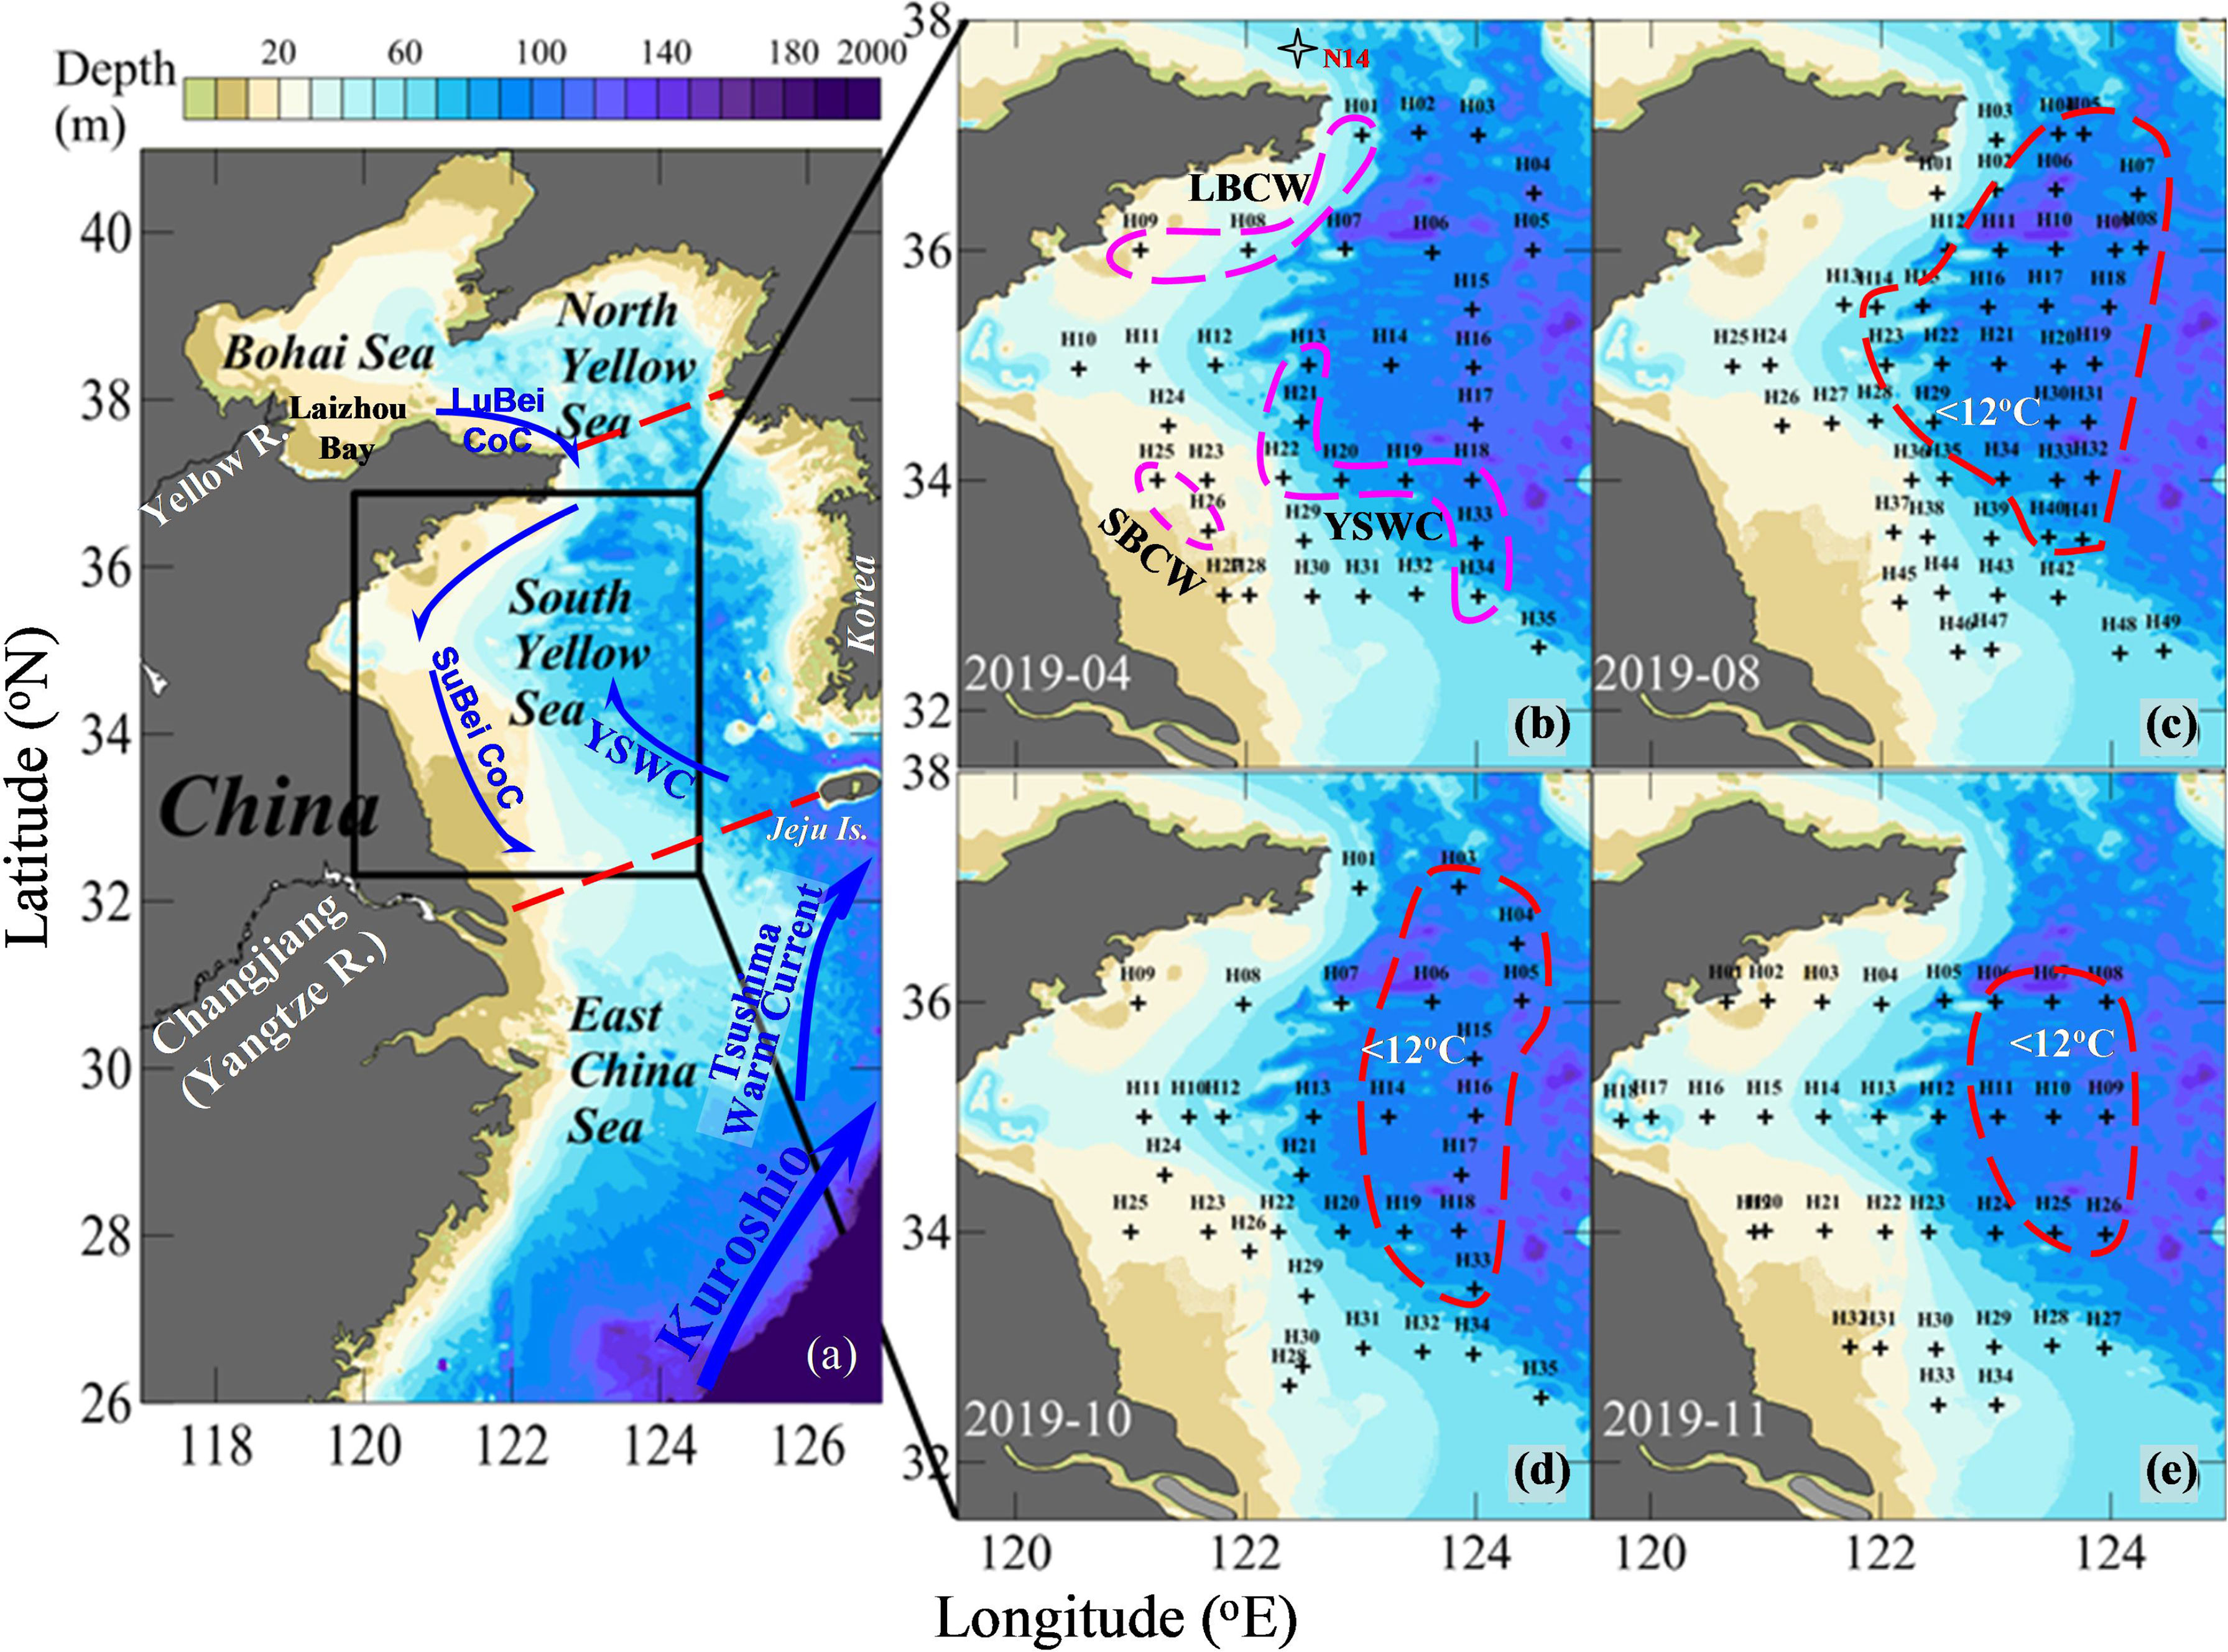
Figure 1 Study area and sampling sites during seasonal mapping cruises in 2019. In (A), Kuroshio Current, Tsushima Warm Current, YSWC, Subei Coastal Current (SuBei CoC), and Lubei Coastal Current (LuBei CoC) in winter and early spring are sketched. In panel (B), several typical water endmembers are highlighted based on our field data, including YSWC water, SuBei Coastal Water (SBCW), and LuBei Coastal Water (LBCW). In panels (C–E), stations with a bottom-water temperature below 12°C are clustered, showing the area of the South Yellow Sea cold water mass (SYSCWM) under study.
The SYSCWM is the remnant of winter cooling water (temperature < 12°C, salinity > 32), overlain by 20–25 m of warm water (Yu et al., 2006). In the SYSCWM, DO, pHT, and Ωarag decline from spring to autumn (Zhai, 2018; Xiong et al., 2020). In the central SYS, a springtime algal bloom develops every year (Tan and Wang, 2014), producing many biogenic particles. Field surveys along the 35°N section have shown that the particulate organic carbon (POC) in the central SYS varies from 140–150 μg·L−1 in spring to 60–140 μg·L−1 in summer to 80–100 μg·L−1 in autumn and to 40–60 μg·L−1 in winter (Cheng, 2011). The springtime biogenic particles presumably settle quickly and support subsequent oxygen consumption and CO2 production in the SYSCWM in summer and autumn (Zhai, 2018; Xiong et al., 2020). According to Song et al. (2016), approximately 90% of the organic carbon obtained through the primary production process in the Yellow Sea is ingested by zooplankton and/or decomposed by microorganisms in the water column, and only 4% or even less may be buried in sediments.
2.2 Sampling, Analyses, and Data From Literature
Four field surveys were conducted in the SYS in 2019 (Figure 1), comprising spring and summer cruises (in April and in August, respectively, both on board the R/V Beidou) and two autumn cruises (in October on board the R/V Lanhai 101 and in November on board the R/VKexue III). Temperature and salinity in the water column were recorded with a calibrated conductivity, temperature, and depth/pressure (CTD) recorder (SBE 25-Plus on board the R/V Beidou, SBE 911 on board the R/V Lanhai 101, and SBE 911-Plus on board the R/V Kexue III). Water samples were collected to determine the dissolved oxygen (DO), DIC, and total alkalinity (TAlk) in the water column at two-to-four different depths using a rosette sampler fitted with 5 or 10 L Niskin bottles and mounted with the CTD units.
DO samples were collected, fixed, and titrated on board following the Winkler procedure (Knap et al., 1996), and 0.01% sodium azide (NaN3) was added to eliminate the interference of nitrite in the water (Wong, 2012). The uncertainty of DO data was estimated to be <0.5% (Zhai et al., 2012). DO saturation (DO%)—the ratio of the measured DO concentration to the DO concentration at equilibrium with the atmosphere—was calculated as in Benson and Krause (1984) from temperature, salinity, and field atmospheric pressure. To quantify the effect of the net community metabolism, apparent oxygen utilization (AOU) was defined as the difference between the air-equilibrated DO concentration and the measured DO. When ignoring the effects of air–sea exchange and water mixing, an AOU >0 implies net community respiration, while an AOU <0 implies net community production.
Water samples for DIC and TAlk were stored in 60 ml screw-top borosilicate glass bottles (for DIC, bubble free) and 140 ml screw-top high-density polyethylene bottles (for TAlk), and 50 μl saturated HgCl2 was added immediately. The bottles were sealed and preserved in the dark at room temperature and finally brought back to the laboratory for analysis (Huang et al., 2012). DIC was measured by a non-dispersive infrared CO2 detector-based DIC analyzer (AS-C3; Apollo SciTech Inc., Newark, Delaware, USA) and TAlk was determined at 25°C by the Gran acidimetric titration (Gran, 1952) using a semi-automated titrator (AS-ALK2; Apollo SciTech Inc., USA). During DIC and TAlk determinations, certificated reference materials (CRMs) from A.G. Dickson’s laboratory were used for quality assurance at a precision of ± 2 μmol kg−1 (Zhai et al., 2014).
To further assess the data quality of these carbonate parameters, we also collected water samples for pH analyses in 140 ml brown borosilicate glass bottles, preserved with 50 μl saturated HgCl2. These samples were preserved at 25°C and measured within 6 h of sampling using a precision pH meter equipped with an Orion® 8102BN Ross electrode against three standard buffers on the National Bureau of Standards scale (pHNBS = 4.01, 7.00 and 10.01 at 25°C; Thermo Fisher Scientific Inc., Waltham, Massachusetts, USA). These pHNBS data were only used for the quality assessment of our carbonate data and calculation (see below).
To better characterize seasonal carbonate dynamics in the SYS, we incorporated the historical data obtained in 2018 (Xiong et al., 2020) in the study. The 2018 data comprised a spring cruise in April, a late spring cruise in May, a summer cruise in July, and an autumn cruise in October.
2.3 Calculation of Other Carbonate System Parameters
Both Ωarag and pH on the total hydrogen ion scale (pHT) were calculated from seawater temperature, salinity, DIC, and TAlk data using the CO2SYS.XLS (Version 24) program (Pelletier et al., 2015), an updated version of the original CO2SYS.EXE program (Lewis & Wallace, 1998). The Millero et al. (2006) dissociation constants of carbonic acid were used in the calculation because they cover much broader applicable ranges of temperature (0°C–50°C) and salinity (0–50), and the dissociation constants for the HSO4– ion were taken from Dickson (1990). The values of Ksp*arag followed Mucci (1983), while the Ca2+ concentrations were assumed to be proportional to salinity (Millero, 1979). In June, August, and November 2011, Ca2+ concentrations were measured in the Yellow Sea (Qi, 2013). The comparison between measured Ca2+ data and calculated Ca2+ values showed that salinity-derived Ca2+ concentrations were slightly lower than real data by 0%–2% (Zhai et al., 2014).
To further assess the quality of our carbonate system data, we also calculated pHNBS based on field-measured DIC and TAlk values and compared the field-measured pHNBS data with the calculated pHNBS data. Most measured and calculated values were consistent at a deviation level of ± 0.05 pH (Figure 2A). In addition, TAlk–DIC ratios were predominantly between 1.05 and 1.15 (Figure 2B), in line with the seawater TAlk–DIC ratio in the mid-latitude regions (Zhai & Zhao, 2016). Both comparisons suggest that our measurements and calculation of the carbonate system parameters were reliable.
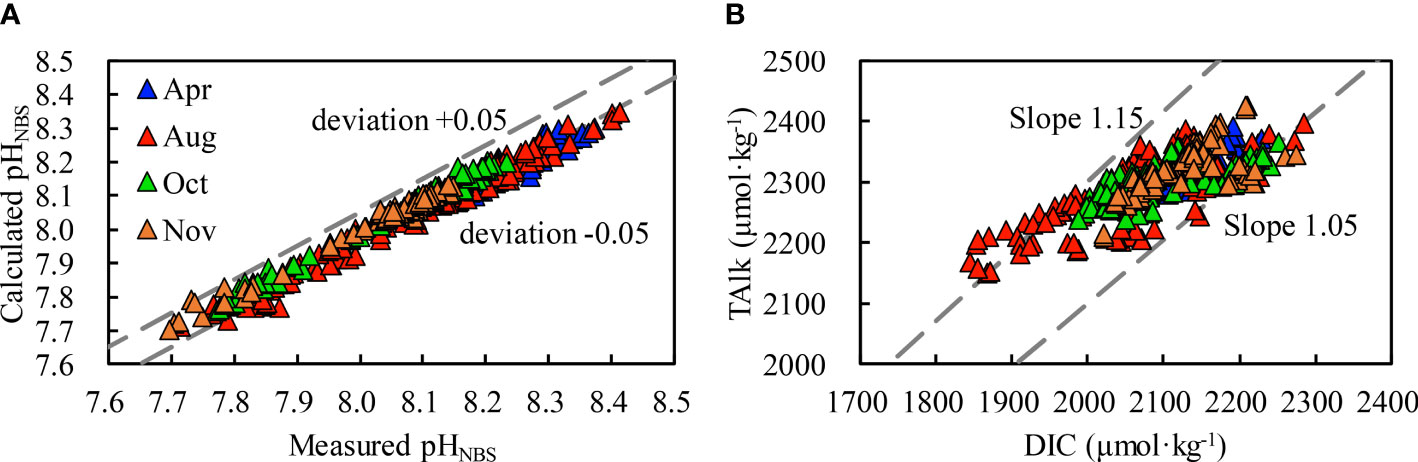
Figure 2 Evaluation of data quality for seasonal mapping cruises in 2019, including the relationship between calculated pHNBS and measured pHNBS (A) and between TAlk and DIC (B). The two dashed lines in panel (A) show a deviation of ± 0.05, and the two dashed lines in panel (B) show TAlk–DIC ratios of 1.05 and 1.15, respectively.
To quantify the effect of the net community metabolism on DIC, following Zhai (2018) and Xiong et al. (2020) we calculated the air-equilibrated DIC (DICequ, corresponding to a mean air-equilibrated fugacity of CO2, value of 415 μatm) from corresponding field-measured seawater temperature, salinity, and TAlk:
The DIC departure from the DICequ was defined as excess DIC:
The relationship between the excess DIC and the net community metabolism is similar to the relationship between AOU and the net community metabolism. That is, an excess DIC > 0 means net community respiration, while an excess DIC < 0 means net primary production.
3 Results
3.1 Hydrological Settings
Cruise-based distributions of seawater temperature in the SYS showed a remarkable seasonal variation (Figures 3a–h). From spring to summer, the sea surface temperature rose from 9.6–12.3°C in April to 22.0–28.8°C in August, while it dropped to 20.0–23.0°C in October and to 14.3–19.9°C in November. In contrast, the bottom-water temperature increased moderately from 10.1 ± 1.1°C in April to 16.6 ± 5.4°C in November. The vertical gradient of temperature in summer and mid-autumn brought about the development of a seasonal thermocline (Figure S1).
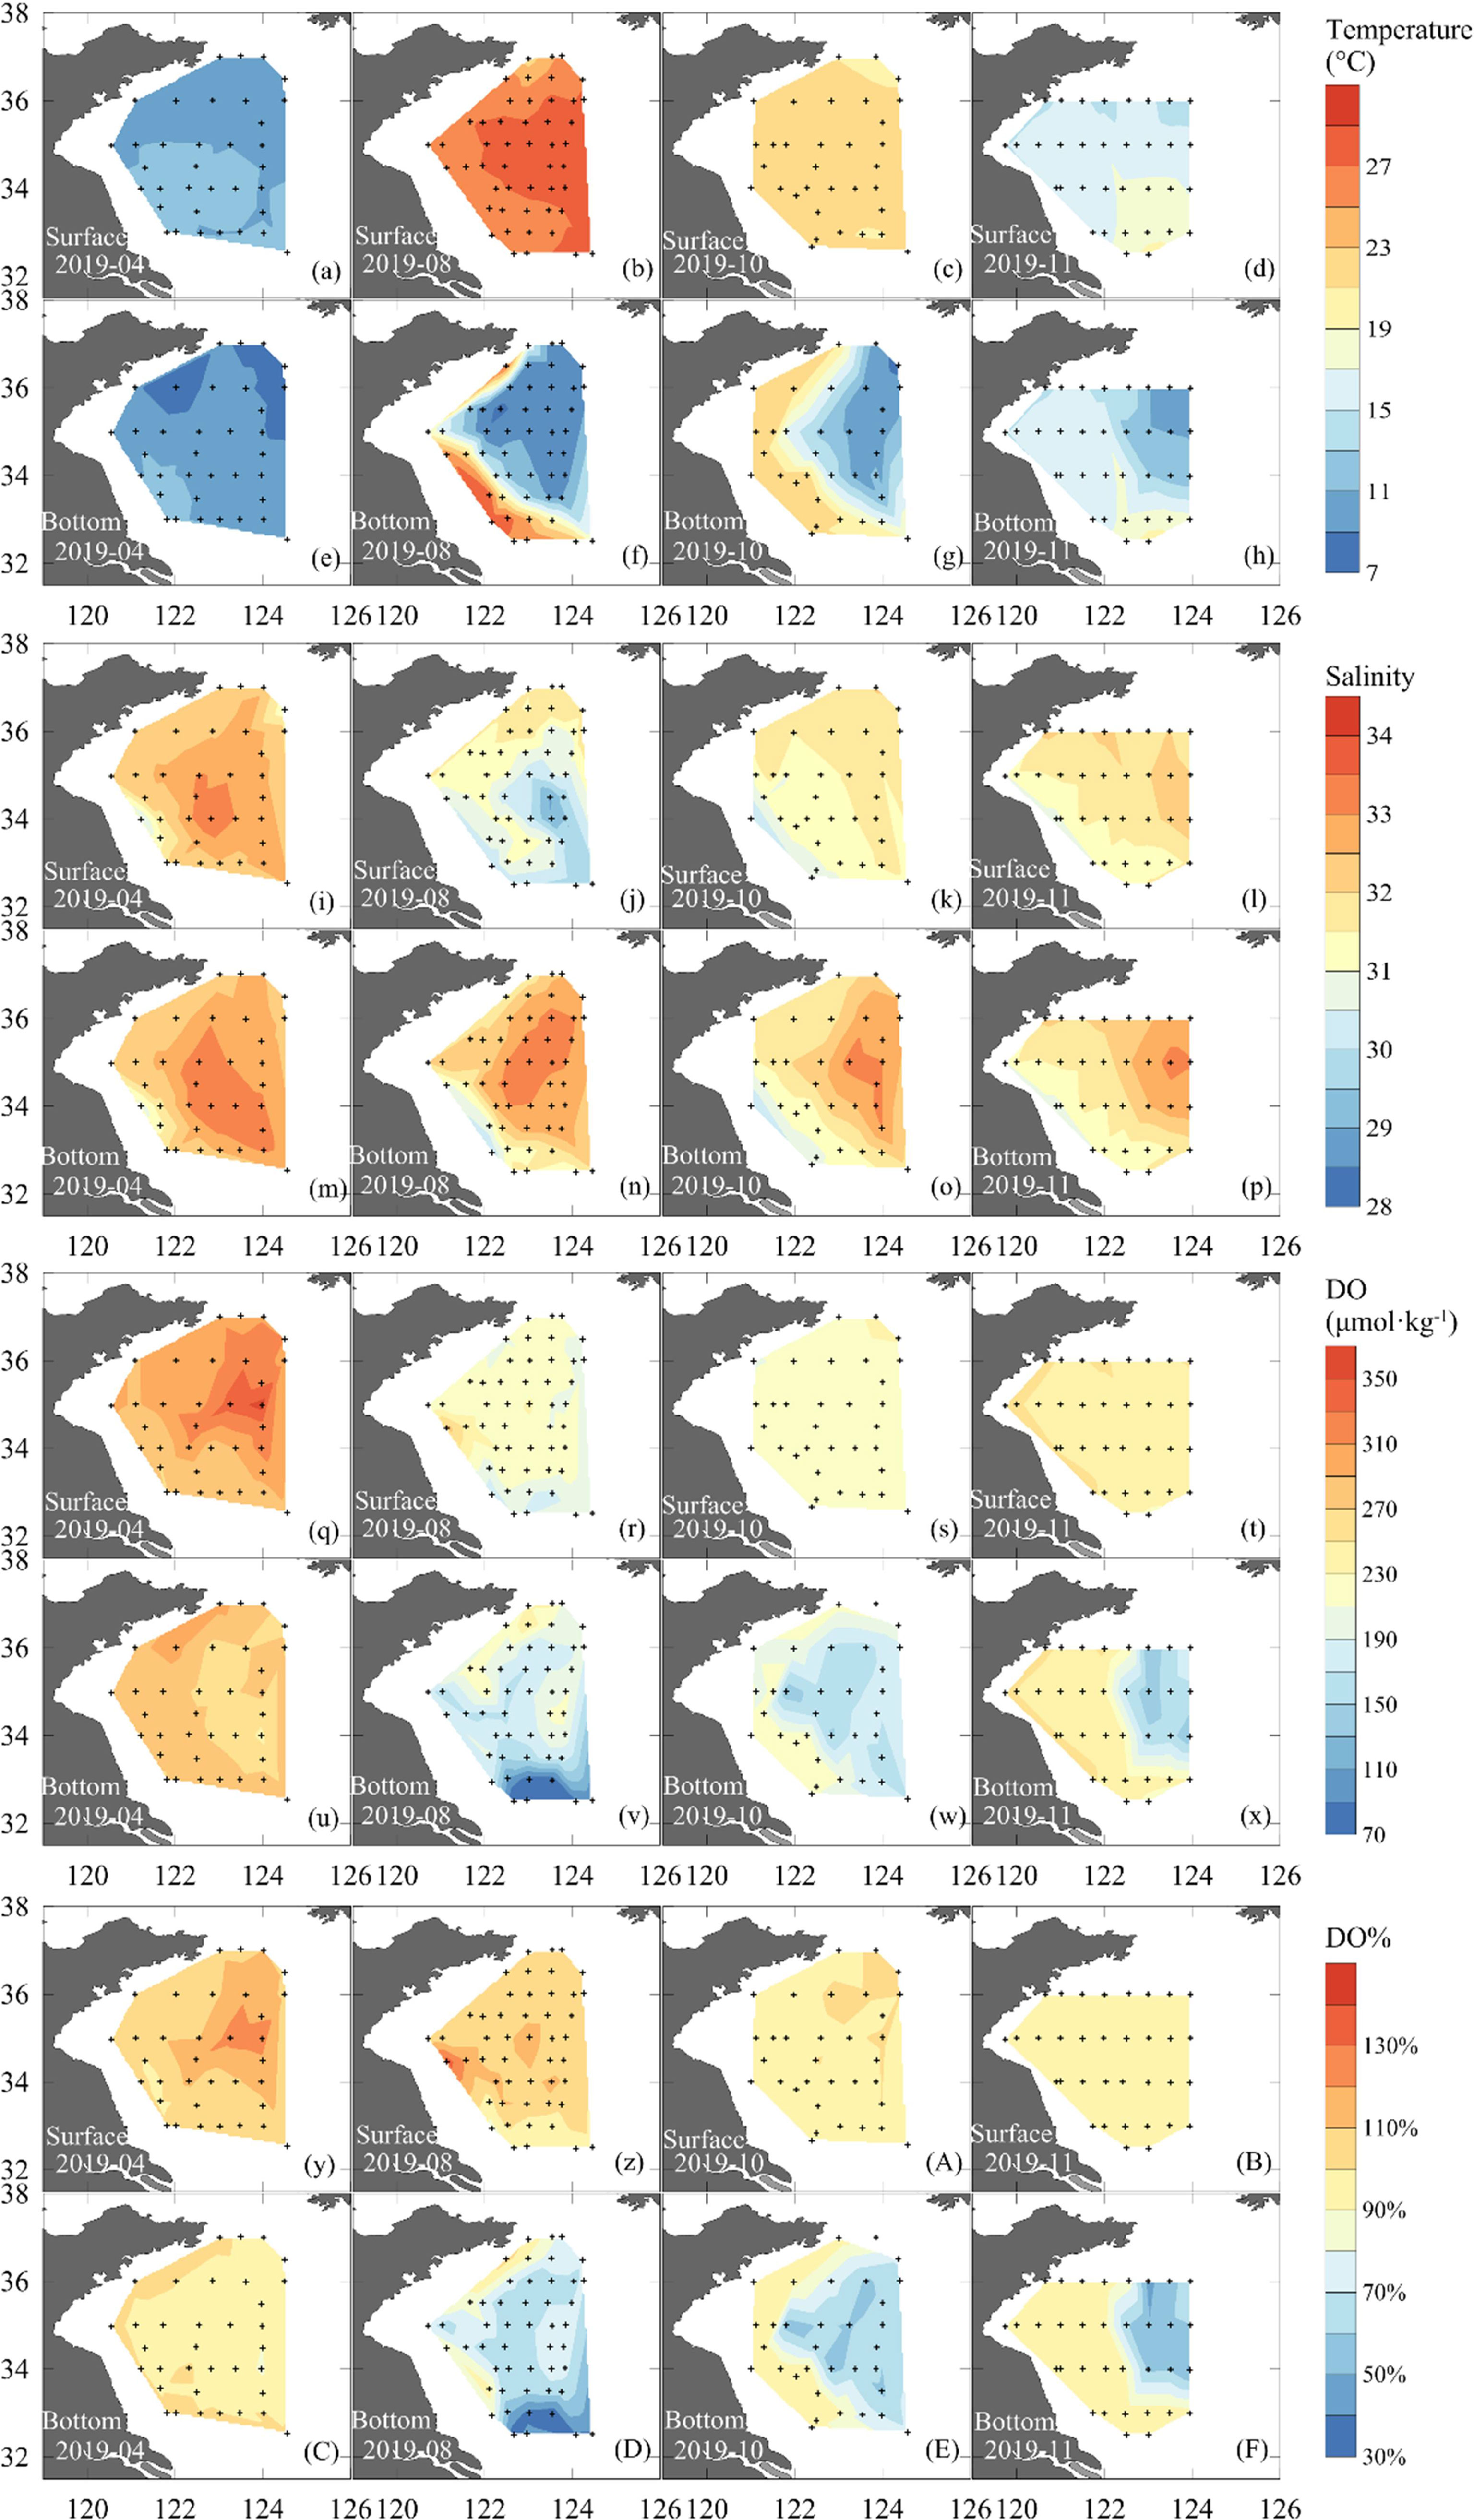
Figure 3 Surface and bottom distribution of water temperature (a-h), salinity (i-p), DO (q-x), and DO% (y-z, A-F) during seasonal mapping cruises carried out in 2019.
Salinity exhibited a small seasonal variation with mean values of 32.5 ± 0.5 in April, 31.6 ± 1.0 in August, 31.7 ± 0.7 in October, and 31.8 ± 0.5 in November (Table 1). In spring, relatively high salinity values (salinity > 32) dominated the whole SYS. In the central SYS, a high-salinity water tongue (salinity > 33) occurred in April (Figure 3m), indicating the YSWC. In summer, the relatively high salinity values of >32 dominated bottom waters in the central SYS (Figure 3n), where the summertime SYSCWM developed. The relatively low surface salinity (Figure 3j) may be caused by the abundant rainfall in this area from late spring to summer and/or by the Changjiang diluted water that flows toward Jeju Island, South Korea. In autumn, the salinity tended to be vertically mixed as the weak halocline that appeared in summer had almost disappeared in this transitional season.
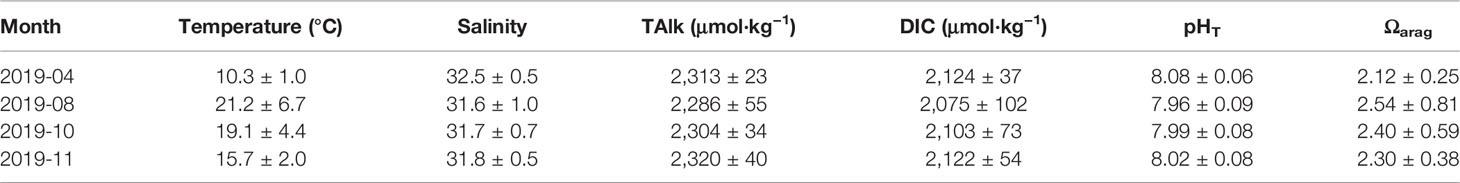
Table 1 Cruise information including water temperature, salinity, and carbonate system parameters (mean ± standard deviation) from seasonal mapping cruises carried out in 2019.
3.2 Dissolved Oxygen and Carbonate System Parameters
In April, sea surface DO values varied between 269 and 359 μmol·kg−1 (Figure 3q) and were always oversaturated. The highest value of surface DO saturation of 130% was observed in the central SYS (Figure 3y). In bottom waters in April, however, DO was determined at 274 ± 10 μmol·kg−1, at ~100% saturation (Figure 3C). Vertical profiles of DO saturation (Figure S1) implied that the surface primary production affected approximately the upper 20 m. From August to November, sea surface DO concentration changed with temperature, but roughly at the air-equilibrated levels (Figures 3z, A, B). In the SYSCWM, bottom-water DO declined from 197 ± 20 μmol·kg−1 in August to 154 ± 17 μmol·kg−1 in November (Figures 3v–x). Nevertheless, the lowest DO value of 69 μmol·kg−1 (with DO% of ~ 32%) was observed in the southern SYS (Figures 3v, D) that was affected by the Changjiang Diluted Water in August (Figures 3j, n). This DO value approached the critical value of hypoxia (i.e., DO < 63 μmol·kg−1 or DO% < 30%).
For a quasi-conservative carbonate system parameter, survey-averaged TAlk in the SYS ranged between 2286 ± 55 μmol·kg−1 in August and 2320 ± 40 μmol·kg−1 in November. TAlk generally exhibited a descending trend from north to south and from nearshore areas to the central basin (Figures 4a–h). In contrast to TAlk, DIC was largely affected by metabolic processes. It was also subject to SYS circulation and the effect of temperature on the solubility of CO2, showing striking seasonal variations (Figures 4i–p). Sea surface DIC varied between 2,044 and 2,229 μmol·kg−1 in April, while the average DIC in bottom waters was 2139 ± 30 μmol·kg−1. From August to November, relatively high DIC values of 2,170–2,284 μmol·kg−1 were observed in the bottom waters of the SYSCWM.
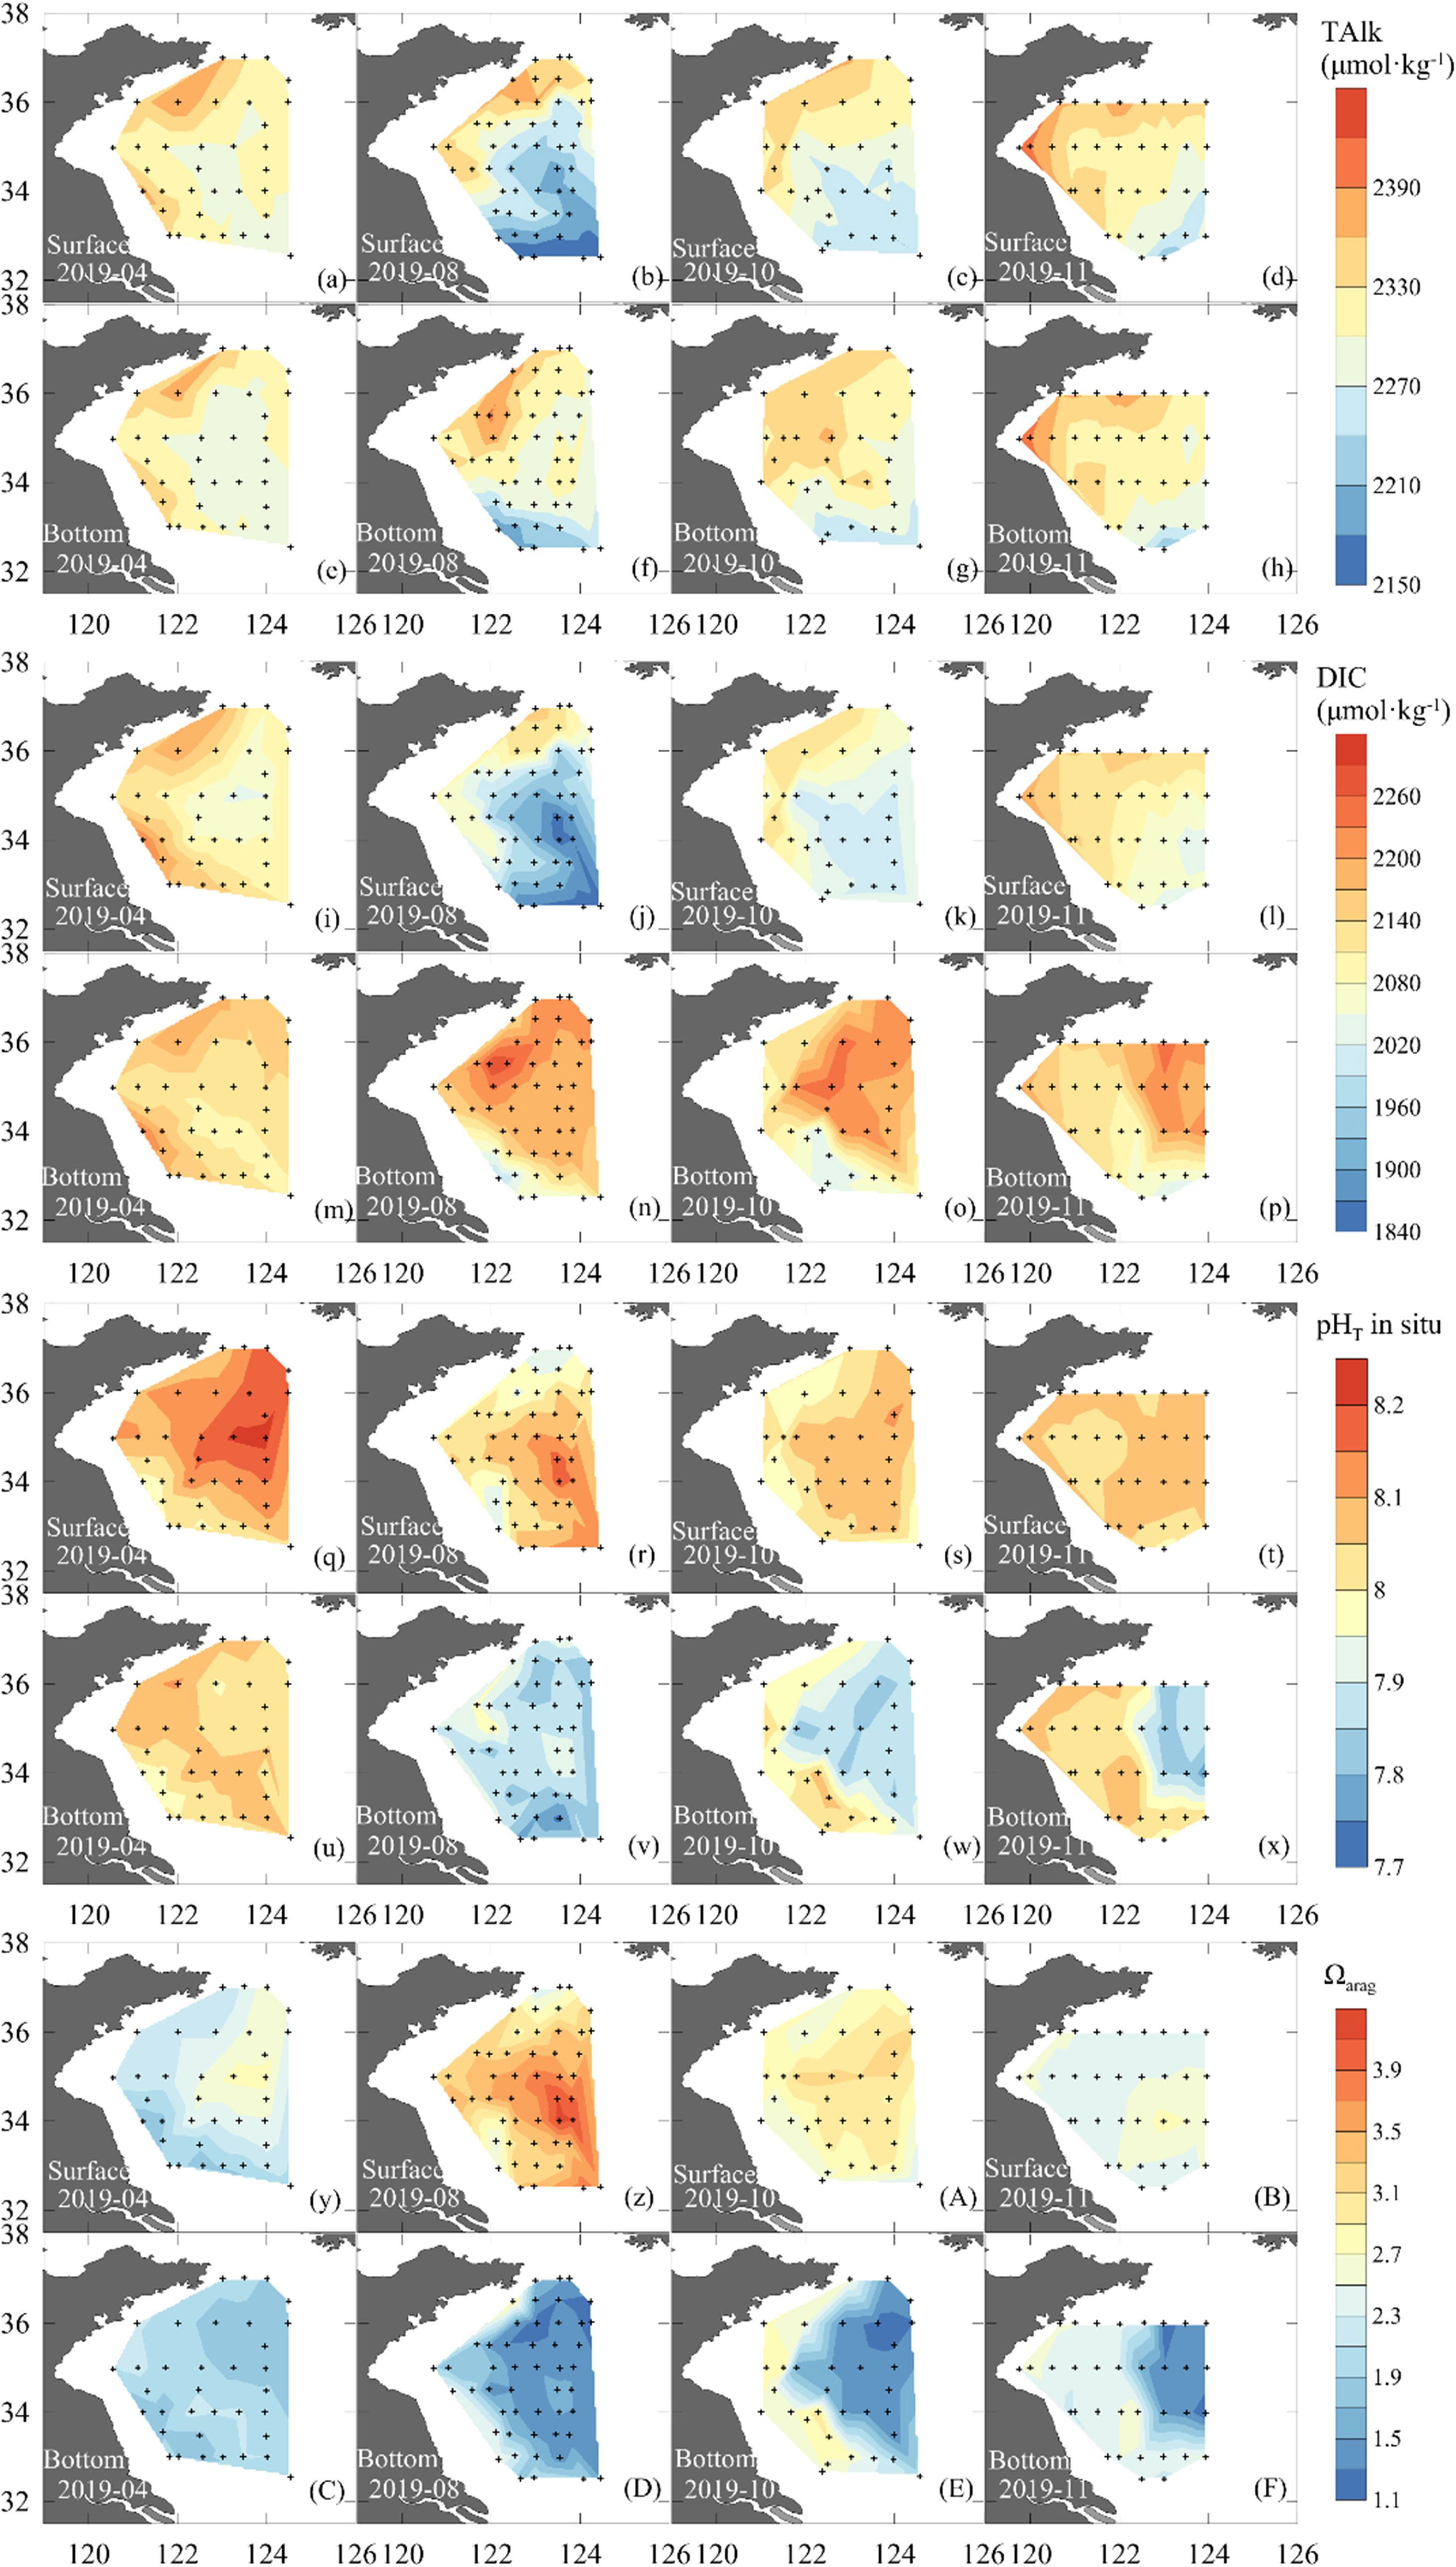
Figure 4 Surface and bottom-water distribution of TAlk (a-h), DIC (i-p), pHT (q-x), and aragonite saturation state (Ωarag) (y-z, A-F) during seasonal mapping cruises carried out in 2019.
Figure 4 shows cruise-based distributions of pHT and Ωarag in the SYS. In April, surface pHT ranged from 7.92 to 8.22, while the corresponding Ωarag was 1.76–2.80. In bottom waters, the April pHT average was 8.04 ± 0.04, and the corresponding Ωarag was 1.95 ± 0.13. From August to November, surface pHT ranged between 7.90 and 8.17, slightly lower than that in April. However, the corresponding surface Ωarag exhibited its maximum values (2.32 – 4.19) in August. In the SYSCWM, the average bottom-water pHT dropped from 7.88 ± 0.04 in August to 7.84 ± 0.04 in November, while the corresponding Ωarag dropped from 1.42 ± 0.12 to 1.32 ± 0.09. The lowest Ωarag of 1.15 was observed in November at a deep-water station in the central SYS, while the lowest pHT of 7.77 appeared in August at a station connecting the SYS and the northern East China Sea.
3.3 The Coupling of Surface Excess Dissolved Inorganic Carbon and Apparent Oxygen Utilization in Spring
In April 2019, surface excess DIC ranged between –85 μmol·kg−1 and –34 μmol·kg−1. The most negative surface excess DIC values of –85 to –69 μmol·kg−1 were located in the central SYS (Stations H14 – H17 in Figure 1B). The corresponding AOU ranged from –82 to –46 μmol·kg−1. In April 2018, surface excess DIC ranged between –55 μmol·kg−1 and –22 μmol·kg−1. The most negative surface excess DIC values of –55 to –40 μmol·kg−1 were also observed in the central SYS, with corresponding AOU values of –56 to –37 μmol·kg−1. The negative excess DIC versus negative AOU on the surface roughly followed the traditional Redfield ratio (Figures 5A, B), showing that primary production synchronously modulated the carbonate system and DO on the sea surface. A small deviation of surface excess DIC : AOU from the Redfield ratio was observed in April 2019 (Figure 5A), presumably due to the slower air–sea re-equilibration of CO2 than that of DO. This is because the marine carbonate system has a substantial chemical buffering capacity, while DO lacks any chemical buffering effect (Zeebe & Wolf-Gladrow, 2001).
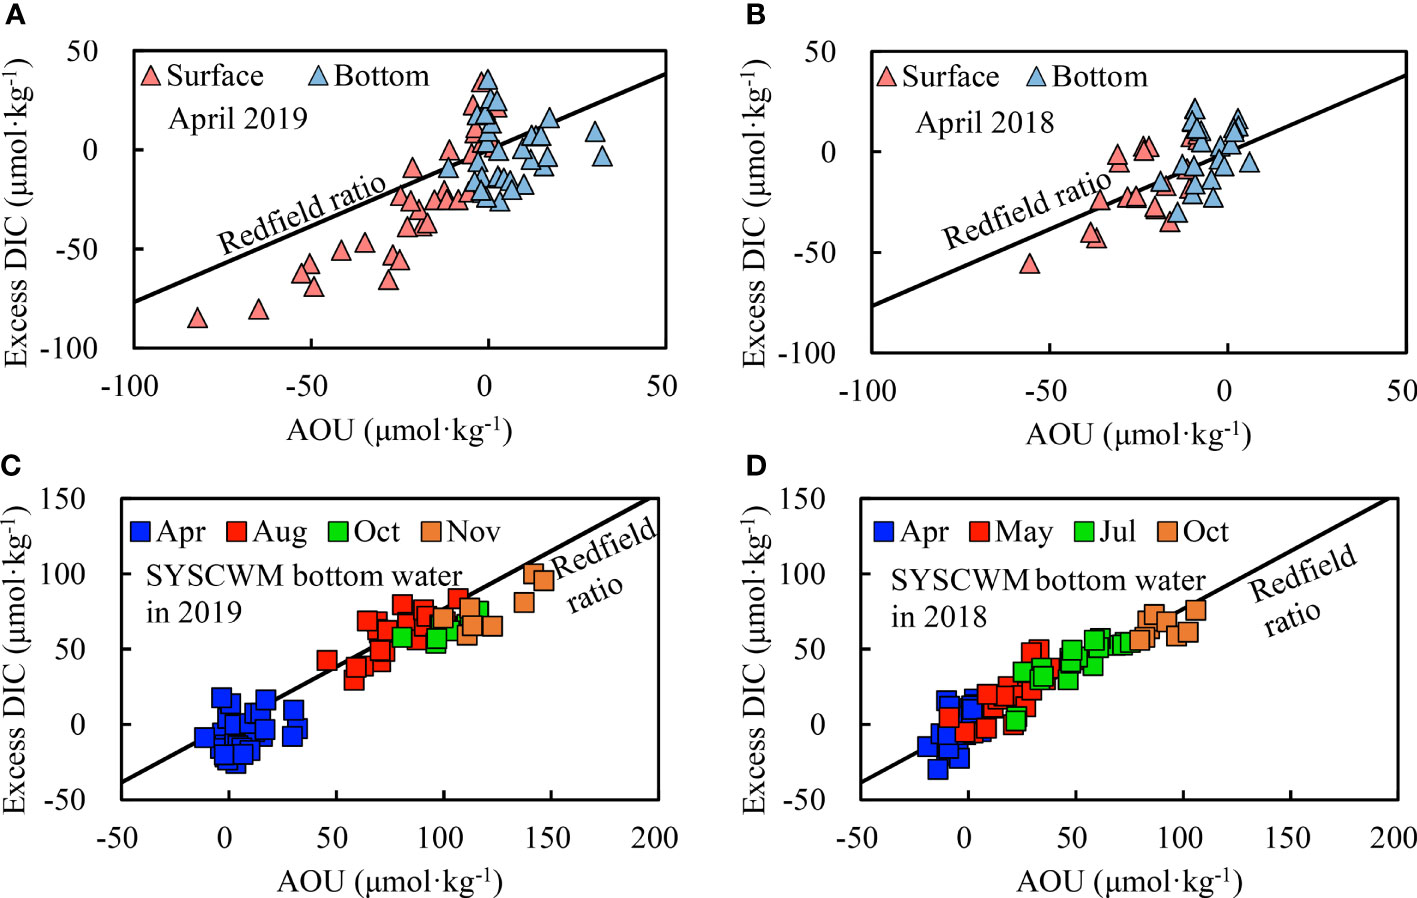
Figure 5 Relationship between excess DIC and AOU in the SYS in spring (A, B) and in the SYSCWM from spring to autumn (C, D). The relevant Redfield ratio is traditionally estimated as excess DIC : AOU = 106:138.
3.4 Quasi-Synchronous Accumulation of Apparent Oxygen Utilization and Excess Dissolved Inorganic Carbon in the South Yellow Sea Cold Water Mass From Spring to Autumn
From spring to autumn, excess DIC versus AOU in the bottom waters of the SYSCWM generally followed the traditional Redfield ratio (Figures 5C, D), suggesting that net community respiration dominated both DIC increase and DO decline. In 2018, the SYSCWM synchronously accumulated excess DIC and AOU by 0.32 and 0.47 μmol·kg−1·d−1, respectively (Figures 6A, B), from April to October. In 2019, however, the seasonal accumulations of excess DIC and AOU were not constant over time.
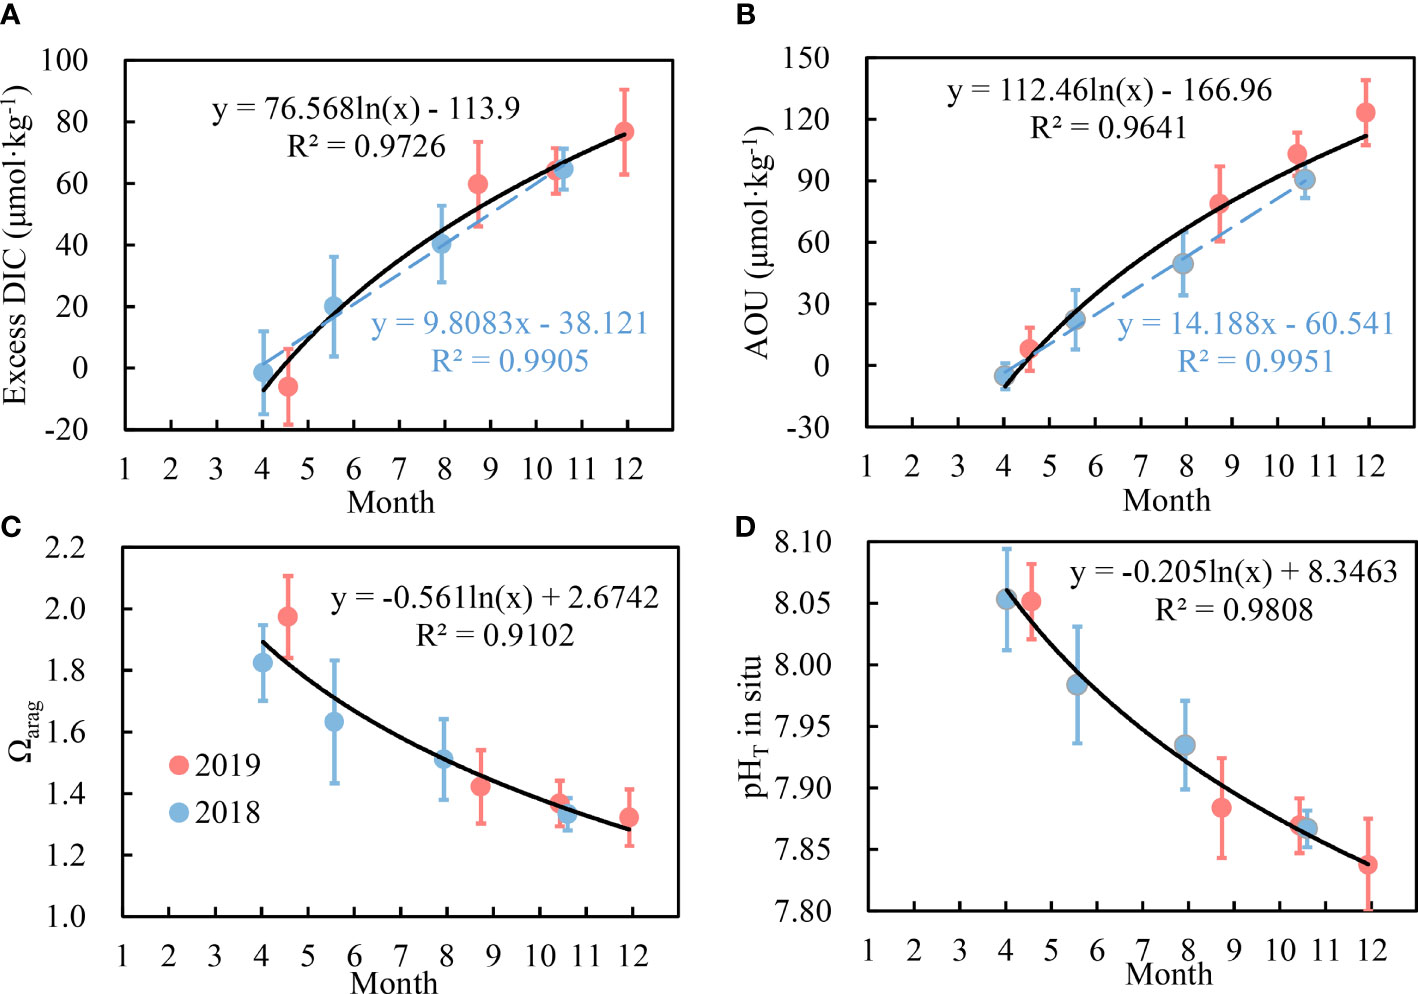
Figure 6 Monthly variations in Ωarag (D), pHT (C), excess DIC (A) and AOU (B) in bottom waters of the SYSCWM. Logarithmic fitting curves (solid black lines) and the optimal regression equations of parameters versus months were plotted, based on all of eight surveys over 2018 and 2019. The blue dashed lines indicate the optimal linear regression of parameters versus months in 2018.
Excess DIC accumulated rapidly in the SYSCWM from mid-April to mid-August in 2019. During this period, excess DIC accumulated at a rate of 0.52 μmol·kg−1·d−1 [i.e., (60 – (–6))/127 = 0.52, Figure 6A], and the converted AOU accumulation rate was 0.68 μmol·kg−1·d−1 (based on the ratio of excess DIC : AOU = 106:138), approximately the same as the earlier reported thr DO consumption rate (ranging from 0.6 to 1 μmol·kg−1·d−1) in the North Yellow Sea cold water mass (Zhai et al., 2014). From mid-August to late November 2019, however, both the excess DIC and AOU accumulation rates declined (Figures 6A, B). The accumulation rate of excess DIC was estimated to be 0.17 μmol·kg−1·d−1 in the second half of 2019 [i.e., (77 – 60)/98 = 0.17, Figure 6A]. Correspondingly, the converted DO consumption rate was only 0.22 μmol·kg−1·d−1, one-third of that from mid-April to mid-August. In general, the SYSCWM exhibited a similar pattern of monthly variations in bottom-water excess DIC and AOU in the two years, although the surveying months were not identical between 2018 and 2019 (Figures 6A, B).
In connection with the strong spring primary production at the surface of the central SYS, the algae blooms in spring provided necessary biogenic debris for net community respiration in the SYSCWM in summer and autumn, making the quasi-synchronous accumulation of AOU and excess DIC in the SYSCWM. In 2019, the negative values of surface excess DIC and AOU were more remarkable in the SYS in comparison with those recorded in 2018 (Figures 5A, B). This may imply that the intensity of spring primary production in 2019 was stronger than that in 2018. The intense primary production in April 2019 may have introduced more biogenic debris to subsurface waters, inducing relatively higher decomposition rates of organic matter and releasing more CO2 (coupled with greater oxygen consumption) in the bottom waters. From spring to autumn, however, earlier intense community respiration may have led to excessive consumption of degradable biogenic debris, weakening later community respiration and leading to a decrease in the accumulation rate of AOU (Figure 6B).
3.5 Respiration-Induced Seasonal Acidification in the South Yellow Sea Cold Water Mass
Figure 6 also shows seasonal variations in cruise-averaged bottom-water Ωarag and pHT in the SYSCWM. From mid-April to mid-August 2019, Ωarag rapidly dropped by 0.55 units, while pHT decreased by 0.17 units (Figures 6C, D). The corresponding rates of decline were estimated to be 0.0043 Ωarag·d−1 and 0.0013 pH·d−1. From mid-August to late November 2019, however, the rates of decline were only 0.0010 Ωarag·d−1 and 0.0005 pH·d−1. Since the net community respiration rate in the SYSCWM decreased from early spring to late autumn, the acidification indexes also exhibited a changing scheme of first decreasing rapidly and then slowing. In this study, logarithmic fitting curves were applied to characterize the Ωarag and pH changes within the two years (Figures 6C, D).
3.6 Interannual Variations in Annual Initial Condition
The progress of acidification in the SYSCWM in 2018 was slightly different from that in 2019. Both the interannual variation in primary production (affecting sea surface hydrochemistry in April and May) and the early spring water temperature affected the annual initial Ωarag values in subsurface waters. In this study, the annual initial average bottom-water Ωarag of 1.82 at a temperature of 7.5°C was observed in April 2018, lower than that of 1.97 at a temperature of 9.9°C in April 2019. After 1 month of net community respiration, in May 2018, the average bottom-water Ωarag had dropped to 1.63. In several deep stations (>70 m), bottom-water Ωarag was observed to be as low as 1.42, even lower than the critical threshold of CaCO3 dissolution of 1.5 in the Yellow Sea. For May 2019, we predicted a possible average bottom-water Ωarag value based on the initial value in April 2019 and the rate of Ωarag decline from mid-April to mid-August 2019. The Ωarag was estimated to be 1.82 in May 2019, much higher than the data in May 2018. It was also much higher than the critical threshold of CaCO3 dissolution of 1.5.
Because of the different annual initial Ωarag, the appearance of CaCO3-unsafe seawater occurred earlier in 2018 than in 2019. Benthic shellfish in the SYSCWM were exposed to CaCO3-unsafe seawater since as early as May in 2018. However, the annual initial pHT (in situ) values were approximately the same in both years (data not presented in this study). This is because, in an open system that re-equilibrates with atmospheric CO2, the pHT (in situ) changes little following changes in temperature (Cai et al., 2020; Xiong et al., 2020).
4 Discussion
4.1 The Water-Mixing Scheme and Springtime Biogeochemical Processes
4.1.1 The Water-Mixing Scheme in the South Yellow Sea
Many potential water sources affect the carbonate system in the SYS (Zhai, 2018). Water exchange can be detected, even in the SYSCWM, in summer (Diao, 2015). We assumed that the SYS should mainly be affected by the mixing of a few water masses. An endmember mixing model was applied to approximate the chemical hydrology of the SYS.
Temperature–salinity diagrams (Figures 7A, B) and TAlk–salinity diagrams (Figures 7C, D) of surface and bottom waters illustrate a three-endmember water-mixing scheme, comprising the SuBei Coastal Water (SBCW), the LuBei Coastal Current (LBCC) and the YSWC waters (Figure 1B). The three water types were characterized as: relatively high temperature, low salinity and high TAlk for SBCW; low temperature, low salinity and high TAlk for LBCC; and relatively high temperature, high salinity and low TAlk for YSWC. The endmembers were listed in Table 2. Most of them were averaged data of the whole water column because the water columns were usually well-mixed in April. A weak halocline appeared in the central SYS in April, however, indicating YSWC intrusion. Combining the flow direction of the YSWC and the temperature–salinity and TAlk–salinity structures, the bottom-water data of station H33 at the southeastern corner of the SYS (Figure 1B) were used to represent the YSWC endmember in April 2019. This station was located in the usual main body of the YSWC in spring; that is, east of 123°30′E and south of 35°N in the SYS (Zhang et al., 1996).
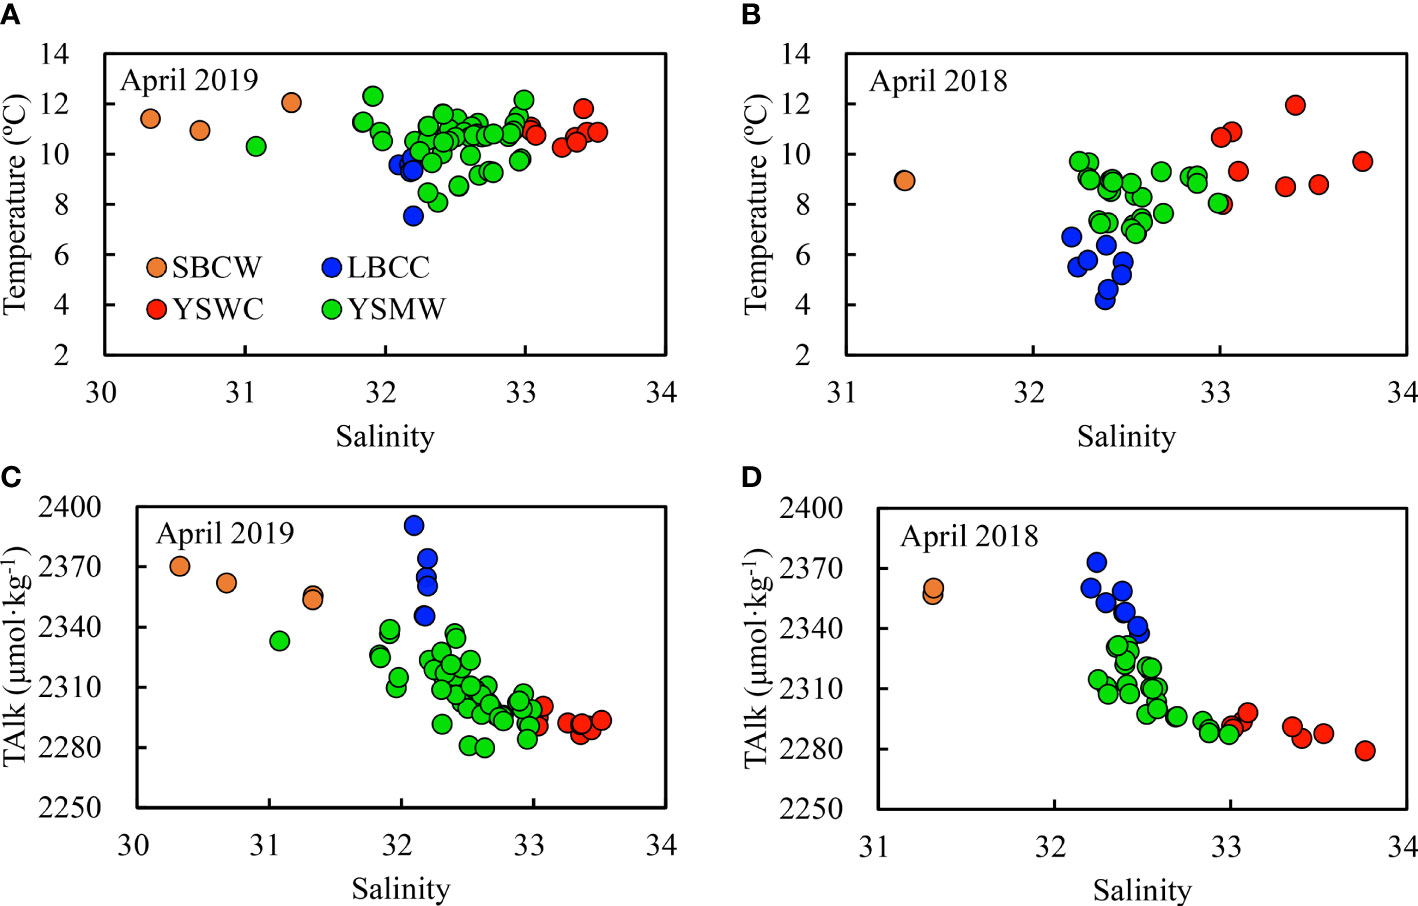
Figure 7 Relationships between water temperature and salinity (A, B) and between TAlk and salinity (C, D) in the SYS in spring. Only surface and bottom-water data were plotted. SBCW, Subei Coastal Water; LBCC, Lubei Coastal Current; YSWC, Yellow Sea Warm Current; YSMW, Yellow Sea Mixed Water. Locations of typical SBCW, LBCC, and YSWC waters observed in April 2019 are shown in Figure 1B.
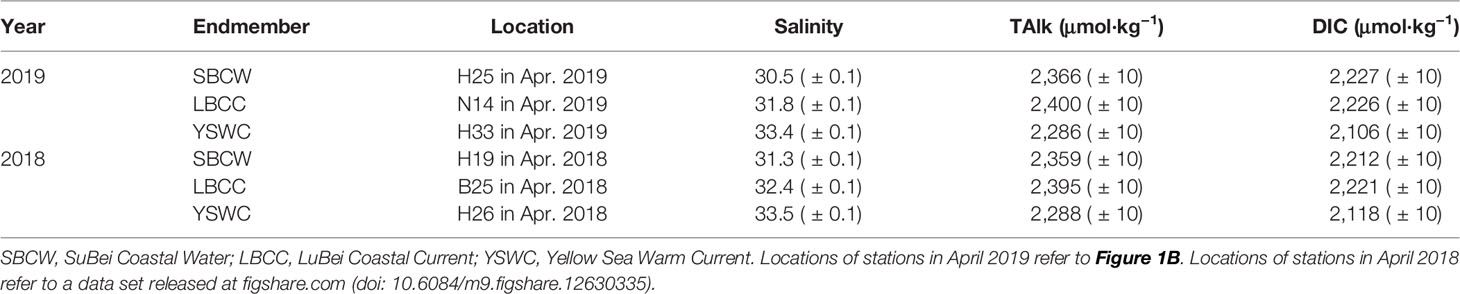
Table 2 Endmember values and their uncertainties.
To construct a three-endmember water-mixing scheme, at least two quasi-conservative tracers are needed. Water temperature is not a good option in shallow seas, since it is affected by the latent and sensible heat exchange between atmosphere and seawater. In this study, salinity and TAlk were used as the two quasi-conservative parameters in constructing our temperature–salinity model, as the effects of organic matter production and degradation on TAlk were usually negligible. In addition, the dominant algae in the SYS are diatoms (Liu et al., 2015) with small amounts of coccolithophores (Jin et al., 2015), and these were not expected to have the potential to change the relationship between TAlk and salinity in the SYS. The Ωarag values are also usually greater than 1.5 in spring (Zhai, 2018; Xiong et al., 2020), indicating that CaCO3 dissolution should also be negligible, at least in that season.
The parameter values of the three endmembers are shown in Table 2. To similarly characterize the hydrological process in the SYS in April 2018, we also constructed another three-endmember water-mixing model (Table 2) based on the 2018 data set (Xiong et al., 2020).
The water-mixing model was defined as
where subscripts 1, 2, and 3 denote the three endmembers (SBCW, LBCC water, and YSWC water, respectively); S and TAlk refer to measured salinity and total alkalinity, respectively; and f refers to the fraction that each endmember contributes to the samples collected in situ. The fraction distributions of the SBCW, LBCC, and YSWC waters in the SYS bottom layer in spring (April) 2018 and 2019 are plotted in Figure 8.
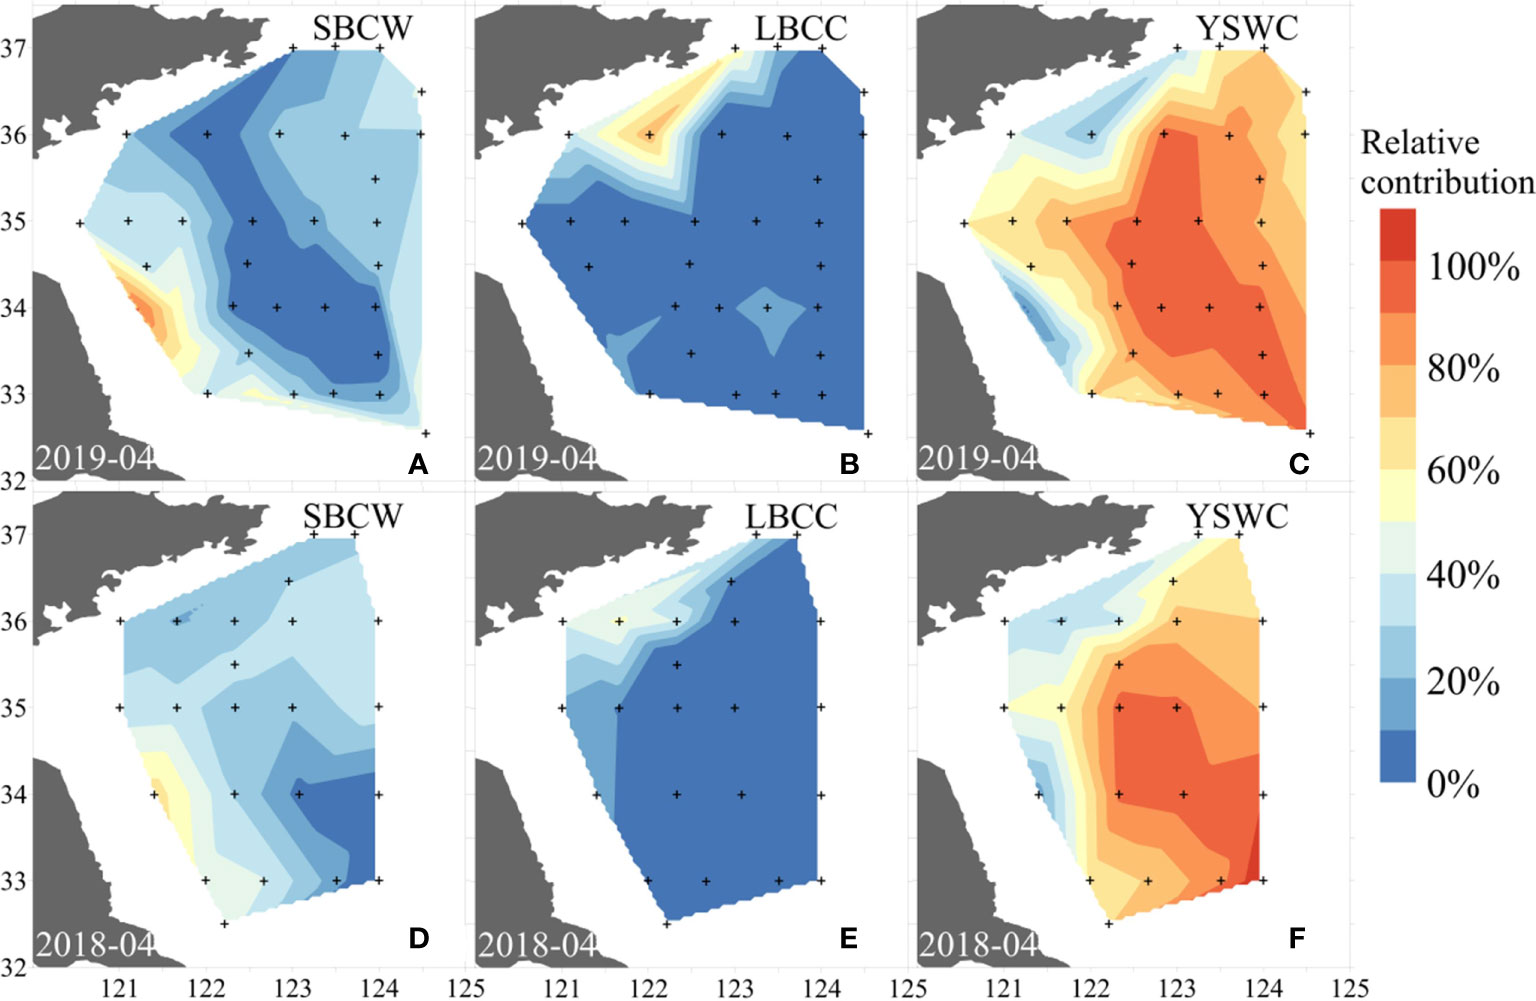
Figure 8 Relative contributions of SuBei Coastal Water (SBCW), LuBei Coastal Current (LBCC) water, and Yellow Sea Warm Current (YSWC) water in the bottom layer of the SYS in April 2019 (A–C) and April 2018 (D–F).
4.1.2 Thermal Sensitivity of Annual Initial Carbonate System Parameters
The lower annual initial Ωarag caused by the lower water temperatures in spring 2018 subjected the growth of calcifying organisms inhabiting the SYSCWM to environmental stress earlier than in 2019. To examine how the spring thermal state affected the annual initial Ωarag, the CO2SYS software and equation (1) were used. By inputting the given salinity, Talk, and of a certain endmember, and changing its water temperature, we obtained the temperature-dependent, air-equilibrated DIC values of the water endmember. Then, we calculated bottom-water DIC values solely from conservative mixing at each station in spring. The basin-averaged DIC and Ωarag were also simulated for the entire region. Our simulation showed that the three water types exhibited similar thermal sensitivity to DIC changes (Figure 9A). However, the cooling in the YSWC had a far greater impact on the spring basin-averaged Ωarag than did the cooling in the two other water types (Figure 9). This was because the volume of YSWC water was the greatest of the three water types and may even have overwhelmed the SYS in winter and early spring (Figure 8). A re-equilibrium of the YSWC water with atmospheric CO2 at a given temperature in late winter and/or early spring determined the initial Ωarag of the SYSCWM before Ωarag declined in late spring, summer, and autumn (Xiong et al., 2020).
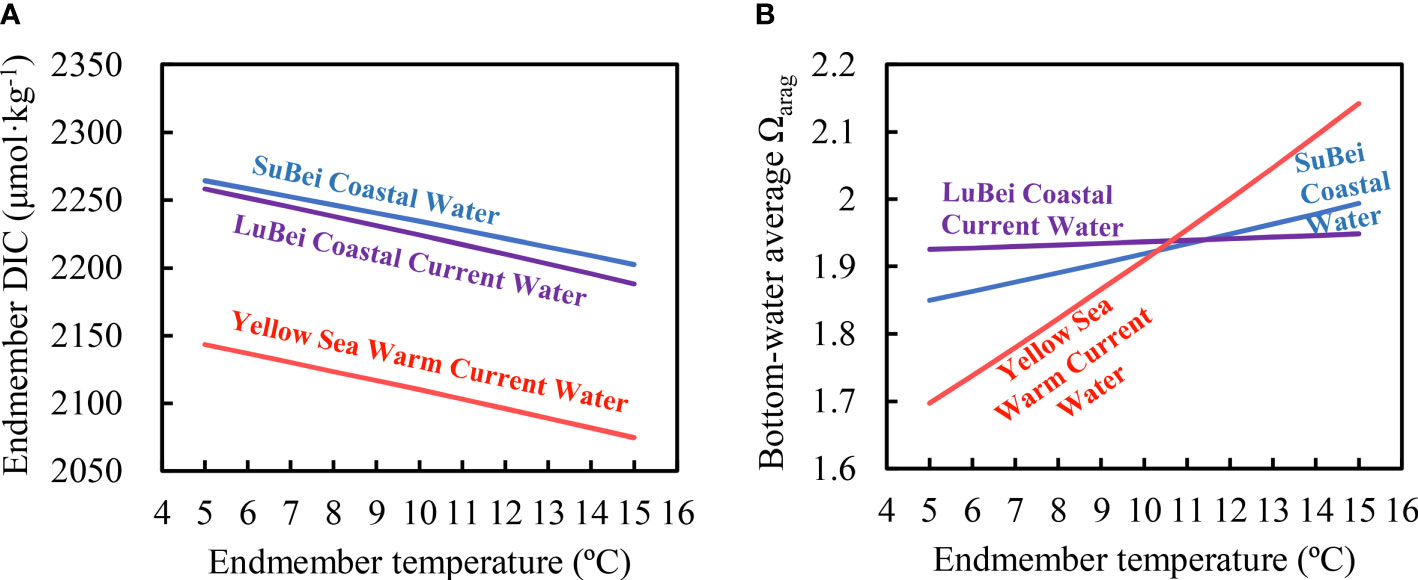
Figure 9 Simulation of effects of endmember water temperature changes on endmember DIC values (A) and on the bottom-water average Ωarag (B) in the SYS in spring.
4.1.3 Non-Conservative Behaviors of Dissolved Inorganic Carbon in the South Yellow Sea in Spring
The above-obtained fractions from equations (3)–(5) were applied to predict conservative concentrations of DIC resulting solely from conservative mixing:
Sensitivity analysis was performed through 50 iterations of a Monte Carlo simulation to determine the robustness of the results to random changes in endmember properties (Table S1). For each iteration, random perturbations for salinity and TAlk were generated from a normal distribution with the same mean and standard deviation as the measured parameter within each endmember. A standard deviation of the difference between the simulated scenarios and the unperturbed scenario was computed for the fractional contribution from each endmember and the conservative concentrations of DIC at every station, as well as a mean standard deviation for the entire region. The results showed that the mean standard deviations of f1, f2, f3, and DICmix were ± 7%, ± 10%, ± 5%, and ± 8 μmol·kg−1, respectively (Table S1).
Since the modeled DICmix values indicated conservative mixing, the DIC measured values minus the DICmix values were regarded as the cumulative effect of various non-conservative processes:
ΔDIC versus AOU roughly followed the Redfield ratio (Figures 10A, B), and the ΔDIC–excess DIC ratio was close to 1:1 (Figures 10C, D), suggesting that both ΔDIC and excess DIC reflected the impact of metabolic processes (mainly including photosynthesis in the surface and net community respiration in bottom waters) on the carbonate system. In spring, all the bottom-water AOU, ΔDIC, and excess DIC were almost zero (Figure 10), indicating that the SYS bottom-water carbonate chemistry in this season was dominated by the physical mixing of multiple water types. The impacts of net community metabolism on spring AOU and the carbonate system were mostly revealed in surface waters.
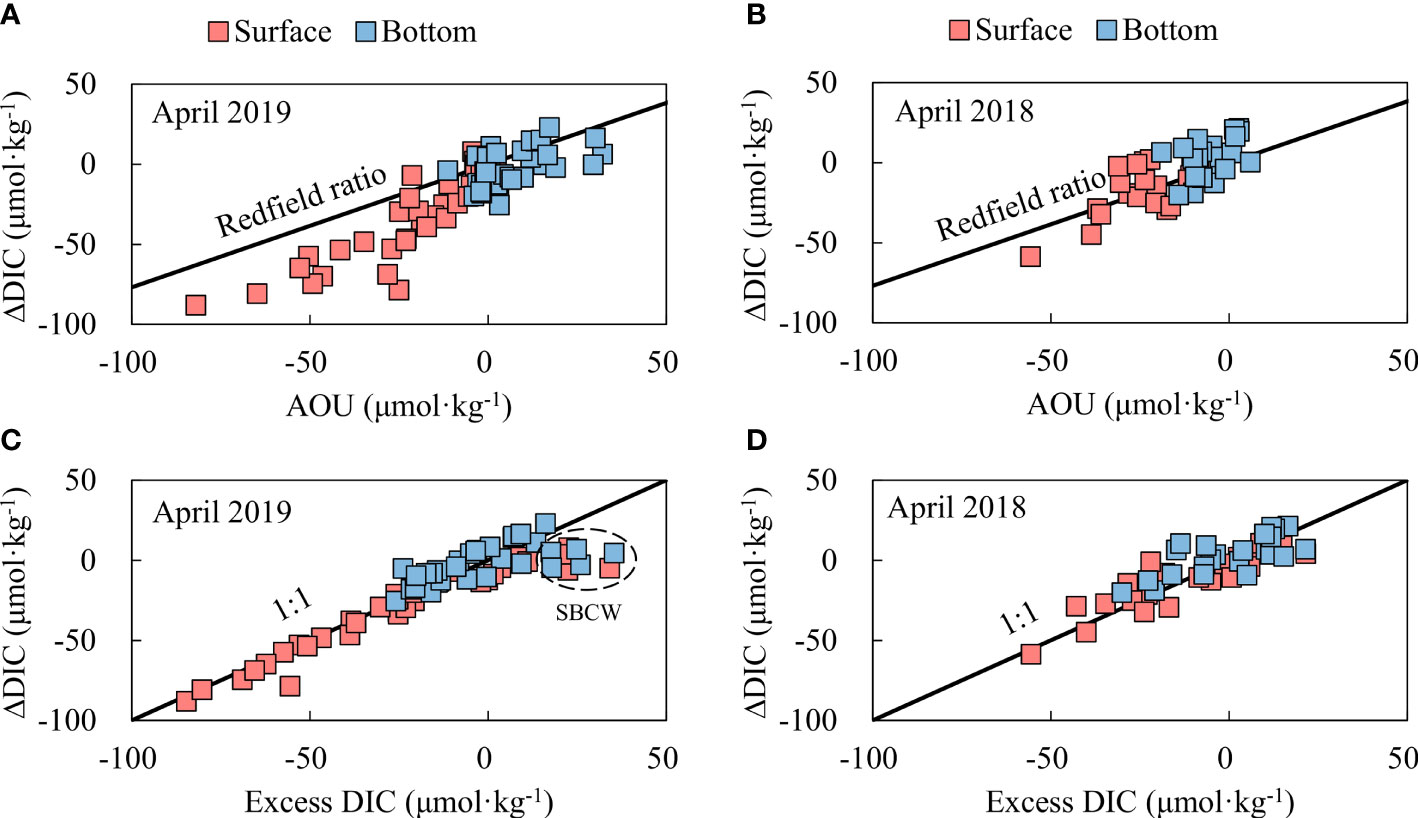
Figure 10 Relationship between ΔDIC and AOU (A, B) and between ΔDIC and excess DIC (C, D) in the SYS in spring. ΔDIC means non-conservative addition (positive values) and/or removal (negative values) [see equation (7)]. In panel (C), the outliers in a dashed circle were collected at stations H23, H25, H26, H27, and H28 (Figure 1B), where water depth (<20 m) was extremely shallow. Dissolved oxygen was roughly 100%, while dissolved CO2 was oversaturated, inducing excess DIC values. SBCW, SuBei Coastal Water.
4.2 Controls of Accumulations of Apparent Oxygen Utilization and Excess Dissolved Inorganic Carbon in the South Yellow Sea Cold Water Mass in Summer and Autumn
In the SYS, a strong thermocline remains stable in summer and autumn (e.g., Zhai, 2018; Guo et al., 2020; Xiong et al., 2020). In a recently published carbonate-related study, Wang and Zhai (2021) showed monthly variations in the density difference between surface and bottom layers (Δρ) in the SYS. Briefly, a remarkable stratification (of Δρ ≥ 1.5 kg·m−3) appears in late spring (May) every year, develops in summer and early autumn (from June to September), tends to collapse in mid-autumn and/or late autumn (October and November), and disappears in early winter (December). This is in good agreement with our results (Figure S1). The well-established stratification and the consequent cold water mass at the bottom layer in warm seasons (i.e., the SYSCWM) were distributed over a large area of the central SYS (Figures 1C–E), undoubtedly blocking vertical water mixing and gas exchanges between the bottom and surface waters. In the SYSCWM, excess DIC versus AOU exhibited a tight relationship with each other and satisfactorily followed the traditional Redfield relationship (Figures 5C, D). In surface waters, however, spring excess DIC versus AOU exhibited a loose relationship with each other, and, to some extent, deviated from the traditional Redfield relationship (Figures 5A, B). This comparison suggested that the SYSCWM served as an almost enclosed biogeochemical reactor on a time scale of 0.5 years. In this biogeochemical reactor, AOU and excess DIC were quasi-synchronously accumulated from late spring to autumn, leading to a decline in bottom-water Ωarag and pHT (Figure 6).
To examine the potential effects of East China Sea shelf waters on the SYSCWM carbonate system, the three-endmember water-mixing models in April 2018 and 2019 were also applied to the other surveys. Then, the non-conservative behaviors of DIC (i.e., ΔDIC) were estimated using Equation (7). The monthly relationships among ΔDIC, excess DIC, and AOU in the SYSCWM (Figures 11) were similar to those in the entire SYS in spring (Figure 10), indicating that the potential influences of horizontal mixing on the accumulation of inorganic carbon in SYSCWM in summer and autumn were negligible and suggesting that the simplified analyses based on excess DIC should be reasonable (see Results).
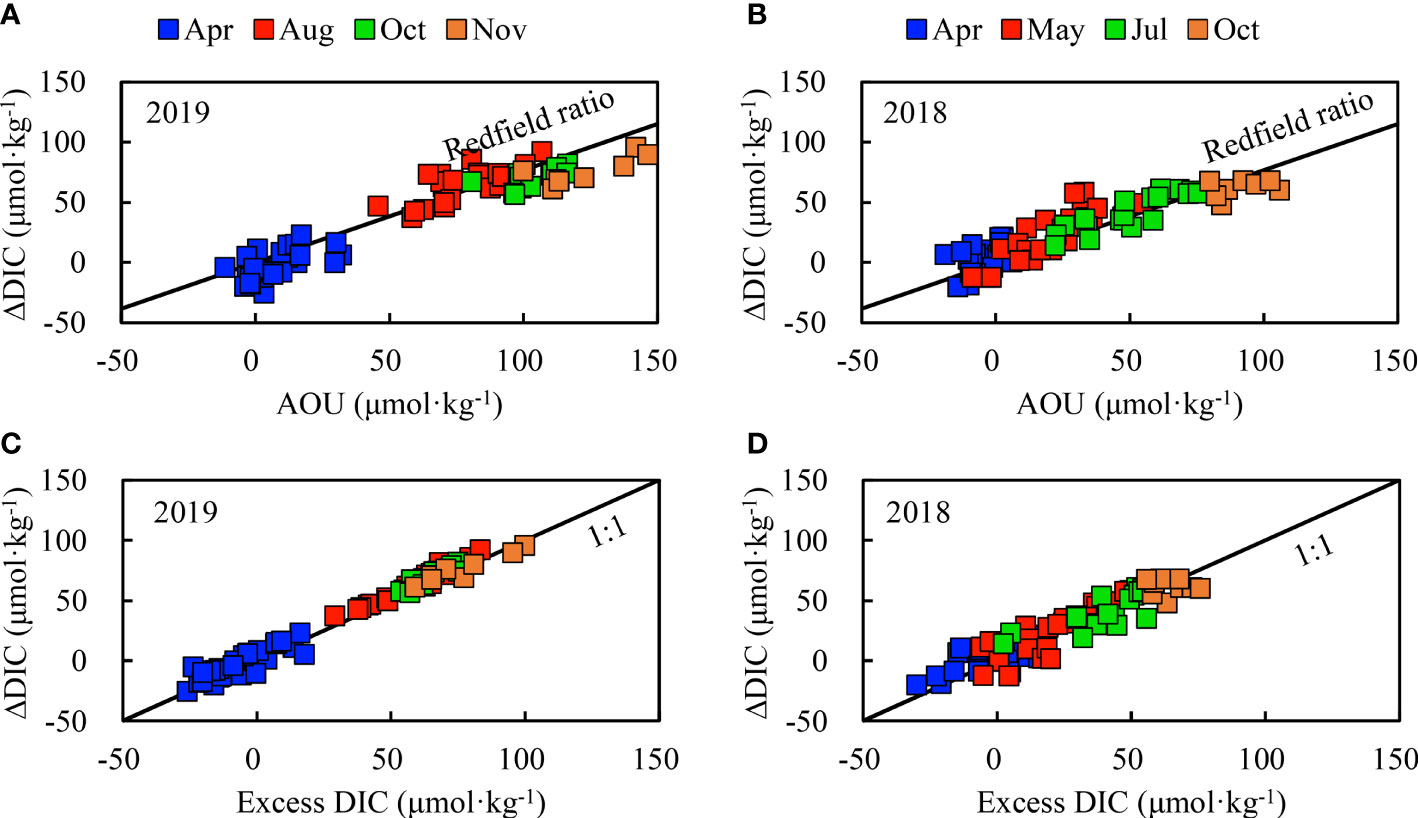
Figure 11 Relationships between ΔDIC and AOU (A, B) and between ΔDIC and excess DIC (C, D) in bottom waters of the SYSCWM. ΔDIC = non-conservative addition (positive values) and/or removal (negative values) (see Equation 7).
The data maps of water temperature, salinity, and TAlk (Figures 3, 4) provided more evidence of the negligible impacts of East China Sea shelf waters on the SYSCWM carbonate system in a given year. In August 2019, the potential East China Sea shelf water intrusion in the SYS was characterized as having a relatively low salinity of <30 (Figure 3j) and a low TAlk of < 2,210 μmol·kg−1 (Figure 4b) at the surface layer. Both were substantially lower than the values generally found in SYS waters, indicating origins from rainfall and/or an estuarine plume (from the Changjiang diluted water). A similar water type also affected the SYS bottom waters along the China coast west of 122°E. In bottom waters east of 122°E, however, the only exogenous water with a relatively high temperature of >17°C (Figures 3f–h), low salinity of <32 (Figures 3n–p), and low TAlk of <2,210 μmol·kg−1 (Figures 4f–h) was confined to the south of 33.5°N, exhibiting a clear boundary with the SYSCWM (Figures 1C–E). In summary, the East China Sea shelf water intrusion mainly affected the surface waters in the SYS in summer. Its impacts on the SYS bottom waters were located outside the SYSCWM area under study.
4.3 Sensitivity of Ωarag Decline to the Accumulation of Excess DissolvedInorganic Carbon
The DIC addition can decrease Ωarag and pH values, and vice versa (Figure 12), resulting in near-linear relationships. The observed Ωarag to ΔDIC relationship in the SYSCWM in 2018 was systematically lower than that found in 2019 (Figure 12E), while there was no statistical difference in the observed pHT-to-ΔDIC relationships in both years (Figure 12F). The different intercepts of 1.85 in 2018 and 1.96 in 2019 (Figures 12A, B) denoted again the slightly different initial Ωarag in spring 2018 and spring 2019 (see section 3.6) when the bottom-water net ecosystem metabolism (net ecosystem photosynthesis minus respiration) was zero. The slopes of the regression lines of Ωarag versus ΔDIC ranged from −0.0088 to −0.0084 (Figures 12A, B). When ΔDIC was added with 100 μmol·kg−1, Ωarag decreased by 0.84–0.88. In other words, to reduce Ωarag by one unit, it is necessary to increase ΔDIC by 114–119 μmol·kg−1 in the SYSCWM.
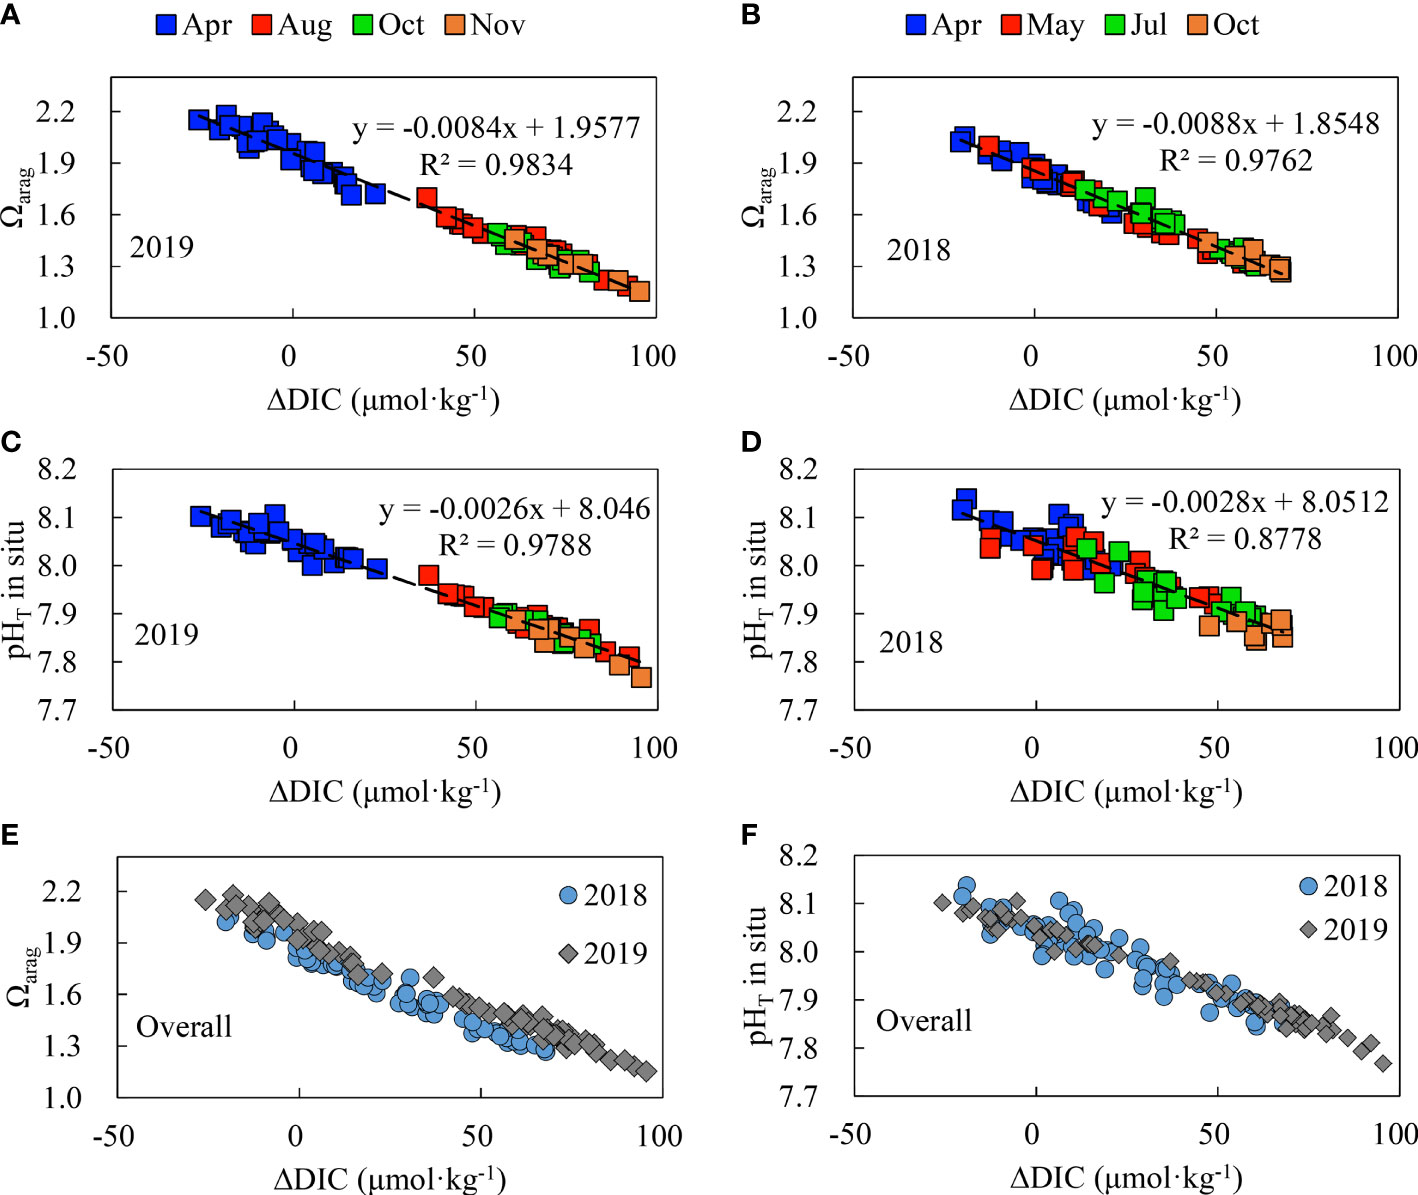
Figure 12 Relationship between Ωarag and ΔDIC (A, B) and between pHT and ΔDIC (C, D) and systematic comparisons of Ωarag and pHT values (E, F) for 2018 and 2019 in bottom waters of the SYSCYM. ΔDIC means non-conservative addition (positive values) and/or removal (negative values) [see Equation (7)].
A similar slope of 100 μmol·kg−1 ΔDIC to 0.89 Ωarag changes was obtained in the central North Yellow Sea (Li & Zhai, 2021). The value in the northern Gulf of Mexico (also a high productivity coastal region), however, differed from ours: Huang et al. (2021) found that each increase in the DIC removal of 100 μmol·kg−1 increased Ωarag by 1 unit. Therefore, the sensitivity of seawater Ωarag changes to DIC addition varies in different systems.
These differences are mainly due to different water temperatures. Compared with the Yellow Sea cold water mass (where the water temperature was 7°C–12°C in this study), the water temperature in the northern Gulf of Mexico is much higher (20°C–30°C). Thus, the annual initial value of Ωarag is also relatively high in the northern Gulf of Mexico, resulting in a relatively large space for the decline in Ωarag. The higher the water temperature and the higher the annual initial Ωarag, the greater the space for Ωarag change, indicating that Ωarag is more sensitive to the addition of DIC. In contrast, the lower the water temperature, the closer the annual initial Ωarag to the mathematical limitation of Ωarag (see Introduction for a definition of Ωarag). The response of Ωarag changes to the addition of DIC will be weaker.
To quantify this temperature-driven relationship, we calculated ideal relationships of Ωarag and the sensitivity index of Ωarag (to ΔDIC) versus ΔDIC in the Yellow Sea cold water mass and the surface of the open ocean (Figures 13A, B). The simulation was based on CO2SYS software, equation (1), region-specific water temperature, salinity, and TAlk. The initial of 365 μatm was used to obtain the zero point of the ΔDIC. In the Yellow Sea cold water mass, the water temperature was fixed at 10°C, while TAlk = 2,313 μmol·kg−1 and salinity = 32.5 (Table 2). On the surface of the open ocean, the water temperature was fixed at 25°C, TAlk = 2,300 μmol·kg−1, and salinity = 35, very similar values to those found in the high-salinity region of the northern Gulf of Mexico, as reported by Huang et al. (2021). During the simulation, was increased by 30 μatm at every step.
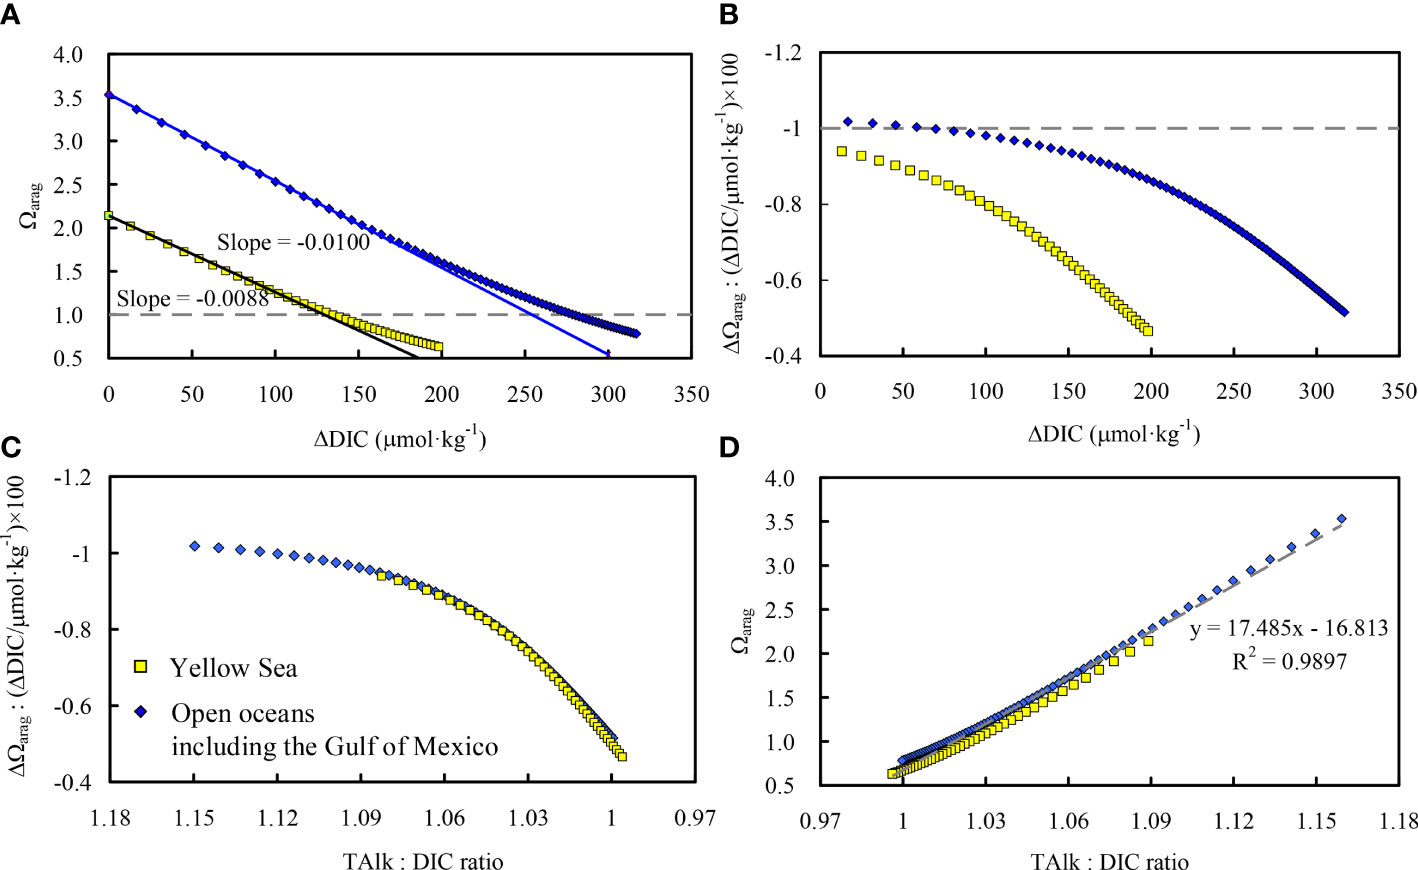
Figure 13 Relationships of Ωarag and the sensitivity index of Ωarag (to ΔDIC) versus ΔDIC (A, B) and versus the TAlk : DIC ratio (C, D) in the Yellow Sea cold water mass and the open ocean surface. ΔDIC means CO2 addition, either from net community respiration or from atmospheric CO2 invasion.
The results clearly revealed the region-specific sensitivity index of Ωarag to ΔDIC (Figure 13A); that is, 100 μmol·kg−1 ΔDIC to 0.88 Ωarag changes in the Yellow Sea cold water mass (the same as our data-based results) and 100 μmol·kg−1 ΔDIC to 1.00 Ωarag changes at the surface of the open ocean (including the high-salinity region of the northern Gulf of Mexico) as reported by Huang et al. (2021). However, the simulation also clearly revealed that the sensitivity index declined when ΔDIC increased (Figure 13B). This was true in both of the two ideal systems, while the sensitivity decline was more pronounced in the Yellow Sea cold water mass than at the surface of the open ocean and in the high-salinity region of the northern Gulf of Mexico.
Water salinity also affects the relationship between Ωarag changes and ΔDIC (Xiong et al., 2019). Therefore, there is no uniform proportional relationship between Ωarag changes and DIC addition, and this relationship is greatly affected by the degree of CO2 supplementation. In addition to the effects of the above annual initial cooling on Ωarag, the sensitivity of Ωarag changes to DIC addition in various sea areas may tend to decrease in the future as atmospheric CO2 continuously increases and invades the ocean interior.
To further explore causes of the apparently region-specific performance of the sensitivity index, we plotted the sensitivity index of Ωarag (to ΔDIC) against the TAlk : DIC ratio (Figure 13C). The apparent regional differences (Figures 13A, B) almost disappeared, suggesting that the temperature-driven decline in the sensitivity index of Ωarag (to ΔDIC) in the Yellow Sea cold water mass—compared with that in open oceans and the Gulf of Mexico—was actually caused by cooling-promoted CO2 dissolution and so by the decline in the annual initial TAlk : DIC ratio in the Yellow Sea in winter and early spring. Since the TAlk : DIC ratio is strongly correlated with the carbonate ion concentration (when the TAlk : DIC ratio is higher than 1 and the carbonate ion concentration is more than 50 μmol·kg−1), and the Ωarag variations primarily depended on carbonate ion concentrations (Li and Zhai, 2021), a significant correlation between Ωarag and the TAlk : DIC ratio was revealed in our ideal simulation (Figure 13D). This correlation is almost linear (when the TAlk : DIC ratio is higher than 1), and exhibits ignorable regional differences based on our ideal settings. A data-based comparison between Ωarag and the TAlk : DIC ratio has been carried out in the Gulf of Mexico and on the east coast of the United States by Wang et al. (2013).
5 Summary and Concluding Remarks
Carbonate dynamics and AOU in the SYS were investigated on seasonal and interannual time scales. Seasonally, both the temperature-dominated air–sea re-equilibration of gases in the YSWC water and the intense spring primary production substantially affected the SYS carbonate system and DO in surface waters. The primary production is expected to produce considerable amounts of biogenic debris for subsurface DO consumption. From late spring, a cold water mass developed. This prevailed in summer and autumn, synchronously accumulating AOU and excess DIC beneath the thermocline, leading to seasonal acidification. With the exception of the annual initial status (dominated by hydrological processes) in spring, the summer and autumn carbonate dynamics and the acidification status of the cold water mass were almost free from the potential impacts of the weak water mixing and internal circulation in summer and autumn in a given year. Although almost the same rhythm of seasonal acidification was revealed in 2018 and 2019, our data also revealed interannual variations in subsurface DO consumption and acidification.
In 2019, subsurface excess DIC accumulated at a rate of 0.52 μmol·kg−1·d−1 from spring to summer, and the correspondingly converted DO consumption rate was 0.6 – 0.7 μmol·kg−1. From summer to autumn, however, the accumulation rate of bottom-water excess DIC declined to only 0.17 μmol·kg−1·d−1, while the converted DO consumption rate was estimated to be 0.22 μmol·kg−1·d−1. Correspondingly, acidification indexes (Ωarag and pHT) decreased in logarithmic forms in 2019, that is, declining quickly from late spring to summer, and the rate of descent slowing in autumn.
In 2018, almost constant accumulation rates of excess DIC and AOU of 0.32 and 0.47 μmol·kg−1·d−1, respectively, were synchronously observed in the SYS cold water mass from April to October. Since the temperature-dominated air–sea re-equilibration of CO2 in the YSWC water substantially affected the central SYS in spring, the annual initial value of Ωarag in 2018 was lower than that in 2019. Therefore, the critical bottom-water Ωarag value of 1.5 when the growth of marine-calcifying organisms is severely threatened was observed since late spring in 2018, although the similarly critical bottom-water Ωarag level appeared only in summer and autumn in 2019.
In the SYS cold water mass, a DIC increase of 100 μmol·kg−1 induced a decrease in Ωarag by 0.84–0.88 units. In other words, to reduce Ωarag by 1 unit, we expect an increase in the DIC accumulation of 114–119 μmol·kg−1 in the present SYS. The spring water temperature and corresponding TAlk : DIC ratio are key factors in determining the regional sensitivity of Ωarag to DIC accumulation. There is no uniform proportional relationship between Ωarag changes and DIC addition, and this relationship may tend to decrease in the future as atmospheric CO2 continuously increases and invades the ocean interior.
Data Availability Statement
The raw data supporting the conclusions of this article will be made available by the authors, without undue reservation.
Author Contributions
W-dZ designed the research and performed two of the field surveys. S-qY performed two field surveys, handled the data collection, analyzed the data set and drafted an early version of the manuscript. T-qX contributed to the historical data collection. All authors contributed to discussion and revision of the manuscript.
Conflict of Interest
The authors declare that the research was conducted in the absence of any commercial or financial relationships that could be construed as a potential conflict of interest.
Publisher’s Note
All claims expressed in this article are solely those of the authors and do not necessarily represent those of their affiliated organizations, or those of the publisher, the editors and the reviewers. Any product that may be evaluated in this article, or claim that may be made by its manufacturer, is not guaranteed or endorsed by the publisher.
Acknowledgments
This research was jointly funded by the National Key Research and Development Program of China (contact no. 2020YFA0608301) and the National Natural Science Foundation of China (grant no. 42141001). Sampling surveys were jointly supported by the National Natural Science Foundation of China (grant no. 41849901) through ship-time sharing projects during Open Research Cruises conducted in the Bohai and Yellow seas (on board R/VBeidou and R/VLanhai 101) in April and October 2019 (cruise no. NORC2019-01); and by the Yellow Sea Fisheries Research Institute, Chinese Academy of Fishery Sciences, through the Monitoring Project of Fishery Resources and Habitat Environment in the Yellow Sea (on board R/V Beidou, August 2019); and by the Center for Ocean Mega-Science, Chinese Academy of Sciences, through a joint “Healthy Ocean” cruise (on board R/V Kexue III, November 2019). We thank Elaine Monaghan for editing the English text of a draft of this paper and the reviewers for their thoughtful and constructive comments, which improved the quality of this paper.
Supplementary Material
The Supplementary Material for this article can be found online at: https://www.frontiersin.org/articles/10.3389/fmars.2022.858871/full#supplementary-material
References
Benson B. B., Krause D. (1984). The Concentration and Isotopic Fractionation of Oxygen Dissolved in Freshwater and Seawater in Equilibrium With the Atmosphere. Limnol. Oceanog. 29 (3), 620–632. doi: 10.4319/lo.1984.29.3.0620
Borges A. V., Gypens N. (2010). Carbonate Chemistry in the Coastal Zone Responds More Strongly to Eutrophication Than Ocean Acidification. Limnol. Oceanog. 55 (1), 346–353. doi: 10.4319/lo.2010.55.1.0346
Cai W.-J., Hu X.-P., Huang W.-J., Murrell M. C., Lehrter J. C., Lohrenz S. E., et al. (2011). Acidification of Subsurface Coastal Waters Enhanced by Eutrophication. Nat. Geosci. 4, 766–770. doi: 10.1038/ngeo1297
Cai W.-J., Xu Y.-Y., Feely R. A., Wanninkhof R., Jönsson B., Alin S. R., et al. (2020). Controls on Surface Water Carbonate Chemistry Along North American Ocean Margins. Nat. Commun. 11, 2691. doi: 10.1038/s41467-020-16530-z
Chen C.-T. A. (2009). Chemical and Physical Fronts in the Bohai, Yellow and East China Seas. J. Mar. Syst. 78, 394–410. doi: 10.1016/j.jmarsys.2008.11.016
Cheng J. (2011). “Seasonal Variation, Distribution and Sources of Particulate Organic Carbon in the Yellow Sea and East China Sea,” in Master Thesis (Qingdao: Ocean University of China), 91 pp. Available at: http://dx.chinadoi.cn/10.7666/d.y1926750.
Choi Y., Cho S., Kim D. (2020). Seasonal Variation in Aragonite Saturation States and the Controlling Factors in the Southeastern Yellow Sea. Mar. Poll. Bull. 150, 110695. doi: 10.1016/j.marpolbul.2019.110695
Diao X. (2015). “The Study of Yellow Sea Warm Current, Yellow Sea Cold Water Mass and Their Evolution Process in Spring,” in Doctoral Thesis (Qingdao: Institute of Oceanology, Chinese Academy of Sciences), 102 pp. Available at: https://xuewen.cnki.net/CDFD-1015387729.nh.html.
Dickson A. G. (1990). Standard Potential of the Reaction: AgCl(s) + 1/2 H2(g) = Ag(s) + HCl(aq), and the Standard Acidity Constant of the Ion HSO4- in Synthetic Sea Water From 273.15 to 318.15 K. J. Chem. Thermodynam. 22 (2), 113–127. doi: 10.1016/0021-9614(90)90074-Z
Dickson A. G. (2010). “The Carbon Dioxide System in Seawater: Equilibrium Chemistry and Measurements,” in Guide to Best Practices for Ocean Acidification Research and Data Reporting, Luxembourg: Publications Office of the European Union. Eds. Riebesell U., Fabry V. J., Hansson L., Gattuso J.-P., pp.17–pp.40.
Doney S. C., Fabry V. J., Feely R. A., Kleypas J. A. (2009). Ocean Acidification: The Other CO2 Problem. Annu. Rev. Mar. Sci. 1, 169–192. doi: 10.1146/annurev.marine.010908.163834
Dong S.-S., Lei Y.-L., Li T.-G., Jian Z.-M. (2020). Response of Benthic Foraminifera to pH Changes: Community Structure and Morphological Transformation Studies From a Microcosm Experiment. Mar. Micropaleontol. 156, 101819. doi: 10.1016/j.marmicro.2019.101819
Ekstrom J. A., Suatoni L., Cooley S. R., Pendleton L. H., Waldbusser G. G., Cinner J. E., et al. (2015). Vulnerability and Adaptation of US Shellfisheries to Ocean Acidification. Nat. Climate Change 5, 207–214. doi: 10.1038/nclimate2508
Eyre B. D., Cyronak T., Drupp P., De Carlo E. H., Sachs J. P., Andersson a. J. (2018). Coral Reefs Will Transition to Net Dissolving Before End of Century. Science 359, 908–911. doi: 10.1126/science.aao1118
Feely R. A., Alin S. R., Newton J., Sabine C. L., Warner M., Devol A., et al. (2010). The Combined Effects of Ocean Acidification, Mixing, and Respiration on pH and Carbonate Saturation in an Urbanized Estuary. Estua. Coast. Shelf. Sci. 88, 442–449. doi: 10.1016/j.ecss.2010.05.004
Friedlingstein P., Jones M. W., O'Sullivan M., Andrew R. M., Hauck J., Peters G. P., et al. (2019). Global Carbon Budget 2019. Earth Syst. Sci. Data 11, 1783–1838. doi: 10.5194/essd-11-1783-2019
Gran G. (1952). Determination of the Equivalence Point in Potentiometric Titrations. Part II. Analyst 77, 661–671. doi: 10.1039/an9527700661
Guo J.-Q., Yuan H.-M., Song J.-M., Li X.-G., Duan L.-Q. (2020). Hypoxia, Acidification and Nutrient Accumulation in the Yellow Sea Cold Water of the South Yellow Sea. Sci. Total. Environ. 745, 141050. doi: 10.1016/j.scitotenv.2020.141050
Hsueh Y. (1988). Recent Current Observations in the Eastern Yellow Sea. J. Geophys. Res.: Ocean. 93 (C6), 6875–6884. doi: 10.1029/JC093iC06p06875
Huang W.-J., Cai W.-J., Hu X.-P. (2021). Seasonal Mixing and Biological Controls of the Carbonate System in a River-Dominated Continental Shelf Subject to Eutrophication and Hypoxia in the Northern Gulf of Mexico. Front. Mar. Sci. 8, 621243. doi: 10.3389/fmars.2021.621243
Huang W.-J., Wang Y.-C., Cai W.-J. (2012). Assessment of Sample Storage Techniques for Total Alkalinity and Dissolved Inorganic Carbon in Seawater. Limnol. Oceanog.: Methods 10, 711–717. doi: 10.4319/lom.2012.10.711
Jiang Z.-P., Cai W.-J., Chen B.-S., Wang K., Han C.-H., Roberts B. J., et al. (2019). Physical and Biogeochemical Controls on pH Dynamics in the Northern Gulf of Mexico During Summer Hypoxia. J. Geophys. Res.: Ocean. 124 (8), 5979–5998. doi: 10.1029/2019JC015140
Jin H.-L., Feng Y.-Y., Li X.-Q., Zhai W.-D., Sun J. (2015). Spring and Autumn Living Coccolithophores in the Bohai Sea and Yellow Sea, China. Acta Oceanol. Sin. 34 (10), 132–146. doi: 10.1007/s13131-015-0712-x
Knap A. H., Michaels A., Close A. R., Ducklow H., Dickson A. G. (1996). “Protocols for the Joint Global Ocean Flux Study (JGOFS) Core Measurements,” in JGOFS, Reprint of the IOC Manuals and Guides No. 29 (Woods Hole, Massachusetts, USA: UNESCO), 19. Available at: http://ijgofs.whoi.edu/Publications/Report_Series/reports.html.
Kottmeier D. M., Rokitta S. D., Rost B. (2016). H+-Driven Increase in CO2 Uptake and Decrease in HCO3- Uptake Explain Coccolithophores’ Acclimation Responses to Ocean Acidification. Limnol. Oceanog. 61 (6), 2045–2057. doi: 10.1002/lno.10352
Leung J. Y., Russell B. D., Connell S. D. (2020). Linking Energy Budget to Physiological Adaptation: How a Calcifying Gastropod Adjusts or Succumbs to Ocean Acidification and Warming. Sci. Total. Environ. 715, 136939. doi: 10.1016/j.scitotenv.2020.136939
Lewis E., Wallace D. W. R. (1998). “Program Developed for the CO2 System Calculations,” in ORNL/CDIAC-105, Carbon Dioxide Information Analysis Center, Oak Ridge National Laboratory (Oak Ridge, Tennessee: US Department of Energy). Available at: https://doi.org/10.2172/639712.
Liu H.-J., Huang Y.-J., Zhai W.-D., Guo S.-J., Jin H.-L., Sun J. (2015). Phytoplankton Communities and its Controlling Factors in Summer and Autumn in the Southern Yellow Sea, China. Acta Oceanol. Sin. 34 (2), 114–123. doi: 10.1007/s13131-015-0620-0
Liu K.-K., Kang C.-K., Kobari T., Liu H., Rabouille C., Fennel K. (2014). Biogeochemistry and Ecosystems of Continental Margins in the Western North Pacific Ocean and Their Interactions and Responses to External Forcing – An Overview and Synthesis. Biogeosciences 11, 7061–7075. doi: 10.5194/bg-11-7061-2014
Li C.-L., Yang D.-Z., Zhai W.-D. (2022). Effects of Warming, Eutrophication and Climate Variability on Acidification of the Seasonally Stratified North Yellow Sea Over the Past 40 Years. Sci. Total. Environ. 815, 152935. doi: 10.1016/j.scitotenv.2022.152935
Li C.-L., Zhai W.-D. (2019). Decomposing Monthly Declines in Subsurface-Water pH and Aragonite Saturation State From Spring to Autumn in the North Yellow Sea. Continent. Shelf. Res. 185, 37–50. doi: 10.1016/j.csr.2018.11.003
Li C.-L., Zhai W.-D. (2021). Mechanism-Based Deduction of Subsurface Aragonite Saturation State in a Semi-Enclosed and Seasonally Stratified Coastal Sea. Mar. Chem. 232, 103958. doi: 10.1016/j.marchem.2021.103958
Millero F. J. (1979). The Thermodynamics of the Carbonate System in Seawater. Geochim. Et. Cosmochim. Acta 43, 1651–1661. doi: 10.1016/0016-7037(79)90184-4
Millero F. J., Graham T. B., Huang F., Bustos-Serrano H., Pierrot D. (2006). Dissociation Constants of Carbonic Acid in Seawater as a Function of Salinity and Temperature. Mar. Chem. 100, 80–94. doi: 10.1016/j.marchem.2005.12.001
Milliman J. D., Troy P. J., Balch W. M., Adams A. K., Li Y.-H., Mackenzie F. T. (1999). Biologically Mediated Dissolution of Calcium Carbonate Above the Chemical Lysocline? Deep. Sea. Res. Part I.: Oceanog. Res. Pap. 46, 1653–1669. doi: 10.1016/S0967-0637(99)00034-5
Mora C., Wei C.-L., Rollo A., Amaro T., Baco A. R., Billett D., et al. (2013). Biotic and Human Vulnerability to Projected Changes in Ocean Biogeochemistry Over the 21st Century. PloS Biol. 11 (10), e1001682. doi: 10.1371/journal.pbio.1001682
Mucci A. (1983). The Solubility of Calcite and Aragonite in Seawater at Various Salinities, Temperatures, and One Atmosphere Total Pressure. Am. J. Sci. 283, 780–799. doi: 10.2475/ajs.283.7.780
Nozaki Y., Tsubota H., Kasemsupaya V., Yashima M., Naoko I. (1991). Residence Times of Surface Water and Particle-Reactive 210Pb and 210Po in the East China and Yellow Seas. Geochim. Cosmochim. Acta 55, 1265–1272. doi: 10.1016/0016-7037(91)90305-O
Pelletier G. J., Lewis E., Wallace D. W. R. (2015). CO2SYS.XLS: A Calculator for the CO2 System in Seawater for Microsoft Excel/VBA. Version 24 (Olympia, Washington: Washington State Department of Ecology). Available at: http://www.ecy.wa.gov/programs/eap/models.html.
Qi D. (2013). “Dissolved Calcium in the Changjiang Estuary and China Seas (in Chinese),” in Master Thesis (Xiamen: Xiamen University), 73 pp. Available at: https://d.wanfangdata.com.cn/thesis/Y2401795.
Redfield A. C., Ketchum B. H., Richards F. A. (1963). “The Influence of Organisms on the Composition of Sea-Water,” in The Sea, Vol. 2: Ideas and Observations on Progress in the Study of the Seas. Ed. Hill M. N. (New York: Interscience Publishers), 26–77.
Sherman K., Hempel G. (2009). “The UNEP Large Marine Ecosystem Report: A Perspective on Changing Conditions in LMEs of the World's Regional Seas,” in UNEP Regional Seas Report and Studies, 182, Nairobi, Kenya: United Nations Environment Programme. 852 pp.
Song G.-D., Liu S.-M., Zhu Z.-Y., Zhai W.-D., Zhu C.-J., Zhang J. (2016). Sediment Oxygen Consumption and Benthic Organic Carbon Mineralization on the Continental Shelves of the East China Sea and the Yellow Sea. Deep. Sea. Res. Part II.: Top. Stud. Oceanog. 124, 53–63. doi: 10.1016/j.dsr2.2015.04.012
Tan S.-C., Wang H. (2014). The Transport and Deposition of Dust and its Impact on Phytoplankton Growth in the Yellow Sea. Atmos. Environ. 99, 491–499. doi: 10.1016/j.atmosenv.2014.10.016
Waldbusser G. G., Hales B., Langdon C. J., Haley B. A., Schrader P., Brunner E. L., et al. (2015). Saturation-State Sensitivity of Marine Bivalve Larvae to Ocean Acidification. Nat. Climate Change 5, 273–280. doi: 10.1038/nclimate2479
Wang Z.-H. A., Lawson G. L., Pilskaln C. H., Maas A. E. (2017). Seasonal Controls of Aragonite Saturation States in the Gulf of Maine. J. Geophys. Res.: Ocean. 122 (1), 372–389. doi: 10.1002/2016JC012373
Wang Z.-H. A., Wanninkhof R., Cai W.-J., Byrne R. H., Hu X.-P., Peng T.-H., et al. (2013). The Marine Inorganic Carbon System Along the Gulf of Mexico and Atlantic Coasts of the United States: Insights From a Transregional Coastal Carbon Study. Limnol. Oceanog. 58 (1), 325–342. doi: 10.4319/lo.2013.58.1.0325
Wang S.-Y., Zhai W.-D. (2021). Regional Differences in Seasonal Variation of Air–Sea CO2 Exchange in the Yellow Sea. Continent. Shelf. Res. 218, 104393. doi: 10.1016/j.csr.2021.104393
Wollast R., Chou L. (1998). Distribution and Fluxes of Calcium Carbonate Along the Continental Margin in the Gulf of Biscay. Aquat. Geochem. 4, 369–393. doi: 10.1023/A:1009640432692
Wong G. T. F. (2012). Removal of Nitrite Interference in the Winkler Determination of Dissolved Oxygen in Seawater. Mar. Chem. 130, 28–32. doi: 10.1016/j.marchem.2011.11.003
Xiong T.-Q., Liu P.-F., Zhai W.-D., Bai Y., Liu D., Qi D., et al. (2019). Export Flux, Biogeochemical Effects, and the Fate of a Terrestrial Carbonate System: From Changjiang (Yangtze River) Estuary to the East China Sea. Earth Space. Sci. 6, 2115–2141. doi: 10.1029/2019EA000679
Xiong T.-Q., Wei Q.-S., Zhai W.-D., Li C.-L., Wang S.-Y., Zhang Y.-X., et al. (2020). Comparing Subsurface Seasonal Deoxygenation and Acidification in the Yellow Sea and Northern East China Sea Along the North-to-South Latitude Gradient. Front. Mar. Sci. 7, 686. doi: 10.3389/fmars.2020.00686
Yu F., Zhang Z.-X., Diao X.-Y., Guo J.-S., Tang Y.-X. (2006). Analysis of Evolution of the Huanghai Sea Cold Water Mass and its Relationship With Adjacent Water Masses (in Chinese). Acta Oceanol. Sin. 28 (5), 26–34. doi: 10.3321/j.issn:0253-4193.2006.05.003
Zeebe R. E., Wolf-Gladrow D. (2001). “Chapter 1 Equilibrium,” in CO2 in Seawater: Equilibrium, Kinetics, Isotopes, vol. 65 . Eds. Zeebe R. E., Wolf-Gladrow D. (Amsterdam, the Netherlands: Elsevier Oceanography Series), 1–84. doi: 10.1016/S0422-9894(01)80002-7
Zhai W.-D. (2018). Exploring Seasonal Acidification in the Yellow Sea. Sci. China Earth Sci. 61, 647–658. doi: 10.1007/s11430-017-9151-4
Zhai W.-D., Zhao H.-D. (2016). Quantifying Air-Sea Re-Equilibration-Implied Ocean Surface CO₂ Accumulation Against Recent Atmospheric CO₂ Rise. J. Oceanog. 72, 651–659. doi: 10.1007/s10872-016-0350-8
Zhai W.-D., Zhao H.-D., Zheng N., Xu Y. (2012). Coastal Acidification in Summer Bottom Oxygen-Depleted Waters in Northwestern-Northern Bohai Sea From June to August in 2011. Chin. Sci. Bull. 57 (9), 1062–1068. doi: 10.1007/s11434-011-4949-2
Zhai W.-D., Zheng N., Huo C., Xu Y., Zhao H.-D., Li Y.-W., et al. (2014). Subsurface pH and Carbonate Saturation State of Aragonite on the Chinese Side of the North Yellow Sea: Seasonal Variations and Controls. Biogeosciences 11, 1103–1123. doi: 10.5194/bg-11-1103-2014
Zhai W.-D., Zheng L.-W., Li C.-L., Xiong T.-Q., Wang S.-Y. (2020). “Changing Nutrients, Dissolved Oxygen and Carbonate System in the Bohai and Yellow Seas, China,” in Changing Asia-Pacific Marginal Seas. Atmosphere, Earth, Ocean & Space. Eds. Chen C.-T. A., Guo X.-Y. (Singapore: Springer Singapore), 121–137. doi 10.1007/978-981-15-4886-4_8.
Zhang Q.-L., Weng X.-C., Yang Y.-L. (1996). Analysis of Water Masses in the South Yellow Sea in Spring (in Chinese). Oceanol. Limnol. Sin. 27 (4), 421–428. Available at: http://qdhys.ijournal.cn/hyyhz/ch/reader/create_pdf.aspx?file_no=199604013
Keywords: coastal acidification, carbonate dynamics, the Yellow Sea, aragonite saturation state, acidification rate
Citation: Yu S-q, Xiong T-q and Zhai W-d (2022) Quasi-Synchronous Accumulation of Apparent Oxygen Utilization and Inorganic Carbon in the South Yellow Sea Cold Water Mass From Spring to Autumn: The Acidification Effect and Roles of Community Metabolic Processes, Water Mixing, and Spring Thermal State. Front. Mar. Sci. 9:858871. doi: 10.3389/fmars.2022.858871
Received: 20 January 2022; Accepted: 06 April 2022;
Published: 03 May 2022.
Edited by:
Ryan Rykaczewski, Pacific Islands Fisheries Science Center (NOAA), United StatesReviewed by:
Wei-Jen Huang, National Sun Yat-sen University, TaiwanJianzhong Su, Xiamen University, China
Copyright © 2022 Yu, Xiong and Zhai. This is an open-access article distributed under the terms of the Creative Commons Attribution License (CC BY). The use, distribution or reproduction in other forums is permitted, provided the original author(s) and the copyright owner(s) are credited and that the original publication in this journal is cited, in accordance with accepted academic practice. No use, distribution or reproduction is permitted which does not comply with these terms.
*Correspondence: Wei-dong Zhai, d2R6aGFpQDEyNi5jb20=
†These authors have contributed equally to this work and share first authorship