 Montserrat Aldunate
 Peter von Dassow
 Cristian A. Vargas
 Osvaldo Ulloa
- 1Department of Oceanography, University of Concepción, Concepción, Chile
- 2Graduate Program in Oceanography, University of Concepción, Concepción, Chile
- 3Millennium Institute of Oceanography (IMO), University of Concepcion, Concepción, Chile
- 4Department of Ecology, Pontificia Universidad Católica de Chile, Santiago, Chile
- 5Department of Integrative Marine Ecology, Stazione Zoologica Anton Dohrn, Naples, Italy
- 6Coastal Ecosystems & Global Environmental Change Lab (ECCALab), Department of Aquatic Systems, Faculty of Environmental Sciences, Universidad de Concepción, Concepción, Chile
Anoxic marine zones (AMZs) constitute pelagic systems distinguished from the oxygen minimum zones (OMZs) by the complete absence of detectable oxygen and the accumulation of nitrite in mid-waters. At the top of the oxygen-depleted layer and below the oxycline, nutrients are abundant; light intensity is very much reduced (<1% of incident light) and a secondary chlorophyll maximum (SCM) is developed. The shoaling of the oxygen-depleted layer, product of the AMZ expansion, could enhance this SCM, which has little-known biogeochemical effects. Here, we show that the SCM is contributing a measurable signal in the particulate organic carbon (POC), enough to alter the δ13CPOC in the top of the oxygen-depleted layer. This data showed significant differences among stations with and without the development of a SCM, being 3.0‰ heavier when a SCM is developed, and indicating photosynthetic activity and/or remineralization in the top of the AMZ. More depleted δ13CPOC values were also found when no SCM was present indicating stronger chemoautotrophic activity, potentially driven by anammox and sulfur-oxidizing bacteria activity. Assimilation rate data show that when sufficient light and Prochlorococcus are present, photosynthesis exceeds chemoautotrophic carbon fixation, and can exceed heterotrophic assimilation of glucose or acetate. However, in the majority of the stations, assimilation rates of both glucose and acetate exceeded carbon fixation rates under light stimulation, suggesting that often the SCM is still a net heterotrophic system.
Introduction
Anoxic marine zones (AMZs) are places in the open ocean with contrasting vertical oxygen concentrations. At the surface, there is a photic and oxic layer followed by an abrupt oxycline. At intermediate depths, there is a complete absence of detectable dissolved oxygen, with accumulation of nitrite (Revsbech et al., 2009; Thamdrup et al., 2012; Ulloa et al., 2012), and the occasional presence of H2S close to the coast (Schunck et al., 2013). Under this anoxic layer, oxygen concentrations increase again. These AMZs are prominent in the Eastern Tropical North and South Pacific (ETNP and ETSP respectively) and in the Arabian Sea (Ulloa et al., 2012). At the top of the anoxic layer, just below a chlorophyll minimum in the oxycline, nutrients are abundant and sunlight levels are very low (<1% of incident light) and in certain cases, a secondary chlorophyll maximum (SCM) develops. This SCM is mainly formed by the picocyanobacteria Prochlorococcus, specifically by the ecotypes: LLIV, LLV and LLVI (Lavin et al., 2010), with the last two ecotypes now being renamed as AMZ I and AMZ II respectively, and a recently discovered novel orange-fluorescent ecotype, the ecotype AMZ III, which was traditionally associated with Synechococcus-like cells (Ulloa et al., 2021). None of these AMZ ecotypes have yet been successfully cultivated, and photosynthetic picoeukaryotes have not been detected within the SCM (Lavin et al., 2010; Aldunate et al., 2020).
Garcia-Robledo et al. (2017) showed that AMZ Prochlorococcus has the ability for carbon fixation through photosynthesis and that this carbon might be recycled through the microbial loop or exported to deeper areas within the AMZs. Furthermore, they also showed that the SCM is producing oxygen, which is not detected because respiration is greater than production. This cryptic oxygen cycle might impact other members of the microbial community, supporting important aerobic metabolisms, such as aerobic respiration and nitrite oxidation (Garcia-Robledo et al., 2017). However, due to the position of the SCM within the water column, it is likely to be transported frequently by internal waves or turbulence to depths where sunlight is scarce for supporting photosynthesis (Cepeda-Morales et al., 2009), decreasing the population or simply dissipating the SCM, and hence stopping the carbon fixation and oxygen production in the top of the anoxic layer. Therefore, it is necessary to understand how the presence or absence of a SCM can influence the net community metabolisms, to explore whether the community is heterotrophic, chemoatotrophic, or net phototrophic.
On the other hand, the expansion of the AMZs (Stramma et al., 2008), and the subsequent shoaling of the upper boundary of the anoxic layer to illuminated waters (Gilly et al., 2013) potentially enhance the SCM. In this way, how the presence/absence of the SCM impacts the carbon metabolism of the AMZ microbial community is still poorly understood.
In this work, we focus on testing the hypothesis that the presence of a SCM has a significant biogeochemical impact in the AMZs. This is expressed in the carbon fractionation and the relative importance of phototrophic vs chemoautotrophic carbon fixation and the light impact in the community organic carbon assimilation. To test this hypothesis, we compared measurements of δ13C for particulate organic carbon (POC) from the primary and secondary chlorophyll maximum (PCM and SCM respectively) in two AMZs in the Eastern Tropical North and South Pacific oceans during five oceanographic cruises with measurements of δ13C of POC from the top of the AMZ layer when no SCM was present. To explore the relative importance of carbon fixation through phototrophy vs chemoautotrophy and the potential impact of the light on the community organic carbon assimilation we performed organic and inorganic carbon uptake rates experiments.
Materials and Methods
Sampling Site and Field Collection
Samples were obtained from a total of 39 stations in the AMZs of the Eastern Tropical North (ETNP) and South Pacific (ETSP), during five cruises: NH1410 (May 2014) and RB1603 (April 2016) for the ETNP, and NBP1305 (June-July 2013), AT2626 (January 2015) and LowpHOx I (November 2015) for the ETSP (see station map in Figure 1; Table S1). Samples were collected based on fluorescence and oxygen profiles of each station, taking water from the PCM (fluorescence peak at the surface), the SCM (fluorescence peak at the top of the oxygen-depleted layer) and from the top of the oxygen-depleted layer when no SCM was detected. Samples were collected using a pump profiler system (PPS) that pumps water directly from the desired depth while profiling the water column with an attached CTD system (Seabird SBE-19 plus for ETNP and Seabird SBE-25 for ETSP) providing continuous records of salinity, temperature, depth, dissolved oxygen (Seabird SBE 43 oxygen sensor; all cruises) and in vivo fluorescence (WETStar for ETNP cruise and ECO-AFL/FL for ETSP cruises, both WET Labs fluorometers). Discrete nutrient samples were analyzed using standard colorimetric methods according to the manufacturers specifications and the fluorometric method of Holmes et al. (1999). In April 2016 (ETNP; cruise RB1603) seawater was pumped into the laboratory and connected to an auto analyzer for high-resolution profiles of , , and , binned to 1 measurement per meter.
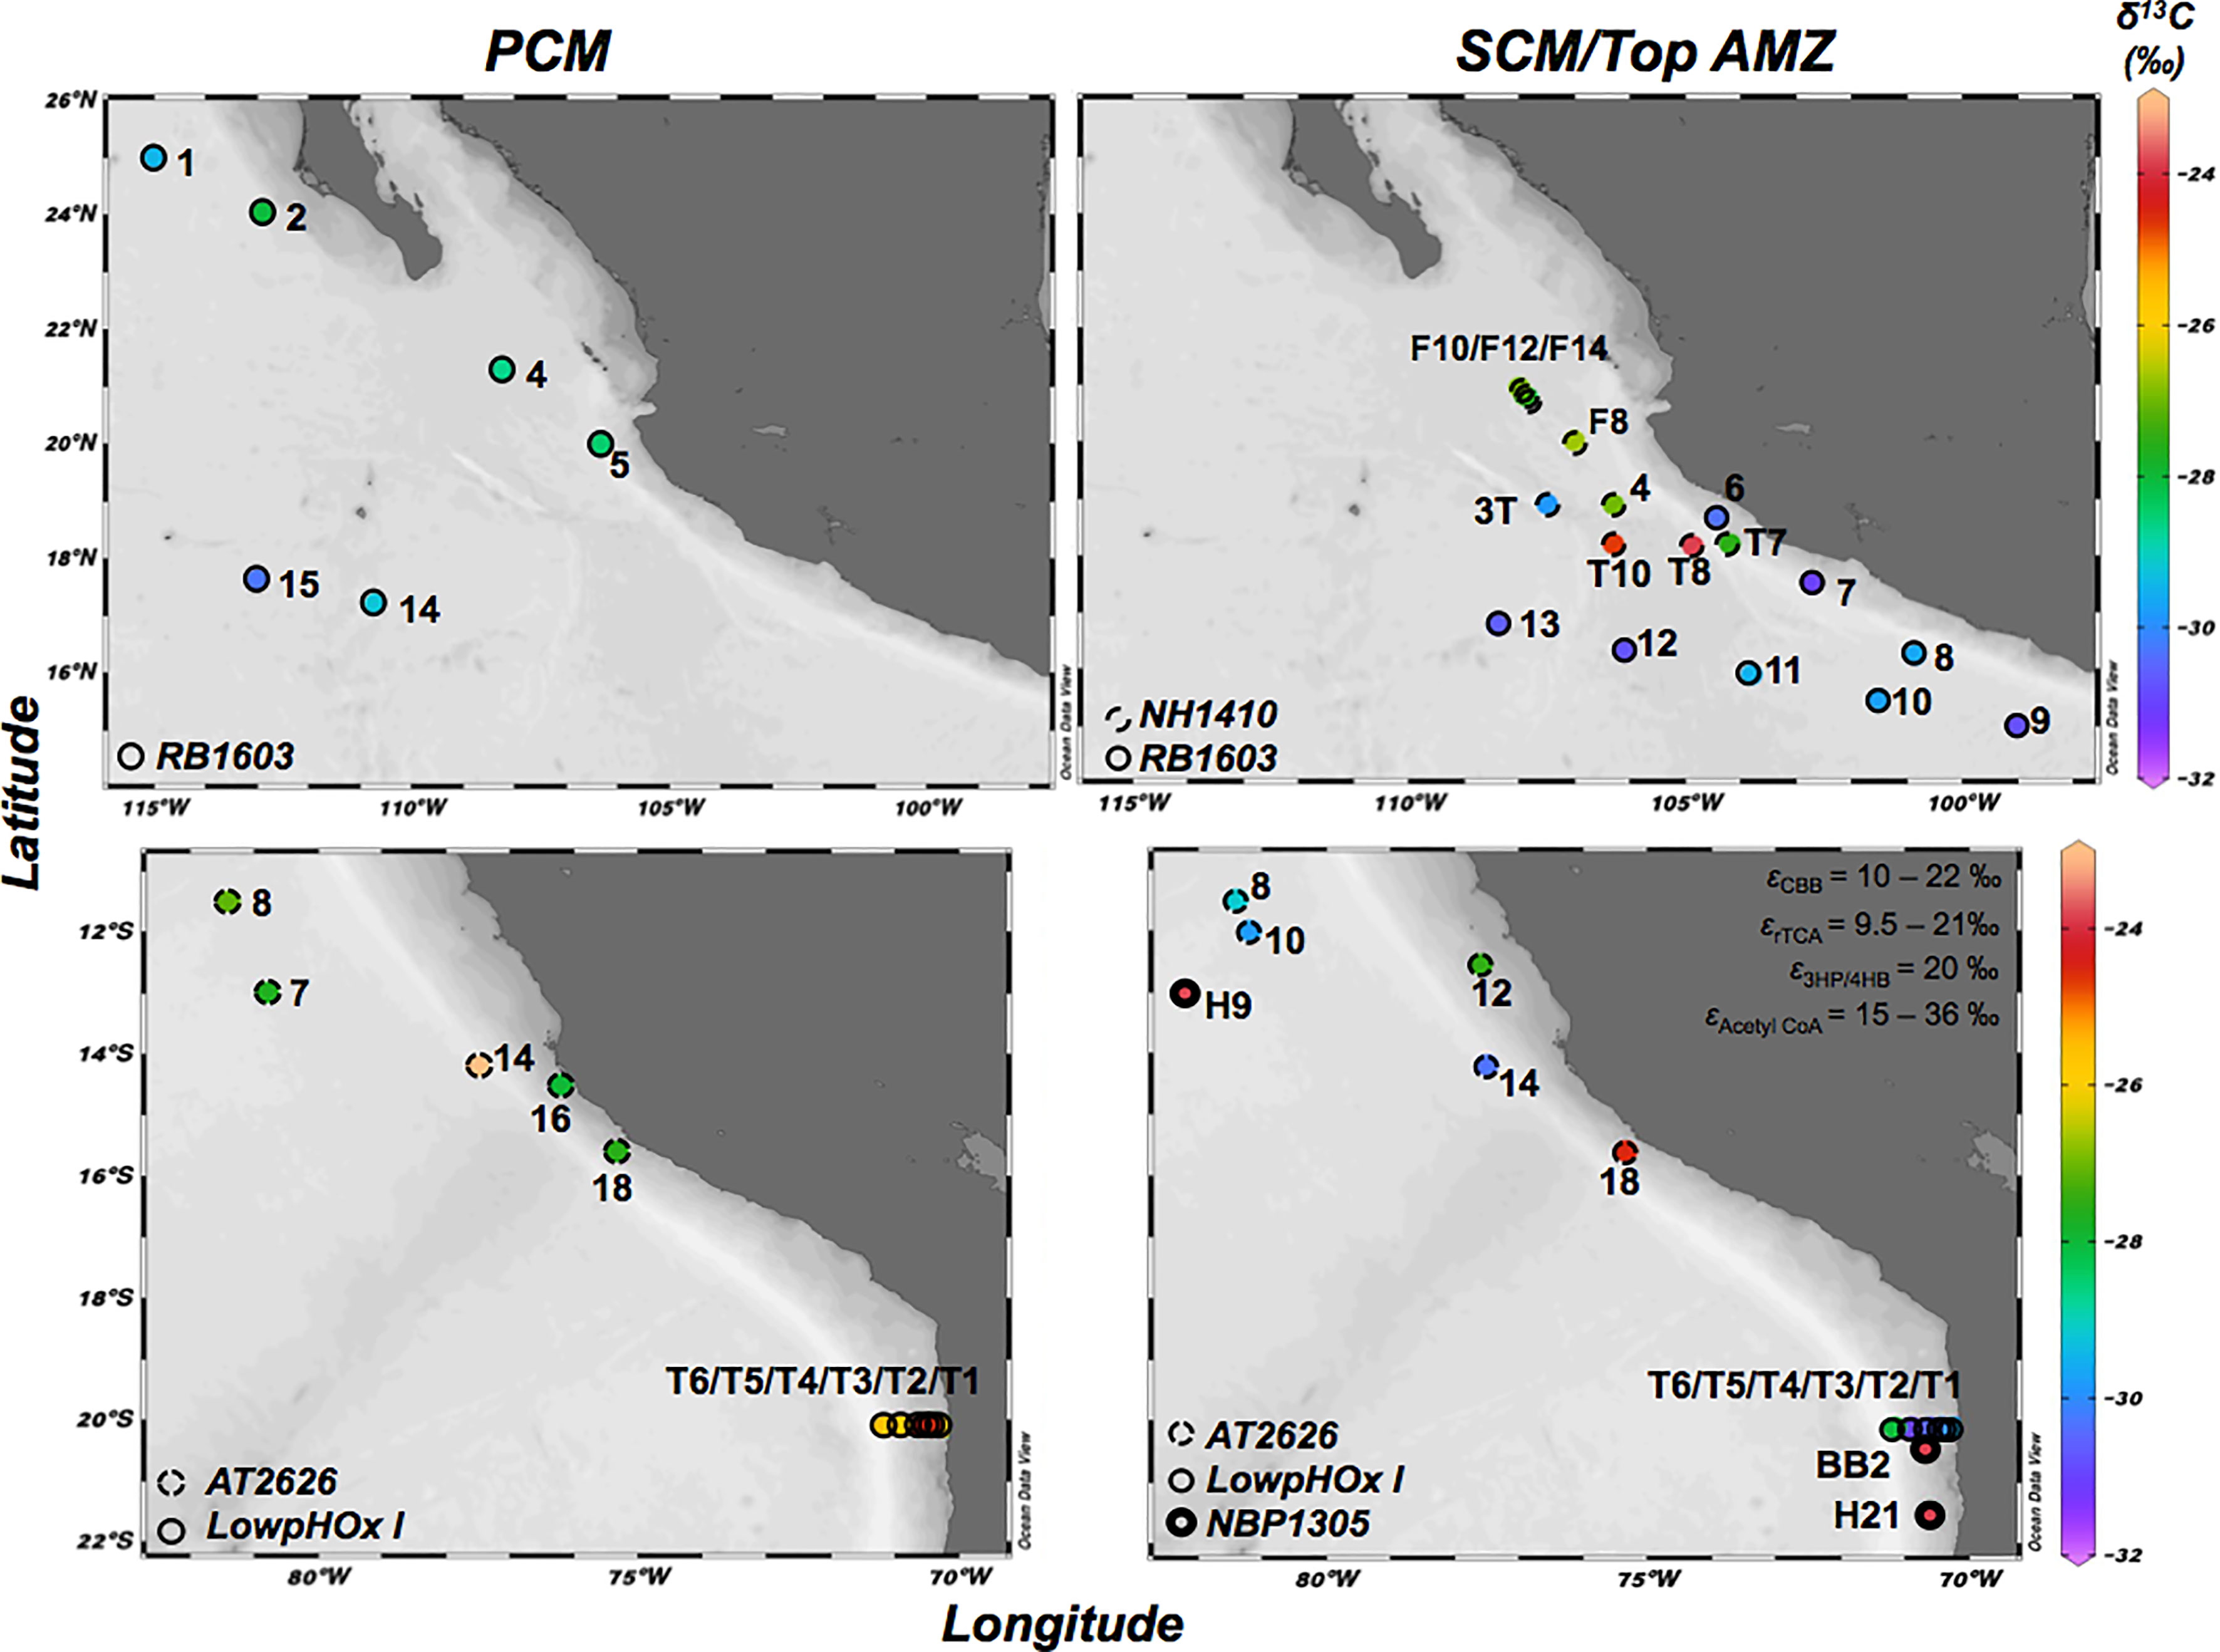
Figure 1 Map with the sampled stations in the ETNP (cruises: NH14010 and RB1603) and the ETSP (cruises: NBP1305, AT2626 and LowpHOx I). Colors indicate δ13C (‰) of POC (0.3 – 3.0 μm size fraction) in the primary chlorophyll maximum (PCM) (left panels), and in the secondary chlorophyll maximum (SCM) and top AMZ when no SCM was present (right panels). ϵ indicates the isotopic discrimination of the enzymes involved in the Calvin Benson Bassham (CBB) cycle, reductive Tricarboxylic Acid (rTCA) cycle, 3-hydroxypropionate/4-hydroxybutyrate (3HP/4HB) cycles and Acetyl CoA cycle.
Natural Abundance of 13C/12C and Incubation Experiments
Both for the PCM and SCM, natural abundance of 13C/12C in suspended POC (0.3 – 3 μm size fraction) was determined by filtering 2-3 L of seawater though a 3-μm pore polycarbonate membrane filter and collecting the microbial biomass on a 0.3 μm nominal pore size glass fiber filter (Sterlitech GF-75; pre-combusted at 500°C for 6 h). The GF-75 filters were dried onboard or frozen in liquid nitrogen. Once in the laboratory, GF-75 filters were fumed with HCl vapors for 8 h to drive off inorganic carbon and then dried and encapsulated in tin capsules. Samples were analyzed at the University of California Davis Stable Isotope Facility by using an Elementar Vario EL Cuve or Micro Cube elemental analyzer (Elementar Analysensysteme GmbH, Hanau, Germany) interfaced to a PDZ Europa 20–20 isotope ratio mass spectrometer (Sercon Ltd., Cheshire, UK). The standard used was VPDB (Vienna Pee Dee Belemnite) and the long-term precision reported is ±0.2‰ for δ 13CPOC.
Incubation experiments were performed for determination of uptake rates of organic and inorganic carbon sources in the SCM. Water from the SCM was collected in a 20-L glass bottle and purged for 20 min with a mixture of 800 ppm CO2 balanced He in order to avoid any oxygen contamination during the sampling and maintain the in situ pCO2/pH. This water was siphoned to 6 – 12 custom-made incubation bottles (1.1 L) and each bottle placed in a water bath inside a temperature-controlled cold van (see diagram in Aldunate et al., 2020). The incubation conditions were set to simulate in situ temperature (ranging between 14 and 16°C depending of the station) and light (blue light with intensities of 10 – 30 μmol photons m−2 s−1). Three different 13C-labeled compounds (Cambridge Isotope Laboratories) were used to assess the potential carbon uptake rates in the SCM. Final concentrations represented enrichments of 14.9-20.3% for 13C-bicarbonate , 17.7% for 13C-glucose and 16.5% for 13C-acetate. After 12 h of incubation, picoplankton from each bottle was concentrated by filtering though a 3-μm pores polycarbonate membrane filter and collecting the microbial biomass on a 0.3 μm nominal pore size glass fiber filter (Sterlitech GF-75; pre-combusted at 500°C for 6 h). Then, filters were fumed with HCl vapors, dried, encapsulated and sent for analysis as described above for 13C/12C natural abundance measurements.
Carbon Assimilation Rates Calculations
Assimilation rates (ρ13C; mg C L-1 h-1) were calculated for each carbon source using the equation (1) (Slawyk et al., 1977):
Where RPOC represents the 13C enrichment in the filter after incubation (atom %) and Rn represent the natural abundance of 13C (atom %). POC represents the amount of particulate organic carbon recovered in the filter after incubation (μg), Vf represents the incubation volume and T indicates the incubation time (hours). The excess enrichment of the tracer after its addition at the beginning of the incubation is indicated by RC (in %) and is calculated using the equation (2):
Where V13C represent the volume of the 13C tracer solution added to the incubation bottle (0.5 mL). 13C represents the concentration in 13C of the added tracer. Ci represents the concentration of the carbon source in the sample before tracer addition; Ca indicates the natural abundance of 13C (in absolute value) and Vb is the volume of sample bottles (1.1 L).
When the tracer additions resulted in initial enrichments exceeding 50%, rates should be considered as potential uptake.
Statistical Analyses
The Kruskal-Wallis test was used to test statistical significance of differences among δ13CPOC from the ETNP SCM, the ETSP SCM and ETSP where there are no SCM, with significance set at 0.05. Correlations between δ13CPOC from the ETNP and ETSP and other environmental variables were calculated using Pearson’s correlation analysis, after variables were log-transformed as Log10 (X+1). Pearson’s correlation coefficients were tested for significance at α = 0.05 using XLStat software (AddinSoft SARL).
Results
Environmental Context
The water column structure of the sampled stations exhibited similar patterns between stations, but with some differences (see examples in Figure 2). The oxygen profiles showed a superficial oxygenated layer (60-80 m deep), followed by an abrupt oxycline where oxygen dropped to levels below detection by the dissolved oxygen sensors of the CTD at greater depths in the ETNP (90 and 160 m depth) than in the ETSP (70 and 127 m depth). Previous results using the more sensitive dissolved oxygen sensor (STOX sensor; Revsbech et al., 2009; Thamdrup et al., 2012; Garcia-Robledo et al., 2017) as well as the accumulation of nitrite at these depths suggest these layers might be considered anoxic. SCMs were present at the top of the oxygen-depleted layer at average depths of 100 m depth and varied in intensity among stations (see Figure 2). Strong SCMs were found both in the ETNP and ETSP (see example in Figures 2A–C), and in extreme cases the maximum fluorescence of the SCM could equal or even exceed the surface PCM (not shown). In other stations, we observed a clear SCM in both fluorescence and flow cytometry profiles, but this maximum was smaller than the surface PCM (example in Figures 2D–F). Finally, there were stations in the ETSP where no SCM could be detected (example in Figures 2G–I; all stations in cruise LowpHOx-I).”
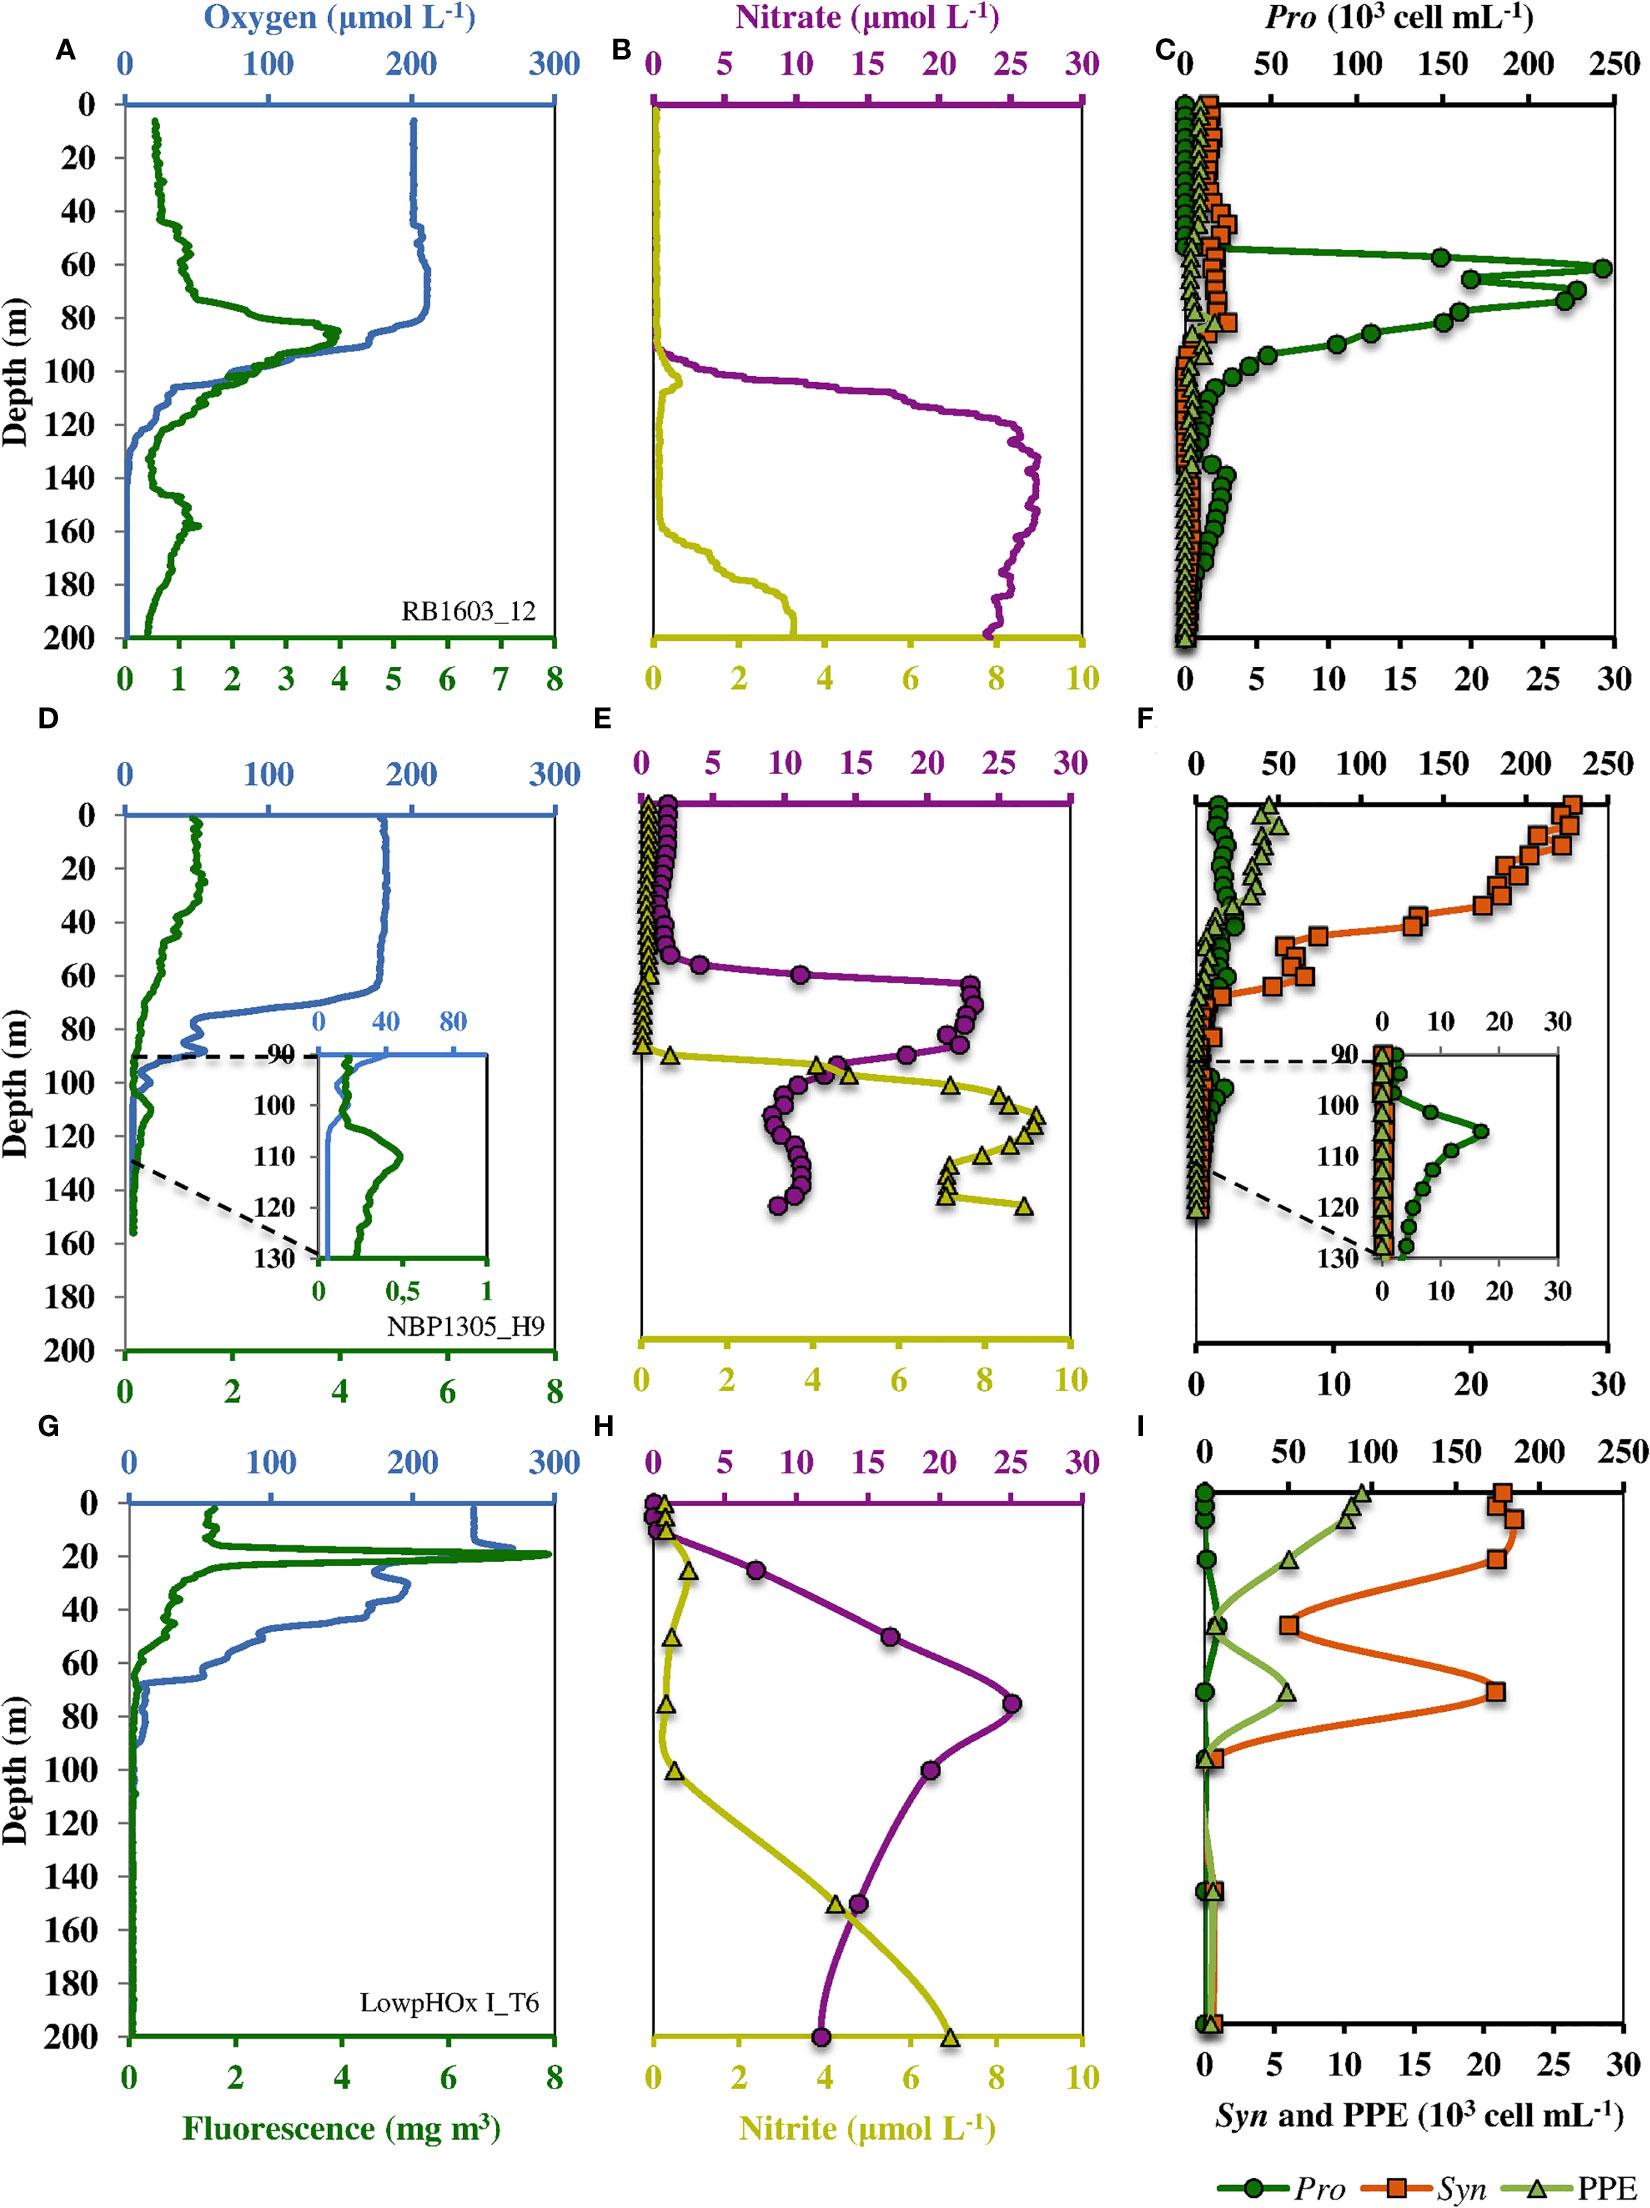
Figure 2 Example vertical structures of water columns and picoplankton with strong, weak, and no SCM at the top of the oxygen-deficient layer in the AMZs. Panels (A–C) represents a strong SCM in the ETNP (cruise RB1603, station 12); panels (D–F) represent a weak SCM in the ETSP (cruise NBP1305, station H9); and panels (G–I) represent an example when no SCM was present in the ETSP (cruise LowpHOx I, station T6). Left panels show oxygen and fluorescence profiles (CTD + fluorometer). Middle panels show nitrate and nitrite profiles measured in continuous flow coupling the PPS and an autoanalyzer (B) and a discrete sampling (E, H). Right panels show cell count (×103 cell mL−1) profiles of picophytoplankton components obtained by a high-resolution sampling analyzed by flow cytometry. Dark green circles indicate Prochlorococcus, light green triangles indicate PPE, and orange squares represent orange-fluorescent cells.
At the depth of the PCM in the surface oxic layer, both nitrate ( = 4.5 μM; SD = 4.5 μM) and nitrite ( = 0.4 μM; SD = 0.5 μM) concentrations were low, with nitrate accumulating with depth through the oxycline (Figure 2; Table S2). Once within the oxygen-depleted layer, nitrate showed a slight decrease ( = 22.0 μM; SD = 5.4 μM) coupled to nitrite accumulation ( = 1.4 μM; SD = 2.3 μM; Figures 2B, E, H). Flow cytometry analyses showed marked changes of picophytoplankton with depth (Figures 2C, F, I). In the surface oxic layer, the PCM was composed of high abundances of Prochlorococcus ( = 36.6 x10³ cell mL-1; SD = 60.4 x10³ cell mL-1), Synechococcus ( = 25.1 x10³ cell mL-1; SD = 32.8 x10³ cell mL-1) and PPE ( = 11.8 x10³ cell mL-1; SD = 14.7 x10³ cell mL-1). The abundances of these three groups decreased with depth throughout the oxycline (Figure 2; Table S2). However, in the stations where a SCM was detected, in the oxygen-depleted layer, Prochlorococcus dominated numerically ( = 41.0 x10³ cell mL-1; SD = 25.9 x10³ cell mL-1), representing on average 93.9% of the picophytoplankton community of the SCM. A less abundant group of orange-fluorescent cells (probably AMZ III Prochlorococcus) was also present ( = 2.2 x10³ cell mL-1; SD = 2.6 x10³ cell mL-1), representing on average 5.1%, of the picophytoplankton community of the SCM, while PPE were very low or undetectable (Table 1).
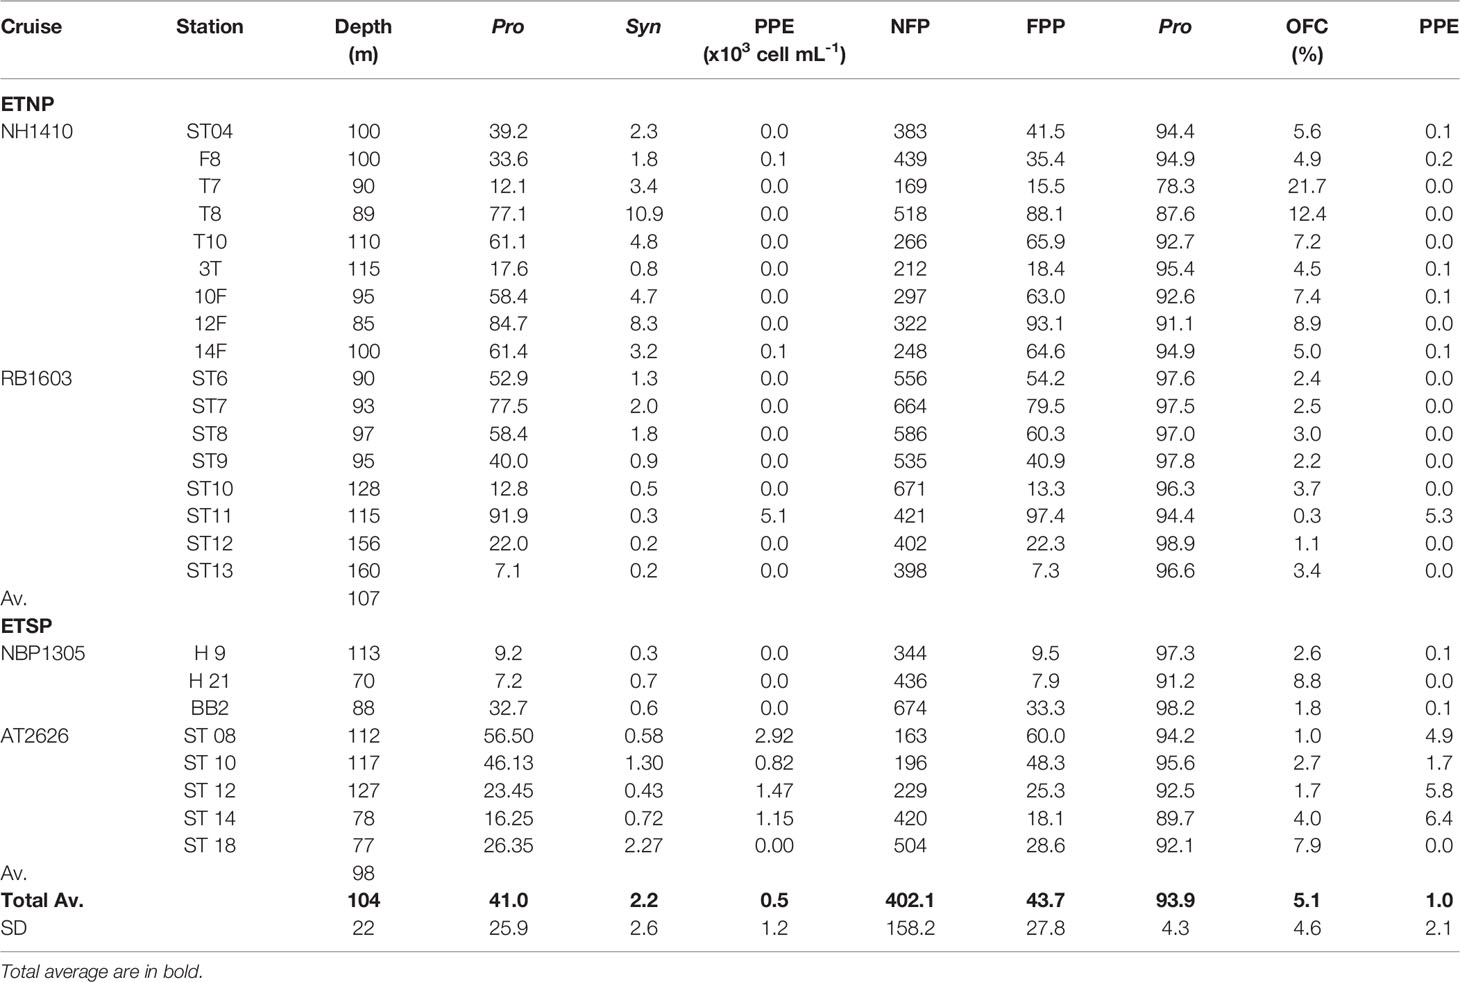
Table 1 Flow cytometric analysis of the microbial community at the peak depth of the secondary chlorophyll maximum (SCM) for the Eastern Tropical North Pacific (ETNP) and Eastern Tropical South Pacific (ETSP), including: cruise name; station; peak depth of the SCM in meters; Prochlorococcus (Pro), orange-fluorescent cells (OFC), photosynthetic picoeukaryotes (PPE), non-fluorescent picoplankton (NFP), fluorescent picoplankton (FPP = Pro + Syn + PPE) abundances (x103 cells mL-1); Pro, Syn and PPE relative abundances (in %) to the fluorescent picoplankton.
δ13C of POC at the depth of the PCM and SCM
The natural abundance of δ13CPOC in both the PCM and SCM in the ETNP and ETSP showed a high variability (Figures 1, 3; Table 2). δ13CPOC values in the ETNP PCM were in general less variable and more depleted in 13C compared with the ETSP PCM, with averages of -28.7‰ (SD = 1.1‰; n = 8) and -26.1s (SD = 2.5‰ n = 6) respectively (Figure 3 top panel). On the other hand, δ13CPOC values in the SCM both in the ETNP and ETSP presented similar distributions, ranging from -31.1‰ to -23.9‰ for the ETNP and from -30.4‰ to -23.8‰ for the ETSP. However, the majority of the data is slightly depleted in the ETNP SCM with 50% of the data (n = 17) distributed between -29.9‰ and -27.0‰, compared with the ETSP SCM with 50% or the data (n = 8) between -29.3‰ and -23.9‰. In the case of the samples taken during LowpHOx-I cruise where no SCM was detected (ETSP top AMZ; Figure 3), samples were taken from the top of the oxygen-depleted layer. δ13CPOC values were extremely depleted, ranging from -31.0‰ to -28.1‰ (Figure 3 bottom panel; Table 2).
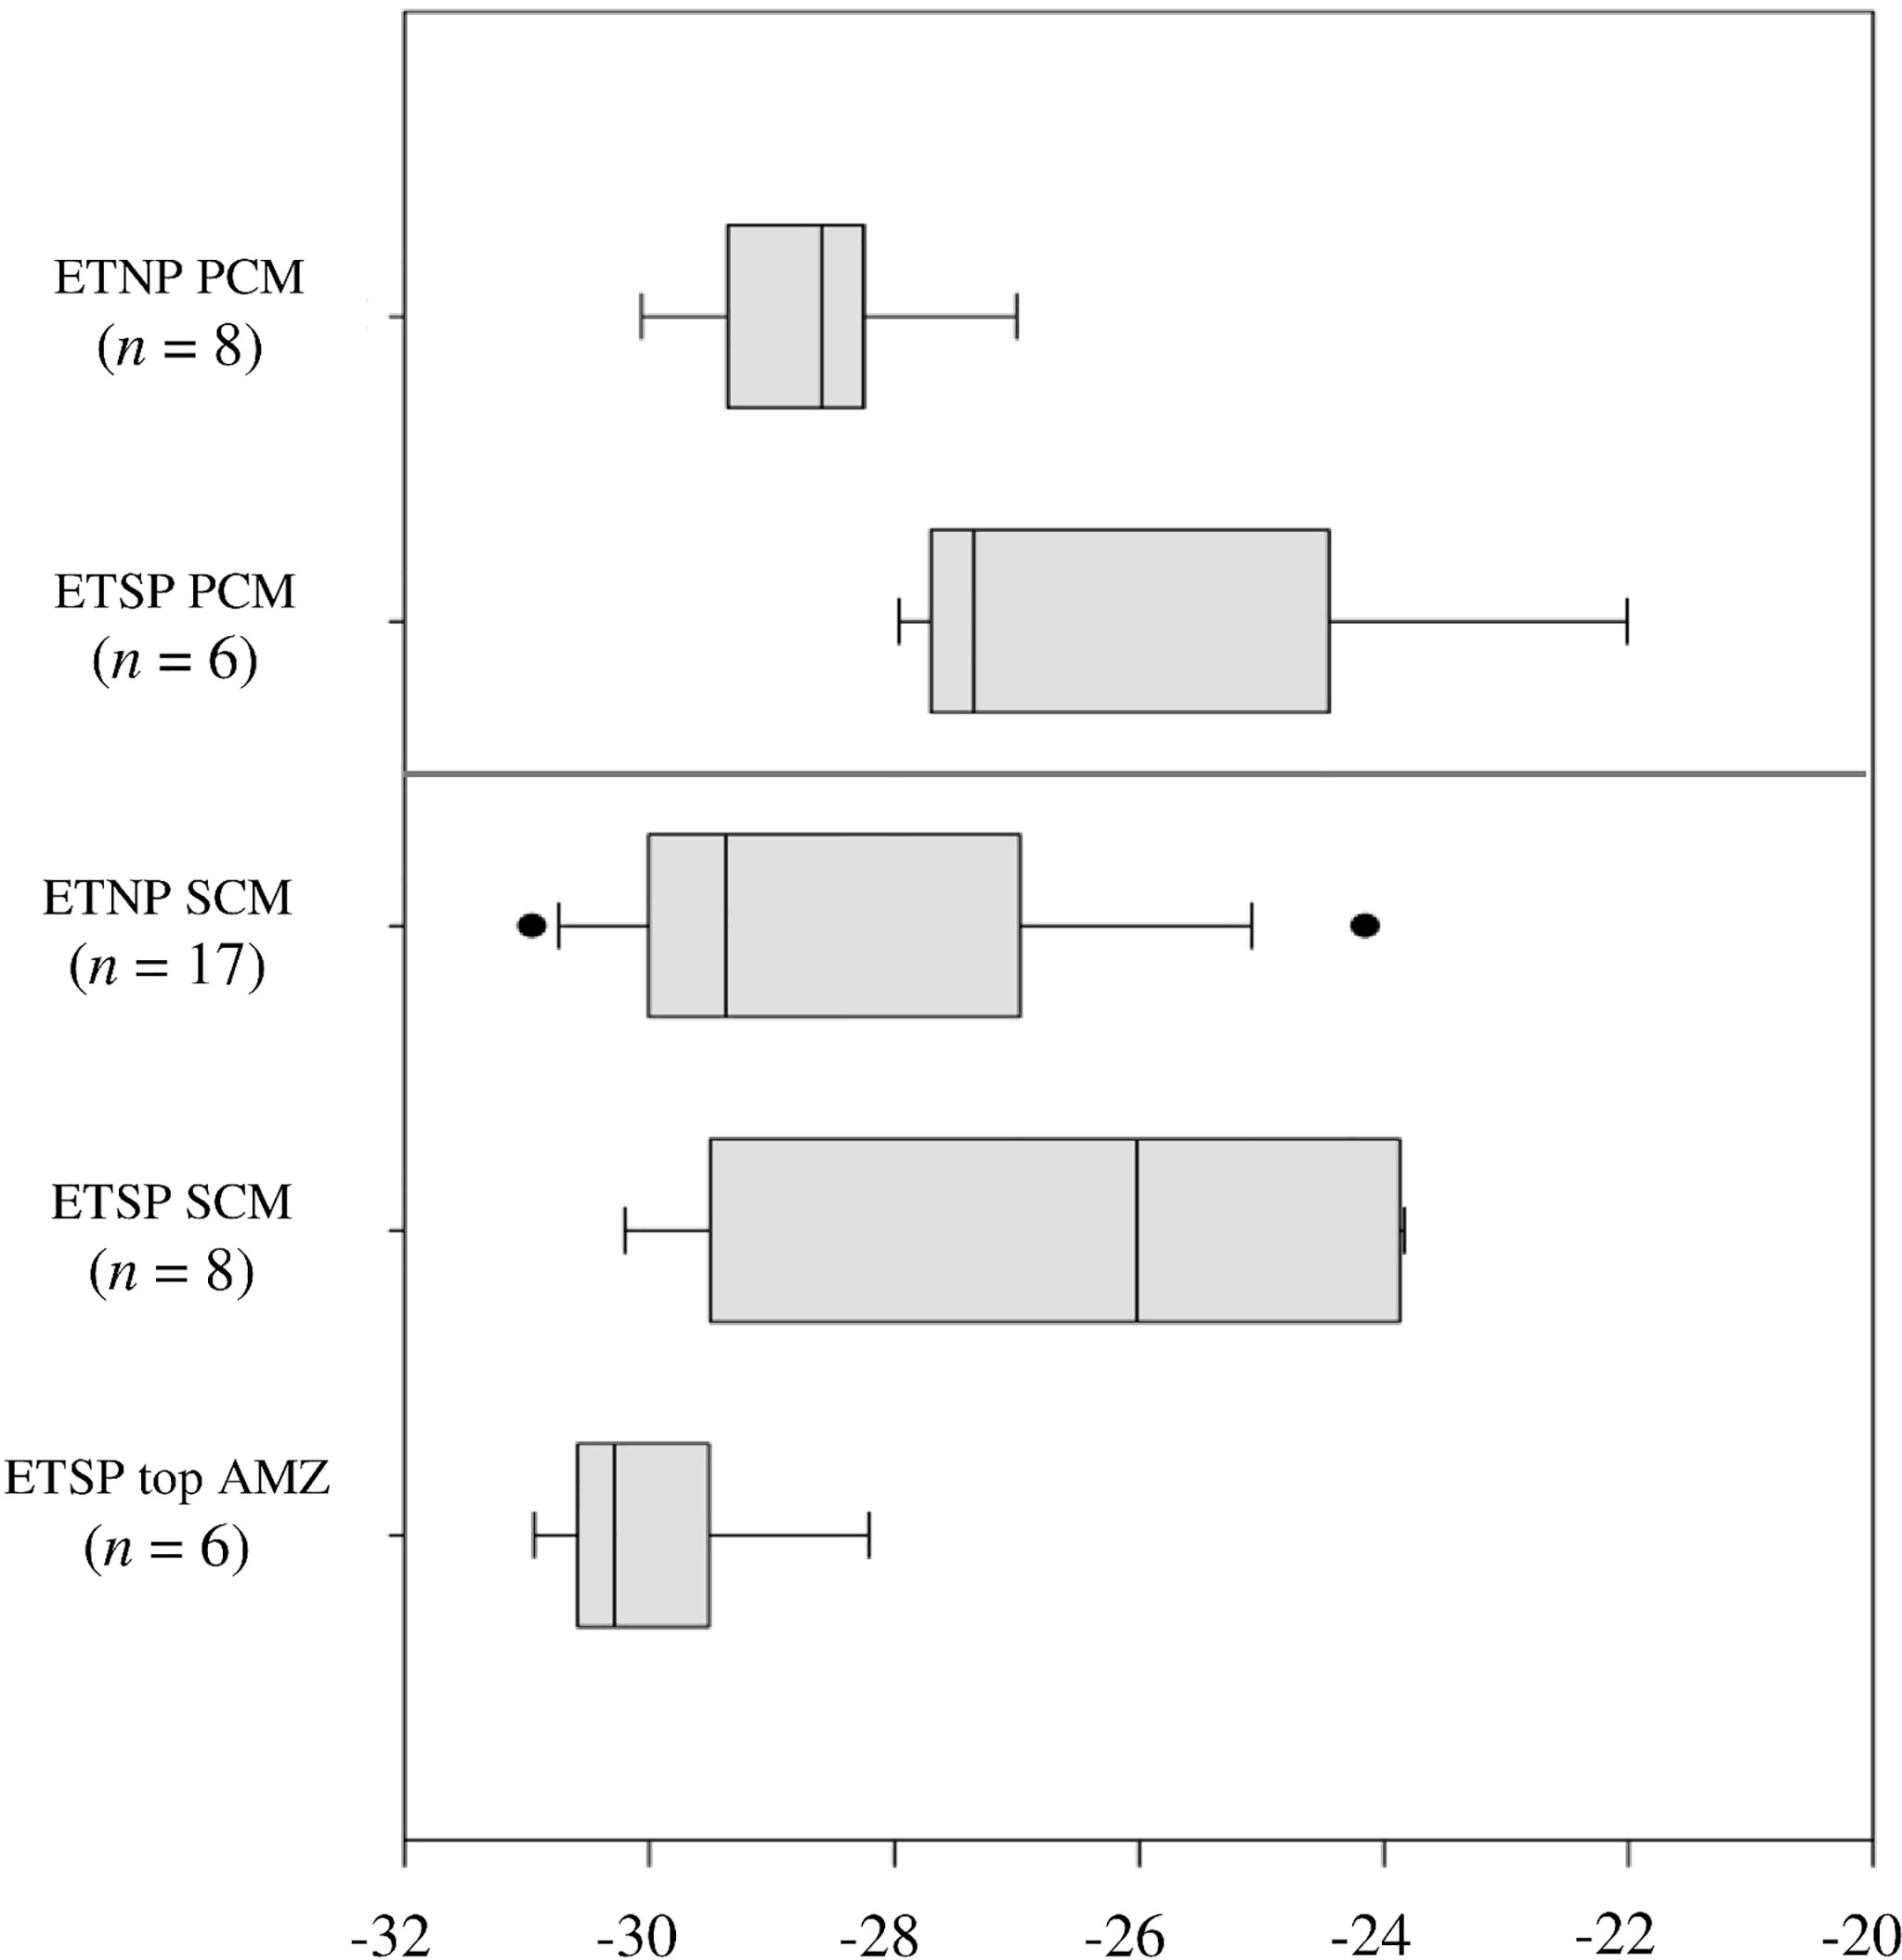
Figure 3 Boxplot of natural abundance of δ13C (‰) of POC (0.3 – 3.0 μm size fraction) during the ETNP and ETSP cruises. PCM indicates primary chlorophyll maximum (top panel), SCM indicates secondary chlorophyll maximum and “ETSP top AMZ” indicates samples taken at the top of the AMZ when no SCM was present (bottom panel). n is the number of measurements per group. The bars indicate the minimum and the maximum values, and the dots indicate the outliers.
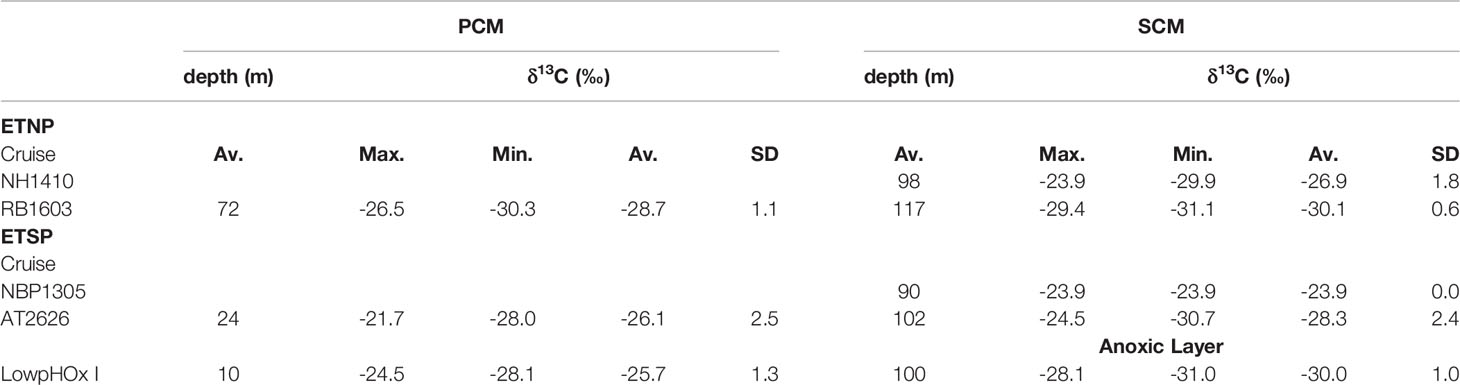
Table 2 Summary of the δ13C in the particulate organic carbon (δ13C –POC; ‰) in the primary chlorophyll maximum (PCM) and secondary chlorophyll maximum (SCM) by cruise for the Eastern Tropical North Pacific (ETNP) and Eastern Tropical North Pacific (ETSP).
Multiple-pairwise comparisons among δ13CPOC for the ETNP SCM, the ETSP SCM, and ETSP top AMZ (no SCM was developed), indicated that there were no significant differences between δ13CPOC from ETNP SCM vs. ETSP SCM at a 95% confidence level, with the variability among stations only 9% higher in the ETNP SCM. However, significant differences were found between δ13CPOC from ETSP SCM vs. ETSP top AMZ where no SCM was developed, with values 3.3‰ on average heavier and the variability among stations 55% higher when the SCM was developed (Table 3). Moreover, no significant correlations were found between δ13CPOC in the SCM and the abundance of Prochlorococcus or any other environmental variable evaluated in this study such as nutrients, distance to the coast, among others.
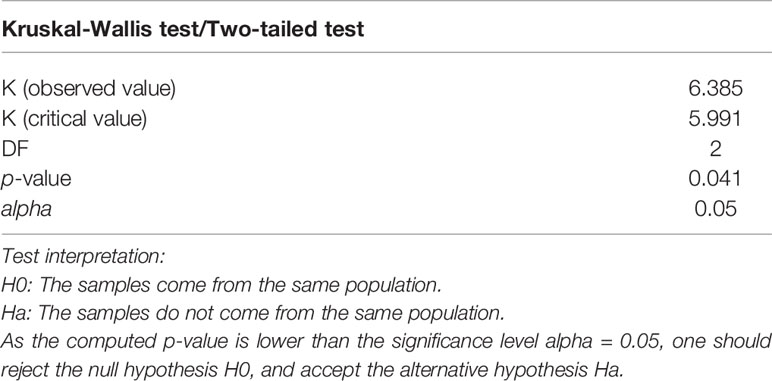
Table 3 Kruskal-Wallis test for the comparison among δ13C-ETNP SCM, δ13C-ETSP SCM and δ13C-ETSP top AMZ (no SCM). K is Kruskal-Wallis test statistic and DF is degrees of freedom.
Carbon Assimilation Rates
Uptake rates for inorganic (bicarbonate) and organic (glucose and acetate) carbon sources were measured in incubation experiments in light vs. dark with water samples taken from the SCM (Figure 4; Table S1). Our results show that bicarbonate (Ci) assimilation in the SCM was highly variable among stations and was always higher in the presence of light (Figure 4A). During incubations with light, Ci assimilation rates varied between 4.2 and 150.3 nmol C L-1 d-1 for the ETNP and between 2.4 and 157.4 nmol C L-1 d-1 in the ETSP ( = 43.7 nmol C L-1 d-1; SD = 59.8 nmol C L-1 d-1; all stations). Pearson’s correlation analysis showed a positive and significant correlation (r = 0.765 p = 0.009) between these rates and the relative abundance of fluorescent cells (Prochlorococcus + orange-fluorescent cells) in the total picoplanktonic community (Prochlorococcus + orange-fluorescent cells + NFP), with high rates and abundances in the stations T7 in the ETNP (cruise NH1410) and ST8 in the ETSP (cruise AT2626) (Table S2). During dark incubations, Ci assimilation rates were very low, but present and ranging between 1.96 and 17.8 nmol C L-1 d-1 in the ETNP and between 0.5 and 64.8 nmol C L-1 d-1 in the ETSP ( = 4.8 nmol C L-1 d-1; SD = 4.5 nmol C L-1 d-1; all stations). On average, Ci assimilation rates in the dark were 11.5 times lower (SD =13.9; min = 0.2; max = 44.6) than in the light.
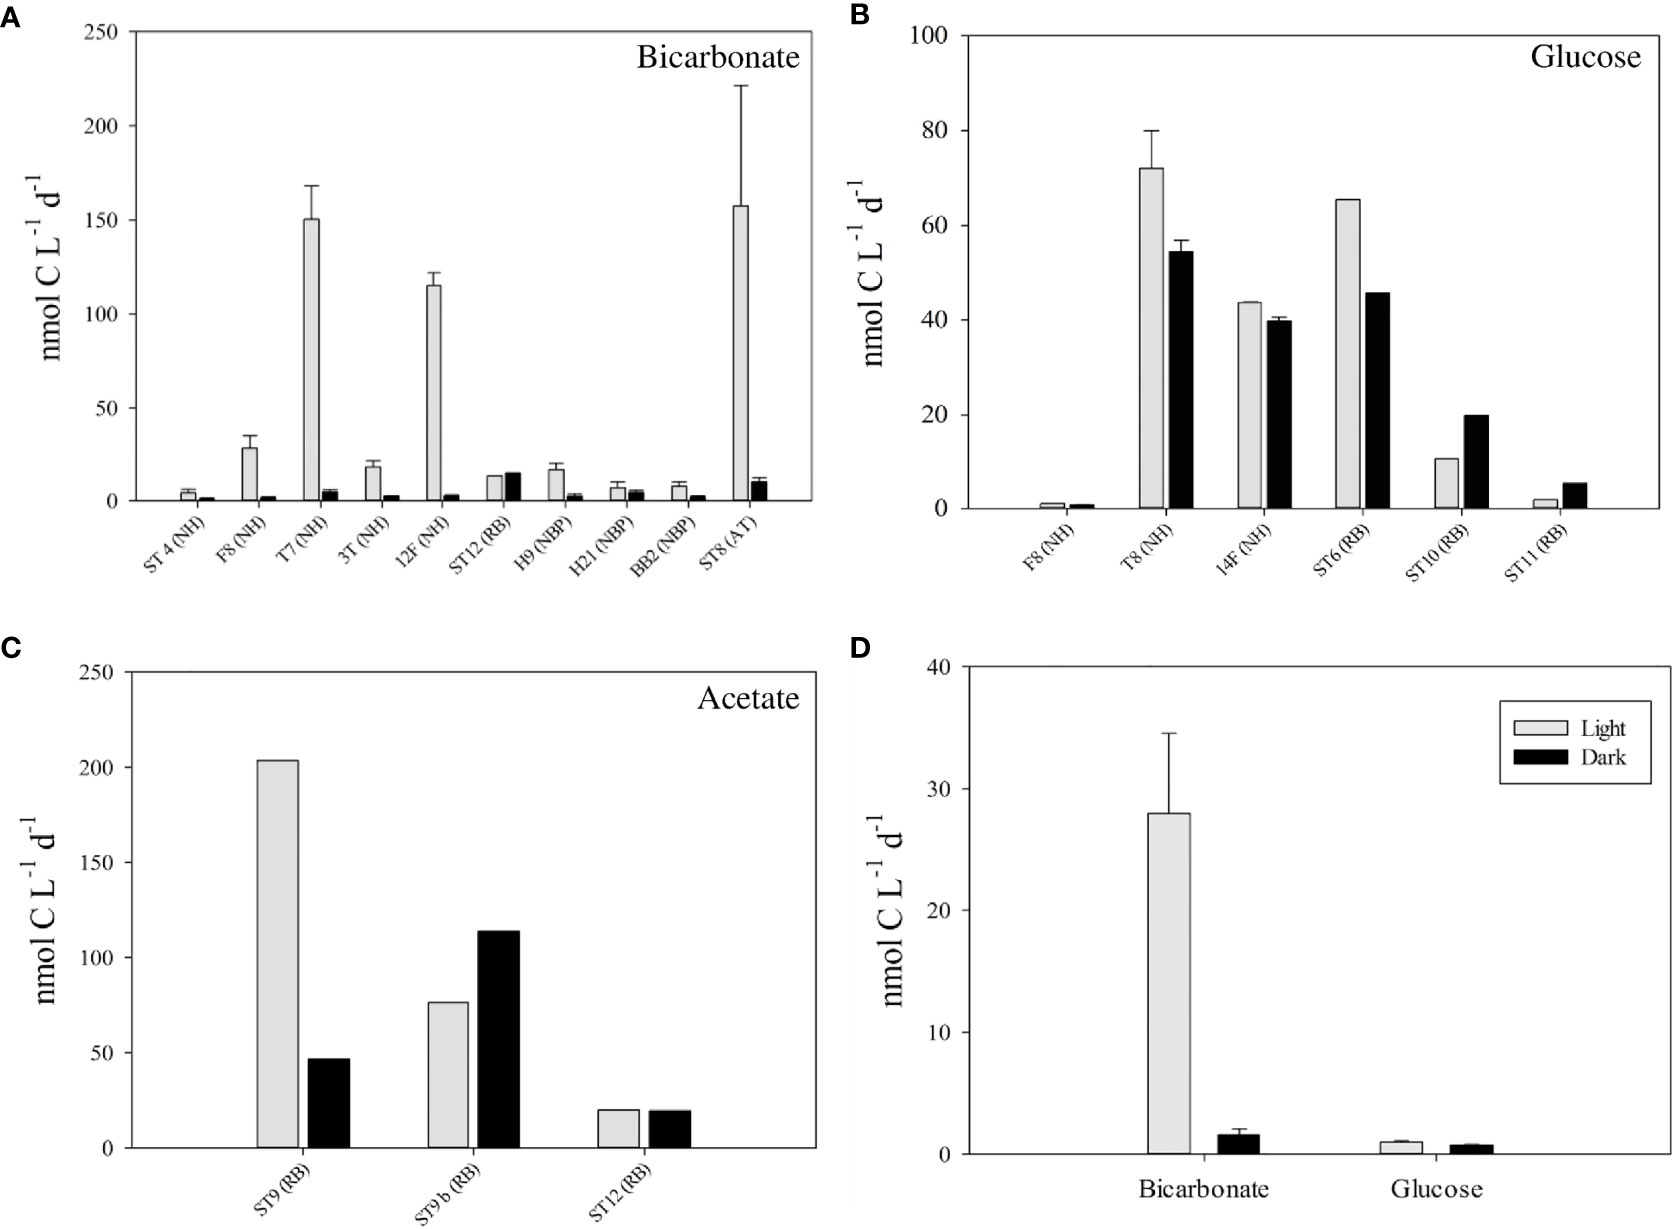
Figure 4 Carbon assimilation rates for bicarbonate (A), glucose (B) and acetate (C) during light (grey bars) and dark (black bars) incubations for several stations at the depth of the SCM (name of the cruise in parenthesis; NH is NH1410 cruise; RB is RB1603 cruise; AT is AT2626 cruise; NBP is NBP1305 cruise). Panel (D) represents C assimilation rates for bicarbonate and glucose during light (grey bars) and dark (black bars) incubations for the SCM at the station F8 in the cruise NH1410. Incubations lasted 12 hours. No incubations were performed in the LowpHOx I cruise.
We also performed experiments using organic carbon sources glucose and acetate during the ETNP cruises. In our experiments with glucose, the calculated assimilation rates were also variable among stations and were generally higher in the light (4 out of 6 stations) (Figure 4B). Although we found a strong negative correlation between the distance to the coast and the difference between the glucose assimilation rates in light and dark, it was not statistically significant (r = -0.755; p = 0.083). However, there was a strong negative and statistically significant correlation (r = -0.918; p = 0.009) between SCM depth and the difference between glucose assimilation rates in light and dark. That is, there was greater stimulation by light in glucose uptake rates with samples collected from a shallower SCM. The maximum uptake rate recorded was in station T8 (cruise NH1410), with values of 72.1 nmol C L-1 d-1 in incubations with light and 54.5 nmol C L-1 d-1 in dark incubations. The lowest uptake rate was recorded in station F8 (cruise NH14010) with values of 1.1 nmol C L-1 d-1 during incubations with light and 0.8 nmol C L-1 d-1 during dark incubations (Figure 4D). The maximum difference between light and dark uptake rates (19.7 nmol C L-1 d-1; being 1.4-fold higher during light incubations) was recorded at station ST6 (cruise RB1603).
We compared Ci and glucose assimilation rates in the only station that we have both measurements (cruise NH1410, St. F8). The results showed that Ci assimilation rate in the SCM exceeded assimilation of glucose by 26.7-fold during light incubations and 2.1-fold during dark incubations (Figure 4D). Additionally, we compared Ci and glucose assimilation rates for all stations. Our results showed that Ci assimilation rates ( = 43.7 nmol C L-1 d-1; SD = 59.8 nmol C L-1 d-1; min = 2.4 nmol C L-1 d-1; max = 157.4 nmol C L-1 d-1) were on average 1.3 times higher than glucose assimilation rates ( = 32.4 nmol C L-1 d-1; SD = 32.2 nmol C L-1 d-1; min = 1.1 nmol C L-1 d-1; max = 72.1 nmol C L-1 d-1) during light incubations (Figures 4A, B). However, during dark incubations, Ci assimilation rates ( = 4.8 nmol C L-1 d-1; SD = 4.5 nmol C L-1 d-1; min = 1.0 nmol C L-1 d-1; max = 14.8 nmol C L-1 d-1) were on average 5.7 times lower than glucose assimilation rates ( = 27.7 nmol C L-1 d-1; SD = 22.3 nmol C L-1 d-1; min = 0.8 nmol C L-1 d-1; max = 54.5 nmol C L-1 d-1) (Figures 4A, B), showing a prevalence of heterotrophic over autotrophic metabolism at least when no light was present.
Three measurements of acetate assimilation rates were performed in the ETNP (cruise RB1603) (Figure 4C). Results showed a high variability among stations, with maximum assimilation rates during light incubations in the station ST9 (203.7 nmol C L-1 d-1) and minimum assimilation rates in station ST12 (19.9 nmol C L-1 d-1). However, the data is insufficient to identify a pattern between light and dark incubations.
Discussion
Our results highlight the importance of picocyanobacteria inhabiting the SCM for modifying the carbon cycle and the isotopic composition of the POC at the top of the oxygen-depleted layer in the AMZs. The structure of the water columns of the stations sampled in both the ETNP and ETSP showed the paradigmatic vertical structure reviewed by Ulloa et al. (2012). The picophytoplanktonic communities inhabiting the SCM in oxygen-depleted subsurface waters differed consistently from those composing the PCM in the oxic surface waters in both abundance and composition similar to previous observations (Goericke et al., 2000; Lavin et al., 2010). Our results show similar trends, with a PCM composed mainly by Prochlorococcus (Av. Rel. Ab. = 40.3%) and Synechococcus-like orange fluorescent cells (Av. Rel. Ab. = 39.3%), and with an abundant community of PPE (Av. Rel. Ab. = 20.4%). In contrast, the SCM picophytoplanktonic community was dominated numerically by Prochlorococcus cells (Av. Rel. Ab. = 94.0%) and to a lesser extent by orange-fluorescent cells (Av. Rel. Ab. = 5.1%) and almost no detectable PPE (Av. Rel. Ab. <1%) (Table S2) (Lavin et al., 2010; Garcia-Robledo et al., 2017; Aldunate et al., 2020). The dominant wavelength of light in the SCM (or in the top of the oxygen-depleted layer when no SCM is developed) is blue, with intensities that are in the range of 2-5 μmol photons m-2 s-1 (Garcia-Robledo et al., 2017). Thus, the great abundance of Prochorococcus at such low light levels have been explained by the high concentration of transmembrane divinyl chlorophyll a and b complexes as their main photosynthetic light-harvesting antennae, very efficient absorbing blue light (Moore and Chisholm, 1999, Goericke et al., 2000). These SCMs, contributed a measurable signal in POC, enough to alter the δ13CPOC in the top of the oxygen-depleted layer. Also, assimilation rates showed that when sufficient light and Prochlorococcus are present, photosynthesis exceeds chemoautotrophic carbon fixation, and can exceed heterotrophic assimilation of glucose or acetate, indicating that chemoautotrophic activity, is normally less important compared with photosynthesis when a SCM, formed by AMZ Prochlorococcus, has developed below the oxycline.
Assimilative C Metabolism in the AMZ
POC samples (< 3 μm) represent a mixture of carbon from living and dead phytoplankton, non-fluorescent bacteria, archaea and picoeukaryotes, as well as other components such as organic detritus. δ13CPOC values depend partially on the isotopic composition of the sources of carbon taken up by the microorganisms composing POC (i.e. dissolved organic and inorganic carbon) and the isotopic discrimination (ϵ) of the enzymes involved in those processes (Blair et al., 1985).
In the surface, at the depth of the PCM, microorganisms performing the Calvin-Benson-Bassham (CBB) cycle pathway mediated by the enzyme RuBisCO typically dominate the autotrophic community (e.g. Raven, 2009; Hügler and Sievert, 2011; Ruiz-Fernández et al., 2020). This enzyme can generate a large kinetic isotopic fractionation against 13C (ϵ = 10 - 22‰; Hayes, 2001), with plankton reported values of δ13CPOC from -18 to -24‰ in the surface waters (Barros et al., 2010; Podlaska et al., 2012). However, in some stations, the PCM was developed in the upper oxycline (Figure 2), where the aerobic ammonium oxidation represents a very important process in our study site, contributing up to 50% of the total dark carbon fixation (Molina and Farías, 2009). This process fixes Ci using 3-hydroxypropionate/4-hydroxybutyrate cycles, and is associated with Thaumarchaeota of the Marine Group I (Ruiz-Fernández et al., 2020). These ammonia-oxidizing archaea, with Nitrosopumilus maritimus as a representative, strongly discriminate against de 13C from the Ci (ϵ = 20‰) reaching δ13C-biomass values of approximately -25.8‰ (Könneke et al., 2012). We found natural δ13CPOC values ranging from -30.3‰ to -26.5‰ for the ETNP and from -28.0‰ to -21.7‰ in the ETSP (Figure 3). Although within our data there were δ13CPOC values within the expected range for planktonic samples, most of our data showed 13C-depleted values.
Alternative explanations could consider the size fraction of the particles, since most studies consider POC > 0.45, 0.7, 0.8, or 1.0 µm (Close and Henderson, 2020) while this study considered the picoplanktonic fraction (0.3 to 3.0 µm) leaving out larger groups of phytoplankton e.g. diatoms, and selecting groups such as Prochorococcus, Synechococcus and PPE. As large phytoplankton such as diatoms often have higher δ13CPOC values than small phytoplankton and heterotrophic microorganisms (Hansman and Sessions, 2016), the exclusion of these organisms in our POC samples would tend to remove their 13C- enriched signature, explaining in part the depleted δ13CPOC at surface.
In the major AMZs of the world, a partitioning of the marker genes associated with different autotrophic carbon fixation pathways has been reported along the oxygen gradient (Ruiz-Fernández et al., 2020), which fractionate against 13C differentially (Preuß et al., 1989). The oxygen-depleted layer within the AMZs harbors a considerable chemoautotrophic community, including anammox bacteria and sulfur-oxidizers (Stevens and Ulloa, 2008) with metabolisms that strongly fractionate against 13C, producing 13C-depleted biomass (Schouten et al., 2017). Even though the CBB pathway is dominant throughout the entire water column, the reductive Acetyl-CoA pathway is a C-fixing pathway very important in suboxic to oxygen-depleted layers (Ruiz-Fernández et al., 2020), is mainly associated to Planctomycetes of the genus Candidatus Scalindua (anammox bacteria), and has a large enzymatic isotope effect (ϵ = 15 - 36‰; Hayes, 2001; Schouten et al., 2017).
The contrasting isotopic data from the stations sampled in the upper part of the oxygen-depleted layer in the presence vs. absence of an SCM can be interpreted as a consequence of the biogeochemical effect of the SCM community in the AMZ. The reduction of inorganic carbon by chemoautotrophs may lead to a significantly greater depletion of 13C than that resulting from photosynthetic fixation (Ruby et al., 1987; Hayes, 2001). Thus, during our study, depleted 13C values in POC were found in the top of the oxygen-depleted layer where the SCM was developed, being markedly more depleted in the top of the oxygen-depleted layer of the ETSP when no SCM was present (Figure 3). When the SCM is present, Prochlorococcus and anammox bacteria may compete for ammonium, and the cryptic oxygen production by Prochlorococcus in the SCM also may repress anammox activity (Aldunate et al., 2020) or autotrophic denitrification (Di Capua et al., 2019). Thus, if no SCM is present, no oxygen is produced in the top of the oxygen-depleted layer and anammox bacteria can be important, explaining more depleted values. On the contrary, when the SCM is present, other (micro)aerobic metabolisms become important such as aerobic respiration and nitrite-oxidation (Garcia-Robledo et al., 2017). A high abundance of transcripts of nitrite oxidizing bacteria (genus Nitrospina) and transcripts encoding nitrite oxidoreductase (nxr) have been found within the SCM (Garcia-Robledo et al., 2017). This is consistent with the metagenomic sequences related to the reductive Tricarboxylic Acid (rTCA) cycle, found in dysoxic to anoxic waters in the AMZ, which are associated to the autotrophic carbon fixation in Nitrospina gracilis, a known aerobic nitrite oxidizer (Ruiz-Fernández et al., 2020). The rTCA pathway has lower enzymatic isotope effect (ϵ = 9.5 - 20.1‰; House et al., 2003; Reid et al., 2013) compared with CBB or Acetyl-CoA pathways. Furthermore, nitrite oxidation rates have been shown to peak in the SCM (Ganesh et al., 2015), and can be being comparable in magnitude with our Ci fixation rates and with the Ci fixation rates and oxygen production reported by Garcia-Robledo et al., 2017. Actually, it has been shown that nitrite oxidation rates have the potential to consume all the oxygen produced in the SCM (Beman et al., 2021b).
In addition to autotrophs, the oxygen-depleted layer includes heterotrophic microorganisms and part of its isotopic signature comes from the isotopic effect during the assimilation of dissolved organic carbon (DOC). The reported values of δ13C -DOC are relatively invariant with depth and geographic region in the ocean, with values in the range of -20‰ to -22‰ (Benner et al., 1997). As the isotopic effect during the assimilation of DOC by heterotrophic microorganisms is very low (0 to 1.9‰; (Fry and Sherr, 1989), it is assumed that the heterotrophic community contribution to POC is only 0.1 to 2‰ heavier that δ13CDOC (Abelson and Hoering, 1961; Ingram et al., 1973; Monson and Hayes, 1982; Blair et al., 1985). This consideration implies that, the variations that we detect in the δ13CPOC values between one sample and another would reflect the variations in the autotrophic community composing POC (photosynthesis, chemosynthesis). However, the oxidation or remineralization of organic matter releases 13C-depleted carbon back into the inorganic reservoir, making POC heavier (Freeman, 2001). Thus, slightly higher δ13CPOC values in the oxygen-depleted layer, where a SCM is developed (relative to when no SCM is developed) could indicate activity of heterotrophic metabolisms.
This is consistent with the variations in the SCM δ13CPOC isotopic signals vs. the stations where there was no development of a SCM, the δ13CPOC values in the SCM being on average 3.3 ‰ heavier (photosynthesis signal) than when there was no development of a SCM (chemoautotrophy signal). This changes also agrees with the findings of Vargas et al. (2021) for the ETSP off Chile whose results suggest a dynamic shift, in terms of carbon fixation, from a chemoautotrophic dominated oxygen-depleted layer (absence of a SCM), to a largely photoautotrophic/nitrifying system with predominance of heterotrophic processes (development of a SCM). Thus, these results highlight the importance of picocyanobacteria inhabiting the SCM for modifying the carbon cycle and the isotopic composition of the POC at the top of the oxygen-depleted layer in the AMZs.
We were unable to factors that associated with the high variability in δ13CPOC both in the PCM and SCM. Here it may be important to consider that the POC and δ13CPOC integrate recent environmental history in a way that may not correlate well with snapshots of instantaneous environmental variables. For example, δ13CPOC may reflect physical dynamics, such as vertical movements due to internal waves that could alter the light field, affecting the relative rates of photosynthesis compared to other metabolic processes. Alternatively, δ13CPOC could also be affected by trajectories in community dynamics that are not detected by flow cytometry of single time points.
Carbon Assimilation Rates
Ci assimilation was strongly stimulated by light, consistent with the photosynthetic activity of Prochlorococcus in the SCM (Garcia-Robledo et al., 2017), presenting higher assimilation rates at the stations with greater relative abundance of Prochlorococcus (Table 1, Table S2). Dark Ci assimilation rates were low at all stations (1 – 15 nmol C L-1 d-1), and much lower than the maximum Ci assimilation rate observed in the light (157 nmol C L-1 d-1), indicating that chemoautotrophic activity, probably associated with anammox or sulfur-oxidazing bacteria (Stewart et al., 2012), is normally less important compared with photosynthesis when light is available and a SCM formed by AMZ Prochlorococcus has developed below the oxycline. In addition, dark Ci assimilation rates could also include Ci assimilation for metabolic pathways involved in heterotrophic growth, such as fatty acid synthesis or gluconeogenesis (Roslev et al., 2004). Nevertheless, at some stations, such as station ST12 (RB) and H21 (NBP), Ci assimilation rates in light and dark incubations showed that the chemoautotrophic activity becomes important when photosynthetic activity is low (Figure 1A).
Glucose assimilation rates were variable among stations and were in the range of the values reported in the Pacific Ocean by Rich et al. (1996). Our data showed a strong negative and statistically significant correlation (r = -0.918; p = 0.009) between SCM depth and the difference between glucose assimilation rates in light and dark. Thus, when the SCM develops in more superficial depths (probably with higher light), glucose assimilation is stimulated by light. On the contrary, when the SCM develops at greater depths (lower light), glucose assimilation is independent of light.
It has been pointed out that microorganisms associated with Roseobacter and SAR11 clade contribute a large fraction of the total glucose assimilation when there is a low concentration of this carbon source and Flavobacteria (Bacteroidetes) can be important when this carbon source is more concentrated (Alonso and Pernthaler, 2006). Roseobacter and Flavobacteria have been found in the oxic surface waters overlaying the oxygen-depleted layer in the AMZs, and only SAR11 is important in the oxygen-depleted layer where the SCM is developed (Stevens and Ulloa, 2008). Although much of this glucose assimilation may be due to the presence of SAR11, Prochlorococcus might also contribute. There is evidence that other ecotypes of Prochlorococcus (different from those found in oxygen-depleted SCM) use glucose both in laboratory studies (Gómez-Baena et al., 2008) and in the environment (Van Wambeke et al., 2018). In fact, a study at the North Pacific Subtropical Gyre showed that Prochlorococcus glucose assimilation rates peak during the day (our experiments were developed in diel time) while rates in the whole community peak during the night-early morning (Muñoz-Marín et al., 2021). Thus, if glucose is available in the SCM (<1% light environment), Prochlorococcus might be using it, competing with SAR11 and other heterotrophic organisms that inhabit the SCM.
Acetate is another important organic carbon source in the ocean and can be produced during the anaerobic degradation of complex organic matter and especially during fermentation (Sansone, 1986; Canfield, 1993; Kristensen et al., 1995). This organic carbon source is especially important in sediments (Boschker, 2001), but also has been reported in the water column (Wu et al., 1997; Zhuang et al., 2019). Maximum assimilation rates have been found in the oxic surface waters and near the suboxic/anoxic interface, suggesting that acetate cycling may be important both in oxic and oxygen-depleted environments (Ho et al., 2002). Acetate is used by both heterotrophic organisms (Zhuang et al., 2019), and by different phytoplankton groups (Combres et al., 1994; Bouarab et al., 2004; Liang et al., 2009; Zhang and Bryant, 2015; Godrijan et al., 2020), including Synechococcus (Ihlenfeldt and Gibson, 1977; Yan et al., 2012). Our results showed variable acetate assimilation rates, with similar variability and magnitude to that shown by Ho et al. (2002) in suboxic/anoxic interface. Although we only have three measurements and a pattern has not been found, speculate that sulfate-reducing bacteria might be important in the assimilation of acetate in darkness (Fauque, 1995), while light might stimulate a photoheterotrophic and/or mixotrophic metabolism by numerically important groups at these depths such as members of the SAR11 clade or Prochlorococcus.
Summary and Conclusions
It has been suggested that anoxic marine zones are in expansion (Stramma et al., 2008), so the anoxic layer boundaries will move to shallower depths, overlapping more frequently with the photic layer (Gilly et al., 2013). This overlap stimulates the presence of a SCM, which has little-known biogeochemical effects (Garcia-Robledo et al., 2017; Beman et al., 2021a). Our results suggest that the presence of SCM has a biogeochemical effect on the layer where it develops, enough to alter δ13C of POC in the top of the oxygen-depleted layer and reflected in the significant differences between δ13CPOCvalues found in samples from below the oxycline in presence vs. absence of a SCM, with the samples from a SCM 3.3‰ heavier on average. The reduction of inorganic carbon by chemoautotrophs may lead to a significantly greater depletion of 13C than that resulting from photosynthetic fixation (Ruby et al., 1987; Hayes, 2001). Therefore, more depleted δ13CPOCvalues when no SCM was present might indicate a stronger chemoautotrophic activity compared with more enriched values when SCM was present. Anammox bacteria and sulfur-oxidizers are important chemoautotrophic groups inhabiting the oxygen-depleted layer of the AMZ (Stevens and Ulloa, 2008; Stewart et al., 2012; Beman et al., 2021a), with anammox bacteria associated to the Acetyl-CoA carbon fixation pathway (Ruiz-Fernández et al., 2020) that strongly fractionate against 13C, producing 13C-depleted biomass (Schouten et al., 2017). On the other hand, when the SCM is present, photosynthesis and (micro)aerobic metabolisms become important as the aerobic respiration and nitrite-oxidation (Garcia-Robledo et al., 2017). Therefore, picocyanobacteria inhabiting the SCM perform an important role modifying the carbon cycle and the isotopic composition of POC at the top of AMZs.
Our estimates of assimilation of inorganic and organic carbon sources by microbial communities inhabiting the oxygen-depleted SCM have provided useful information about the dominant assimilatory pathways. The layer immediately below the oxycline in AMZs is strongly influenced by the presence or absence of AMZ Prochlococcus and their relative abundance in the picoplanktonic community and this is reflected in the enhanced of Ci assimilation rates when light is present. Ci assimilation rates in the dark (chemoautotrophic activity) are probably associated with anammox or sulfur-oxidizing bacteria (Stewart et al., 2012) and do not reach the same maximum magnitudes that photosynthetic carbon fixation can reach when an SCM develops. Glucose assimilation was also stimulated by light (photoheterotrophy) and, although there are a variety of microorganisms that can use light as an energy source to assimilate organic carbon, the most abundant in the oxygen-depleted layer are SAR11 and Prochlorococcus. Despite the fact that we only have three measurements of acetate assimilation in the SCM, and a pattern has not been found, we detected stimulation by light in one occasion, suggesting photoheterotrophic and/or mixotrophic metabolisms, which we suggest could performed by numerically important groups at these depths such the SAR11 clade or AMZ Prochlorococcus. When there is no light stimulation, the assimilation of acetate might result from organisms such as sulfate-reducing bacteria (Fauque, 1995). Therefore, when light and sufficient Prochlorococcus are present, photosynthesis exceeds chemoautotrophic carbon fixation, and can exceed heterotrophic assimilation of glucose or acetate. Furthermore, oxygen produced by Prochlorococcus may be suppressing anammox activity, explaining the low chemoautotrophic carbon fixation when SCM is present. However, in the majority of the stations, both the maximum glucose and acetate assimilation rates exceeded carbon fixation rates, supporting that the SCM is often still a net heterotrophic system.
Data Availability Statement
The original contributions presented in the study are included in the article/Supplementary Material. Further inquiries can be directed to the corresponding author.
Author Contributions
MO, PD and OU contributed the concept and design of the study. MO collected the samples during field samplings, conducted the experiments, and analyzed the samples. MO organized the database and analyzed the datasets. MO drafted the manuscript with contributions from PD and CV. All authors contributed to the manuscript revision, read, and approved the submitted version.
Funding
This study was financially supported by the Millennium Science Initiative (grant ICN12_019), the ANID-Chile Fondecyt grant 1161483 to O.U. and ANID graduate fellowship to M.A. Additional support has been provided by ANID Fondecyt Postdoctoral project 3210281 to M.A. during the last stage of this study. ANID-Chile National also supported this study by the Competition for ship time (AUB 150006/12806).
Conflict of Interest
The authors declare that the research was conducted in the absence of any commercial or financial relationships that could be construed as a potential conflict of interest.
Publisher’s Note
All claims expressed in this article are solely those of the authors and do not necessarily represent those of their affiliated organizations, or those of the publisher, the editors and the reviewers. Any product that may be evaluated in this article, or claim that may be made by its manufacturer, is not guaranteed or endorsed by the publisher.
Acknowledgments
We would like to thank to the chief scientists whose invited to us to participate in the cruises included in this study: Bess Ward and Alan Devol (NPB1305) Frank Stewart (NH1410), Margaret Mulholland (AT2626 and RB1603; NSF OCE-1356056) and Amal Jayakumar (RB1603). We also would like to thank the captain and crew of the R/V Nathaniel B. Palmer, the R/V New Horizon, the R/V Atlantis and NOAA vessel Ronald Brown for their help with the sampling. We also want to thank to Gadiel Alarcón, Marguerite Blum and Francisco Chavez for their help with the PPS and Cristian Venegas for flow cytometry analysis.
Supplementary Material
The Supplementary Material for this article can be found online at: https://www.frontiersin.org/articles/10.3389/fmars.2022.858308/full#supplementary-material
References
Abelson P. H., Hoering T. C. (1961). Carbon Isotope Fractionation in Formation of Amino Acids by Photosynthetic Organisms. Proc. Natl. Acad. Sci. 47, 623–632. doi: 10.1073/pnas.47.5.623
Aldunate M., Henríquez-Castillo C., Ji Q., Lueders-Dumont J., Mulholland M. R., Ward B. B., et al. (2020). Nitrogen Assimilation in Picocyanobacteria Inhabiting the Oxygen-Deficient Waters of the Eastern Tropical North and South Pacific. Limnol. Oceanogr. 65, 437–453. doi: 10.1002/lno.11315
Alonso C., Pernthaler J. (2006). Roseobacter and SAR11 Dominate Microbial Glucose Uptake in Coastal North Sea Waters. Environ. Microbiol. 8, 2022–2030. doi: 10.1111/j.1462-2920.2006.01082.x
Barros G. V., Martinelli L. A., Oliveira Novais T. M., Ometto J. P. H. B., Zuppi G. M. (2010). Stable Isotopes of Bulk Organic Matter to Trace Carbon and Nitrogen Dynamics in an Estuarine Ecosystem in Babitonga Bay (Santa Catarina, Brazil). Sci. Total Environ. 408, 2226–2232. doi: 10.1016/j.scitotenv.2010.01.060
Beman J. M., Vargas S. M., Vazquez S., Wilson J. M., Yu A., Cairo A., et al. (2021a). Biogeochemistry and Hydrography Shape Microbial Community Assembly and Activity in the Eastern Tropical North Pacific Ocean Oxygen Minimum Zone. Environ. Microbiol. 23 (6), 2765–2781. doi: 10.1111/1462-2920.15215
Beman J. M., Vargas S. M., Wilson J. M., Perez-Coronel E., Karolewski J. S., Vazquez S., et al. (2021b). Substantial Oxygen Consumption by Aerobic Nitrite Oxidation in Oceanic Oxygen Minimum Zones. Nat. Commun. 12 (1), 7043. doi: 10.1038/s41467-021-27381-7
Benner R., Biddanda B., Black B., McCarthy M. (1997). Abundance, Size Distribution, and Stable Carbon and Nitrogen Isotopic Compositions of Marine Organic Matter Isolated by Tangential-Flow Ultrafiltration. Mar. Chem. 57, 243–263. doi: 10.1016/S0304-4203(97)00013-3
Blair N., Leu A., Munoz E., Olsen J., Kwong E., Des Marais D. (1985). Carbon Isotopic Fractionation in Heterotrophic Microbial Metabolism. Appl. Environ. Microbiol. 50, 996–1001. doi: 10.1128/aem.50.4.996-1001.1985
Boschker H. (2001). Bacterial Populations and Processes Involved in Acetate and Propionate Consumption in Anoxic Brackish Sediment. FEMS Microbiol. Ecol. 35, 97–103. doi: 10.1016/S0168-6496(00)00116-1
Bouarab L., Dauta A., Loudiki M. (2004). Heterotrophic and Mixotrophic Growth of Micractinium Pusillum Fresenius in the Presence of Acetate and Glucose:Effect of Light and Acetate Gradient Concentration. Water Res. 38, 2706–2712. doi: 10.1016/j.watres.2004.03.021
Canfield D. E. (1993). “Organic Matter Oxidation in Marine Sediments,” in Interactions of C, N, P and S Biogeochemical Cycles and Global Change (Berlin, Heidelberg: Springer Berlin Heidelberg), 333–363. doi: 10.1007/978-3-642-76064-8_14
Cepeda-Morales J., Beier E., Gaxiola-Castro G., Lavín M. F., Godínez V. (2009). Effect of the Oxygen Minimum Zone on the Second Chlorophyll Maximum. Cienc. Marinas 35 (4), 389–403. doi: 10.7773/cm.v35i4.1622
Close H. G., Henderson L. C. (2020). Open-Ocean Minima in δ13c Values of Particulate Organic Carbon in the Lower Euphotic Zone. Front. Mar. Sci. 7, 540165. doi: 10.3389/fmars.2020.540165
Combres C., Laliberte G., Reyssac J. S., Noue J. (1994). Effect of Acetate on Growth and Ammonium Uptake in the Microalga Scenedesmus Obliquus. Physiol. Plant 91, 729–734. doi: 10.1111/j.1399-3054.1994.tb03012.x
Di Capua F., Pirozzi F., Lens P. N. L., Esposito G. (2019). Electron Donors for Autotrophic Denitrification. Chem. Eng. J. 362, 922–937. doi: 10.1016/j.cej.2019.01.069
Fauque G. D. (1995). “Ecology of Sulfate-Reducing Bacteria,” in Sulfate-Reducing Bacteria (Boston, MA: Springer US), 217–241. doi: 10.1007/978-1-4899-1582-5_8
Freeman K. H. (2001). “11. Isotopie Biogeochemistry of Marine Organic Carbon,” in Stable Isotope Geochemistry, vol. 43 . Eds. Valley J. W., Cole D. R. (Berlin: De Gruyter), 579–606). doi: 10.1515/9781501508745-014
Fry B., Sherr E. B. (1989). “δ13c Measurements as Indicators of Carbon Flow in Marine and Freshwater Ecosystems,” in Stable Isotopes in Ecological Research, eds. Rundel P. W., Ehleringer J. R., Nagy K. A. (New York, NY: Springer), 196–229. doi: 10.1007/978-1-4612-3498-2_12
Ganesh S., Bristow L. A., Larsen M., Sarode N., Thamdrup B., Stewart F. J. (2015). Size-Fraction Partitioning of Community Gene Transcription and Nitrogen Metabolism in A Marine Oxygen Minimum Zone. ISME J. 9, 2682–2696. doi: 10.1038/ismej.2015.44
Garcia-Robledo E., Padilla C. C., Aldunate M., Stewart F. J., Ulloa O., Paulmier A., et al. (2017). Cryptic Oxygen Cycling in Anoxic Marine Zones. Proc. Natl. Acad. Sci. 114, 8319–8324. doi: 10.1073/pnas.1619844114
Gilly W. F., Michael Beman J., Litvin S. Y., Robison B. H. (2013). Oceanographic and Biological Effects of Shoaling of the Oxygen Minimum Zone. Annu. Rev. Mar. Sci. 5, 393–420. doi: 10.1146/annurev-marine-120710-100849
Godrijan J., Drapeau D., Balch W. M. (2020). Mixotrophic Uptake of Organic Compounds by Coccolithophores. Limnol. Oceanogr. 11396, 1410–1421. doi: 10.1002/lno.11396
Goericke R., Olson R. J., Shalapyonok A. (2000). A Novel Niche for Prochlorococcus Sp. In the Low-Light Suboxic Envrionrments in the Arabian Sea and the Eastern Tropical North Pacific. Deep-Sea Res. I 47 (7), 1183–1205. doi: 10.1016/S0967-0637(99)00108-9
Gómez-Baena G., López-Lozano A., Gil-Martínez J., Lucena J. M., Diez J., Candau P., et al. (2008). Glucose Uptake and Its Effect on Gene Expression in Prochlorococcus. PloS One 3, e3416. doi: 10.1371/journal.pone.0003416
Hansman R. L., Sessions A. L. (2016). Measuring the in Situ Carbon Isotopic Composition of Distinct Marine Plankton Populations Sorted by Flow Cytometry. Limnol. Oceanogr.: Methods 14 (2), 87–99. doi: 10.1002/lom3.10073
Hayes J. M. (2001). Fractionation of Carbon and Hydrogen Isotopes in Biosynthetic Processes. Rev. Mineral. Geochem. 43, 225–277. doi: 10.2138/gsrmg.43.1.225
Ho T.-Y., Scranton M. I., Taylor G. T., Varela R., Thunell R. C., Muller-Karger F. (2002). Acetate Cycling in the Water Column of the Cariaco Basin: Seasonal and Vertical Variability and Implication for Carbon Cycling. Limnol. Oceanogr. 47, 1119–1128. doi: 10.4319/lo.2002.47.4.1119
Holmes R. M., Aminot A., Kérouel R., Hooker B. A., Peterson B. J. (1999). A Simple and Precise Method For Measuring Ammonium in Marine and Freshwater Ecosystems. Can. J. Fish. Aquat. Sci. 56, 1801–1808. doi: 10.1139/f99-128
House C. H., Schopf J. W., Stetter K. O. (2003). Carbon Isotopic Fractionation by Archaeans and Other Thermophilic Prokaryotes. Organic Geochemistry 34 (3), 345–356. doi: 10.1016/S0146-6380(02)00237-1
Hügler M., Sievert S. M. (2011). Beyond the Calvin Cycle: Autotrophic Carbon Fixation in the Ocean. Annu. Rev. Mar. Sci. 3 (1), 261–289. doi: 10.1146/annurev-marine-120709-142712
Ihlenfeldt M. J. A., Gibson J. (1977). Acetate Uptake by the Unicellular Cyanobacteria Synechococcus and Aphanocapsa. Arch. Microbiol. 113, 231–241. doi: 10.1007/BF00492030
Ingram L. O., Calder J. A., Van Baalen C., Plucker F. E., Parker P. L. (1973). Role of Reduced Exogenous Organic Compounds in the Physiology of the Blue-Green Bacteria (Algae): Photoheterotrophic Growth of a “Heterotrophic” Blue-Green Bacterium. J. Bacteriol. 114, 695–700. doi: 10.1128/JB.114.2.695-700.1973
Könneke M., Lipp J. S., Hinrichs K.-U. (2012). Carbon Isotope Fractionation by the Marine Ammonia-Oxidizing Archaeon Nitrosopumilus Maritimus. Org. Geochem. 48, 21–24. doi: 10.1016/j.orggeochem.2012.04.007
Kristensen E., Ahmed S. I., Devol A. H. (1995). Aerobic and Anaerobic Decomposition of Organic Matter in Marine Sediment: Which is Fastest? Limnol. Oceanogr. 40, 1430–1437. doi: 10.4319/lo.1995.40.8.1430
Lavin P., González B., Santibáñez J. F., Scanlan D. J., Ulloa O. (2010). Novel Lineages of Prochlorococcus Thrive Within the Oxygen Minimum Zone of the Eastern Tropical South Pacific. Environ. Microbiol. Rep. 2, 728–738. doi: 10.1111/j.1758-2229.2010.00167.x
Liang Y., Sarkany N., Cui Y. (2009). Biomass and Lipid Productivities of Chlorella Vulgaris Under Autotrophic, Heterotrophic and Mixotrophic Growth Conditions. Biotechnol. Lett. 31, 1043–1049. doi: 10.1007/s10529-009-9975-7
Molina V., Farías L. (2009). Aerobic Ammonium Oxidation in the Oxycline and Oxygen Minimum Zone of the Eastern Tropical South Pacific Off Northern Chile (∼20°s). Deep Sea Res. Part II: Topical Stud. Oceanogr. 56 (16), 1032–1041. doi: 10.1016/j.dsr2.2008.09.006
Monson K. D., Hayes J. (1982). Carbon Isotopic Fractionation in the Biosynthesis of Bacterial Fatty Acids. Ozonolysis of Unsaturated Fatty Acids as a Means of Determining the Intramolecular Distribution of Carbon Isotopes. Geochim. Cosmochim. Acta 46, 139–149. doi: 10.1016/0016-7037(82)90241-1
Moore L. R., Chisholm S. W. (1999). Photophysiology of the Marine Cyanobacterium Prochlorococcus: Ecotypic Differences Among Cultured Isolates. Limnol. Oceanogr. 44, 628–638. doi: 10.4319/lo.1999.44.3.0628
Muñoz-Marín M., del C., Duhamel S., Björkman K. M., Magasin J. D., Díez J., et al. (2021). Differential Timing for Glucose Assimilation in Prochlorococcus and Coexistent Microbial Populations at the North Pacific Subtropical Gyre. BioRxiv, 1–45. doi: 10.1101/2021.10.04.462702
Podlaska A., Wakeham S. G., Fanning K. A., Taylor G. T. (2012). Microbial Community Structure and Productivity in the Oxygen Minimum Zone of the Eastern Tropical North Pacific. Deep Sea Res. Part I Oceanogr. Res. Pap. 66, 77–89. doi: 10.1016/j.dsr.2012.04.002
Preuß A., Schauder R., Fuchs G., Stichler W. (1989). Carbon Isotope Fractionation by Autotrophic Bacteria With Three Different C02 Fixation Pathways. Z. Für Naturforschung C 44 (5–6), 397–402. doi: 10.1515/znc-1989-5-610
Raven J. A. (2009). Contributions of Anoxygenic and Oxygenic Phototrophy and Chemolithotrophy to Carbon and Oxygen Fluxes in Aquatic Environments. Aquat. Microb. Ecol. 56 (2–3), 177–192. doi: 10.3354/ame01315
Reid W. D. K., Sweeting C. J., Wigham B. D., Zwirglmaier K., Hawkes J. A., McGill R. A. R., et al. (2013). Spatial Differences in East Scotia Ridge Hydrothermal Vent Food Webs: Influences of Chemistry, Microbiology and Predation on Trophodynamics. PloS One 8 (6), e65553. doi: 10.1371/journal.pone.0065553
Revsbech N. P., Larsen L. H., Gundersen J., Dalsgaard T., Ulloa O., Thamdrup B. (2009). Determination of Ultra-Low Oxygen Concentrations in Oxygen Minimum Zones by the STOX Sensor. Limnol. Oceanogr. Methods 7, 371–381. doi: 10.4319/lom.2009.7.371
Rich J. H., Ducklow H. W., Kirchman D. L. (1996). Concentrations and Uptake of Neutral Monosaccharides Along 140°W in the Equatorial Pacific: Contribution of Glucose to Heterotrophic Bacterial Activity and the DOM Flux. Limnol. Oceanogr. 41, 595–604. doi: 10.4319/lo.1996.41.4.0595
Roslev P., Larsen M. B., Jørgensen D., Hesselsoe M. (2004). Use of Heterotrophic CO2 Assimilation as a Measure of Metabolic Activity in Planktonic and Sessile Bacteria. J. Microbiol. Methods 59 (3), 381–393. doi: 10.1016/j.mimet.2004.08.002
Ruby E. G., Jannasch H. W., Deuser W. G. (1987). Fractionation of Stable Carbon Isotopes During Chemoautotrophic Growth of Sulfur-Oxidizing Bacteria. Appl. Environ. Microbiol. 53, 1940–1943. doi: 10.1128/aem.53.8.1940-1943.1987
Ruiz-Fernández P., Ramírez-Flandes S., Rodríguez-León E., Ulloa O. (2020). Autotrophic Carbon Fixation Pathways Along the Redox Gradient in Oxygen-Depleted Oceanic Waters. Environ. Microbiol. Rep. 12 (3), 334–341. doi: 10.1111/1758-2229.12837
Sansone F. J. (1986). Depth Distribution of Short-Chain Organic Acid Turnover in Cape Lookout Bight Sediments. Geochim. Cosmochim. Acta 50, 99–105. doi: 10.1016/0016-7037(86)90052-9
Schouten S., Strous M., Kuypers M. M. M., Rijpstra W. I. C., Baas M., Schubert C. J., et al. (2017). Stable Carbon Isotopic Fractionations Associated With Inorganic Carbon Fixation by Anaerobic Ammonium-Oxidizing Bacteria. Appl. Environ. Microbiol. 70, 3785–3788. doi: 10.1128/AEM.70.6.3785
Schunck H., Lavik G., Desai D. K., Großkopf T., Kalvelage T., Löscher C. R., et al. (2013). Giant Hydrogen Sulfide Plume in the Oxygen Minimum Zone Off Peru Supports Chemolithoautotrophy. PloS One 8 (8), e68661. doi: 10.1371/journal.pone.0068661
Slawyk G., Collos Y., Auclair J.-C. (1977). The Use of the 13 C and 15 N Isotopes for the Simultaneous Measurement of Carbon and Nitrogen Turnover Rates in Marine Phytoplankton1. Limnol. Oceanogr. 22, 925–932. doi: 10.4319/lo.1977.22.5.0925
Stevens H., Ulloa O. (2008). Bacterial Diversity in the Oxygen Minimum Zone of the Eastern Tropical South Pacific. Environ. Microbiol. 10, 1244–1259. doi: 10.1111/j.1462-2920.2007.01539.x
Stewart F. J., Ulloa O., DeLong E. F. (2012). Microbial Metatranscriptomics in a Permanent Marine Oxygen Minimum Zone. Environ. Microbiol. 14, 23–40. doi: 10.1111/j.1462-2920.2010.02400.x
Stramma L., Johnson G. C., Sprintall J., Mohrholz V. (2008). Expanding Oxygen-Minimum Zones in the Tropical Oceans. Science 320 (5876), 655–658. doi: 10.1126/science.1153847
Thamdrup B., Dalsgaard T., Revsbech N. P. (2012). Widespread Functional Anoxia in the Oxygen Minimum Zone of the Eastern South Pacific. Deep Sea Res. Part I Oceanogr. Res. Pap. 65, 36–45. doi: 10.1016/j.dsr.2012.03.001
Ulloa O., Canfield D. E., DeLong E. F., Letelier R. M., Stewart F. J. (2012). Microbial Oceanography of Anoxic Oxygen Minimum Zones. Proc. Natl. Acad. Sci. 109, 15996–16003. doi: 10.1073/pnas.1205009109
Ulloa O., Henríquez-Castillo C., Ramírez-Flandes S., Plominsky A. M., Murillo A. A., Morgan-Lang C., et al. (2021). The Cyanobacterium Prochlorococcus has Divergent Light-Harvesting Antennae and may Have Evolved in a Low-Oxygen Ocean. Proc. Natl. Acad. Sci. 118 (11), e2025638118. doi: 10.1073/pnas.2025638118
Van Wambeke F., Gimenez A., Duhamel S., Dupouy C., Lefevre D., Pujo-Pay M., et al. (2018). Dynamics and Controls of Heterotrophic Prokaryotic Production in the Western Tropical South Pacific Ocean: Links With Diazotrophic and Photosynthetic Activity. Biogeosciences 15, 2669–2689. doi: 10.5194/bg-15-2669-2018
Vargas C. A., Cantarero S. I., Sepúlveda J., Galán A., De Pol-Holz R., Walker B., et al. (2021). A Source of Isotopically Light Organic Carbon in a low-pH Anoxic Marine Zone. Nat. Commun. 12 (1), 1604. doi: 10.1038/s41467-021-21871-4
Wu H., Green M., Scranton M. I. (1997). Acetate Cycling in the Water Column and Surface Sediment of Long Island Sound Following a Bloom. Limnol. Oceanogr. 42, 705–713. doi: 10.4319/lo.1997.42.4.0705
Yan R., Zhu D., Zhang Z., Zeng Q., Chu J. (2012). Carbon Metabolism and Energy Conversion of Synechococcus Sp. PCC 7942 Under Mixotrophic Conditions: Comparison With Photoautotrophic Condition. J. Appl. Phycol. 24, 657–668. doi: 10.1007/s10811-011-9683-2
Zhang S., Bryant D. A. (2015). Biochemical Validation of the Glyoxylate Cycle in the Cyanobacterium Chlorogloeopsis Fritschii Strain PCC 9212. J. Biol. Chem. 290, 14019–14030. doi: 10.1074/jbc.M115.648170
Keywords: autotrophy, secondary chlorophyll maximum, oxygen minimum zones, anoxia, Prochlorococcus, heterotrophy
Citation: Aldunate M, von Dassow P, Vargas CA and Ulloa O (2022) Carbon Assimilation by the Picoplanktonic Community Inhabiting the Secondary Chlorophyll Maximum of the Anoxic Marine Zones of the Eastern Tropical North and South Pacific. Front. Mar. Sci. 9:858308. doi: 10.3389/fmars.2022.858308
Received: 19 January 2022; Accepted: 19 April 2022;
Published: 19 May 2022.
Edited by:
Syed WajihAhmad Naqvi, Indian Institute of Technology Kanpur, IndiaReviewed by:
J Michael Beman, University of California, Merced, United StatesDouglas Andrew Campbell, Mount Allison University, Canada
Mangesh Uttam Gauns, Council of Scientific and Industrial Research (CSIR), India
Copyright © 2022 Aldunate, von Dassow, Vargas and Ulloa. This is an open-access article distributed under the terms of the Creative Commons Attribution License (CC BY). The use, distribution or reproduction in other forums is permitted, provided the original author(s) and the copyright owner(s) are credited and that the original publication in this journal is cited, in accordance with accepted academic practice. No use, distribution or reproduction is permitted which does not comply with these terms.
*Correspondence: Montserrat Aldunate, bW9udHNlcnJhdC5hbGR1bmF0ZUBpbW8tY2hpbGUuY2w=
†Present address: Montserrat Aldunate, Coastal Ecosystems & Global Environmental Change Lab (ECCALab), Department of Aquatic Systems, Faculty of Environmental Sciences, Universidad de Concepción, Concepción, Chile & Millennium Institute of Oceanography (IMO), University of Concepción, Concepción, Chile