 Alberto Dallolio
 Helge B. Bjerck2
 Henning A. Urke
 Jo A. Alfredsen
- 1Center for Autonomous Marine Operations and Systems, Department of Engineering Cybernetics, Norwegian University of Science and Technology, Trondheim, Norway
- 2Faculty of Biosciences and Aquaculture, Nord University, Bodø, Norway
- 3INAQ AS, Trondheim, Norway
Over the last few decades, acoustic fish telemetry has developed into a viable approach for remote monitoring of fish behaviour in the marine environment. Simultaneously, unmanned surface and underwater vehicles have found extensive use as scalable, persistent and cost-effective platforms for ocean observation. Equipping such robotic vehicles with fish telemetry receivers constitutes an emerging approach with the potential to significantly push the current operational limits of fish movement studies at sea. Here, we present an energy-autonomous robotic fish telemetry platform realised through the integration of a real-time acoustic receiver into an ocean-going wave- and solar-powered unmanned surface vehicle. The vehicle frame and energy harvesting solutions are based on the commercially available AutoNaut USV, while the vehicle’s control and communication systems were developed using open-source software and standard hardware components. The open architecture permitted deep integration of the acoustic receiver as a system-level payload making fish detections and other sensor data available in real-time to the vehicle’s onboard control system. The vehicle is thus prepared with local situational awareness to support autonomous control during vehicle-fish encounters, as well as conventional interfaces for remote piloting and data management through long-range wireless communication links and the Internet. The vehicle concept was investigated theoretically and experimentally in an acoustic range test and a full-scale sea trial. When driven passively by waves, tag detection performance was comparable to that of traditional moored receivers, while activation of the auxiliary electric thruster caused a reduction in detection radius of more than 50%, confirming wave-power as the ideal mode of propulsion. Finally, by deploying the AutoNaut over a period of several days at the outskirts of a Norwegian fjord during the seaward migration of Atlantic salmon post-smolts, we demonstrated that the vehicle was able to detect an acoustically tagged post-smolt into the open ocean beyond the reach of the fjord’s stationary receiver grid, while using only wave- and solar energy harvesting to power its operation. The ability to observe small individual fish in the ocean environment using an energy-autonomous robotic vehicle creates novel and unprecedented opportunities for scientific inquiry in fish behaviour and movement ecology studies at sea.
1 Introduction
Fish movement and migration are essential mechanisms for the productivity and health of ocean ecosystems and, consequently, for the sustenance and livelihoods of people and communities around the world (Albouy et al., 2019). Fish migrations are remarkable natural phenomena that have intrigued humans for millennia, and the quest to understand them has developed into an area of vigorous scientific inquiry (Leggett, 1977; Secor, 2015; Morais and Daverat, 2016). In a time of unprecedented anthropogenic pressures on the oceans (Halpern et al., 2015), knowledge on how fish move and distribute over different scales of space and time, how they interact with their biophysical environment, and how this affects their reproduction and survival is of crucial interest and plays an essential role in developing and implementing well-advised ocean management and conservation strategies (Lewison et al., 2015; Allen and Singh, 2016). Central to research in this area is our ability to make observations of fish movement of sufficient quality and quantity on relevant temporal and spatial scales. However, the opacity, inaccessibility, and the sheer vastness of the ocean render the pursuit of such observations a far from trivial task.
Driven by rapid advances in microelectronics and sensor technology, acoustic fish telemetry has recently developed into a viable approach for acquiring remote observations of the behaviour of free-ranging fish in the marine environment (Donaldson et al., 2014; Hussey et al., 2015; Lennox et al., 2017). When attached to or implanted into a fish, an acoustic transmitter tag enables remote underwater detection of a fish’s presence and identity at ranges typically < 1 km using a matching acoustic receiver. Detection range depends on the tag’s power output and carrier frequency, receiver sensitivity and the intrinsic properties of the acoustic channel, while its operating life ranges from days to years depending on transmitter power level, signal modulation and battery capacity (Pincock and Johnston, 2012). The growing availability of miniature low-power microelectronic sensors and their integration into tags has further paved the way for acoustic sensor transmitters that allow remote sensing of physiological (e.g., heart rate, respiration and tailbeat frequency) and ambient physical variables (e.g., temperature, salinity and water depth) pertaining to the fish, providing physiological and environmental context for a plausible eco-physiological interpretation of fish movements (Wilmers et al., 2015).
Successive detections of a tagged fish at different receiver locations make it possible to establish a chronological account of a fish’s movement pattern. Depending on the configuration of the receiver system, a single transmission may also permit fine-scale localisation of the fish in two or three dimensions (Baktoft et al., 2017). The acoustic receiver thus comprises the inseparable and essential second half of a telemetry system as its performance and placement, together with the transmitter and the channel characteristics, jointly determine the probability of making detections. Although active (mobile) tracking of fish is regularly used and serves as a viable option in many scenarios (Mitamura et al., 2017), the advent of cost-effective automatic monitoring receivers has made it feasible to deploy entire systems of moored receivers (often referred to as passive acoustic telemetry) that enable continuous year-round monitoring of aquatic habitats over a wide span of geographical scopes (Hussey et al., 2015). Such stationary receiver systems are typically organised as clusters of transects (Jackson, 2011; Chaput et al., 2018) or arrays (Simpfendorfer et al., 2002; Hedger et al., 2008; Kraus et al., 2018), or in less regular structures, e.g., focusing on monitoring of specific landmarks or bottlenecks where the fish are expected to dwell or pass (Urke et al., 2013).
Apart from the information obtained from being non-present, acoustic transmitters residing beyond the detection range of receivers for prolonged periods of time are obviously of limited value. The data yield, and ultimately the scientific outcome of telemetry studies, is thus inherently linked to receiver-side design parameters, such as the number of receivers used, how they are distributed in space and time, as well as their technical performance (e.g., sensitivity, bandwidth, operational life). The number of receivers that can be deployed in a passive telemetry system is usually subject to practical and economic constraints and cannot scale cost-effectively with the size of the target area to make complete coverage a realistic option in many studies. Optimal placement and configuration of receiver transects and arrays with respect to detection probability have been investigated and established (Welch et al., 2002; Steckenreuter et al., 2017; Kraus et al., 2018). However, the risk of low detection rates and location biases in movement data will necessarily increase with a decreasing ratio of receivers to the size of the sample area.
Over the last few decades, sea-going unmanned surface and underwater vehicles (USVs and UUVs) have found widespread use as flexible, persistent and cost-effective platforms for ocean observation (Whitt et al., 2020). The idea of equipping such robotic vehicles with fish telemetry receivers represents an emerging approach with the potential to significantly advance the current operational limits of fish movement studies (Eiler et al., 2013). Such mobile receiver platforms may operate independently or as additional resources to mitigate coverage issues and to consolidate passive receiver systems. Moreover, the ability to dynamically relocate receiver resources to areas of particular interest or high activity will make adaptive sampling strategies possible, which could in turn optimise coverage and increase data yield (Fossum, 2019). Adaptive sampling requires (near) real-time availability of detection data in a networked system of stationary and mobile receivers, and although not common in passive acoustic telemetry yet, real-time solutions for these systems have been demonstrated and used in several studies (Hassan et al., 2019; Yang et al., 2019). USVs and UUVs will usually include one or more long-range telecommunication links for remote monitoring and control purposes, either through satellite, cellular or other proprietary services. Using these communication capabilities during fish tracking experiments will increase situational awareness and facilitate a more agile approach to the planning and management of such experiments. Robotic ocean observing platforms also come with the additional benefit of producing simultaneous high-resolution measurements of the proximal ocean environment. These platforms typically carry with them a range of sensors for essential ocean variables, such as sea temperature, water quality parameters, water currents, chlorophyll, plankton and fish aggregations (Whitt et al., 2020). These data would otherwise require dedicated resources and can be hard to obtain with sufficient temporal and spatial resolution when fish actually reside within a particular area, despite being key information for interpreting and understanding the movement patterns of fish.
An increasing number of studies have been reported over the last few years where unmanned marine vehicles have been employed in acoustic fish telemetry studies. With their ability to dive directly into the fish habitat and survey deeper waters, underwater vehicles of various designs so far appear to be the most commonly used vehicle type for carrying acoustic receivers (Grothues et al., 2008; Oliver M. et al., 2013; Lin et al., 2017; Ennasr et al., 2020; Masmitja et al., 2020). Autonomous underwater vehicles (AUVs) with electric thrusters are relatively fast and have field-proven capabilities of detecting and localising acoustically tagged fish (Clark et al., 2013; Eiler et al., 2013; Eiler et al., 2019), but onboard energy resources strictly constrain mission times for these platforms, and they often require proximity to ship or shore for communication and navigational assistance. However, the integration of acoustic receivers into underwater gliders that feature an energy-efficient buoyancy-driven propulsion mechanism mitigates this energy limitation to a large extent and enables long-term unassisted fish tracking missions even in remote oceanic regions (Oliver M. et al., 2013; Haulsee et al., 2015; Oliver et al., 2017). On the other hand, underwater gliders are relatively slow and can experience large offsets in position due to sea currents, which can cause challenges with manoeuvring in shallower and more confined waters. Like underwater gliders, surface gliders are less constrained by onboard energy limitations with respect to propulsion, but can, in addition, carry a more extensive sensor suite, harvest solar and wind energy for powering of payload and auxiliary propulsion, and can, unlike underwater vehicles, keep telecommunication links operational and uninterrupted throughout missions due to their continuous surface access. These properties make surface gliders an interesting option as mobile long-endurance robotic receiver platforms in acoustic telemetry studies, and the utility and performance of such platforms have been explored and demonstrated in several recent studies using the Liquid Robotics Wave Glider (Carlon, 2015; Cimino et al., 2018; Cote et al., 2019).
This article presents a technical solution where a real-time acoustic receiver is integrated as a system-level payload on an alternative surface glider platform, the wave-propelled USV AutoNaut, essentially creating an energy autonomous robotic fish telemetry platform. The deep integration of the receiver within the control and telecommunication system of the USV provides real-time transmission of fish detections to an operator for remote piloting of the vehicle, and prepares the vehicle itself for increased situational awareness and autonomous control during vehicle-fish encounters. The vehicle’s capacity to detect a small acoustic fish tag at different ranges and propulsion modes is investigated through a field trial, and the resulting detection probability for different vehicle-fish “sail-by” scenarios is estimated through simulations. Finally, we provide a proof-of-concept study where the AutoNaut was deployed in a Norwegian fjord during the seaward migration of Atlantic salmon post-smolts and demonstrate that the vehicle was able to detect a tagged smolt at the fringe of the open ocean beyond the reach of the fjord’s stationary receiver grid.
2 Materials and Methods
In this section we discuss the integration of the TBLive, a real-time acoustic fish telemetry receiver, into the instrument payload onboard the AutoNaut, a wave-propelled unmanned surface vehicle (USV) designed for long-duration ocean observation missions. During normal operations when waves propel the vehicle, the AutoNaut is a silent platform. This makes it well-suited for the application considered in this work where acoustic noise levels need to be kept low in order to optimise hydrophone performance and fish detection capabilities. Moreover, the USV’s autonomy and long-endurance capabilities make its employment suited for the study of slowly evolving, yet spatially and temporally extensive processes such as the migration of salmon post-smolts and other fish of moderate size, as demonstrated in this article.
2.1 The AutoNaut
The AutoNaut1 is a commercially available unmanned surface vehicle normally produced and supplied with a proprietary control and communication system (Johnston and Poole, 2017). In this work, we employed a 5 meter long version of the AutoNaut in which payload control, navigation and communication systems are developed by the Norwegian University of Science and Technology (NTNU) with a publicly available hardware and software architecture2 based on the DUNE unified navigation environment (Pinto et al., 2013), as described in Dallolio et al. (2019).
The AutoNaut USV carries an innovative propulsion system that relies on sea surface waves to produce forward thrust (see Figure 1), making it suitable for sustained operations at sea without human assistance. The ground speed of the vehicle is mainly determined by waves and normally reaches 0.5 to 3 knots, although drifting forces generated by winds and sea currents may under certain circumstances degrade speed and impact navigation performance (Dallolio et al., 2022). The USV’s heading is governed by an electric stern rudder powered by an onboard battery bank. A set of three solar panels supplying up to 300 W allows continuous energy harvesting and recharging of the battery bank, extending vehicle autonomy to several weeks. Unlike common robotic marine platforms, the AutoNaut is therefore less constrained by the energy limitations that normally affect propulsion and payload usage, ensuring long-duration autonomous missions. The USV is also equipped with an ancillary electric stern thruster that can be used to increase maneuverability or provide propulsion in calm weather conditions. The thruster introduces, however, acoustic noise that deteriorates hydrophone performance and reduces the probability of detecting tagged fish (Figure 5).
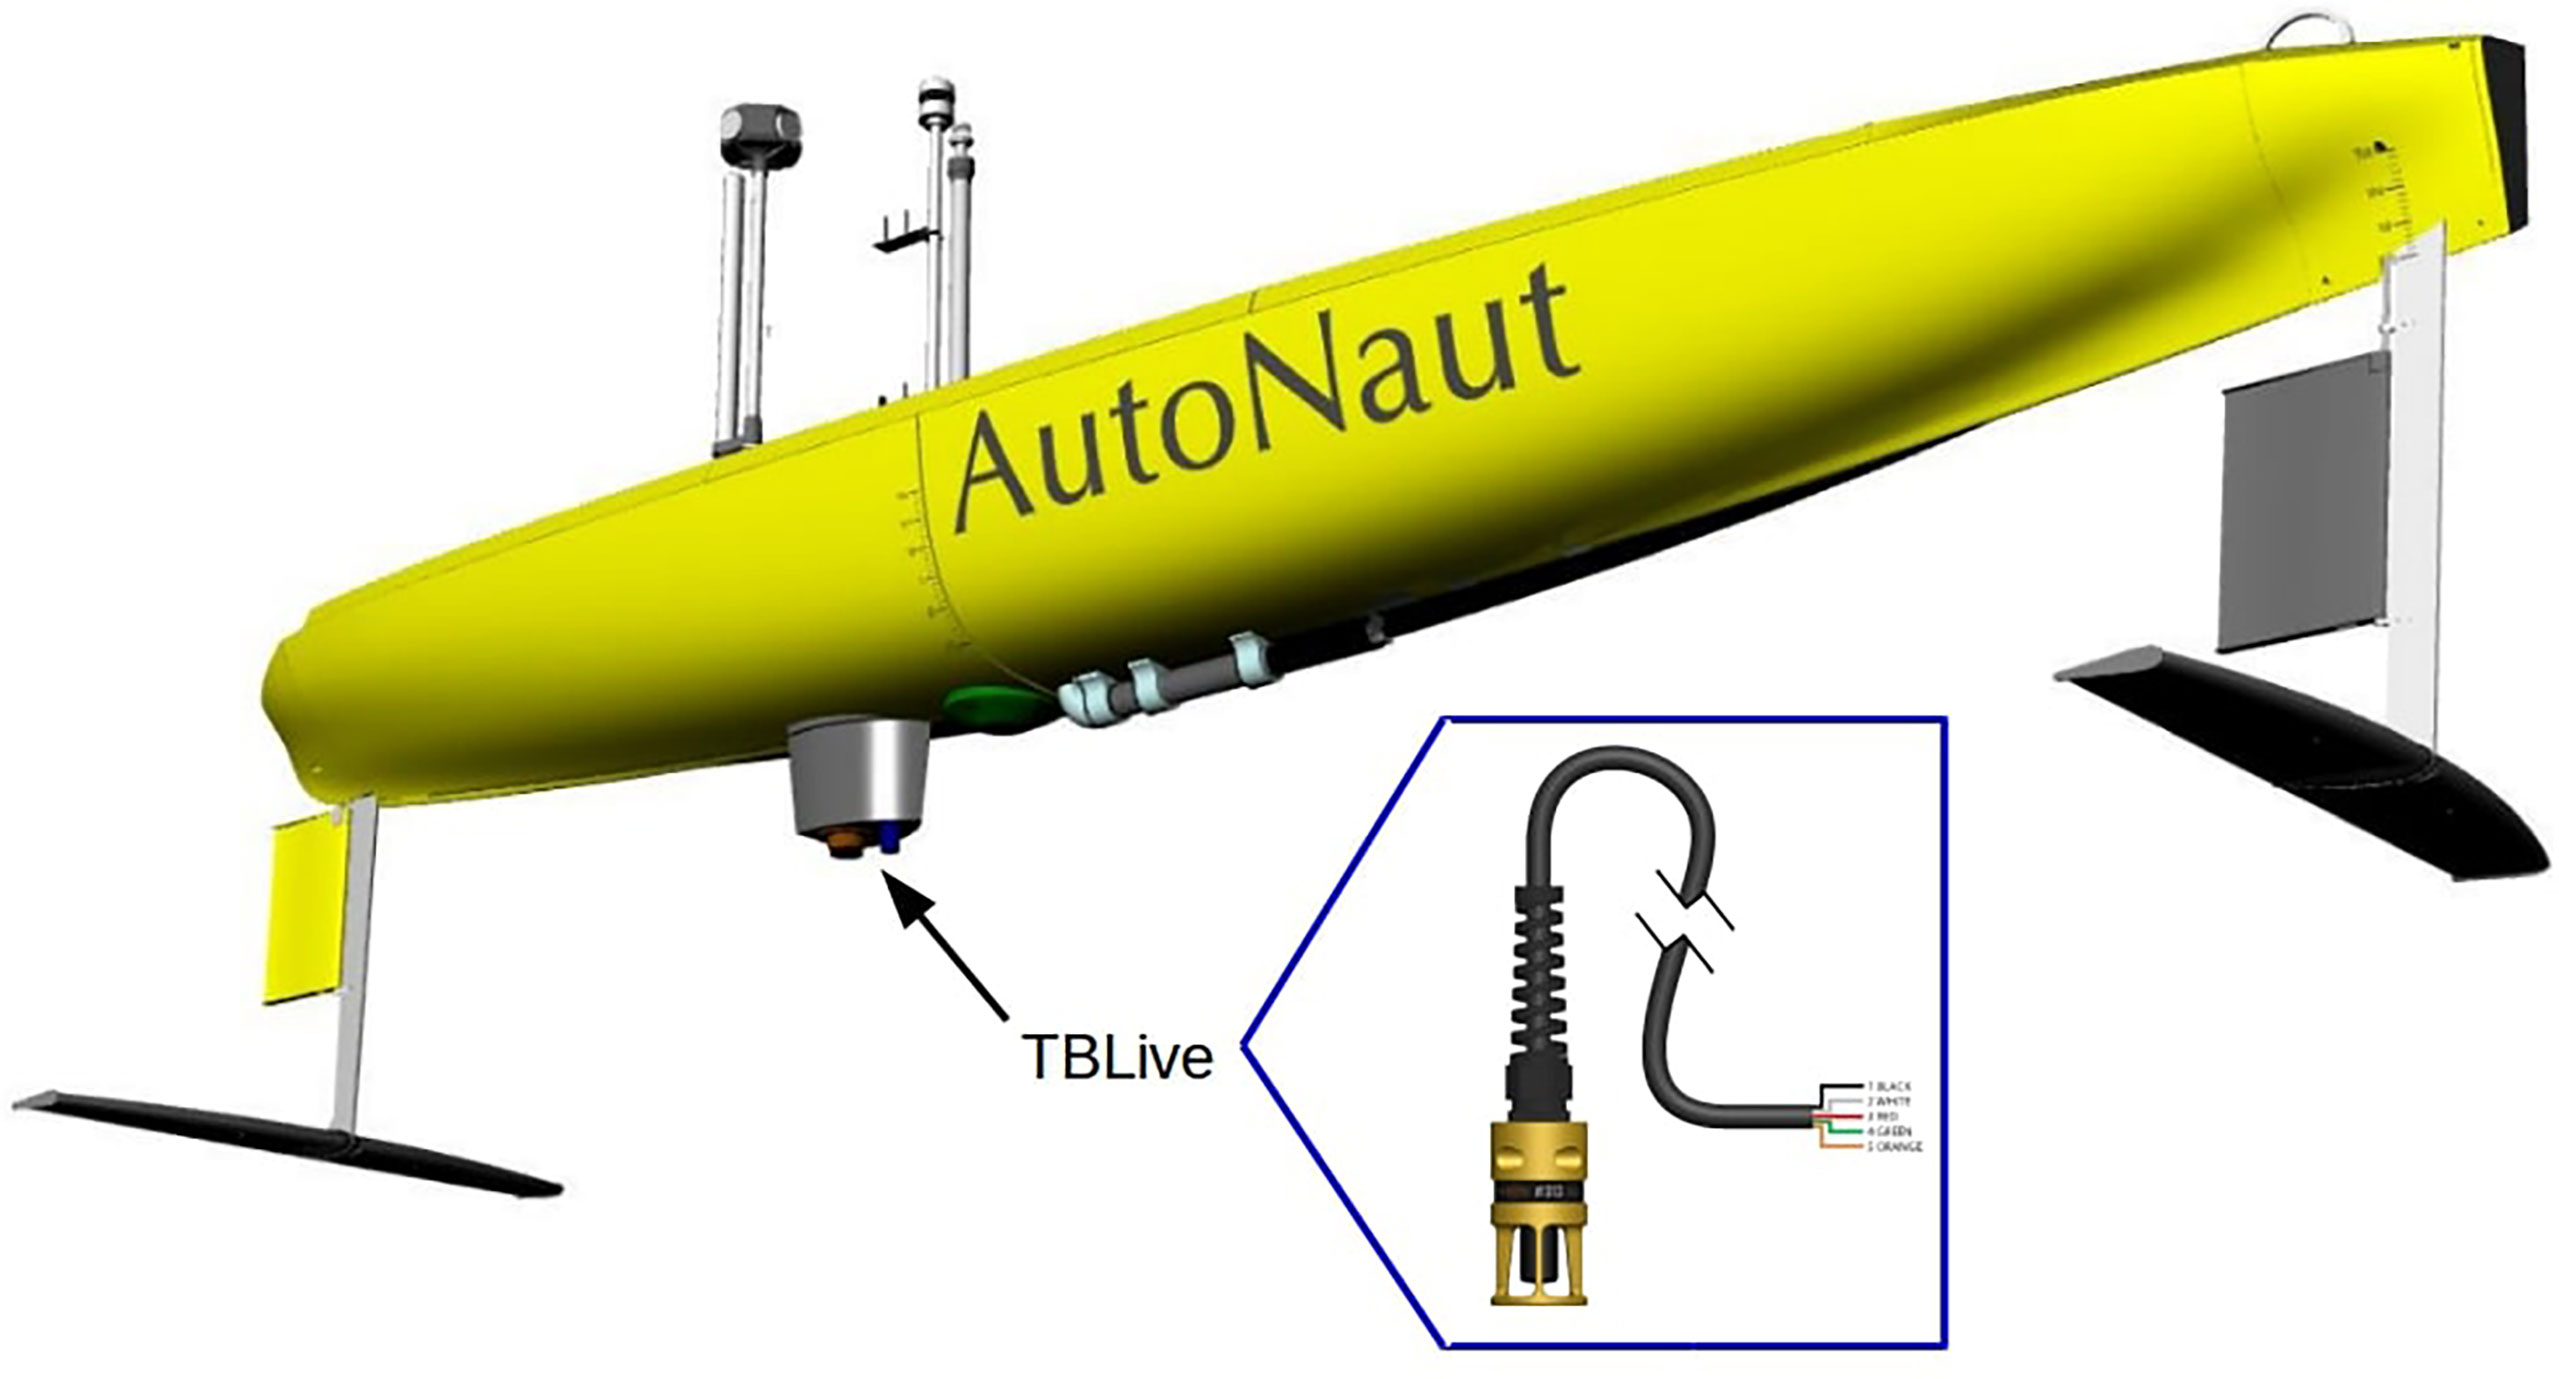
Figure 1 3D model of the AutoNaut USV showing the underwater wave foil propulsion system and the sensor payload connected to the hull and the keel. The acoustic receiver TBLive (inset) is mounted to the end of the protruded instrument keel at 50 cm depth.
2.2 Integration of Acoustic Receiver
2.2.1 Receiver Specifications
The acoustic fish telemetry receiver used in this work is the TBLive3 (Thelma Biotel AS4, Trondheim, Norway), a digital multi-channel receiver for detection of acoustic tags in the frequency range 63 - 77 kHz (see Figure 1). The unit features a cabled RS-485 real-time communication interface and a time pulse input from a GNSS source for precise high-resolution time-stamping of tag detections. The TBLive runs a proprietary software on an advanced digital signal processing unit. The processing algorithm dynamically tries to maintain high acoustic performance even in noisy environments and further reduces signal collision events by singling out the strongest when multiple signals are present. In addition to its main task of decoding R-coded acoustic tag detections (Pincock and Johnston, 2012) and sending these in real-time over its communication interface, the receiver provides measurements of background noise level and water temperature. The receiver consumes less than 45 mW of power depending on the number of channels monitored.
2.2.2 Physical Integration
As described in Dallolio et al. (2019), the vehicle carries a heterogeneous scientific payload that collects information about a wide range of environmental variables. The receiver is installed on the 27 cm long vertical keel near the longitudinal centre of the vehicle in order to maximise the distance between the sensor and the sea surface and hence decrease the potential noise effects due to proximity to the boundary layer. The keel also hosts an Optode4835 oxygen sensor5 and an ECO Puck Triplet6. Whereas the latter measures light scattering and fluorescence to determine primary production features of the upper water column, the former provides information about the oxygen concentration based on fluorescence quenching. Both are optical instruments and are thus not expected to interfere with the hydrophone measurements, despite being tightly integrated at the end of the instrument keel. The TBLive also protrudes 6 cm deeper than the other two sensors to ensure an unobstructed acoustic path to the hydrophone. The TBLive power and communication cable is terminated to a wet-mateable SubConn bulkhead connector that penetrates the hull inside the base of the instrument keel and provides connection to the AutoNaut’s scientific payload control unit, as depicted in Figure 2.
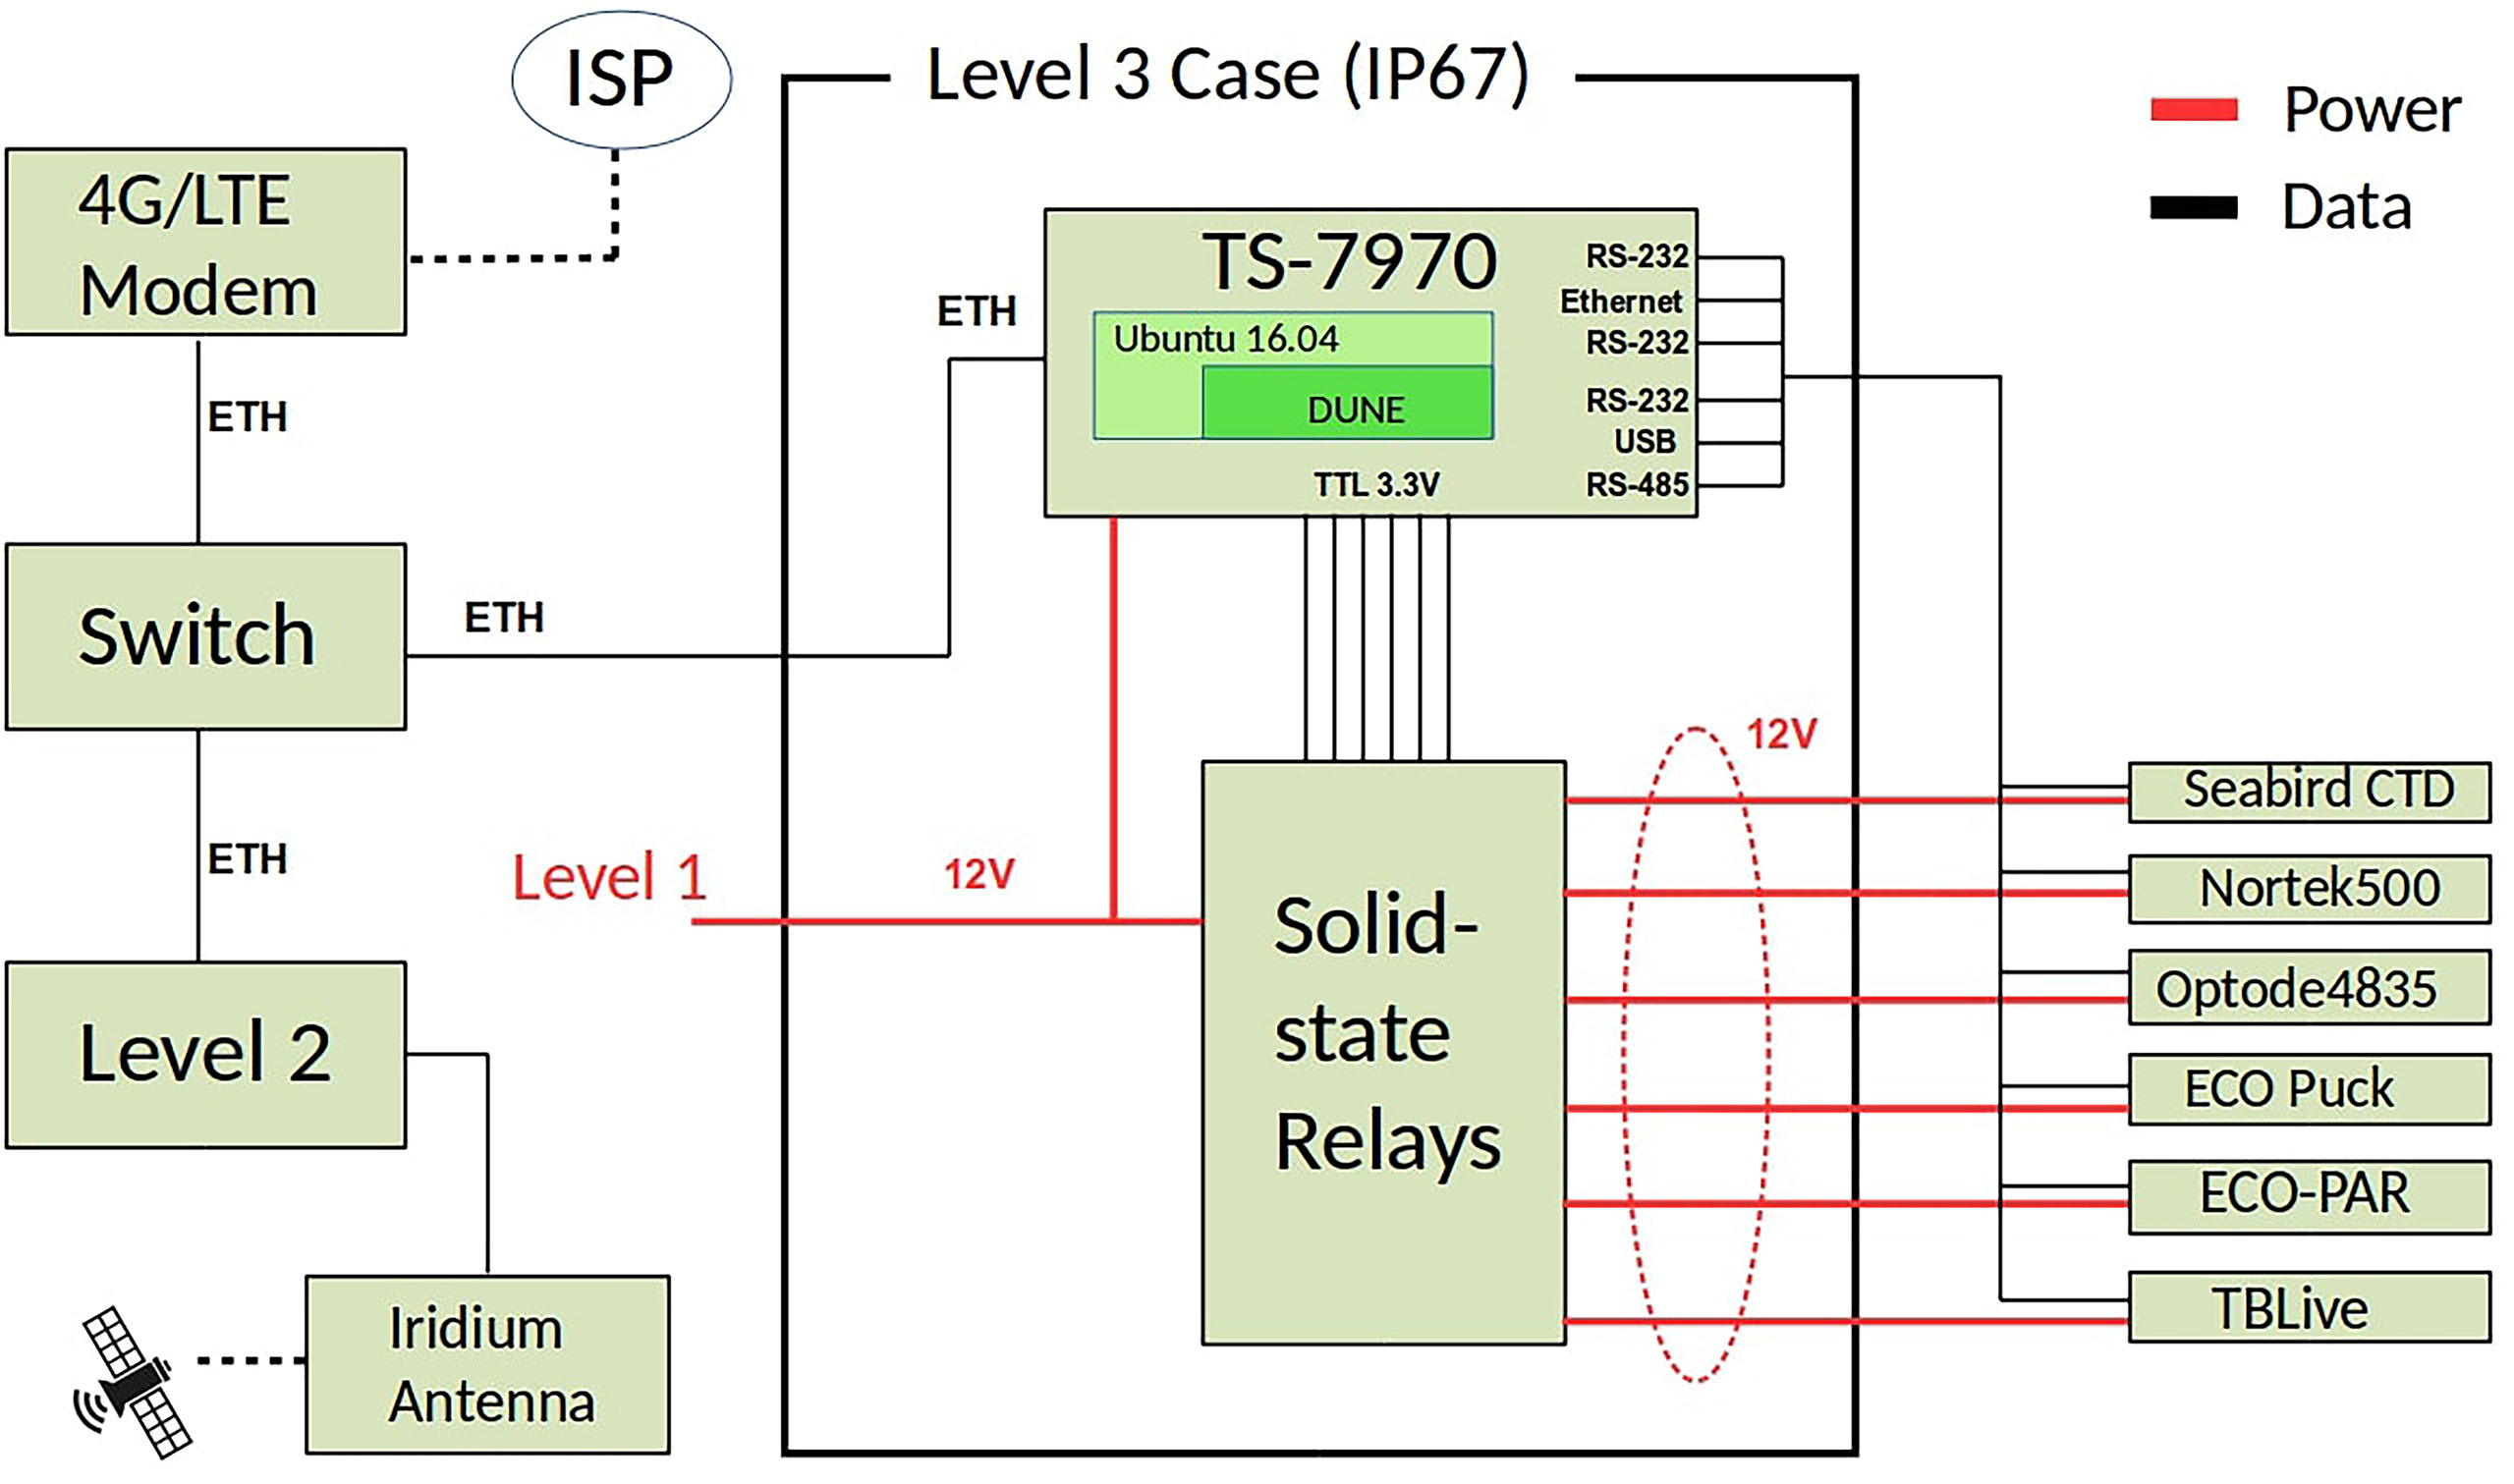
Figure 2 Hardware architecture of the AutoNaut control, communication and payload management system. Sensor data collected by the Level 3 scientific payload control unit include fish detections from the TBLive and are shared in real-time to the Level 2 vehicle control computer over Ethernet, where they are available for the USV control and navigation system.
2.2.3 Software Integration
Onboard the AutoNaut, the receiver is controlled by a dedicated software module running in DUNE, a software framework designed with strong emphasis on flexibility in the configuration of sensors and on data collection and transmission over different communication interfaces (Pinto et al., 2013). The TBLive talks through an NMEA0183 inspired protocol over an RS-485 serial line to the Level 3 computer, which interprets and converts receiver tag detections and sensor readings (noise level, water temperature) to DUNE inter-module communication messages and shares them with other onboard computers for immediate transmission to shore over Internet or Iridium Satellite upon request. As shown in Figure 2, a 4G/LTE modem onboard the USV allows continuous two-way communication to shore over the Internet, which enables real-time monitoring of fish detections and receiver performance via two different user interfaces.
The vehicle operators make use of the graphical command and control user interface Neptus (Dias et al., 2005), which is also a part of the LSTS Toolchain (Pinto et al., 2013). Since the Neptus interface is mainly intended for vehicle control and management, an ancillary GUI was developed to provide scientific personnel such as biologists and oceanographers with real-time sensor data related to fish detections and ocean environmental variables. The scientific data GUI was implemented using the public Grafana HTTP API7, which displays timestamped data from all sensors and georeferenced fish detections on a scalable map in terms of an interactive Grafana dashboard (see Figure 3). The Grafana dashboard permits inspection and comparison of environmental variables (e.g., water temperature, salinity, oxygen concentration, sea current profiles, weather data) both at the time of detection and for subsequent offline analysis in order to facilitate studies of migration processes and fish behavior with an environmental context.
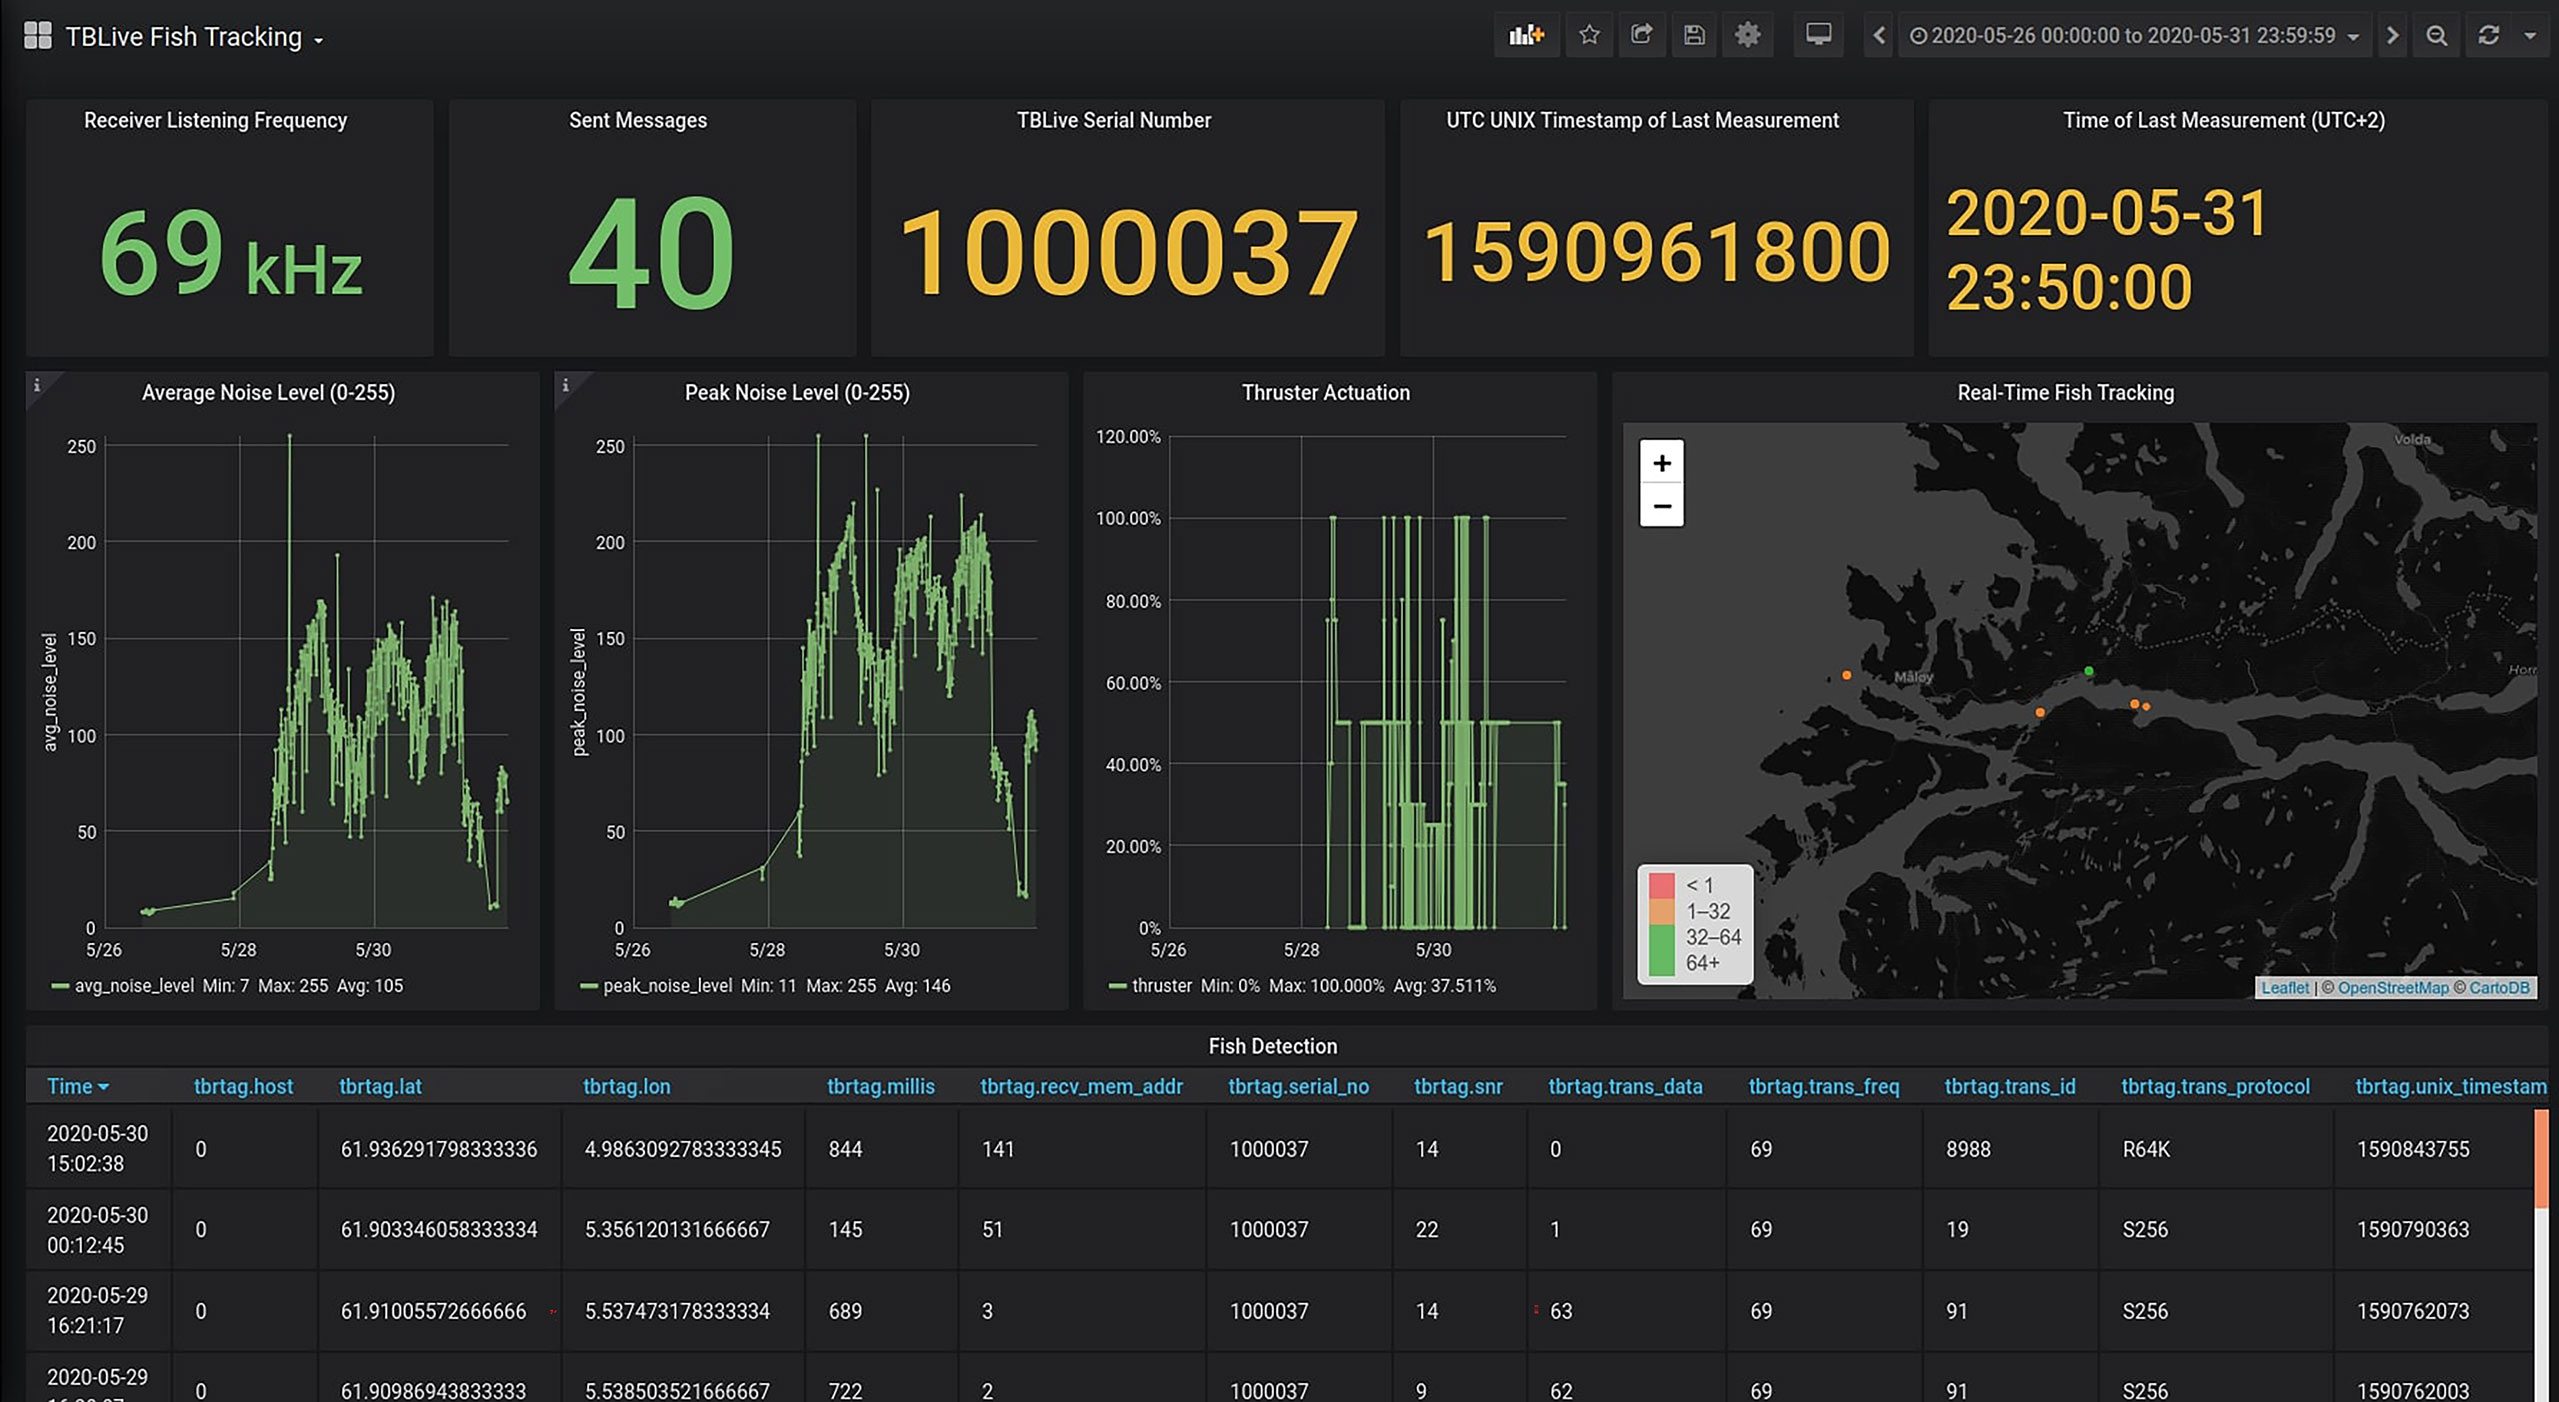
Figure 3 The fish tracking dashboard of the Grafana real-time monitoring interface. Relevant parameters are displayed numerically (from the top left to top right: listening frequency, sent messages, hydrophone serial number, UNIX timestamp, UTC time/date) and graphically (from left to right: average noise level, peak noise level, thruster actuation, USV location at the time of detection). Information is constantly updated as the USV navigates in areas with 4G/LTE coverage.
2.3 Tag Detection Performance
2.3.1 Detection Range Model and Test
The underlying physical mechanisms determining whether the moving USV will detect (or not detect) an acoustic tag transmission are notoriously complex and depend on the properties of the highly dynamic acoustic channel as well as characteristics intrinsic to the receiver, the transmitter and the vehicle itself (Kessel et al., 2013). However, as shown by Huveneers et al. (2016) for example, detection probability as a function of range and other conditions can be modelled using a logistic relation as a simple, but feasible approach. A tag transmission may be regarded as a Bernoulli trial (Papoulis and Pillai, 2002) represented by a binary random variable Y with outcomes detected (Y = 1) or not detected (Y = 1). Using the distance to the tag x as the predictor, the probability p of making a detection can be modelled as a logistic function by assuming that the logarithm of the detection odds p/(1 - p) is linearly dependent on distance:
Solving for p gives the detection probability:
which predicts a sigmoid relationship between the detection probability and the distance to the tag, where and are regression coefficients.
The regression coefficients were estimated from data collected by conducting a controlled field experiment in Trondheimsfjorden, Norway. An acoustic transmitter with size and power output specifications (diameter 7.3 mm, length 17 mm, 139 dB re 1 µPa)similar to those used for tagging of Atlantic salmon post-smolts (Bjerck et al., 2021) was selected for the experiment in order to preserve the relevance of the results with respect to the Nordfjord full-scale trial described below. The tag (R-LP7, Thelma Biotel AS, Trondheim, Norway) was, however, programmed as a range test transmitter with a short and fixed transmission interval (10 s) and with a monotonously increasing transmission sequence number as data payload to facilitate rapid data collection and straightforward assessment of the number of received and lost signals. The range test transmitter was kept at a fixed location by attaching it to a buoy mooring at 2 m depth, while the AutoNaut with the integrated receiver was navigated at different distances from the buoy. The experiment was divided into two trials where only the passive wave-foils were used to propel the AutoNaut during the first trial, whereas the second trial also involved activation of the ancillary electric thruster. During both trials, all tag transmissions were registered and for each transmission the AutoNaut’s position and range to the buoy were noted together with the event of whether the signal was detected or not. The background noise in the acoustic channel was recorded continuously from the receiver, and if a signal was detected, the signal-to-noise ratio (SNR) was registered as well.
2.3.2 Sail-by Scenarios
The detection probability model permits simulation of simple “sail-by” scenarios and estimation of the expectancy of making one or more fish detections as the USV and a tagged fish pass each other at different distances. The purpose of the simulation was to provide some initial predictions on the “sweeping efficiency” of the USV as it moves through an area populated with tagged fish, although several assumptions and simplifications were made to make the calculations more tractable and the results easier to interpret. Here we assumed that the fish remained near the surface at a fixed position relative to the USV and that the USV “sailed by” following a linear path at constant speed and passed the fish at some minimum distance, defined as the sail-by distance. It was also assumed that the tag emitted acoustic messages that were repeated with a uniformly distributed random delay within a fixed time interval, which is a common feature of acoustic fish tags. This means that a sail-by may result in a variable number of transmissions where the probability of detection is greater than zero, depending on the transmission interval, the relative speed between vehicle and fish, and the sail-by distance. In these simulations, the number of detections can be viewed as a random variable consisting of a sequence of independent Bernoulli trials where each trial (transmission) i is associated with a varying probability of success (detection) pi, given by the actual range and the logistic model described the previous section. The random variable can therefore be characterized as having a Poisson binomial distribution (Katti and Rao, 1968). The expected value of a random variable having this distribution is simply the sum of the detection probabilities over all transmissions during a sail-by. This fact was used to find an estimate of the maximum passing distance where at least one detection can be expected.
2.4 Full-Scale Trial
A full-scale trial with the AutoNaut was planned and conducted over a period of three days in May 2020 in Nordfjord, Norway (N61°54’, E5°14’). Nordfjord is with its 106 km the sixth longest fjord in Norway (see Figure 4). Several of the rivers entering the fjord sustain significant populations of Atlantic salmon (Salmo salar) and anadromous brown trout (Salmo trutta), where the Stryn and Eid rivers constitute two of the main salmonid habitats. The trial was aligned with an already ongoing acoustic telemetry experiment in these two rivers, where the fjord and seaward migration of these species were studied. The trial therefore gave a reasonable chance of experiencing vehicle-fish encounters in the setting of a genuine fish migration study and served as a realistic test of the AutoNaut as a mobile robotic telemetry platform.
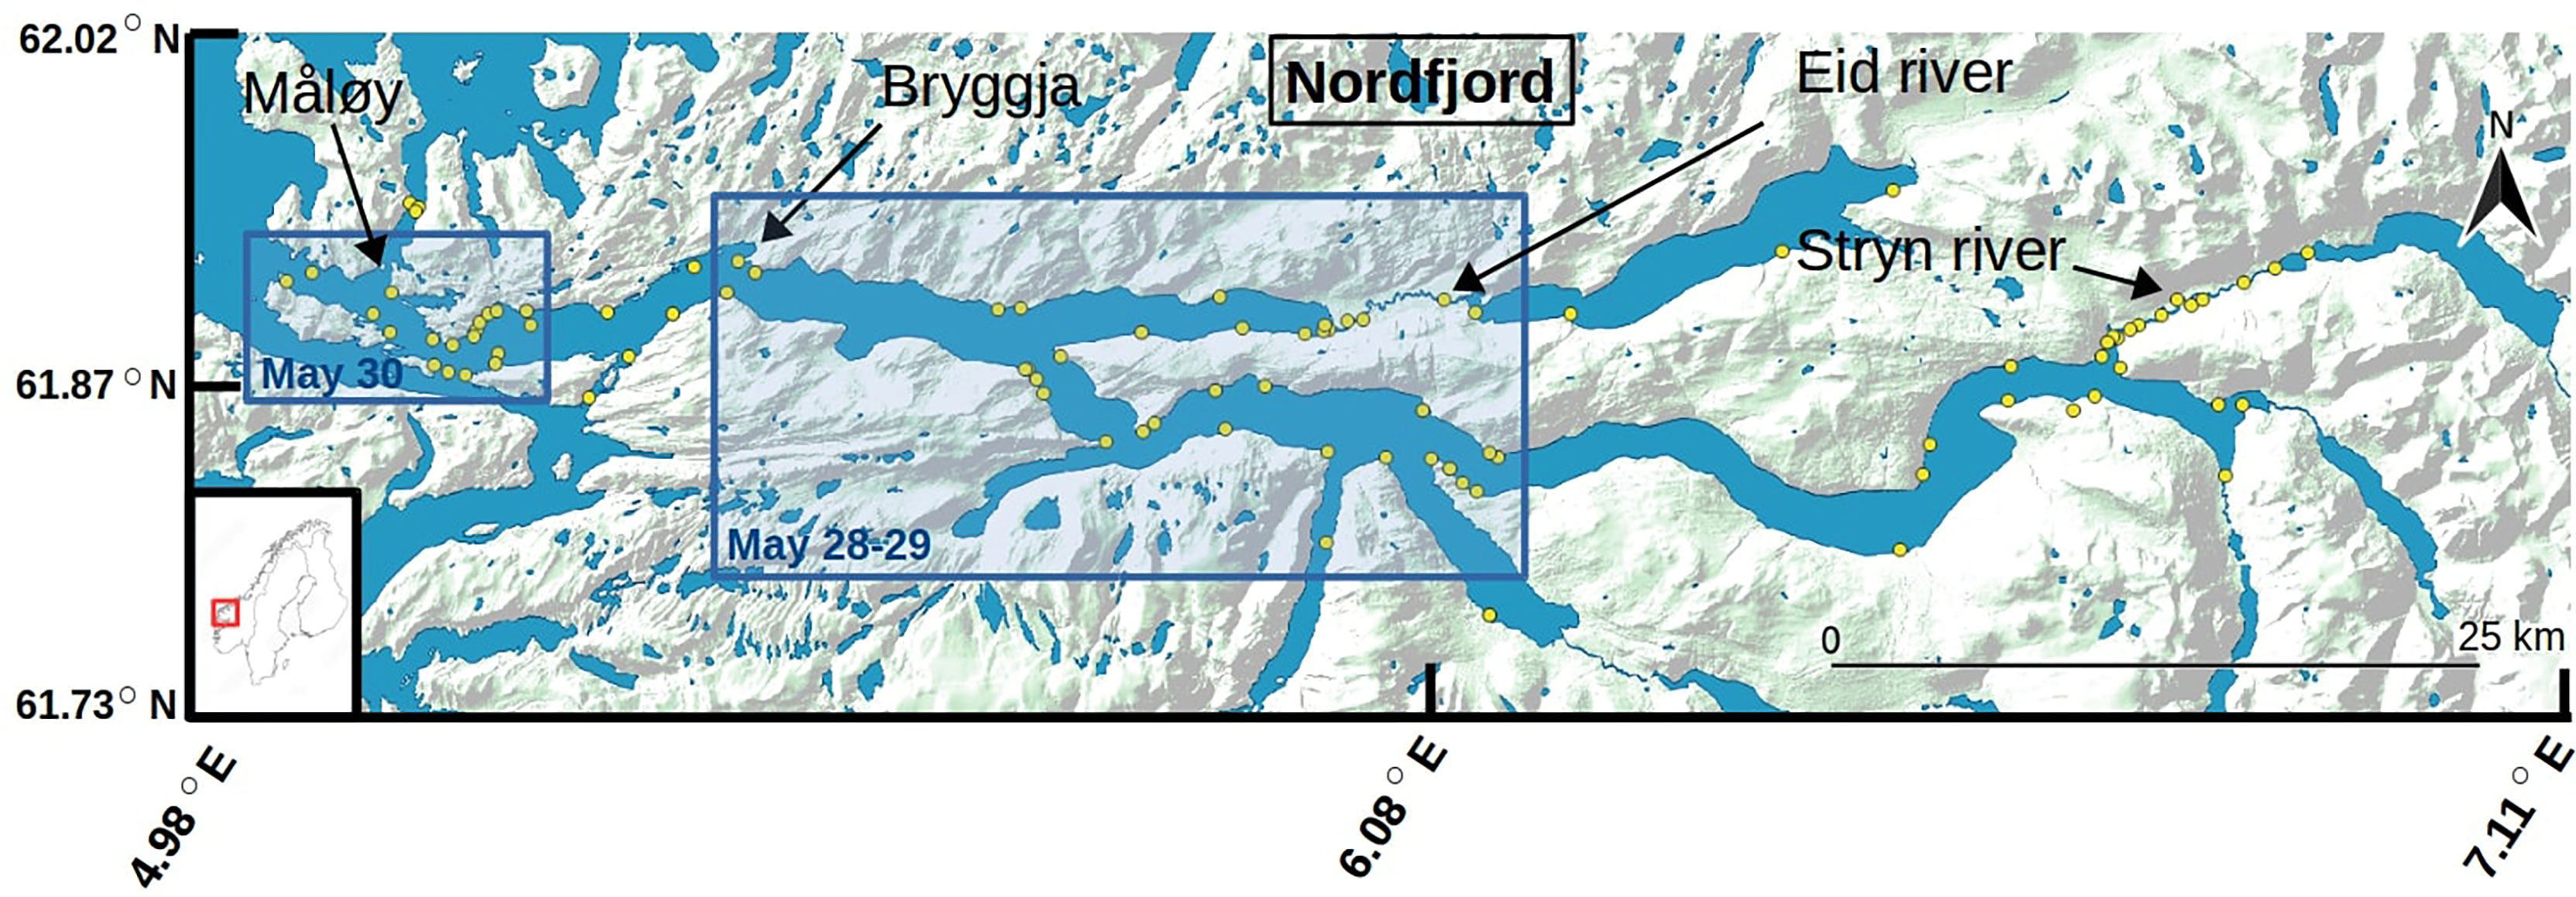
Figure 4 Map showing Nordfjord in western Norway, from river Stryn in the east to the fjord outlet and the North Atlantic Ocean in the west, which was site of the field trial with the fish telemetry-enabled AutoNaut. The trial was aligned with an ongoing fish telemetry experiment studying the fjord migration of salmonids from the Stryn and Eid rivers in the spring 2020. A system of 74 passive receivers were deployed at fixed locations over the full length of the fjord (yellow circles). Blue rectangles indicate the two areas that were analysed in detail, in which the AutoNaut navigated between the 28th and 30th May 2020 and where the receiver grid provided ground-truth fish detection data.
Following the procedure described in Bjerck et al. (2021), 100 salmon pre-smolts and 85 sea trout had been captured by electrofishing, implanted with an acoustic transmitter, and released at their respective capture sites in the Stryn and Eid rivers between the 10th and 16th of April 2020. Two different types of acoustic transmitters were used; the D-LP6 and the ID-LP7 (Thelma Biotel AS, Trondheim, Norway). While the D-LP6 transmits swimming depth as sensor data payload in addition to a unique ID code, the ID-LP7 is a pure ID transmitter and acoustically identical to the R-LP7 employed in the range test with the AutoNaut. Both transmitter types had a battery life of roughly 150 days and were programmed with a uniformly distributed random delay/transmit interval of 30–90 seconds to permit time-division multiplexing, giving an average sending rate of 60 IDs per hour.
As part of the fish telemetry experiment reported in Bjerck et al. (2021), a system of 74 VR2W passive acoustic receivers (Innovasea Systems Inc., Halifax, Canada) had been deployed at fixed stations distributed from the rivers to the outer rim of the fjord, as shown in Figure 4. The full record of detection data from the passive receivers was downloaded in the summer after the smolt migration season had ended and provided ground-truth data for the subsequent analysis of the trial. In addition to the full data record, fish detections registered during the three days of the trial at stations within or in the vicinity of the area covered by the Autonaut were extracted and used to establish an overview of the evolving migration situation and potential detection targets. As a simple approximation, the migration route of fish that had been detected at more than one station was estimated by using the recorded detection times along with the shortest linear path through the fjord connecting the respective receiver positions. The migration routes were then used to calculate the fish’s distance to the river mouth as a function of time and compared to the corresponding position of the AutoNaut, which was logged continuously using the onboard GNSS receiver.
The timing of the trial was decided based on experience from earlier migration studies in the same area (Bjerck et al., 2021), and the route of the AutoNaut was nominally planned to the outer 40 km section of the fjord and consisted of shoreline and mid-fjord traverses as well as a short excursion to the open sea. Still, the vehicle’s route was under real-time control and prepared for adjustments at any time to adapt to situations caused by, e.g., weather conditions, sea currents or opposing ship traffic. Fish detections from the receiver grid were not used actively for vehicle guidance during the trial since they were not readily available in real-time. It was also desirable to retain the scope of the trial as a baseline test of the unbiased detection capacity of the mobile receiver platform.
3 Results
3.1 Technical Integration
The full-scale trial in Nordfjord and the range test in Trondheimsfjorden provided five days of technical performance testing and validation of the AutoNaut and TBLive receiver integration. The mechanical installation of the receiver was observed to have no perceivable effect on the vehicle’s drag or navigational performance, which was expected due to the receiver’s small size and tight integration on the vehicle’s streamlined instrument keel. Potential issues related to air exposure or bubble entrainment around the relatively shallow hydrophone cannot be ruled out since weather conditions were generally calm and wave height never exceeded 1 m, although no indications of such effects were observed during the trials. Integration of the TBLive with the AutoNaut payload control software showed immediate availability of accurately timestamped tag detection data, background noise level, and water temperature both locally in the vehicle guidance computer and on the remote user interfaces. With the 4G/LTE cellular link active, the latency time of receiver data to the Neptus and Grafana GUIs was typically less than 2 seconds. Tag detections were georeferenced by the payload computer by adding the vehicle GNSS position to the detection record before they were broadcast as DUNE IMC messages, and it was confirmed that they appeared on the map panel of the Grafana dashboard in real-time (see Figure 3). All receiver data were successfully logged to the vehicle database along with all other sensor data for post-mission analysis.
The TBLive receiver experienced an elevated and fluctuating noise level during the full-scale trial that was not present during the range test. This most likely caused a reduction in the AutoNaut’s effective detection range. The noise figure reported by the receiver is an accumulated measure of the noise observed in the frequency band averaged over 5-minute intervals. In a moving platform, noise will be affected by a variety of naturally fluctuating noise sources such as environmental noise, turbulent flow, thruster usage, and inherent electrical properties of the hydrophone sensor itself. However, the source of the elevated noise level was subsequently identified simply as a case of electrical interference between the Seabird CTD sensor and the receiver, and was eliminated by a rewiring of the sensors’ ground connections and installation of a line filter on the receiver’s power supply. The specific reduction of detection range during the Nordfjord trial was not quantified, but the fact that both tagged fish and test transmitters deployed from a boat were detected suggests that the vehicle receiver was still functional despite the noise issue.
3.2 Detection Range and Sail-by Simulations
The range test was conducted in Trondheimsfjorden under calm conditions. The small acoustic transmitter (R-LP7, 7.3 mm, 69 kHz) was deployed at 2 m depth by attaching it with a thin metal string to the mooring line of a surface buoy that was held taut and in a fixed position by a heavy anchor. The string served to offset the tag a few centimetres from the thick mooring line and keep it in a horizontal orientation similar to that of a tag implanted in a fish. The buoy was installed approximately 100 m from the shore at 10 m water depth, with the seafloor sloping moderately to about 50 m depth outside the buoy at the far end of the test range. The position of the tag (buoy) was determined using a GPS with accuracy better than 2 m. The wave height was low during the test, ranging from ripples to small waves (< 25 cm), which caused the AutoNaut to move at relatively low speed (below 0.4 m/s) when driven only by wave propulsion.
The range test was divided into two trials and provided 298 tag detections out of a total of 468 transmissions. The first trial, with the AutoNaut driven by the wave-foils only, lasted approximately 35 minutes and gave 129 detections out of 210 transmissions. The second trial, where the AutoNaut also had the ancillary thruster engaged, lasted approximately 43 minutes and gave 169 detections out of 258 transmissions. The distance between the tag and the AutoNaut was calculated for all detected and lost transmissions using the vehicle’s measured GNSS position (logged at 1 s intervals) at the time of reception and was further organised into 25 m range bins in the interval 0-300 m (0-25, 26-50,…,276-300). The maximum detection range recorded for the first and the second trial was 256 m and 135 m, respectively.
The detection ratio (detections/transmission) for all range bins were then calculated and processed by the MATLAB® function glmfit (The Math Works Inc., Natick, MA, USA) to estimate the coefficients of the logistic regression model given in Equation 2. The regression results are shown in Figure 5 and summarised in Table 1. It was estimated that the AutoNaut would have a 50% efficient detection radius (detecting transmissions with probability 0.5, or R0.5) of 207 m or 95 m depending on whether the vehicle was passively or actively propelled, respectively. The corresponding R0.9 detection radii were estimated to 117 m and 46 m.
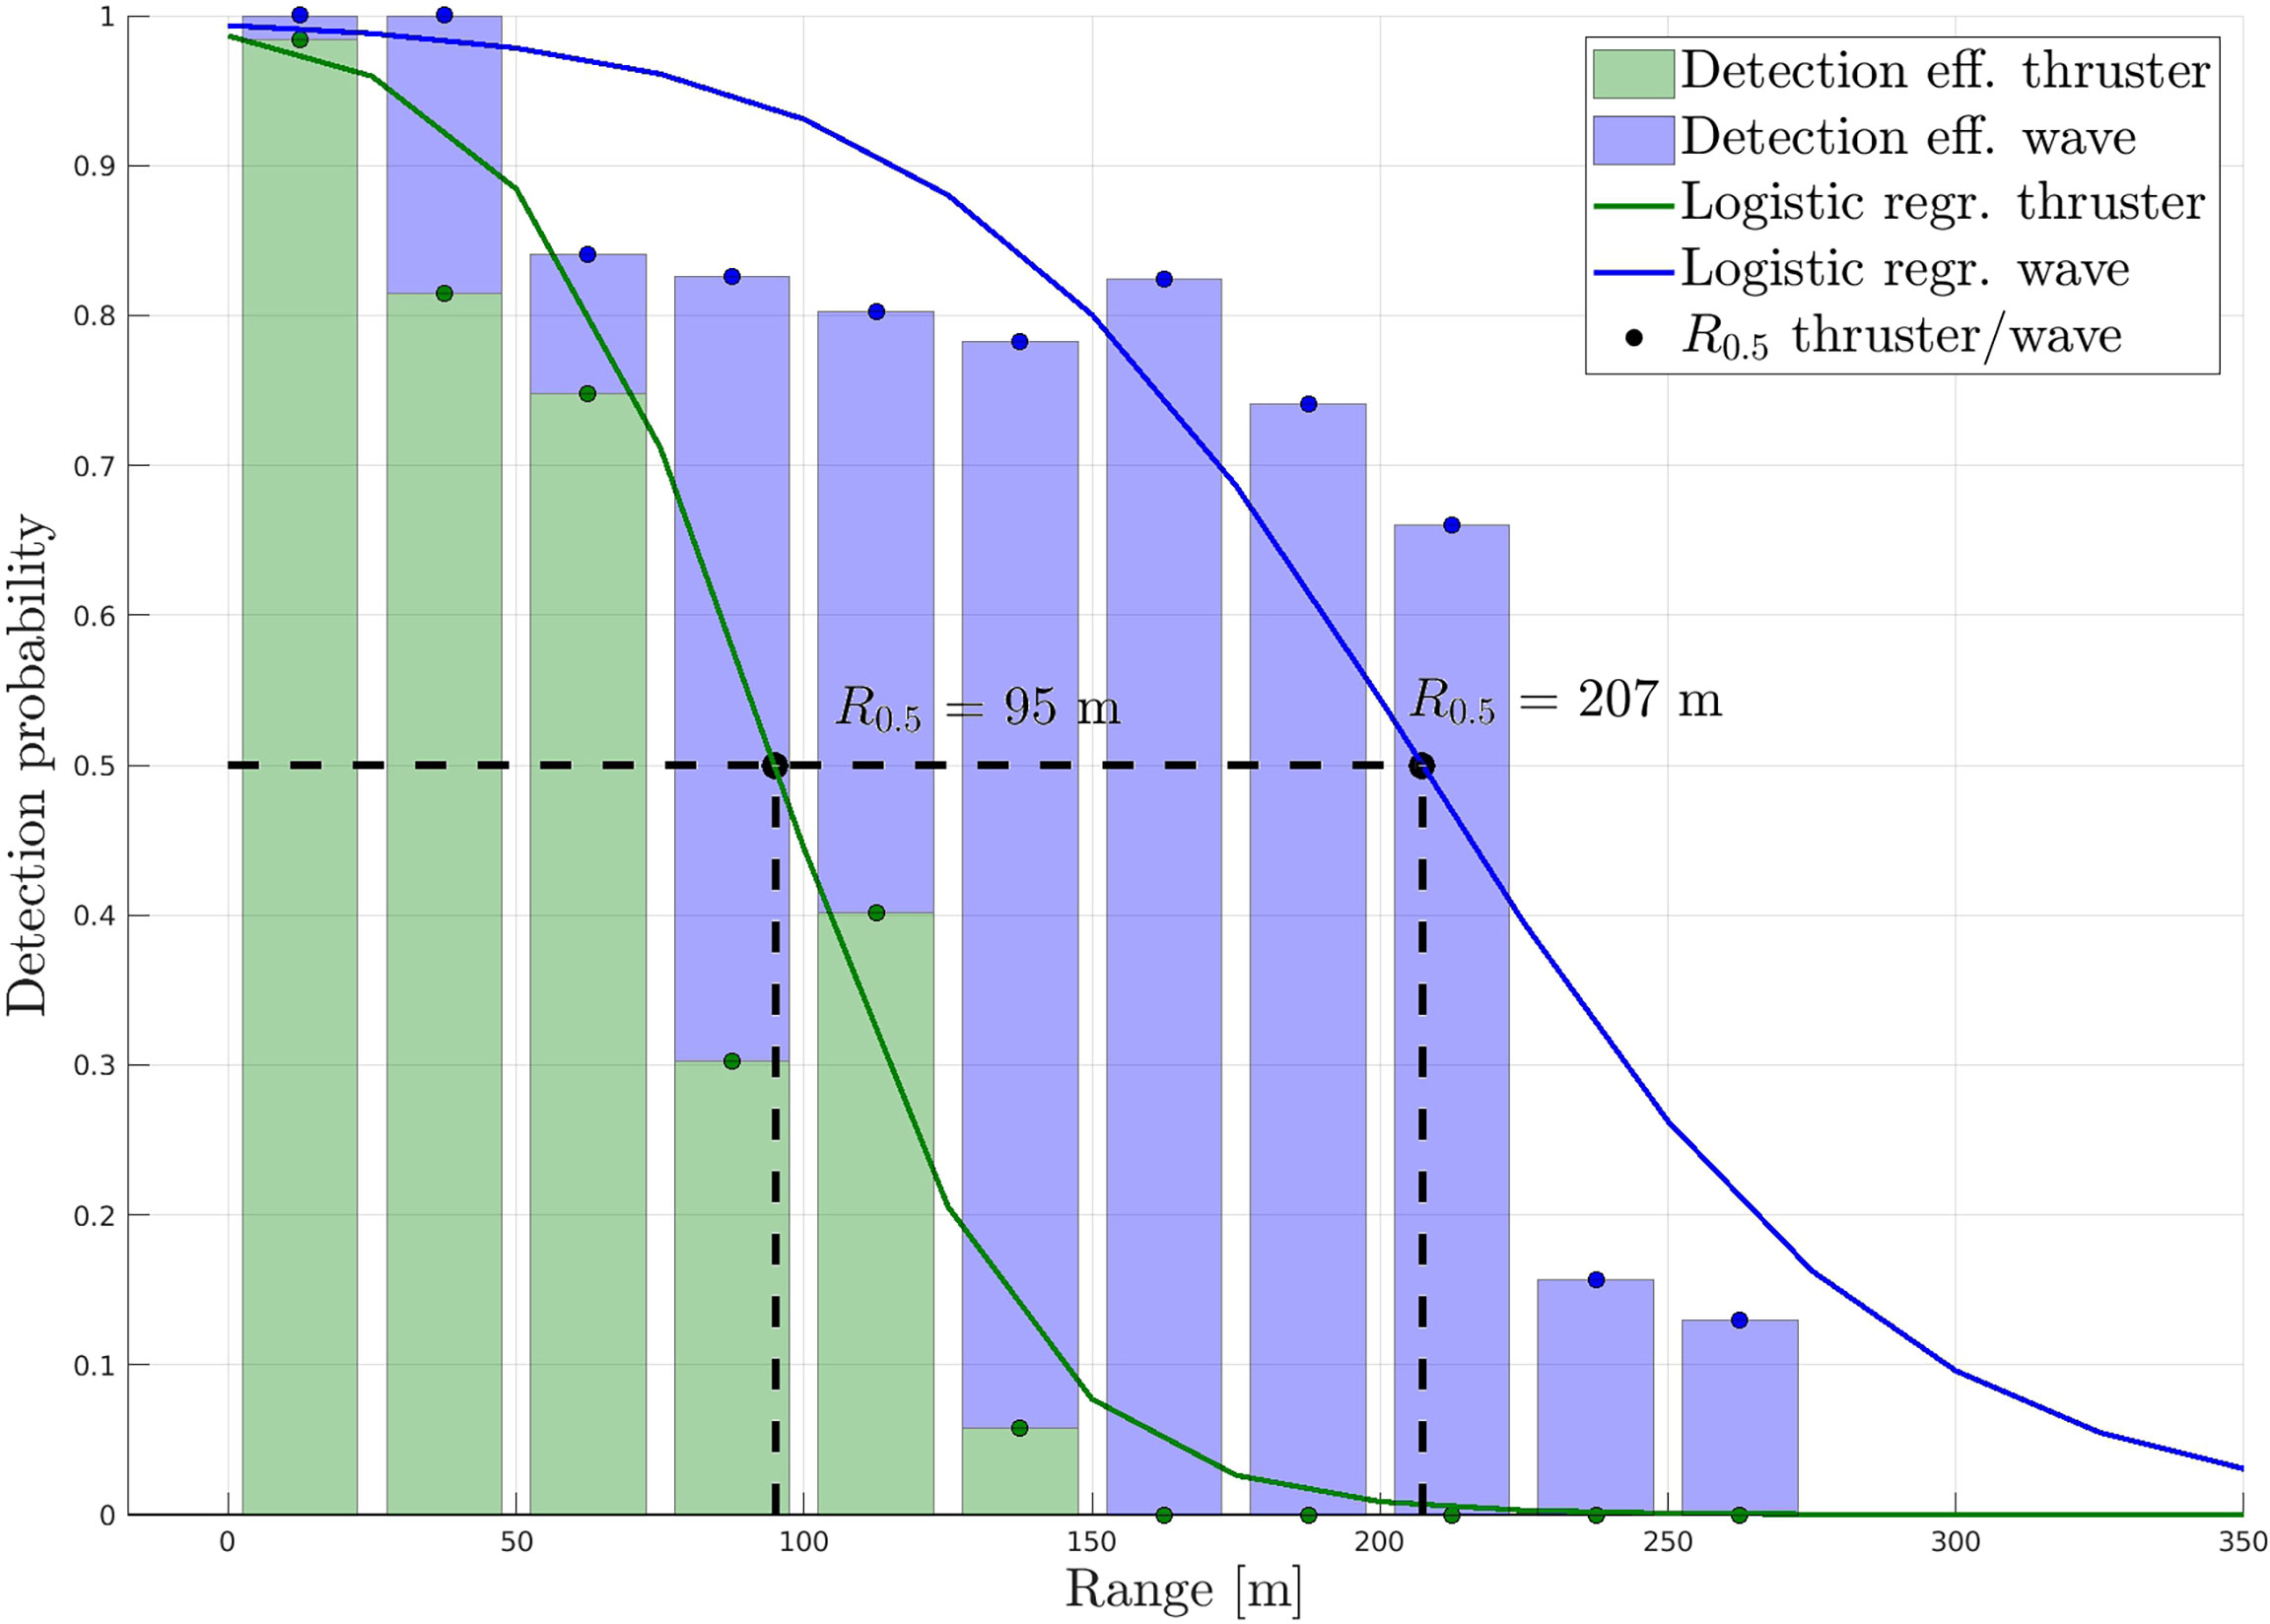
Figure 5 Logistic regression applied to the range test data where the vehicle was propelled by the wave-foils only (blue) or with both wave-foils and electric thruster (green). Dashed lines indicate ranges corresponding to 50% chance of detection, reaching 207 and 95 meters respectively.
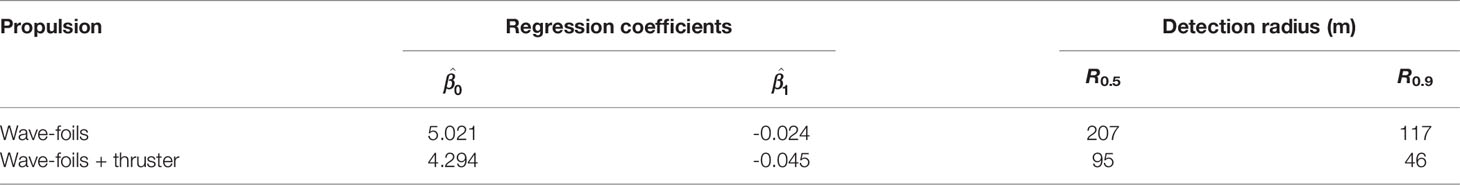
Table 1 Regression results for range test trials using the model in Equation 2.
The detection range model fitted to the wave-propulsion case was subsequently used to simulate sail-by scenarios for the vehicle and an acoustically tagged fish in order to estimate the effective range where at least one detection can be expected. In these simulations, it was assumed for the sake of simplicity that the tagged fish was stationary, while the vehicle followed straight paths at constant speed. It was also assumed that the receiver’s sensitivity was constant with respect to vehicle speed, that the fish stayed near the surface, and that the tag emitted energy omni-directionally and featured a sending schedule similar to the tags used in the full-scale trial with a 30-90 s uniformly distributed random delay/sending interval. The simulations were set up with 1 km vehicle transects with minimum sail-by distances in the range 0-500 m (10 m steps), and relative speed between vehicle and fish in the range 0.1-1.5 ms-1 (0.1 ms-1 steps). An example of a sail-by simulation is shown in Figure 6 (only sail-by distances in steps of 50 m retained for clarity), where the surface colour contour indicates the tag detection probability and stem plots indicate tag transmissions along the straight vehicle transects.
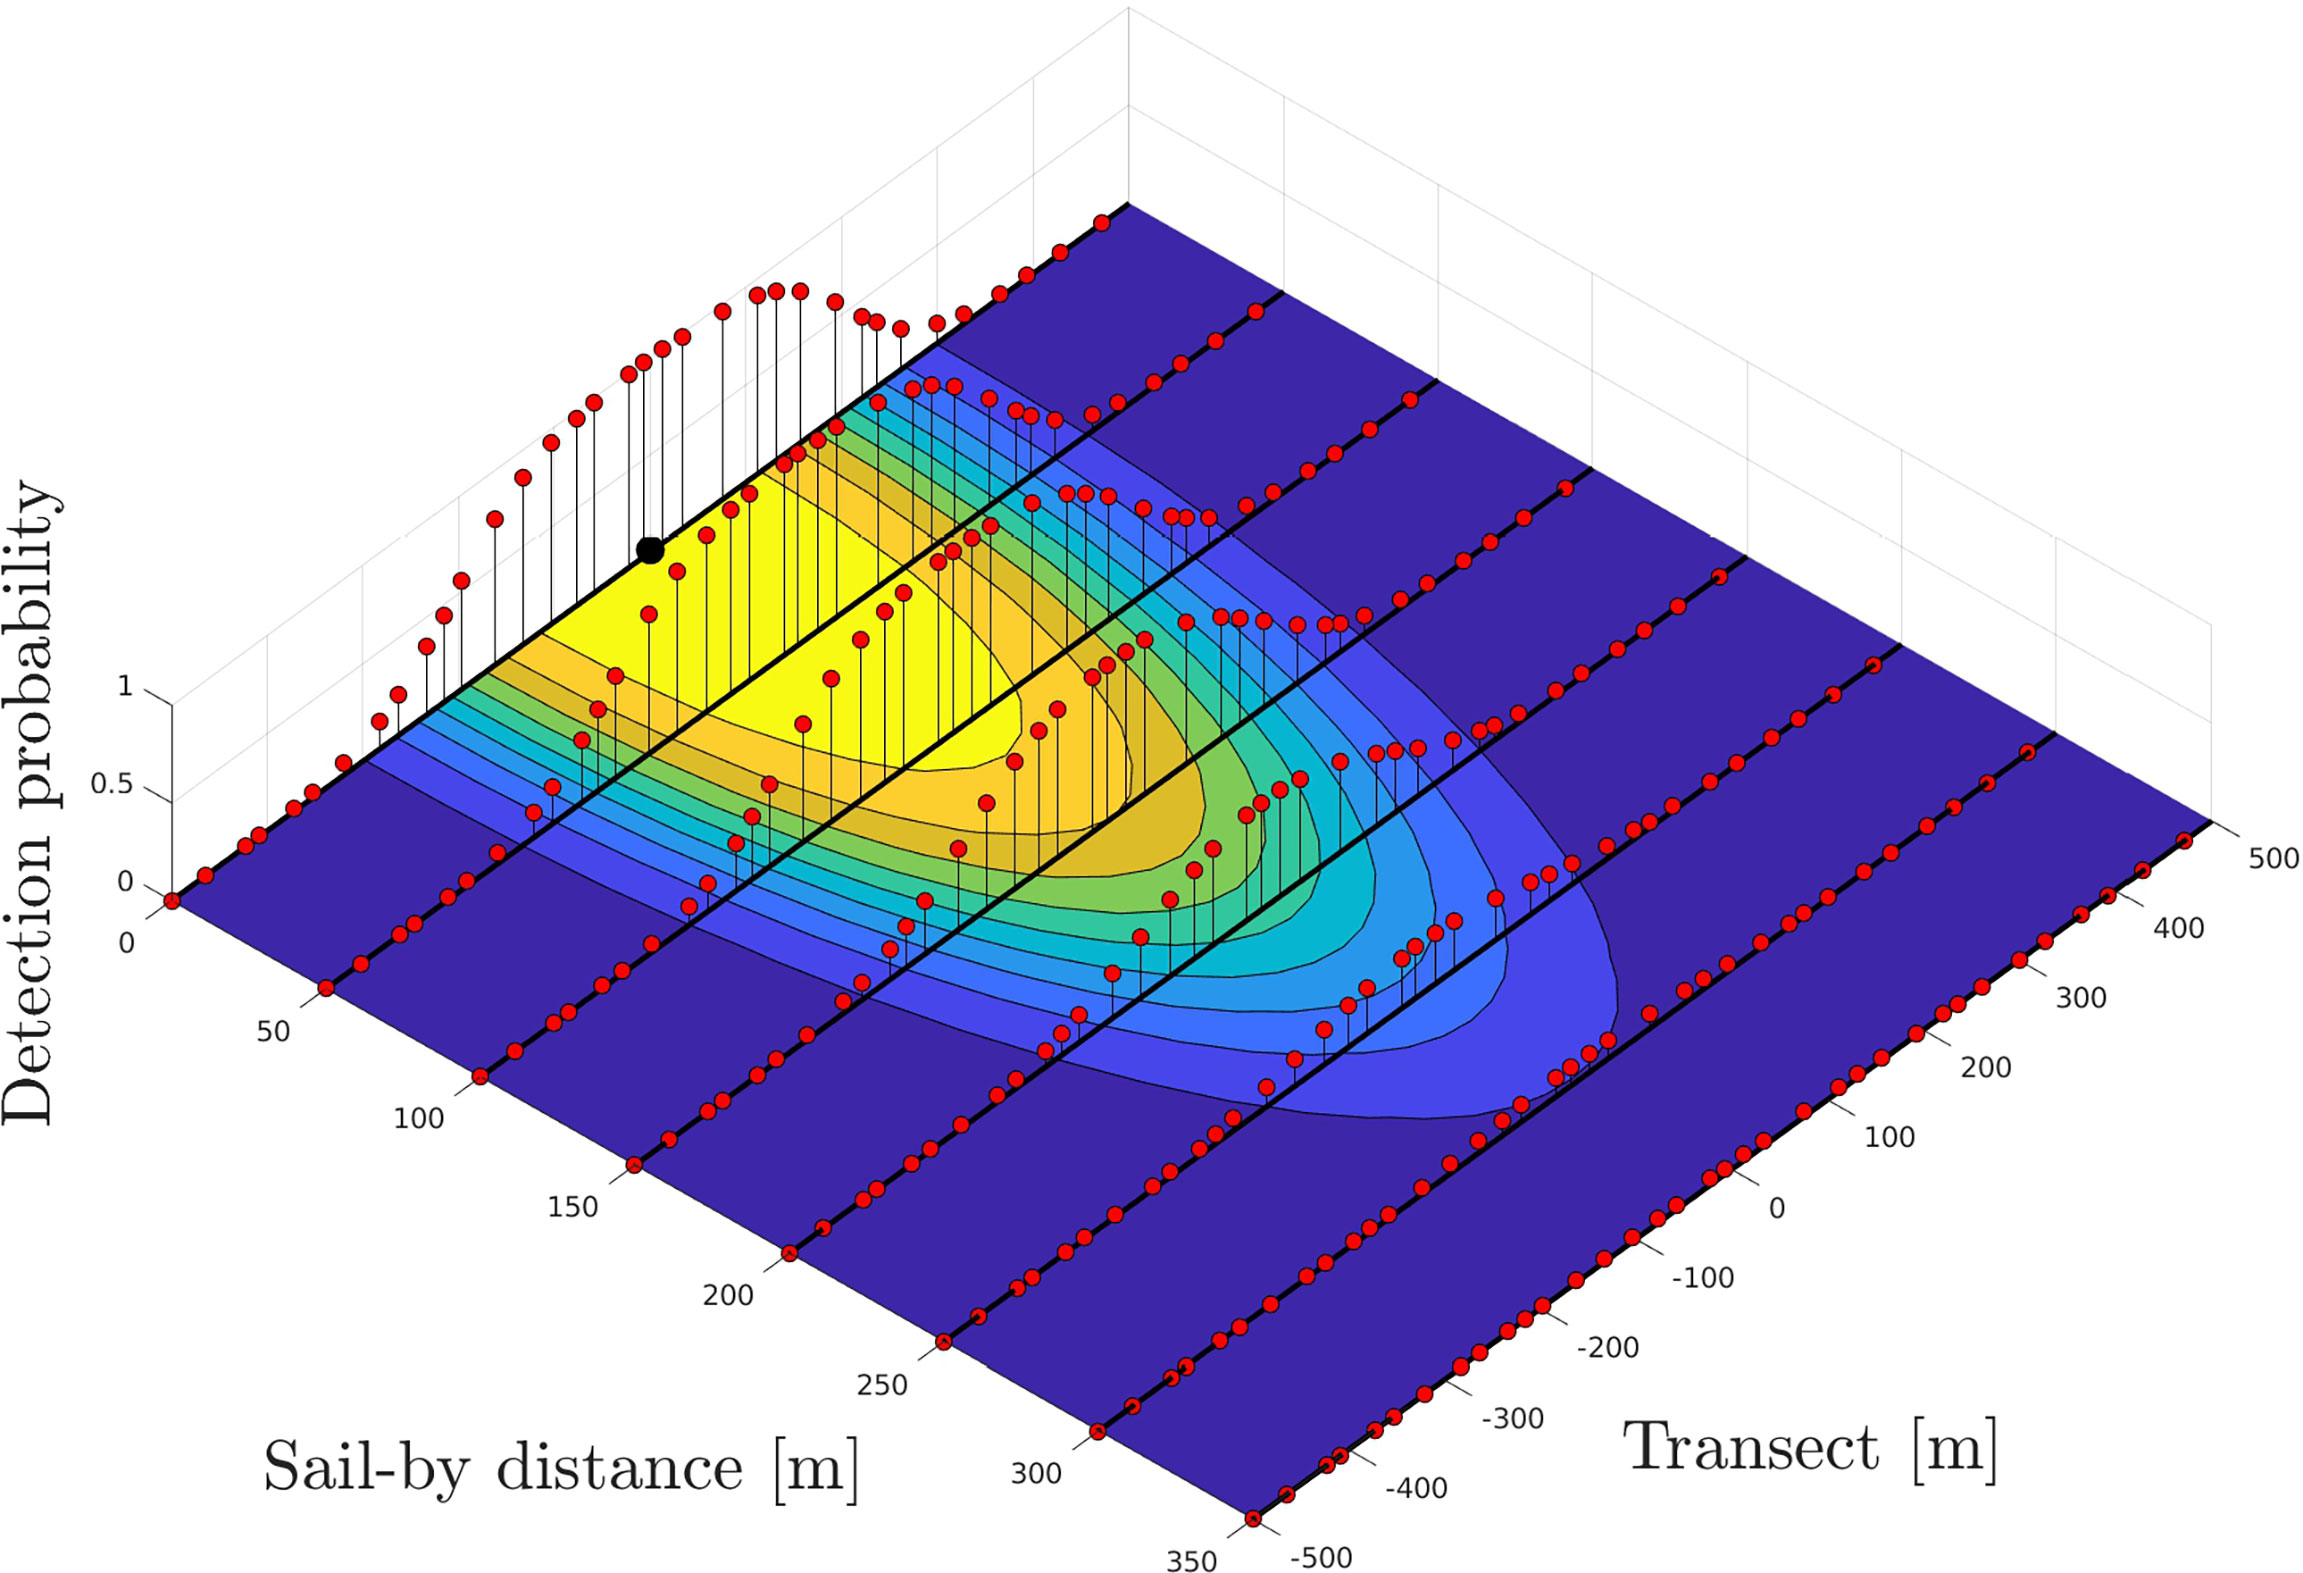
Figure 6 Example showing eight simulated vehicle-transmitter sail-by scenarios with tag transmissions and their associated detection probability. The stationary acoustic transmitter is located at the origin (black bullet), while the vehicle “sails by” at a constant speed of 0.5 ms-1 following straight paths/transects on the sea surface (black lines). The minimum sail-by distance is reached at the middle of each transect, here ranging from 0 to 350 m in 50 m intervals. The coloured surface contour indicates the tag detection probability (yellow > 0.9, dark blue < 0.1) at any given coordinate, and the tag transmissions with 30-90 seconds semi-random delay/transmit interval are shown with their associated detection probability as stem plots (red bullets) along each vehicle transect.
The expected number of detections along all transects for all relative speeds were calculated as the expectancy value of the associated Poisson binomial distribution (see section Sail-by scenarios above). For the different relative speeds, the sail-by distances that gave exactly one detection were determined numerically by fitting high-order polynomials to the detection expectancy curves using MATLAB® functions polyfit and fzero, as shown in Figures 7, 8. In Figure 7, each curve (blue) represents a constant relative speed between vehicle and fish in the interval 0.1-1.5 ms-1 (speed gradient indicated by arrow). Moreover, Figure 8 shows that a single detection of the tag can be expected at a sail-by distance of 371 m for the lowest speed (0.1 ms-1), while the distance is reduced to 241 m for the highest speed (1.5 ms-1). On the other hand, the area efficiently swept by the AutoNaut will be almost ten times higher for the latter case due to the speed difference.
Figure 7 Expected number of detections as a function of sail-by distance. Expectancy of one detection indicated with a red line.
Figure 8 Sail-by distances giving exactly one detection as a function of relative speed.
3.3 Nordfjord Field Trial
The AutoNaut was launched 28th May 2020 at Bryggja on the north side of Nordfjord, 25 km east of the fjord outlet and 70 km west of the Stryn river (see Figure 4), and was recovered four days later at the same location. Weather conditions were sunny/clear with the sea state ranging from flat calm to small waves (< 0.5 m) as well as some swell at the open ocean. The generally calm conditions required partial activation of the ancillary thruster to assist wave propulsion, which gave an overall average speed over ground of 0.4 ms-1. External recharging of the batteries was not required as the solar panels proved sufficient for powering the vehicle’s electrical subsystems throughout the mission, including the thruster. The average power harvested from the solar panels was estimated to 62 W. Surface temperature and salinity were measured every two minutes by the onboard sensors and showed average values (mean ±SD.) 11.2 ± 1.5°C; 16.2 ± 6.7ppt and 12.5 ± 0.6°C; 26.9 ± 1.7ppt for the fjord sections east and west of Måløy, respectively.
The results presented here concern the 54-hour period from the launch up to the point when a fish was detected at an offshore location west-northwest of the fjord in the afternoon 30th May, after the AutoNaut had travelled a distance of 80 km. Inspection of the detection record from the passive receiver system confirmed that the timing of the trial coincided with the migration of salmon post-smolts from the Stryn river. Due to hydrological differences between the two rivers, tagged salmon from the Eid river migrated earlier (median 13th May) and were not detected in the fjord at the time of the trial. A total of 27 migrating salmon were detected on receivers in the Stryn estuary that spring (see Supplementary Material), and the detection record verified that at least three of these fish migrated through the outer half of the fjord at the time of the trial. The further analysis will focus on these three individuals whose detection records are shown in Table 2. Two of the fish carried ID-LP7 tags with ID 8996 and 8988, while the third one carried a D-LP6 with ID 252. The fork lengths of the fish were measured in April during tag implantation to 13.7, 13.6 and 13.4 cm, respectively. In general, the detection records show that the three individuals exhibited a distinct and directed seaward migration behaviour during the time of the trial. Although hypothetical, the proximity of the fish detections in space and time, with all fish detected at the fjord outlet in an interval of just three hours after swimming 100 km from the estuary, suggests that the post-smolts may have migrated as part of a larger group. It can also be observed that the migration route included at least one fjord crossing for all fish. Using the detection times shown in Table 2 and the shortest straight fjord-path between the receiver positions, the average rate of movement through the outer half of the fjord for the three fish were 3.2, 3.7 and 3.4 BLs-1 (Body Lengths per second, using the April measurements). In the remaining part of this article, the three individuals will be identified by their tag ID number, or with letters A, B and C, respectively.
Table 2 Detection record for fish ID 8996, 8988 and 252.
Figures 9, 10 illustrate how the situation evolved in space and time in terms of the location of the fish detections and the corresponding position and track of the AutoNaut in two distinct sections of the fjord during 28-29th and 30th May. All fish were detected on passive receivers located a few kilometres further inside the fjord relative to the vehicle’s position on the 28-29th May, with fish 8996 detected at one point (A4) only 2.3 km to the south-east behind the AutoNaut. About 17 hours later, the same fish was detected again by a passive receiver located 28 km further out (A5), still with the AutoNaut only 2.4 km apart, suggesting that the fish and the vehicle had moved at similar speeds over this stretch of the fjord. The vehicle’s average ground speed was here measured to 0.49 ms-1, while the fish had maintained a speed of at least 3.3 BLs-1 (corresponding to 0.45 ms-1). The fish was not detected by the AutoNaut, which may be explained by the fact that the vehicle was commanded to stay more in the middle of the fjord over this stretch (typically 500-1300 m from shore), as opposed to the day before, when the AutoNaut traversed relatively close to the northern shore of the fjord (see Figure 9). The passive receivers on which the fish was detected were both located close to the shore, suggesting a more shore-oriented migration route. In addition, the relative positions of the vehicle and the detection points indicated that the vehicle may have been some distance ahead of the fish. This interpretation, however, should be regarded as hypothetical since the fish’ exact migration route and speed between the detection points cannot be known. Fish 8986 was finally detected at the westernmost receiver at the fjord outlet (A6) and had at that point increased its average movement speed to at least 4.6 BLs-1 and overtaken the AutoNaut by 7.4 km after the vehicle had been commanded to execute a temporary excursion to the northern shore of the fjord (see Figure 10). This example, with the eventual separation of the vehicle and fish, clearly demonstrates the transient nature of fish migrations and the challenge of sampling such processes as they evolve in space and time.
Figure 9 Section of the fjord navigated by the AutoNaut on 28th and 29th May (blue track), fish detections on passive receivers (coloured circles), and the AutoNaut’s position at the detection times (correspondingly coloured rectangles). Numerical order of detection labels correspond to rectangle positions in chronological order. See Table 2 for colour and label coding, and Figure 4 for geographical reference.
Figure 10 Section of the fjord navigated by the AutoNaut on 30th May (blue track), fish detections on passive receivers (coloured circles), and the AutoNaut’s position at the detection times (correspondingly coloured rectangles), and the AutoNaut’s own detection (red diamond). Numerical order of detection labels correspond to rectangle positions in chronological order. See Table 2 for colour and label coding, and Figure 4 for geographical reference.
Fish 8988 and 252 were also detected by passive receivers on 29th May around 50 km from the fjord outlet (see Figure 9, labels B1 and C1). They were observed to behave in a similar manner as 8996, with the fish and the AutoNaut moving approximately at the same average speed through the outer half of the fjord. Twenty-one hours later, 8988 was detected again on three passive receivers distributed over the outer 8 km stretch of the fjord with the AutoNaut (unknowingly) moving in the same direction 1.5-2.5 km ahead of the fish, as can be seen from Figure 10 (label B2-B4) and Figure 11. Here, the AutoNaut maintained an average speed of 0.82 ms-1, and the fish a minimum of 6 BLs-1, showing an increase in migration speed similar to that observed for fish 8996 towards the outer part of the fjord. Using depth transmitters, previous telemetry studies of salmon post-smolts in Nordfjord have shown that the fish typically stay in the upper three meters of the water column during the fjord migration (Bjerck et al., 2021). It is therefore reasonable to assume that the fish’ net movement speed will include components of advective transport in addition to active swimming. The outer part of Nordfjord can sustain significant tidal currents in the surface layer (Urke et al., 2021), but their actual contribution to the movement speed observed in this study were not quantified.
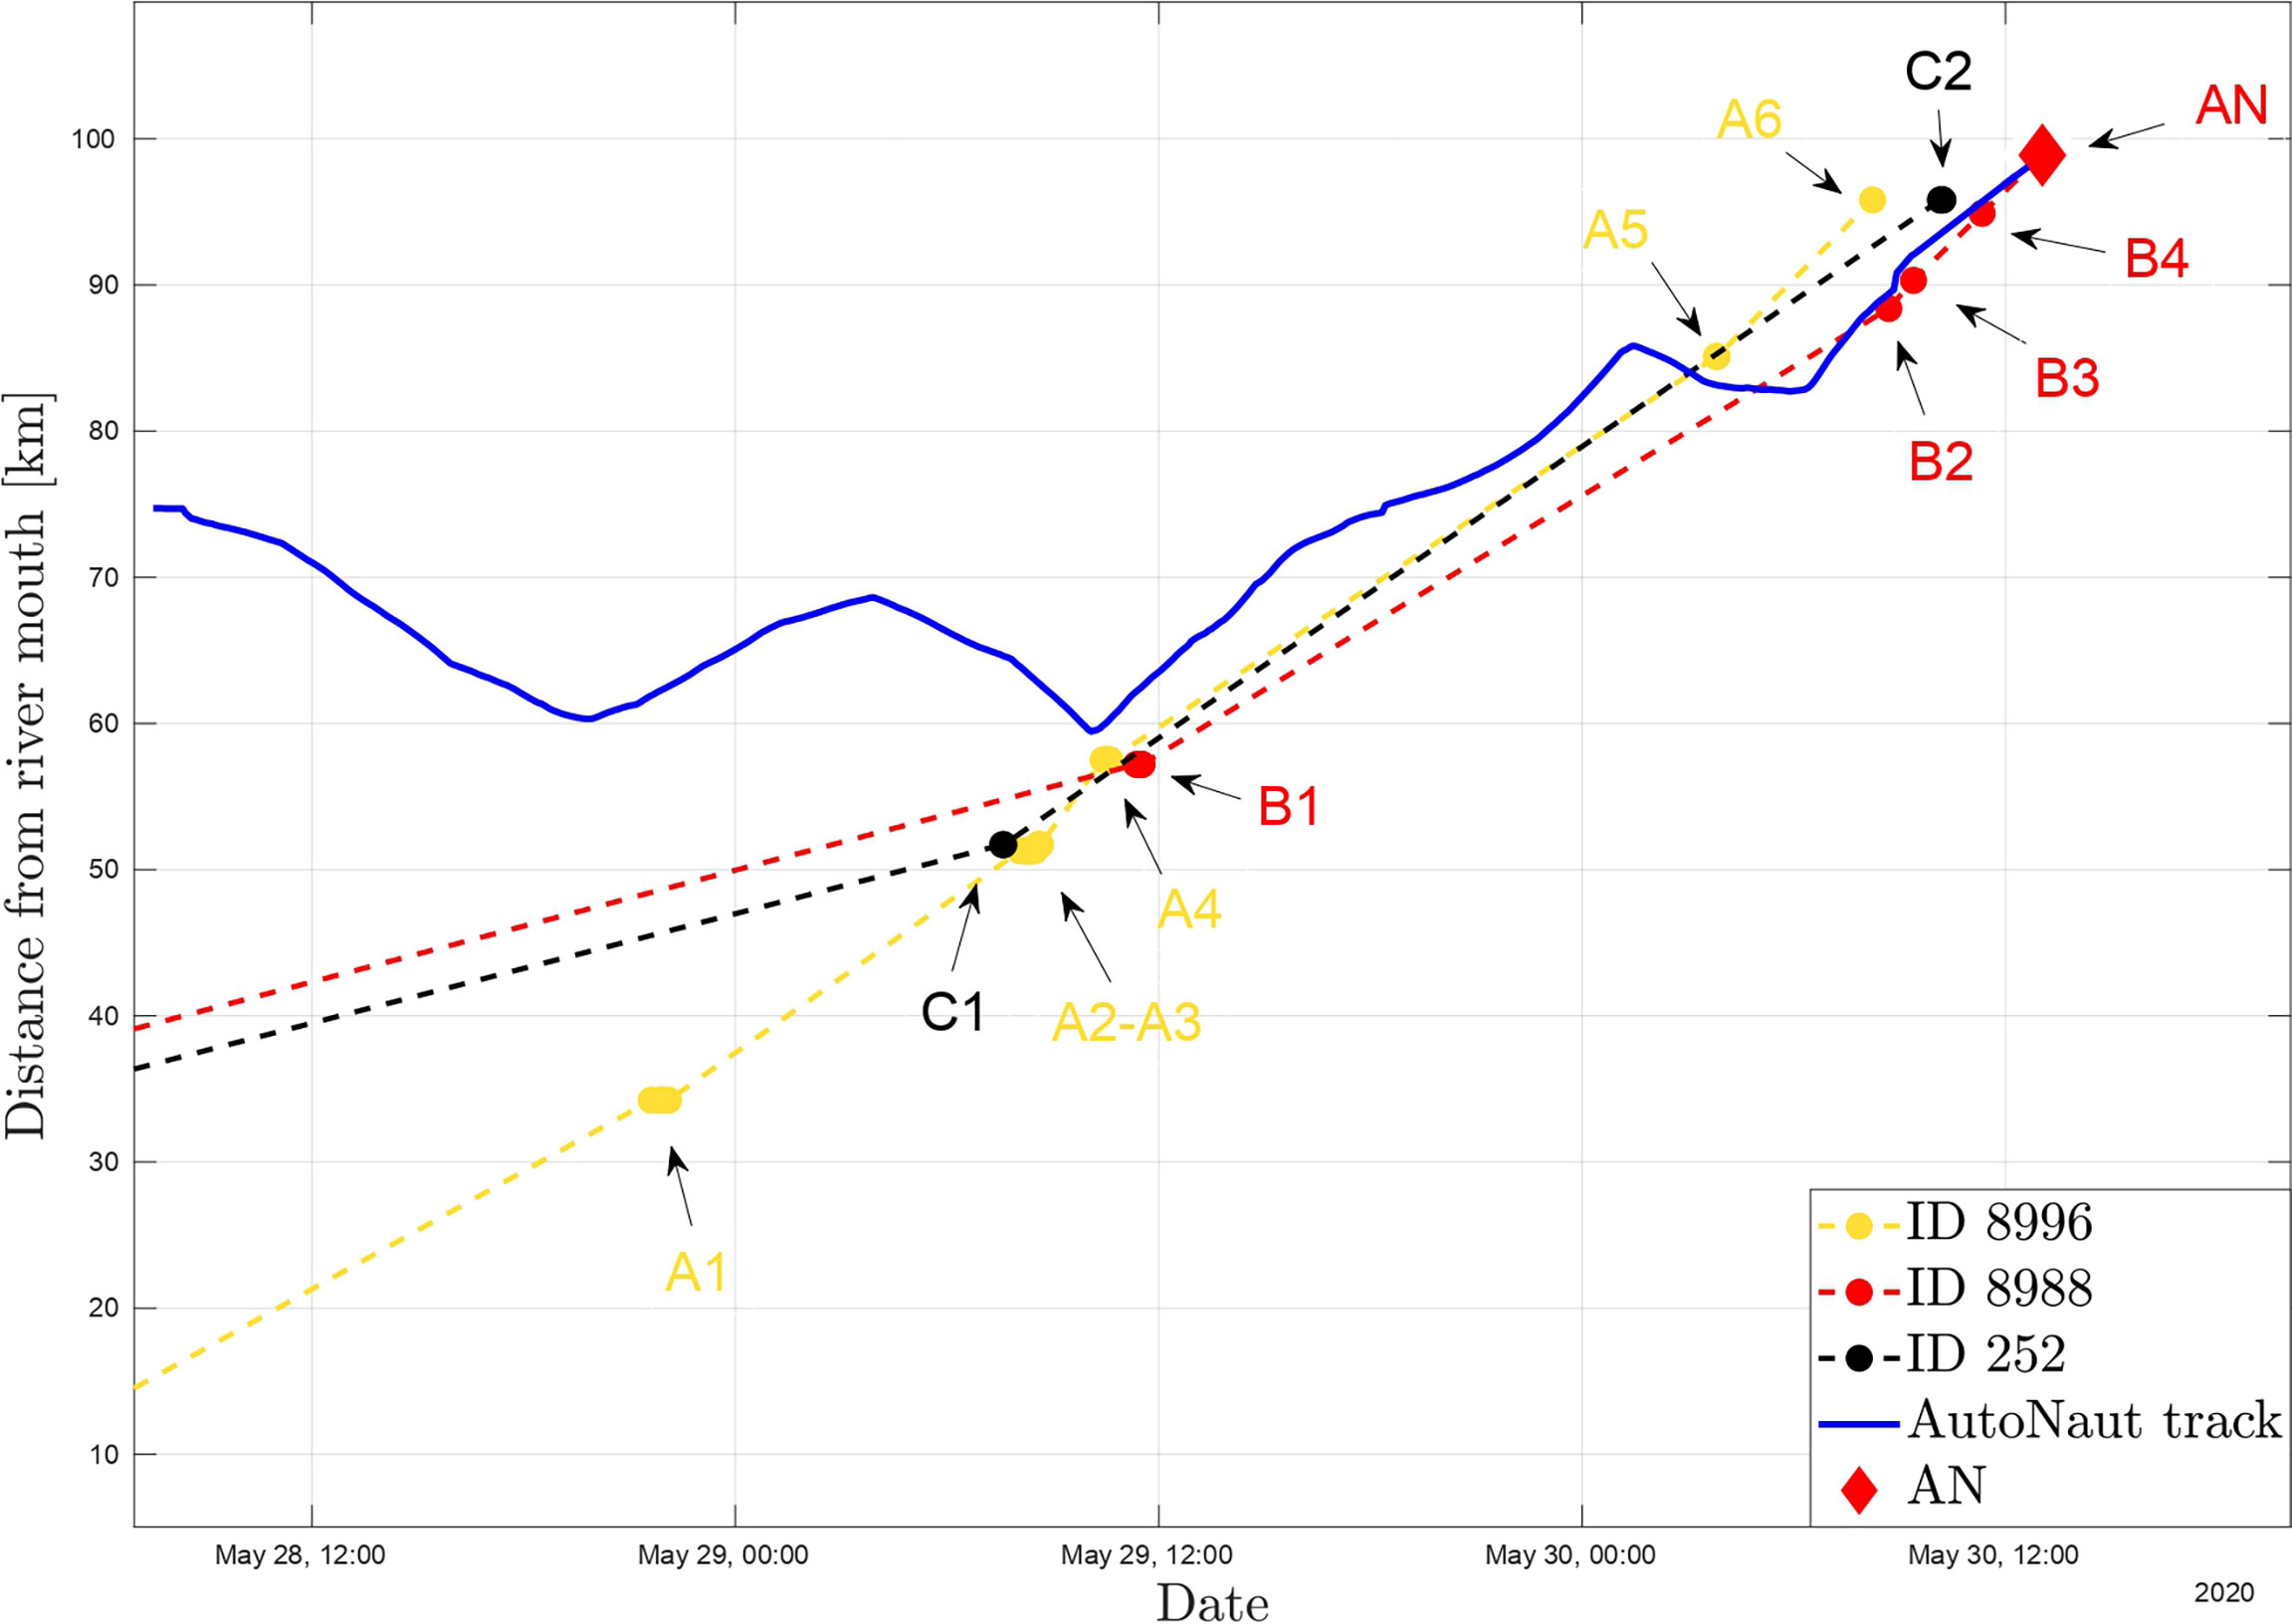
Figure 11 The distance from the Stryn estuary to the AutoNaut and the three fish. Coloured circles indicate detections on passive receivers (see Table 2), while the red diamond indicates the AutoNaut’s detection of fish 8988 in the open sea. Dashed lines represent interpolated fish positions based on the shortest straight path between receivers.
Finally, in the afternoon of May 30th, after having navigated around 3 km off the fjord into the open ocean, the AutoNaut system conveyed a successful detection of fish 8988, as indicated in Figure 10 (label AN). The salmon post-smolt had at that point migrated a (minimum) distance of around 100 km from the Stryn river estuary over a period of 4.5 days. Assuming that the speed and direction of movement in the hours up until the AutoNaut detection can be used to project the fish’ continued migration into the open ocean, the post-smolt would be 60-70 km offshore west of the Stad peninsula (N62.18°, E5.12°) the following day and arrive at the continental shelf in the Norwegian Sea about 6-7 days after leaving its natal river Stryn.
4 Discussion
Surface gliders have found widespread use as persistent, flexible and cost-effective ocean observation platforms in a variety of applications of ocean observation (Thomson and Girton, 2017; Whitt et al., 2020) and are also emerging as an interesting option as mobile and remotely operated sensing assets in fish movement studies (Carlon, 2015; Cimino et al., 2018; Cote et al., 2019). In this study we introduced an energy-autonomous robotic fish telemetry platform that was realised through the integration of a real-time acoustic receiver into a sea-going wave- and solar-powered USV. The vehicle frame and energy harvesting solutions were based on the commercially available AutoNaut USV (Johnston and Poole, 2017), while the vehicle’s control and communication systems were developed using standard hardware components and the open source LSTS DUNE unified software framework for autonomous vehicle control and connectivity (Pinto et al., 2013). The open architecture (Dallolio et al., 2019) permitted system-level integration of the acoustic receiver making fish detections along with other sensor data available in real-time to the vehicle’s onboard GNC (guidance, navigation and control) system, as well as to remote user interfaces and databases through cellular Internet connection.
The detection performance of the system was investigated by fitting a logistic regression model to range test data obtained from a controlled experiment using a small acoustic transmitter with physical specifications consistent with those used for tagging of salmon post-smolt and other small-sized fish. When the vehicle was passively driven by waves, the 50% detection probability radius was estimated from the model to 207 m, which is comparable to detection ranges observed using sentinel tags with similar specifications in long term deployments in stationary receiver arrays at sea [see e.g., Main (2021)]. Theoretical “sail-by” simulations based on the regression model predicted that a single detection can be expected at ranges up to around 350 m for very low passing speeds, while the corresponding range would be just above 300 m for the average vehicle speed maintained during the Nordfjord full-scale trial (0.4 ms-1). Assuming stationary transmitters, complete coverage of the 28 km2 fjord section traversed by the AutoNaut in Figure 9 would under these conditions be achieved in about 32 hours. These results are based on idealised assumptions and must be regarded as highly hypothetical, but may serve as ballpark figures for the sweeping efficiency of the vehicle system.
It should be noted that the range test was limited in time and conducted under relatively mild conditions in small waves and the result therefore reflects detection performance that could be expected in a situation with low levels of environmental noise and low to moderate vehicle motion. It is likely that the detection radius will decrease with an increasing sea state due to both added noise and the receiver’s proximity to the surface layer. However, Bingham et al. (2012) found that the noise generated by a comparable wave-driven surface vehicle (Wave Glider, Liquid Robotics) was low both around the glider/sinker and surface float and that sea state did not have a strong influence on the vehicle’s emitted noise at least up to 2.8 m significant wave height. It was also shown that noise dropped off considerably towards higher frequencies and was lowest at the highest frequency measured (60 kHz), which is close to the frequency spectrum normally utilized for acoustic fish tags in marine applications. An extensive range test spanning a wider range of sea states will nevertheless be required for a more complete characterisation of the AutoNaut’s detection performance under passive wave propulsion.
Although the AutoNaut is primarily a wave-driven vehicle, the auxiliary electric thruster serves as backup propulsion in flat calm conditions and to increase rudder force during tight manoeuvres or to counter drift forces when waves are insufficient to keep an acceptable forward speed. With its high rotational speed and proximity to the receiver (approx. 2 m from the receiver at the AutoNaut’s stern strut), it was considered important to quantify the thruster’s impact on detection performance. The range test confirmed that activation of the thruster increases ambient noise level in the relevant frequency bands and causes a more than 50% reduction in detection radius (to 95 m) as compared to pure wave propulsion. While the result clearly suggests that thruster activation should be minimized during fish tracking operations, it should be noted that measurements were obtained using one of the smallest and least powerful acoustic transmitters available (139 dB). The loss of detection performance was not complete even with a weak transmitter and could be accepted in situations where the alternative is a dead drifting vehicle or in studies where more powerful transmitters are applied. Nevertheless, a towed solution that separates the receiver by a greater distance from both the thruster and surface layer should be investigated and considered for future deployments. Technically, this can readily be achieved by suspending the receiver directly from the instrument keel by a properly arranged cable extension, which in principle could be several tens of meters without causing problems for the receiver’s RS-485 communication interface. The feasibility of using the AutoNaut with a towed acoustic sensor array was shown by Johnston and Pierpoint (2017), although issues like increased drag, entanglement risk and sub-optimal receiver orientation must be considered against the convenience of a clean keel-mounted solution.
The basic functionality of the vehicle concept as an energy-autonomous and remotely piloted mobile fish telemetry platform with real-time connectivity was demonstrated during a three-day trial in the outer regions of a fjord in western Norway. The trial provided an opportunity to experience genuine encounters between the vehicle and tagged fish since it was conducted in parallel with an already ongoing acoustic telemetry experiment targeting the seaward migration of Atlantic salmon post-smolts from rivers in the Nordfjord area. The early marine migration represents a critical life stage of salmon with an urgent need of improved scientific understanding (Thorstad et al., 2012), but insight is limited and precluded by the technical and practical difficulties of obtaining relevant observations beyond estuaries and confined coastal areas (Barry et al., 2020; Newton et al., 2021). Having a primary conceptual and technical focus, rigorous biological inference on post-smolt behaviour was not the aim of our study and it should neither be regarded as an integral part of the original biologically focused experiment, which will be reported elsewhere [see Bjerck et al. (2021)]. Nevertheless, along with the preceding detections recorded by the passive receivers, the fish detection made by the AutoNaut provides an interesting and rare observation of the pathway of an actively migrating salmon post-smolt extending beyond the fjord environment, at least in a Norwegian context. We therefore believe that the main contribution of this study relates to the manifestation of the AutoNaut’s ability to observe even small free-ranging fish in the ocean environment, and the associated prospects of evolving the concept into a powerful mobile autonomous fish telemetry tool with capacity to complement and extend the reach of traditional receiver setups and experimental designs. Considering that fish detection was possible despite the relatively short duration of the trial, and the fact that optimal system performance was impeded by the initial electrical noise interference problem as well as the thruster usage necessitated by the unusually calm weather conditions, we suggest that performance will improve as the system evolves from its prototypical state and more operational experience is gained.
Despite technical shortcomings, we generally consider our study as a tenable proof-of-concept that warrants further investigation into the performance of the system over a wider range of operating conditions and study objectives. Furthermore, we consider the prospects of exploiting the vehicle’s inherent capacity for autonomous operation and real-time networking with both mobile and stationary sensor assets (e.g., other vehicles, communication buoys and drifters) to be particularly promising. Although requiring considerable investments in equipment, technical development and operational experience, we believe that realisation of multi-agent collaborating systems of receiver and sensor resources of this kind will create novel and unprecedented opportunities for scientific inquiry in fish behaviour and movement ecology studies at sea.
Data Availability Statement
The raw data supporting the conclusions of this article will be made available by the authors, without undue reservation.
Ethics Statement
This study refers to another study in which approved, consolidated techniques for treating the involved individuals are documented.
Author Contributions
JA and HU conceived the study. AD, JA, and HU contributed to the design of the study. AD performed the hydrophone integration and led the preparation of the USV. AD and JA led the field tests presented in the study. HB and HU collected additional data and organized the acoustic detection database. AD and JA performed the statistical analysis. AD and JA wrote sections of the manuscript. All authors contributed to manuscript revision, read, and approved the submitted version.
Funding
The study was conducted as a part a long-term study on salmonids (KLAFF project), funded by County Governor of Vestland, PO3/4 Kunnskapsinkubator and Eid and Stryn river owner organizations. This work was also supported by the Research Council of Norway (RCN) through the MASSIVE project, grant number 270959, and AMOS grant number 223254 to NTNU.
Conflict of Interest
JA owns a minor share in Thelma Biotel AS, but the company had no role in conceiving the research and no funding, sponsoring or other financial support was received from the company.
The remaining authors declare that the research was conducted in the absence of any commercial or financial relationships that could be construed as a potential conflict of interest.
Publisher’s Note
All claims expressed in this article are solely those of the authors and do not necessarily represent those of their affiliated organizations, or those of the publisher, the editors and the reviewers. Any product that may be evaluated in this article, or claim that may be made by its manufacturer, is not guaranteed or endorsed by the publisher.
Acknowledgments
The authors would like to thank Nikolai Lauvås for his contribution in the development of the Grafana dashboard for real-time monitoring of acoustic detections.
Supplementary Material
The Supplementary Material for this article can be found online at: https://www.frontiersin.org/articles/10.3389/fmars.2022.857623/full#supplementary-material
Footnotes
- ^ http://www.autonautusv.com.
- ^ http://autonaut.itk.ntnu.no/doku.php.
- ^ https://www.thelmabiotel.com/wp-content/uploads/tb-live-datasheet-1.jpg.
- ^ https://www.thelmabiotel.com.
- ^ https://www.aanderaa.com/media/pdfs/d385_aanderaa_oxygen_sensor_4835.jpg.
- ^ https://www.seabird.com/combination-sensors/family?productCategoryId=54627869917.
- ^ https://grafana.com/.
References
Albouy C., Archambault P., Appeltans W., Araújo M., Beauchesne D., Cazelles K., et al. (2019). The Marine Fish Food Web Is Globally Connected. Nat. Ecol. Evol. 3, 1153–1161. doi: 10.1038/s41559-019-0950-y
Allen A. M., Singh N. J. (2016). Linking Movement Ecology With Wildlife Management and Conservation. Front. Ecol. Evol. 3. doi: 10.3389/fevo.2015.00155
Baktoft H., Gjelland K.Ø., Økland F., Thygesen U. H. (2017). Positioning of Aquatic Animals Based on Time-of-Arrival and Random Walk Models Using YAPS (Yet Another Positioning Solver). Sci. Rep. 7, 14294. doi: 10.1038/s41598-017-14278-z
Barry J., Kennedy R. J., Rosell R., Roche W. K. (2020). Atlantic Salmon Smolts in the Irish Sea: First Evidence of a Northerly Migration Trajectory. Fish. Manage. Ecol. 27, 517–522. doi: 10.1111/fme.12433
Bingham B., Kraus N., Howe B., Freitag L., Ball K., Koski P., et al. (2012). Passive and Active Acoustics Using an Autonomous Wave Glider. J. Field Robot. 29, 911–923. doi: 10.1002/rob.21424
Bjerck H., Urke H., Haugen T., Alfredsen J. A., Ulvund J., Kristensen T. (2021). Synchrony and Multimodality in the Timing of Atlantic Salmon Smolt Migration in Two Norwegian Fjords. Sci. Rep. 11. doi: 10.1038/s41598-021-85941-9
Chaput G., Carr J., Daniels J., Tinker S., Jonsen I., Whoriskey F. (2018). Atlantic Salmon (Salmo Salar) Smolt and Early Post-Smolt Migration and Survival Inferred From Multi-Year and Multi-Stock Acoustic Telemetry Studies in the Gulf of St. Lawrence, Northwest Atlantic. ICES. J. Mar. Sci. 76, 1107–1121. doi: 10.1093/icesjms/fsy156
Cimino M., Cassen M., Merrifield S., Terrill E. (2018). Detection Efficiency of Acoustic Biotelemetry Sensors on Wave Gliders. Anim. Biotel. 6. doi: 10.1186/s40317-018-0160-4
Clark C. M., Forney C., Manii E., Shinzaki D., Gage C., Farris M., et al. (2013). Tracking and Following a Tagged Leopard Shark With an Autonomous Underwater Vehicle. J. Field Robot. 30, 309–322. doi: 10.1002/rob.21450
Cote D., Nicolas J.-M., Whoriskey F., Cook A. M., Broome J., Regular P. M., et al. (2019). Characterizing Snow Crab (Chionoecetes Opilio) Movements in the Sydney Bight (Nova Scotia, Canada): A Collaborative Approach Using Multiscale Acoustic Telemetry. Can. J. Fish. Aquat. Sci. 76, 334–346. doi: 10.1139/cjfas-2017-0472
Dallolio A., Øveraas H., Alfredsen J.A., Fossen T.I., Johansen T. (2022). Design and Validation of a Course Control System for A Wave-Propelled Unmanned Surface Vehicle. Field Robot. 2, 748-773. doi 10.55417/fr.2022025
Dallolio A., Agdal B., Zolich A., Alfredsen J. A., Johansen T. A. (2019). Long-Endurance Green Energy Autonomous Surface Vehicle Control Architecture OCEANS (Seattle, Washington: IEEE).
Dias P. S., Fraga S. L., Gomes R. M., Goncalves G. M., Pereira F. L., Pinto J., et al. (2005). “NEPTUS- a Framework to Support Multiple Vehicle Operation,” in Proc Oceans MTS/IEEE Conference, Brest, France. 963–968.
Donaldson M. R., Hinch S. G., Suski C. D., Fisk A. T., Heupel M. R., Cooke S. J. (2014). Making Connections in Aquatic Ecosystems With Acoustic Telemetry Monitoring. Front. Ecol. Environ. 12, 565–573. doi: 10.1890/130283
Eiler J. H., Grothues T. M., Dobarro J. A., Masuda M. M. (2013). Comparing Autonomous Underwater Vehicle (Auv) and Vessel-Based Tracking Performance for Locating Acoustically Tagged Fish. Mar. Fish. Rev. 75. doi: 10.7755/MFR.75.4.2
Eiler J., Grothues T., Dobarro J., Shome R. (2019). Tracking the Movements of Juvenile Chinook Salmon Using an Autonomous Underwater Vehicle Under Payload Control. Appl. Sci. 9, 2516. doi: 10.3390/app9122516
Ennasr O., Holbrook C., Hondorp D. W., Krueger C. C., Coleman D., Solanki P., et al. (2020). Characterization of Acoustic Detection Efficiency Using a Gliding Robotic Fish as a Mobile Receiver Platform. Anim. Biotel. 8, 32. doi: 10.1186/s40317-020-00219-7
Grothues T. M., Dobarro J., Ladd J., Higgs A., Niezgoda G., Miller D. (2008). Use of a Multi-Sensored Auv to Telemeter Tagged Atlantic Sturgeon and Map Their Spawning Habitat in the Hudson River, USA. IEEE/OES. Autonomous. Underwat. Vehicle. 1–7. doi: 10.1109/AUV.2008.5347597
Halpern B. S., Frazier M., Potapenko J., Casey K. S., Koenig K., Longo C., et al. (2015). Spatial and Temporal Changes in Cumulative Human Impacts on the World’s Ocean. Nat. Commun. 6, 7615. doi: 10.1038/ncomms8615
Hassan W., Føre M., Ulvund J., Alfredsen J. (2019). Internet of Fish: Integration of Acoustic Telemetry With LPWAN for Efficient Real-Time Monitoring of Fish in Marine Farms. Comput. Electron. Agric. 163. doi: 10.1016/j.compag.2019.06.005
Haulsee D., Breece M., Miller D., Wetherbee B., Fox D., Oliver M. (2015). Habitat Selection of a Coastal Shark Species Estimated From an Autonomous Underwater Vehicle. Mar. Ecol. Prog. Ser. 528, 277–288. doi: 10.3354/meps11259
Hedger R., Martin F., Dodson J., Hatin D., Caron F., Whoriskey F. (2008). Optimized Interpolation of Fish Positions and Speeds in an Array of Fixed Acoustic Receivers. ICES. J. Mar. Sci. 65. doi: 10.1093/icesjms/fsn109
Hussey N. E., Kessel S. T., Aarestrup K., Cooke S. J., Cowley P. D., Fisk A. T., et al. (2015). Aquatic Animal Telemetry: A Panoramic Window Into the Underwater World. Science 348. doi: 10.1126/science.1255642
Huveneers C., Simpfendorfer C. A., Kim S., Semmens J. M., Hobday A. J., Pederson H., et al. (2016). The Influence of Environmental Parameters on the Performance and Detection Range of Acoustic Receivers. Methods Ecol. Evol. 7, 825–835. doi: 10.1111/2041-210X.12520
Jackson G. (2011). The Development of the Pacific Ocean Shelf Tracking Project Within the Decade Long Census of Marine Life. PloS One 6, e18999. doi: 10.1371/journal.pone.0018999
Johnston P., Pierpoint C. (2017). “Deployment of a Passive Acoustic Monitoring (PAM) Array From the AutoNaut Wave-Propelled Unmanned Surface Vessel (USV),” in OCEANS 2017 - Aberdeen (IEEE). doi: 10.1109/oceanse.2017.8084780
Johnston P., Poole M. (2017). Marine Surveillance Capabilities of the Autonaut Wave-Propelled Unmanned Surface Vessel (USV). In:. OCEANS. 2017. - Aberdeen., 1–46. doi: 10.1109/OCEANSE.2017.8084782
Katti S. K., Rao A. V. (1968). Handbook of the Poisson Distribution. Technometrics 10, 412–412. doi: 10.1080/00401706.1968.10490580
Kessel S. T., Cooke S. J., Heupel M. R., Hussey N. E., Simpfendorfer C. A., Vagle S., et al. (2013). A Review of Detection Range Testing in Aquatic Passive Acoustic Telemetry Studies. Rev. Fish. Biol. Fish. 24, 199–218. doi: 10.1007/s11160-013-9328-4
Kraus R., Holbrook C., Vandergoot C., Stewart T., Faust M., Watkinson D., et al. (2018). Evaluation of Acoustic Telemetry Grids for Determining Aquatic Animal Movement and Survival. Methods Ecol. Evol. 9 (6), 1489-1502. doi: 10.1111/2041-210X.12996
Leggett W. C. (1977). The Ecology of Fish Migrations. Annu. Rev. Ecol. Systemat. 8, 285–308. doi: 10.1146/annurev.es.08.110177.001441
Lennox R. J., Aarestrup K., Cooke S. J., Cowley P. D., Deng Z. D., Fisk A. T., et al. (2017). Envisioning the Future of Aquatic Animal Tracking: Technology, Science, and Application. BioScience 67, 884–896. doi: 10.1093/biosci/bix098
Lewison R., Hobday A. J., Maxwell S., Hazen E., Hartog J. R., Dunn D. C., et al. (2015). Dynamic Ocean Management: Identifying the Critical Ingredients of Dynamic Approaches to Ocean Resource Management. BioScience 65, 486–498. doi: 10.1093/biosci/biv018
Lin Y., Hsiung J., Piersall R., White C., Lowe C. G., Clark C. M. (2017). A Multi-Autonomous Underwater Vehicle System for Autonomous Tracking of Marine Life. J. Field Robot. 34, 757–774. doi: 10.1002/rob.21668
Main R. A. K. (2021). Migration of Atlantic Salmon (Salmo Salar) Smolts and Post-Smolts From a Scottish East Coast River (University of Glasgow), Glasgow. doi: 10.5525/gla.thesis.82089
Masmitja I., Navarro J., Gomariz S., Aguzzi J., Kieft B., O’Reilly T., et al. (2020). Mobile Robotic Platforms for the Acoustic Tracking of Deep-Sea Demersal Fishery Resources. Sci. Robot. 5, eabc3701. doi: 10.1126/scirobotics.abc3701
Mitamura H., Thorstad E., Uglem I., Økland F. (2017). In Situ Measurement of Salinity During Seaward Migration of Atlantic Salmon Post-Smolts Using Acoustic Transmitters With Data-Storage Capabilities and Conventional Acoustic Transmitters. Anim. Biotel. 5. doi: 10.1186/s40317-017-0120-4
Morais P., Daverat F. (2016). An Introduction to Fish Migration (CRC Press), Boca Raton. doi: 10.1201/b21321
Newton M., Barry J., Lothian A., Main R., Honkanen H., Mckelvey S., et al. (2021). Counterintuitive Active Directional Swimming Behaviour by Atlantic Salmon During Seaward Migration in the Coastal Zone. ICES. J. Mar. Sci. 78, 1730–1743. doi: 10.1093/icesjms/fsab024
Oliver M. J., Breece M. W., Fox D. A., Haulsee D. E., Kohut J. T., Manderson J., et al. (2013). Shrinking the Haystack: Using an AUV in an Integrated Ocean Observatory to Map Atlantic Sturgeon in the Coastal Ocean. Fisheries 38, 210–216. doi: 10.1080/03632415.2013.782861
Oliver M., Breece M., Haulsee D., Cimino M., Kohut J., Aragon D., et al. (2017). Factors Affecting Detection Efficiency of Mobile Telemetry Slocum Gliders. Anim. Biotel. 5. doi: 10.1186/s40317-017-0129-8
Papoulis A., Pillai S. (2002). “Probability, Random Variables, and Stochastic Processes. McGraw-Hill Series in Electrical Engineering,” in Communications and Signal Processing (McGraw-Hill), New York.
Pincock D. G., Johnston S. V. (2012). “Acoustic Telemetry Overview,” in Telemetry Techniques: A User Guide for Fisheries Research. Eds. Adams N. S., Beeman J. W., Eiler J. H. (American Fisheries Society), Bethesda, Maryland.
Pinto J., Dias P. S., Martins R., Fortuna J., Marques E. R. B., de Sousa J. B. (2013). “The Lsts Toolchain for Networked Vehicle Systems,” in MTS/IEEE OCEANS - Bergen. 1–9. doi: 10.1109/OCEANS-Bergen.2013.6608148
Secor D. (2015). Migration Ecology of Marine Fishes (Johns Hopkins University Press), Baltimore. doi: 10.1353/book.39942
Simpfendorfer C., Heupel M., Hueter R. (2002). Estimation of Short-Term Centers of Activity From an Array of Omnidirectional Hydrophones and its Use in Studying Animal Movements. Can. J. Fish. Aquat. Sci. 59, 23–32. doi: 10.1139/f01-191
Steckenreuter A., Hoenner X., Huveneers C., Simpfendorfer C., Buscot M. J., Tattersall K., et al. (2017). Optimising the Design of Large-Scale Acoustic Telemetry Curtains. Mar. Freshwat. Res. 68, , 1403–, 1413. doi: 10.1071/MF16126
Thomson J., Girton J. (2017). Sustained Measurements of Southern Ocean Air-Sea Coupling From a Wave Glider Autonomous Surface Vehicle. Oceanog. Vol. 30, 104–109. doi: 10.5670/oceanog.2017.228
Thorstad E. B., Whoriskey F., Uglem I., Moore A., Rikardsen A. H., Finstad B. (2012). A Critical Life Stage of the Atlantic Salmon Salmo Salar: Behaviour and Survival During the Smolt and Initial Post-Smolt Migration. J. Fish. Biol. 81, 500–542. doi: 10.1111/j.1095-8649.2012.03370.x
Urke H., Daae K., Viljugrein H., Kandal I., Staalstrøm A., Jansen P. (2021). Improvement of Aquaculture Management Practice by Integration of Hydrodynamic Modelling. Ocean. Coast. Manage. 213, 105849. doi: 10.1016/j.ocecoaman.2021.105849
Urke H. A., Kristensen T., Ulvund J. B., Alfredsen J. A. (2013). Riverine and Fjord Migration of Wild and Hatchery-Reared Atlantic Salmon Smolts. Fish. Manage. Ecol. 20, 544–552. doi: 10.1111/fme.12042
Welch D., Boehlert G., Ward B. (2002). Post-The Pacific Ocean Salmon Tracking Project. Oceanologica. Acta 5. doi: 10.1016/S0399-1784(02)01206-9
Whitt C., Pearlman J., Polagye B., Caimi F., Muller-Karger F., Copping A., et al. (2020). Future Vision for Autonomous Ocean Observations. Front. Mar. Sci. 7. doi: 10.3389/fmars.2020.00697
Wilmers C. C., Nickel B., Bryce C. M., Smith J. A., Wheat R. E., Yovovich V. (2015). The Golden Age of Bio-Logging: How Animal-Borne Sensors Are Advancing the Frontiers of Ecology. Ecology 96, 1741–1753. doi: 10.1890/14-1401.1
Keywords: ocean observation, unmanned surface vehicle, wave glider, acoustic telemetry, fish tracking, fish movement, Atlantic salmon, post-smolt
Citation: Dallolio A, Bjerck HB, Urke HA and Alfredsen JA (2022) A Persistent Sea-Going Platform for Robotic Fish Telemetry Using a Wave-Propelled USV: Technical Solution and Proof-of-Concept. Front. Mar. Sci. 9:857623. doi: 10.3389/fmars.2022.857623
Received: 18 January 2022; Accepted: 05 May 2022;
Published: 07 July 2022.
Edited by:
Hervé Claustre, Centre National de la Recherche Scientifique (CNRS), FranceReviewed by:
Christoph Waldmann, University of Bremen, GermanyHannele Honkanen, University of Glasgow, United Kingdom
Copyright © 2022 Dallolio, Bjerck, Urke and Alfredsen. This is an open-access article distributed under the terms of the Creative Commons Attribution License (CC BY). The use, distribution or reproduction in other forums is permitted, provided the original author(s) and the copyright owner(s) are credited and that the original publication in this journal is cited, in accordance with accepted academic practice. No use, distribution or reproduction is permitted which does not comply with these terms.
*Correspondence: Alberto Dallolio, YWxiZXJ0by5kYWxsb2xpb0BudG51Lm5v