 Jianfeng Tong
 Minghua Xue
 Zhenhong Zhu
 Weiqi Wang
 Siquan Tian
- 1College of Marine Sciences, Shanghai Ocean University, Shanghai, China
- 2National Engineering Research Center for Oceanic Fisheries, Shanghai Ocean University, Shanghai, China
- 3Key Laboratory of Sustainable Exploitation of Oceanic Fisheries Resources, Ministry of Education, Shanghai, China
- 4Key Laboratory of Oceanic Fisheries Exploration, Ministry of Agriculture and Rural Affairs, Shanghai, China
Chub mackerel (Scomber japonicus) is an important commercial fish in the Northwest Pacific Ocean. Accurate target strength (TS) underpins acoustic stock assessment but the TS of S. japonicus is still poorly understood. In this study, the Kirchhoff-ray mode (KRM) model was used to estimate the TS of S. japonicus and its relationship with sound wave frequency and fish morphology. The results revealed that TS values varied with pitch angle shifts, with the impact on fish scattering strength being greater at higher frequency. This is less important because 38 kHz has been used for the biomass assessment of these fish resources. At frequencies of 38 kHz, 70 kHz, 120 kHz and 200 kHz, TS was greatest at a pitch angle range of -10° to 0°, which was related to the angle of the swim bladder tilt. There were almost no differences between TS estimated using the measured pitch angle distributions and using the universal distribution. When the measured pitch angle was N[-3°,4°], the average TS of S. japonicus with body length of 12.04–22.17 cm at four frequencies was -48.88 dB, -49.14 dB, -49.75 dB and -48.55 dB, respectively. The regression intercept (b20) in TS–body length equation was -73.27 dB, -73.56 dB, -74.18 dB and -73.46 dB, respectively. Variation in TS range at 0–300 m depth was about 10 dB. The simulated broadband target strength spectrum shows the scattering characteristics of individuals with different swim bladder length between 0–250 kHz. These results could be used for identification of S. japonicus in echograms and provide reference for acoustic stock assessment of S. japonicus in the Northwest Pacific Ocean.
Introduction
The Northwest Pacific Ocean has abundant fishery resources (Chiba et al., 2009; Miyamoto et al., 2020). As the most productive marine fishery area in the world, total catches in this area reached 20.06 million tons in 2018, accounting for 23.76% of total marine catches (FAO, 2020). Chub mackerel (Scomber japonicus) is a warm-water pelagic fish. As one of the most economically important fish species in the Northwest Pacific Ocean, it plays an important role in the marine fisheries of China, Japan, and South Korea. Total global catch of S. japonicus was 1.56 million tons in 2018, accounting for 2% of total marine catches (FAO, 2020). However, S. japonicus biomass has declined sharply since 1997 and has remained low over the past few decades (Takahashi et al., 2014). To develop appropriate fishery management measures and sustainably use S. japonicus resources, it is necessary to assess its biomass accurately.
Underwater acoustic surveys can provide high-resolution information in large-scale bodies of water and are widely used in monitoring behavior of marine organisms (Muñoz et al., 2020), habitat distribution research (Zhang et al., 2020), and stock assessment (Stierhoff et al., 2019; Escobar-Flores et al., 2020). Target strength (TS) is a key parameter used to identify species in the echogram and convert the echo signal into biomass. TS varies between species and is affected by many factors including swim bladder characteristics (Foote, 1980), body size (Lu et al., 2011), swimming pitch angle (Horne, 2003), water depth (Mukai and Iida, 1996), and incident sound wave frequency (Foote, 1982). Therefore, it is very important to correctly identify target species, estimate their TS, and understand the factors that affect TS variation to accurately assess stocks of marine fish.
Estimation methods of TS mainly include in situ, ex situ, and theoretical models (Sobradillo et al., 2021). The in situ method records the TS of fish in their natural environment. This method requires the target fish to be discretely distributed and single-species (Simmonds and MacLennan, 2005). However, these conditions are difficult to satisfy, especially in mixed species aggregations. The ex situ method measures the TS of target fish in an artificial acoustic experimental arena; however, the experimental arena is challenging to set up and has poor flexibility. Theoretical models approximate the main source of acoustic scattering to a regular geometric model based on scattering theories and biological characteristics of the fish. Then, computer simulations are used to estimate TS. Because the model method is simple, flexible and low-cost, it could enable the study of the factors affecting TS (Hazen and Horne, 2003). Additionally, theoretical models could improve the ability to identify and classify targets in echograms (Jech and Horne, 2002) and reduce the uncertainty of stock assessment (Khodabandeloo et al., 2021).
The Kirchhoff-ray mode (KRM) model could simulate the process of sound waves from seawater into the body and swim bladder of fish. It uses low-mode solutions and Kirchhoff-ray approximations to estimate resonant and geometric backscatter from the body and swim bladder of fish (Gauthier and Horne, 2004). The results of the KRM model are consistent with those of in situ and ex situ methods (Horne, 2003; Kang et al., 2004; Kusdinar et al., 2014). Some researchers have used the KRM model to study the effects of different factors on TS. For example, Hazen and Horne (2003) used KRM to determine that pitch angle and frequency had greater effects on walleye pollock (Theragra chalcogramma) TS compared to length, while depth had the least effect. Gauthier and Horne (2004) established the TS–length equation for five pelagic fish species in the Bering Sea and the Gulf of Alaska.
The purpose of this study was to estimate the impacts of morphological characteristics on the TS of S. japonicus in the Northwest Pacific Ocean, so as to improve the acoustic stock assessment accuracy. First, the morphological characteristics of the swim bladder and its changes with fish growth were described based on X-ray images. Then, the KRM model was used to calculate theTS of S. japonicus and to analyze variation in TS with fish body and swim bladder shape at different frequencies. Four common frequencies used in acoustic fishery surveys, including 38 kHz, 70 kHz, 120 kHz and 200 kHz, were selected. Finally, a broadband TS spectrum was produced by simulating the variation of TS with frequency in the range of 0–250 kHz. Our work could provide a scientific basis for signal identification of S. japonicus in echograms and provide reference for acoustic stock assessment of S. japonicus in the Northwest Pacific Ocean.
Materials and Methods
Field Sampling
Samples were obtained from 147°E–165°E, 33°N–44°N in the Northwest Pacific Ocean by the Shanghai Ocean University research vessel (RV) Songhang. The survey was conducted from June 18 to August 7, 2021 using a four-panel midwater trawl with a mean speed of 4.6 knots. Samples were frozen in seawater immediately after being captured and stored in plastic bottles at -20°C onboard the research vessel.
Morphological Measurements
One month after capture, frozen samples were transferred to the laboratory. There, the bottles were slowly thawed in cold water over a period of 20 h to minimize any changes in swim bladder shape (Yasuma et al., 2010). After the length and weight measurements of samples were recorded, a specialized MIKASA HF100HA X-ray imaging system, with input voltage of AC220 V maximum tube voltage of 100 kV, and maximum tube current of 40 mA, was used to map the outlines of each fish. Both lateral and dorsal aspects from 18 individuals were X-rayed. Morphological parameters of each sample were measured as shown in Figure 1, including body length (BL), body height (BH), body width (BW), swim bladder length (SL), swim bladder height (SH) and swim bladder width (SW). The swim bladder tilt angle was also measured relative to the main axis of the lateral image aspect.
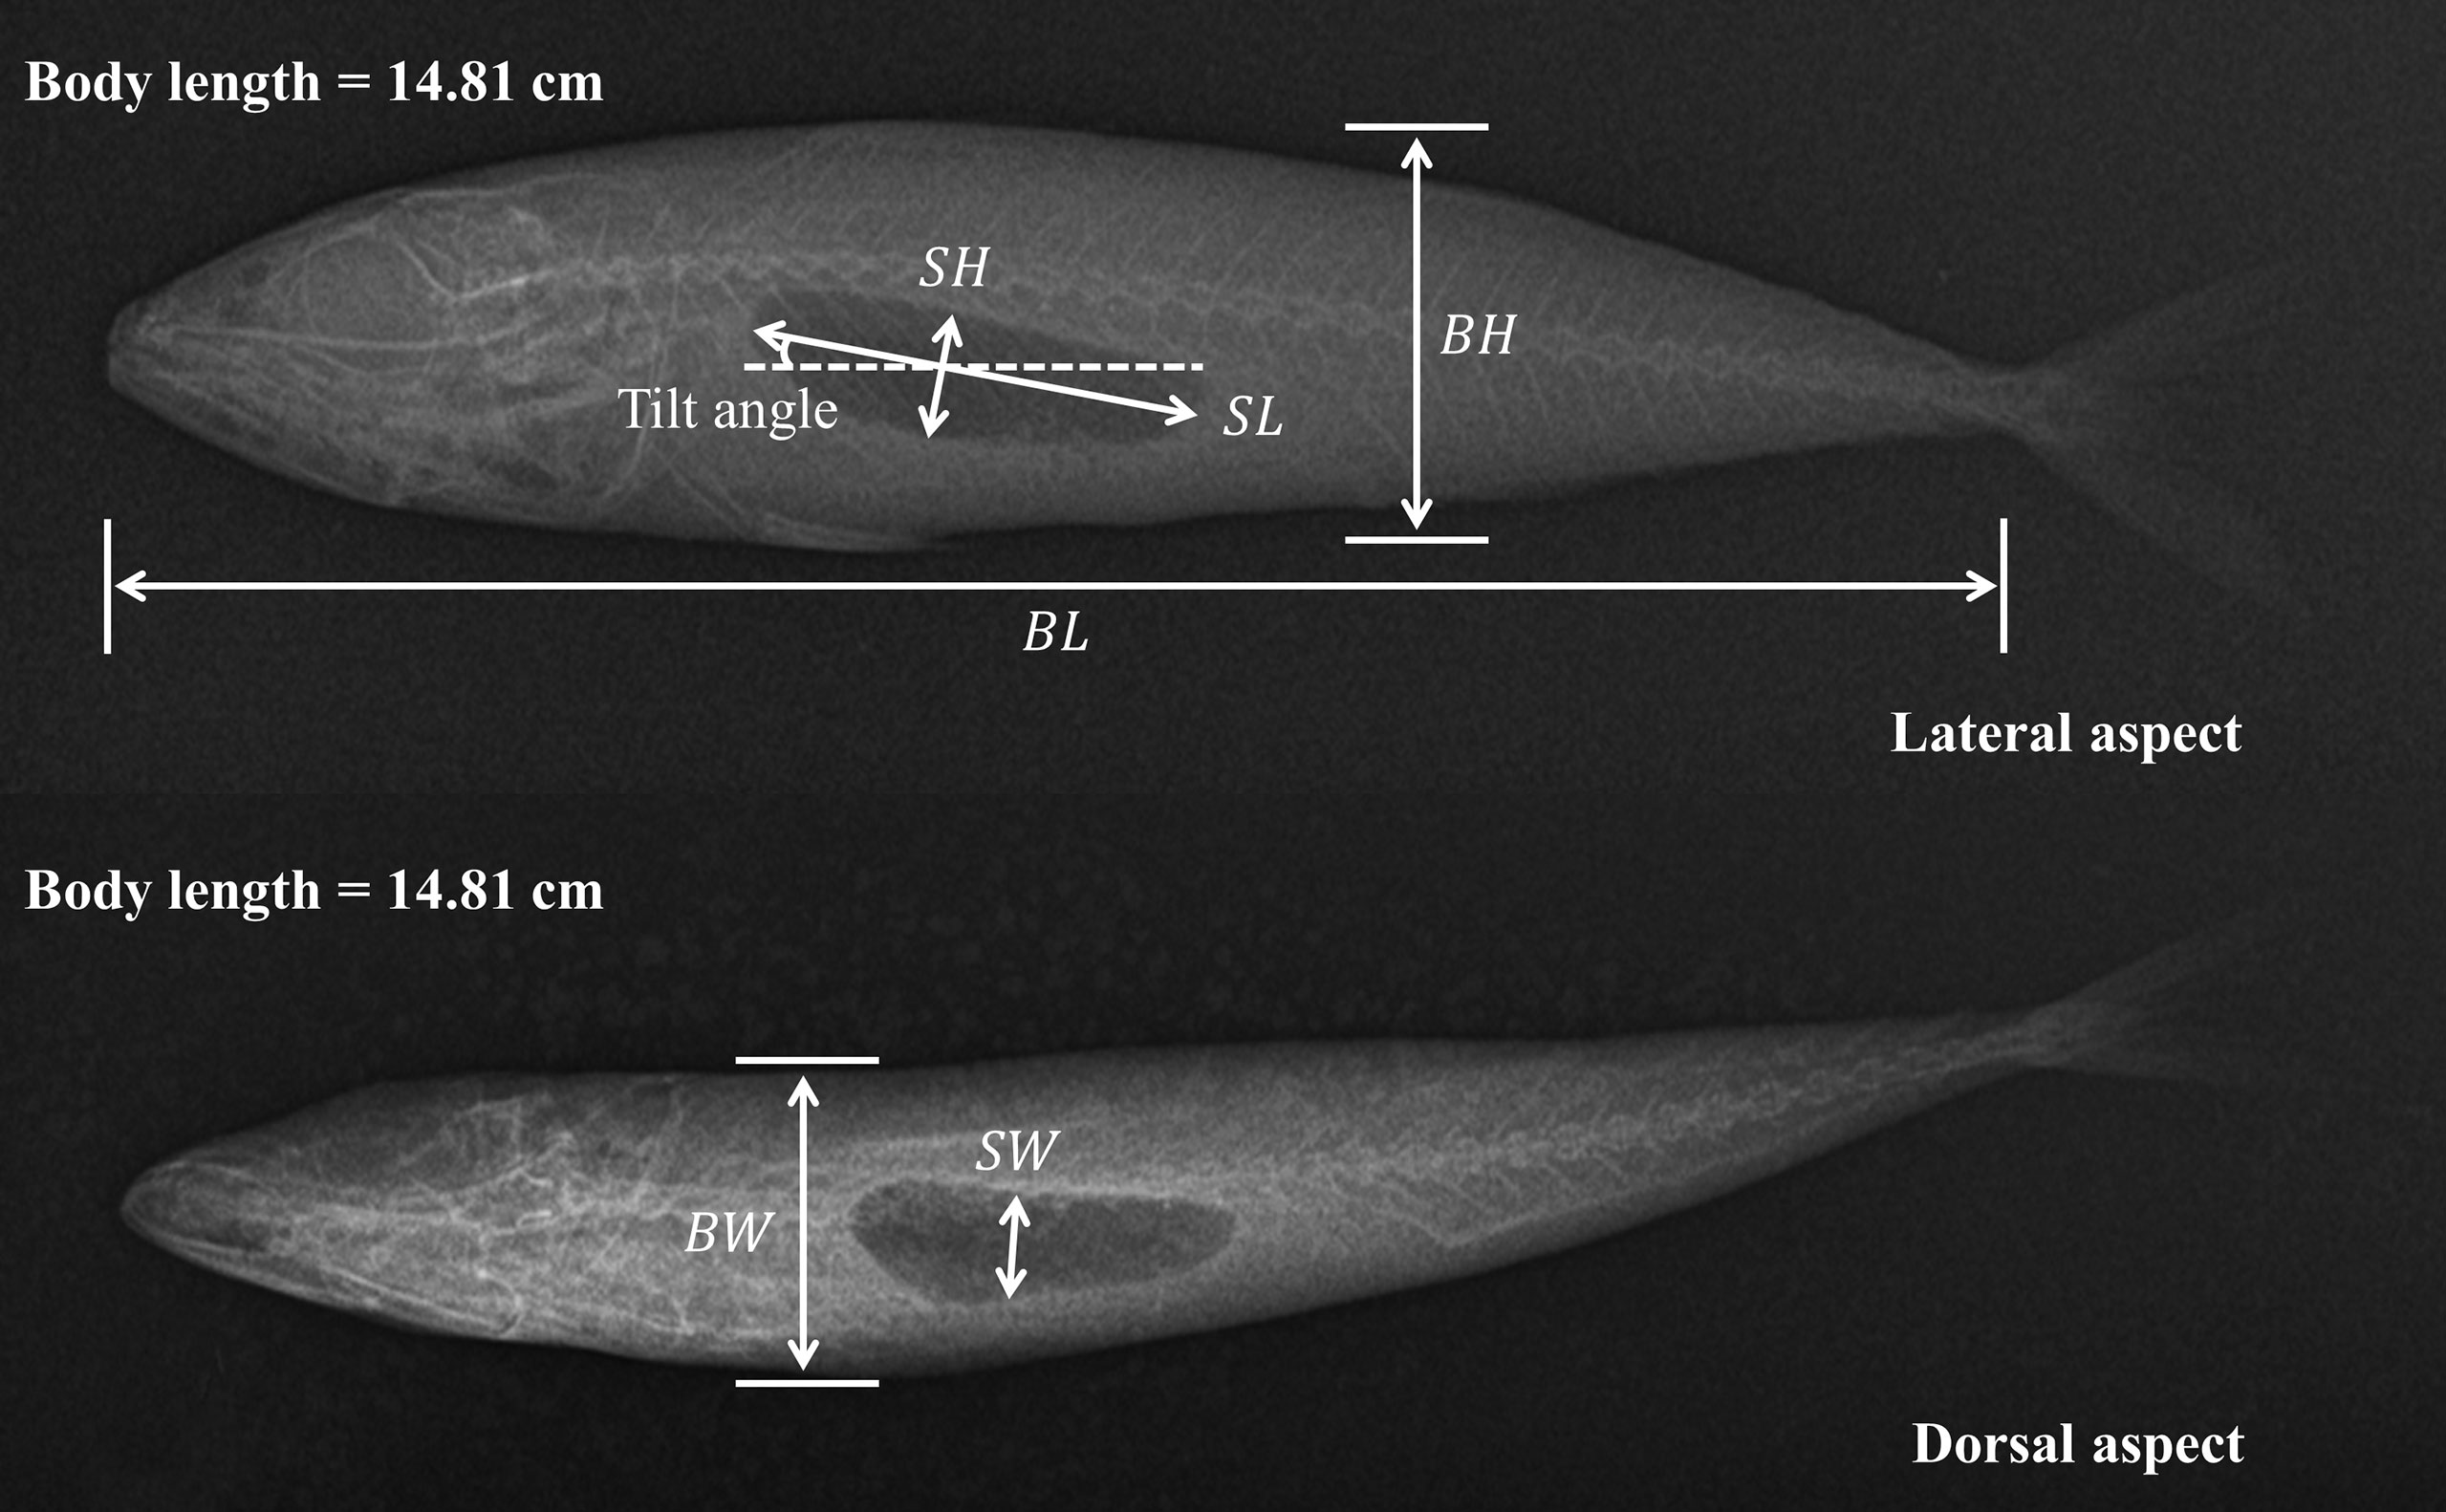
Figure 1 Morphological measurements on lateral and dorsal X-ray images. The air-filled swim bladder can be seen as a dark shape within the fish body. The symbols BL, BH and BW represent body length, body height, and body width, respectively. While the symbols SL, SH and SW represent swim bladder length, swim bladder height, and swim bladder width, respectively.
TS Estimation
Since the lack of in situ data, the KRM model (Clay and Horne, 1994) was used to estimate TS. Acoustic parameters, such as the density contrast (g) and sound speed contrast (h), were needed in this model. Previous researchers found that fish flesh had g values ranging from ~1.02 to 1.06 and h values from ~1.02 to 1.08 (Love, 1978; Medwin and Clay, 1998; Gastauer et al., 2016). Typical acoustic parameters of fish with a swim bladder, measured using Atlantic cod (Gadus morhua), from literature (Clay and Horne, 1994) were chosen in our model (Table 1), which were also used in the jack mackerel (Trachurus japonicus) TS research performed by Hwang et al. (2015). TS of fish is closely related to the sound wave frequency and the swimming pitch angle. Broadband scattering characteristics with a frequency in the range of 0–250 kHz were simulated to plot the entire broadband TS spectrum. According to Yasuma et al. (2003), when the incidence sound wave is perpendicular to the dorsal aspect of the fish body, the pitch angle is defined as 0°. Shifts in TS, when the swimming pitch angle ranged from −50° (head-down) to 50° (head-up), were estimated at frequencies of 38 kHz, 70 kHz, 120 kHz, and 200 kHz. Average TS value was calculated from estimated TS across the pitch angle distribution. This value was used as the TS of individual fish (Yasuma et al., 2010). Pitch angle follows a normal distribution defined by where is the mean pitch angle and Std is the standard deviation (Furusawa, 1988; Bairstow et al., 2021). In this paper, three previously determined pitch angle distributions were used. Two of them were observed from S. japonicus, N[−3°,4°] (Nauen and Lauder, 2002) and N[−0.5°,0.09°] (Gibb et al., 1999), while another one was a universal distribution calculated from many species, N[−5°,10°] (Kusdinar et al., 2014; Sun et al., 2021). The average TS of S. japonicus could be calculated as follows:
Table 1 Acoustic parameters used in the KRM model of the TS of S. japonicus.
Where is the average TS of all S. japonicus samples, and is the average backscattering cross-section of all samples. According to Boyle’s law (Scoulding et al., 2015; Proud et al., 2019), the following model (Sobradillo et al., 2019) was used to estimate TS variation relative to depth:
where σz is the backscattering cross-section at depth z, and a is the estimated contraction rate whose value is −0.67 for a free ellipsoid (Ona, 2003).
The relationship between TS and body length at four frequencies was analyzed using the least-squares method. TS–body length equation could be expressed as:
where a is the slope of the regression, b is the intercept, and BL represents body length. According to Furusawa (1988), equation (3) could be transformed into:
where b20 is the intercept when a=20.
Results
Morphology of S. japonicus
The range of body length of the 18 S. japonicus was 12.98–22.17 cm, with a mean of 16.08±3.15 cm (mean ± SD). The range of swim bladder length was 1.45–6.63 cm, with a mean of 3.64 ± 1.49 cm. Tilt angle was from 1.7° to 14.0° and mean tilt angle was 8.26° ± 3.62°.
TS Variation With Body Pitch Angle Shifts
Figure 2 shows TS variation of each sample in relation to pitch angle shifts. We used ∆TS (TSmax-TSmin) to represent this variation. When pitch angle shifted from −50° to 50°, the ∆TS range of the 18 S. japonicus at four frequencies was 12.33–52.68 dB, 28.81–45.34 dB, 26.38–52.30 dB, and 28.57–50.15 dB, respectively.
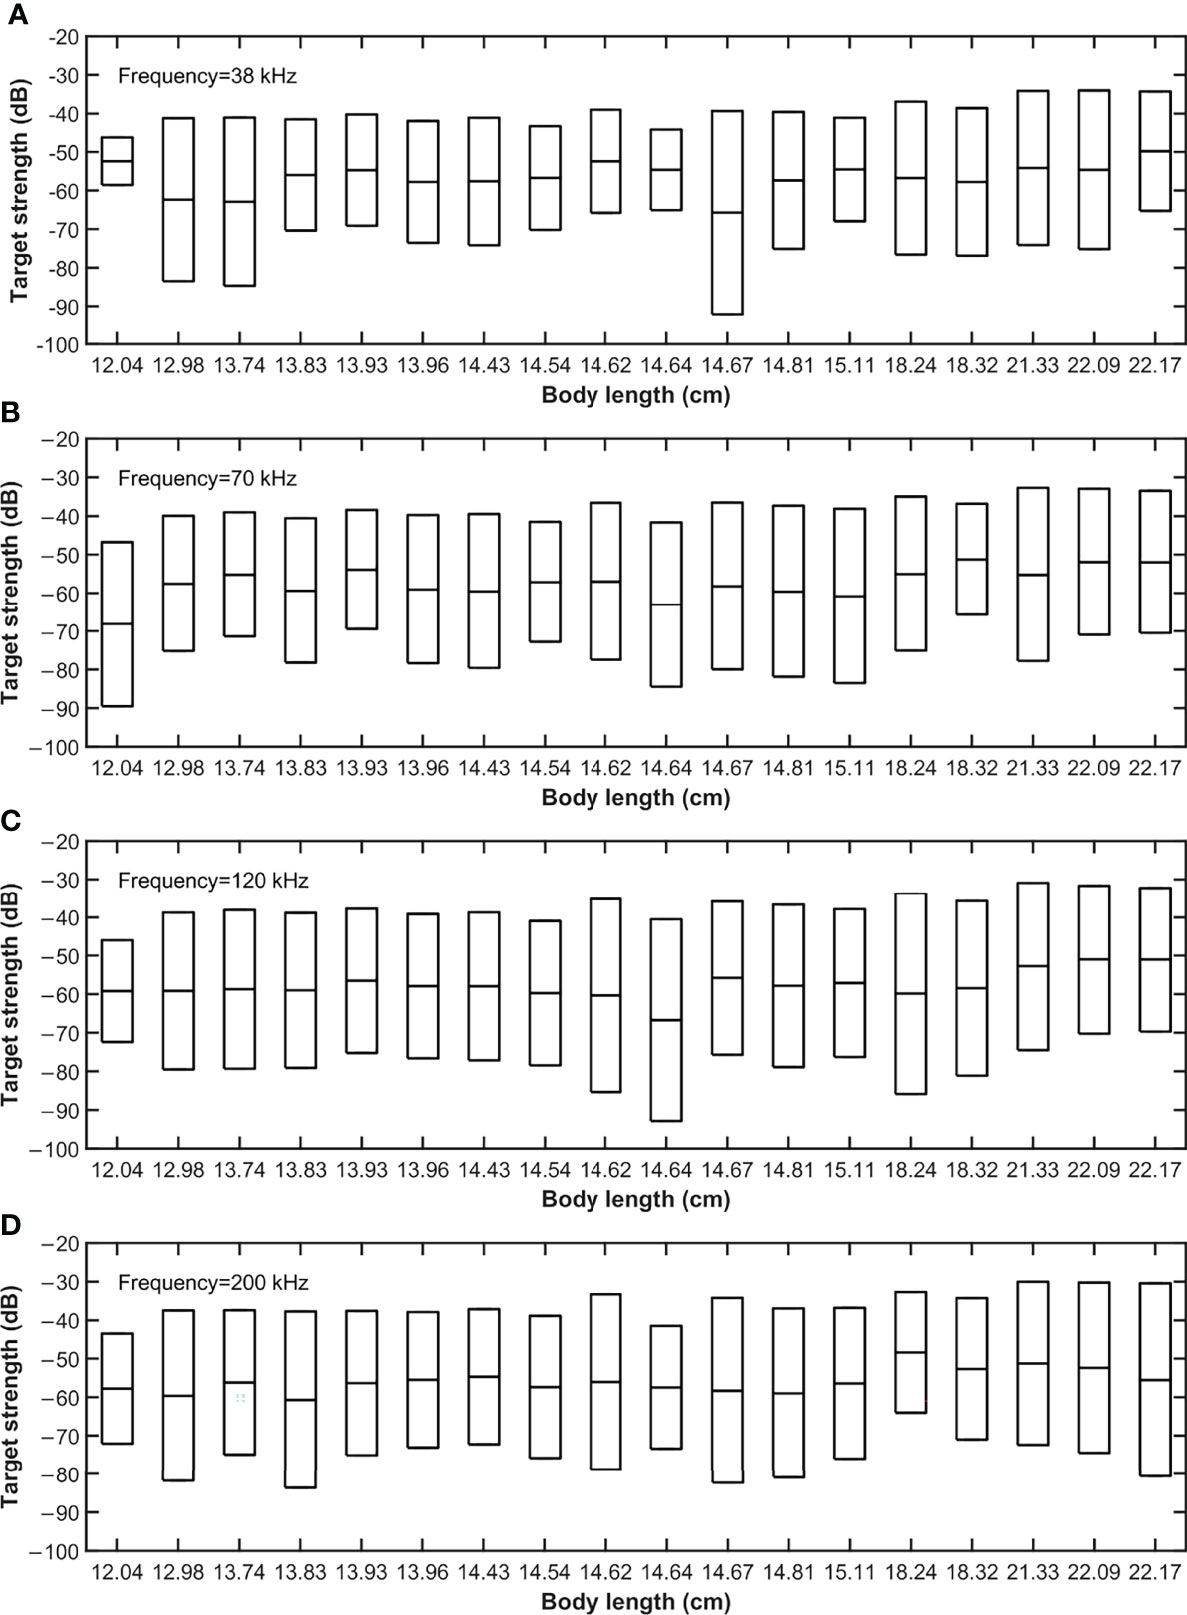
Figure 2 Variation in TS of each sample with pitch angle ranging from -50° to 50°. Using ∆TS, the difference between the maximum TS and the minimum TS, to represent the variation values. The range of ∆TS was: (A) 12.33–52.68 dB at 38 kHz; (B) 28.81–45.34 dB at 70 kHz; (C) 26.38–52.30 dB at 120 kHz; (D) 28.57–50.15 dB at 200 kHz. Top and bottom edges of the box represent maximum and minimum values of TS, respectively. The middle line is the half of ∆TS.
At the same frequency, body length did not affect ∆TS of S. japonicus. Figure 3 details TS variation related to body, swim bladder, and the whole fish (BL=14.81cm) relative to pitch angle shifts. Observed variation in TS relative to whole fish was consistent with the observed variation of swim bladder TS, but not that of the body. TS was significantly affected by the pitch angle and varied greatly with frequency. At a frequency of 38 kHz, 70 kHz, 120 kHz, and 200 kHz, TS peaked (main lobe) around −10° to 0°. As frequency increased, the main lobes increased directionality, the number of side lobe peaks and fluctuation increased. These results suggest that the impact of fish behavior on scattering strength becomes greater with increasing frequency.
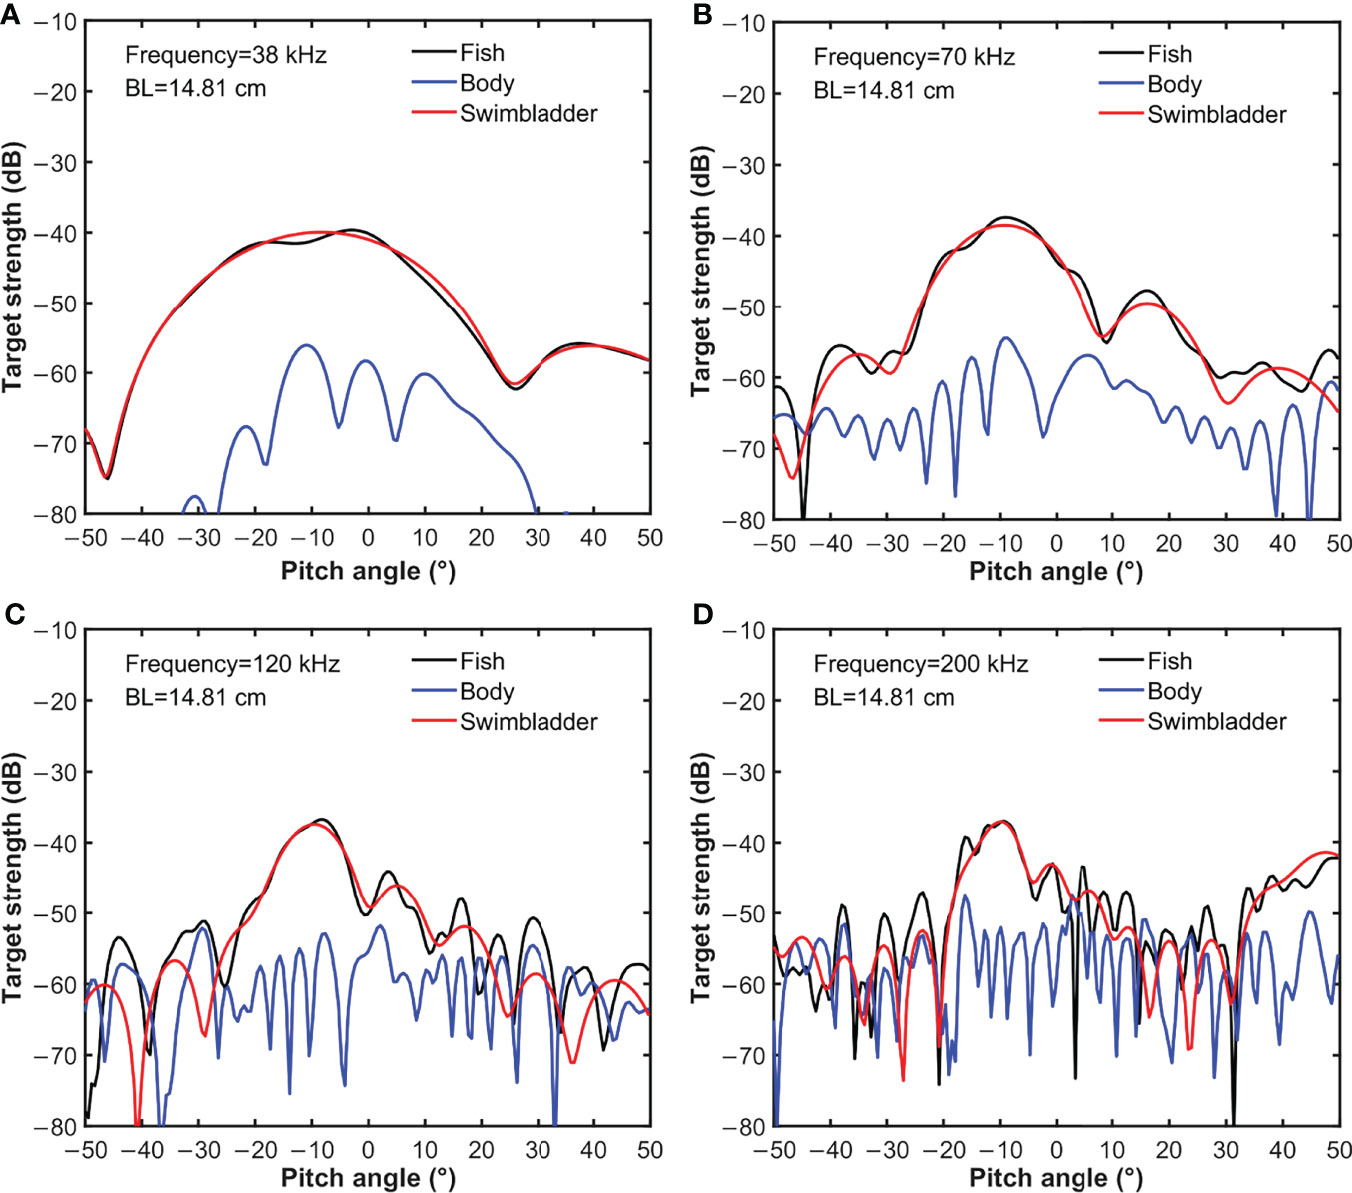
Figure 3 TS variation of body, swim bladder, and the whole fish (BL=14.81cm) with pitch angle shifts at (A) 38 kHz, (B) 70 kHz, (C) 120 kHz and (D) 200 kHz.
Average TS
Average TS of each sample with different pitch angle distributions was estimated using the KRM model. The difference in average TS between the samples with the largest and smallest body length was about 10 dB. Small differences, nearly 1 dB, were observed among the average TS of individuals between each frequency.TS was estimated using the measured S. japonicus angle distributions N[−3°,4°] and N[−0.5°,0.09°], and the universal distribution N[−5°,10°] was almost identical. Differences between three distributions had little effect on the KRM results in this study.
Table 2 shows the values of all S. japonicus at 38 kHz, 70 kHz, 120 kHz, and 200 kHz frequencies with different pitch angle distributions. The difference of the between each frequency was about 1 dB, no matter which distribution was used.
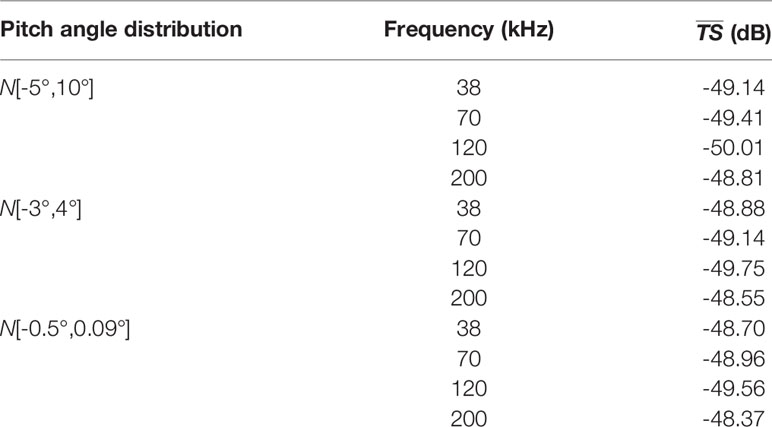
Table 2 values for different pitch angle distributions at four frequencies.
S. japonicus usually lives in 0–300 m depth. Figure 4 shows TS variation relative to depth when angle distribution is N[−3°,4°]. TS decreased gradually as water depth increased. When the size of the swim bladder decreases due to pressure, the TS of the fish also decreases This phenomenon was greatest in depths of 0–60 m. The decrease slowed down in water deeper than 60 m and stabilized at 300 m. The shift range of TS from 0–300 m depth was about 10 dB.
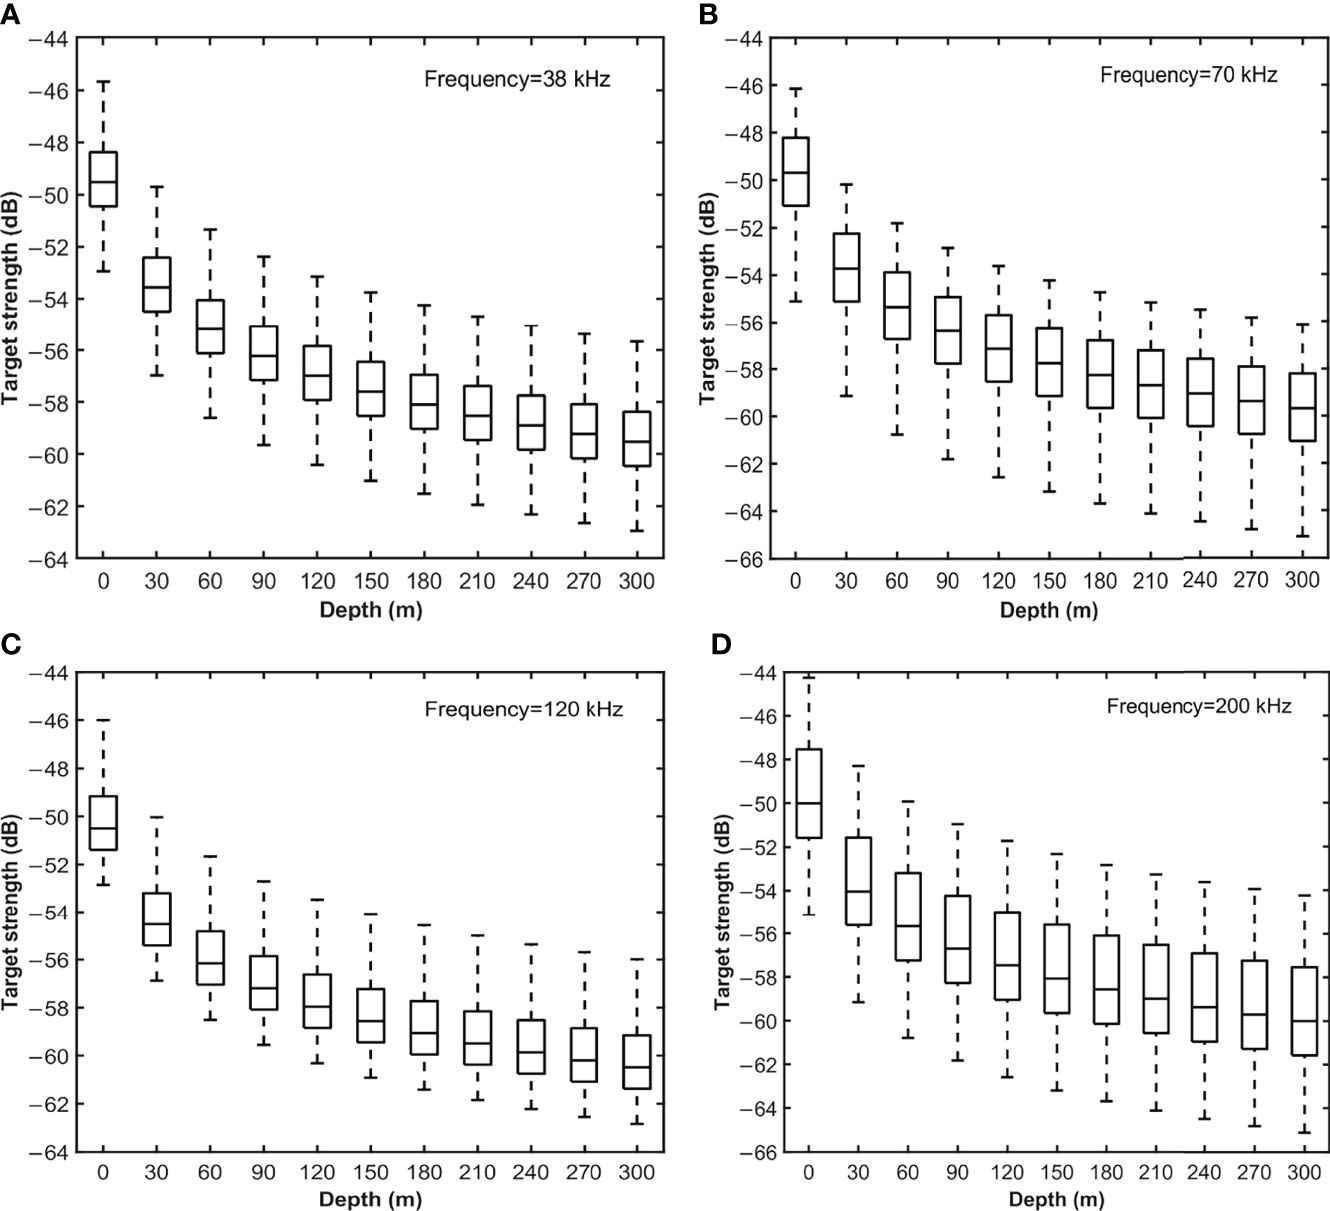
Figure 4 TS variation relative to depth when the angle distribution is N[−3°,4°] at (A) 38 kHz, (B) 70 kHz, (C) 120 kHz and (D) 200 kHz. On each box, the central line indicates the median TS value of all samples. The bottom and top edges of the box indicate the 25th and 75th percentiles, respectively. The whiskers extend to the most extreme data without outliers.
TS-BL Equation
The relationship between TS for average pitch angle and body length of S. japonicus is shown in Figure 5. The equations for the linear regression in Figure 5 are listed in Table 3.
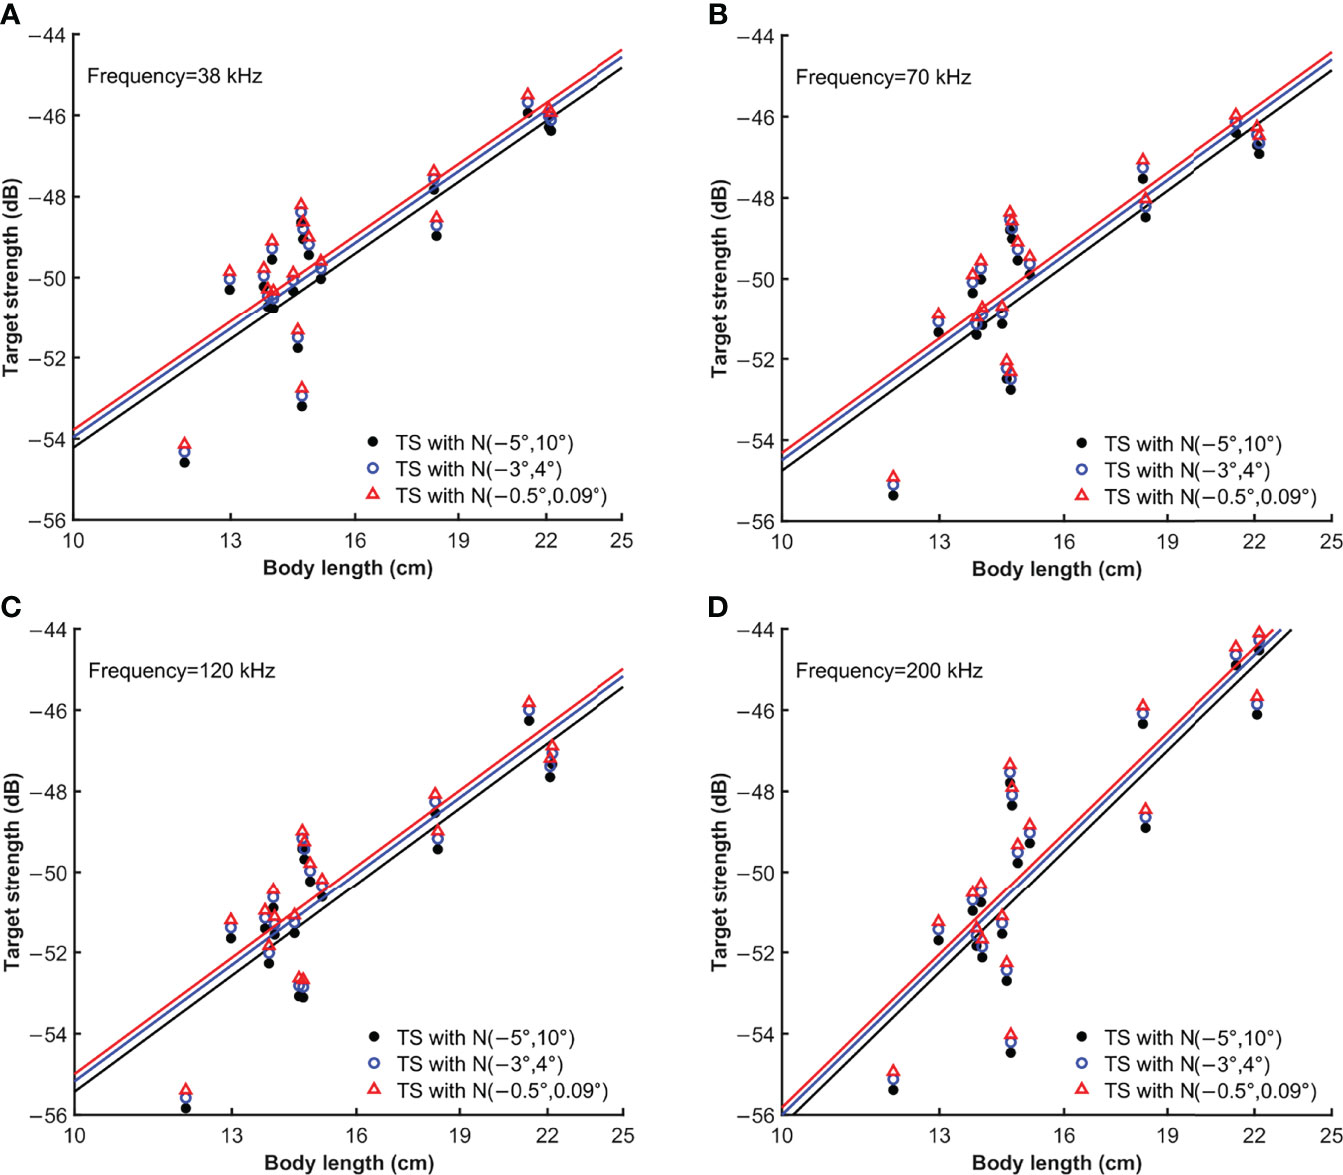
Figure 5 TS variation with body length estimated using the measured angle distributions N[−3°,4°] and N[−0.5°,0.09°], and the universal distribution N[−5°,10°] at (A) 38 kHz, (B) 70 kHz, (C) 120 kHz and (D) 200 kHz.
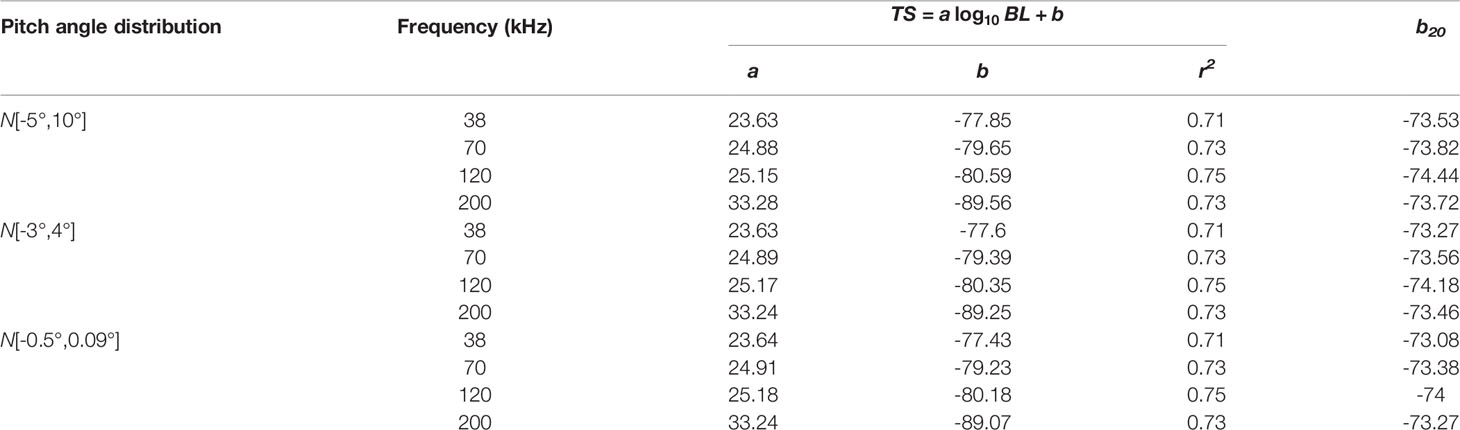
Table 3 Equations of the linear regressions plotted in Figure 5.
TS increased along with body length at different frequencies. However, the fitted TS-BL equations always differed from the standard equations. As shown in Table 3, the regression slopes (a) were greater than 20 in all cases. This suggests that the backscattering cross-section of S. japonicus is not proportional to the square of body length and that the TS increases at a greater rate than body length. There were almost no differences between the b20 values estimated using the measured pitch angle distributions and the values estimated by using the universal distribution. The intercept and slope of the TS-BL equation was affected by frequency. For example, TS increased the least with BL at 38 kHz and the most at 200 kHz. The b20 decreased with frequency increasing.
The Broadband Scattering Characteristics
The broadband TS spectrum of the 18 S. japonicus, estimated using the pitch angle distribution N[−3°,4°], in the frequency range of 0–250 kHz, is shown in Figure 6. TS values decreased along with swim bladder length but the resonance frequency dominated by Rayleigh scattering increased. As frequency increased and entered into the Mie scattering range, TS began to fluctuate over a range of 5 dB. However, individuals with different swim bladder lengths showed two trends after 150 kHz. TS of fish whose SL>3 cm increased, while the TS of fish with SL>3 cm maintained stability.
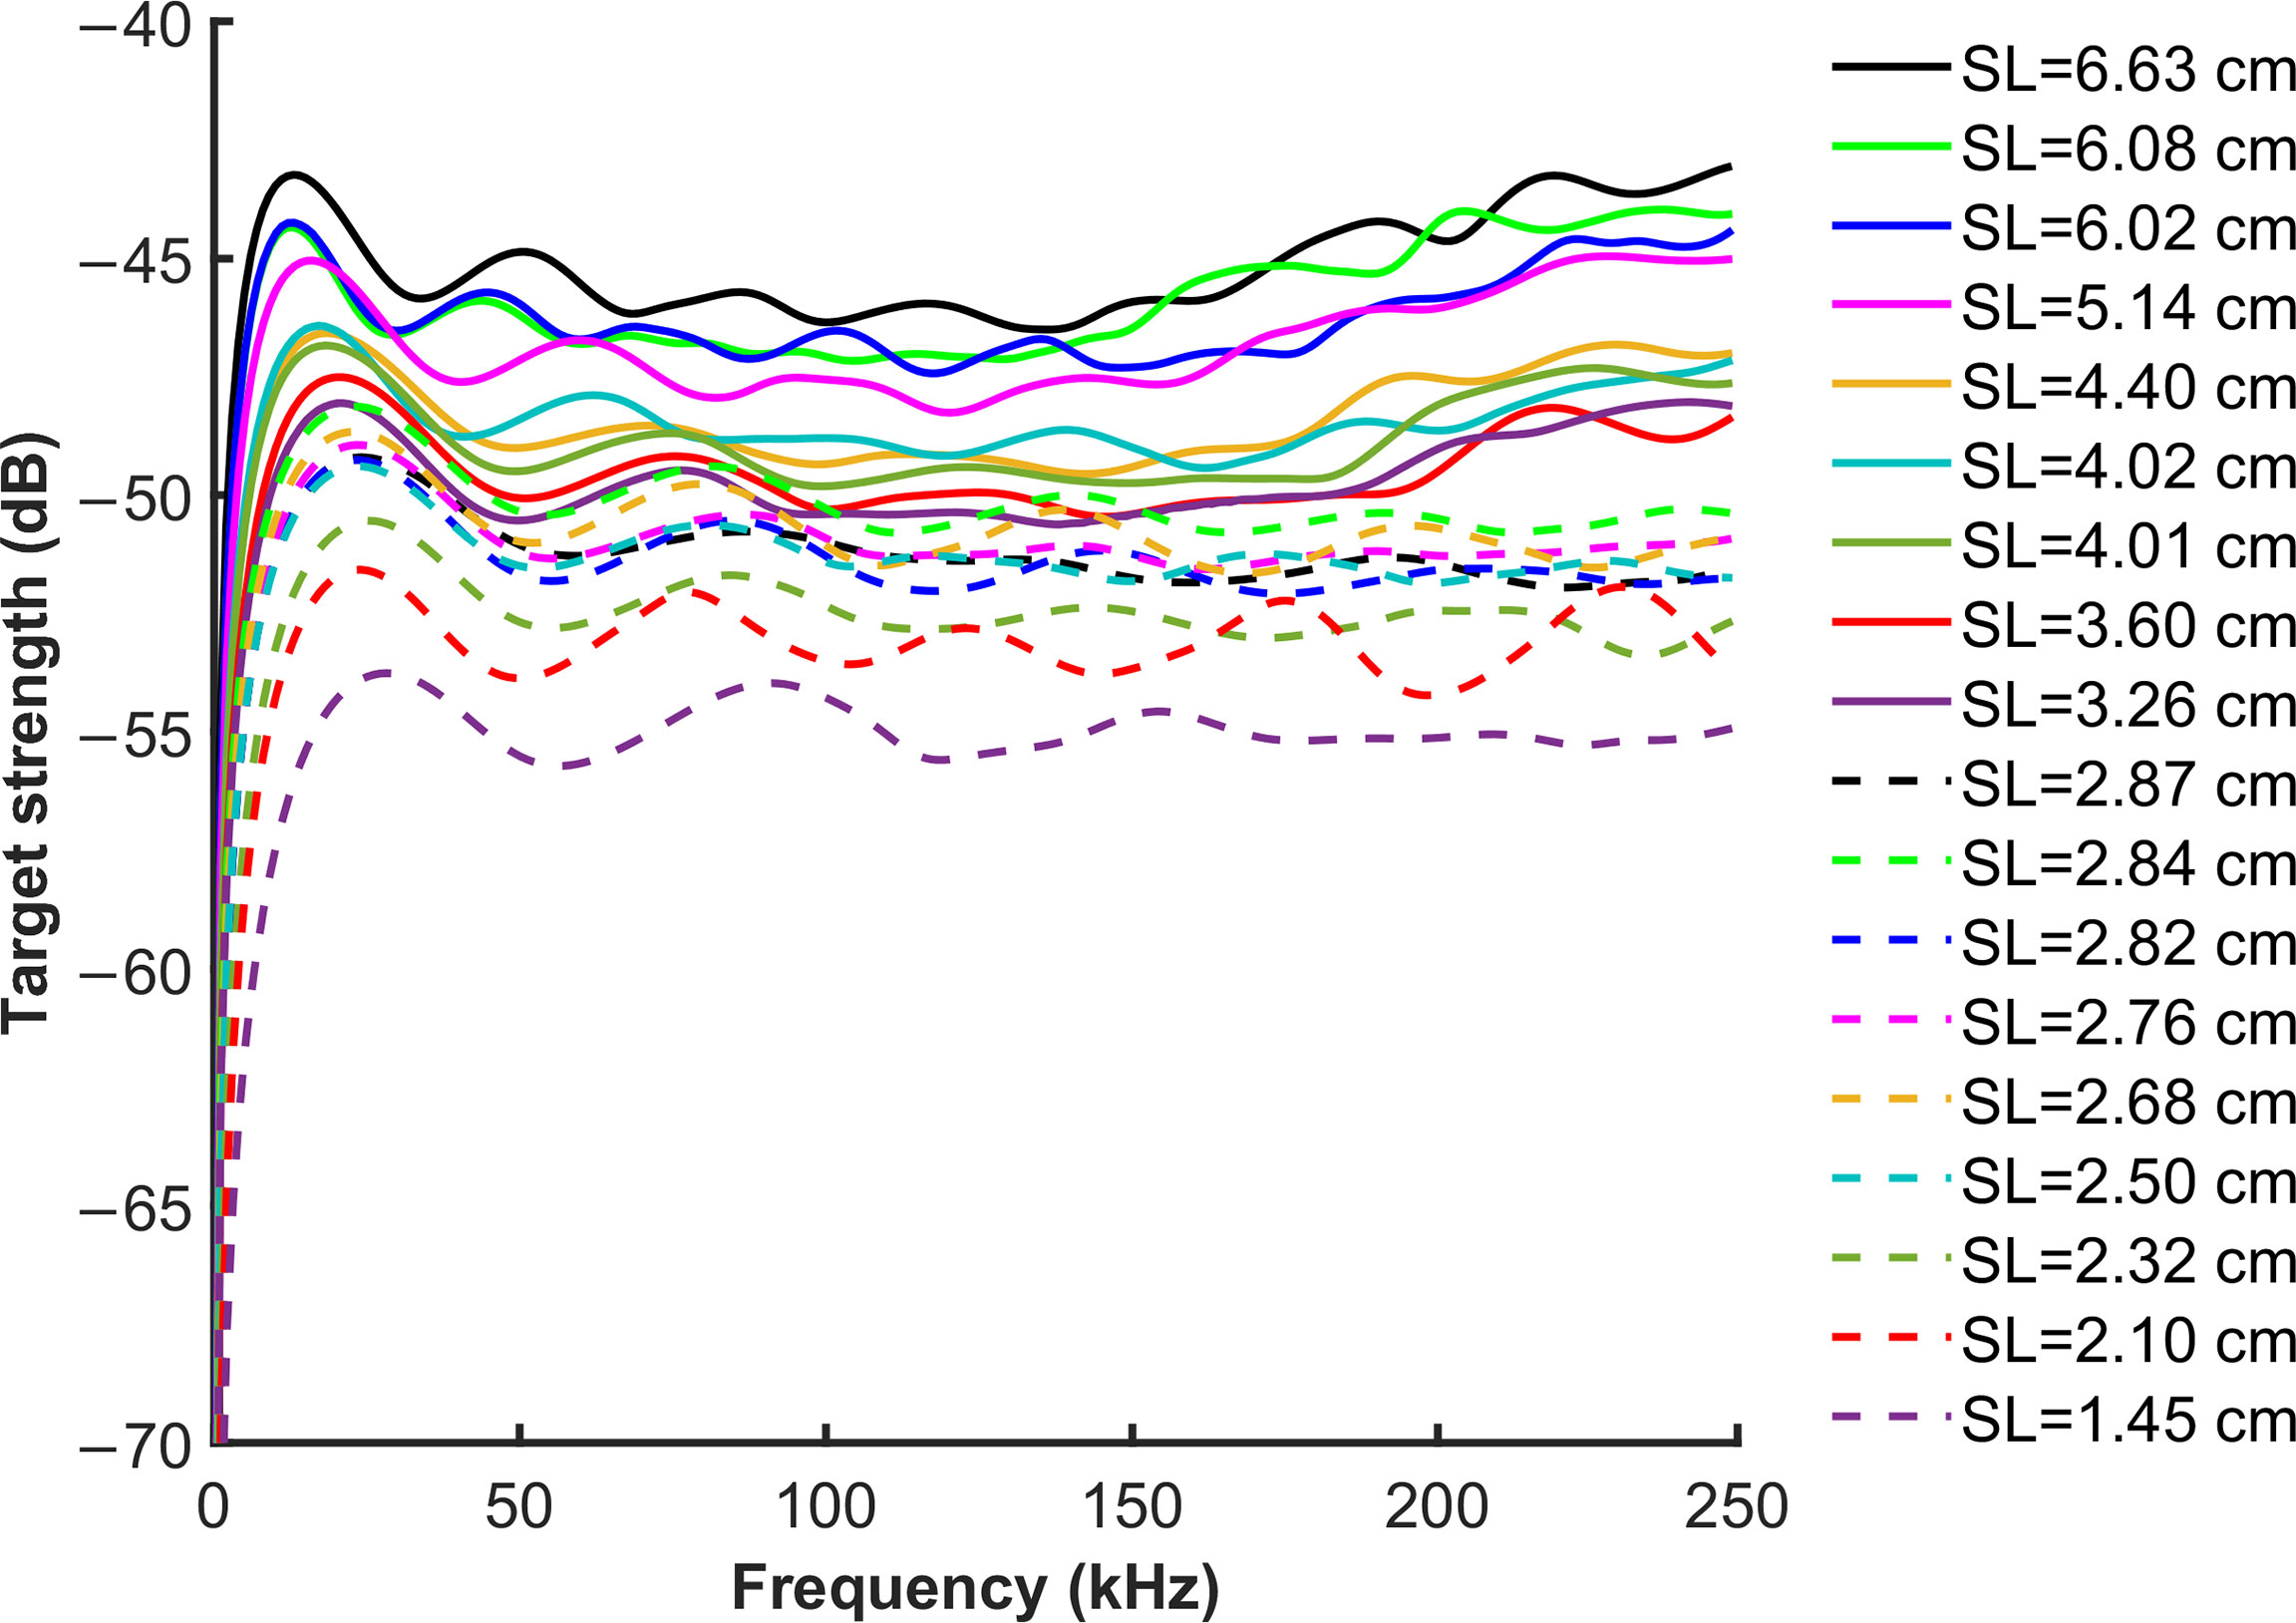
Figure 6 The broadband TS spectrum of the 18 S. japonicus, was estimated using the pitch angle distribution N[−3°,4°], in the frequency range of 0–250 kHz. The low frequency resonance range is shown, the wide peak is the swim bladder resonance. The solid line refers to the individuals with SL>3 cm; the broken line refers to individuals with SL<3 cm.
Discussion
The KRM model requires precise measurements of the body and swim bladder to obtain detailed morphological parameters. Therefore, we used a specialized X-ray imaging system to map the outlines of the fish, which reliably reflects the size of the swim bladder and its relative position in the body. Sample preservation quality greatly influenced image quality as the swim bladder may not be obvious in the poorly preserved samples. In this study, S. japonicus samples were collected in situ and frozen in seawater, ensuring the relative stability of the internal structure of the fish and improved measurement accuracy. However, morphology will inevitably change during freezing and thawing, and temperature cannot be kept constant during long periods of time needed for transportation. Sobradillo et al. (2019) proposed using liquid nitrogen to freeze samples and thaw them in a temperature-controlled environment (0°C), which can minimize damage to biological structures. It is better to take X-rays in situ when conditions permit, to avoid freezing and transportation. The total catch of S. japonicus during the survey period was 1,299 and their body length distribution follows N[16.15,4.14]. Among these catches, 946 individuals with gonadal maturity of stage 1 and stage 2 indicate that they were mainly juveniles. In this paper, the body length distribution of the 18 samples was N[15.86,3.15], which is consistent with the overall catches. Although there were few samples used in TS estimation, it would not have a large impact on conclusions.
The TS of fish is influenced by many factors. There are even differences in the same species due to variation in individual morphology. The size of this difference depends on the frequency of the sound waves (Gauthier and Horne, 2004). At 38 kHz, TS was relatively stable with body pitch angle shifts and there were fewer side lobes. While at higher frequencies, wavelength interaction in the body produced more interference which caused greater fluctuation in TS and more side lobes. TS of S. japonicus was sensitive to body pitch angle shifts at high frequencies. However, this is less important because 38 kHz has been used for the biomass assessment of these fish resources. S. japonicus have a swim bladder, which is filled with gas and has a stronger scattering ability than the rest of the fish body. Researchers have shown that the swim bladder accounts for more than 90% of the total scattering of fish with swim bladders (Foote, 1980) and that is why the maximum TS of the sample with a body length of 14.81 cm in Figure 3 appeared at a pitch angle of about −10°. Because the tilt angle of this sample was 8.4°, the swim bladder reached its normal aspect and intercepted the sound wave the most when the pitch angle was −10°.
Fish have different pitch angles due to differences in body size, swimming speed, and living conditions. In this paper, three pitch angle distributions were used to calculate TS of S. japonicus. Results show that there were almost no differences between TS calculated using the measured S. japonicus angle distributions and that estimated by using the universal distribution and this is consistent with the results of Furusawa (1988). Therefore, we conclude that the difference between the measured and universal angle distributions had little effect on the KRM results for S. japonicus. However, due to low samples sizes used to obtain these two measured distributions, N[−3°,4°] was observed using four samples and N[−0.5°,0.09°] was observed using only one; these conclusions are not generalizable. In addition, these two distributions were quite different, indicating differences in individual swimming patterns. To improve the accuracy of acoustic stock assessment, it is better to estimate TS of S. japonicus using the measured distribution. It is necessary to carry out comprehensive studies on the swimming posture of S. japonicus and to use more samples to measure the angle distribution.
There are few studies on TS of S. japonicus: Miyanohana et al. (1990) used four frequencies to measure TS of S. japonicus but they did not show the explicit values. Mukai et al. (1993) measured the b20 of individuals with a total length of 23.0–26.8 cm using the ex situ method, which was −64.1 dB at 25 kHz and −65.5 dB at 100 kHz. Gutiérrez and Maclennan (1998) reported the b20 of S. japonicus with a total length of 26–30 cm using the in situ method, which was −70.95 dB at 38 kHz and −70.8 dB at 120 kHz. The TS calculated using their b20 and our total length data were 2–8 dB higher than our KRM model results. Lee and Shin (2005) used the ex situ method to obtain the b20 for individuals with a total length of 26.2–38.3 cm which was −66.9 dB at 120 kHz and −71.1 dB at 200 kHz. TS calculated using their b20 were 6–12 dB higher than ours at 120 kHz and 1–7 dB higher at 200 kHz. Svellingen and Charouki (2008, cited in Palermino et al., 2021) used the in situ method to measure the b20 of S. japonicus with an average length of 21.8 cm which was −77.6 dB at 38 kHz and −79.8 dB at 120 kHz. Our TS were 0–6 dB higher than results calculated using their b20. Kurnia et al. (2011) reported that the TS of a S. japonicus with BL=21.4 cm was −40.02 dB at 50 kHz when the incidence wave was perpendicular to the dorsal aspect. While the sample with BL=21.33 cm in this paper had a simulated TS of −36.28 dB under the same frequency and pitch angle. These difference of these results indicate that there may be errors in the KRM estimation. However, the length of S. japonicus in most studies was larger than ours, which may be another reason that caused these differences in TS.
Density contrast value (g) and sound speed contrast value (h) of a fish’s body and swim bladder are not only important parameters in the KRM model but also in most TS models. Changes in g and h will affect the TS estimation (Chu and Wiebe, 2005; Kang et al., 2006; Matsukura et al., 2009). The results of Yasuma et al. (2009) showed that using g and h values in the primary research may lead to an error of about 10 dB when using the deformed cylinder model to calculate TS of fish without a swim bladder. For zooplankton TS estimation, small changes in g and h in the distorted wave born approximation model can result in errors of up to 20 dB (Chu et al., 2000). Therefore, the use of measured g and h is better for the accurate estimation of the TS of S. japonicus. In addition, the results of KRM model are affected by the sound speed and density of seawater. Eulachon (Thaleichthys pacificus) has a TS of 3–4 dB higher in freshwater than in seawater (Gauthier and Horne, 2004). For fish with a swim bladder, their volume has a greater effect on TS than g and h values (Mukai and Iida, 1996; Gorska and Ona, 2003). Studies showed that some mackerel species have a diel vertical migration behavior (Bertrand et al., 2004; Li et al., 2014; Tsuda et al., 2014; Paramo et al., 2015). They usually aggregate in deeper water during the daytime and move to the surface at night. These differences have strong implications for the estimation of biomass. Therefore, TS in different depths should be attended. According to Boyle’s law, there is a negative correlation between swim bladder volume and water depth. With increasing depth, pressure increases on the swim bladder causing a decrease in volume and the effective backscattering cross-section, which leads to a decrease in TS. Morphological characteristics in this study were obtained by taking X-ray images of fish out of the water. However, TS in different depths still needs further study and experimental data on TS at different depths are needed to validate the theoretical model.
In recent years, using broadband techniques to identify and classify species in echograms has become a hot topic in fishery acoustics (Stanton et al., 2010; Yan et al., 2020; Hasegawa et al., 2021; Xue et al., 2021). At the same time, a growing number of research vessels are equipped with broadband fish finders. The broadband scattering spectrum of S. japonicus produced by us can provide a reference for identifying S. japonicus in a mixed population echogram. The two observed trends in TS variation of individuals with different swim bladder lengths above 150 kHz may be related to the ratio of swim bladder lengths to acoustic wavelengths. It is necessary to select the appropriate frequency for the body length of the fish to improve accuracy when using the dB-difference method for stock assessment.
Data Availability Statement
The raw data supporting the conclusions of this article will be made available by the authors, without undue reservation.
Ethics Statement
The animal study was reviewed and approved by the Institutional Animal Care and Use Committee of Shanghai Ocean University.
Author Contributions
ST and JT designed the study. MX, ZZ and WW analyzed the data. MX wrote the original draft. JT reviewed and edited the draft. All authors contributed to the article and approved the submitted version.
Funding
This research was funded by the National Key R&D Program of China (2019YFD0901401, 2019YFD0901405). We acknowledge funds sponsored by Ministry of Agriculture and Rural Affairs of China, through the project on the Survey and Monitor-Evaluation of Global Fishery Resources.
Conflict of Interest
The authors declare that the research was conducted in the absence of any commercial or financial relationships that could be construed as a potential conflict of interest.
Publisher’s Note
All claims expressed in this article are solely those of the authors and do not necessarily represent those of their affiliated organizations, or those of the publisher, the editors and the reviewers. Any product that may be evaluated in this article, or claim that may be made by its manufacturer, is not guaranteed or endorsed by the publisher.
Acknowledgments
The authors of this research would like to thank all the researchers and sailors on RV Songhang, especially Shujie Wan, Gan Chen and Wen Ma, who contributed to the data collection during the marine survey. Thanks to the reviewers for the thoughtful discussion that substantially improved the original manuscript.
References
Bairstow F., Gastauer S., Finley L., Edwards T., Brown C. T. A., Kawaguchi S., et al. (2021). Improving the Accuracy of Krill Target Strength Using a Shape Catalogue. Front. Mar. Sci. 8. doi: 10.3389/fmars.2021.658384
Bertrand A., Barbieri M. A., Cordova J., Hernandez C., Gomez F., Leiva F. (2004). Diel Vertical Behaviour, Predator Prey Relationships, and Occupation of Space by Jack Mackerel (Trachurus Murphyi) Off Chile. ICES J. Mar. Sci. 61, 1105–1112. doi: 10.1016/j.icesjms.2004.06.010
Chiba S., Sugisaki H., Nonaka M., Saino T. (2009). Geographical Shift of Zooplankton Communities and Decadal Dynamics of the Kuroshio-Oyashio Currents in the Western North Pacific. Global Change Biol. 15, 1846–1858. doi: 10.1111/j.1365-2486.2009.01890.x
Chu D., Wiebe P. (2005). Measurements of Sound-Speed and Density Contrasts of Zooplankton in Antarctic Waters. ICES J. Mar. Sci. 62, 818–831. doi: 10.1016/j.icesjms.2004.12.020
Chu D., Wiebe P., Copley N. (2000). Influence of Material Properties of Zooplankton From Acoustic and Resistivity Measurement. ICES J. Mar. Sci. 57, 1128–1142. doi: 10.1006/jmsc.2000.0800
Clay C. S., Horne J. K. (1994). Acoustic Models of Fish: The Atlantic Cod (Gadus Morhua). J. Acoust. Soc Am. 96, 1661–1668. doi: 10.1121/1.410245
Escobar-Flores P. C., O’Driscoll R. L., Montgomery J. C., Ladroit Y., Jendersie S. (2020). Estimates of Density of Mesopelagic Fish in the Southern Ocean Derived From Bulk Acoustic Data Collected by Ships of Opportunity. Polar Biol. 43, 43–61. doi: 10.1007/s00300-019-02611-3
FAO (2020). The State of World Fisheries and Aquaculture 2020. Sustainability in Action (Rome: Food and Agriculture Organization).
Foote K. G. (1980). Importance of the Swimbladder in Acoustic Scattering Fish: A Comparison of Gadoid and Mackerel Target Strengths. J. Acoust. Soc Am. 67, 2084–2089. doi: 10.1121/1.384452
Foote K. G. (1982). Optimizing Copper Spheres for Precision Calibration of Hydroacoustic Equipment. J. Plankton Res. 71, 742–747. doi: 10.1121/1.387497
Furusawa M. (1988). Prolate Spheroidal Models for Predicting General Trends of Fish Target Strength. J. Acoust. Soc Jp. 9, 13–24. doi: 10.1250/ast.9.13
Gastauer S., Scoulding B., Fässler S. M., Benden D. P., Parsons M. (2016). Target Strength Estimates of Red Emperor (Lutjanus Sebae) With Bayesian Parameter Calibration. Aquat. Living Resour. 29, 301. doi: 10.1051/alr/2016024
Gauthier S., Horne J. K. (2004). Acoustic Characteristics of Forage Fish Species in the Gulf of Alaska and Bering Sea Based on Kirchhoff-Approximation Models. Can. J. Fish. Aquat. Sci. 61, 1839–1850. doi: 10.1139/f04-117
Gibb A. C., Dickson K. A., Lauder G. V. (1999). Tail Kinematics of the Chub Mackerel Scomber Japonicus: Testing the Homocercal Tail Model of Fish Propulsion. J. Exp. Biol. 202, 2433–2447. doi: 10.1242/jeb.202.18.2433
Gorska N., Ona E. (2003). Modelling the Effect of Swimbladder Compression on the Acoustic Backscattering From Herring at Normal or Near-Normal Dorsal Incidences. ICES J. Mar. Sci. 60, 1381–1391. doi: 10.1016/S1054-3139(03)00142-5
Gutiérrez M., Maclennan D. (1998). Preliminary Results of In Situ Target Strength Measurements of the Main Pelagic Species. BIC Humboldt 9803-05 Cruise From Tumbes to Tacna. Inf. Inst. Mar Perú. 135, 16–19.
Hasegawa K., Yan N., Mukai T. (2021). In Situ Broadband Acoustic Measurements of Age-0 Walleye Pollock and Pointhead Flounder in Funka Bay, Hokkaido, Japan. J. Mar. Sci. Tech. 29, 2. doi: 10.51400/2709-6998.1076
Hazen L. E., Horne J. K. (2003). A Method for Evaluating the Effects of Biological Factors on Fish Target Strength. ICES J. Mar. Sci. 60, 555–562. doi: 10.1016/S1054-3139(03)00053-5
Horne J. K. (2003). The Influence of Ontogeny, Physiology, and Behaviour on the Target Strength of Walleye Pollock (Theragra Chalcogramma). ICES J. Mar. Sci. 60, 1063–1074. doi: 10.1016/S1054-3139(03)00114-0
Hwang K., Yoon E. A., Lee K., Lee H., Hwang D. J. (2015). Multifrequency Acoustic Scattering Characteristics of Jack Mackerel by KRM Model. J. Korean Soc Fish. Ocean Technol. 51, 424–431. doi: 10.3796/KSFT.2015.51.3.424
Jech J. M., Horne J. K. (2002). Three-Dimensional Visualization of Fish Morphometry and Acoustic Backscatter. Acoust. Res. Lett. Online. 3, 35–40. doi: 10.1121/1.1430676
Kang D., Iida K., Mukai T., Kim J. (2006). Density and Sound Speed Contrasts of the Japanese Common Squid Todarodes Pacificus and Their Influence on Acoustic Target Strength. Fisheries Sci. 72, 728–736. doi: 10.1111/j.1444-2906.2006.01211.x
Kang D., Sadayasu K., Mukai T., Iida K., Hwang D., Sawada K., et al. (2004). Target Strength Estimation of Black Porgy Acanthopagrus Schlegeli Using Acoustic Measurements and a Scattering Model. Fisheries Sci. 70, 819–828. doi: 10.1111/j.1444-2906.2004.00875.x
Khodabandeloo B., Agersted M. D., Klevjer T., Macaulay G. J., Melle W. (2021). Estimating Target Strength and Physical Characteristics of Gas-Bearing Mesopelagic Fish From Wideband In Situ Echoes Using a Viscous-Elastic Scattering Model. J. Acoust. Soc Am. 149, 673–691. doi: 10.1121/10.0003341
Kurnia M., Iida K., Mukai T. (2011). Measurement and Modeling of Three Dimensional Target Strength of Fish for Horizontal Scanning Sonar. J. Mar. Sci. Tech. 19, 287–293. doi: 10.51400/2709-6998.2194
Kusdinar A., Hwang B. K., Shin H. O. (2014). Determining the Target Strength Bambood Wrasse (Pseudolabrus Japonicus) Using Kirchhoff-Ray Mode. J. Korean Soc Fish. Ocean Technol. 50, 427–434. doi: 10.3796/KSFT.2014.50.4.427
Lee D. J., Shin I. H. (2005). Construction of a Data Bank for Acoustic Target Strength With Fish Species, Length and Acoustic Frequency for Measuring Fish Size Distribution. J. Korean Fish. Soc 38, 265–275. doi: 10.5657/kfas.2005.38.4.265
Li Y., Chen X., Chen C., Ge J., Ji R., Tian R., et al. (2014). Dispersal and Survival of Chub Mackerel (Scomber Japonicus) Larvae in the East China Sea. Ecol. Model. 283, 70–84. doi: 10.1016/j.ecolmodel.2014.03.016
Love R. H. (1978). Resonant Acoustic Scattering by Swimbladder-Bearing Fish. J. Acoust. Soc Am. 64, 571–580. doi: 10.1121/1.382009
Lu H. J., Kang M., Huang H. H., Lai C. C., Wu L. J. (2011). Ex Situ and In Situ Measurements of Juvenile Yellowfin Tuna Thunnus Albacares Target Strength. Fisheries Sci. 77, 903–913. doi: 10.1007/s12562-011-0401-4
Matsukura R., Yasuma H., Murase H., Yonezaki S., Funamoto T., Honda S., et al. (2009). Measurements of Density Contrast and Sound-Speed Contrast for Target Strength Estimation of Neocalanus Copepods (Neocalanus Cristatus and Neocalanus Plumchrus) in the North Pacific Ocean. Fisheries Sci. 75, 1377–1387. doi: 10.1007/s12562-009-0172-3
Miyamoto H., Vijai D., Tadokoro K., Watanabe T., Fuji T., Suyama S. (2020). Geographic Variation in Feeding of Pacific Saury Cololabis Saira in June and July in the North Pacific Ocean. Fish. Oceanogr. 29, 558–571. doi: 10.1111/fog.12495
Miyanohana Y., Ishii K., Furusawa M. (1990). Measurements and Analyses of Dorsal-Aspect Target Strength of Six Species of Fish at Four Frequencies. Rapp. P.-v. Réun. Cons. Int. Explor. Mer. 189, 317–324.
Mukai T., Iida K. (1996). Depth Dependence of Target Strength of Live Kokanee Salmon in Accordance With Boyle’s Law. ICES J. Mar. Sci. 53, 245–248. doi: 10.1006/jmsc.1996.0029
Mukai T., Sano N., Iida K., Sasaki S. (1993). Studies on Dorsal Aspect Target Strength of Ten Species of Fish Collected in the East China Sea. Nippon Suisan Gakk. 59, 1515–1525. doi: 10.2331/suisan.59.1515
Muñoz L., Aspillaga E., Palmer M., Saraiva J., Arechavala-Lopez P. (2020). Acoustic Telemetry: A Tool to Monitor Fish Swimming Behavior in Sea-Cage Aquaculture. Front. Mar. Sci. 7. doi: 10.3389/fmars.2020.00645
Nauen J. C., Lauder G. V. (2002). Hydrodynamics of Caudal Fin Locomotion by Chub Mackerel, Scomber Japonicus (Scombridae). J. Exp. Biol. 205, 1709–1724. doi: 10.1242/jeb.205.12.1709
Ona E. (2003). An Expanded Target-Strength Relationship for Herring. ICES J. Mar. Sci. 60, 493–499. doi: 10.1016/S1054-3139(03)00031-6
Palermino A., De Felice A., Canduci G., Biagiotti I., Costantini I., Malavolti S., et al. (2021). First Target Strength Measurement of Trachurus Mediterraneus and Scomber Colias in the Mediterranean Sea. Fish. Res. 240, 105973. doi: 10.1016/j.fishres.2021.105973
Paramo J., Lang C., Lillo S. (2015). ”Modelled Day-Night Biases in Spatial Structure of Jack Mackerel (Trachurus Murphyi) in Chile,” in 2015 IEEE/OES Acoustics in Underwater Geosciences Symposium (RIO Acoustics). 1–4 (IEEE). doi: 10.1109/RIOAcoustics.2015.7473625
Proud R., Handegard N. O., Kloser R. J., Cox M. J., Brierley A. S. (2019). From Siphonophores to Deep Scattering Layers: Uncertainty Ranges for the Estimation of Global Mesopelagic Fish Biomass. ICES J. Mar. Sci. 76, 718–733. doi: 10.1093/icesjms/fsy037
Scoulding B., Chu D., Ona E., Fernandes P. G. (2015). Target Strengths of Two Abundant Mesopelagic Fish Species. J. Acoust. Soc. Am. 137, 989–1000. doi: 10.1121/1.4906177
Simmonds J., MacLennan D. N. (2005). Fisheries Acoustics: Theory and Practice, 2nd Ed (Hoboken: Blackwell Publishing).
Sobradillo B., Boyra G., Martinez U., Peña M., Irigoien X. (2019). Target Strength and Swimbladder Morphology of Mueller’s Pearlside (Maurolicus Muelleri). Sci. Rep. 9, 1–14. doi: 10.1038/s41598-019-53819-6
Sobradillo B., Boyra G., Pérez-Arjona I., Martinez U., Espinosa V. (2021). Ex Situ and in Situ Target Strength Measurements of European Anchovy in the Bay of Biscay. ICES J. Mar. Sci. 78, 782–796. doi: 10.1093/icesjms/fsaa242
Stanton T. K., Chu D., Jech J. M., Irish J. D. (2010). New Broadband Methods for Resonance Classification and High-Resolution Imagery of Fish With Swimbladders Using a Modified Commercial Broadband Echosounder. ICES J. Mar. Sci. 67, 365e78. doi: 10.1093/icesjms/fsp262
Stierhoff K. L., Zwolinski J. P., Demer D. A. (2019). Distribution, Biomass, and Demography of Coastal Pelagic Fishes in the California Current Ecosystem During Summer 2019 Based on Acoustic-Trawl Sampling (Washington: NOAA).
Sun Y., Tang Y., Xing B. B., Li H. Q., Bi F. Y., Ma Z. (2021). Target Strength of Northern Whitefish Coregonus Peled by Using Kirchhoff Ray Mode Methods. J. Dalian Ocean. Uni. 36, 310–316. doi: 10.16535/j.cnki.dlhyxb.2020-082
Svellingen I. K., Charouki N. (2008). “Acoustic Target Strength of Chub Mackerel (Scomber Japonicus) Measured In Situ Using Split Beam Acoustics,” in Science And Management Of Small Pelagics. Casablanca, Morocco: Food and Agriculture Organization. pp 11–14.
Takahashi M., Yoneda M., Kitano H., Kawabata A., Saito M. (2014). Growth of Juvenile Chub Mackerel Scomber Japonicus in the Western North Pacific Ocean: With Application and Validation of Otolith Daily Increment Formation. Fisheries Sci. 80, 293–300. doi: 10.1007/s12562-013-0698-2
Tsuda Y., Yamamoto S., Yamaguchi H., Ohnishi T., Sakamoto W., Murata O. (2014). Vertical Movement of Spawning Cultured Chub Mackerel (Scomber Japonicus) in a Net-Cage. Aquaculture 422, 136–140. doi: 10.1016/j.aquaculture.2013.12.008
Xue M. H., Tong J. F., Tian S. Q., Wang X. F. (2021). Broadband Characteristics of Zooplankton Sound Scattering Layer in the Kuroshio–Oyashio Confluence Region of the Northwest Pacific Ocean in Summer of 2019. J. Mar. Sci. Eng. 9, 938. doi: 10.3390/jmse9090938
Yan N., Mukai T., Yamamoto J., Hasegawa K. (2020). Acoustic Discrimination Between Juvenile Walleye Pollock and Pointhead Flounder. Fish. Res. 224, 105434. doi: 10.1016/j.fishres.2019.105434
Yasuma H., Nakagawa R., Yamakawa T., Miyashita and K., Aoki I. (2009). Acoustic Models of Fish: The Atlantic Cod (Gadus Morhua). Fisheries Sci. 75, 545–552. doi: 10.1007/s12562-009-0172-3
Yasuma H., Sawada K., Ohshima T., Miyashita K., Aoki I. (2003). Target Strength of Mesopelagic Lanternfishes (Family Myctophidae) Based on Swimbladder Morphology. ICES J. Mar. Sci. 60, 584–591. doi: 10.1016/S1054-3139(03)00058-4
Yasuma H., Sawada K., Takao Y., Miyashita K., Aoki I. (2010). Swimbladder Condition and Target Strength of Myctophid Fish in the Temperate Zone of the Northwest Pacific. ICES J. Mar. Sci. 67, 135–144. doi: 10.1093/icesjms/fsp218
Keywords: Kirchhoff-ray mode model, target strength, Scomber japonicus, Northwest Pacific Ocean, acoustic
Citation: Tong J, Xue M, Zhu Z, Wang W and Tian S (2022) Impacts of Morphological Characteristics on Target Strength of Chub Mackerel (Scomber japonicus) in the Northwest Pacific Ocean. Front. Mar. Sci. 9:856483. doi: 10.3389/fmars.2022.856483
Received: 17 January 2022; Accepted: 25 March 2022;
Published: 27 April 2022.
Edited by:
Morten Omholt Alver, Norwegian University of Science and Technology, NorwayReviewed by:
Jorge Paramo, University of Magdalena, ColombiaIole Leonori, National Research Council (CNR), Italy
Copyright © 2022 Tong, Xue, Zhu, Wang and Tian. This is an open-access article distributed under the terms of the Creative Commons Attribution License (CC BY). The use, distribution or reproduction in other forums is permitted, provided the original author(s) and the copyright owner(s) are credited and that the original publication in this journal is cited, in accordance with accepted academic practice. No use, distribution or reproduction is permitted which does not comply with these terms.
*Correspondence: Jianfeng Tong, amZ0b25nQHNob3UuZWR1LmNu