 Sarah M. E. Fortune
 Andrew W. Trites
 Valerie LeMay
 Mark F. Baumgartner
 Steven H. Ferguson
- 1Department of Oceanography, Dalhousie University, Halifax, NS, Canada
- 2Fisheries and Oceans Canada, Freshwater Institute, Winnipeg, MB, Canada
- 3Department of Zoology and Marine Mammal Research Unit, Institute for the Oceans and Fisheries, University of British Columbia, Vancouver, BC, Canada
- 4Department of Forest Resources Management, University of British Columbia, Vancouver, BC, Canada
- 5Biology Department, Woods Hole Oceanographic Institution, Woods Hole, MA, United States
The ecological impact of environmental changes at high latitudes (e.g., increasing temperature, and decreased sea ice cover) on low-trophic species, such as bowhead whales, are poorly understood. Key to understanding the vulnerability of zooplanktivorous predators to climatic shifts in prey is knowing whether they can make behavioural or distributional adjustments to maintain sufficient prey acquisition rates. However, little is known about how foraging behaviour and associated environmental conditions fluctuate over space and time. We collected long-term movement (average satellite transmission days were 397 (± 204 SD) in 2012 and 484 (± 245 SD) in 2013) and dive behaviour data for 25 bowhead whales (Balaena mysticetus) equipped with time-depth telemetry tags, and used hierarchical switching-state-space models to quantify their movements and behaviours (resident and transit). We examined trends in inferred two-dimensional foraging behaviours based on dive shape of Eastern Canada-West Greenland bowhead whales in relation to season and sea ice, as well as animal sex and age via size. We found no differences with regards to whale sex and size, but we did find evidence that subsurface foraging occurs year-round, with peak foraging occurring in fall (7.3 hrs d-1 ± 5.70 SD; October) and reduced feeding during spring (2.7 hrs d-1 ± 2.55 SD; May). Although sea ice cover is lowest during summer foraging, whales selected areas with 65% (± 36.1 SD) sea ice cover. During winter, bowheads occurred in areas with 90% (± 15.5 SD) ice cover, providing some open water for breathing. The depth of probable foraging varied across seasons with animals conducting epipelagic foraging dives (< 200 m) during spring and summer, and deeper mesopelagic dives (> 400 m) during fall and winter that approached the sea bottom, following the seasonal vertical migration of lipid-rich zooplankton. Our findings suggest that, compared to related species (e.g., right whales), bowheads forage at relatively low rates and over a large geographic area throughout the year. This suggests that bowhead whales have the potential to adjust their behaviours (e.g., increased time allocated to feeding) and shift their distributions (e.g., occupy higher latitude foraging grounds) to adapt to climate-change induced environmental conditions. However, the extent to which energetic consumption may vary seasonally is yet to be determined.
Introduction
Climate change is a leading threat to marine biodiversity worldwide (Worm and Lotze, 2021) because of the critical role environmental conditions (e.g., temperature, sea ice, stratification) play in species distribution and diversity in the oceans (Pacifici et al., 2015; Worm and Lotze, 2021). Based on forecasted global temperature increases, up to one in six species may be lost due to ecosystem shifts (Urban, 2015). The ecological mechanisms driving such extinction include habitat loss or degradation, reduced prey acquisition, lowered reproductive success, and higher rates of mortality (Beissinger, 2000; Strona and Bradshaw, 2018; Román-Palacios and Wiens, 2020). Species may also experience temperatures that exceed their physiological limits leading to metabolic challenges (e.g., fish) (Cahill et al., 2013) or phenological responses that alter lifecycles through changed growth rates, development times and molting rates (e.g., calanoid copepods—zooplankton). This in turn can affect recruitment and interspecific competition for resources (Usov et al., 2021). Subsequent shifts in the distribution and abundance of energetically rich prey species (Cahill et al., 2013) in response to abiotic stressors (temperature) may result in population level impacts for comparatively higher trophic species including marine mammals.
Zooplankton serve an important role in the transfer of organic matter and energy in marine food webs (Armengol et al., 2019) and are sensitive to changes in environmental conditions such as temperature, salinity and sea ice cover (Ershova et al., 2021). Poleward shifts in the distribution of ecologically important zooplankton taxa such as Calanus spp. have been documented in the North Atlantic Ocean, along with the borealization (i.e., northern shift in distribution of boreal species; Renaud et al., 2018) of zooplankton in the Davis Strait (Møller and Nielsen, 2020). Given these existing shifts in zooplankton and the critically important role they play in the stability of marine food-webs (Venkataramana et al., 2019), low-trophic, zooplanktivorous predators may be particularly vulnerable to climatic shifts.
Climate change impacts on population dynamics (Jenouvrier et al., 2018) may be particularly pronounced for balaenid whales, specifically, bowhead (Balaena mysticetus) and North Atlantic right whales (Eubalaena glacialis). Although both species are genetically related with similar morphologies and diets, their population trajectories and life-history characteristics are markedly different. They may also have physiological adaptations making it easier for bowheads to meet their metabolic needs (e.g., hypometabolic rate; George et al., 2021) under future climatic conditions compared to right whales. Unlike other zooplanktivorous polar predators, such as humpback whales (Megaptera novaeangliae), little auk (Alle alle), and ringed seal (Pusa hispida) (Jakubas et al., 2017; Bengtson Nash et al., 2018; Ross et al., 2022), bowhead whales may be particularly vulnerable to climate-induced shifts in prey, since their long generation times may limit the capacity for adaptive evolution to help compensate for environmental fluctuation (Refsnider and Janzen, 2012; Silber et al., 2017). Consequently, behavioural plasticity and dispersal may be the most important means by which bowhead and right whales can contend with climatic changes. However, the inherent sensitivity of both species to climate-induced shifts in prey and their capacity to adapt is unknown.
Although northward habitat shifts have been observed for right whales (Simard et al., 2019), little is known about the energetic impact of prey alterations (Gavrilchuk et al., 2021) for future populations (Meyer-Gutbrod and Greene, 2018). Unlike more generalist predators such as sei whales (Balaenoptera borealis) that can exploit both calanoid copepods and small schooling fish (Burkhardt-Holm and N’Guyen, 2019), balaenids are not morphologically adapted to efficiently capture evasive fish prey. Slow swim speeds conducive to continuous ram-filtration require that bowheads and right whales target smaller, less mobile but densely aggregated prey compared to the Balaenopteridae family that use fast lunges and expanding throat grooves to maximize consumption of mobile taxa (Goldbogen et al., 2017). Consequently, the specialized foraging strategy of balaenids may make them particularly sensitive to climatic shifts in prey. Furthermore, research indicates that bowheads will experience a 50% loss in suitable habitat by 2100 (Foote et al., 2013), as lipid-rich Arctic calanoid copepods (Calanus glacialis) become replaced by smaller temperate species (C. finmarchicus) that are lower in lipid content (Møller and Nielsen, 2020). However, it is yet to be determined whether bowheads will be able to adjust their energy budget by allocating more time to foraging (behavioural) or shift their distribution (dispersal) as they did during the Late Pleistocene (Foote et al., 2013) when pronounced fluctuations in environmental conditions occurred. Central to understanding the role that behavioural flexibility (i.e., plasticity) (Refsnider and Janzen, 2012; Samarra and Miller, 2015; Beever et al., 2017; Buchholz et al., 2019) may play in mitigating population level impacts of climate change is knowing to what extent bowhead whales (Reeves et al., 1983; Richardson et al., 1995; Fortune et al., 2020c) forage seasonally (Matthews and Ferguson, 2015; Pomerleau et al., 2018).
Behavioural flexibility or plasticity has been identified as a potential mechanism for disparate responses to environmental fluctuations (Buchholz et al., 2019). However, capacity to evaluate the degree to which behavioural flexibility may buffer climatic shifts—particularly in response to changes in the distribution, abundance and species composition of prey—is contingent upon comprehensive knowledge of the movements, habitat-use patterns (Pomerleau et al., 2011; Heide-Jorgensen et al., 2012; Chambault et al., 2018) and behaviours (Nielsen et al., 2015; Citta et al., 2021) of individuals under present conditions. To evaluate the capacity for individuals to alter their behaviour (e.g., activity budgets) in response to prey alterations, requires knowing where and for how long different age-sex groups of whales forage throughout their range. Much of what is known about large whale foraging ecology has come from short-term biologgers that record data for hours to days (Baumgartner and Mate, 2003; Simon et al., 2009; Goldbogen et al., 2015; Baumgartner et al., 2017; van der Hoop et al., 2019). Although informative, these studies provide a spatially and temporally limited understanding of behaviour, leaving little capability to quantify to what degree individual species like bowhead whales may be able to make behavioural adjustments.
To assess the potential for behavioural plasticity and dispersal to help buffer Eastern Canada-West Greenland bowhead whales against forecasted ecosystem changes, we used long-term satellite telemetry, time-depth recorder data (>365 days), and georeferenced bathymetry and sea ice condition data to examine: 1) the proportion of time individuals allocate to probable foraging on a daily and seasonal timescale; 2) what environmental conditions currently support successful foraging (e.g., sea ice conditions); and 3) how vertical foraging behaviour (e.g., depth) changes across seasons for individuals of different sexes and body lengths. Since Eastern Canada-West Greenland bowhead whales make predictable seasonal movements (Heide-Jørgensen et al., 2010; Nielsen et al., 2015; Fortune et al., 2020c) from southern regions in winter and spring to higher latitude areas in summer and fall, we can infer habitat-use patterns based on season. We predicted that seasonally high foraging effort under present environmental conditions would indicate a reduced capacity to adjust activity budgets in a changing environment, and that low effort may reflect greater potential for compensation via behavioural plasticity. We also expected that small spatial extent would indicate poor capacity for dispersal and vice versa—assuming that spatial extent of seasonal foraging areas is an indicator of suitable habitat. Consequently, we utilized longitudinal data to quantify patterns in the time spent foraging to evaluate how climate-change resilient bowhead whales are likely to be. Finally, we compared our findings with what is known for a closely related but apparently nutritionally stressed species—the North Atlantic right whale.
Materials and methods
Telemetry
A total of 25 bowhead whales were equipped with long-term satellite telemetry tags that included time-depth recorders (Wildlife Computers SPLASH MK10). Whales were tagged in Foxe Basin and Cumberland Sound, Nunavut (Figure 1). The SPLASH tags recorded date, time, location, and summary dive behaviour (i.e., depth, duration, and shape of dive). Dive behaviour is continuously logged via time-depth recorder and all summary statistics are transmitted during successful satellite transmission. The Platform transmitter terminals (PTTs) were programmed to maximize tag longevity to cover as much of the annual whale migrations as possible. Consequently, the tags were programmed to transmit up to 400 times a day every second hour during the summertime and only 100 times every second day during winter.
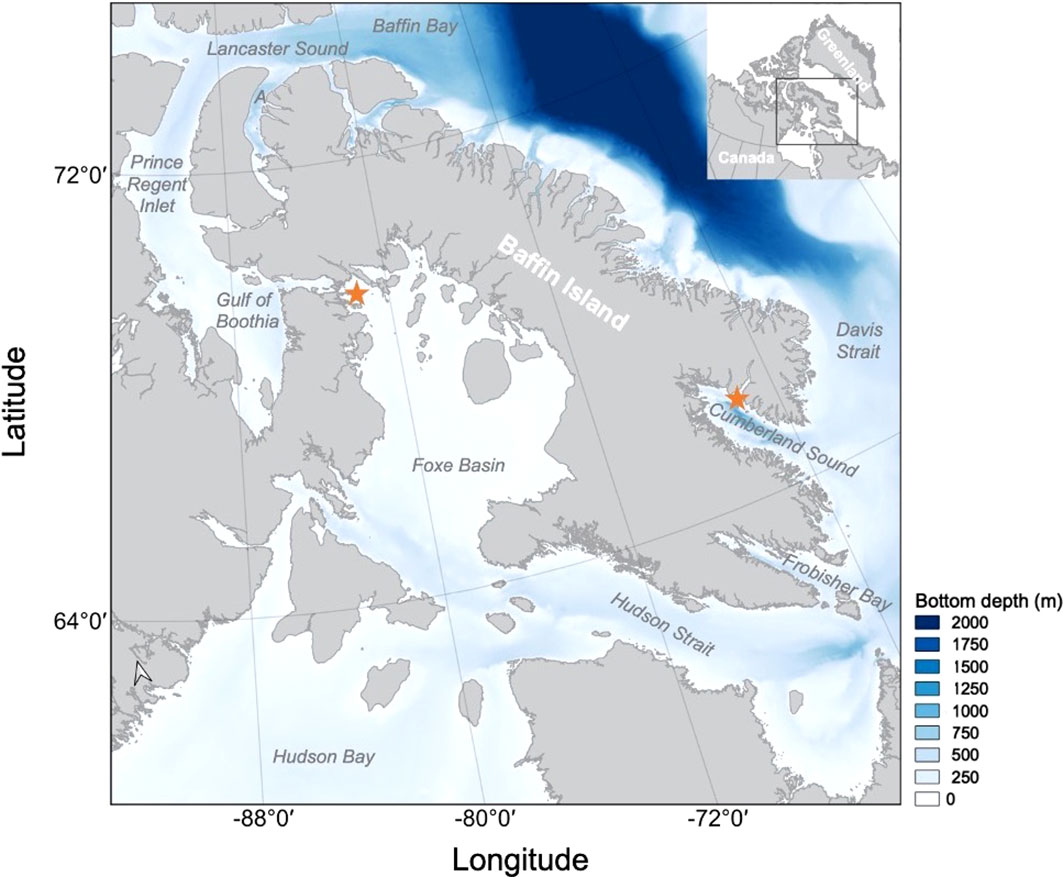
Figure 1 Study area for Eastern Canada-West Greenland bowhead whales tagged in Foxe Basin and Cumberland Sound Nunavut with bathymetric data indicating the depth of the sea bottom ranging from 0 m (white) to 2000 m (dark blue). Regions of interest (Hudson Bay, Hudson Strait, Foxe Basin, Gulf of Boothia/Prince Regent Inlet, Admiralty Inlet, Cumberland Sound and Frobisher Bay) are indicated with ‘A’ representing Admiralty Inlet. Tagging locations off Igloolik (Foxe Basin) and Pangnirtung (Cumberland Sound) are indicated (★). QGIS 3.10 (QGIS Development Team, 2018) and General Bathymetric Chart of the Oceans (GEBCO) global 453 terrain model for ocean and land (GEBCO Compilation Group, 2021) was used to construct this map.
A ~20 cm stainless steel anchor was used to attach the tag to the whale’s blubber, and a 4 cm biopsy tip simultaneously collected a skin and blubber sample for genetic analysis and to determine sex. A 1:10 bleach/water solution was used to sterilize the anchor and biopsy tip prior to use. The tags were deployed using an 8 m fiberglass hand-held tagging pole and attached in the middle of the back posterior to the blowholes. Placing the tag in this location improved data transmission by maximizing the time the transmitter was above the water. Body length was estimated relative to the known length of the tagging vessel during each tagging event. Age-classes were determined based on estimated median body length of tagged whales (n=23) whereby juveniles include individuals 10 m, sub-adults represent animals >10 m and <13 m and adults were ≥13 m.
Horizontal movement analysis
We used the Square Root Unscented Kalman Filter (SRUKF) algorithm developed by Service Argos to re-process the raw Argos locations. This algorithm consists of a correlated random walk model that uses the individual’s previous location and estimated error to predict an animal’s future position (Silva et al., 2014). We selected the Kalman Filter over the Least-squares algorithm because it typically results in an increased number of positions and improved accuracy of low-quality Argos locations (e.g., location classes 0, A and B) that are common for large whale tagging studies (Silva et al., 2014, Lowther et al., 2015). The bowhead whale telemetry data are typically biased towards low-quality locations due to diving behaviour (e.g., short surface intervals between dives) and the environment (e.g., seasonally ice covered).
Argos location data for marine animals often contain some poor-quality records. We therefore filtered the data using a speed filter (vmask function in the argosfilter package in R; R Core Team, 2020) to remove SRUKF Argos locations that would have resulted from biologically improbable swimming speeds. We set a speed threshold of 2 m s-1 based on previous measurements of balaenid swim speed while foraging and travelling (Mayo and Marx, 1990; Baumgartner and Mate, 2003; Werth, 2004; Simon et al., 2009; Nielsen et al., 2015), and removed locations with swimming speeds greater than this from the data set.
We used a hierarchical switching-state-space model or ‘HSSSM’ (Jonsen et al., 2005, Jonsen et al., 2013) to estimate the movement of individual whales and determine the probable behavioural state associated with each location (e.g., travelling and resident behaviours). Jonsen et al. (2013) provided the R package ‘bsam’ (R Core Team, 2020), which we used to fit a correlated random walk model (CRW). The CRW switched between two CRWs, one that reflected resident or area-restricted movement behaviour and another that reflected transit behaviour (Jonsen et al., 2005). Mean turn angle and swimming speed were used to differentiate the two CRWs and the associated behavioural states (Jonsen et al., 2005). Low swimming speeds and high turning angles reflected ‘resident’ behaviour, whereas faster and more linear movements reflected ‘transit’ behaviour. Resident behaviour is expected to be associated with foraging (e.g., Haskell 1997; Hill et al., 2000; Fauchald and Tveraa 2003; Thums et al., 2011; Byrne and Chamberlain, 2012) and other spatially limited behaviours such as reproduction (Würsig et al., 1993; Kraus and Hatch, 2001) and rock-rubbing (Fortune et al., 2017). During winter when sea ice thickness and cover are maximized, resident behaviour may also reflect a degree of spatial restriction such that horizontal movement is limited. In the absence of extensive ice cover, multi-scale biologging and simultaneous prey-field sampling studies have corroborated that resident behaviour is associated with foraging behaviour (Fortune et al., 2020a).
We selected the hierarchical switching-state-space model because it provides regularly spaced location estimates and categorizes behaviour, both needed to determine the seasonal foraging behaviour of bowhead whales in the Eastern Canadian Arctic. We defined seasons as being summer (June, July, August), fall (September, October, November), winter (December, January, February) and spring (March, April, May), and used mean estimates from the Markov Chain Monte Carlo (MCMC) samples to classify behaviour states (b), which assumed that b=1 was transit and b=2 was resident mode. We used the same cut off points for b as used by others (Jonsen et al., 2007; Fortune et al., 2020b; Fortune et al., 2020c) such that locations with mean estimates of b > 1.75 were assumed to reflect resident and b <1.25 reflected transit behaviour. Values of b that fell between 1.25 and 1.75 were assigned an unclassified behavioural state.
To determine physical environmental conditions associated with tagged whales, HSSSM predicted locations were georeferenced with bathymetry and sea ice datasets. We used satellite derived sea-ice concentration data from the Advanced Microwave Scanning Radiometer 2 (AMSR2) sensor (Institute of Environmental Physics, University of Bremen) (Spreen et al., 2008) to determine monthly sea ice concentration. To obtain an estimate of sea ice conditions encountered by tagged whales, we used one raster image from the beginning of the month for each year (2012-2015) with a 3.125 km spatial resolution. For bathymetry, we used the 2020 gridded bathymetric data set from General Bathymetric Chart of the Oceans (GEBCO) global terrain model for ocean and land. This data set provided elevation information in metres on a 15 arc-second interval grid. Using QGIS (version 3.10; Development Team, 2018), we used the point sampling tool to extract bathymetric and sea ice cover data associated with each HSSSM location. We subsequently removed any corresponding values resulting from HSSSM locations occurring on land as well as erroneous bathymetric readings (< 0 m).
Vertical movement analysis
We analyzed bowhead diving behaviour using summary time-depth-recorder (TDR) dive data telemetered over the duration of the tag attachment period to: 1) refine predictions of foraging behaviour based on horizontal movement; 2) evaluate spatio-temporal trends in 2D foraging behaviour (e.g., square dives); 3) determine how environmental covariates such as sea ice cover and bathymetry impact diving behaviour as well as sex, body length and season; and 4) quantify time spent foraging seasonally throughout their range. The TDR recorded several dive statistics such as dive shape (V, U or square), maximum dive depth and duration. Dives were defined as excursions to depths ≥ 8 m. Consequently, dives that were shallower than 8 m were not included in the analysis. The shape of the dive was classified using Wildlife Computers’ three broad categories: V-shaped dives included dives where ≤ 20% of total duration was spent at maximum depth; U-shaped dives occurred when > 20% and ≤ 50% of total duration was spent at maximum depth; and square dives included those where > 50% of the duration was spent at maximum depth.
Dive shape classification may be used to infer behaviour. Previous foraging ecology studies of bowhead whales have concluded that square and U-shaped dives that maximize bottom time reflect foraging dives (Laidre et al., 2007; Heide-Jørgensen et al., 2013). For example, bowhead whales off the coast of Disko Bay during spring, conducted deep U- shaped dives to depths where high abundances of pre-ascension Calanus finmarchicus were concentrated (Laidre et al., 2007). Furthermore, bowhead whales appear to temporally adjust the depth of their U-shape dives, suggesting that individuals alter their feeding behaviour based on the vertical distribution of their prey (Heide-Jørgensen et al., 2013; Fortune et al., 2020a). We defined foraging behaviour as square-shaped dives conducted during resident behavior, and estimated the time spent foraging per day for each whale by summing the duration of square-shape dives (including descent, bottom and ascent phase) during resident behaviour. To account for gaps in predicted locations from the satellite-telemetry data, we calculated a daily estimate of foraging time aggregated across months and do not provide a cumulative estimate.
As well as prior data screening previously described, we further excluded locations predicted from the HSSSM that resulted from gaps exceeding four consecutive days in the ‘raw’ SRUKF data. We subsequently merged the behavioural data with the Argos location data based on matching dates and assumed that animals remained in a specific habitat for the entire day as this matched previous observation of bowhead movement in Cumberland Sound based on focal follows of tagged individuals (Fortune et al., 2020a). We also assumed that if there was a resident associated HSSSM location within a habitat on a particular day, all dives occurring during that same day were similarly conducted inside that habitat. This assumption was based on observed multi-scale bowhead whale tagging and focal follow data that showed individuals resided in a region of interest (e.g., Cumberland Sound) for consecutive weeks to months (Fortune et al., 2020a; Fortune et al., 2020b). Furthermore, observed patterns in HSSSM data demonstrate that transit locations occur when individuals are exiting a region of interest (Fortune et al., 2020a; Fortune et al., 2020b).
Examining patterns in horizontal and vertical movements
Once data were prepared, we first used graphical approaches and simple data summaries to examine spatio-temporal patterns in two-dimensional behaviours. Specifically, we examined the spatial extents of resident, transient, and unknown behavioural states using the HSSSM predicted locations and mapping software (i.e, QGIS 3.10; QGIS Development Team, 2018). To evaluate how much horizontal behaviour might reflect actual foraging, we examined the proportion of all dives by shape associated with predicted resident locations. Assuming square-shaped dives (≥8 m) were foraging dives based on prior research (Fortune et al., 2020a) or behavioural changes within years, we graphed the percent sea ice cover by month (2013 and 2014 only). We used faceted heatmaps to examine monthly and diel patterns in putative foraging dive behaviour, and used ridgeline plots to compare the distributional changes in bathymetric and sea ice cover data across months and behavioural states (i.e., resident, transient and unknown). We also summarized the information on square-shaped dive depths, proximity to the sea bottom, and associated ice conditions using boxplots. Finally, seasonal and regional changes in average time spent feeding per day was elucidated with heatmaps, boxplots and violin plots (showing raw data distribution).
We then used models to specifically look for effects of four fixed-effects factors, namely, the two class variables, season (spring, summer, winter, fall) and sex (male or female), and the two continuous variables, median body length (m) and percent sea ice cover on vertical models, namely foraging dives considered to be the square-shaped dives only (Laidre et al., 2007; Heide-Jørgensen et al., 2013; Fortune et al., 2020b). For this, 23 of the 25 whales were included, since two whales (PTT 114501 and 128149 removed) were missing one or more of these four factors. We scaled dive depths for varying sea water depths by calculating: 1) the distance between the maximum depth of putative foraging dives (square-shaped dives) and sea bottom (i.e., maximum bathymetry), labeled hereafter as ‘distance to bottom’; and 2) the ratio of the maximum depth of square-shaped dives relative to maximum bathymetry, henceforth called ‘fraction of water column’. We included ‘distance to bottom’ in our models because it represents the proximity of probable foraging dives to the sea bottom providing an indication of when bowheads are likely feeding on deep prey aggregations (i.e., benthic dives) such as diapausing life-stages of lipid-rich copepods. A small difference indicates whales are near the sea bottom (e.g., 5 m) conducting benthic dives, whereas a large difference (e.g., 100 m) reflects more epipelagic dives in the photic zone. The fraction of the water column was also included as this variable provides a proportional measure of proximity of maximum depth of square-shaped foraging dives associated with resident locations to the sea bottom. Data were filtered such that any instances where the max dive depth was greater than the sea bottom depth were deemed erroneous and were removed from our analysis. Values closer to 0 are near the surface, whereas values closer to 1 indicate the deep dives near the sea floor.
Using distance to bottom as the response variable, the modelling approach was as follows:
1. We used estimated generalized least squares fitted using the function ‘gls’ of the R package ‘nlme’ to fit alternative models using combinations of the four factors and interactions between the class variables as well as between the class and continuous variables (21 models).
2. For these models, we used a natural logarithmic of the distance to bottom variable to meet assumptions of normality and equal variances. We also standardized the two continuous variables, length and sea ice, to zero means and unit standard deviations to remove differing measurement scale effects on estimated fixed-effects parameters.
3. We accounted for the autocorrelation of multiple dive records per animal (repeated measures) using a first-order continuous autocorrelation process (i.e., CAR(1) using Julian date) within each animal given the irregularly spaced measures in time (Pinheiro and Bates, 2000). However, we also investigated possible higher-level correlations using first- to fourth-order autocorrelation (AR) processes, since higher-level CAR processes are difficult to model and, consequently, have not been included in nlme (nor in other R packages). Although some evidence was found for possible higher order autocorrelations using AR processes, the largest was first order, as expected. Given that over-specifying the correlation model can lead to a removal of the signal in the data, and also that higher orders of CAR processes were not available using nlme, CAR(1) was retained for all models.
4. Since interpretation of the magnitude and direction of estimated fixed-effects parameters would be of interest for models without interactions, we used the variance inflation factor (VIF) as a measure of multicollinearity implemented in R using collinearity() and vif() functions. VIFs were all <1.5 in the model with all four factors (no interactions). For models with interactions, variables are related given the nature of interactions and VIFs tend to be inflated. In any case, estimated fixed-effects parameters of models with interactions among variables cannot be separately interpreted, but must be jointly interpreted.
5. The log likelihood and Akaike’s Information Criterion (AIC) were used to select among the models, along with likelihood ratio tests for a subset of nested models (α=0.05).
To examine the possible impacts of the four fixed-effects factors on the fraction of the water column as the response variable, some changes were made to the modelling approach since this variable is a ratio bounded by 0 and 1. First, we considered two alternative probability distributions for this ratio response variable, specifically the binomial distribution with a logit link that has commonly been used for proportions or ratios and the beta distribution also with a logit link. The binomial distribution is not ideal since there are technically no ‘successes’ and ‘trials’ used in obtaining the fraction of the water column values. As a result, the beta distribution has been more recently recommended for proportions and ratios (e.g., Ferrari and Cribari-Neto, 2010; Damgaard and Irvine, 2019). However, the beta distribution requires all values to be in the (0,1) interval, meaning that all values exactly equal to 0 or to 1 must be removed or the response variable must be rescaled to avoid these endpoints. Also, algorithms using the beta distribution that also account for correlated data and/or random effects are generally not available. Conversely, the binomial distribution has been used for some time for successes out of trials as well as for proportions and ratios. As a result, algorithms to account for correlated data and random effects have been developed and well-tested. Overall, a clear choice for the fraction of the water column models would appear to be using a binomial distribution and CAR1 to account for irregularly-spaced time intervals, as with the distance to bottom response variable. Unfortunately, the algorithms for a binomially distributed response variable with correlations in time use pseudo-likelihood to find a solution. As a result, there is no log likelihood and therefore no AIC to compare models; other measures of goodness-of-fit, such as the sum of squared deviances, sum of squared differences between the measured (‘y’) and (‘yhat’) estimated proportions, and/or root mean squared difference between y and yhat must be used instead. Furthermore, hypothesis tests of groups of variables are not easily done, including testing nested models. As well, higher levels of correlation are generally not implemented, meaning that only AR1 or CAR1 can be included in the models. Given these challenges and focusing on examining any impacts of the four factors, we used the following modelling approach for the fraction of the water column response variable:
1. First, we used the R package ‘glmmPQL’ to fit a generalized linear model with a binomial distribution, a logit link, random intercept by animal, and a CAR1 within animal correlated error structure. We did also examine alternative algorithms based on reported reliabilities. specifically the R package ‘lme4’ using the ‘glmer()’ function, but that allowed for a random intercept by animal only, a correlation structure that does not represent the repeated measures within animal data used in this study. We initially also fitted all models using the R package ‘betareg’, since the beta distribution had been recommended, but given the inability to include correlation structures, and the need to rescale the fraction of the water column to remove any 0’s or 1’s, these were dropped.
2. As with models for distance to bottom, we standardized the two continuous variables and combinations of variables without and with interactions (21 models for fraction of the water column).
3. To compare the models, we used the sum of squared deviances as well as the sum of squared differences between the measured and estimated (‘SSE’) fraction of the water column values. The sum of squared deviances were carefully used for model comparison, since the deviances use both the fixed and random effects; consequently, a model with more explanatory variables may not have a smaller (or even the same) sum of squared deviances. The SSE used only the estimated fixed-effects parameters; however, since search algorithms are used to fit these models, again, a model with more fixed-effects variables may not have a lower (or even the same) value.
4. For a selection of models resulting from the comparisons, we also calculated the square root of the mean squared differences. These values indicate the accuracy of fraction of the water column estimates in the same units as fraction of the water column and facilitated model interpretation.
Results
Overview of satellite-telemetry data and HSSSM
The 25 bowhead whales were tagged during summer 2012 and 2013 in two regions of the eastern Canadian Arctic—Foxe Basin and Cumberland Sound. There were 16 whales tagged during July and August 2012 in Foxe Basin (4 females, 3 males and 1 of unknown sex) and Cumberland Sound (3 females and 5 males). In July 2013, 9 juvenile and adult whales (4 non-lactating females, 4 males and 1 of unknown sex) were tagged in Foxe Basin. Females with calves were not approached for tagging. The whales tagged in 2012 transmitted data for 397 ± 204 days on average, while those tagged in 2013 transmitted for 484 ± 245 days (Table 1). The state-space model predicted two daily locations for each animal. The combined data set for all whales contained 16,587 locations throughout the Eastern Canadian Arctic, and the location data were relatively evenly distributed across seasons with 29% (n=4,737) in fall, 25% (n=4,095) winter, 22% (n=3,709) in spring and 24% (n=4,046) in summer. Of all the predicted locations, 73% (n=12,161) were associated with resident behaviour and only 13% (n=2207) were associated with transit behaviour (Figures 1, 2). The greatest proportion of resident locations for all bowhead whales and years combined was during winter (83.2% of n=3,405), followed by fall (69.6%, n=3,297), spring (81.3%, n=3,017) and summer (60.4%, n=2,442). The high number of winter and springtime resident locations corresponds with lower numbers of transit behaviours observed during winter (12%, n=258) and spring (14%, n=301). Conversely, proportionally fewer resident locations were observed during fall (transit; 34%, n=745) and summer (transit:41%, n=903) when transit behaviour was more frequent.
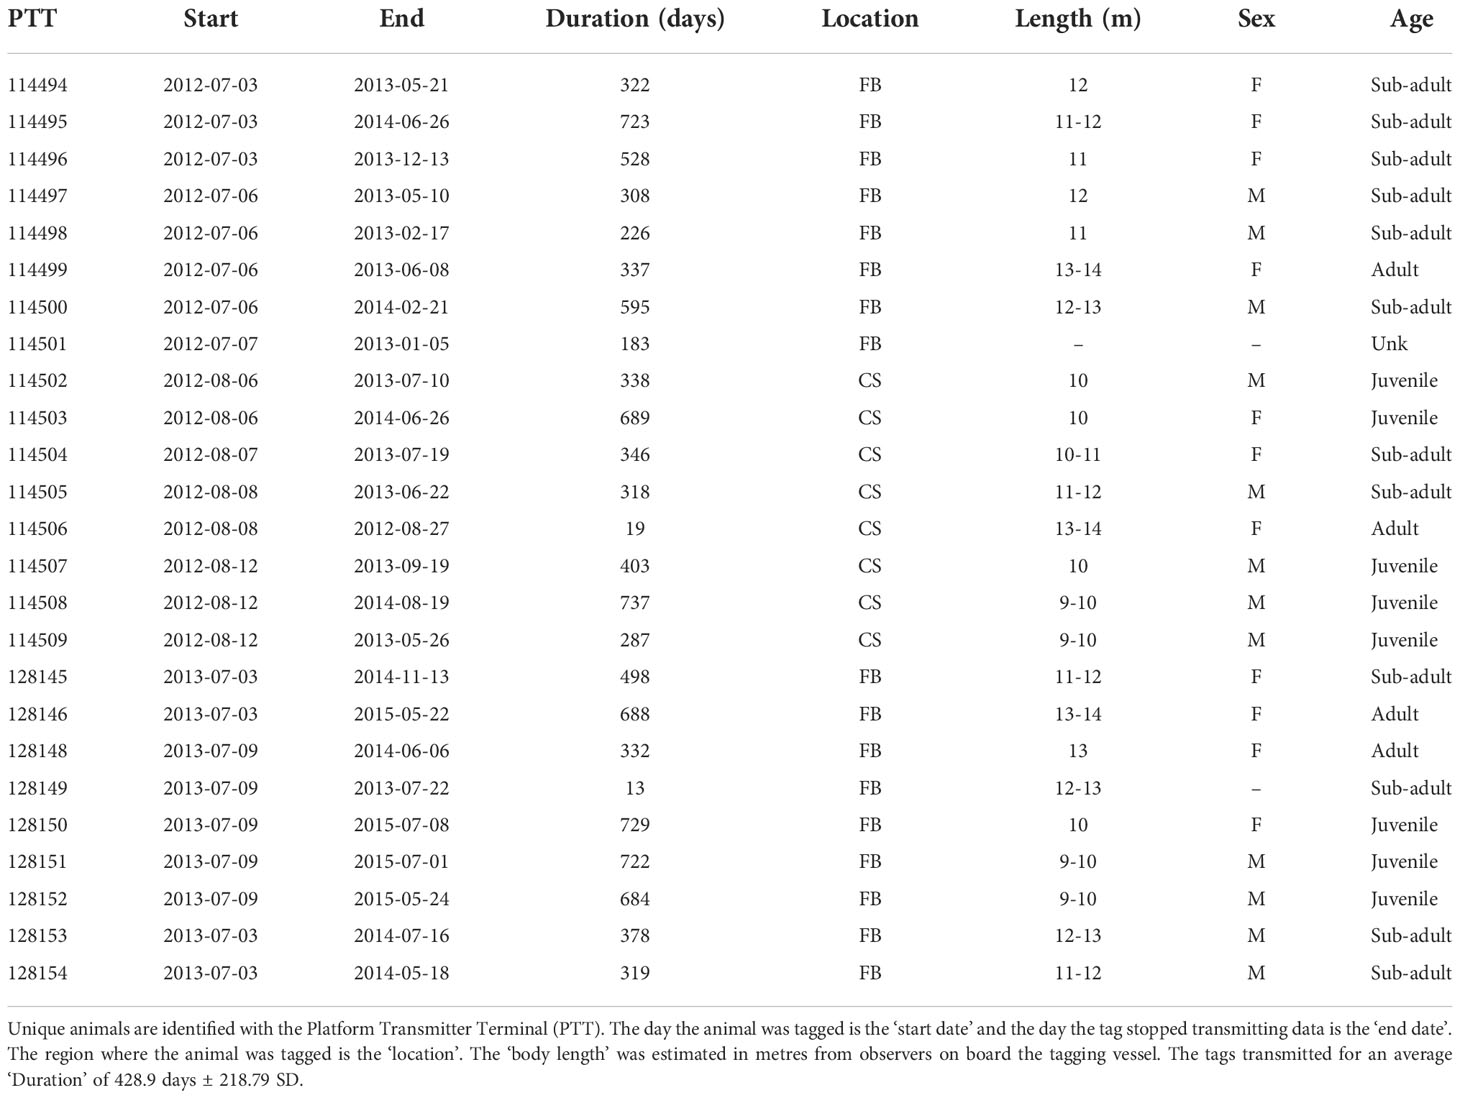
Table 1 Summary information for all bowhead whales tagged in Cumberland (CS) and Foxe Basin (FB) with Wildlife Computers SPLASH Tags (MK10) between 2012 and 2013.
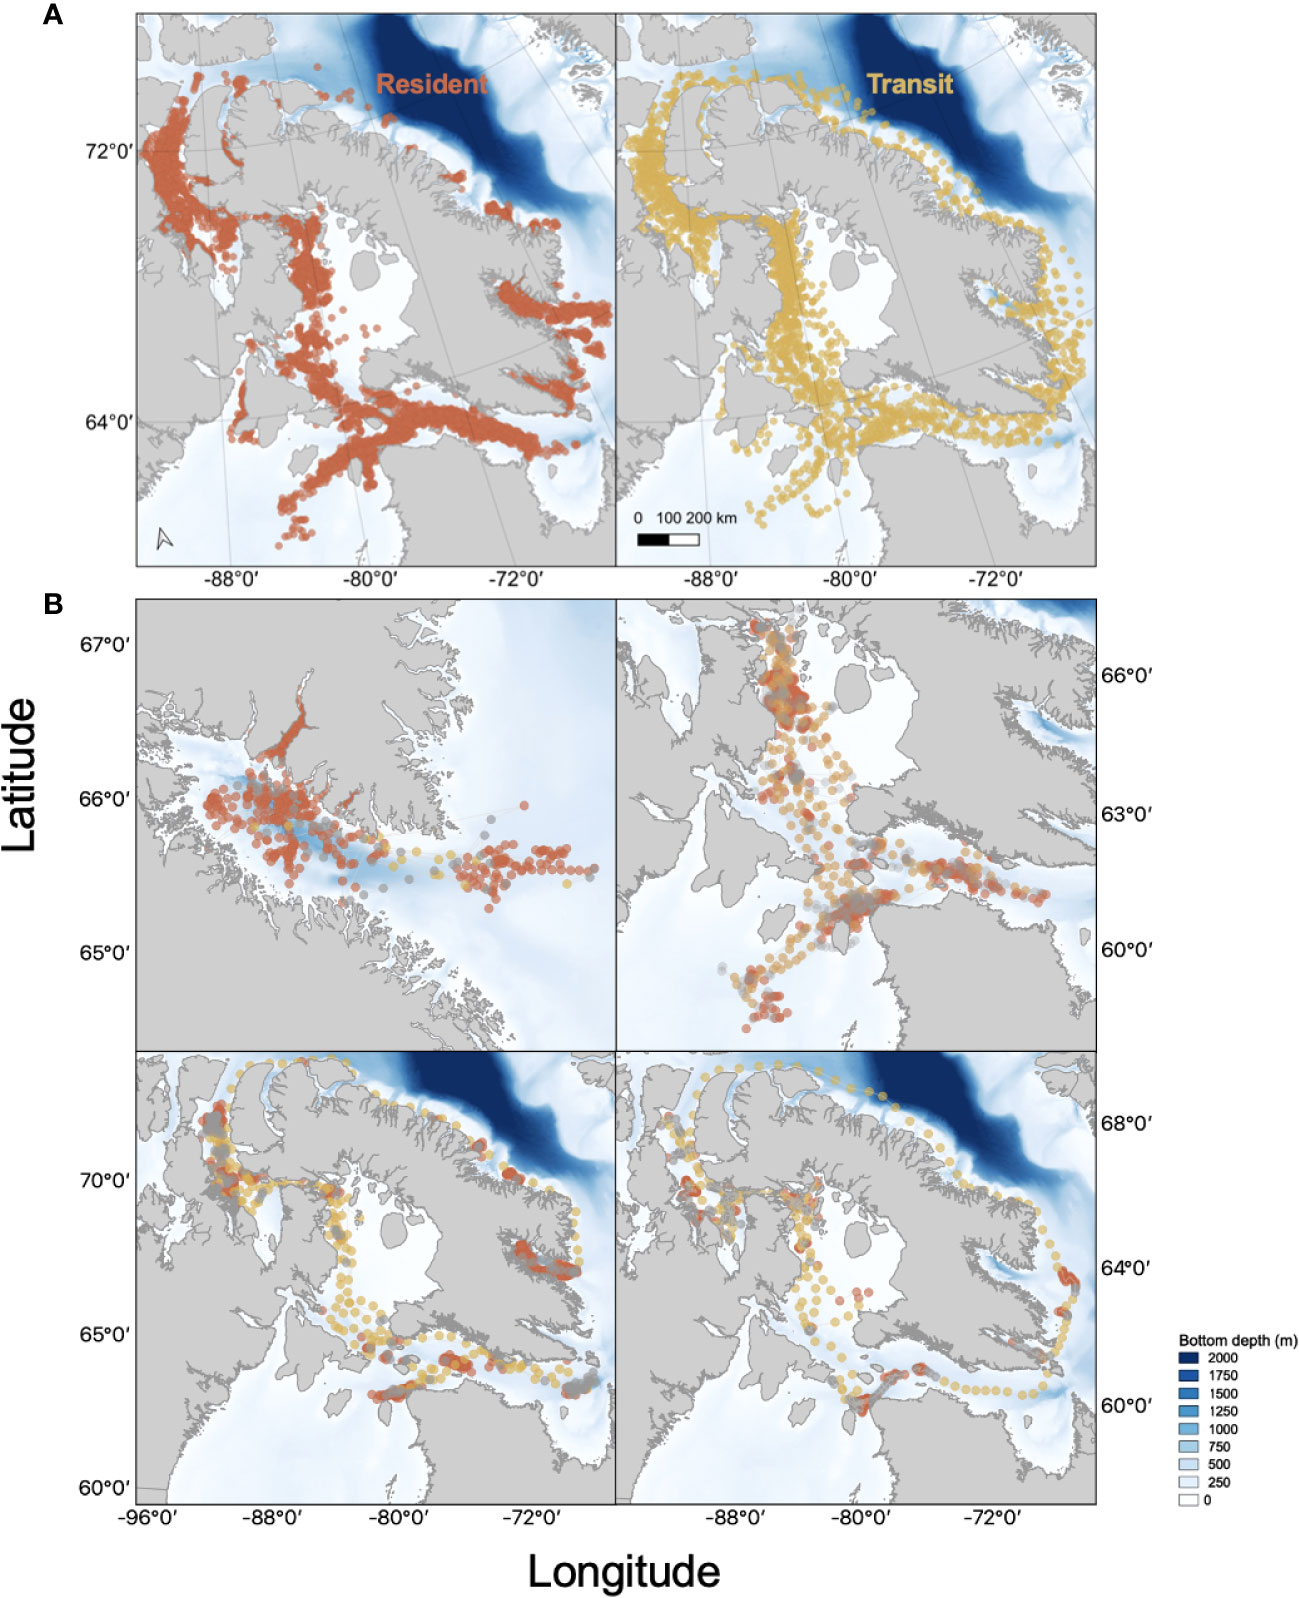
Figure 2 (A): Argos Satellite locations for 25 SPLASH tagged bowhead whales in the Eastern Canadian Arctic derived from hierarchical switching state-space models (HSSSM). Resident (●) and transit (●) behavioural states derived from the HSSSM are plotted for each animal. (B): Example of Argos satellite tracks derived from HSSSM predictions for four SPLASH tagged bowhead whales (PTT 114504, 128150, 128152, 128153) resident, transit and unknown (●) behavioural states highlighted behavioural states derived from the HSSSM are shown for each animal.
Diving behaviours
The 25 tagged whales made 206,772 dives, but 22 of recorded dives were removed as outliers because dive durations and depths were biologically improbable with durations exceeding 75 min and depths beyond 700 m. Consequently, 206,750 dives were included in the graphical and initial analyses. We were able to associate 73% (n=151,279) of the dives with resident behaviour, 36,379 (18%) with transit and 19,114 (9%) with an unknown behavioral state. Whales spent on average 5.71 hrs ( ± SD: 2.57) diving (all shapes) to depths of ≥8m on a daily basis with an average total of 25.4 ± 11.56 dives per day. Among resident associated dives (Figure 3), 66% (n=99,780) were square-shaped, 23% (n=34,852) U-shaped, 10% (n=15,662) were V-shaped, and 0.65% (n=985) were of unknown shape. Of all the square dives that occurred in association with resident behaviour, 17% (n=16,699) occurred in winter, 13% (n=13,311) in spring, 40% (n=39,705) in summer and 30% (n=30,065) in fall. However, our analysis did not account for surface foraging behaviour, which likely occurred during late spring/early summer when zooplankton often concentrate at the surface. During transit behaviour, the whales conducted 36,376 dives where 53% (n=19,280) were square-shaped, 32% (n=11,560) were U-shaped, 15% (n=5,335) were V-shaped and 0.6% (n=201) were of unknown shape.
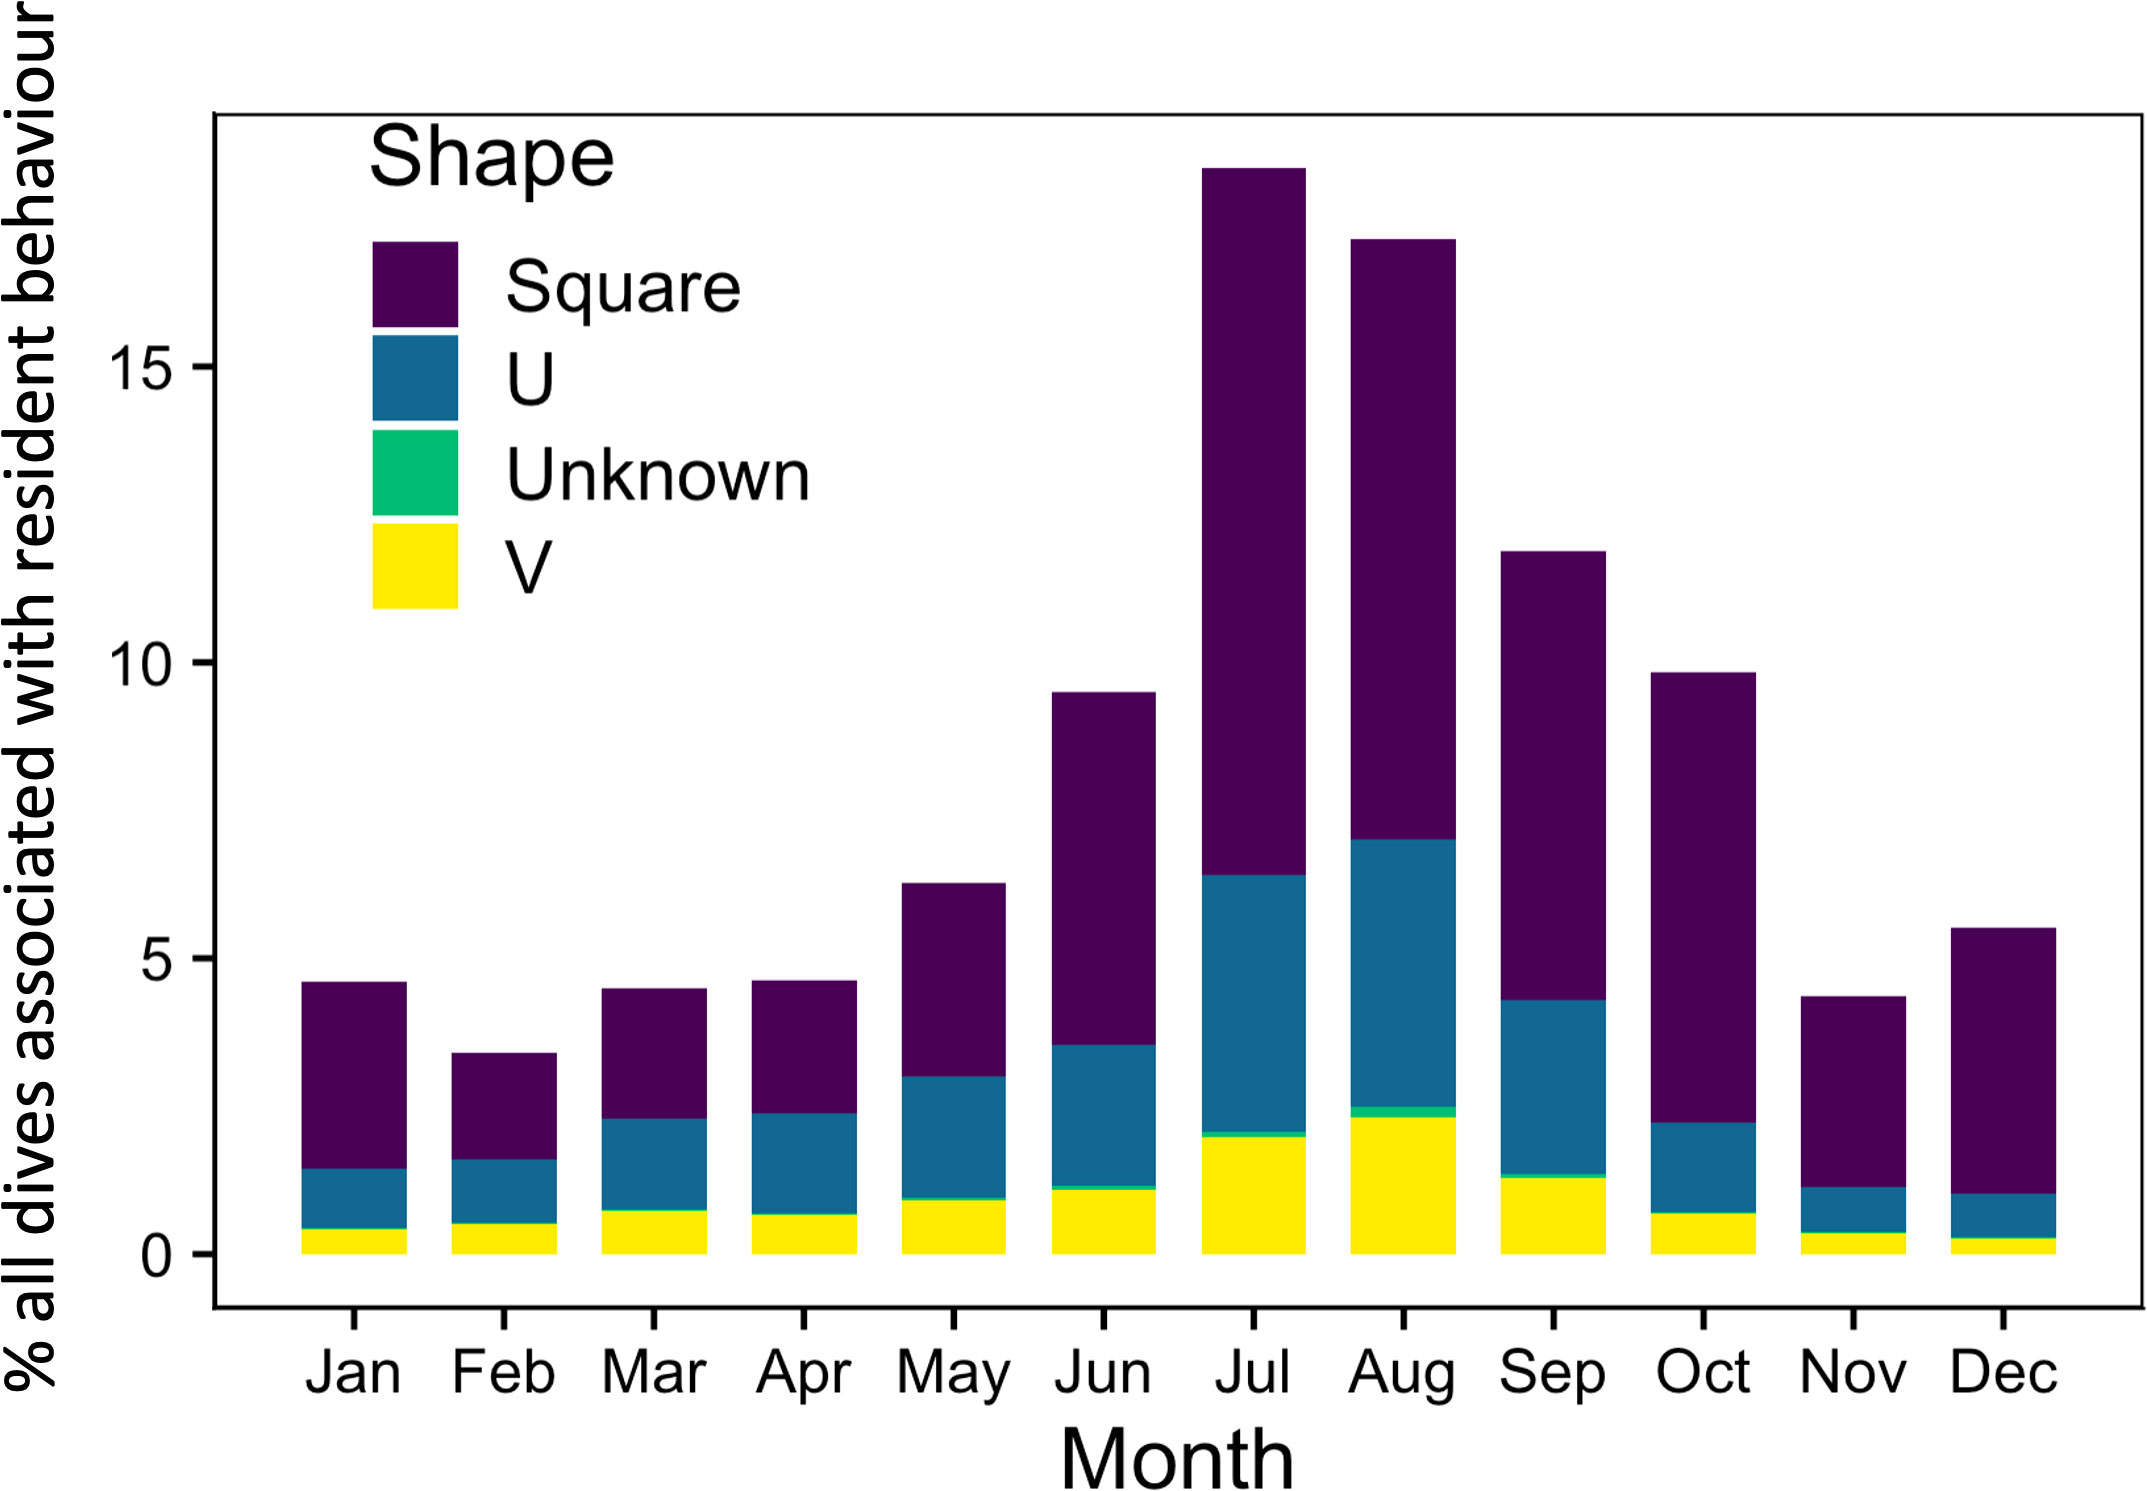
Figure 3 Percent of all bowhead whale dives (n=206,750) that occurred on the same day as a resident associated Argos location (predicted from the HSSSM) by season and dive shape. Data were pooled across individuals and years.
The maximum depth of square dives varied over time (Figure 4 top; Table S1), with the shallowest dives occurring during early summer (29.63 m ± 21.7 SD; July), progressively deeper and variable dives in fall (112.67 m ± 111.3; September), and a maximum in winter (242.37 m ± 80.3; December). Minimum dive duration similarly followed seasonal patterns with the shortest dives occurring during early summer (8.88 mins ± 4.2; July), becoming longer in fall (16.07 mins ± 8.7; September) and greatest in winter (24.84 mins ± 8.8; January) (Figure 4; bottom).
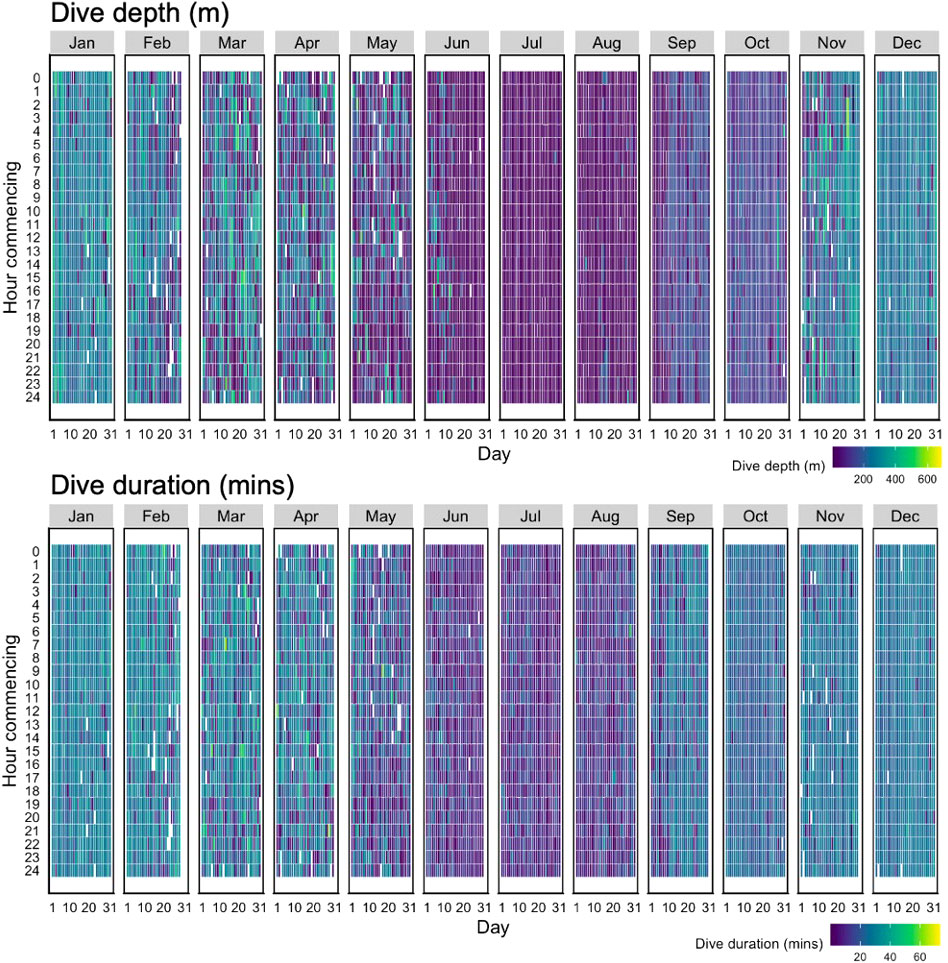
Figure 4 Heatmap of the maximum dive depth (m) (top) and minimum dive duration (mins) (bottom) of square-shaped dives (n=99,780) associated with resident behaviour for all bowhead whales (n=25) by time of day (Hour commencing) and day of the month (Day). Data are pooled across years (2012-2015) and include dives throughout their range (both inside and outside regions of interest).
Seasonal patterns in bathymetry
Of the 16,587 predicted HSSSM locations, we used 93.6% (n=15,532) of them to georeference bathymetric data and removed 6.4% (n=1,065) that occurred on land. In total, 14,995 bathymetric measurements were associated with predicted whale locations (Figure 5; Table 2). Of these predicted HSSSM locations, there were 124 instances (0.83% of locations; n=14,995) where a location associated with resident behaviour occurred on the same day as a transit location for a given whale. Although bathymetry was variable (223.5 m ± 164.01 SD) when all HSSSM locations were combined, tagged whales occupied consistently shallower areas during resident compared to unknown behaviour during summer (June-August; Table 2) and occasionally resided in shallower waters than while transiting (September bottom depth was 74 m during resident vs. 125 m while transit). A trend towards deeper waters was observed for unknown behaviours during the winter (February) and for all behavioural states during late spring (March and May) to early summer (June and July). Average depths utilized by bowhead whales were shallowest during fall (e.g., September; 74 m ± 64.87) and deepest during winter (e.g., January; 315 m ± 96.69) (Figure 5). However, resident behaviour occurred in areas with greatest variability in bottom depth during spring (e.g., May; 286 m ± 251.21), when foraging depths were shallow.
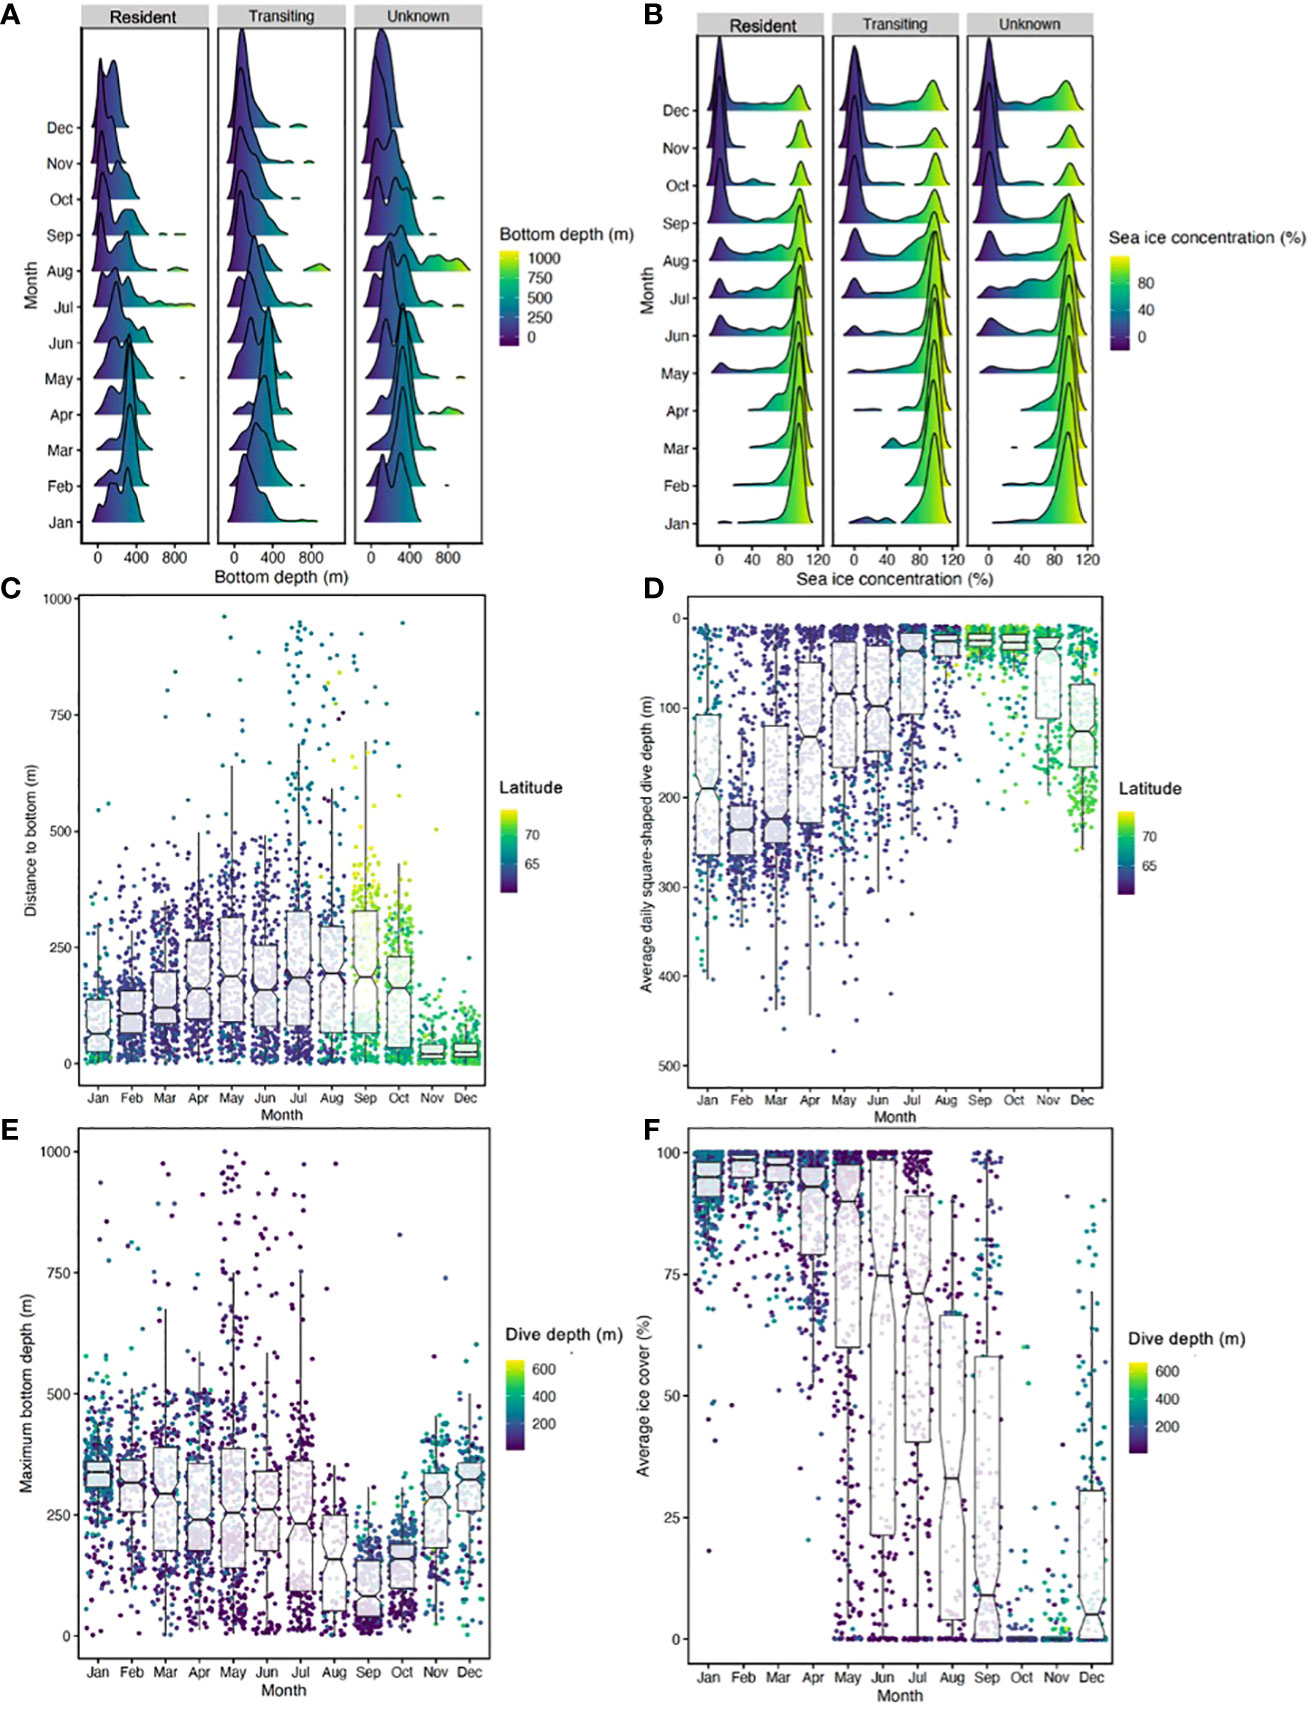
Figure 5 (A) Bathymetric (bottom depth) data associated with HSSSM predicted locations for all bowhead whales (n=25) by behavioural state and month. Shallow bathymetry is indicated by warm colours and deep bottom depths are denoted by cool colours. Due to location uncertainty, predicted locations occurring on land were removed as bathymetric data could not be determined for these positions. (B) Sea ice concentration associated with HSSSM predicted locations by behavioural state (resident, transit and unknown) and month where warm colours indicate low ice concentration and cool colours denote extensive coverage. (C) Boxplots reflect distance in metres between the average daily maximum depth of square-shaped dives and the mean daily bathymetry associated with resident locations. Scatter points reflect raw data and the colour gradient indicates corresponding latitudinal position. (D) Average daily square-shaped dive depth (putative foraging dive depth) per individual associated with resident locations. Raw data is represented by scatter points and colour coded by latitude whereby warm colours reflect putative foraging dive depth in low latitude regions and cool colors reflect high-latitude behaviours. (E) Maximum bottom depth (bathymetry) by month with the mean depth of square-shaped dives represented by scatter points such that warm colors indicate shallow dive depth and cool colors indicate deep depths. (F) Average percent sea ice cover by month with associated square-shaped dive depths displayed as a scatterplot. Boxplots include notches to indicate potential significant differences (when notches do not overlap) between months.
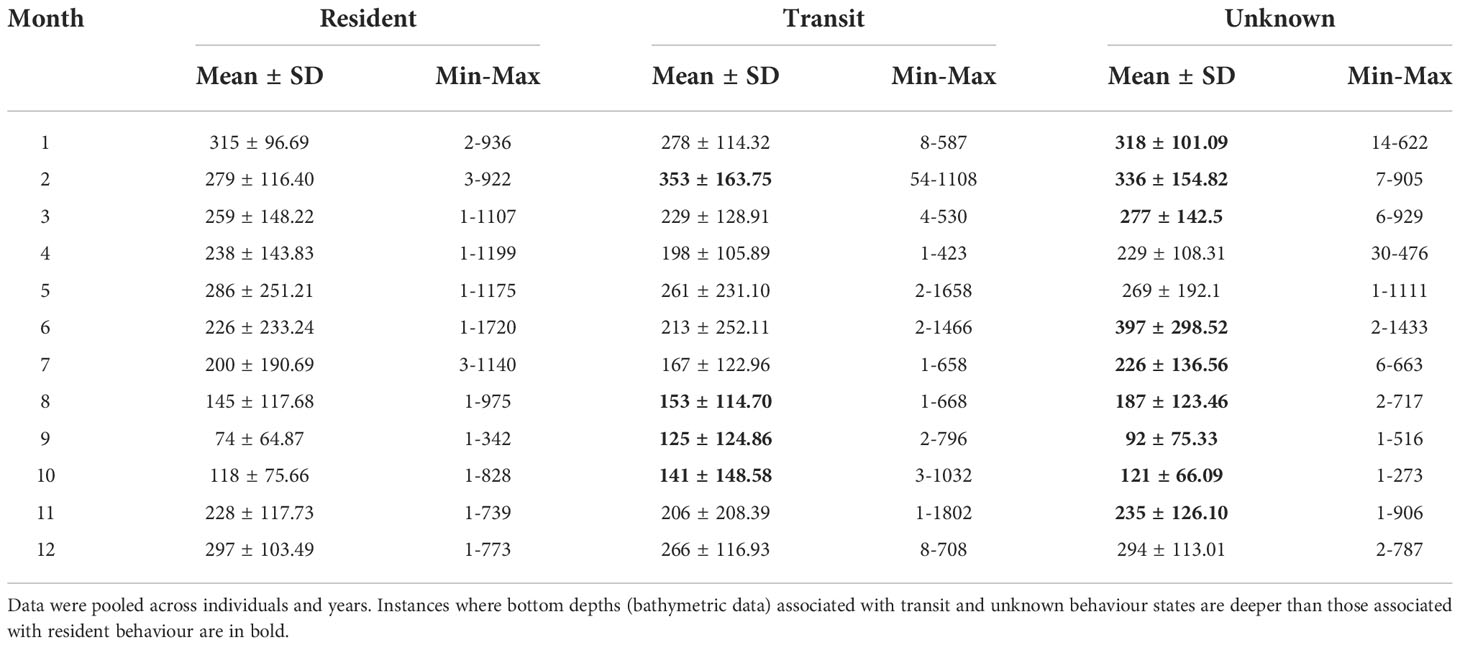
Table 2 Bathymetric data (m) associated with HSSSM predicted locations of bowhead whales by behavioural state (resident, transit and unknown) and month.
Sea ice concentration values were obtained for 90% (n=14,994) of all HSSSM predicted locations (Figure S1). This resulted in a total of 10,712 resident, 2,094 transit and 2,188 unknown locations having corresponding sea ice data. While animals engaged in resident movement, the average sea ice concentration across seasons was 69% ± 37.60 SD, less ice cover occurred during transit (61% ± 42.16) and unknown behavioural states (61% ± 41.43). Maximum percent ice cover occurred in March for resident (92% ± 12.52) and unknown (94% ± 10.09) locations—and in February for transit (94% ± 6.71) locations (Table 3).
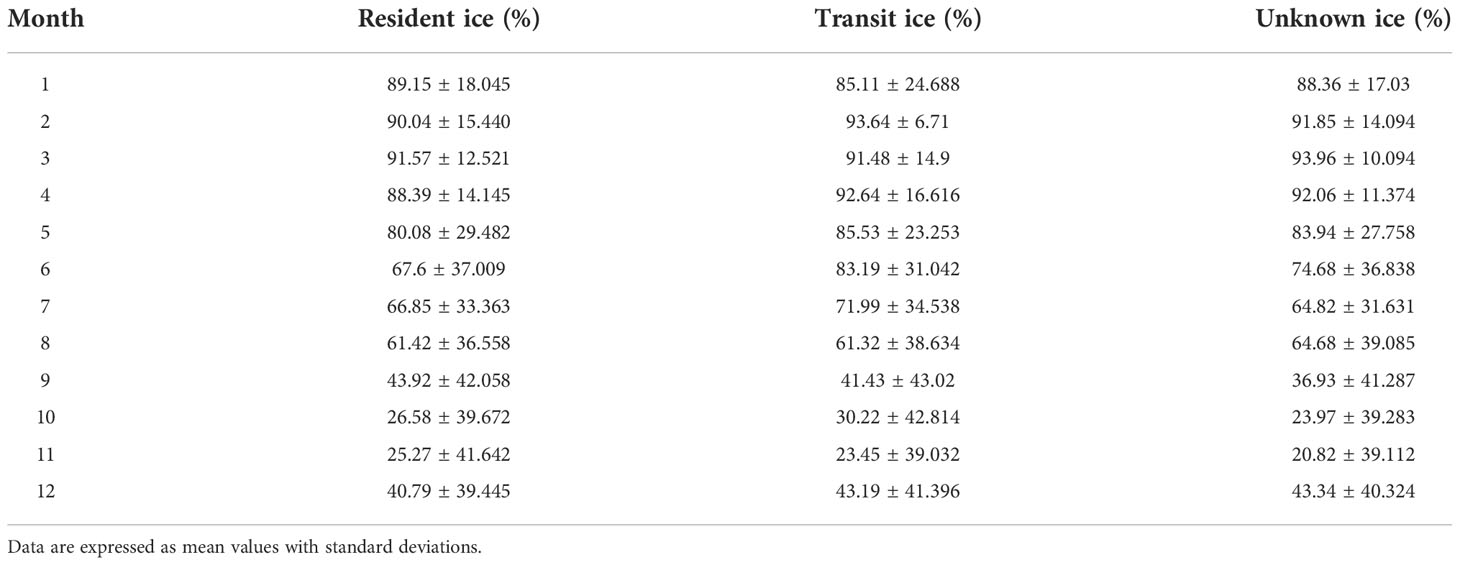
Table 3 Sea ice concentration (%) values by season associated with HSSSM predicted locations of bowhead whales by behavioural state averaged across individuals and years.
We statistically evaluated the impact of season, bathymetry, sea ice, sex and body length on putative foraging behaviour for 23 whales with complete datasets. We first found no interactions among factors (M19, full model versus M20 no interactions) for the distance to bottom response variable. However, we found fairly strong evidence of season and some evidence for percent sea ice cover effects on differences between the maximum depth of probable foraging dives (i.e., square-shaped dives) and bathymetry (i.e., sea bottom). For example, square-shape dive depth was shallowest in July (27 m ± 20.238 SD), and was considerably deeper in December (223.8 m ± 70.312 SD). The difference between the maximum depth of square-dives and the sea bottom was on average 204 m ± 171.677 in July and 119 m ± 80.626 SD in December (Table 3, S1; Figure 5). Seasonal patterns in sea ice conditions were also noted such that bowheads occupied areas of low ice cover in fall (49% ± 3.58 SD; November) and high concentrations in winter (93% ± 10.311 SD; January) (Table 3; Figure 5). Distance to bottom models treated these two factors as having impacts (Table S2A), with M16 having the lowest AIC (10360.85) suggesting it was the best model. No interactions among factors were found (M19 full model versus M20 no interactions, p=0.8614; Table S2B). Other than season and sea ice cover, we found little evidence of additional impacts of sex or body length on these distances (M16 versus M20, p=0.4918; Table S2B). In terms of impact trends, there was a slight curvilinear and upward trend of distance to bottom with sea ice cover (logarithm of distance was used in the model), with summer having the largest differences (i.e., more shallow dives), fall having the smallest differences (i.e., deepest dives), and summer and winter being similar (Table S2C and Figure S2).
For the fraction of water column (i.e., maximum depth of square-shaped dives relative to bathymetry), season showed the highest impact relative to the other models with only one factor (i.e., M2 versus M1, M3, and M12; Table S3). Furthermore, the model with just season showed the biggest drop in both sum of squared deviances and SSE relative to the null model (i.e., SSE of 358.93 and 263.86 for M0 (null) versus M2 (season), respectively, Table S3). Adding in other factors and interactions among factors resulted in only very modest drops [e.g., SSE of 263.86 and 261.33 for M2 (season) versus M19 (full model)]. This evidence indicates that season was the most important factor related to changes in the relative feeding dive depths. For example, fraction of the water column was 0.76% ± 0.209 SD in October showing close agreement to the maximum depth of putative foraging dives and the depth of the sea floor (Table 5 and Figure 5). However, during early summer, fraction of the water column was 0.22% ± 0.224 SD in July indicating a mismatch between diving behaviour and bathymetry (Table 5). Unlike distance to bottom, which represents the distance in metres between the maximum depth of square-shaped dives and the associated depth of the sea bottom, fraction of the water column is a scaled measure indicating relative agreement between bowhead dive behaviour and bathymetry.
Foraging time
Combining all square-shaped dives (n=6,029) that occurred in the six core-use regions we found evidence of putative foraging behaviour across seasons (Table 5). Estimated time spent foraging was lowest during spring (2.68 hrs ± 2.547 SD; May) when dive depth was shallow (52.67 m ± 81.972 SD) and greatest in fall (7.34 hrs ± 5.697 SD; October) when foraging depth was comparatively deeper (141.59 m ± 112.103 SD) (Figure 6). Year-round foraging behaviour (i.e., consistent occurrence of square-shaped dives) was observed in three regions—Cumberland Sound, Hudson Bay and Hudson Strait. Within season, daily foraging time was elevated in Gulf of Boothia/Prince Regent Inlet and Central East Baffin Coast compared to Cumberland Sound, Hudson Bay and Hudson Strait. Accounting for estimated median body length to infer age-class of tagged whales, we found that juveniles conducted a total of 2,410 dives, while sub-adults made 2,587 dives and adults dove 875 times across all seasons and years.
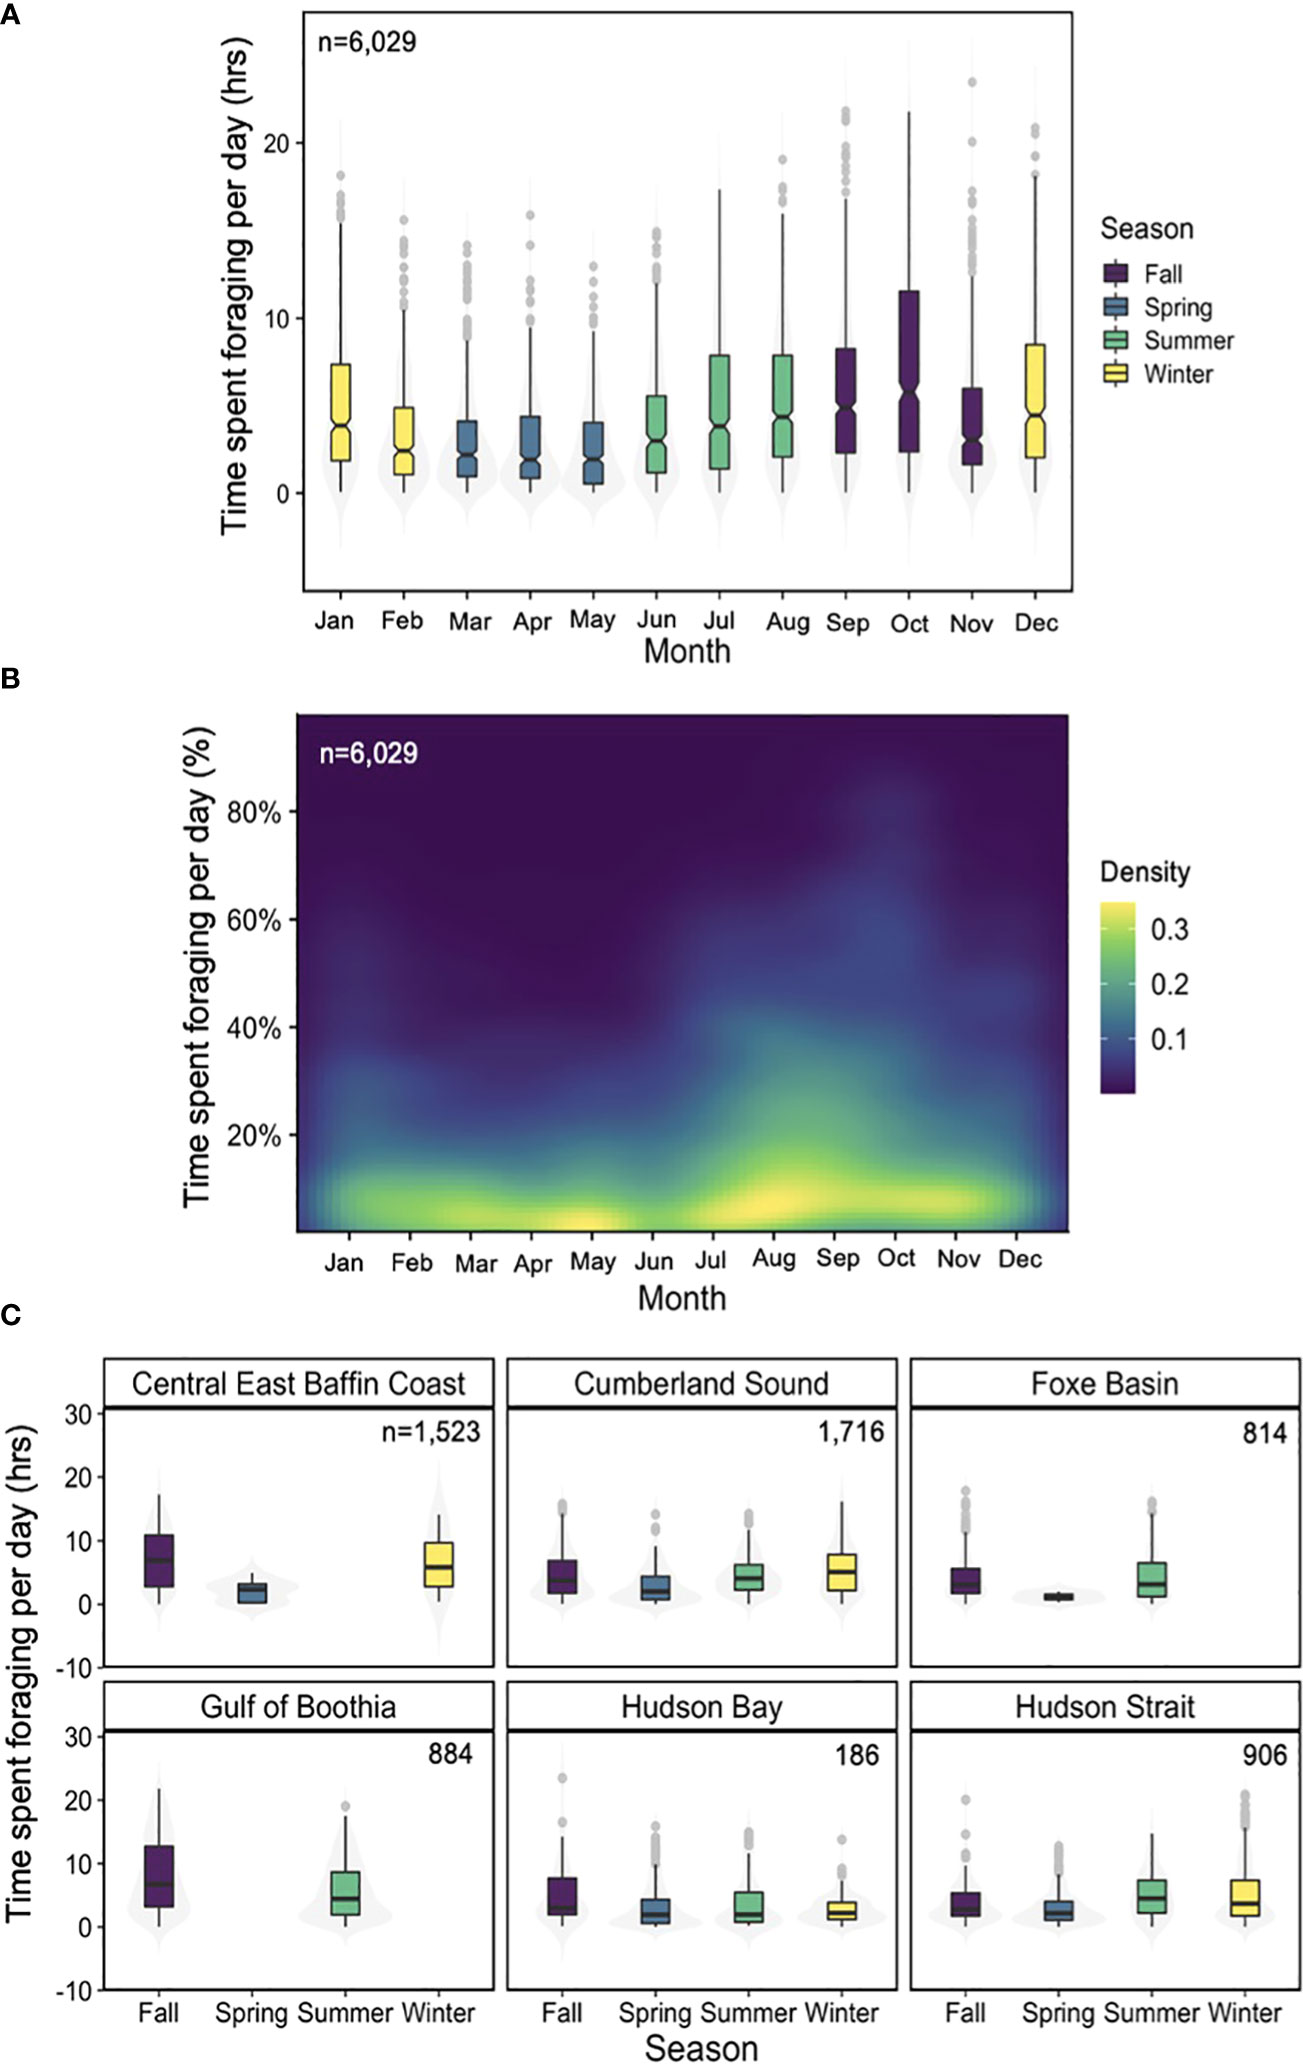
Figure 6 (A) Total time spent conducting putative foraging dives (square-shaped) daily by month with data pooled across individuals (n=25) and years (n=4). Data are colour coded based on season whereby purple = fall, blue = spring, green= summer and yellow= winter. (B) heatmap of the proportion of time (24hrs) spent foraging per day based on the total daily proportion of time spent conducting square-shaped dives. Data pooled across individuals and years. Cool colors (purple) indicate low density of data points and warm colors (yellow) represent comparatively high densities of data. (C) Total time spent conducting putative foraging dives by region and season with data pooled across individuals and years. Boxplots include notches to indicate potential significant differences (when notches do not overlap) between months (A) and seasons (B) and violin plots (grey shaded area) shows the data distribution.
Discussion
Summary of findings and limitations
Our analysis of multi-dimensional behaviour revealed that bowheads engage in putative foraging year-round that varies seasonally in depth, intensity (i.e., hours per day), and with sea ice cover (Figures 5, 6). Although evidence of peak foraging occurred during fall when a daily average of 7.3 hrs (Table 5) were allocated to putative foraging dives in October, feeding continued throughout the winter (e.g., 5.7 hrs in December; Table 5). Probable foraging dives to the sea bottom (Figure 5D) varied across seasons and sea ice conditions for distance to bottom (absolute measure of distance between probable foraging dive depth and depth of sea bottom) and across season only for fraction of the water column (relative measure of agreement between feeding depth and bathymetry). Accounting for the absolute distance to bottom (m) provides insight into whether whales were likely targeting diapausing Calanus spp. found near the seafloor (Kvile et al., 2019; Banas et al., 2021), whereas relative (fraction of water column) differences provided behavioural information about the general characteristics of the putative foraging dive. The strong support for seasonal impacts on foraging behaviour and proximity to the seafloor, along with the seasonal vertical ontogenetic migration of copepods in the Calanidae family (Madsen et al., 2001; Baumgartner and Tarrant, 2017), indicate that bowheads were mostly likely exploiting high-energy, diapausing life-stages during fall and winter and surface aggregations of feeding copepods during spring and summer (Madsen et al., 2001; Fortune et al., 2020b). This finding is consistent with the Bering-Chukchi-Beaufort bowhead population that exploit prey aggregations near the sea bottom during fall (Olnes et al., 2020). To a lesser extent, shallow epipelagic dives during early summer may have also reflected consumption of mysids, euphausiids and chaetognaths (Pomerleau et al., 2012).
Sea ice conditions varied seasonally along with feeding behaviour as whales selected areas where sea ice persisted during summer (61% cover in August; Table 4) and where some open water remained during winter (93% in January; Table 4). However, sea ice impacts were only detected for the model that accounted for the absolute differences (distances to sea bottom; Table S2) between putative foraging dive depth and the seafloor. No evidence of sea ice effects was observed for models that included relative differences (i.e., fraction of water column; Table S3). Selection for greater sea ice cover during the open-water summer season, may provide refuge (Ferguson et al., 2010) from mammal-eating killer whales that are known to predate on bowheads (Reinhart et al., 2013; Young et al., 2019; Matthews et al., 2020). The apparent preference for sea ice cover during early summer may also reflect initiation of the phytoplankton bloom and consumption of recently ascended late-life stages and early life-stages of copepods (Baumgartner and Tarrant, 2017; Sampei et al., 2021). Occupying areas with open water in winter likely provide bowhead whales with breathing access and reduce risk of entrapment for younger animals (Mitchell and Reeves, 1982; Ferguson et al., 2010). These findings are consistent with year-round foraging with autumn hyperphagia, suggesting that bowheads forage at depth widely throughout their range, but at low rates (hours per day) across the eastern Canadian Arctic.
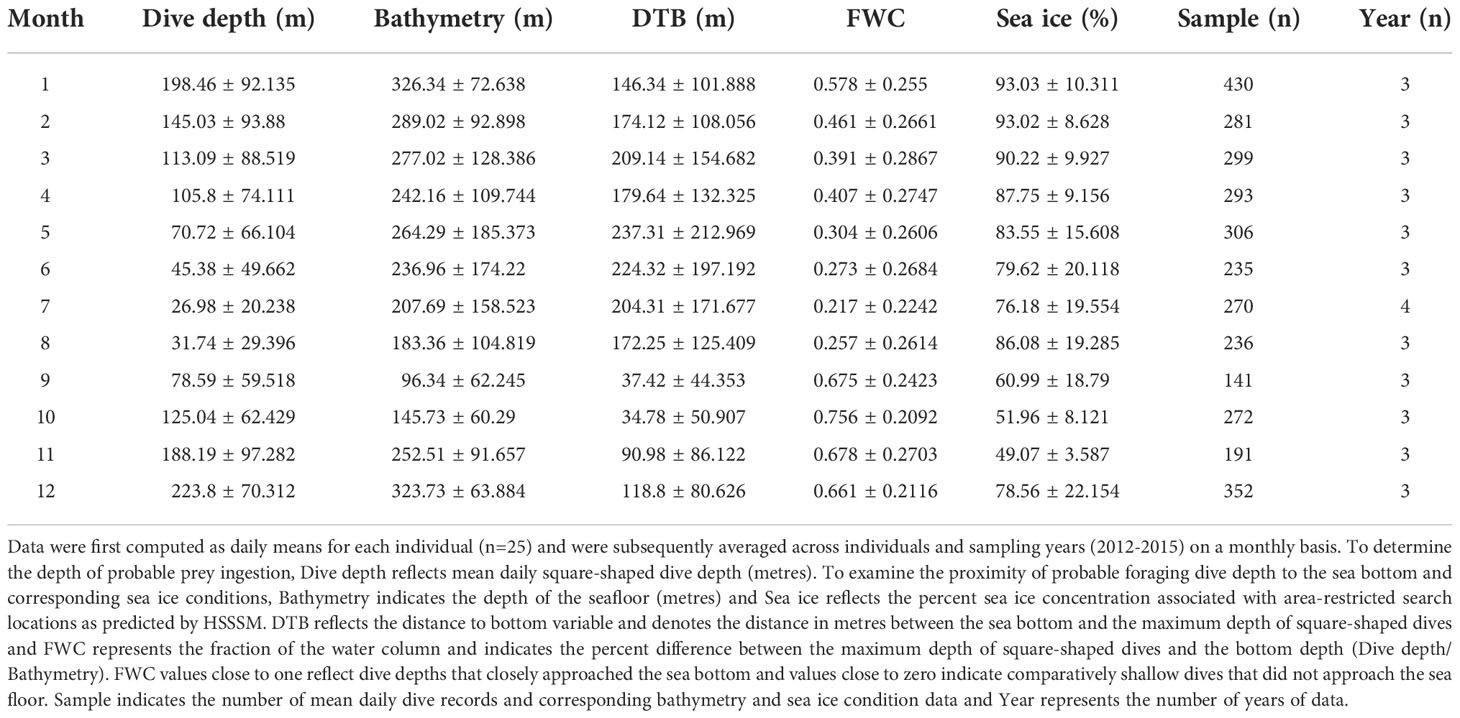
Table 4 Summary information on bowhead whale putative foraging behaviour with georeferenced environmental covariates.
Although previous studies in Cumberland Sound corroborated that square-shaped dives are a reliable indicator of feeding activity (Fortune et al., 2020a), similar co-located tagging and prey field sampling studies have not been conducted elsewhere in their range. Furthermore, since the quality and quantity of zooplankton prey are known to vary spatially and temporally, it is unlikely that feeding conditions will remain constant year-round. Consequently, net energy gain is expected to vary seasonally and regionally despite consistent foraging effort. To address these limitations, in-situ physical and biological oceanographic sampling need to be expanded near bowheads. Given the lack of spatio-temporal data about bowhead whale feeding conditions, we made inferences about prey quality based on the depth of putative foraging dives and the proximity to the sea bottom. However, with limited location information (two predicted HSSSM per day) our estimates of bathymetry are coarse. To obtain a long timeseries of movement data, the daily resolution of locations was sacrificed. In the future, medium duration tags with fast acquisition GPS and inertial sensors (e.g., accelerometers) may be used to increase the number of daily locations while improving location accuracy and permitting the quantification of prey ingestion time. Another consideration is that by considering probable foraging behaviour on days when whales displayed horizontal movement that was consistent with resident behaviour only, we excluded the possibility for intermittent foraging during transit. We also may have overestimated daily foraging time during winter when sea ice conditions preclude movement between regions and resident behaviour is expected to dominate. However, the overall impact of excluding sporadic feeding while migrating between areas is low given the relative sparseness of transient locations and because daily foraging time was calculated based on dive behaviour consistent with foraging (validated through field observations; Fortune et al., 2020a). Another consideration is that the 8 m depth threshold for summary dive data determined by Wildlife Computers, precluded the inclusion of surface or near surface feeding between 0 and 8 m. Consequently, it is possible that putative foraging time is underestimated during spring when copepods are expected to aggregate near the surface (Madsen et al., 2001).That said, summertime sampling near feeding whales in Cumberland Sound demonstrated that the mixed-layer depth was at 17 m on average and that the shallowest prey layer occurred between 30 and 40 m (Fortune et al., 2020a). Consequently, we don’t anticipate that the exclusion of shallow dives less than 8 m in depth resulted in underestimated feeding estimates during other times of year (summer, fall and winter). Furthermore, when including the time spent at the surface with the time spent diving (all shapes) to depths ≥8 m when displaying resident behaviour for a randomly selected whale (PTT 11495), we found that this accounted for a total of 20.49 hrs leaving only 3.5 hrs for dives shallower than 8 m on August 1, 2012. This suggests that our dive dataset is comprehensive, providing a complete picture of summary dive behaviour.
Climatic impacts on foraging conditions
There are numerous ways in which future oceanographic shifts can impact the foraging conditions of low-trophic, high-latitude species, such as bowhead whales. Most important, is the thinning and earlier breakup of sea ice (Notz and Stroeve, 2016; Stroeve et al., 2017), which has created new opportunities for phytoplankton blooms to occur below the sea ice. For example, in the Chukchi Sea increased light penetration through the no-longer snow-covered sea ice, is sufficient to support phytoplankton growth in the Arctic Ocean (Arrigo et al., 2012; Horvat et al., 2017). Given current trends of decreasing sea ice thickness across the Arctic, sub-ice phytoplankton are likely to continue increasing in occurrence and extent (Horvat et al., 2017). This will likely shift the timing and magnitude of net primary productivity (e.g., diatoms) needed to support the secondary production of herbivorous calanoid copepods (Swalethorp et al., 2011; Darnis and Fortier, 2014). Such shifts in environmental conditions are likely to impact the development, energy needs and recruitment of three dominant bowhead whale prey species—Calanus hyperboreus, C. glacialis (Arctic origin) and C. finmarchicus (temperate) (Scott et al., 2000; Niehoff et al., 2002; Falk-Petersen et al., 2009).
Faced with climatic shifts, smaller bodied, low-energy temperate species (C. finmarchicus) (Falk-Petersen et al., 2009) may have a competitive advantage over slower growing, larger and higher energy Arctic species (C. hyperboreus and C. glacialis). For example, earlier phytoplankton blooms and warmer water temperatures increase copepod growth rates and metabolic demand, potentially allowing C. finmarchicus to reach reproductive spawning stages of development faster than multi-year Arctic species as has been observed in subarctic waters (Weydmann et al., 2018). Consequently, temperate species may outcompete Arctic taxa because they are more capable of exploiting longer periods of food availability to support spawning (Swalethorp et al., 2011). Such shifts in community composition have begun to be documented in bowhead whale foraging areas (Disko Bay, Greenland) where C. finmarchicus and C. hyperboreus once represented equal proportions of copepod biomass (1990s), but where C. finmarchicus now dominates (Møller and Nielsen, 2020). Since late-stage copepodites of Arctic origin such as C. hyperboreus (1.03-1.81 mg lipid for overwintering stage five and adult female individuals) contain over 25 times as much stored lipid as similarly aged temperate species (C. finmarchicus contain 0.04-0.08 mg of lipid per individual stage five and adult female), the numerical abundance of lower energy prey must be sufficiently high to offset the energetic loss of lipid-rich Arctic species (Falk-Petersen et al., 2009).
Prey consumption differences
Understanding how prey field characteristics differ based on species composition is important for elucidating the energetic impacts of climate change to balaenids. In Cumberland Sound during summertime (August), bowheads dove to deeper depths (215 m ± 28.7 SD) and exploited lower densities of prey (285 orgs m-3 ± 175.4 SD) that consisted of a lower proportion of temperate species (7.4% C. finmarchicus) and higher proportions of Arctic taxa (26.1% C. glacialis and 18.2% C. hyperboreus; Fortune et al., 2020b). However, in previously occupied summertime feeding habitats in the lower Bay of Fundy and Scotian Shelf, right whales targeted dense near-bottom layers consisting almost exclusively of diapausing (stage five) life-stages of C. finmarchicus (Baumgartner and Mate, 2003; Davies et al., 2013; Baumgartner et al., 2017). On average, whales dove to 121 m (± 24.2 SD) encountering prey abundances of 7,481 (± 4, 581 SD) orgs per m-3 (Baumgartner and Mate, 2003). The higher abundances of prey encountered by right whales may help compensate for the comparatively lower energy value of available copepods, but it may also be necessary to offset their lower filtration rate. Right whales have a smaller mouth gape than bowhead whales and would need to feed on either higher abundances of prey or for longer times to obtain energy ingestion rates similar to bowheads (van der Hoop et al., 2019).
Seasonality in foraging behaviour and fasting
In the absence of foraging ecology studies with similarly high spatio-temporal resolution to our bowhead study, there remains much guesswork about the seasonal feeding activity of North Atlantic right whales. Currently, only a segment of the North Atlantic population resides on calving grounds where they are presumed to fast (Dombroski et al., 2021). Consequently, a portion of the right whale population is unaccounted for during winter months (Hayes et al., 2018; Charif et al., 2020). Although the time spent foraging per day is unknown for right whales on a monthly basis, movement of individuals between known foraging grounds (e.g., Cape Cod Bay, Massachusetts, USA) and presumed areas of fasting (southeastern US) occurs frequently based on photo-identified individuals. This suggests that even non-reproductive animals likely spend at least a portion of the winter fasting (Brown and Marx, 2000). However, high-resolution archival tags are designed to provide detailed dive data over a short period of time (≤24 hrs) and therefore yield an incomplete picture of daily feeding activities that preclude assessing seasonal shifts in foraging effort. Consequently, estimates of annual and even daily foraging effort must be extrapolated beyond the available data (e.g., Savoca et al., 2021). This contrasts with what long-term satellite telemetry and time-depth recorder data have revealed for both the eastern (Laidre and Heide-Jorgensen, 2012; Nielsen et al., 2015; Chambault et al., 2018; Fortune et al., 2020c) and western (Citta et al., 2015; Olnes et al., 2020; Citta et al., 2021) bowhead whale populations.
We found evidence of year-round foraging in three regions across the eastern Canadian Arctic—Cumberland Sound, Central East Baffin Coast and Hudson Strait. For example, whales spent an average of 5 hrs (± 4.2 SD) conducting putative foraging dives during winter in Hudson Strait (Table 4). Since different age-sex groups of bowhead whales occupy Hudson Strait during winter (Heide-Jørgensen et al., 2010; Higdon and Ferguson, 2010; Fortune et al., 2020c), it appears all demographic groups likely consume prey during winter, unlike North Atlantic right whales (Dombroski et al., 2021). Although juvenile males appear to allocate more time to feeding across seasons compared to females, this may be an artifact of an unbalanced sample size given that foraging effort for sub-adult males and females (equal sample sizes) shows close agreement, providing support of year-round foraging effort despite demography. Furthermore, wintertime feeding has been corroborated for the eastern population by longitudinal analysis of stable isotopes and mercury analysis from bowhead baleen (Matthews and Ferguson, 2015; Pomerleau et al., 2018). Behavioural evidence of year-round foraging has been detected for the western population in the Gulf of Anadyr in the Bering Sea, where whales conduct probable foraging dives to the seafloor where diapausing life-stages of copepods are anticipated to aggregate (Citta et al., 2015). Year-round feeding was also inferred for the EC-WG population based on dive frequency data analysis from satellite-telemetry tags with time-depth recorders (Nielsen et al., 2015).
Seasonal differences in prey availability
Ultimately, the divergent life-history characteristics of bowhead and right whale prey may drive observed differences in foraging ecology. Calanus hyperboreus has a multi-year life cycle with a life span ranging from 3-4 years, allowing organisms to accumulate stored energy in the form of lipids. They also overwinter several years in a row before molting into an adult and spawning. In addition, adult females are likely multiannual-iteroparous and thus able to spawn in consecutive years (Hirche, 1997, 2013). Consequently, the suspected availability of high-quality prey throughout the year may be sufficient to support the energetic needs of bowhead whales despite their comparatively low daily feeding rates (hours per day). This is supported by our observations of deep putative foraging dives near the sea bottom during winter. Conversely, Calanus finmarchicus typically has a one-year (or less) life-cycle (Conversi et al., 2001; Swalethorp et al., 2011) and is comprised of nauplii and early copepodite stages after winter spawning that are small, low in lipids, and potentially poorly filtered by right whale baleen (assuming dead-end filtration; Mayo et al., 2001). In the absence of late-stage C. finmarchicus (Baumgartner et al., 2007; Baumgartner et al., 2017), right whales consume a diverse diet of lower energy taxa such as Centropages spp. and Pseudocalanus spp. in mid-winter to early spring (DeLorenzo Costa et al., 2006a, 2006b; Parks et al., 2011). In the absence of an energetically rich, year-round food resource, right whales may require seasonally higher feeding rates to allow for the accumulation of stored energy (blubber) to survive the period when C. finmarchicus is unavailable to them and to support the high costs of reproduction (Miller et al., 2011; Moore et al., 2021).
Differences in whale feeding activity
Should the density of temperate prey (C. finmarchicus) be insufficient to compensate for the loss of energy-rich Arctic taxa, balaenid whales may adjust their activity budgets to allocate more time to feeding. Such a behavioural shift presumes that animals would not be feeding at maximum rates under present environmental conditions. Based on short-term, fine-scale biologging studies, right whales forage for 40% (1.85 hrs ± 1.255 SD; Baumgartner and Mate, 2003) and > 42% (7.16 hrs ± 4.275 SD; van der Hoop et al., 2019) of the total time they were studied during the summer in the Bay of Fundy, Nova Scotia, Canada. However, long-term tagging (>24 hrs) and co-located prey sampling in the Bay of Fundy and Scotian Shelf found that right whales spent on average 15.07 hrs per day (12-22 hrs per day) feeding during summer (Goodyear, 1996). Foraging behavior was determined based on the presence of long and deep dives (134 m on average) to depths that coincided with maximum calanoid copepod biomass—96% of which were C. finmarchicus (Goodyear, 1996). Conversely, during the same time of year (August), we found that bowheads allocated considerably less time on average to feeding with only 5.23 hrs (± 3.84 SD) spent making probable foraging dives. Although bowheads spent apparently less time each day feeding sub-surface than right whales, there was considerable variation in foraging time (i.e., some individuals fed for as little as 1.44 hrs and others as much as 10.52 hrs per day on average in August; Table 5). Such variability suggests bowheads alternated between days of high and low foraging effort. The full extent of right whale foraging and the potential for similar shifts in time-budgets between days remains poorly understood, leaving an incomplete understanding of species-specific foraging strategies under present environmental conditions.
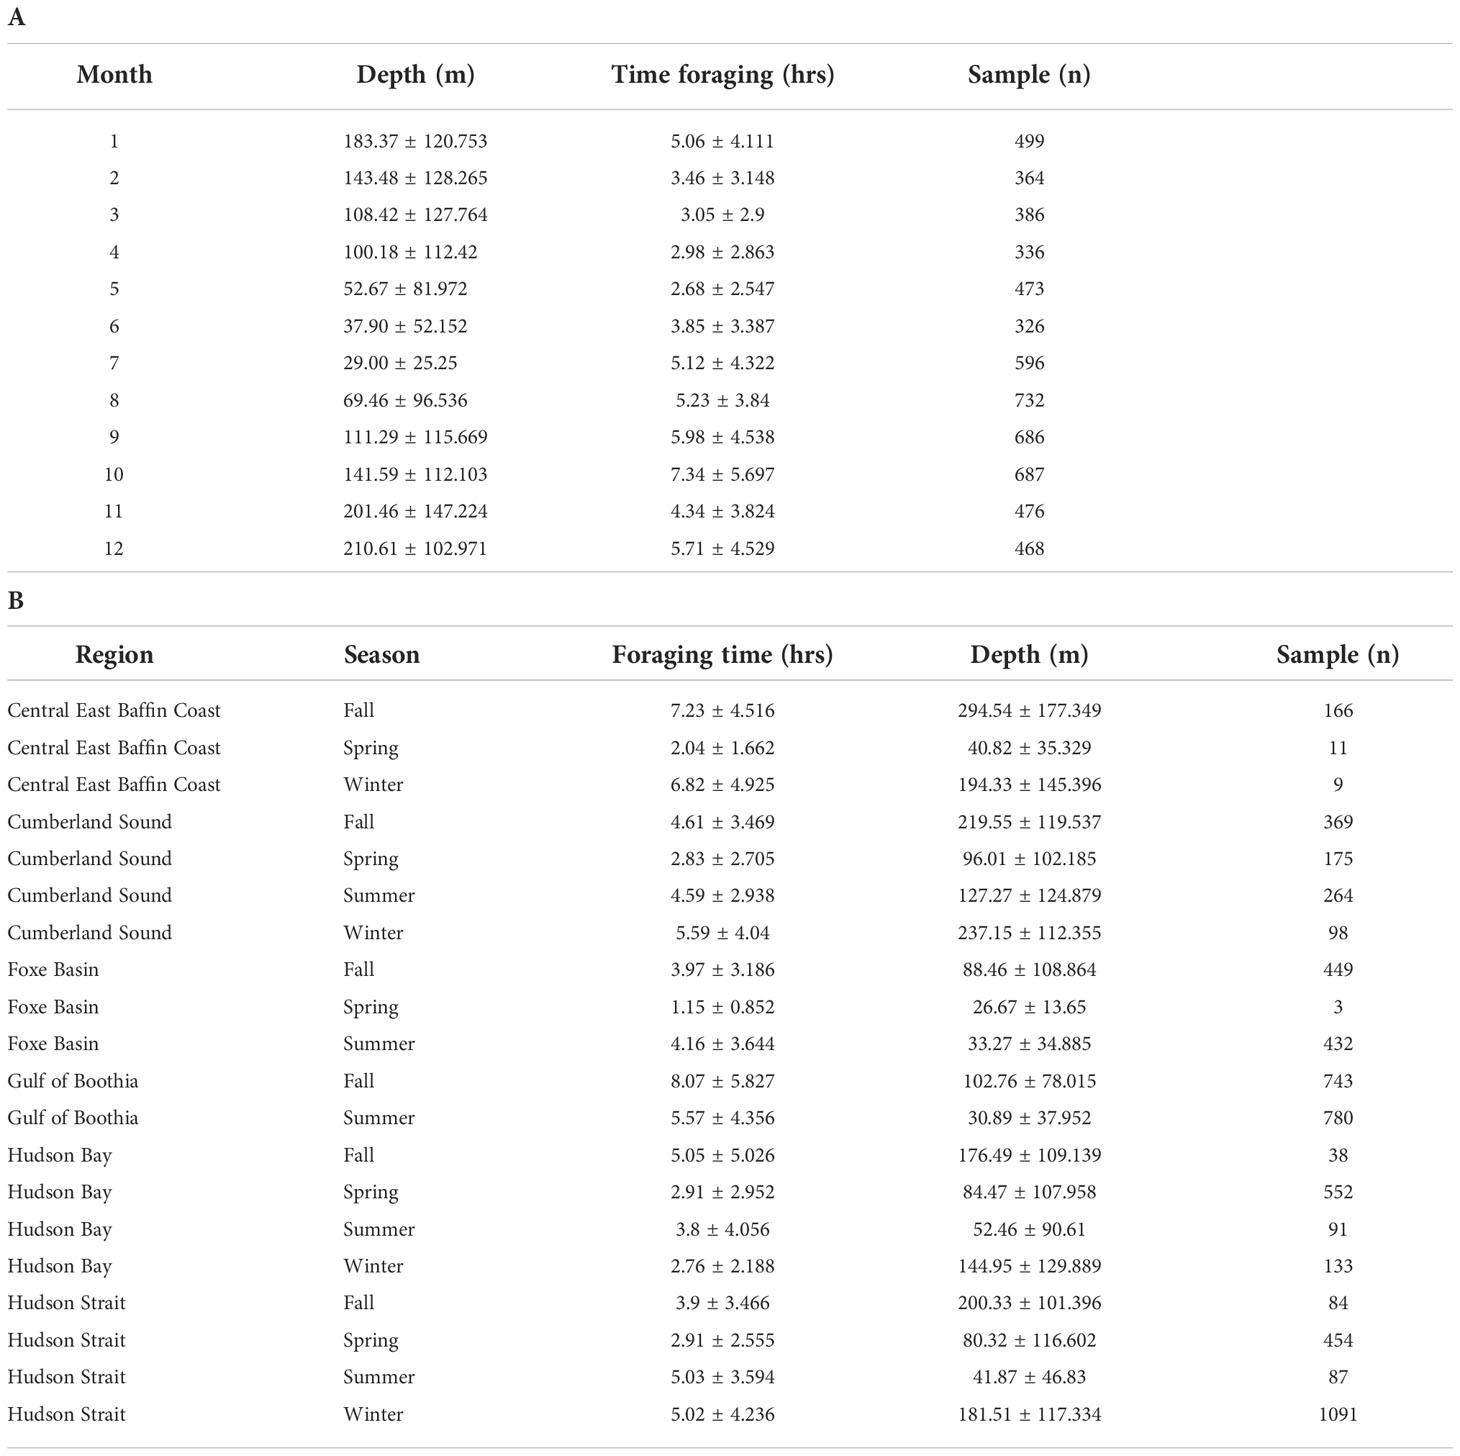
Table 5 Summary information about the Depth (m) of probable foraging of bowhead whales based on the maximum depth and minimum duration [Time foraging (hrs)] of square-shaped dives (Sample n=6,029) by A: month with data pooled across individuals and years and B: region and season. Data are expressed as mean ± SD.
There are several possible explanations for why bowheads and right whales show dissimilar foraging behaviour. Evidence of bowhead year-round feeding indicates a degree of behavioural flexibility, whereby individuals respond to seasonal variation in prey availability. This suggests that bowheads may have a comparative advantage over right whales when it comes to climate change since at least a portion of the declining right whale population fasts during winter (Dombroski et al., 2021). Similar observations have been made in other mammalian species—including Endangered African penguins (Spheniscus demersus) that employ a flexible foraging acquisition strategy based on shifts in prey abundance (Campbell et al., 2019). Furthermore, increased foraging effort in endangered Galapagos sea lions (Zalophus wollebaeki) is believed to reflect limited availability of resources throughout the year compared to the increasing California sea lion (Zalophus californianus) (Villegas-Amtmann et al., 2011). Consequently, the comparatively higher foraging effort of right whales during summer may reflect poor feeding opportunities during other times of year. However, low and variable foraging effort that shifts across latitudinal gradients as whales migrate north to high-latitude foraging grounds during the open-water season, and return south in fall as sea ice reforms (Ferguson et al., 2010; Fortune et al., 2020c), along with evidence of reduced abundances and energetic density of prey, suggests that bowheads may encounter sub-optimal feeding conditions. Bowheads may then need to allocate time to foraging activities throughout the year to offset lower daily energetic gains. Reconciling these observed differences in feeding activity require seasonal observations of right whale dive behaviour on daily time scales as it is unknown how much time individuals allocate to feeding activities during other times of year.
Sensitivity to climate change
Biogeographical shifts through dispersal may be an important mechanism to mitigate adverse impacts from declines in foraging conditions caused by borealization. This may be particularly crucial for polar species as marine ecosystems are experiencing pronounced shifts in response to climate change (Moore and Huntington, 2008; Tulloch et al., 2019; Huntington et al., 2020). For example, 16.9 km per decade shifts to high-latitude regions have been observed across many terrestrial species (Chen et al., 2011). Consequently, the timing of bowhead whale migration, along with their distribution and residency patterns, particularly during open water season, are likely to change overtime (Chambault et al., 2022).
Understanding where and to what extent suitable foraging habitat occurs throughout their range under present environmental conditions can provide insight into the sensitivity of a species to climatic shifts, whereby small geographic ranges result in higher extinction probability (Purvis et al., 2000). For example, Pacific bluefin tuna (Thunnus orientalis) employ flexible migration patterns that help compensate for energetic costs incurred from both climate change and variability in thermal oceanographic conditions (Carroll et al., 2021). Our analysis revealed that bowheads forage widely throughout the eastern Canadian Arctic, supporting earlier reports of probable foraging in nine regions across the eastern Arctic (Disko Bay, Clyde Inlet, Isabella Bay, Broughton Island, Cumberland Sound, Frobisher Bay and northern Foxe Basin) (Nielsen et al., 2015; Fortune et al., 2020c). Utilizing dive behaviour data to infer putative foraging dives (square-shaped) for times when horizontal behaviour was consistent with resident behaviour or area-restricted movement allowed us to quantify foraging time over long timescales (>365 days), revealing that whales foraged extensively below 8 m throughout their range and across seasons. This suggests that there is considerable suitable habitat that supports bowhead foraging under present environmental conditions.
The potential for biogeographical shifts in bowhead distribution and habitat-use during the open water season (e.g., Gulf of Boothia/Prince Regent Inlet and Admiralty Inlet) may help buffer reductions in prey quality that are more likely to occur in the southern portion of their range first. However, to what extent the carrying capacity of high-latitude ecosystems will be able to support a greater population of whales is unknown. Furthermore, population models suggest that the EC-WG bowhead whale population rebounded following commercial exploitation by whaling in the early 1900s more slowly than would be predicted based on demographic expectations (Ferguson et al., 2021). Delayed recovery may indicate that the marine ecosystem was degraded from over exploitation and the population will be unable to recover to pre-exploitation stock sizes or pristine carrying capacity (Savoca et al., 2021). This would suggest that in addition to future shifts in foraging conditions, population growth may be limited despite their apparently flexible foraging behaviour. Assessment of habitat suitability in the high-latitude ecosystems requires: 1) long-term monitoring of the two-dimensional (horizontal and vertical) distribution, abundance, and composition of prey relative to physical conditions across seasons; 2) knowledge of the demographic composition (age, sex and reproductive status) and abundance of whales currently occupying the area; and 3) detailed diet analysis from in-situ prey sampling near feeding whales equipped with biologgers, DNA metabarcoding of scats and stomach content analysis from harvested animals.
Conclusions
Our study provides important insight into the spatio-temporal foraging strategy of bowhead whales in the eastern Canadian Arctic relative to bathymetry and sea ice conditions. With strong evidence of year-round feeding and comparatively low foraging effort across seasons and regions, we suggest that bowheads may be less sensitive to climate-induced shifts in prey compared to North Atlantic right whales, and that there is capacity for both behavioural adjustment (e.g., increased time-spent foraging) and dispersal (northward shift in distribution) to help offset shifts in prey quality and quantity overtime. However, a lack of detailed information about the characteristics of prey consumed by bowheads across regions and seasons precludes us from quantifying spatio-temporal variability in prey consumption. Since calanoid copepods have a life-history that varies seasonally (Falk-Petersen et al., 2009; Jung-Madsen et al., 2013; Weydmann et al., 2018) with lipid content increasing from eggs (spring) to diapausing and adult life-stages (fall), feeding conditions are not expected to be static over time. Consequently, understanding to what degree low-trophic species are likely to incur energetic costs and their ability to counterbalance such deficits through behavioural changes or dispersal requires the simultaneous collection of foraging behaviour data using inertial sensing biologgers (equipped with three-dimensional accelerometers, magnetometers and gyroscopes) and associated physical and biological oceanographic conditions.
Another confounding issue with which bowheads will have to contend as sea ice extent and thickness continues to decline over time is increased pressure from mammal-eating killer whales (Reinhart et al., 2013; Young et al., 2019; Matthews et al., 2020). Given the importance of sea ice during summer foraging, and the potential physical protection this provides from killer whale predation, decreased availability of sea ice in the future may adversely impact foraging effort as whales may need to travel greater distances to access sea ice while foregoing feeding opportunities. However, the degree to which future populations will exhibit reduced feeding opportunities due to predator avoidance or decreased juvenile survival are unknown. With continued sea ice loss and the opening of the Northwest Passage (Heide-Jorgensen et al., 2012; Kochanowicz et al., 2021), new opportunities have emerged for industrial activities through commercial fisheries, shipping, and oil and gas exploration in the Arctic. Although such expansion in human activity presents new economic opportunities, endemic species such as bowhead whales are likely to face new challenges through acoustic disturbance (vessel noise, sonar and seismic operations) (Robertson et al., 2013; Gulas et al., 2017; Halliday et al., 2020) as well as elevated risk of fishing-gear entanglement and vessel strikes (Citta et al., 2014; McWhinnie et al., 2018).
Data availability statement
The original contributions presented in the study are included in the article/Supplementary Material. Further inquiries can be directed to the corresponding author.
Ethics statement
This study was reviewed and approved by the Fisheries and Oceans Canada Freshwater Institute Animal Care Committee (AUP# FWI-ACC-2013 and 2013) and under Fisheries and Oceans Canada License to Fish for Scientific Purposes #S-12/13-1024-NU and S-13/14-1009-NU.
Author contributions
Conceptualization: SMEF, SHF. Methodology: SMEF, VL, SHF, VL. Investigation: SMEF, VL. Visualization: SMEF. Funding acquisition: SHF, SMEF. Project administration: SMEF. Supervision: SMEF, SHF, VL, MB, AT. Writing – original draft: SMEF SHF, VL, MB, AT. Writing – review and editing: SMEF, SHF, VL, MB, AT. All authors contributed to the article and approved the submitted version.
Funding
Funding for this research was provided to SHF through Fisheries and Oceans Canada, Nunavut Wildlife Research Trust Fund, Nunavut General Monitoring Program, Ocean Tracking Network, University of Manitoba, ArcticNet and to SMEF through the Weston Family Awards in Northern Research Postdoctoral (PDF) Level Awards.
Acknowledgments
Bowhead whale tagging was approved by DFO Freshwater Institute Animal Care Committee (AUP # FWI 2012 and 2013) and DFO License to Fish for Scientific Purposes #S-12/13-1024-NU, S-13/14-1009-NU. We are most appreciative of the support provided by our project partners, Levi Qaunaq and Natalino Piugattak from Igloolik, and Noah Ishulutaq and Timeosie Akpalialuk from Pangnirtung for vessel operations and Bernard LeBlanc for tagging and biopsy collection. We are grateful for the invaluable logistical support provided by the Igloolik and the Pangnirtung Hunters and Trappers Organization.
Conflict of interest
The authors declare that the research was conducted in the absence of any commercial or financial relationships that could be construed as a potential conflict of interest.
Publisher’s note
All claims expressed in this article are solely those of the authors and do not necessarily represent those of their affiliated organizations, or those of the publisher, the editors and the reviewers. Any product that may be evaluated in this article, or claim that may be made by its manufacturer, is not guaranteed or endorsed by the publisher.
Supplementary material
The Supplementary Material for this article can be found online at: https://www.frontiersin.org/articles/10.3389/fmars.2022.853525/full#supplementary-material
References
Armengol L., Calbet A., Franchy G., Rodriguez-Santos A., Hernandez-Leon S. (2019b). Planktonic food web structure and trophic transfer efficiency along a productivity gradient in the tropical and subtropical Atlantic ocean. Sci. Rep. 2019 9, 1–19. doi: 10.1038/s41598-019-38507-9
Arrigo K. R., Perovich D. K., Pickart R. S., Brown Z. W., Van Dijken G. L., Lowry K. E., et al. (20121408). Massive phytoplankton blooms under arctic sea ice. Science 336. doi: 10.1126/SCIENCE.1215065/SUPPL_FILE/PAP.PDF
Banas N. S., Møller E. F., Laidre K. L., Simon M., Ellingsen I. H., Nielsen T. G. (2021). Reconciling behavioural, bioenergetic, and oceanographic views of bowhead whale predation on overwintering copepods at an Arctic hotspot (Disko bay, Greenland). Front. Mar. Sci. 0. doi: 10.3389/FMARS.2021.614582
Baumgartner M. F., Mate B. R. (2003). Summertime foraging ecology of north Atlantic right whales. Mar. Ecol. Prog. Ser. 264, 123–135. doi: 10.3354/meps264123
Baumgartner M. F., Mayo C. A., Kenney R. D. (2007). “Enormous carnivores, microscopic food, and a restaurant that’s hard to find,” in The urban whale: North Atlantic right whales at the crossroads. Eds. Kraus S. D., Rolland R. M. (Cambridge, Massachusetts, USA: Harvard Univeristy Press), 138–171.
Baumgartner M. F., Tarrant A. M. (2017). The physiology and ecology of diapause in marine copepods. Ann. Rev. Mar. Sci. 9, 387–411. doi: 10.1146/annurev-marine-010816-060505
Baumgartner M. F., Wenzel F. W., Lysiak N. S. J., Patrician M. R. (2017). North Atlantic right whale foraging ecology and its role in human-caused mortality. Mar. Ecol. Prog. Ser. 581, 165–181. doi: 10.3354/meps12315
Baumgartner M. F., Tarrant A. M. (2017). The physiology and ecology of diapause in marine copepods. Ann. Rev. Mar. Sci. 9, 387–411. doi: 10.1146/annurev-marine-010816-060505
Beever E. A., Hall L. E., Varner J., Loosen A. E., Dunham J. B., Gahl M. K., et al. (2017). Behavioral flexibility as a mechanism for coping with climate change. Front. Ecol. Environ. 15, 299–308. doi: 10.1002/FEE.1502
Beissinger S. R. (2000). Ecological mechanisms of extinction. Proc. Natl. Acad. Sci. U. S. A. 97, 11688. doi: 10.1073/PNAS.97.22.11688
Bengtson Nash S. M., Castrillon J., Eisenmann P., Fry B., Shuker J. D., Cropp R. A., et al. (2018). Signals from the south; humpback whales carry messages of Antarctic sea-ice ecosystem variability. Glob. Change Biol. 24, 1500–1510. doi: 10.1111/GCB.14035
Brown M. W., Marx M.K. (2000). Surveillance, monitoring and management of north Atlantic right whales, eubalaena glacialis, in cape cod bay, Massachusetts: January to mid- maFinal report. Division Mar. Fisheries Boston Massachusetts.
Buchholz R., Banusiewicz J. D., Burgess S., Crocker-Buta S., Eveland L., Fuller L. (2019). Behavioural research priorities for the study of animal response to climate change. Anim. Behav. 150, 127–137. doi: 10.1016/J.ANBEHAV.2019.02.005
Burkhardt-Holm P., N’Guyen A. (2019). Ingestion of microplastics by fish and other prey organisms of cetaceans, exemplified for two large baleen whale species. Mar. pollut. Bull. 144, 224–234. doi: 10.1016/J.MARPOLBUL.2019.04.068
Byrne M. E., Chamberlain M. J. (2012). Using first-passage time to link behaviour and habitat in foraging paths of a terrestrial predator, the racoon. Anim. Behav. 84, 593–601. doi: 10.1016/j.anbehav.2012.06.012
Cahill A. E., Aiello-Lammens M. E., Fisher-Reid M. C., Hua X., Karanewsky C. J., Ryu H. Y., et al. (2013). How does climate change cause extinction? Proc. R. Soc B Biol. Sci. 280. doi: 10.1098/RSPB.2012.1890
Campbell K. J., Steinfurth A., Underhill L. G., Coetzee J. C., Dyer B. M., Ludynia K., et al. (2019). Local forage fish abundance influences foraging effort and offspring condition in an endangered marine predator. J. Appl. Ecol. 56, 1751–1760. doi: 10.1111/1365-2664.13409
Carroll G., Brodie S., Whitlock R., Ganong J., Bograd S. J., Hazen E., et al. (2021). Flexible use of a dynamic energy landscape buffers a marine predator against extreme climate variability. Proc. R. Soc B 288. doi: 10.1098/RSPB.2021.0671
Chambault P., Albertsen C. M., Patterson T. A., Hansen R. G., Tervo O., Laidre K. L., et al. (2018). Sea Surface temperature predicts the movements of an Arctic cetacean: The bowhead whale. Sci. Rep. 8, 9658. doi: 10.1038/s41598-018-27966-1
Chambault P., Kovacs K. M., Lydersen C., Shpak O., Teilmann J., Albertsen C. M., et al. (2022). Future seasonal changes in habitat for Arctic whales during predicted ocean warming. Sci. Adv. 8, 2422. doi: 10.1126/SCIADV.ABN2422
Charif R. A., Shiu Y., Muirhead C. A., Clark C. W., Parks S. E., Rice A. N. (2020). Phenological changes in north Atlantic right whale habitat use in Massachusetts bay. Glob.Chang. Biol. 26, 734–745. doi: 10.1111/GCB.14867
Chen I. C., Hill J. K., Ohlemuller R., Roy D. B., Thomas C. D. (2011). Rapid range shifts of species associated with high levels of climate warming. Sci. (80). 333, 1024–1026. doi: 10.1126/SCIENCE.1206432/SUPPL_FILE/CHEN.SOM.PDF
Citta J. J., Burns J. J., Quakenbush L. T., Vanek V., George J. C., Small R. J., et al. (2014). Potential for bowhead whale entanglement in cod and crab pot gear in the Bering Sea. Mar. Mammal Sci. 30, 445–459. doi: 10.1111/mms.12047
Citta J. J., Olnes J., Okkonen S. R., Quakenbush L., George J. C., Maslowski W., et al. (2021). Influence of oceanography on bowhead whale (Balaena mysticetus) foraging in the chukchi Sea as inferred from animal-borne instrumentation. Cont. Shelf. Res. 224, 104434. doi: 10.1016/J.CSR.2021.104434
Citta J. J., Quakenbush L. T., Okkonen S. R., Druckenmiller M. L., Maslowski W., Clement-Kinney J., et al. (2015). Ecological characteristics of core-use areas used by Bering–Chukchi–Beaufort (BCB) bowhead whales 2006–2012. Prog. Oceanogr. 136, 201–222. doi: 10.1016/J.POCEAN.2014.08.012
Conversi A., Piontkovski S., Hameed S. (2001). Seasonal and interannual dynamics of Calanus finmarchicus in the gulf of Maine (northeastern US shelf) with reference to the north Atlantic oscillation. Deep. Res. II 48, 519–530.
Czapanskiy M. F., Savoca M. S., Gough W. T., Segre P. S., Wisniewska D. M., Cade D. E., et al. (2021). Modelling short-term energetic costs of sonar disturbance to cetaceans using highresolution foraging data. J. Appl. Ecol. 58, 1643–1657. doi: 10.1111/1365-2664.13903
Damgaard C. F., Irvine K. M. (2019). Using the beta distribution to analyse plant cover data. J. Ecol. 107, 2747–2759. doi: 10.1111/1365-2745.13200
Darnis G., Fortier L. (2014). Temperature, food and the seasonal vertical migration of key arctic copepods in the thermally stratified amundsen gulf (Beaufort Sea, Arctic ocean) GE. J. Plankton Res. 36, 1092–1108. doi: 10.1093/plankt/fbu035
Davies K. T. A., Ross T., Taggart C. T. (2013). Tidal and subtidal currents affect deep aggregations of right whale prey, Calanus spp., along a shelf-basin margin. Mar. Ecol. Prog. Ser. 479, 263–282. doi: 10.3354/meps10189
Development Team, Q. (2018). QGIS geographic information system. open source (Geospatial Foundation).
DeLorenzo Costa A., Durbin E. G., Mayo C. A., Lyman E. G. (2006a). Variability in the nutritional value of the major copepods in Cape Cod Bay (Massachusetts, USA) with Implications for right whales. Mar. Ecol. Prog. Ser. 27, 109–123. doi: 10.1111/j.1439-0485.2006.00087.x.
DeLorenzo Costa A., Durbin E. G., Mayo C. A., Lyman E. G. (2006b). Environmental factors affecting zooplankton in cape cod bay: implications for right whale dynamics. Mar. Ecol. Prog. Ser. 323, 281–298.
Dombroski J. R., Parks S. E., Nowacek D. P. (2021). Dive behavior of north Atlantic right whales on the calving ground in the southeast USA: implications for conservation. Endanger. Species Res. 46, 35–48.
Ershova E. A., Kosobokova K. N., Banas N. S., Ellingsen I., Niehoff B., Hildebrandt N., et al. (2021). Sea Ice decline drives biogeographical shifts of key Calanus species in the central Arctic ocean. Glob. Change Biol. 27, 2128–2143. doi: 10.1111/GCB.15562
Falk-Petersen S., Mayzaud P., Kattner G., Sargent J. R. (2009) Lipids and life strategy of Arctic Calanus. Mar. Biol. Res. 5, 18–39. doi: 10.1080/17451000802512267
Fauchald P., Tveraa T. (2003). Using first-passage time in the analysis of area-restricted search and habitat selection. Ecology 84, 282–288. doi: 10.1890/0012-9658(2003)084[0282:UFPTIT]2.0.CO;2
Ferguson S. H., Higdon J. W., Hall P. A., Hansen R. G., Doniol-Valcroze T. (2021). Developing a precautionary management approach for the Eastern Canada-West Greenland population of bowhead whales (Balaena mysticetus). Front. Mar. Sci., 1278. doi: 10.3389/FMARS.2021.709989
Ferguson S. H., Dueck L., Loseto L. L., Luque S. P. (2010). Bowhead whale Balaena mysticetus seasonal selection of sea ice. Mar. Ecol. Prog. Ser. 411, 285–297. doi: 10.3354/meps08652
Ferrari S. L. P., Cribari-Neto F. (2010). Beta regression for modelling rates and proportions. J. Appl. Stat. 31, 799–815. doi: 10.1080/0266476042000214501
Foote A. D., Kaschner K., Schultze S. E., Garilao C., Ho S. Y. W., Post K., et al. (2013). Ancient DNA reveals that bowhead whale lineages survived late pleistocene climate change and habitat shifts. Nat. Commun. 4, 1–7. doi: 10.1038/ncomms2714
Fortune S. M. E., Ferguson S. H., Trites A. W., Hudson J. M., Baumgartner M. F. (2020a). Bowhead whales use two foraging strategies in response to fine-scale differences in zooplankton vertical distribution. Sci. Rep. 10, 20249. doi: 10.1038/s41598-020-76071-9
Fortune S. M. E., Ferguson S. H., Trites A. W., Leblanc B., Lemay V., Hudson J. M., et al. (2020b). Seasonal diving and foraging behaviour of eastern Canada-west Greenland bowhead whales. Mar. Ecol. Prog. Ser. 643, 197–217. doi: 10.3354/MEPS13356
Fortune S. M. E., Young B. G., Ferguson S. H. (2020c). Age and sex-specific movement, behaviour and habitat use patterns of bowhead whales in the Eastern Canadian Arctic. Polar Biol. 43, 1725–1744. doi: 10.1007/s00300-020-02739-7
Fortune S. M. E., Koski W. R., Higdon J. W., Trites A. W., Baumgartner M. F., Ferguson S. H. (2017). Evidence of molting and the function of “rock-nosing” behavior in bowhead whales in the eastern Canadian Arctic. PloS One 12, 1–15. doi: 10.1371/journal.pone.0186156
Gavrilchuk K., Lesage V., Fortune S. M. E., Trites A. W., Plourde S. (2021). Foraging habitat of north Atlantic right whales has declined in the gulf of st. Lawrence, Canada, and may be insufficient for successful reproduction. Endanger. Species Res. 44, 113–136. doi: 10.3354/ESR01097
George J. C., Horstmann L., Fortune S., Sformo T. L., Elsner R., Follmann E. (2021). “Chapter 16 - thermoregulation and energetics,” in The bowhead whale balaena mysticetus: Biology and human interactions. Eds. George J. C., Thewissen J. G. M. B. T.-T. B. W. (Academic Press), 237–260. doi: 10.1016/B978-0-12-818969-6.00016-9
Goldbogen J. A., Cade D. E., Calambokidis J., Friedlaender A. S., Potvin J., Segre P. S., et al. (2017). How baleen whales feed: The biomechanics of engulfment and filtration. Ann. Rev. Mar. Sci. 9, 367–386. doi: 10.1146/annurev-marine-122414-033905
Goldbogen J. A., Hazen E. L., Friedlaender A. S., Calambokidis J., DeRuiter S. L., Stimpert A. K., et al. (2015). Prey density and distribution drive the three-dimensional foraging strategies of the largest filter feeder. Funct. Ecol. 29, 951–961. doi: 10.1111/1365-2435.12395
Goodyear J. D. (1996). “Significance of feeding habitats of north Atlantic right whales based on studies of diel behaviour, diving, food ingestion rates, and prey,” in PhD Dissertation(Guelph University).
Gulas S., Downton M., D’Souza K., Hayden K., Walker T. R. (2017). Declining Arctic ocean oil and gas developments: Opportunities to improve governance and environmental pollution control. Mar. Policy 105, 177–179. doi: 10.1016/j.marpol.2016.10.014
Halliday W. D., Pine M. K., Insley S. J. (2020). Underwater noise and Arctic marine mammals: Review and policy recommendations Environmental Reviews 28, 438–448. doi: 10.1139/ER-2019-0033
Haskell D. G. (1997). Experiments and a model examining learning in the area-restricted search behavior of ferrets (Mustela putorius furo). Behav. Ecol. 8, 448–455. doi: 10.1093/beheco/8.4.448
Hayes S. A., Josephson E., Maze-Foley K., Rosel P. E., Byrd B., Chavez-Rosales S., et al. (2018). US Atlantic And gulf of Mexico marine mammal stock assessments – 2017. NOAA Tech. Memorandum NMFS NE-245, 1–371.
Heide-Jorgensen M. P., Laidre K. L., Nielsen N. H., Hansen R. G., Rostad A., Rostad A. (2013). Winter and spring diving behavior of bowhead whales relative to prey. Anim. Biotelemetry 1, 1–15. doi: 10.1186/2050-3385-1-15
Heide-Jørgensen M. P., Laidre K. L., Wiig O., Postma L., Dueck L., Bachmann L. (2010). Large Scale sexual segregation of bowhead whales. Endang. Species Res. 13, 73–78. doi: 10.3354/esr00315
Heide-Jorgensen M. P., Laidre K. L., Quakenbush L. T., Citta J. J. (2012). The Northwest passage opens for bowhead whales. Biol. Lett. 8, 270–273. doi: 10.1098/rsbl.2011.0731
Higdon J. W., Ferguson S. H. (2010). “Past, present, and future for bowhead whales (Balaena mysticetus) in Northwest Hudson bay,” in A little less Arctic: top predators in the world’s largest northern inland sea, Hudson bay. Eds. Ferguson S. H., Loseto L. L., Mallory M. L. (Dordrecht: Springer Netherlands), 159–177. doi: 10.1007/978-90-481-9121-5_8
Hill S., Burrows M. T., Hughes R. N. (2000). Increased turning per unit distance as an arearestricted search mechanism in a pause-travel predator, juvenile plaice, foraging for buried bivalves. J. Fish Biol. 56, 1497–1508. doi: 10.1006/jfbi.2000.1278
Hirche H. J. (1997). Life cycle of the copepod Calanus hyperboreus in the Greenland Sea. Mar. Biol. 1997 1284 128, 607–618. doi: 10.1007/S002270050127
Hirche H. J. (2013). Long-term experiments on lifespan, reproductive activity and timing of reproduction in the Arctic copepod Calanus hyperboreus. Mar. Biol. 160, 2469–2481. doi: 10.1007/s00227-013-2242-4
Horvat C., Jones D. R., Iams S., Schroeder D., Flocco D., Feltham D. (2017). The frequency and extent of sub-ice phytoplankton blooms in the Arctic ocean. Sci. Adv. 3. doi: 10.1126/SCIADV.1601191/SUPPL_FILE/1601191_SM.PDF
Huntington H. P., Danielson S. L., Wiese F. K., Baker M., Boveng P., Citta J. J., et al. (2020). Evidence suggests potential transformation of the pacific Arctic ecosystem is underway. Nat. Clim. Change 2020 104 10, 342–348. doi: 10.1038/s41558-020-0695-2
Jakubas D., Wojczulanis-Jakubas K., Iliszko L. M., Strøm H., Stempniewicz L. (2017). Habitat foraging niche of a high Arctic zooplanktivorous seabird in a changing environment. Sci. Rep. 7, 1–14. doi: 10.1038/s41598-017-16589-7
Jenouvrier S., Desprez M., Fay R., Barbraud C., Weimerskirch H., Delord K., et al. (2018). Climate change and functional traits affect population dynamics of a long-lived seabird. J. Anim. Ecol. 87, 906–920. doi: 10.1111/1365-2656.12827
Jonsen I. D., Basson M., Bestley S., Bravington M. V., Patterson T. A., Pedersen M. W., et al. (2013). State-space models for bio-loggers: A methodological road map. Deep. Res. Part II Top. Stud. Oceanogr., 88–89. doi: 10.1016/j.dsr2.2012.07.008
Jonsen I. D., Flemming J. M., Myers R. A. (2005). Robust state-space modeling of animal movement data. Ecology 86, 2874–2880. doi: 10.1890/04-1852
Jonsen I. D., Myers R. A., James M. C. (2007). Identifying leatherback turtle foraging behaviour from satellite telemetry using a switching state-space model. Mar. Ecol. Prog. Ser. 337, 255–264. doi: 10.3354/meps337255
Jung-Madsen S., Nielsen T. G., Gronkjar P., Hansen B. W., Moller E. F. (2013). Early development of Calanus hyperboreus nauplii: Response to a changing ocean. Limnol. Oceanogr. 58, 2109–2121. doi: 10.4319/lo.2013.58.6.2109
Kochanowicz Z., Dawson J., Halliday W. D., Sawada M., Copland L., Carter N. A., et al. (2021). Using western science and Inuit knowledge to model ship-source noise exposure for cetaceans (marine mammals) in tallurutiup imanga (Lancaster sound), Nunavut, Canada. Mar. Policy 130, 104557. doi: 10.1016/J.MARPOL.2021.104557
Kvile K. Ø., Ashjian C., Ji R. (2019). Pan-arctic depth distribution of diapausing calanus copepods. Biol. Bull. 237, 76–89. doi: 10.1086/704694
Kraus S. D., Hatch J. J. (2001). Mating strategies in the north Atlantic right whale (Eubalaena glacialis). J. Cetacean Resour. Manage. (Special Issue) 2, 237–244.
Laidre K. L., Heide-Jorgensen M. P. (2012). Spring partitioning of disko bay, West Greenland, by Arctic and subarctic baleen whales. ICES J. Mar. Sci. 69, 1226–1233. doi: 10.1093/icesjms/fss095
Laidre K. L., Heide-Jorgensen M. P., Nielsen T. G., Gissel Nielsen T. (2007). Role of the bowhead whale as a predator in West Greenland. Mar. Ecol. Prog. Ser. 346, 285–297. doi: 10.3354/meps06995
Lowther A. D., Lydersen C., Fedak M. A., Lovell P., Kovacs K. M. (2015). The argos-CLS kalman filter: Error structures and state-space modelling relative to fastloc GPS data. PloS One 10, e0124754. doi: 10.1371/journal.pone.0124754
Madsen S. D., Nielsen T. G., Hansen B. W. (2001). Annual population development and production by Calanus finmarchicus, C. glacialis and C. hyperboreus in disko bay, western Greenland. Mar. Biol. 139, 75–93. doi: 10.1007/s002270100552
Matthews C. J. D., Breed G. A., LeBlanc B., Ferguson S. H. (2020). And Ferguson, sKiller whale presence drives bowhead whale selection for sea ice in Arctic seascapes of fear. Proc. Natl. Acad. Sci. U. S. A. 117, 6590–6598. doi: 10.1073/pnas.1911761117
Matthews C. J. D., Ferguson S. H. (2015). Seasonal foraging behaviour of Eastern Canada-West Greenland bowhead whales: An assessment of isotopic cycles along baleen. Mar. Ecol. Prog. Ser. 522, 269–286.
Mayo C. A., Letcher B. H., Scott S. (2001). Zooplankton filtering efficiency of the baleen of a north Atlantic right whale, Eubalaena glacialis. J. Cetacean Res. Manage. (Special Issue) 2, 225–229.
Mayo C. A., Marx M. K. (1990). Surface foraging behaviour of the north Atlantic right whale, Eubalaena glacialis, and associated zooplankton characteristics. Can. J. Zool. 68, 2214–2220.
McWhinnie L. H., Halliday W. D., Insley S. J., Hilliard C., Canessa R. R. (2018). Vessel traffic in the Canadian Arctic: Management solutions for minimizing impacts on whales in a changing northern region. Ocean Coast. Manage. 160, 1–17. doi: 10.1016/J.OCECOAMAN.2018.03.042
Meyer-Gutbrod E. L., Greene C. H. (2018). Uncertain recovery of the North Atlantic right whale in a changing ocean. Glob. Chang. Biol. 24, 455–464.
Miller C. A., Reeb D., Best P. B., Knowlton A. R., Brown M. W., Moore M. J., et al (2011). Blubber thickness in right whales Eubalaena glacialis and Eubalaena australis related with reproduction, life history status and prey abundance. Mar. Ecol. Prog. Ser. 438, 267–283. doi: 10.3354/meps09174
Mitchell E. D., Reeves R. R. (1982). Factors affecting abundance of bowhead whales Balaena mysticetus in the eastern arctic of north america, 1950-1980. Biol. Conserv. 22, 59–78. doi: 10.1016/0006-3207(82)90097-0
Moller E. F., Nielsen T. G. (2020). Borealization of Arctic zooplankton–smaller and less fat zooplankton species in disko bay, Western Greenland. Limnol. Oceanogr. 65, 1175–1188. doi: 10.1002/lno.11380
Moore S., Huntington H. (2008). Arctic Marine mammals and climate change: impacts and resilience. Ecol. Appl. 18, 157–165. doi: 10.1890/06-0571.1
Moore M. J., Rowles T. K., Fauquier D. A., Baker J. D., Biedron I., Durban J. W., et al. (2011). Assessing north Atlantic right whale health: Threats, and development of tools critical for conservation of the species. Photo J. Durban Holly Fearnbach Dis. Aquat. Org. Dis. Aquat Org 143, 205–226. doi: 10.3354/dao03578
Niehoff B., Madsen S. D., Hansen B. W., Nielsen T. G. (2002). Reproductive cycles of three dominant Calanus species in disko bay, West Greenland. Mar. Biol. 140, 567–576. doi: 10.1007/s00227-001-0731-3
Nielsen N. H., Laidre K., Larsen R. S., Heide-Jorgensen M. P., Heide-Jørgensen M. P. (2015). Identification of potential foraging areas for bowhead whales in Baffin bay and adjacent waters. Arctic 68, 169–179. doi: 10.14430/arctic4488
Notz D., Stroeve J. (2016). Observed Arctic sea-ice loss directly follows anthropogenic CO2 emission. Sci. (80). 354, 747–750. doi: 10.1126/science.aag2345
Olnes J., Citta J. J., Quakenbush L. T., George J. C., Harwood L. A., Lea E. V., et al. (2020). Use of the alaskan beaufort sea by bowhead whales (Balaena mysticetus) tagged with satellite transmitters 2006–18. Arctic 73, 278–291. doi: 10.14430/ARCTIC70865
Pacifici M., Foden W. B., Visconti P., Watson J. E. M., Butchart S. H. M., Kovacs K. M., et al. (2015). Assessing species vulnerability to climate change. Nat. Clim. Change 2015 53 5, 215–224. doi: 10.1038/nclimate2448
Parks S. E., Warren J. D., Stamieszkin K., Mayo C. A., Wiley D. (2011). Dangerous dining: Surface foraging of north Atlantic right whales increases risk of vessel collisions. Biol. Lett. 8. doi: 10.1098/rsbl.2011.057810.1098/rsbl.2011.0578
Pinheiro J. C., Bates D.M. (2000). “Linear mixed-effects models,” in Mixed-effects models in s and s-plus (New York, NY: Springer-Verlag), 1–56. doi: 10.1198/tech.2001.s574
Pomerleau C., Matthews C. J. D., Gobeil C., Stern G. A., Ferguson S. H., Macdonald R. W. (2018). Mercury and stable isotope cycles in baleen plates are consistent with year-round feeding in two bowhead whale (Balaena mysticetus) populations. Polar Biol. 41, 1881–1893. doi: 10.1007/s00300-018-2329-y
Pomerleau C., Lesage V., Ferguson S. H., Winkler G., Petersen S. D., Higdon J. W. (2012). Prey assemblage isotopic variability as a tool for assessing diet and the spatial distribution of bowhead whale Balaena mysticetus foraging in the Canadian eastern Arctic. Mar. Ecol. Prog. Ser. 469, 161–174. doi: 10.3354/meps10004
Pomerleau C., Patterson T., Luque S., Lesage V., Heide-Jørgensen M., Dueck L., et al. (2011). Bowhead whale (Balaena mysticetus) diving and movement patterns in the eastern Canadian Arctic: Implications for foraging ecology. Endanger. Species Res. 15, 167–177. doi: 10.3354/esr00373
Purvis A., Gittleman J. L., Cowlishaw G., Mace G. M. (2000). Predicting extinction risk in declining species. Proc. R. Soc London. Ser. B Biol. Sci. 267, 1947–1952. doi: 10.1098/RSPB.2000.1234
R Core Team. R: A Language and Environment for Statistical Computing. R Found. Stat. Comput. (Vienna, Austria) (2020). doi: 10.1038/sj.hdy.6800737
Refsnider J. M., Janzen F. J. (2012). Behavioural plasticity may compensate for climate change in a long-lived reptile with temperature-dependent sex determination. Biol. Conserv. 152, 90–95. doi: 10.1016/J.BIOCON.2012.03.019
Reeves R., Mitchell E., Mansfield A., McLaughlin M. (1983). Distribution and migration of the bowhead whale, Balaena mysticetus, in the Eastern north American arctic. 1983 36, 60. doi: 10.14430/arctic2243
Reinhart N. R., Ferguson S. H., Koski W. R., Higdon J. W., LeBlanc B., Tervo O., et al. (2013). Occurrence of killer whale Orcinus orca rake marks on Eastern Canada-West Greenland bowhead whales Balaena mysticetus. Polar Biol. 36, 1133–1146. doi: 10.1007/s00300-013- 1335-3
Renaud P. E., Daase M., Banas N. S., Gabrielsen T. M., Soreide J. E., Varpe O., et al. (2018). Pelagic food-webs in a changing Arctic: A trait-based perspective suggests a mode of resilience. ICES J. Mar. Sci. 75, 1871–1881. doi: 10.1093/ICESJMS/FSY063
Richardson W. J., Finley K. J., Miller G. W., Davis R. A., Koski W. R. (1995). Feeding, social and migration behavior of bowhead whales, Balaena mysticetus, in Baffin bay vs. the Beaufort Sea - regions with different amounts of human activity. Mar. Mamal Sci. 11, 1–45. doi: 10.1111/j.1748-7692.1995.tb00272.x
Robertson F. C., Koski W. R., Thomas T. A., Richardson W. J., Würsig B., Trites A. W. (2013). Seismic operations have variable effects on dive-cycle behavior of bowhead whales in the Beaufort Sea. Endang. Species Res. 21, 143–160. doi: 10.3354/esr00515
Román-Palacios C., Wiens J. J. (2020). Recent responses to climate change reveal the drivers of species extinction and survival. Proc. Natl. Acad. Sci. 117, 4211–4217. doi: 10.1073/PNAS.1913007117
Ross T. R., Thiemann G. W., Young B. G., Ferguson S. H. (2022). Complementary diet analyses reveal intraspecific and temporal variation in ringed seal (Pusa hispida) foraging in the Canadian high arctic. Polar Biol. 1, 1–16. doi: 10.1007/S00300-021-02999-X/FIGURES/6
Samarra F. I. P., Miller P. J. O. (2015). Prey-induced behavioural plasticity of herring-eating killer whales. Mar. Biol. 162, 809–821. doi: 10.1007/S00227-015-2626-8/FIGURES/5
Sampei M., Fortier L., Raimbault P., Matsuno K., Abe Y., Que Guiner B., et al. (2021). An estimation of the quantitative impacts of copepod grazing on an under sea-ice spring phytoplankton bloom in western Baffin bay, Canadian Arctic. Elem Sci. Anth 9. doi: 10.1525/elementa.2019.00092
Scott C. L., Kwasniewski S., Falk-Petersen S., Sargent J. R. (2000). Lipids and life strategies of Calanus finmarchicus, Calanus glacialis and Calanus hyperboreus in late autumn, kongsfjorden, Svalbard. Polar Biol. 23, 510–516. doi: 10.1007/s003000000114
Silber G. K., Lettrich M. D., Thomas P. O., Baker J. D., Baumgartner M., Becker E. A., et al. (2017). Projecting marine mammal distribution in a changing climate. Front. Mar. Sci. 4. doi: 10.3389/FMARS.2017.00413/BIBTEX
Silva M. A., Jonsen I., Russell D. J. F., Prieto R., Thompson D., Baumgartner M. F. (2014). Assessing performance of Bayesian state-space models fit to argos satellite telemetry locations processed with kalman filtering. PloS One 9, e92277. doi: 10.1371/journal.pone.0092277
Simard Y., Roy N., Giard S., Aulanier F. (2019). North Atlantic right whale shift to the gulf of st. Lawrence in 2015, revealed by long-term passive acoustics. Endanger. Species Res. 40, 271–284. doi: 10.3354/ESR01005
Simon M., Johnson M. J., Tyack P., Madsen P. T. (2009). Behavior and kinematics of continous ram filtration in bowhead wahles (Balaena mysticetus). Proc. R. Soc London Ser. B Biological Sci. 276, 3819–3828. doi: 10.1098rspb.2009.1135
Strona G., Bradshaw C. J. A. (2018). Co-Extinctions annihilate planetary life during extreme environmental change. Sci. Rep. 8, 1–12. doi: 10.1038/s41598-018-35068-1
Spreen G., Kaleschke L., Heygster G. (2008). Sea Ice remote sensing using AMSR-e 89-GHz channels. J. Geophys. Res. Ocean. 113. doi: 10.1029/2005JC003384
Stroeve J., Serreze M., Ornaheim I., Holland M., Vavrus S., Meier W., et al. (2017). Arctic Sea ice in 2016: A preview of the future. Geophys. Res. Abstr. EGU Gen. Assem. 19, 2017–6110. http://meetingorganizer.copernicus.org/EGU2017/EGU2017-6110.pdf.
Swalethorp R., Kjellerup S., Dunweber M., Nielsen T. G., Moller E. F., Rysgaard S., et al. (2011). Grazing, egg production, and biochemical evidence of differences in the life strategies of Calanus finmarchicus, C. glacialis and C. hyperboreus in disko bay, Western Greenland. Mar. Ecol. Prog. Ser. 429, 125–144. doi: 10.3354/meps09065
Thums M., Bradshaw C. J. A., Hindell M. A. (2011). In situ measures of foraging success and prey encounter reveal marine habitat-dependent search strategies. Ecology 92, 1258–1270. doi: 10.1890/09-1299.1
Tulloch V. J. D., Plaganyi E. E., Brown C., Richardson A. J., Matear R. (2019). Future recovery of baleen whales is imperiled by climate change. Glob. Change Biol. 25, 1263–1281. doi: 10.1111/GCB.14573
Urban M. C. (2015). Accelerating extinction risk from climate change. Science 348(6234), 571–573. doi: 10.1126/science.aaa4984
Usov N. V., Khaitov V. M., Kutcheva I. P., Martynova D. M. (2021). Phenological responses of the Arctic, ubiquitous, and boreal copepod species to long-term changes in the annual seasonality of the water temperature in the white Sea. Polar Biol. 2021 445 44, 959–976. doi: 10.1007/S00300-021-02851-2
van der Hoop J. M., Nousek-McGregor A. E., Nowacek D. P., Parks S. E., Tyack P., Madsen P. T. (2019). Foraging rates of ram-filtering north Atlantic right whales. Funct. Ecol. 33, 1290–1306. doi: 10.1111/1365-2435.13357
Venkataramana V., Anilkumar N., Naik R. K., Mishra R. K., Sabu P. (2019). Temperature and phytoplankton size class biomass drives the zooplankton food web dynamics in the Indian ocean sector of the southern ocean. Polar Biol. 2019 424 42, 823–829. doi: 10.1007/S00300-019-02472-W
Villegas-Amtmann S., Simmons S. E., Kuhn C. E., Huckstadt L. A., Costa D. P. (2011). Latitudinal range influences the seasonal variation in the foraging behavior of marine top predators. PloS One 6, e23166. doi: 10.1371/JOURNAL.PONE.0023166
Werth A. J. (2004). Models of hydrodynamic flow in the bowhead whale filter feeding apparatus. J. Exp. Biol. 207, 3569–3580. doi: 10.1242/jeb.01202
Weydmann A., Walczowski W., Carstensen J., Kwaśniewski S. (2018). Warming of subarctic waters accelerates development of a key marine zooplankton Calanus finmarchicus. Glob. Change Biol. 24, 172–183. doi: 10.1111/GCB.13864
Worm B., Lotze H. K. (2021). “Marine biodiversity and climate change,” in Climate change: Observed impacts on planet earth, third edition (Elsevier), 445–464. doi: 10.1016/B978-0- 12-821575-3.00021-9
Wursig B., Guerrero J., Silber G. K. (1993). Social and sexual behavior of bowhead whales in fall in the Western Arctic: A re-examination of seasonal trends. Mar. Mammal Sci. 9, 103–115. doi: 10.1111/j.1748-7692.1993.tb00434.x
Keywords: state-space modelling, satellite-telemetry, time-depth recorder (TDR), Arctic, behavioural flexibility, zooplankton, sea ice, bathymetry
Citation: Fortune SME, Trites AW, LeMay V, Baumgartner MF and Ferguson SH (2023) Year-round foraging across large spatial scales suggest that bowhead whales have the potential to adapt to climate change. Front. Mar. Sci. 9:853525. doi: 10.3389/fmars.2022.853525
Received: 12 January 2022; Accepted: 30 August 2022;
Published: 23 January 2023.
Edited by:
Ryan Rudolf Reisinger, University of Southampton, United KingdomReviewed by:
Philippine Chambault, University of California, Santa Cruz, United StatesPatrick James O’Malley Miller, University of St Andrews, United Kingdom
Copyright © 2023 Fortune, Trites, LeMay, Baumgartner and Ferguson. This is an open-access article distributed under the terms of the Creative Commons Attribution License (CC BY). The use, distribution or reproduction in other forums is permitted, provided the original author(s) and the copyright owner(s) are credited and that the original publication in this journal is cited, in accordance with accepted academic practice. No use, distribution or reproduction is permitted which does not comply with these terms.
*Correspondence: Sarah M. E. Fortune, c2FyYWguZm9ydHVuZUBkYWwuY2E=