
95% of researchers rate our articles as excellent or good
Learn more about the work of our research integrity team to safeguard the quality of each article we publish.
Find out more
ORIGINAL RESEARCH article
Front. Mar. Sci. , 26 July 2022
Sec. Marine Conservation and Sustainability
Volume 9 - 2022 | https://doi.org/10.3389/fmars.2022.851757
This article is part of the Research Topic Novel Technologies for Assessing the Environmental and Ecological Impacts of Marine Renewable Energy Systems View all 8 articles
 Charles W. Bangley1*
 Daniel J. Hasselman2
 Joanna Mills Flemming1
 Fredrick G. Whoriskey3
 Joel Culina2
 Lilli Enders4
 Rod G. Bradford5
Understanding the spatiotemporal distributions of migratory marine species at marine renewable energy sites is a crucial step towards assessing the potential impacts of tidal stream turbines and related infrastructure upon these species. However, the dynamic marine conditions that make tidal channels attractive for marine renewable power development also make it difficult to identify and follow species of marine fishes with existing technologies such as hydroacoustics and optical cameras. Acoustic telemetry can resolve some of these problems. Acoustic tags provide unique individual ID codes at an ultrasonic frequency, which are then detected and recorded by acoustic receivers deployed in the area of interest. By matching detection locations of fish species with environmental conditions at proposed sites for tidal energy infrastructure, species distribution models can be developed to predict the probability of species occurrence at sites of current and planned tidal power development. This information can be used to develop statistically robust encounter rate models to aid in quantifying the risk of tidal power development to migratory fish species. We used this approach to develop a predictive model of striped bass (Morone saxatilis) distribution within Minas Passage in the upper Bay of Fundy, Nova Scotia. Model results suggested increased probability of striped bass presence in Minas Passage during late ebb tide conditions and at relatively high water temperatures. We demonstrate the potential utility of species distribution modeling of acoustic tag detections in predicting interactions with renewable energy infrastructure, and show the importance of physical oceanographic variables influencing species distributions in a highly dynamic marine environment.
Tidal stream power has an opportunity to significantly contribute to the transition to renewable energy for coastal communities in the vicinity of extreme tidal environments. Development is already occurring in northern Scotland and is being explored in parts of the Bay of Fundy in US and Canadian waters (Sparling et al., 2020; Copping et al., 2021). The Minas Passage in the upper Bay of Fundy has particularly high potential for significant power generation, with some estimates suggesting turbines in the area could extract over 2.5 GW of power each tidal cycle (Karsten et al., 2008).
While in-stream tidal power generation lacks the large-scale environmental consequences of fossil fuels and does not affect access to essential habitat as much as dam-based riverine hydropower, tidal power generation may have the potential for harmful interactions with marine species including collisions between animals and rotating turbine blades (Sparling et al., 2020; Copping et al., 2021). In Canadian waters, documenting and mitigating potential harm to fish species is a requirement for permitting the deployment of tidal turbines and other power generation structures under the Canadian Environmental Assessment Act, Fisheries Act, and Species at Risk Act. Globally, some research has been done to assess the potential for collision risk with tidal turbines, though typically this has focused on marine mammals (Gillespie et al., 2021; Onoufriou et al., 2021). The risk of collision is typically framed as an encounter risk, defined as the risk of an individual animal or group of animals entering the turbine’s area of effect and presumably either colliding with the turbine or executing some kind of avoidance behavior (Wilson et al., 2007). Encounter rate modeling has traditionally been derived from predator-prey encounter models originally developed by Gerritsen and Strickler (1977) with turbine swept-area representing the area of potential encounter with the “predator.” This approach provided a framework that has been adapted to collision risk modeling (Wilson et al., 2007). However, because different species transiting through areas where they may encounter tidal stream turbines are likely to differ in their movement patterns, density, and avoidance behaviors, there is a need for species-specific information on potential encounter rate with tidal power infrastructure.
Species-specific information on spatial and temporal fish distributions in high-energy environments are lacking due to the impracticality of most fishing activities and fishery-independent survey methods in these areas. Hydroacoustic methods have been used to measure baseline fish densities at potential tidal power sites in the Bay of Fundy (Viehman et al., 2015) but it is difficult to translate these data to species-specific presence/absence or abundance data without accompanying trawl survey data to cross-reference acoustic targets. Typical fishery-independent survey methods such as stratified trawling and gillnetting are impossible and likely hazardous in Minas Passage. This leaves intertidal fishing weirs along the margins of the passage as the only practical fishing method that could be used to sample finfish in the immediate area (Dadswell et al., 2020). However, there has been extensive tagging of multiple species with acoustic transmitters in the area through the activities of various institutions, including Fisheries and Oceans Canada (DFO), The Mi’kmaw Conservation Group (MCG), Acadia University, and Dalhousie University, as well as by international researchers tagging highly migratory species outside of the vicinity of Minas Basin. Deployment metadata, including species and tagging location and tag detection data for many of these projects, are stored on the database of the Ocean Tracking Network (OTN), which organizes acoustic telemetry data with the goal of facilitating collaborative data sharing agreements among individual researchers and projects (Iverson et al., 2018). Acquiring cooperative agreements with researchers conducting acoustic telemetry research on species of fishery and conservation interest in Minas Passage to pool and use their data on species presence and movements provides an unprecedented opportunity to advance our understanding of potential interactions between tidal stream power and fishes.
Acoustic telemetry requires both the transmitters carried by the animals and deployment of receivers to detect the ultrasonic signals. While individual receivers or small arrays of receivers are capable of local tracking, large-scale receiver networks like the OTN and its associated regional nodes allow for tracking at large regional or even continental spatial scales (Bangley et al., 2020b). With this rich scale of data available, it is possible to match tag detections with environmental data to generate predictive species distribution models, which can be used to predict the probability of species presence based on environmental conditions (Bangley et al., 2020a). If both acoustic tag detections and environmental data are recorded in the local area around proposed tidal stream turbine deployment, we suggest it is possible to use this approach to predict the probability of species of interest co-occurring in space and time with tidal stream turbines. Here we demonstrate this approach for a single species using multiple years of environmental and hydrodynamic data recorded in Minas Passage and matched with tag detections of striped bass (Morone saxatilis).
The Minas Passage connects Minas Basin to the greater Bay of Fundy and the rest of the Gulf of Maine. At only 5 km in width, Minas Passage represents the only path for both tidal currents and marine species. During both flood and ebb tide, tidal currents are forced through the passage at velocities that can exceed 5 m/s (Karsten et al., 2011). Due to this high-energy environment, most of the bottom habitat is made up of exposed bedrock and boulder habitat. A volcanic plateau rises to a near-uniform depth off the north shore of Minas Basin near Black Rock. Due its relatively consistent bathymetry and position in some of the strongest tidal currents it makes up the majority of the area within the Crown Lease Area (CLA) overseen by the Fundy Ocean Research Centre for Energy (FORCE) (Figure 1). The CLA was established to assess the viability of tidal power development in Minas Passage and is an active site of research and monitoring related to the establishment of tidal stream power.
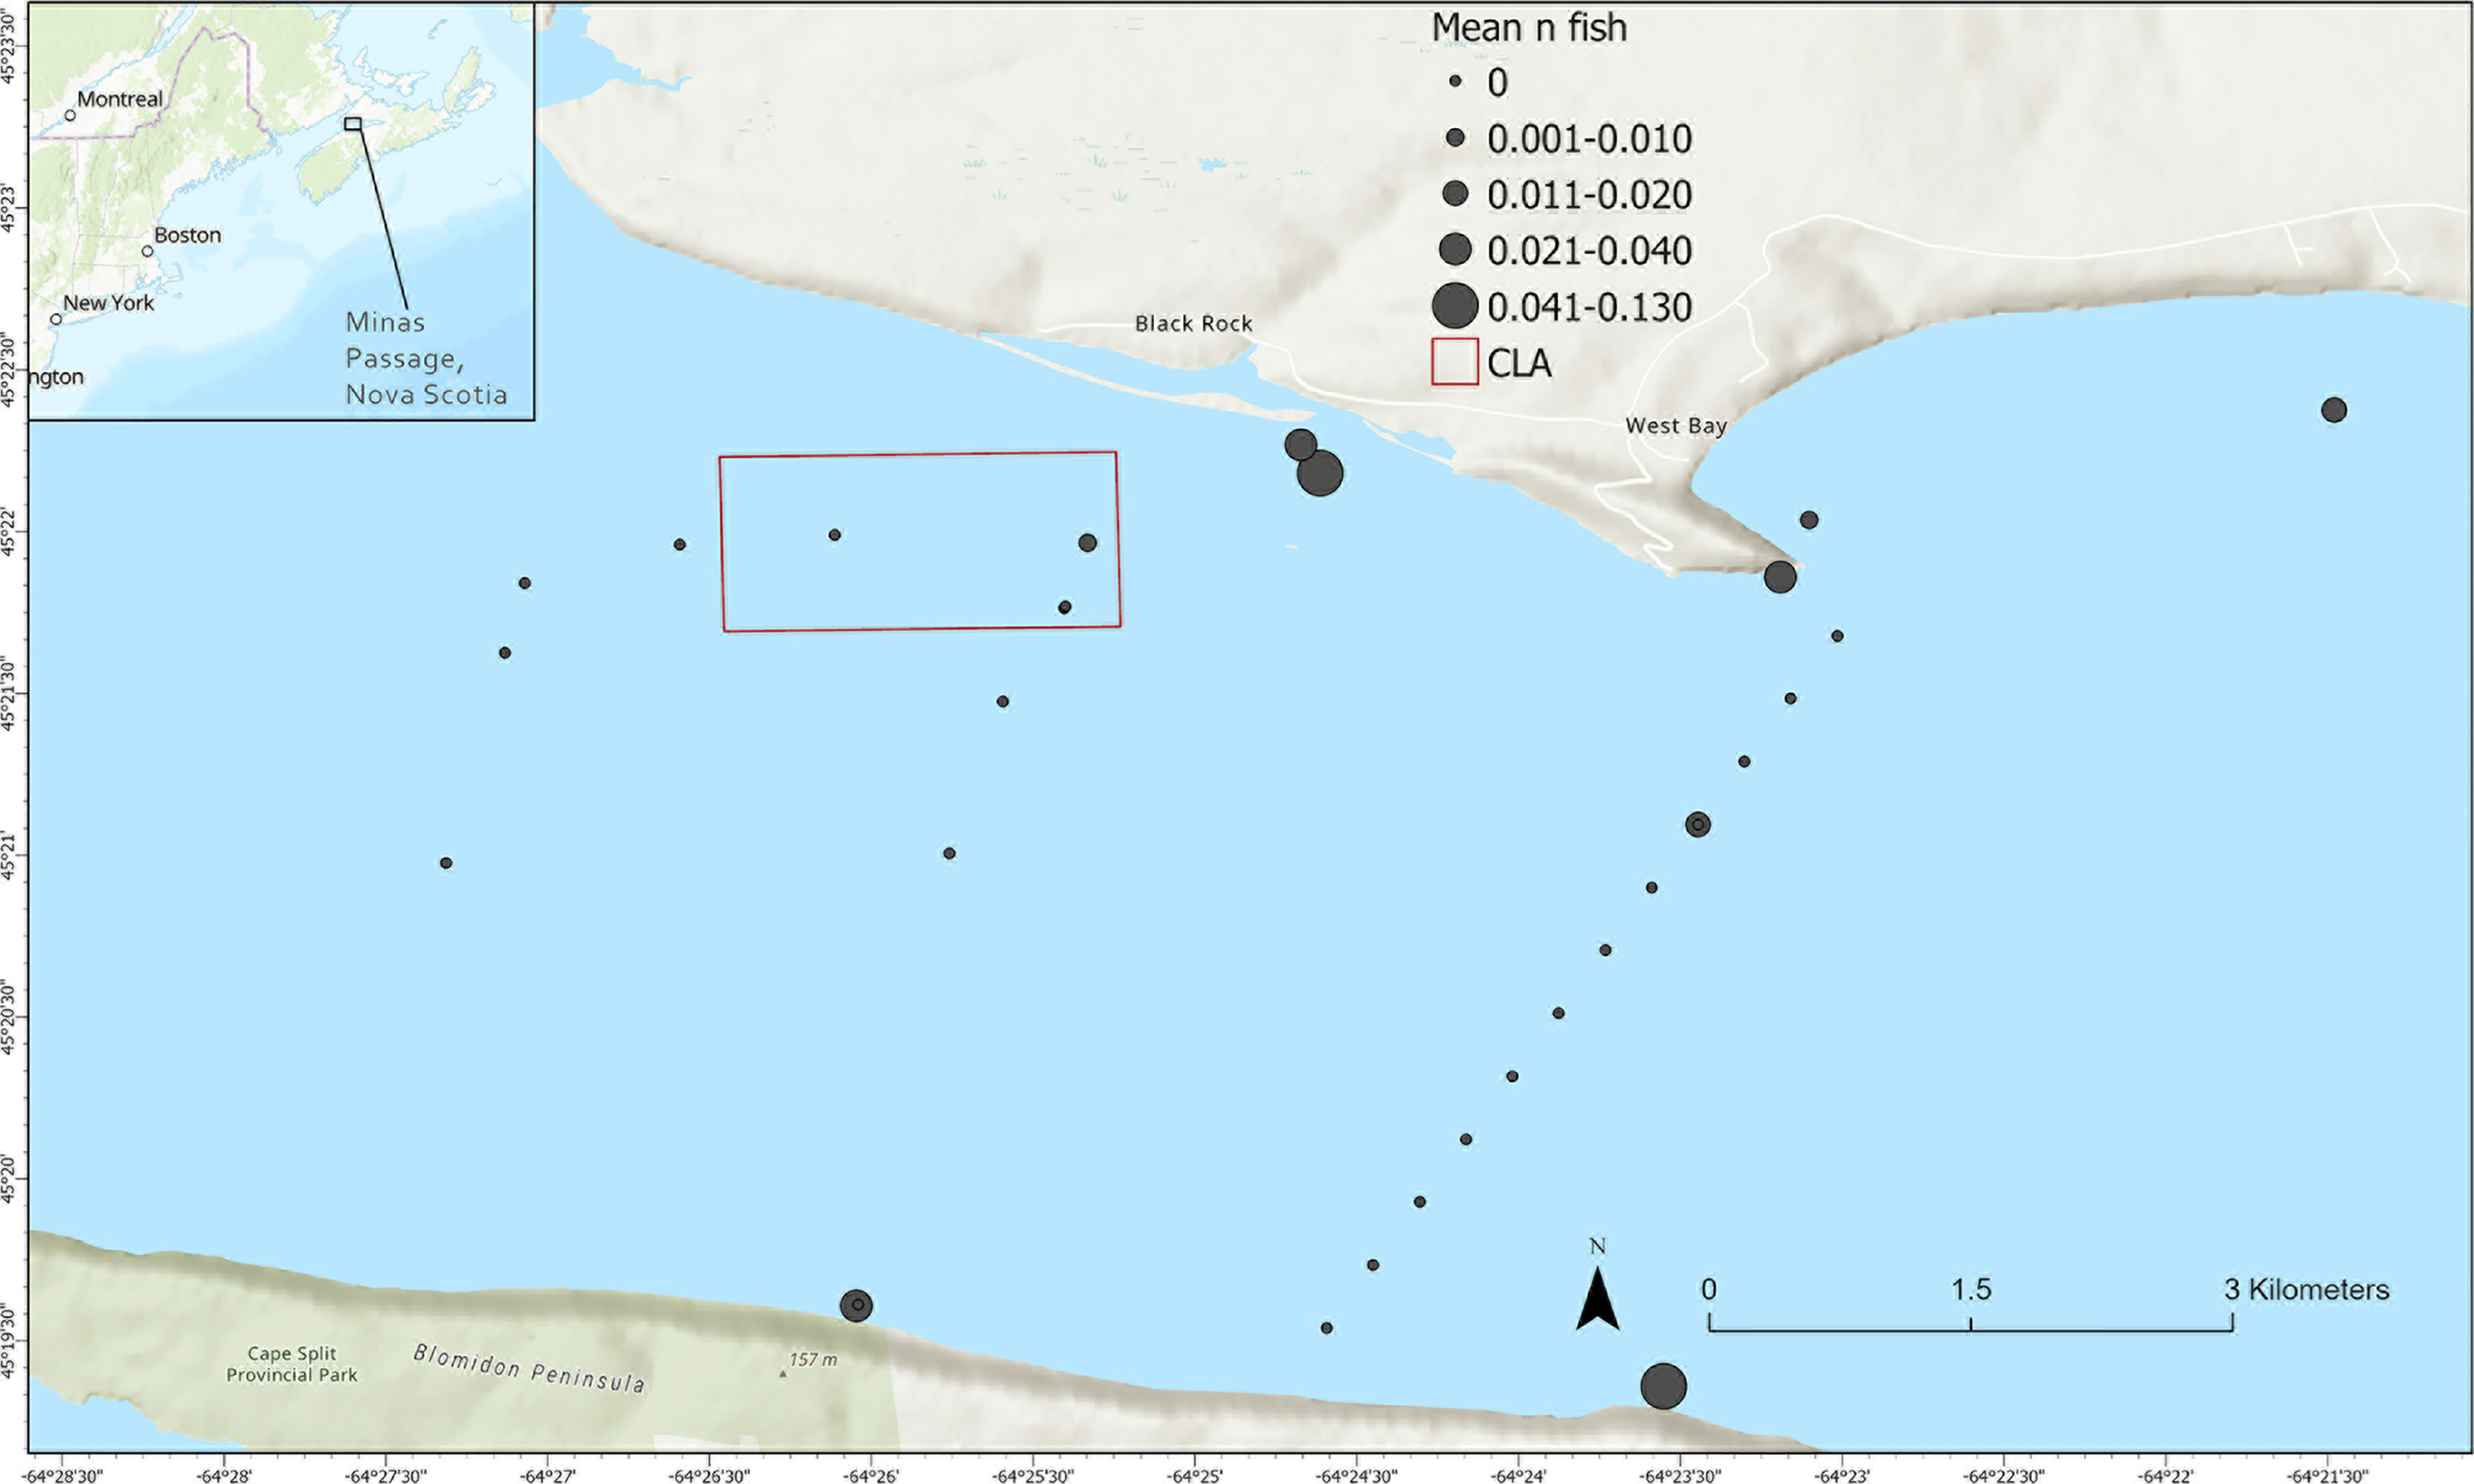
Figure 1 Study area within Minas Basin in the upper Bay of Fundy, including receiver locations with mean number of striped bass detected during October-December 2017-2020, the borders of the FORCE Crown Lease Area (CLA), and the boundaries of the area where species distribution model results will be mapped.
Minas Passage is the only point of entry and exit for most migratory species that occupy Minas Basin (CSAS, 2018). This includes transient species such as Atlantic sturgeon (Acipenser oxyrinchus) and sharks as well as anadromous species that spawn in the freshwater tributaries of Minas Basin. These anadromous species include alewife (Alosa pseudoharengus), American eel (Anquilla rostrata), American shad (Alosa sapidissima), Atlantic tomcod (Microgadus tomcod), and striped bass. Aside from their ecological importance, these species are economically and culturally significant to local communities.
The Minas Basin population of striped bass spawns in the Shubenacadie River and Grand Lake, Nova Scotia and is considered the northernmost confirmed breeding population for the species (Bradford et al., 2015). A portion of the population remains within Minas Basin year-round and overwinters in Grand Lake, while some larger individuals forage within and transit through Minas Passage on larger-scale coastal migrations (Paramore and Rulifson, 2001; Rulifson et al., 2008; Bradford et al., 2015). Sub-adult and adult striped bass are found throughout Minas Passage from May to October but depart over the course of October as they migrate to overwintering habitats in Grand Lake or the greater Bay of Fundy (Kendall et al., 2018). Oceanic migration in this population has been confirmed through otolith microchemistry and correlates with differences in coloration and diet from individuals that overwinter in freshwater habitats, with likely ocean migrants making up at least 25% of striped bass found in the Shubenacadie River (Paramore and Rulifson, 2001). However, acoustically tagged striped bass have been detected on receivers in Minas Passage during winter at what would be expected to be lethal temperatures (Keyser et al., 2016). The Bay of Fundy striped bass population is designated as Endangered by the Committee on the Status of Endangered Wildlife in Canada (COSEWIC), and as the only currently confirmed spawning population in the Bay of Fundy, Minas Basin striped bass are of high conservation interest and potential ecological importance (Bradford et al., 2015).
To measure the potential effect of current velocity on tag detection efficiency and range, we deployed five receiver stations equipped with VR2 69-kHz receivers and two sentinel tag stations with 69-kHz transmitters in a line perpendicular to the prevailing current direction (Supplementary Figure S1). Receiver stations were deployed with approximately 50 m spacing between stations and sentinel tag stations were deployed 75 m from either end of the receiver line. Receivers and sentinel tags were mounted to the posterior tail assembly of streamlined sub-surface floats designed to pivot and orient into the prevailing current. Each sub-surface float was anchored using a 500-lb single anchor chain link connected using a 2-m length of riser chain. The range test was conducted within the CLA from April 9th to May 11th, 2021 and was timed to match a full monthly tidal cycle. Signed current velocity at each station was derived from the FVCOM model (Chen et al., 2006) in 10-minute increments for the entirety of the deployment period.
The sentinel tags were Innovasea V13 or V16 69-kHz transmitters and transmitted at randomized 1140-1320-second intervals. Power level was 143 dB for the V13 transmitter and 158 dB for the V16, comparable to the power levels of tags deployed on striped bass used in this study. Detection efficiency was calculated as the percentage of expected transmissions that were detected on each receiver and matched with the current velocity at time of detection and the distance between the receiver and the sentinel tag. These data were used to interpolate a matrix of detection efficiency as a function of current velocity and distance.
We used boosted regression tree (BRT) analysis to model the probability of striped bass presence based on hydrodynamic conditions in a section of Minas Passage. BRT analysis is ideal for species distribution modeling because it is insensitive to most error distributions common in ecological data, multicollinearity of explanatory variables, and outliers (Elith et al., 2008; Dormann et al., 2013; Dedman et al., 2017). These features allow BRT analysis to be among the best-performing approaches to predictive species distribution modeling (Valavi et al., 2021). We performed our analysis in R version 4.1.2 (R Core Team, 2021) using the package gbm.auto, which automates many of the analytical and mapping steps (Dedman et al., 2017). In the following paragraphs we briefly summarize BRT modeling procedures, but for a more detailed description of each step and the underlying statistical theory see Elith et al. (2008) and see Dedman et al. (2017) for details on how each stage is performed in the gbm.auto package.
BRT analysis is a form of regression tree modeling, which divides data based on cut points in the range of each explanatory variable that result in reduced variance in the resulting sub-groups, referred to as branches. The number of branches at each split, or division at a cut point, is defined by tree complexity (tc) and splits typically occur at divisions between greater and lesser values of the response variable. Boosting reduces the variance of individual regression tree models by iteratively replicating trees through a stagewise machine learning process in which information from the previous tree is used to reduce the deviance in the next. The learning rate (lr) of a BRT model represents the contribution of each individual tree to reducing the deviance in the next. At each tree iteration, a portion of the data referred to as the bag fraction (bf) (Elith et al., 2008) is randomly selected and used to cross-validate the remainder of the data, which are used to train the model. This process is repeated until there is no longer significant deviance between successive tree iterations. Generally, a minimum of 1,000 tree iterations is considered sufficient to allow the model to reach the minimum possible deviance (Elith et al., 2008).
When applied to spatial species distribution modeling, BRT analysis requires two types of data: samples and grids (Dedman et al., 2015). Samples data include both the response variable and explanatory variables matched in space and time. These data are used to investigate the relationships between the response and explanatory variables and train the predictive model. Grids data are explanatory variable data recorded or interpolated in a regularly-spaced grid across the area of interest for the species distribution model. The predictive model generated from the samples data is applied to the grids data, generating predictive map surfaces showing predicted values of the response variable across the area of interest (Dedman et al., 2015; Dedman et al., 2017).
In this model, our samples data included hourly presence/absence of acoustically-tagged striped bass at acoustic receivers as the response variable, and physical/environmental variables derived from FORCE surface water flow radar, current speed/water flow model data, and other sources matched to acoustic receiver locations each hour as the explanatory variables. The measurements used as explanatory variables in this model were sea surface height (m), sea surface height gradient, divergence of horizontal velocity, vorticity, signed water current velocity (m/s), bathymetry standard deviation (m), and water temperature (°C).
Hydrodynamic variables (u and v velocity components, sea surface height, sea surface height gradient, divergence, vorticity) were derived from water surface wave field data collected by two overlapping X-band radar installations covering Minas Passage: one at the FORCE test site and one on the end of Cape Sharp. Data were collected during periods when the wave field was coherent. Radar data were collected during December 2020-April 2021, covering four full tidal cycles. Current velocity components were extracted from the wave field using the Geometric Current Triangulation (GemCuT) algorithm (Bell and McCann, unpublished as cited by Locke, 2019) and computed on a regular 150 x 150-m grid covering the study area at a 20-min temporal resolution. Gaps in the radar data set were filled using unified tidal analysis and prediction/harmonic analysis (Codiga, 2011).
All radar-derived measurements were validated using the FORCE region hydrodynamic model and concurrent acoustic Doppler current profiler (ADCP) data. The FORCE hydrodynamic model uses the Finite Volume Community Ocean Model (FVCOM) as model solver (Chen et al., 2006) and has itself been validated against an extensive number of acoustic Doppler current profilers (ADCPs) deployed in the region (FORCE, unpublished data). Hydrodynamic conditions in Minas Passage are relatively consistent over the course of a tidal cycle and radar data covered most of the tidal variability seen historically (FORCE, unpublished data). Because of this, we were able to hind-cast radar-derived metrics over our study time period using relationships between tide stage, sea surface height, and the other hydrodynamic metrics to predict variable values from historically modeled and recorded sea surface height data.
Signed current velocity (referred to as current velocity from here) was calculated using the u and v velocity components derived from the FORCE radar data in equation 1:
where s is 1 or -1 based on the current direction. Current direction was assigned by calculating the direction angle from the u and v velocity components using equation 2:
Based on the prevailing current directions in Minas Passage (Viehman et al., 2019), directional angles between 30 and 205° represented an incoming tide and assigned 1 for s in equation 1, while directional angles greater than 205° or less than 30° represented an outgoing tide and assigned -1 for s in equation 1
Bathymetry standard deviation was derived from high-resolution (2 m) multibeam sonar data collected through the Minas Passage and was assumed to be constant at each samples and grids location across the entire time frame of our study. Temperature was recorded by onboard sensors on four Innovasea HR2 acoustic receivers deployed in the vicinity of the CLA. Temperatures from all four receivers were compared and any measurements from a single receiver with a difference in standard deviation greater than 1°C were considered anomalous and removed. After removal of anomalous temperatures nearly all temperatures were within 1 SD of the others, which we interpreted as supporting the assumption that temperature would be constant throughout the modeled area due to the Minas Passage being an extremely well-mixed system. We applied the mean temperature recorded on the HR receivers uniformly across the modeled area. Except for bathymetry standard deviation, these variables were summarized by hour and matched with the date, hour, and location of each receiver.
All variables in the samples data were tested for multicollinearity using a pairwise Pearson’s correlation test. This was conducted using the corr.test function in the R package psych (Revelle, 2022). We used thresholds of correlation strength from Dormann et al. (2013) to assess whether collinearity was occurring. If strong correlation was found between pairs of variables, model runs with one of the variables dropped were used to determine the effect of removing the variable on model performance.
Both striped bass tag detections and environmental data covered the time period of fall through early winter, which was a period during which seasonal changes in the use of Minas Passage by striped bass are expected, including the outward migration of the portion of the population that leaves Minas Basin (Rulifson et al., 2008). This time period covered the dates of October 1st through December 31st and within the years 2017-2020. During this time period, receivers were deployed at 86 stations within the study area (Figure 1). For each receiver, only the hours that individual receiver could be confirmed to have been in the water based on deployment and recovery dates and times from the OTN database were included in our analysis. Deployment periods during which the receiver was recovered from a location other than the most recent deployment location (i.e. due to detaching from the mooring and being recovered elsewhere) were removed from analysis due to our inability to confirm the receiver’s location for the full deployment. Striped bass were tagged at their spawning grounds in the Shubenacadie River with Innovasea V16 model 69-kHz transmitters (Innovasea, Halifax, Nova Scotia) surgically implanted into the body cavity, as part of Fisheries and Oceans Canada (DFO) studies on movements within Minas Basin. Tagging occurred during 2016-2018, and primarily targeted individuals greater than 60 cm fork length. The tagged fish were detected on Innovasea VR2W 69-kHz receivers deployed in Minas Passage during the study period (Figure 1). Striped bass tag detections were summarized as the total number of unique individuals detected during each hour at each receiver, and we assumed that hours during which no individuals were detected represented absence of the species.
Grids data were derived from the same data sources as the samples data and mapped across an area of Minas Passage in which radar data were consistently high quality (southwest corner 45.33990/-64.46124, northeast corner 45.37634/-64.37122) (Figure 1). Grid cell size was 150 x 150 m, which corresponds to the average spatial resolution of the FORCE radar data. Eight grids were generated, each representing the average conditions during slack high, early, mid, and late ebb, slack low, and early, mid, and late flood tide stages in October. The grids used for this demonstration represented mean conditions during each of these tide stages, based on the values of each explanatory variable in each grid cell between October 1st and 31st from 2009 through 2020.
Because Minas Passage is subject to eddies and other complex hydrology, tide stages were defined using a combination of signed current velocity and sea surface height at a single common datum located centrally in the passage (45.34392/-64.32384). Signed current velocity and sea surface height data were obtained at this location by extracting the values nearest to this point from the environmental grids using the filter function from the R package dplyr (Wickham et al., 2021). Based on histograms of current velocity frequency, we classified current velocities between -1.0 and 1.0 as the slack range and defined tide stages as follows: slack high tide was defined as velocity within the slack range with a sea surface height greater than 2 m, slack low tide was defined as velocity within the slack range with sea surface heights less than -2 m, ebb tide was defined as any negative velocity value outside the slack range, and flood tide was defined as any positive velocity value outside the slack range. Flood and ebb tide were further divided into early, mid, and late stages to capture the variation within these parts of the tidal cycle. Current velocity less than -2.5 m/s during ebb tide denoted mid ebb stage, current velocity greater than -2.5 m/s with sea surface height greater than 0 m denoted early ebb stage, and current velocity greater than -2.5 m/s with sea surface height less than 0 m denoted late ebb stage. During flood tide, current velocity greater than 2.5 m/s denoted mid flood, less than 2.5 m/s with sea surface height less than 0 m denoted early flood, and velocity less than 2.5 m/s with sea surface height greater than 0 m denoted late flood stage.
Once samples and grids data were prepared, we performed BRT model training and results mapping using the R package gbm.auto (Dedman et al., 2017), which automates most of the necessary steps. A binary presence/absence BRT model was used to predict the probability of striped bass presence in each of the four grids. The model was trained by testing combinations of initial tc, lr, and bf values until the best-performing model was found. Models that generated at least 1,000 tree iterations were evaluated based on the cross-validation score (CV score), mean deviance, and % deviance explained, with the model showing the greatest CV score and % deviance explained and the lowest mean deviance selected as the best-performing model. To assess the potential for model overfitting, we observed the difference between the cross-validated area under operator curve (CV AUC) and training area under operator curve (training AUC), with lower differences indicating lower likelihood of overfitting (Hijmans and Elith, 2013).
Marginal effect plots were generated from the model results and used to illustrate the relationships between striped bass presence probability and each explanatory variable. The relative influence of each explanatory variable was measured as the percentage of tree splits attributed to that variable. Mapped results showed the probability of at least one striped bass being present in each grid cell. To determine how representative the hydrodynamic data used to train the model were of the conditions found in the grids data, maps of “unrepresentativeness” were generated, indicating how dissimilar each grid cell was to the conditions in the samples data.
A total of 69 unique individual striped bass were detected within Minas Passage during October-December 2017-2020, accounting for 254 hourly presence records. Response variable distributions varied (Figure 2): sea surface height and sea surface height gradient showed upper and lower peaks, while temperature skewed towards higher values and while bathymetry standard deviation towards the lower values. Current velocity metrics showed a relatively normal distribution and vorticity and divergence values were mostly grouped close to 0 (Figure 2).
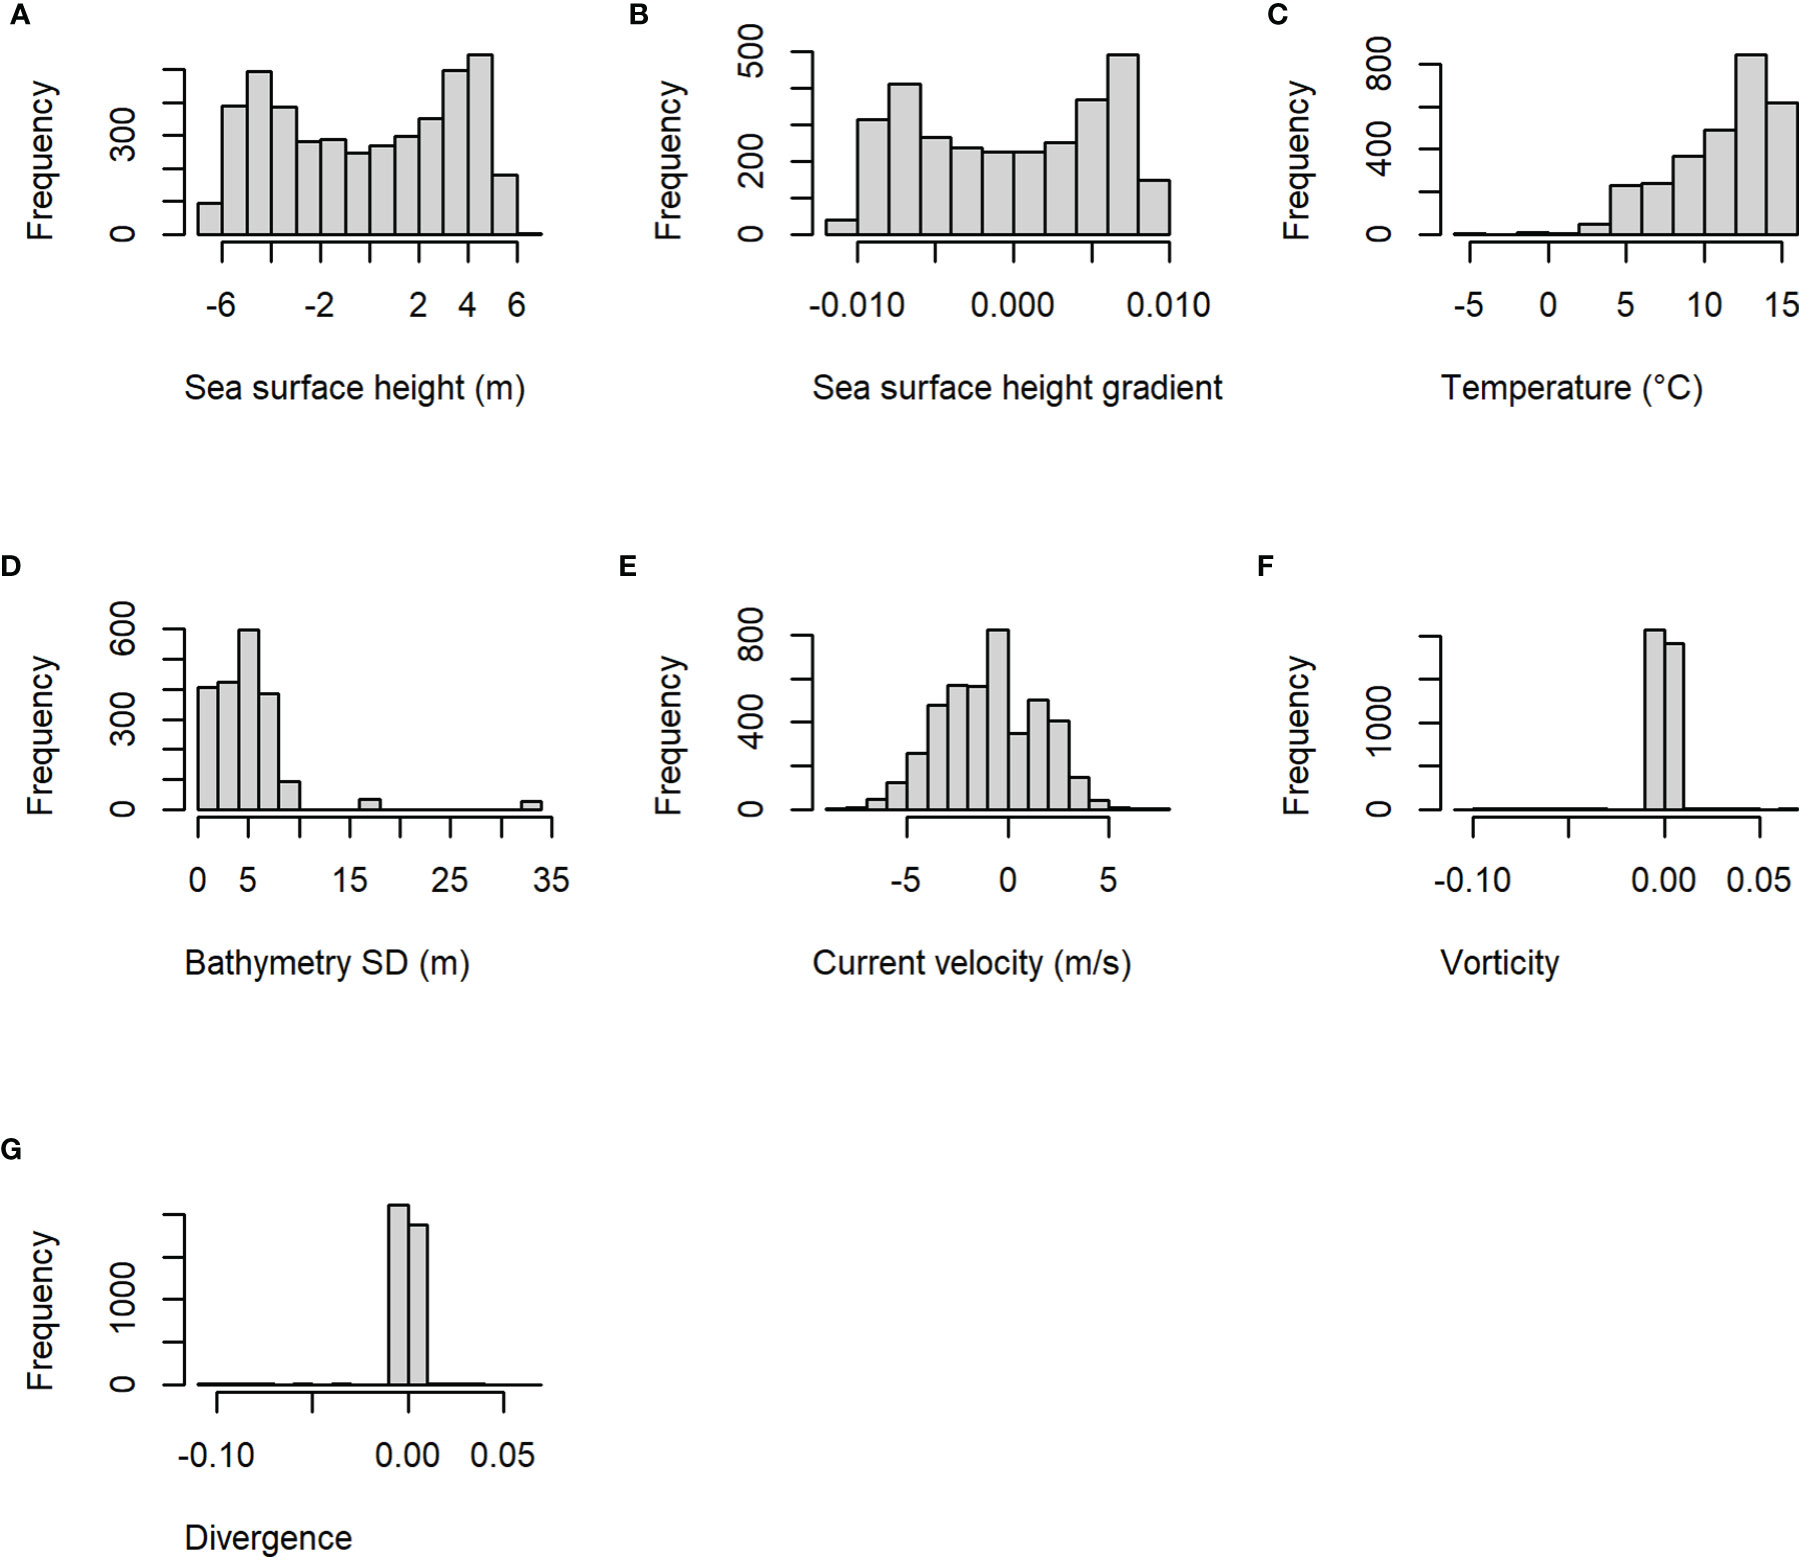
Figure 2 Histograms showing the frequency of explanatory variable values from training data used to develop the final boosted regression tree model of striped bass presence probability during October-December 2017-2020. Variables are (A) sea surface height, (B) sea surface height gradient, (C) temperature, (D) bathymetry standard deviation (SD), (E) current velocity, (F) vorticity, and (G) divergence.
Multicollinearity tests showed significant (p < 0.001) but weak (r < 0.2) correlations between current velocity and sea surface height, sea surface heigh gradient, vorticity, and divergence (Table S1). Vorticity and divergence both showed a significant (p < 0.001) and strong (r > 0.9) correlation, as did sea surface height and sea surface height gradient. Removal of either variable in each pair led to a decline in model performance based on CV and AUC values, so all variables were left in the final model. Pairwise correlations between all other variables were both insignificant (p > 0.05) and weak (Table S1).
Detection efficiency was greater than 60% at least as far as 350 m at low current velocities, but tapered off quickly as current speed increased on both flood and ebb tide (Supplementary Figure 2). Relatively high detection efficiency to at least 150 m occurred at current velocities up to -2.0 m/s during ebb tide and 2.5 m/s during flood tide, and was functionally zero at velocities beyond -3.0 m/s at ebb tide and greater than 3.5 m/s at flood tide. Detection efficiency appeared to reach zero at a lower current velocity during ebb tide but initially tapered off more sharply during flood tide (Supplementary Figure 2).
The best performing BRT model had a tc of 7, lr of 0.001, and bf of 0.60, and generated 1950 tree iterations (Table 1). Training and CV AUC values showed a difference of less than 0.094, indicating that overfitting was unlikely. A CV score of over 0.77 was indicative of good performance, and the model explained 66.77% of the deviance (Table 1).
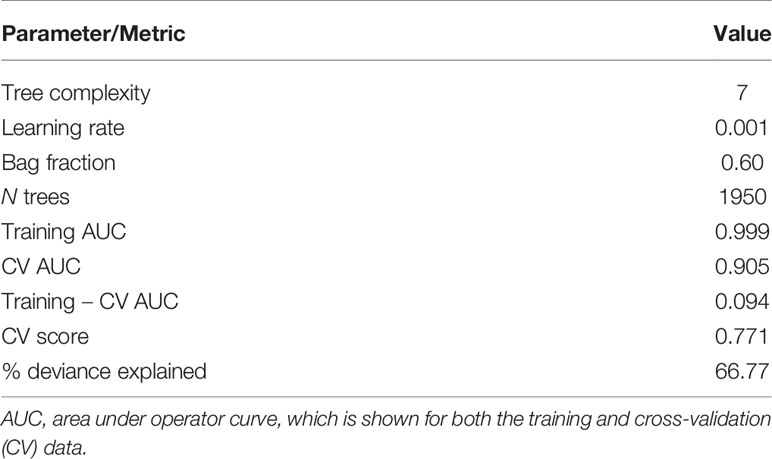
Table 1 Starting parameters and evaluation metrics for the best-performing boosted regression tree model.
Temperature was the most influential variable, accounting for 24.1% of tree splits, followed by bathymetry standard deviation (18.9%), current velocity (15.4%), vorticity (14.6%), and sea surface height (13.3%) (Figure 3). Temperatures greater than approximately 12°C had a positive effect on presence probability, which peaked at 14°C. Bathymetry standard deviation had a negative effect between 3 and 10 m, but relatively lower and higher values had a positive effect. Current velocities associated with ebb tide (< 0 m/s) and vorticity less than -0.05 and greater than 0.05 had positive effects on presence probability. Sea surface height had a small but positive effect at values associated with near slack low (-4 to -6 m) and slack high (4 to 6 m) conditions (Figure 3).
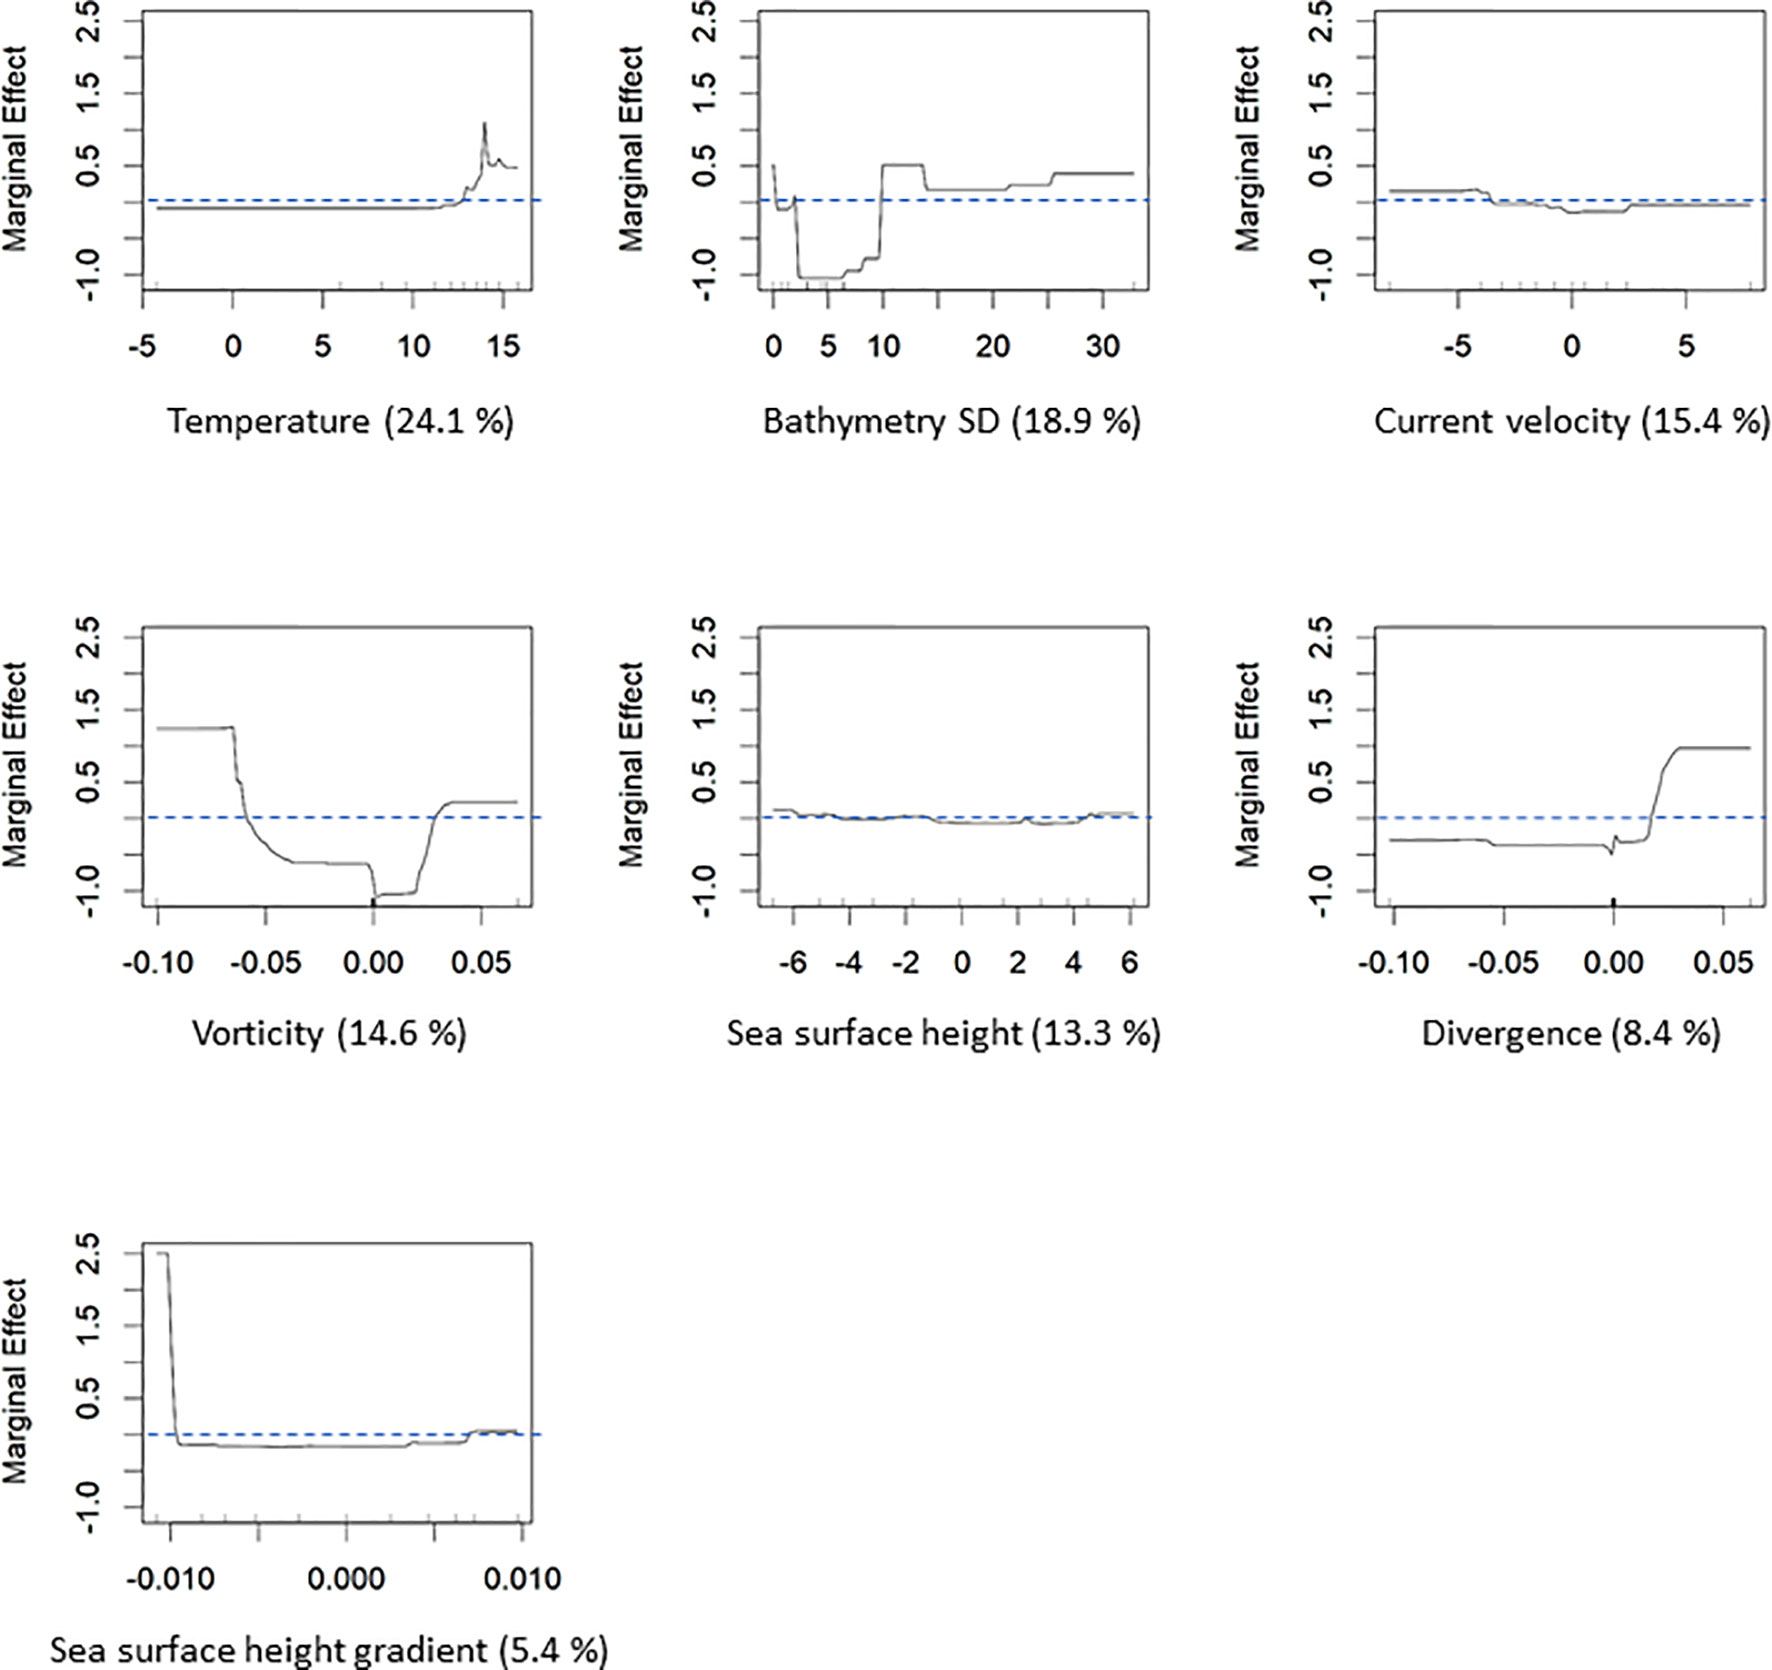
Figure 3 Marginal effect plots showing relationships between striped bass presence probability and each explanatory variable. Percentages next to variable names are the percent of tree splits attributed to that variable.
Maximum presence probability rarely exceeded 0.4 except during late ebb tide, with areas of relatively higher presence probability generally distributed close to shore around Cape Sharp or south of the CLA in the main channel (Figures 4, 5). The generally low presence likelihood likely reflected the effect of temperature on striped bass presence during October. Areas of relatively greater or lower striped bass presence probability varied between tide stages. During the outgoing tide (Figures 4A–D), areas of elevated presence probability were distributed close to shore around Cape Sharp and into West Bay at the early ebb stage, increased to peak presence probability across a broader area by late ebb tide, and reduced at slack low tide. During the outgoing tide (Figures 5A–D), presence probability reduced during early flood stage and was relatively low throughout the study area through slack high tide. Striped bass presence probability within the CLA was relatively low during all tide stages, though it was elevated in small areas to the north and southwest of the CLA boundary (Figures 4, 5).
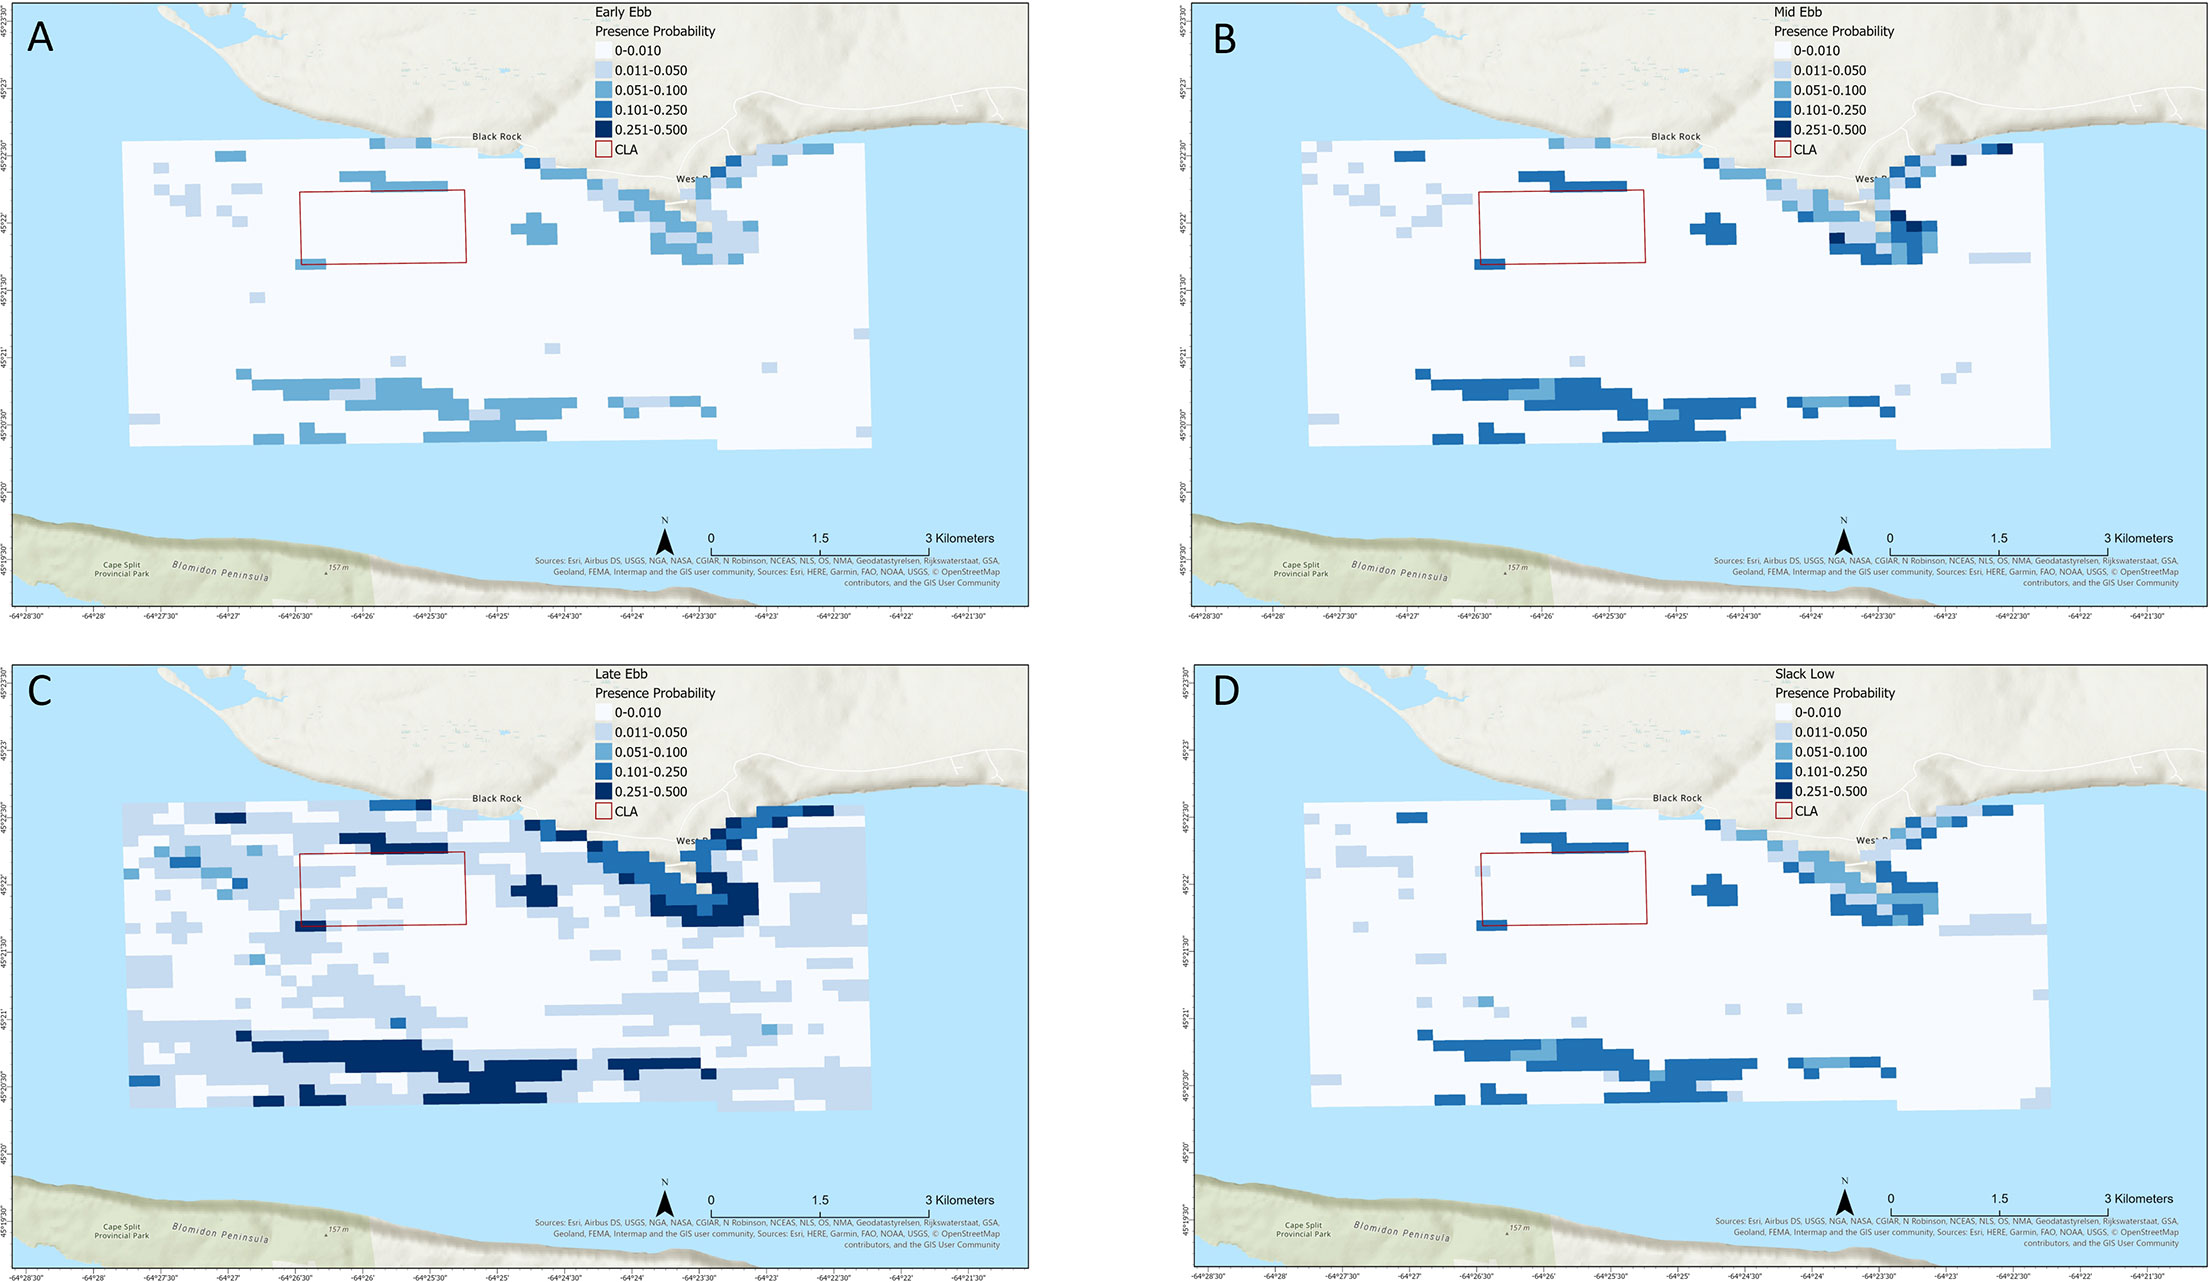
Figure 4 Mapped boosted regression tree model result showing striped bass presence probability in Minas Passage during ebb tide at (A) early ebb, (B) mid ebb, (C) late ebb, and (D) slack low tide stages.
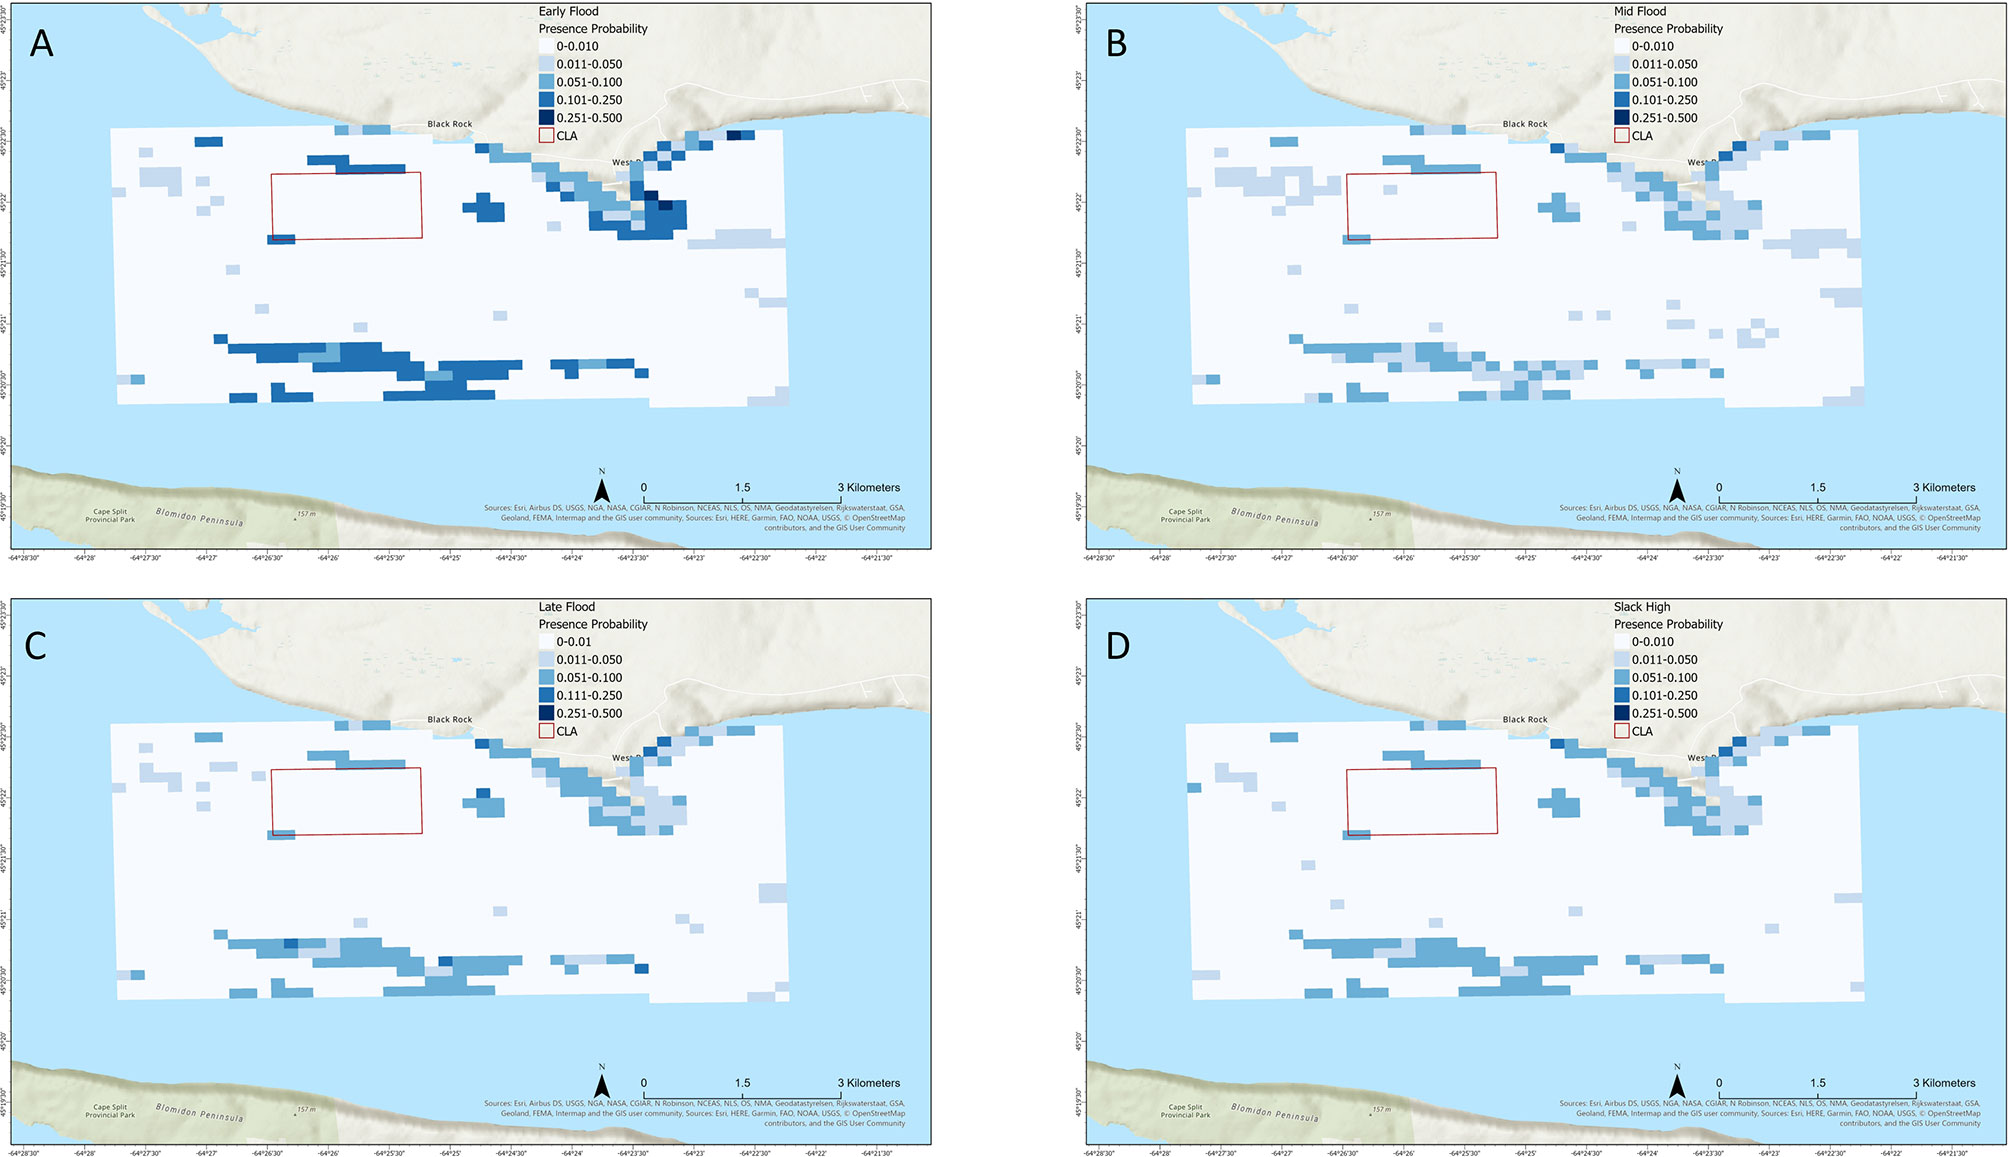
Figure 5 Mapped boosted regression tree model result showing striped bass presence probability in Minas Passage during flood tide at (A) early flood, (B) mid flood, (C) late flood, and (D) slack high tide stages.
Unrepresentativeness was generally low to moderate (approximately 0.15-0.4) across most of the modeled area, indicating that samples data were fairly representative of environmental variation (Supplementary Figures 3, 4). Unrepresentativeness was generally lowest near shore and, during the mid flood through early ebb tide stages, extending into the channel off the end of Cape Sharp. Unrepresentativeness was greatest in the middle of the channel during all tide stages (Supplementary Figures 3, 4).
Overall our model performed well and produced results that are realistic in the context of local striped bass ecology. BRT marginal effect plots suggested an increased probability of striped bass presence at warmer temperatures, bathymetry at very low or high complexity, and velocity, vorticity, and sea surface height conditions associated with ebb tide. Mapped results reflected these relationships with the greatest maximum presence probability occurring during late ebb tide, with a general rise in presence probability during ebb tide and fall by early flood tide. Mapped results also showed relatively low presence probability within the CLA during all tide stages with areas of greater presence probability occurring along shore and farther out in the open passage, though discrete areas of elevated presence probability were distributed just outside the boundaries.
Temperature was the most influential variable on the model, reflecting its clear role as an essential biological driver of striped bass movement from Minas Basin. Informed by the initial analysis of temperature records from four HR receivers, we assumed the relatively uniform temperature throughout Minas Passage was due to the high energy mixing of water. The relationships identified by the model between striped bass presence probability and temperature are likely to be broadly applicable in the study area. To our knowledge, no study thus far has documented stable and predictable temperature micro regimes in the study area that would contradict this assumption and our analysis seems to support it. Our model showed a sharp increase in striped bass presence probability at temperatures greater than 12°C, suggesting that the species should be more likely to occur within Minas Passage at relatively warm temperatures. This apparent threshold response occurred at a considerably warmer temperature than the lower incipient lethal range for striped bass from the local population (approximately 0-2°C) but may be as close to thermally optimal conditions for striped bass as possible during October (Coutant et al., 1984; Cook et al., 2006). It is worth noting that 35% of striped bass tagged by Keyser et al. (2016) were detected in the Minas Passage in the winter months of December-March. The species may show a different relationship with hydrodynamic conditions at lower temperatures later in the winter. Season-specific modeling should be performed to determine whether the relative importance and effects of environmental variables change between seasons.
Bathymetry standard deviation was the second most influential variable, with increased striped bass presence probability at considerably lesser and greater bottom complexity than the most commonly occurring measurements. This may represent two different habitat use patterns within Minas Passage. The preference for less-complex bottom habitat may reflect midwater foraging or travel through the passage during seasonal migrations, while occurrence at more complex habitats may represent foraging for benthic prey or sheltering behavior. American lobster (Homarus americanus) is an important prey species for large adult striped bass (Nelson et al., 2003). Lobster occur in Minas Passage (CSAS, 2018) and may be more available in complex bottom habitat. A portion of the striped bass used to develop this model carry transmitters equipped with depth sensors, and further analysis of the fish’s position in the water column relative to bathymetry standard deviation may provide deeper insight into striped bass habitat use within Minas Passage.
Variables directly related to tidal forces in Minas Passage, including current velocity, vorticity, and sea surface height were similarly influential, suggesting that tidal forces play an important role in local fish distributions. Predicted presence probability was most positively influenced by ebbing current velocities, relatively high vorticity, and the highest and lowest sea surface heights. Combined, these suggest that striped bass are more likely to be present in Minas Passage during the later stages of ebb tide. This may represent striped bass taking advantage of outgoing tidal currents during their fall outward migration while selecting for less extreme currents to maintain control over their swimming speed and direction. Such conditions are likely less energetically demanding on swimming performance and may represent periods during which striped bass are able to most efficiently emigrate from Minas Basin. During all tide stages, areas of relatively high presence probability were distributed close to shore, particularly near Cape Sharp and within West Bay. These areas may be refuges or staging areas for striped bass during higher-energy tide stages. These near-shore areas are also the sites of the most complex eddies in the study area, which may be the reason for the positive relationship between striped bass presence probability and relatively turbulent water. In open ocean environments, mesoscale eddies can create complex horizontal boundaries that aggregate prey and attract larger predators (Godo et al., 2012). Eddies and wakes are created consistently in the vicinity of Cape Sharp during each tidal cycle, which may similarly attract striped bass and other large, mobile predators in Minas Passage.
Broome et al. (2015) noted few striped bass tag detections at current speeds greater than 3 m/s. This may be due to behavioral avoidance of high-flow conditions, but could also be an artifact of reduced tag detection efficiency at greater current velocities (Sanderson et al., 2017). Our own range testing confirmed a sharp reduction in tag detection efficiency at current speeds greater than 2.5 m/s during both ebb and flood tide. Future model iterations will explore this in greater detail and incorporate tag detection efficiency directly into predictions of presence probability.
Mapped predictions suggest that during October the probability of this species overlapping in space and time with tidal power devices deployed in the CLA should be relatively low. Areas of relatively elevated presence probability just outside the CLA boundaries are most likely due to bottom habitat complexity at the edges of the volcanic plateau. Widespread striped bass occurrence within the CLA is most likely during late ebb tide, but even during this tide stage the greatest presence probability does not exceed 0.05. It should be noted that these predictive maps represent a static snapshot of presence probability during average environmental and hydrodynamic conditions in each tide stage, and do not account for movement trajectories of individual fish. Therefore, these maps should be used to assess the probability of striped bass co-occurring in space and time with a tidal power device under a given set of conditions and represents the most basic assessment of potential encounter risk. In locations where fish and tidal stream devices are predicted to overlap, a more fine-scale analysis incorporating the vertical position and movement behaviors of the fish and the physical characteristics of the tidal stream device (height off the bottom, swept area, rotation speed, etc.) should be undertaken to assess the true risk of encounter or collision (Wilson et al., 2007). This modeling approach provides a method of assessing potential overlap at relatively large spatial scales and will help narrow down locations and times where more detailed encounter risk assessment is needed.
While all the variables used in this model have plausible ecological explanations for their relationships with species presence, we were limited by those variables that were available with sufficient spatial and temporal coverage for use in the model. Ideally, we would have included variables such as salinity, dissolved oxygen, and turbidity, but these data were not available for Minas Passage at the spatial and temporal scales needed for this modeling effort. The combination of variables we were able to use provided ecologically plausible results, but there is the possibility that variables we were unable to include may have important influences on the distribution of striped bass and other species in Minas Passage. Should sufficient data for other variables become available, they will be included in future model iterations.
Some of our variables showed strong and significant correlation but dropping them from the model caused a decline in model performance. This suggests that while all hydrodynamic and environmental variables likely interact in some way within Minas Passage, each variable had at least some independent influence on striped bass presence probability. Such situations are common in ecological studies, where correlation does not necessarily mean collinearity and the true relationships between variables require interpretation based on how they interact in the study system (Dormann et al., 2013).
In this demonstration, we have made two key assumptions: transmissions from tagged fish are equally likely to be detected in all environmental conditions including tide stage, and environmental associations of tagged fish are representative of the general habits of the species and population. Our first assumption is likely violated by the dynamic nature of the Minas Passage environment. Current speed and turbulence can reduce the detection efficiency and range of acoustic transmissions by increasing ambient noise or by pushing the fish through the receiver’s detection range before the tag’s intermittent transmission can be detected (Sanderson et al., 2017). When building a model of presence probability, this is problematic because it reduces the likelihood that all actual fish presences are documented and that a lack of detection represents a true absence. Our initial range testing shows that detection efficiency declines sharply at current velocities greater than 2-2.5 m/s associated with both peak ebb and peak flood tide stages, though it may be relatively reliable at current velocities occurring during other tide stages. Therefore, mapped presence probability results are likely more reliable during slack, early, and late tide stages than during peak flood and ebb tide. However, Minas Passage is a complex environment, and finer-scale currents and eddies likely mean that detection efficiency will vary spatially at any tide stage. We continue to conduct long-term range testing to assess detection efficiency of acoustic transmitters at varying distances from receivers under as close to the full spectrum of hydrodynamic conditions in Minas Passage as possible. In future model iterations, the results of this range testing will allow us to better measure the uncertainty of the predicted presence probabilities from our models, and to make any necessary adjustments to the modeling approach and receiver deployment strategy.
The second assumption, that the behavior of tagged fish is representative of the general population, is likely only true for the proportion of large adult striped bass that either forage in Minas Passage or make seasonal migrations out of Minas Basin to the ocean. For striped bass, currently available data suggest this may represent the only portion of the population that regularly occurs in Minas Passage (Paramore and Rulifson, 2001; Rulifson et al., 2008), but direct comparison with tag detections of smaller individuals will be necessary to confirm. Moving forward, this assumption will be tested by incorporating new tag detections that have been recorded since the completion of model training, including new transmitter deployments on species of interest, particularly demographics that are not well-represented in current or historical tag detection data. These new tag detection locations will be compared with predictive SDM maps to determine whether these detections that were not part of the original model training fall within or near areas of greater predicted presence probability. This will be used to validate model predictions, and new tag detections may also be incorporated into new model iterations to determine if this improves predictive performance.
As of this writing, our range testing and follow-up tagging studies testing model assumptions are underway but not complete. Therefore, current model results for assessing the risk of potential encounter with tidal stream turbines in Minas Passage are preliminary and should be used with caution until they have been sufficiently validated. This work has demonstrated a model providing testable predictions of animal distributions based on acoustic tag detections in a highly dynamic environment. The model’s initial predictions seem realistic in the context of local striped bass ecology during the autumn study period. The expansion of the work to include data from other species and yearly seasonal cycles will provide a generalized tool useful to tidal power developers seeking to quantify risk and eliminate or reduce the potential for negative interactions between power infrastructure and marine species.
The raw data supporting the conclusions of this article will be made available by the authors, without undue reservation.
The animal study was reviewed and approved by Department of Fisheries and Oceans Canada.
CWB conceived of and conducted the statistical analyses and wrote the manuscript. DH organized the project, provided background material, and contributed to analysis and manuscript writing. FGW organized and provided access to fish tag and receiver deployment data, and contributed to manuscript writing. JMF contributed to statistical analyses and manuscript writing. JC organized and provided environmental data and contributed to manuscript writing. LE helped develop and describe methods for deriving environmental data and contributed to manuscript writing. RB provided fish tag detection data and metadata, and contributed to manuscript writing.
Natural Resources Canada, Emerging Renewable Power Program - the primary source of funding for this research. The grant number is ERPB-RA-07.
The authors declare that the research was conducted in the absence of any commercial or financial relationships that could be construed as a potential conflict of interest.
All claims expressed in this article are solely those of the authors and do not necessarily represent those of their affiliated organizations, or those of the publisher, the editors and the reviewers. Any product that may be evaluated in this article, or claim that may be made by its manufacturer, is not guaranteed or endorsed by the publisher.
We would like to acknowledge all the researchers at Fisheries and Oceans Canada who participated in tagging striped bass and contributed tag detection data for this modeling effort. Brian Sanderson has been instrumental in the development and analysis of the initial range test and continued range testing. Mike Stokesbury, Joe Beland, Darren Porter, and Charlie Fleming have provided valuable insight into fish movement patterns and telemetry logistics in Minas Basin and are partners in the development and execution of follow-up model validation studies. Jessica Douglas, Louise McGarry, Shaun Allain, and Dylan DeGrace assisted with field ops planning and initial analysis. We would also like to thank all field crew and data team members working with Darren Porter, The Mi’kmaw Conservation Group, Acadia University, and the Ocean Tracking Network for deployment and recovery of acoustic receivers and organization of tag detection data. Funding for this project was provided by Natural Resources Canada (award ERPP-RA-07).
The Supplementary Material for this article can be found online at: https://www.frontiersin.org/articles/10.3389/fmars.2022.851757/full#supplementary-material
Supplementary Figure 1 | Map of receiver and sentinel tag deployments used in the preliminary range test within the FORCE Crown Lease Area. Arrows designate the prevailing tidal current directions.
Supplementary Figure 2 | Matrix of the efficiency (% of average expected transmissions received) of detection of high-power (143 dB) transmissions from 69-kHz sentinel tags over current velocity (m/s) and range from the receiver (m), based on results of a preliminary range test within the FORCE Crown Lease Area. Figure by B. Sanderson.
Supplementary Figure 3 | Unrepresentativeness maps showing the difference between explanatory variable values in the samples and grids data during October-December 2017-2020 ebb tide at A) early ebb, B) mid ebb, C) late ebb, and D) slack low tide stages.
Supplementary Figure 4 | Unrepresentativeness maps showing the difference between explanatory variable values in the samples and grids data during October-December 2017-2020 during flood tide at A) early flood, B) mid flood, C) late flood, and D) slack high tide stages.
Bangley C. W., Curtis T. H., Secor D. H., Latour R. J., Ogburn M. B. (2020a). Identifying Important Juvenile Dusky Shark Habitat in the Northwest Atlantic Ocean Using Acoustic Telemetry and Spatial Modeling. Mar. Coast. Fish. 12, 348–363. doi: 10.1002/mcf2.10120
Bangley C. W., Whoriskey F. G., Young J. M., Ogburn M. B. (2020b). Networked Animal Telemetry in the Northwest Atlantic and Caribbean Waters. Mar. Coast. Fish. 12, 339–347. doi: 10.1002/mcf2.10128
Bradford R. G., Halfyard E. A., Hayman T., LeBlanc P. (2015). Overview of 2013 Bay of Fundy Striped Bass Bioligy and General Status. Ottowa, ON: Fisheries and Oceans Canada.
Broome J., Redden A., Keyser F., Stokesbury M., Bradford R. (2015). “Passive Acoustic Telemetry Detection of Striped Bass at the FORCE TISEC Test Site in Minas Passage, Nova Scotia, Canada,” in Proceedings of the 3rd Marine Energy Technology Symposium. 5. (Washington, DC)
Chen C., Beardsley R. C., Cowles G. (2006). An Unstructured-Grid, Finite-Volume Coastal Ocean Model (FVCOM) System. Oceanography 19, 78–89. doi: 10.5670/oceanog.2006.92
Codiga D. L. (2011). “Unified Tidal Analysis and Prediction Using the UTide Matlab Functions,” in Technical Report 2011-01 (Narragansett, RI, USA: Graduate School of Oceanography, University of Rhode Island), 59pp.
Cook A. M., Duston J., Bradford R. G. (2006). Thermal Tolerance of a Northern Population of Striped Bass Morone Saxatilis. J. Fish. Biol. 69, 1482–1490. doi: 10.1111/j.1095-8649.2006.01211.x
Copping A. E., Hemery L. G., Viehman H., Seitz A. C., Staines G. J., Hasselman D. J. (2021). Are Fish in Danger? A Review of Environmental Effects of Marine Renewable Energy on Fishes. Biol. Conserv. 262, 109297. doi: 10.1016/j.biocon.2021.109297
Coutant C. C., Zachman K. L., Cox D. K., Pearman B. L. (1984). Temperature Selection by Juvenile Striped Bass in Laboratory and Field. Trans. Am. Fish. Soc. 113, 666–671. doi: 10.1577/1548-8659(1984)113<666:TSBJSB>2.0.CO;2
CSAS (2018). Delineating Important Ecological Features of the Evangeline-Cape Blomidon-Minas Basin Ecologically and Biologically Significant Area (EBSA). Ottowa, ON: Fisheries and Oceans Canada.
Dadswell M. J., Spares A. D., Potter E., Porter D. (2020). Diversity, Abundance and Size Structure of Fishes and Invertebrates Captured by an Intertidal Fishing Weir at Bramber, Minas Basin, Nova Scotia. Proc. Nova. Scotian. Instit. Sci. 50, 283–318. doi: 10.15273/pnsis.v50i2.10003
Dedman S., Officer R., Brophy D., Clarke M., Reid D. G. (2015). Modelling Abundance Hotspots for Data-Poor Irish Sea Rays. Ecol. Model. 312, 77–90. doi: 10.1016/j.ecolmodel.2015.05.010
Dedman S., Officer R., Clarke M., Reid D. G., Brophy D. (2017). Gbm.auto: A Software Tool to Simplify Spatial Modelling and Marine Protected Area Planning. PLos One 12, e0188955. doi: 10.1371/journal.pone.0188955
Dormann C. F., Elith J., Bacher S., Buchmann C., Carl G., Carré G., et al. (2013). Collinearity: A Review of Methods to Deal With it and a Simulation Study Evaluating Their Performance. Ecography 36, 27–46. doi: 10.1111/j.1600-0587.2012.07348.x
Elith J., Leathwick J. R., Hastie T. (2008). A Working Guide to Boosted Regression Trees. J. Anim. Ecol. 77, 802–813. doi: 10.1111/j.1365-2656.2008.01390.x
Gerritsen J., Strickler J. R. (1977). Encounter Probabilities and Community Structure in Zooplankton: A Mathematical Model. J. Fish. Res. Bd. Can. 34, 73–82. doi: 10.1139/f77-008
Gillespie D., Palmer L., Macaulay J., Sparling C., Hastie G. (2021). Harbour Porpoises Exhibit Localized Evasion of a Tidal Turbine. Aquat. Conserv. 31, 2459–2468. doi: 10.1002/aqc.3660
Godo O. R., Samuelsen A., Macaulay G. J., Patel R., Hjollo S. S., Horne J., et al. (2012). Mesoscale Eddies are Oases for Higher Trophic Marine Life. PLos One 7, e30161. doi: 10.1371/journal.pone.0030161
Iverson S. J., Fisk A. T., Hinch S. G., Mills Flemming J., Cooke S. J., Whoriskey F. G. (2018). The Ocean Tracking Network: Advancing Frontiers in Aquatic Science and Management. Ocean. Track. Net.: Adv. Aquat. Res. Manage. 01, 1041–1051. doi: 10.1139/cjfas-2018-0481@cjfas-otn.issue01
Karsten R. H., Greenberg D., Tarbottom M. (2011). “Assessment of the Potential of Tidal Power From Minas Passage and Minas Basin,” in Final Report to OEER/OETR, Project Number 300-170-09-11. Halifax, NS: Offshore Energy Environmental Research Association (now Net Zero Atlantic).
Karsten R. H., McMillan J. M., Lickley M. J., Haynes R. D. (2008). Assessment of Tidal Current Energy in the Minas Passage, Bay of Fundy. Proc. Instit. Mechan. Eng. Part A.: J. Power Energy 222, 493–507. doi: 10.1243/09576509JPE555
Kendall V. J., Stewart P. L., Levy H. A. (2018). “Spatial and Temporal Delineation of Ecological Features of the Evangeline-Cape Blomidon-Minas Basin Ecologically and Biologically Significant Area (EBSA),” in DFO Canadian Science Advisory Secretariat Research Document 2018/013. Ottowa, ON: Fisheries and Oceans Canada.
Keyser F. M., Broome J. E., Bradford R. G., Sanderson B., Redden A. M. (2016). Winter Presence and Temperature-Related Diel Vertical Migration of Striped Bass (Morone Saxatilis) in an Extreme High-Flow Passage in the Inner Bay of Fundy. Can. J. Fish. Aquat. Sci. 73, 1777–1786. doi: 10.1139/cjfas-2016-0002
Locke J. G. (2009). X-Band Radar as a Site Assessment Tool in Minas Passage Vol. 119 (Wolfville, NS: Acadia University).
Nelson G. A., Chase B. C., Stockwell J. (2003). Food Habits of Striped Bass (Morone Saxatilis) in Coastal Waters of Massachusetts. J. Northwest. Atlantic. Fish. Sci. 32, 1–25. doi: 10.2960/J.v32.a1
Onoufriou J., Russell D. J. F., Thompson D., Moss S. E., Hastie G. D. (2021). Quantifying the Effects of Tidal Turbine Array Operations on the Distribution of Marine Mammals: Implications for Collision Risk. Renewable Energy 180, 157–165. doi: 10.1016/j.renene.2021.08.052
Paramore L. M., Rulifson R. A. (2001). Dorsal Coloration as an Indicator of Different Life History Patterns for Striped Bass Within a Single Watershed of Atlantic Canada. Trans. Am. Fish. Soc. 130, 663–674. doi: 10.1577/1548-8659(2001)130<0663:DCAAIO>2.0.CO;2
R Core Team (2021). R: A Language and Environment for Statistical Computing. (Vienna, Austria: R Foundation for Statistical Computing). Available at: https://www.R-project.org/.
Revelle W. (2022). Psych. Procedures for Personality and Psychological Research. (Evanston, Illinois, USA: Northwestern University). Available at: https://CRAN.R-project.org/package=psychVersion=2.2.3.
Rulifson R. A., McKenna S. A., Dadswell M. J. (2008). Intertidal Habitat Use, Population Characteristics, Movement, and Exploitation of Striped Bass in the Inner Bay of Fundy, Canada. Trans. Am. Fish. Soc. 137, 23–32. doi: 10.1577/T06-174.1
Sanderson B., Buhariwalla C., Adams M., Broome J., Stokesbury M., Redden A. (2017). Quantifying Detection Range of Acoustic Tags for Probability of Fish Encountering MHK Devices Vol. 27, 10. (Cork, Ireland: Proceedings of the 12th European Wave and Tidal Energy Conference).
Sparling C. E., Seitz A. C., Masden E., Smith K. (2020). “OES-Environmental 2020 State of the Science Report, Chapter 3: Collision Risk for Animals Around Turbines,” in US Department of Energy Office of Science and Technical Information. Washington, DC: US Department of Energy, 38 p. doi: 10.2172/1632881
Valavi R., Guillera-Arroita G., Lahoz-Monfort J. J., Elith J. (2021). Predictive Performance of Presence-Only Species Distribution Models: A Benchmark Study With Reproducible Code. Ecol. Monogr. 92, e01486. doi: 10.1002/ecm.1486
Viehman H., Hasselman D., Boucher T., Douglas J., Bennett L. (2019). “Integrating Hydroacoustic Approaches to Predict Fish Interactions With in-Stream Tidal Turbines,” in Report to the Fundy Ocean Research Centre for Energy, Project No. 300-208. Dartmouth, NS: Fundy Ocean Research Centre for Energy
Viehman H. A., Zydlewski G. B., McCleave J. D., Staines G. J. (2015). Using Hydroacoustics to Understand Fish Presence and Vertical Distribution in a Tidally Dynamic Region Targeted for Energy Extraction. Estuar. Coast. 38, 215–226. doi: 10.1007/s12237-014-9776-7
Wickham H., François R., Henry L., Müller K. (2021) Dplyr: A Grammar of Data Manipulation. R Package Version 1.0.7. Available at: https://CRAN.R-project.org/package=dplyr.
Keywords: species distribution analysis, tidal stream energy impact, acoustic telemetry, minas passage, boosted regression tree (BRT) models, striped bass (Morone saxatilis), encounter risk
Citation: Bangley CW, Hasselman DJ, Flemming JM, Whoriskey FG, Culina J, Enders L and Bradford RG (2022) Modeling the Probability of Overlap Between Marine Fish Distributions and Marine Renewable Energy Infrastructure Using Acoustic Telemetry Data. Front. Mar. Sci. 9:851757. doi: 10.3389/fmars.2022.851757
Received: 10 January 2022; Accepted: 17 May 2022;
Published: 26 July 2022.
Edited by:
Maria Grazia Pennino, Spanish Institute of Oceanography (IEO), SpainReviewed by:
Raul Vilela, BioConsult SH, GermanyCopyright © 2022 Bangley, Hasselman, Flemming, Whoriskey, Culina, Enders and Bradford. This is an open-access article distributed under the terms of the Creative Commons Attribution License (CC BY). The use, distribution or reproduction in other forums is permitted, provided the original author(s) and the copyright owner(s) are credited and that the original publication in this journal is cited, in accordance with accepted academic practice. No use, distribution or reproduction is permitted which does not comply with these terms.
*Correspondence: Charles W. Bangley, Q2hhcmxlcy5CYW5nbGV5QGRhbC5jYQ==
Disclaimer: All claims expressed in this article are solely those of the authors and do not necessarily represent those of their affiliated organizations, or those of the publisher, the editors and the reviewers. Any product that may be evaluated in this article or claim that may be made by its manufacturer is not guaranteed or endorsed by the publisher.
Research integrity at Frontiers
Learn more about the work of our research integrity team to safeguard the quality of each article we publish.