 Haejin Kim
 Naoki Hirose2
 Katsumi Takayama
- 1Marine Environmental Research Center, Korea Institute of Ocean Science and Technology, Busan Metropolitan City, South Korea
- 2Center for Oceanic and Atmospheric Research, Research Institute for Applied Mechanics, Kyushu University, Fukuoka, Japan
- 3Institute of Environmental Informatics, IDEA Consultants, Inc., Kanagawa, Japan
A substantial decrease in the dissolved oxygen (DO) concentration over the lower layers of the East/Japan Sea (EJS), including the deep and bottom waters (1500 to 2500 m and 2500 to 3500 m, respectively), has been reported during the last few decades. This study quantitatively explain the mechanisms underlying the long-term decline in the DO concentration of the EJS for the first time using a coupled physical-biogeochemical model. We demonstrated that the cessation of new water formation was a major factor underlying the long-term decline in the DO concentration over the lower layers, and its contribution exceeded the net decrease. In addition, our simulations confirmed that the enhanced primary production in the euphotic zone accompanying increases in organic matter exported to the lower layers accelerates the DO decline in a quantitative respect. It was accounted for 12% of the net DO change at the lower layers from 1980 to 2015. The enhanced primary production resulted from increases in available nutrients due to the intensified vertical mixing caused by the strengthened inflow transport through the Korea/Tsushima Strait. Physical activities such as vertical transport of oxygen from the central water increased the DO concentration of the lower layers, and offset 42% of the net decrease in DO concentration due to organic matter decomposition.
1 Introduction
Global warming has caused a decrease in the dissolved oxygen (DO) concentrations and an expansion of the DO minimum zones in the ocean interior, which may lead to changes in ocean productivity, trophic structure, and biogeochemical cycling (Keeling et al., 2010; Stramma et al., 2010; Falkowski et al., 2011; Schmidtko et al., 2017; Breitburg et al., 2018; Oschlies, 2021). The globally averaged decline in the DO concentration during the period from the 1970s to the 1990s was −0.93 ± 0.23 μmol kg−1 at depths from 100 to 1000 m (Helm et al., 2011), and the long-term trends in the DO concentration were greatly dependent on the geographic location (Keeling et al., 2010).
In particular, a rapid decline in DO concentration was observed in the bottom water (2000-2500 m to the bottom) of the East/Japan Sea (EJS) at a rate of −7.6 μmol kg−1 decade−1 between 1977 and 1998 (Gamo, 1999) and −4.6 to −4.7 μmol kg−1 decade−1 from 1961 to 2001 (Watanabe et al., 2003). Gamo (1999) predicted that the bottom water of the EJS would become anoxic after a few hundred years if DO concentration continues to decrease at the present tendency. This observational evidence indicates that more obvious responses to climate change occur in the EJS compared to the globally averaged condition. In addition, the EJS is considered a suitable ocean for identifying the signals of climate change as it is one of the lowest latitude seas where deep convection occurs (Sudo, 1986; Seung and Yoon, 1995). The topographic features and flows of main surface currents on the EJS are shown in Figure 1. In this region, the deep convection generally occurs as open-ocean convection in the northwestern part (dashed box in Figure 1), triggered by dense surface water associated with high salinity and low temperature.
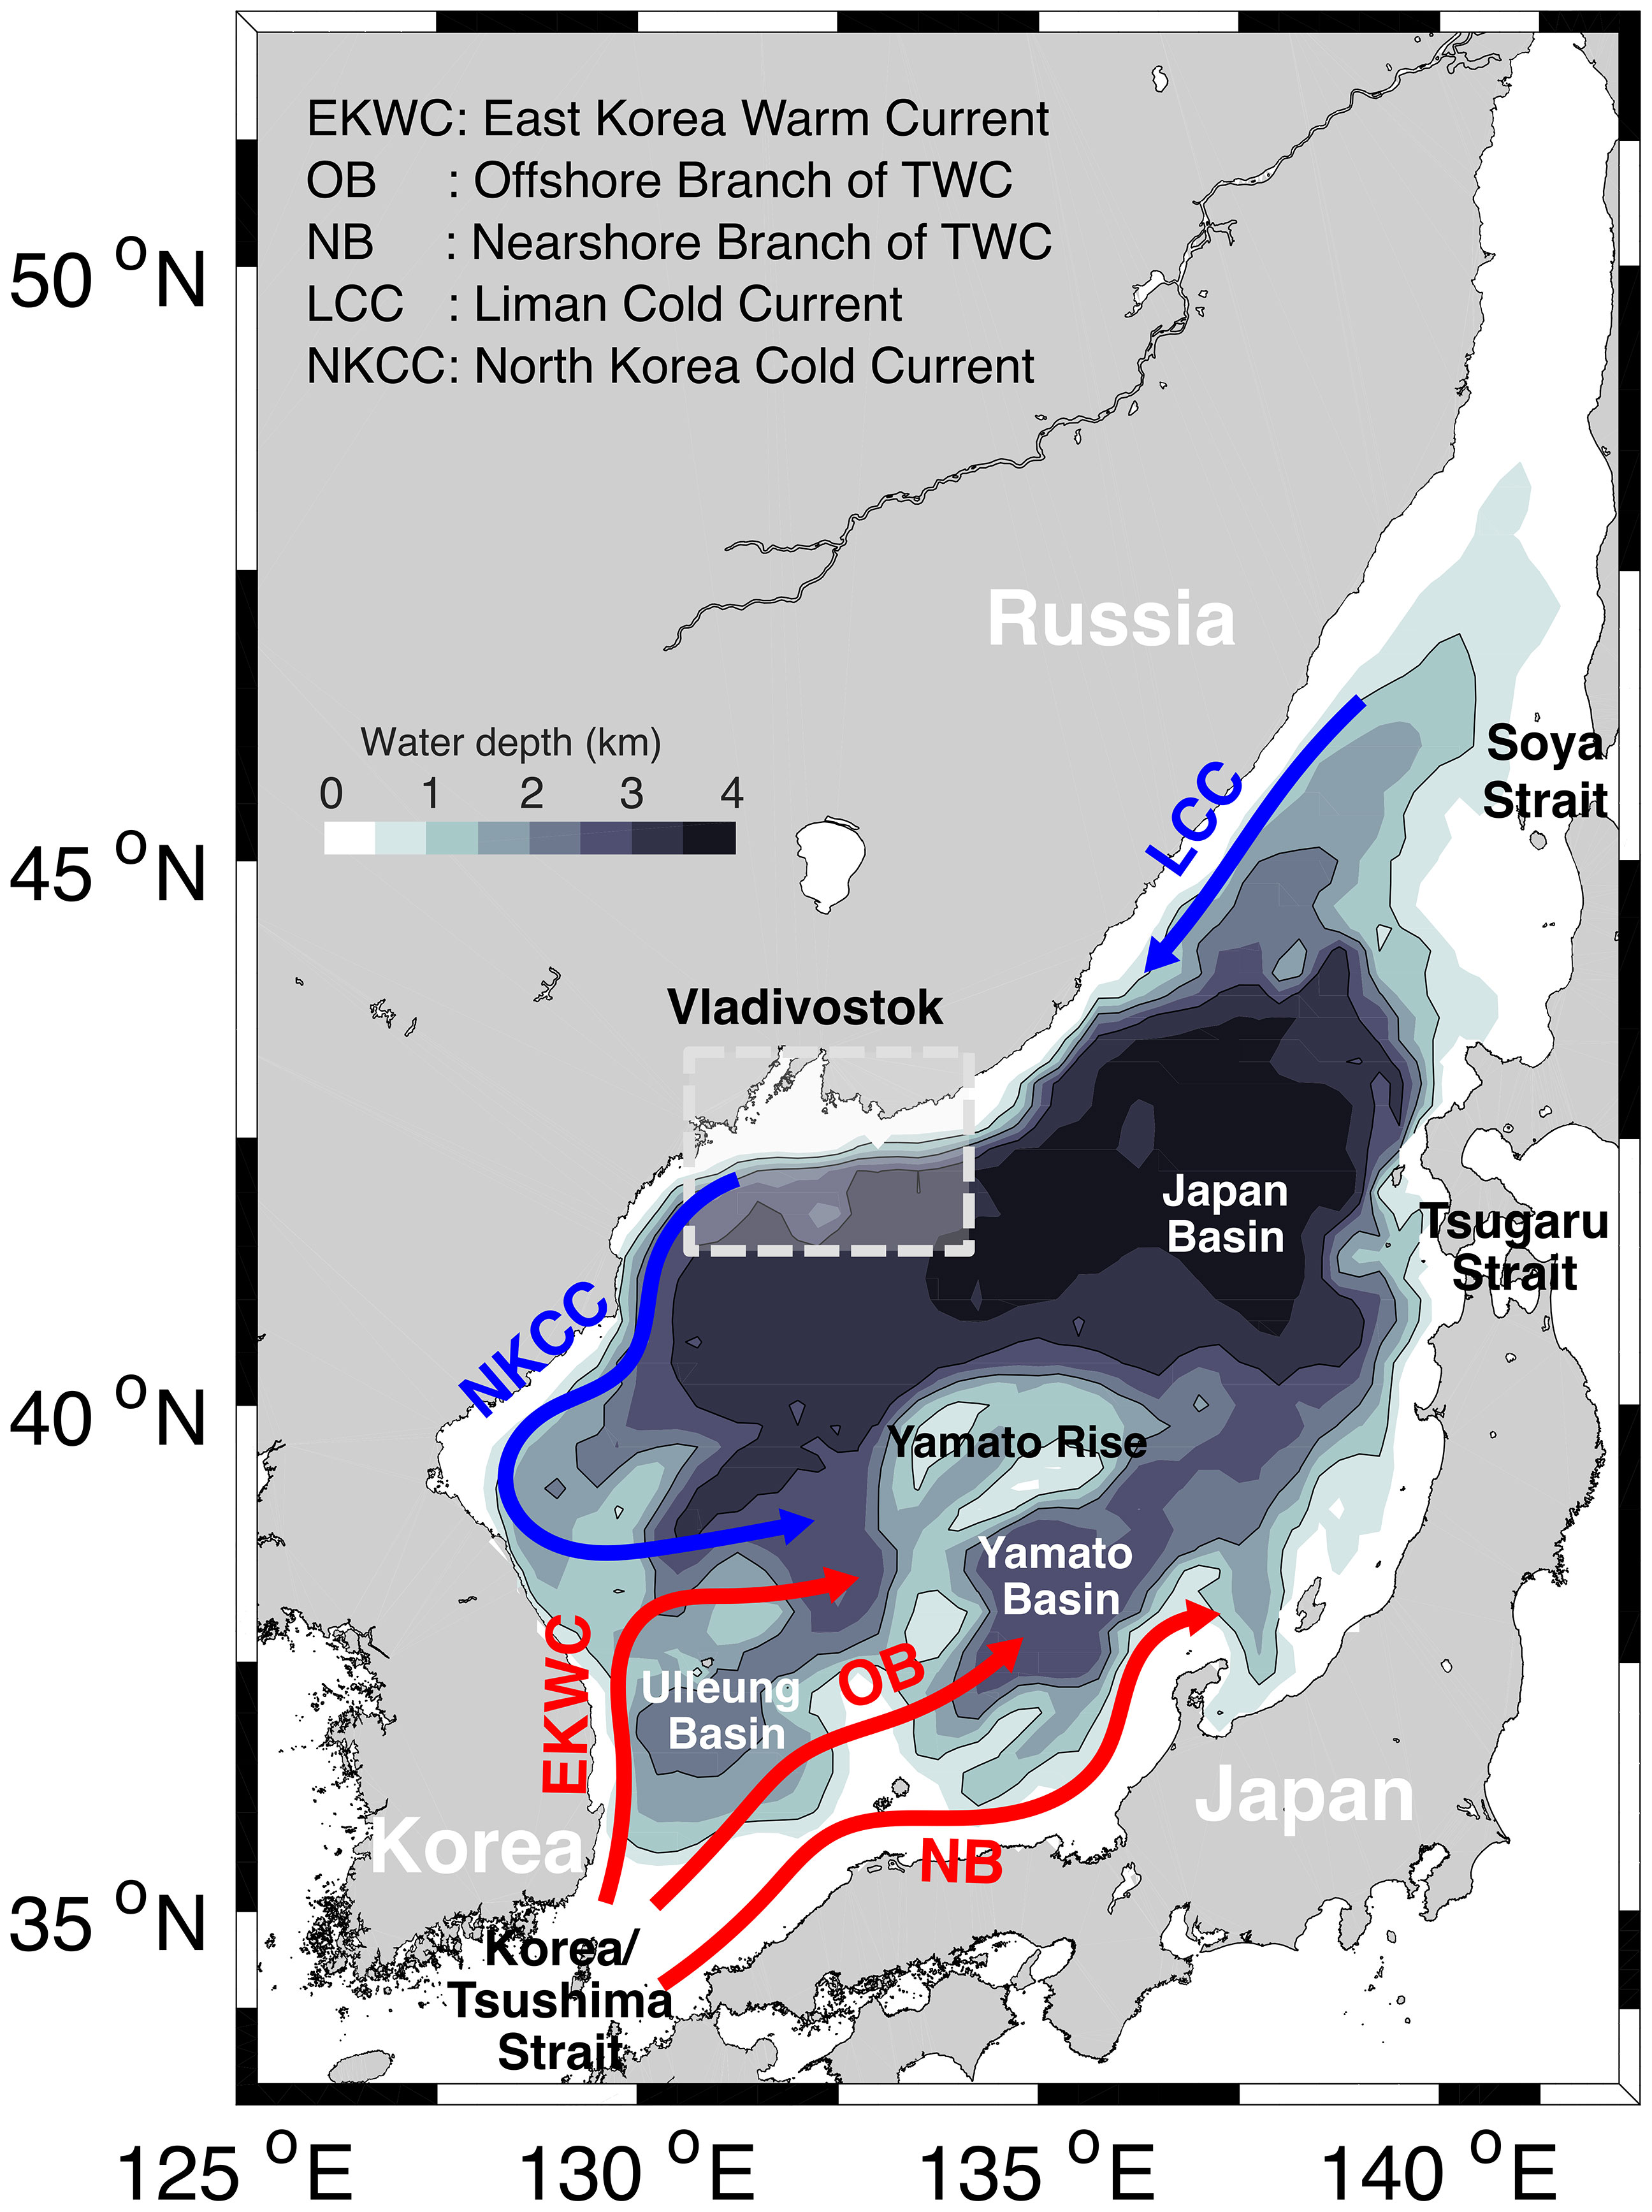
Figure 1 Bathymetry and a schematic major surface currents in the East/Japan Sea. The dashed-box indicates the area where deep convection occurs.
Many observational studies reported the long-term decreasing trend in the DO concentration of the bottom water in the EJS (e.g., Gamo et al., 1986; Chen et al., 1999; Minami et al., 1999; Kim et al., 2001; Gamo, 2011; Cui and Senjyu, 2012; Gamo et al., 2014). Gamo et al. (1986) suggested three possible causes for this decline in DO concentration: 1. Reduced or discontinued supply of new water mass from the surface to the deep and bottom layer attributed to the weakening of the ventilation system; 2. Increased amount of sinking organic matter due to the increase in biological production; and 3. Enhanced vertical mixing between the deep and bottom waters, which may increase the DO concentration of the deep water because typically the oxygen concentration in the bottom layer of the EJS is higher than that of the deep layer. However, because the DO concentration of the deep layer has also been shown to decrease by the measurement record, the third possibility was deemed as a negligible factor by Gamo et al. (1986).
The first possible cause, i.e., the discontinued supply of new water due to the weakening of the ventilation system, induces ongoing oxygen consumption of bottom water by the in situ decomposition of organic matter. Chemical tracer data indicate that changes in the conveyor belt, that is, bottom-water formation, are slowed down, while intermediate-water formation is enhanced (Gamo et al., 2001). Such changes, along with the other observational evidence like the decreased thickness of the bottom layer and the deepening of the DO minimum layer, render the first possibility the most reasonable explanation for the decreasing trend of the DO concentration (e.g., Gamo et al., 1986; Minami et al., 1999; Kim et al., 2001).
The increase in falling organic matter is caused by enhanced biological activities in the euphotic zone, which leads to the consumption of DO through organic matter decomposition in the lower layers. Gamo et al. (1986) were not regard the second possible reason as important for the decline in the DO concentration because surface chlorophyll-a (Chl-a) measurements from 1977 to 1984 did not show remarkable increases in surface primary productivity. However, during this time period, the data did not have sufficient temporal and spatial resolution to estimate biogeochemical environment changes of the EJS.
The influence of changes in biological environment has also not been considered in some numerical studies that predicted the long-term variability of DO concentrations in the EJS. Kang et al. (2004) reconstructed the structure of deep water masses of the EJS using a moving-boundary box model and suggested that the bottom water will not be anoxic, which is contrary to Gamo (1999), because the alteration in water structure would replace the bottom water. However, they allocated constant values for oxygen consumption in the lower layers without considering variations in the biogeochemical environment. Yoon et al. (2018) derived similar results as Kang et al. (2004) using a one-dimensional advection-diffusion model; however, they did not consider the long-term tendency of biological activities either.
However, in situ and satellite-based measurement datasets showed that obvious increases in the Chl-a concentration occurred at the surface layer of the EJS, although the periods of these datasets were not identical (Figure 2). The linear trends of each observation dataset are as follows: +0.25 (Moderate Resolution Imaging Spectroradiometer Aqua: MODIS Aqua; NASA, 2014a); +0.11 (MODIS Terra; NASA, 2014b); +0.02 (Sea-viewing Wide Field-of-view Sensor: SeaWiFS; NASA, 2014c); and +0.04 mg m−3 decade−1 (World Ocean Database 2013: WOD13; Boyer et al., 2013). Such changes in the biological environment of the upper ocean influence the lower layers through the settling of organic matter. The amount of organic materials exported from the surface plays a key role in regulating the extent of DO consumption by the decomposition process.
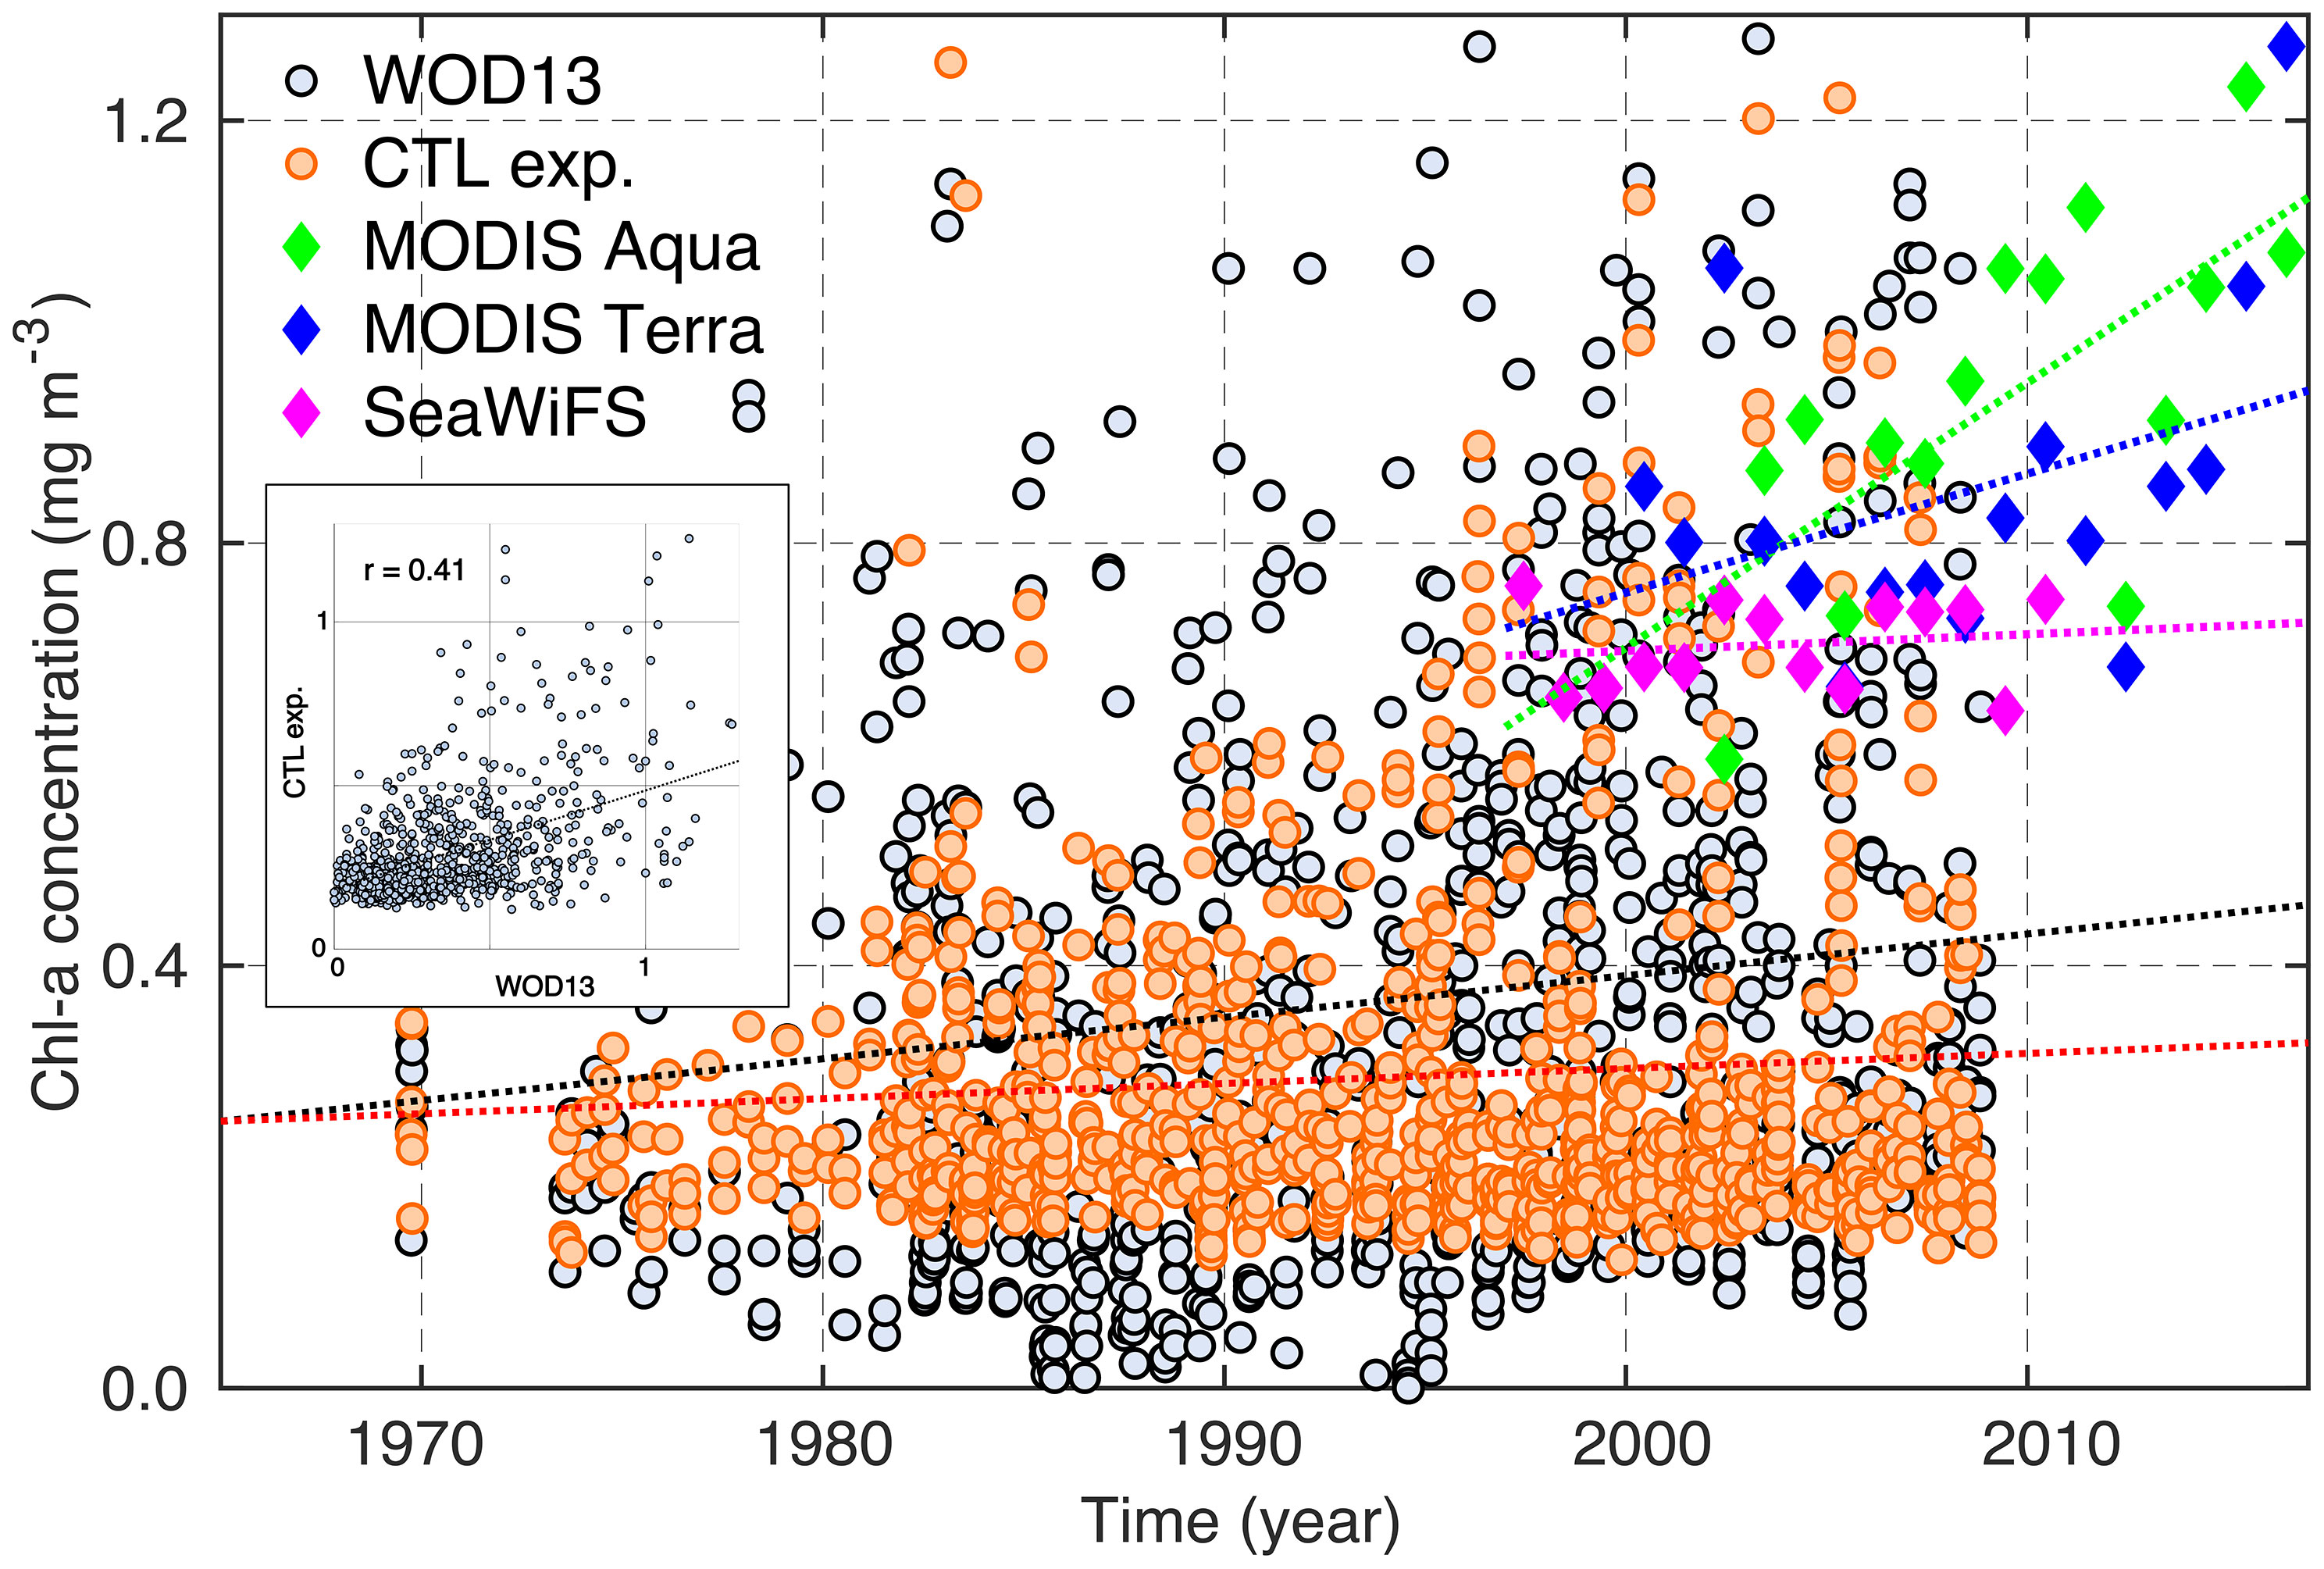
Figure 2 Time series of the surface chlorophyll-a (Chl-a) concentration. The orange circles indicate simulated Chl-a concentration values (the control experiment: CTL exp.), which were selected to correspond to the closest location and date relative to the in situ observation data (World Ocean Database 2013: WOD13). The gray circles and green, blue, and magenta squares show the in situ and satellite measurement data, respectively. The satellite data are represented by annual mean values. The dotted lines denote the linear regression lines of each dataset. The long-term tendencies of the Moderate Resolution Imaging Spectroradiometer (MODIS) Aqua, WOD13 and model data are statistically significant at the 95% confidence level (p < 0.05). The inset scatter plot compares the Chl-a concentration between the WOD13 and the CTL experiment.
A coupled physical-biogeochemical model reasonably represented the key processes of biological environments including photosynthesis, respiration, and decomposition of organic materials, and the spatial and seasonal distribution of the DO concentration in the upper layer of the EJS (Kim et al., 2019). This previous study contributes greatly to the realistic representation of long-term variations in the biogeochemical variables and the DO concentration in the lower layers. In this study, numerical modeling is performed to quantitatively examine the contributions of physical and biogeochemical causes with respect to the DO concentrations in deep and bottom waters. In particular, the mechanisms underlying recent variations in biological processes and their impact on the decline of DO concentrations are discussed.
2 Materials and Methods
2.1 Coupled Physical-Biogeochemical Model
A coupled physical-biogeochemical model was adopted to reveal the physical and biological influences on the decreasing trend of DO concentration shown in the lower layers. The RIAM Ocean Model (RIAMOM; Lee et al., 2003) developed at the Research Institute for Applied Mechanics, Kyushu University, is used as the physical model. A nitrogen-based lower-trophic (NPZD) model composed of dissolved inorganic nitrogen (DIN), phytoplankton (PHY), zooplankton (ZOO), and detritus (DET) is utilized to represent biogeochemical activities. The DO concentration incorporated in the NPZD model is determined by Equation 1. The detailed parameterization of each term of Equation 1 is described in Supplementary based on Kim et al. (2019). The unit of DO concentration in the coupled model is ml l−1 (1 ml l−1 = 1.428 mg L−1 = 43.537 μmol kg−1 = 44.661 mmol m−3).
The model domain is the northwestern Pacific (105°E–180°E, 15°N–63°N), with 1/4° spacing in the zonal direction and 1/5° spacing in the meridional direction, and it is divided into 38 layers in the vertical direction. Nitrogen deposition from the atmosphere was neglected in this model based on the sensitivity experiments of Onitsuka et al. (2009), who found that atmospheric nitrogen deposition contributes little (> 5% in the nearshore region along the Japanese coast and < 2% in the northeastern region) to the primary production. The coupled model was demonstrated to well represent the fundamental mechanisms of the biogeochemical environment in the upper EJS, such as photosynthesis and remineralization (Onitsuka et al., 2007; Kim et al., 2019).
The initial distributions of temperature and salinity were determined based on the climatological mean of the Four-dimensional Variational Ocean ReAnalysis for the Western Pacific (FORA-WNP30; Usui et al., 2017). The DO and DIN distribution in the initial state and at the southern and eastern boundaries (15°N and 180°E) was set to the monthly mean concentration from the World Ocean Atlas 2009 (WOA09). The PHY, ZOO, and DET concentrations in the initial state were uniformly distributed from the surface to 200 m layer with values of 0.1, 0.01, and 0.001 mmol m−3, respectively, and 0.001 mmol m−3 was given as PHY, ZOO, and DET concentrations for layers deeper than 200 m. And their boundary conditions are equal to the initial conditions.
The settings for the model and the parameters related to the biogeochemical processes are basically the same as those used in Kim et al. (2019), except for some experimental conditions. First, the Japanese 55-year Reanalysis (JRA-55; Kobayashi et al., 2015; Harada et al., 2016) data are used for the meteorological conditions instead of the older generation Japanese Meteorological Agency (JMA) reanalysis (JRA-25) used in Kim et al. (2019). Compared to JRA-25, JRA-55 uses an increased model resolution (T319: ~55 km vs TL106: ~110 km in JRA-25), a more advanced data assimilation scheme (4Dvar vs 3Dvar in JRA-25), and several additional observational data sources (Kobayashi et al., 2015). Second, we applied geothermal heating of 100 mW m−2 at the bottom layer deeper than 1000 m to improve the deep water circulation (Park et al., 2013). The introduction of geothermal heating improved the model reliability for the bottom mixed layer thicker than ~1000 m and long-term trends of temperature and DO concentration. Third, the initial conditions of the DO and DIN concentrations for the EJS were adjusted from a depth of 900 m to the bottom with consideration for several degrees of bias between the WOD13 and the preliminary simulation results.
Based on these conditions, the experiment was conducted from 1958 to 2015 and referred to as the control (CTL) experiment. Sections 3.1 to 3.3 address the results of the CTL experiment.
2.2 Sensitivity Experiments
We suggest physical and biological causes for the long-term decline in the DO concentration in the lower layers of the EJS. In order to quantitatively separate the causes, two sensitivity experiments were performed. The experimental conditions of the sensitivity experiments such as surface forcing, parameters are basically the same as those of the CTL experiment, but there are some differences.
The first possibility concerns only physical processes without biological activities; thus, it can be defined by the physical effect. The physical processes include air-sea gas exchange, advection, diffusion, and vertical mixing between the water masses as well as the oxygen supply from the upper layers. To identify the physical effect, a no-ecosystem (NE) experiment, that includes “Advection”, “Diffusion”, and “Exchange with the Atmosphere” in Equation 1 neglecting all biogeochemical processes, was first carried out. Thus, the NE experiment directly provides us with the physical contributions to DO variations, that is, the contributions of the physical effect.
Next, we discuss the DO changes attributed to the biological contribution. The amount of organic matters exported from the upper ocean regulates the extent of DO consumption by the decomposition process. The increased primary productivity shown in Introduction increases the detritus flux settling to the deeper layers, and which can be divided into mean and deviation terms. The mean detritus flux induces the annually constant biological decomposition and the deviation term results in the additional consumption of oxygen.
The decrease in the DO concentration caused by the deviation term of the detritus flux is ultimately due to the increasing trend of biological production in the upper ocean. To extract such biological effect exceeding the average, we simulated the constant detritus flux (CDF) experiment. The experimental conditions of the CDF experiment are identical with those of the CTL experiment, but it assumes that the amount of organic materials sinking to the lower layers is constant yearly. The climatological monthly mean distribution of the detritus concentration from 1975 to 1985 obtained by the CTL experiment was given for the CDF experiment within the euphotic zone (from the surface to a depth of 312 m) through a nudging technique. The difference between the CTL and CDF experiments represents the temporal variations in detritus flux. Thus, we can derive the impact of the additional detritus flux on the DO concentration by subtracting the results of the CDF experiment from that of the CTL experiment.
Of the total detritus flux that sinks into the deep layers, what remains after excluding the deviation term is the mean detritus flux. The bottom water formation of the EJS was reported to have been completely halted in the 1980s, which is also realistically represented by the model (see Section 3.1.2). In these environments, the DO concentration basically reduced by the decomposition of organic matters, that is, by the mean detritus flux. In other words, the oxygen consumption due to the annually constant influx of organic matter indicates the effect of cessation of new water formation. Thus, the contribution of discontinued ventilation defined as the difference between the CDF and NE experiment: this effect implies a sustained oxygen consumption by decomposition of organic matter (= CDF experiment) irrelevant to changes in oxygen concentration by physical contributions such as advection and diffusion (= NE experiment), in an isolated lower layer environment.
Here is the brief definition of the three causes underlying long-term decrease in DO concentration: 1. Physical effect indicates the influences of advection, diffusion, and air-sea gas exchange; 2. Increased biological productivity in the upper ocean induces “additional biological consumption” through the increase in sinking organic particles; and 3. Cessation of new water formation results in “constant biological consumption”. The contribution of the first cause is obtained from the NE experiment. The second and third biological possibilities are explained by the difference between the CTL and the CDF experiments, and the difference between the CDF and the NE experiments, respectively. The sensitivity experiments were performed from 1980 to 2015, when active deep convection was ceased. The results related to the sensitivity experiments will be given in Section 3.4.
3 Results
3.1 Evaluation of Model Performance
3.1.1 Biological Changes in the Upper Layer
To evaluate the performance of the model in terms of long-term changes in biological processes, we presented the Chl-a concentration of the CTL experiment in combination with the observation data (Figure 2). The model results were plotted selected the closest location and date for each in situ observation. The mean Chl-a concentration simulated in the CTL experiment was similar to that of in situ observations, whereas three satellite remote sensing retrievals showed higher concentrations. The large Chl-a concentration estimated from the satellite measurements may have been caused by ocean color algorithms. Reports indicated that the algorithms for satellite observation do not provide the Chl-a concentration accurately in the entire area of the ocean (Darecki and Stramski, 2004; Gómez-Jakobsen et al., 2016). The Chl-a concentration of the CTL experiment was enhanced similar to other measurement datasets, and its linear trend (+0.014 mg m−3 decade−1) was on the same order as that of the in situ observations. The comparison of Chl-a concentration between the WOD13 and the CTL experiment indicated a positive correlation of 0.41 (p < 0.05; scatter plot in Figure 2).
However, because surface changes in Chl-a are not representative of the biological production in the upper EJS with regard to the Chl-a maximum usually located in the subsurface layer (e.g., Rho et al., 2012), the long-term trend in the Chl-a concentration over the euphotic zone (0 to 100 m) was also investigated. Biological production was enhanced based on the long-term trend in the Chl-a concentration within the euphotic zone of both the observation and model (WOD13: +0.019, CTL experiment: +0.002 mg m−3 decade−1). The simulated Chl-a inventory over the EJS increased by 1.25 mg m−2 from 1980 to 2015 (= 0.36 mg m−2 decade−1) in the euphotic zone (0 to 110 m).
3.1.2 Deep Convection
As one of the lowest latitude seas where deep convection occurs, realistic representations of winter convection are essential for discussing the long-term variation over the deep layers in the EJS. Winter deep convection can induce fluctuations in the trends of DO or DIN concentrations through the direct supply of surface water. According to observational studies, the ventilation system of the EJS started to slow down in the 1960s or earlier and bottom-water formation eventually completely halted in the 1980s (e.g., Chen et al., 1999; Minami et al., 1999; Kim et al., 2002; Kang et al., 2003).
To confirm the performance of the model in terms of ventilation variations, we calculated the total volume of new water formation caused by open-ocean convection exceeding a depth of 2000 m. New water formation occurred in 1961, 1969, and 1970, and then it completely halted. The total volume of new water was 1.8×10⁹, 1.8×10¹², and 1.1×10¹² m3 in 1961, 1969, and 1970, respectively. The volume of new water was obtained by multiplying the extent of the grid and the thickness of the surface layer whenever the mixed layer exceeds 2000 m. These values present a comparable magnitude to the calibrated estimation: the estimate of the annual new bottom water volume calibrated with CFC-11 and tritium is approximately 0.02 Sv (~ 6.3×10¹¹ m3) in the early 1950s when ventilation was active (Kang et al., 2003). The model represented the slow-down of the ventilation system since the 1980s, which is consistent to the observational reports. The model-simulated mean maximum depth of winter mixed layer was approximately 516 m from 1980 to 2015; thus, new water has generally not been supplied to the deep and bottom waters since 1980.
The deep convection by brine rejection, i.e., the so-called “slope convection”, could not be embodied by the present model because the model does not consider ice formation. However, the volume of the new bottom water, based on the extent and thickness of the formation area of the new water, generated by the slope convection episode in the winter of 2000 to 2001 is deemed to not a great bulk (Senjyu et al., 2002). The estimate of the new water volume is approximately 7.2×10⁸ m3, which corresponds to 0.03% of the annual bottom water formation in the early 1950s, when ventilation was active (Kim et al., 2002). Tsunogai et al. (2003) suggested that 3% of the total volume of bottom water is substituted by surface water because of this episode. Therefore, the new water supplied by slope convection can be considered negligible because the concentrations of biochemical tracers presented limited changes.
3.1.3 Long-Term Trend in the Lower Layer
The comprehensive review of Kim et al. (2004) and Yoon et al. (2018) showed that the water masses of the EJS can be roughly classified as deep water (DW) from 1500 to 2500 m and bottom water (BW) from 2500 to 3500 m. Based on these studies, we examine the model performance with a focus on the long-term variation and properties of the lower layer (from 1500 m to the bottom) covering the deep and bottom waters. The realistic representation of the physical and biogeochemical environments, especially in the temperature, salinity, chlorophyll, and DIN concentrations, in the near-surface layer was demonstrated in a previous study (Kim et al., 2019).
The performance of the model was evaluated by comparing the long-term variations in temperature, salinity, DO, and DIN concentration with WOD13 at depths from 1500 m to the bottom (Figure 3). The simulation results were selected at the closest date and location to each observed record. The observed temperature in the lower layer of the EJS has increased by 0.017°C decade−1 during the last four decades (Figure 3A). The acceleration of temperature since the 1990s is also found in the EJS by the measurements as a signal of global warming (e.g., see Figure 3.2b in Chapter 3 of the IPCC, 2013). Although the model slightly underestimates the increasing trend in temperature (0.007°C decade−1), it is believed to be acceptable given that generating an exact representation of the deep ocean environment is difficult.
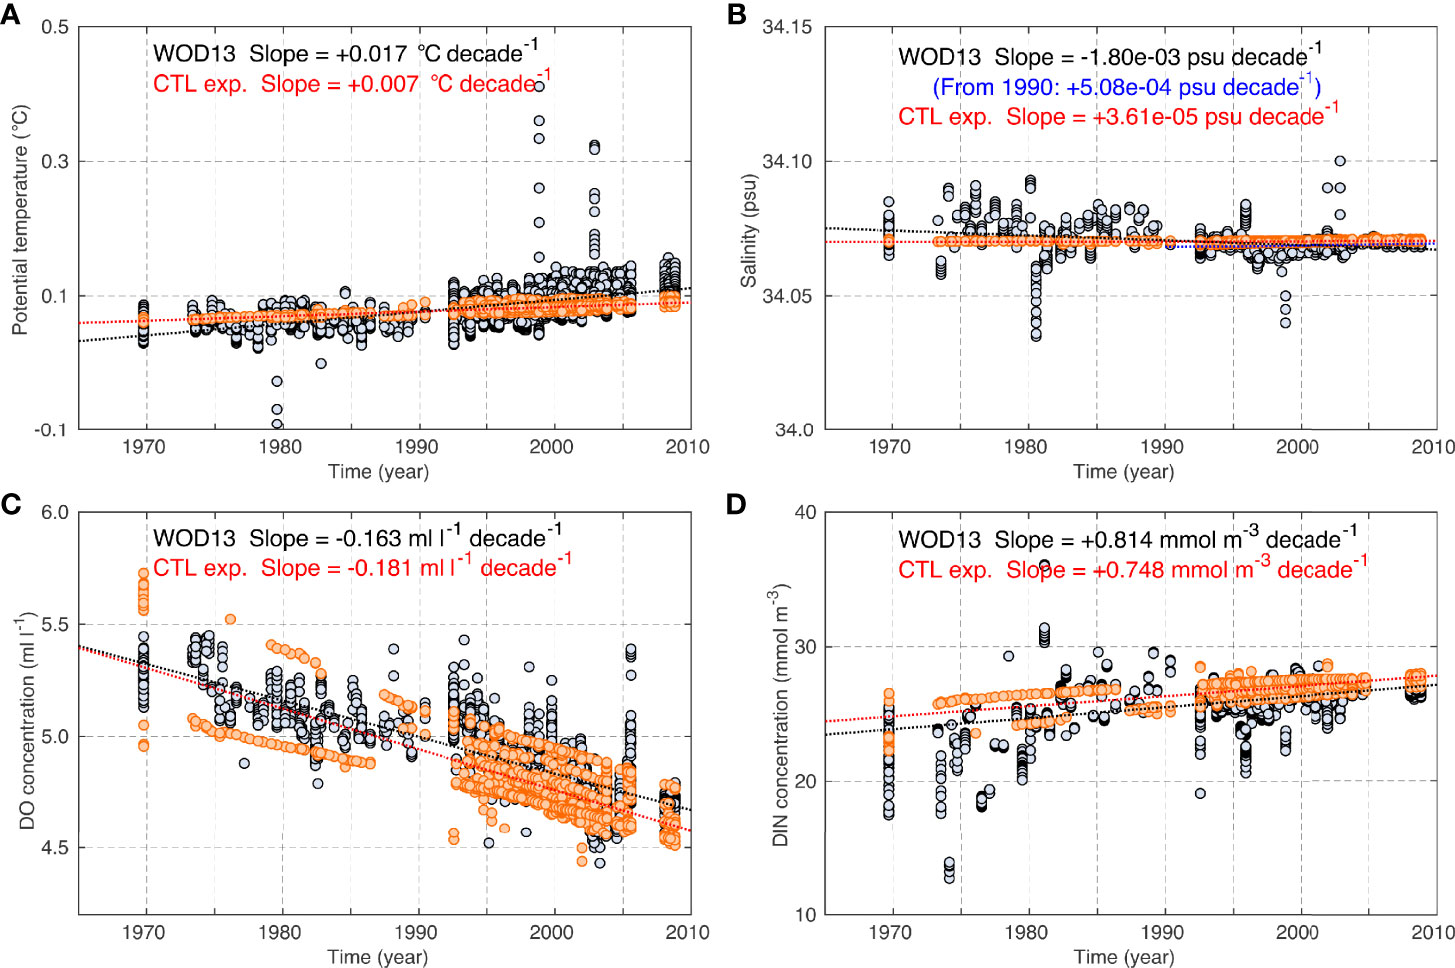
Figure 3 Long-term variation in (A) temperature, (B) salinity, (C) dissolved oxygen (DO) concentration, and (D) dissolved inorganic nitrogen (DIN) concentration at depths from 1500 m to the bottom. The gray and orange circles indicate the observation data and results of the control (CTL) experiment, respectively. The dotted lines denote the linear regression lines of each dataset. All linear trends were statistically significant at a confidence level of 95% (p < 0.05).
The mean salinity of the model (34.07 psu) is the same as that of the WOD13 dataset for the lower layer (Figure 3B). Mild decreasing and increasing trends in salinity are observed in the measured data (−1.8×10⁻³ psu decade−1) and model results (+3.6×10⁻⁵ psu decade−1) for the entire observation period. The salinity observation records from the 1960s to 1980s lack credibility due to their wide distribution. The measured salinity increased from 1990 to 2010 (+5.1×10⁻⁴ psu decade−1), which is represented by the blue dotted line in the figure. Based on this evidence, our model appropriately represents the long-term variation in the physical characteristics in the lower layer of the EJS.
Observation data indicated that the DO concentration in the lower layer steadily decreased at a rate of −0.16 ml l−1 decade−1 (Figure 3C). The modeled long-term DO concentration trend (−0.18 ml l−1 decade−1) presented the same order as the observed trend. Moreover, the modeled increasing DIN concentration (+0.75 mmol m−3 decade−1) was similar to the observations (+0.81 mmol m−3 decade−1; Figure 3D).
The modeled long-term variations were comparable to observed variations in both physical and biogeochemical environments from 1970 until recent years. This finding implies that the spin-up of the model was completed in the 1970s. Therefore, we will mainly cover the model results after 1980.
3.2 Mean and Changes in DO Concentration of the CTL Experiment
In this study, the model-defined DW and BW correspond to the depths from 1618 to 2250 m and from 2250 m to the bottom, respectively, in accordance with the vertical grid thickness of the model. The DO concentration was generally higher in the BW than in the DW (average concentrations were 4.95 and 4.88 ml l−1, respectively). This vertical structure results from a more vigorous detritus decomposition process in the DW than in the BW. The biological consumption decreases as the detritus concentration decreases with increasing depth. The DO concentration consistently decreased from 1980 to 2015. The reduction in the DO concentration over the 36-year period was 0.686 and 0.687 ml l−1 in the deep and bottom waters, respectively. The decreasing trend in the DO concentration of the BW reproduced by the model (0.19 ml l−1 decade−1) was almost the same scale as that of the observation data (0.17 ml l−1 decade−1) reported by Gamo (1999).
The spatial distribution of the mean and net changes in DO concentration over the 36-year period is shown in Figure 4. In both DW and BW, the mean DO concentration is high in the Japan Basin and decreases as distance increases (Figures 4A, B). During the last few decades, the DO concentrations decreased in the entire area of the EJS in both deep and bottom waters (Figures 4C, D). The decreasing tendencies are noticeable around the Japan Basin, but weaker further away.
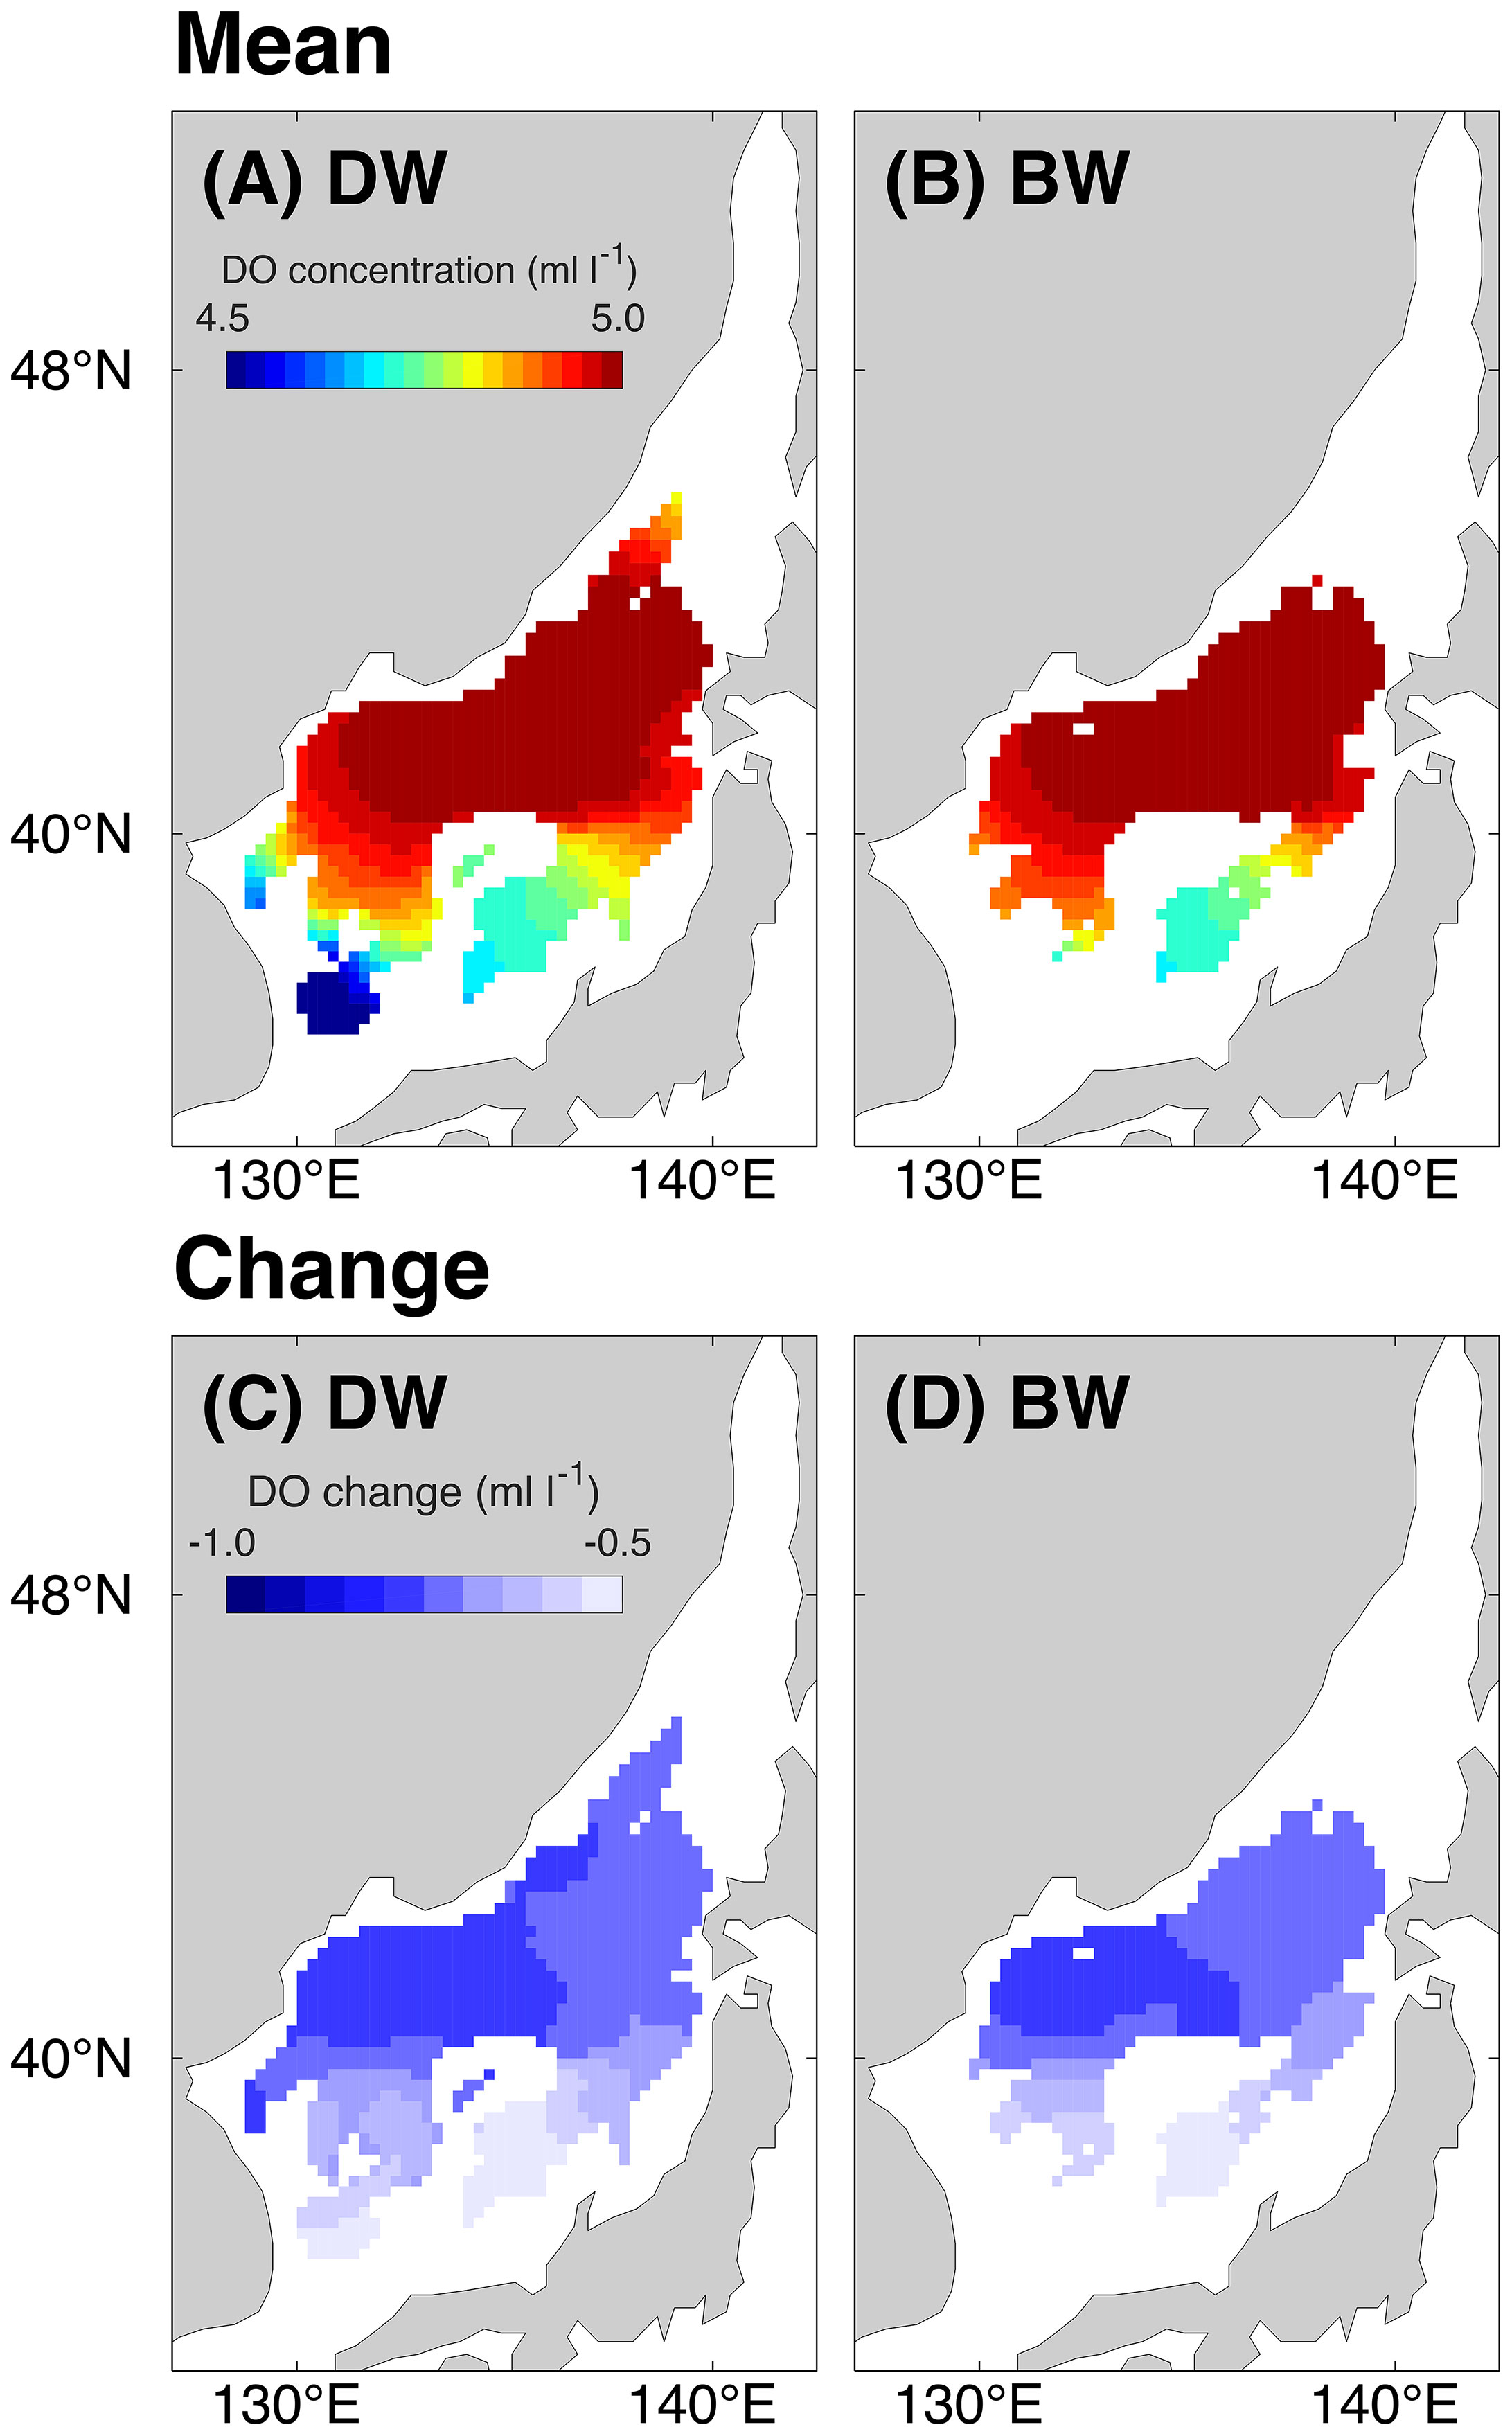
Figure 4 Spatial distribution of the mean dissolved oxygen (DO) concentration (upper panel) and its changes (lower panel) for the 36-year period (1980 to 2015) of the control (CTL) experiment in the depth range from (A, C) 1618 to 2250 m (deep water: DW) and (B, D) 2250 m to the bottom (bottom water: BW).
We firstly identify the mechanisms of the increased biological production in the upper layer in the Section 3.3. In the Section 3.4, the physical and biological effects on the decline in DO concentration of the lower layers are quantitatively evaluated. Additionally, the spatial pattern underlying the net decrease in DO concentration will be explained separately for each causal factor.
3.3 Mechanisms Underlying Enhanced Biological Production
The enhanced biological production in the upper EJS was confirmed by the observed and simulated results. In the EJS, the nutrient environment, which is one of the main control factors for biological activities, responds sensitively to the vertical processes attributed to vertical mixing, lateral upwelling, eddies and so on. These processes can be altered by the inflow transport through the Korea/Tsushima Strait, which refers to the Tsushima Warm Current (TWC) characterized by warm and saline water. The intensity of the inflow of the TWC and its migration route in the EJS changes the vertical transport of nutrients by modifying the physical environment of the upper ocean. The changes in TWC also affect the amount of nutrients advected directly from the external sea, but it is generally effective around the Korea/Tsushima Strait.
Therefore, we investigated the underlying mechanisms of the increased biological production, mainly focusing on changes in the inflow of TWC based on the results of the CTL experiment. We found an interesting change in TWC in the simulation results. Figure 5A indicates the spatial distribution of the linear trend of annual mean current speed averaged from the surface to 110 m depth and the mean current vector to understand the current system. The spatial pattern of the linear trend in current speed obtained by the model indicates that the TWC was enhanced in recent decades (Figure 5A). The interesting findings are the strengthening of the offshore branch (OB) and the East Korean Warm Current. The flow of the OB was altered so that it concentrated offshore.
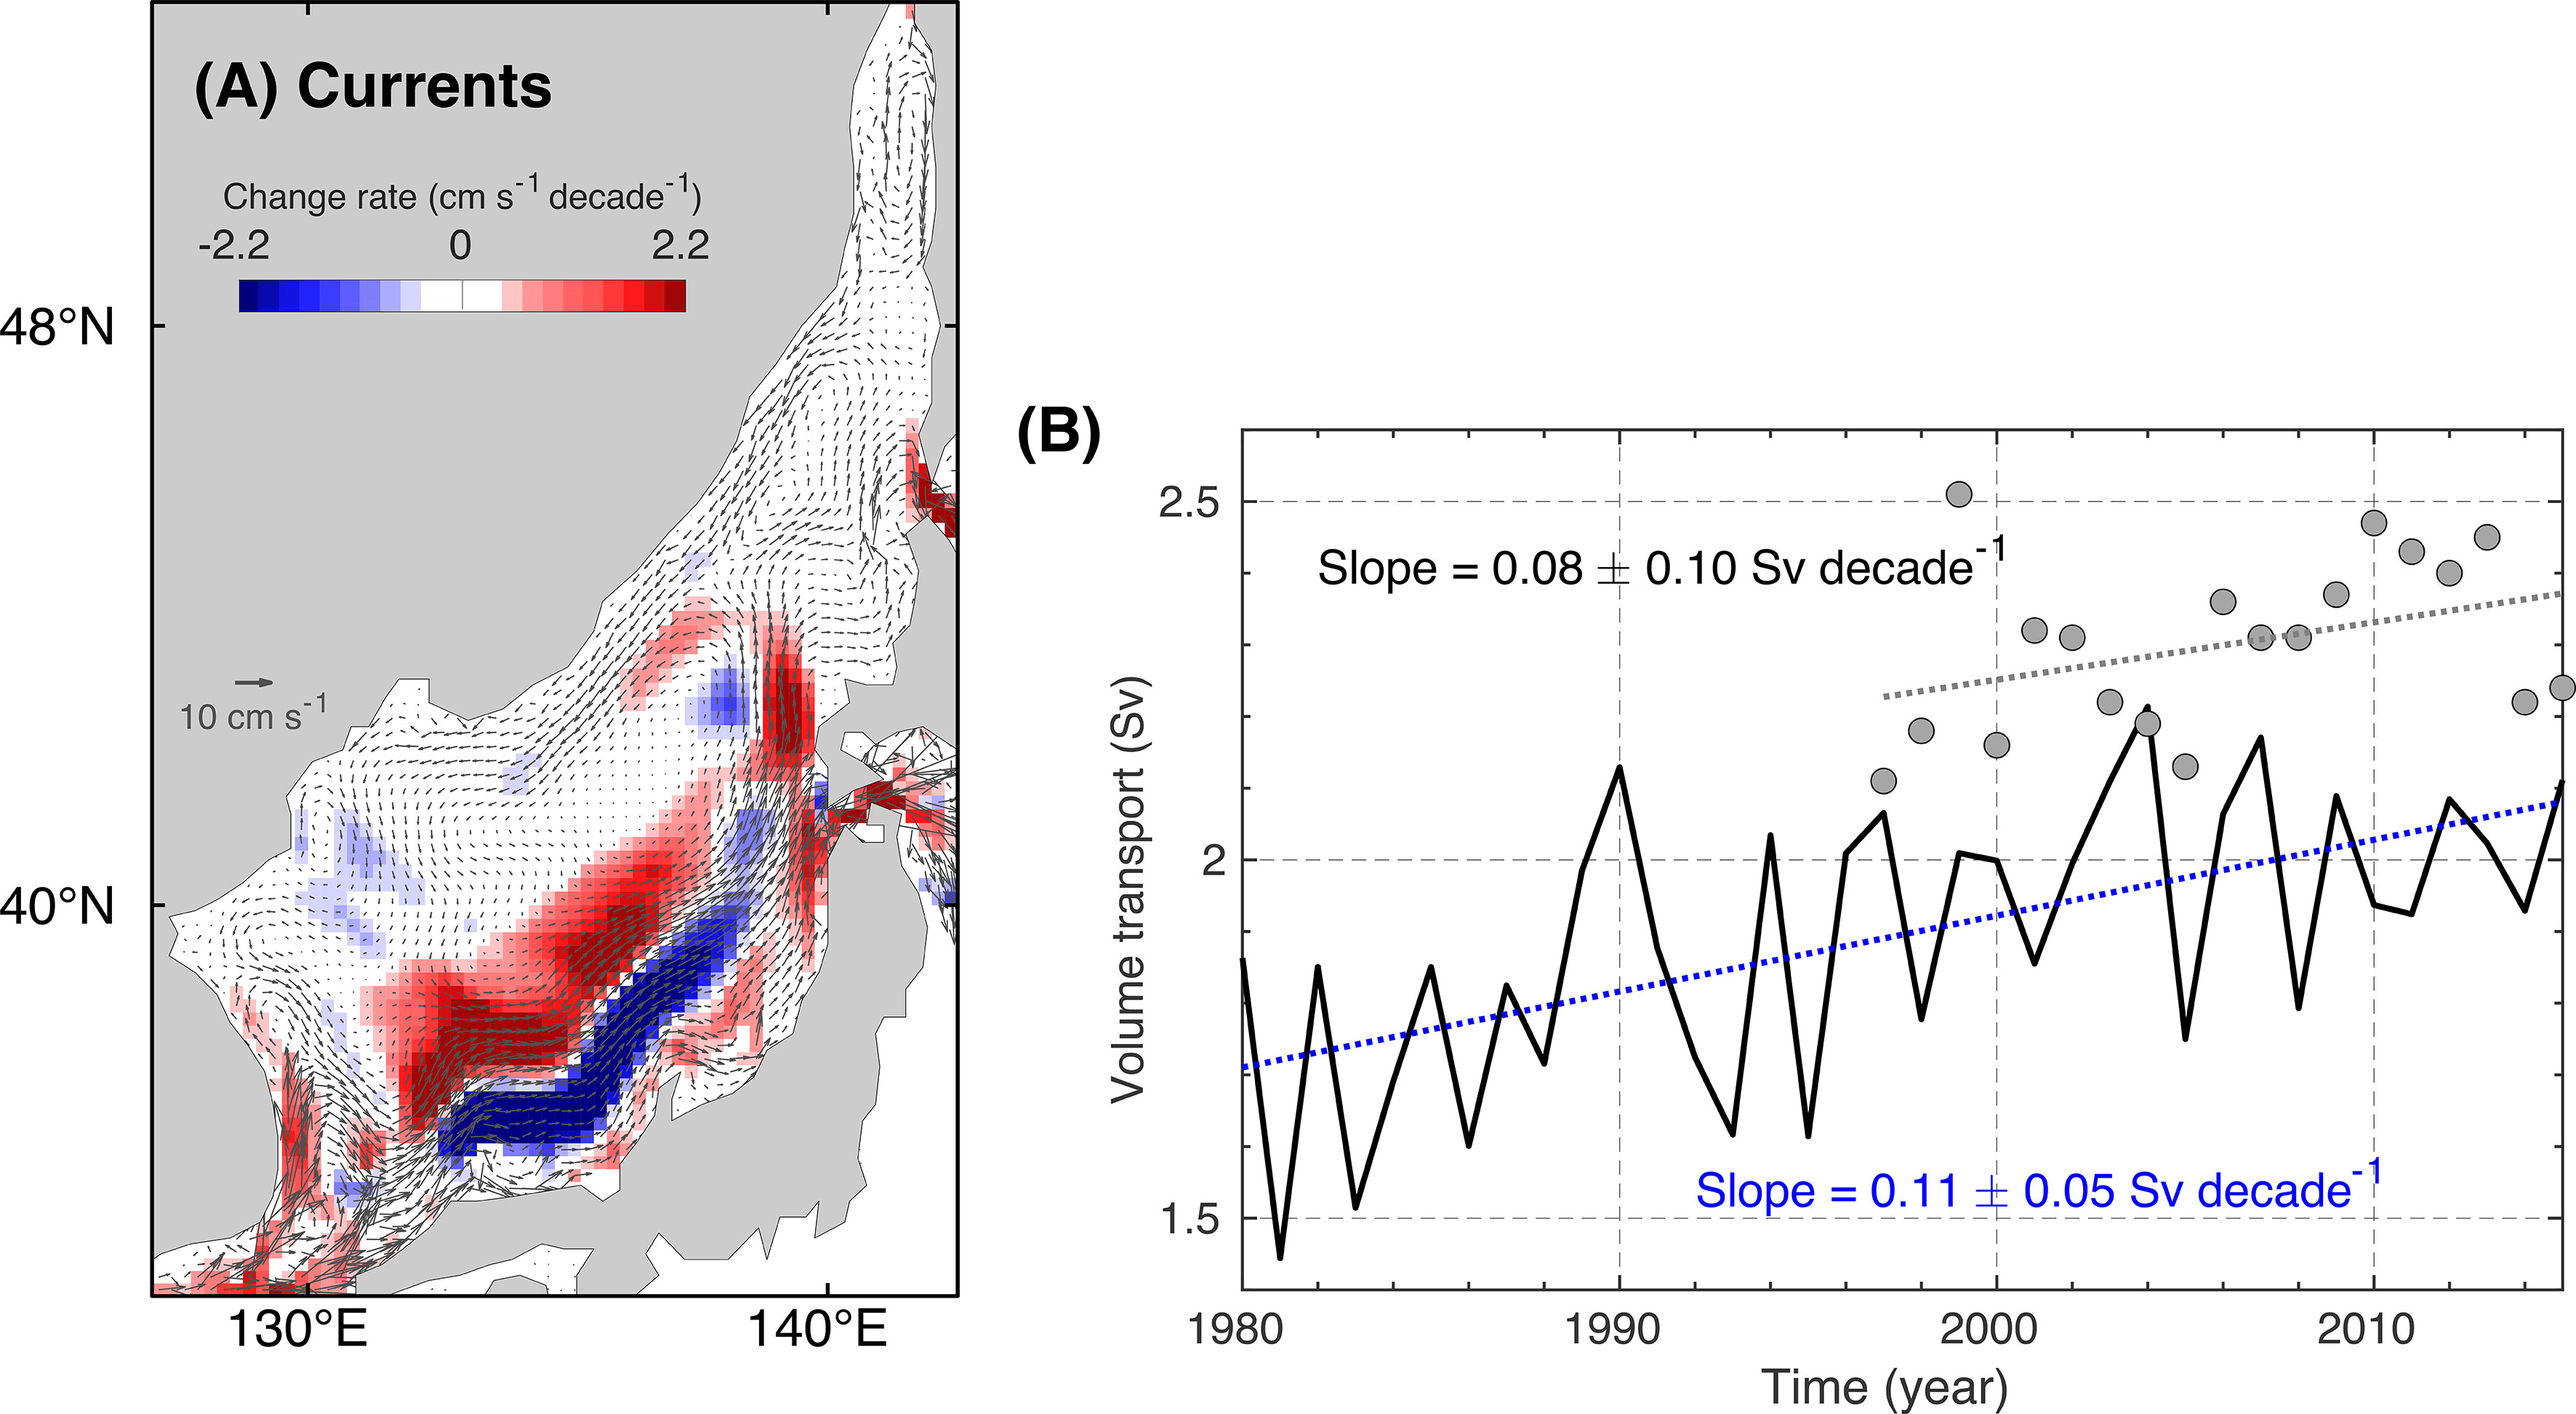
Figure 5 (A) Spatial distribution of the linear trend in current speed (color) of the 36-year period (1980 to 2015). The vector indicates the mean current. (B) Time series of the volume transport through the Korea/Tsushima Strait obtained from the model (solid line) and the direct measurements by the Acoustic Doppler Current Profiler (circles).
Previous observational reports also support our finding that volume transport increased from the 1990s to 2000s (Takikawa and Yoon, 2005). Kida et al. (2020) also reported that a long-term increasing trend in the transport of the EJS throughflow based on sea-level differences across the Korea/Tsushima Strait. Furthermore, an increasing trend was found in the volume transport estimated from the current data provided by the Acoustic Doppler Current Profiler (ADCP) at the Korea/Tsushima Strait for recent years (1997 to 2012), which is consistent with the results calculated from the model (Figure 5B). The observation and simulated results showed increases in volume transport of 0.08 ± 0.10 and 0.11 ± 0.05 Sv decade−1, respectively.
The strengthening of the TWC led to changes in the physical conditions in the upper ocean accompanied by biogeochemical variations. The intensification of the TWC led to increases in temperature and salinity over the path of the OB in the EJS (Figures 6F, G), and these changes were associated with the high temperature and high salinity of the TWC (Figures 6A, B). The increase in salinity deepened the mixed layer depth (MLD) in winter along the OB by increasing surface density (Figure 6H), even though the temperature increased. The MLD in the OB area has deepened more than 10 m from the average depth about 100 m (Figure 6C).
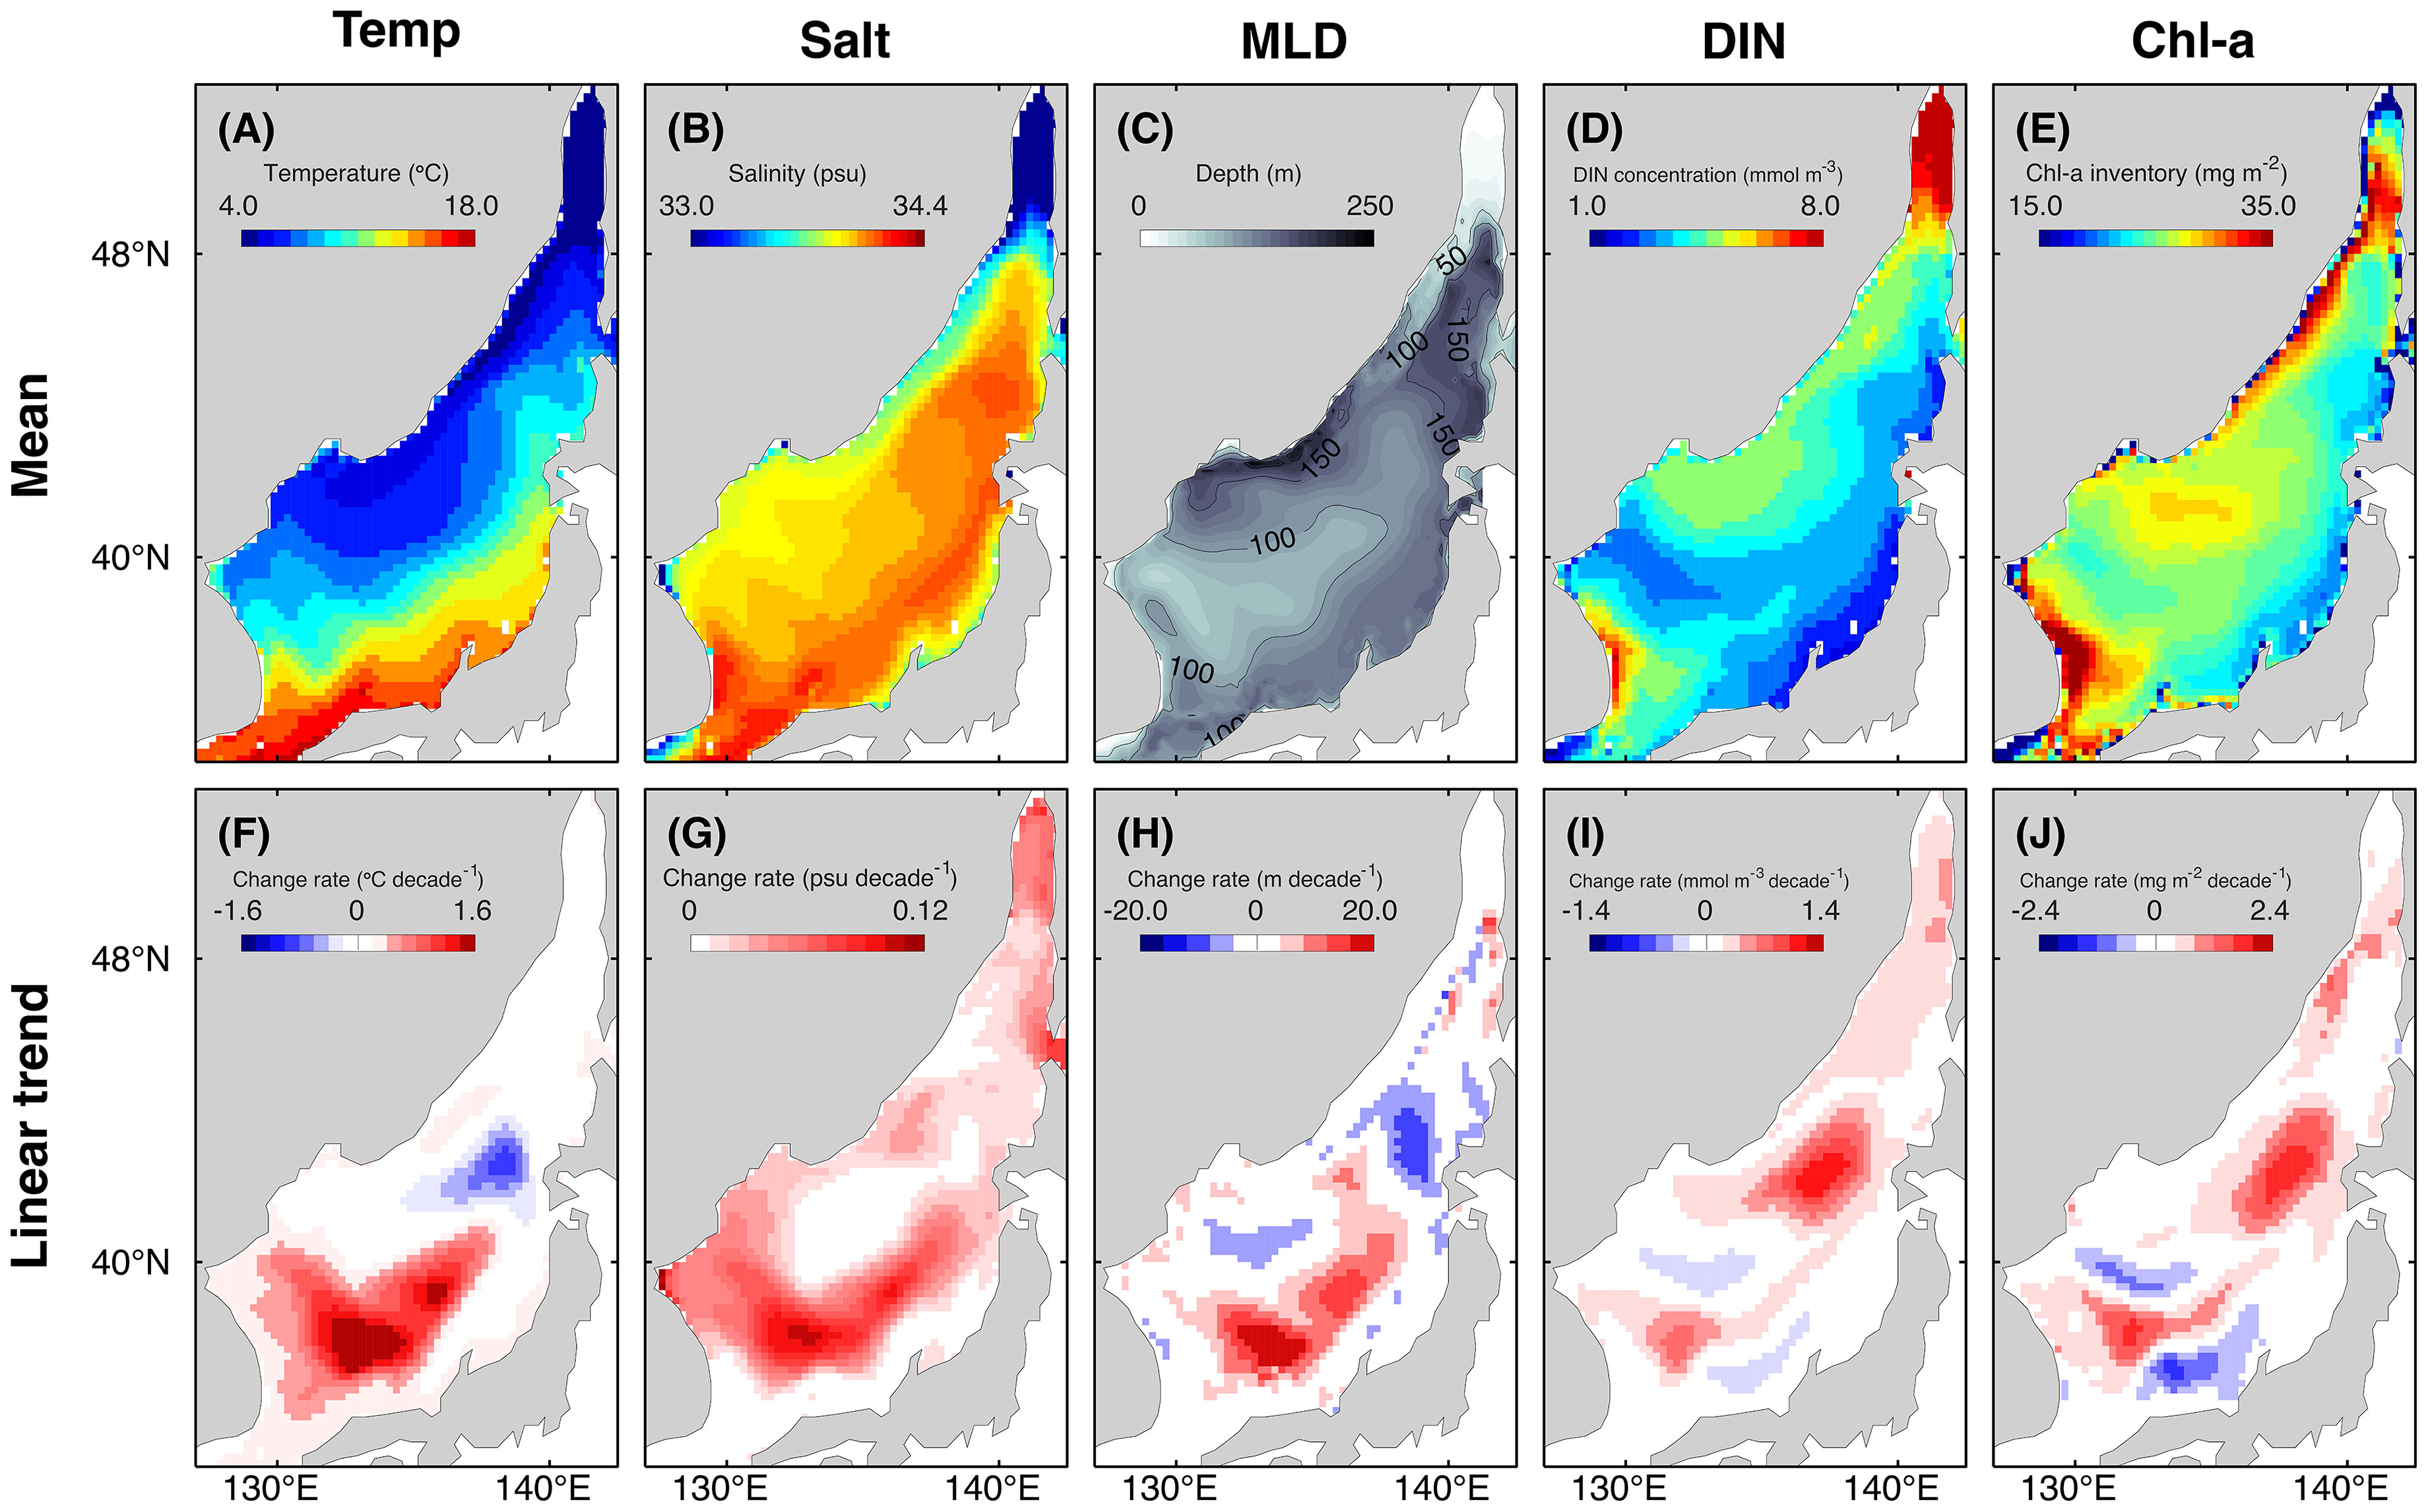
Figure 6 Spatial distributions of the mean (upper panel) and linear trends (lower panel) of the control (CTL) experiment over the 36-year period (1980 to 2015): (A, F) temperature, (B, G) salinity, (C, H) mixed layer depth (MLD), (D, I) dissolved inorganic nitrogen (DIN) concentration, and (E, J) chlorophyll-a (Chl-a) inventory. Temperature, salinity, DIN and Chl-a patterns indicate the annual mean and are averaged from the surface to a depth of 110 m. The spatial patterns of the mean and linear trend of the MLD denote the average in the winter season.
The nutrients laterally advected from the external sea is almost consumed before they passing through the TKS (Figure 6D), thus the DIN distribution in the EJS is generally determined by vertical processes. The DIN is typically sufficient in the northern Japan Basin due to the deep MLD, and is also high along the eastern coast of Korea associated with lateral upwelling (Figure 6D). MLD development induced the increase in DIN concentration along the OB (Figure 6I). It is attributed to that the enhanced vertical mixing enhances the supply of DIN from the intermediate to the upper layer. The increased DIN concentration in the central part of the cyclonic gyre (i.e., northern part of the Japan Basin) results from the intensification of upwelling due to the strengthening of the cyclonic eddy. A distinct increase in the DIN concentration of the surface water over the last several decades has also been reported in observational studies (Kim et al., 2011; Kim et al., 2013; Kim et al., 2014).
The regional distribution and long-term tendency of the Chl-a concentration are consistent with those of the DIN concentration (Figures 6D, E, I, J). The Chl-a inventory and the DIN concentration over the EJS have a high positive correlation, with a correlation coefficient of 0.85 (p < 0.05). The correlation between the Chl-a inventory and water temperature or solar radiation was not significant.
In summary, the recent increase in the influx of Tsushima warm water has altered the physical conditions to warmer and more saline upper EJS. Thus, it enhanced the available nutrients in the upper ocean by intensifying vertical mixing, with the abundant nutrients enhancing photosynthetic production. The long-term improvement in biological productivity was closely related to the amount of nutrients rather than the water temperature or solar radiation.
3.4 Physical and Biological Factors Underlying Long-Term Decreases in DO Concentration
Here, we discuss three causes underlying long-term decrease in DO concentration in the deep and bottom layers: 1. Physical effect including advection, diffusion, and air-sea gas exchange; 2. Effect of the increased organic particles inflowed from the upper ocean; and 3. Impact of cessation of new water formation (leads to the sustained biological consumption). The influences of one physical and two biological factors are described by the NE experiment, the difference between the CTL and the CDF experiments, and the difference between the CDF and the NE experiments, respectively.
3.4.1 Physical Effect (= NE Experiment)
Figure 7A shows the long-term variation in the DO concentration of the NE experiment in the deep and bottom layers. The DO concentrations by the physical processes without biological decomposition tend to increase gradually in the lower layers, and the increasing trend is more distinct in the upper part. The vertical structure of the DO concentration in the beginning, which was low in the DW and high in the BW, was reversed without considering biological consumption.
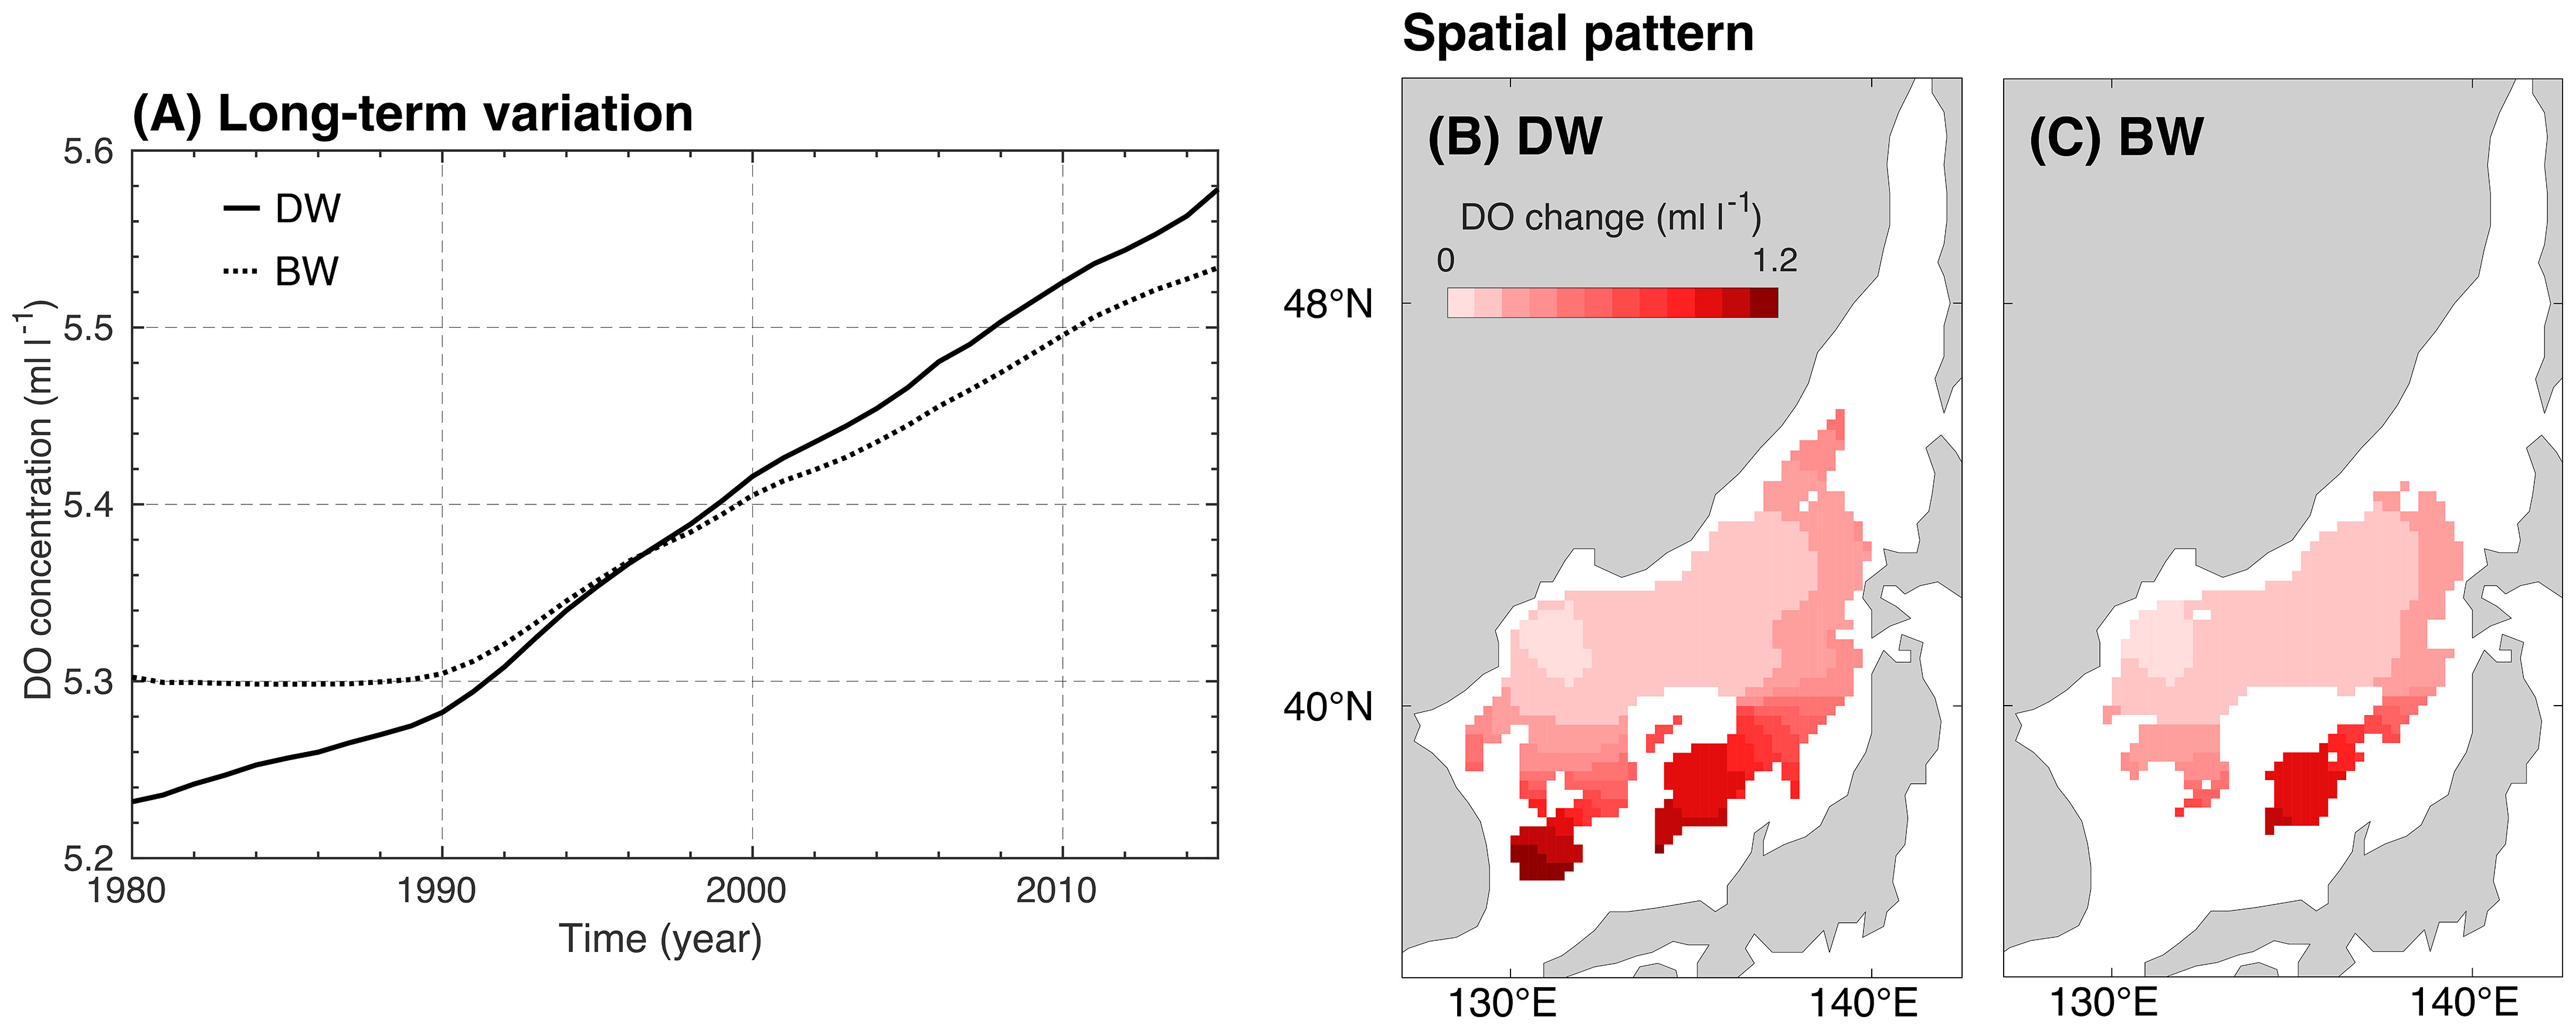
Figure 7 (A) Long-term variation in the dissolved oxygen (DO) concentration of the no-ecosystem (NE) experiment. Solid and dotted lines indicate the DO concentration averaged in the East/Japan Sea from 1618 to 2250 m (deep water: DW) and 2250 m to the bottom (bottom water: BW), respectively. (B, C) Spatial distribution of the changes in the DO concentration simulated by the NE experiment for the 36-year period (1980 to 2015) in the DW and BW, respectively.
The penetration of water masses from the surface due to the ventilation event is a primary factor inducing increases in DO concentration across deep and bottom waters in general. However, although deep convection only reached the central water (< 1000 m) after the 1970s, the DO concentration of the deep and bottom waters gradually increased by the physical effect (Figure 7A). It is because oxygen was supplied to the lower layers through bottom mixing with the central water. Because the source was located in the upper ocean, the physical contribution weakened with depth. DO changes caused by physical processes without biological decomposition over the 36-year period were +0.35 and +0.23 ml l−1 in the deep and bottom water, respectively.
The increase in the DO concentration caused by the physical effect was weak in the Japan Basin and generally increased towards the southern area (Figures 7B, C). This distribution of the physical contribution was considered to depend on the geographic location: the physical effect was weakened in areas with a deep topography. The depth of the Japan Basin is over 2000 m; thus, the amount of oxygen supplied from the upper layer was highly diluted relative to that of the shallow areas.
3.4.2 Biological Effect
3.4.2.1 CTL – CDF Experiments
We derived the impact of the additional detritus flux on the DO concentration by subtracting the results of the CDF experiment from that of the CTL experiment. Figure 8A shows the time series of the detritus flux into the lower layers obtained from the CTL experiment and the CDF experiment, which showed almost constant sinking each year (18.7 mmol m−2 decade−1). The flux is calculated by the difference between the incoming flux through 516 m, which is calculated by considering the sinking speed of detritus (43.2 m day−1), and the outgoing flux of the sedimentation at the bottom. The outgoing flux is taken into account to reflect that the detritus reaching the bottom is buried in the sediment, thus is not decomposed and consuming oxygen.
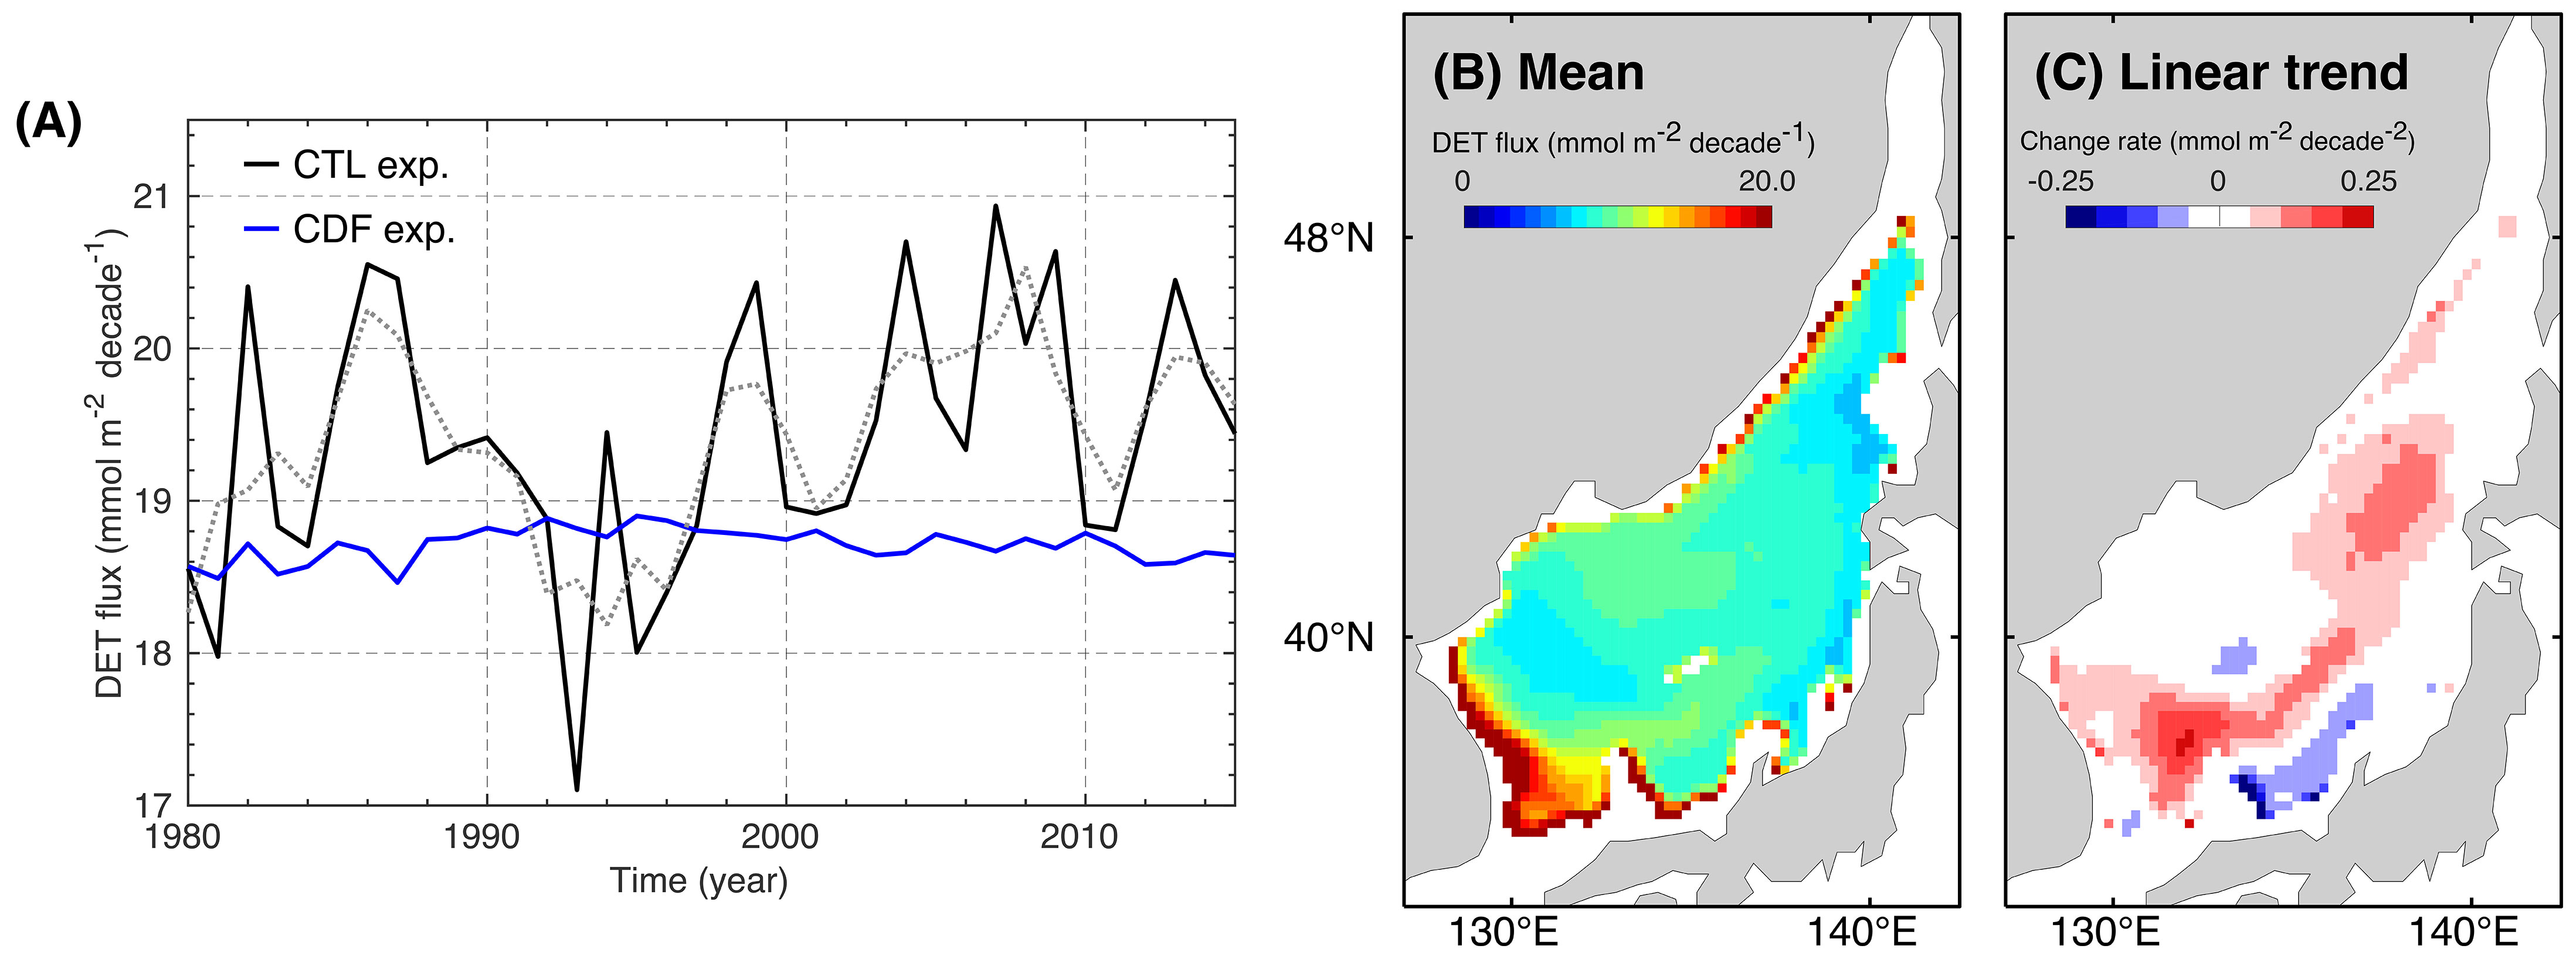
Figure 8 (A) Long-term variation in the detritus (DET) flux into the lower layers averaged in the East/Japan Sea, which is determined by the incoming flux through 516 m depth and the outgoing flux of the sedimentation at the bottom. The black and blue solid lines indicate the results of the control (CTL) and constant detritus flux (CDF) experiments, respectively. The gray dotted line represents the 3-year moving average of the detritus flux simulated by the CTL experiment. (B) Spatial distribution of the mean detritus flux and (C) spatial pattern of the linear trend in the detritus flux of the CTL experiment.
Figure 9A indicates the long-term change in the DO concentration from 1980 to 2015 for the DW and BW obtained from the CDF experiment. The results of the CTL experiment were plotted together for comparison. The sinking flux of organic matter was larger in the CTL experiment than in the CDF experiment except in 1981, 1993, and 1995, and the difference increased over time (Figure 8A). The long-term increase in the detritus flux sinking to the lower layers of the CTL experiment (Figure 8A) is closely related to the increase in Chl-a concentration in the euphotic zone. The correlation coefficient between the detritus flux through 516 m and the Chl-a inventory from the surface to 110 m is 0.52 (p < 0.05).
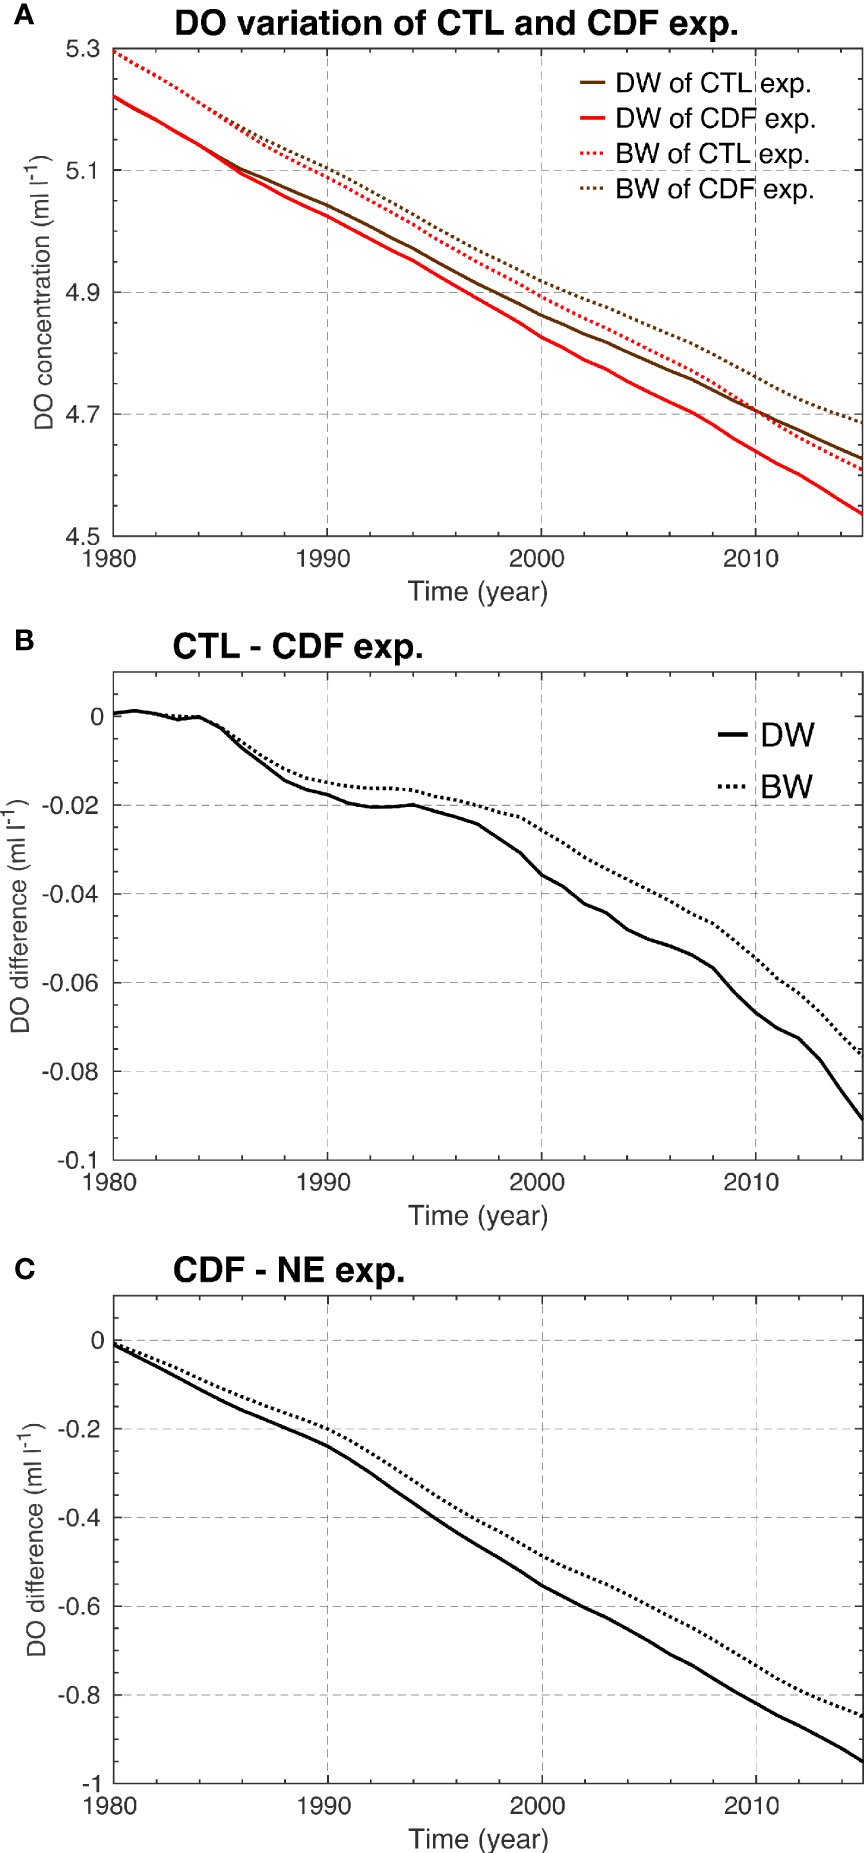
Figure 9 (A) Long-term variation in the dissolved oxygen (DO) concentration of the constant detritus flux (CDF; brown) and the control (CTL; red) experiments. Difference in the DO concentration (B) between the CTL and the CDF experiment, (C) between the CDF and the no-ecosystem (NE) experiments. Solid and dotted lines indicate the DO concentration averaged in the East/Japan Sea from 1618 to 2250 m (deep water: DW) and 2250 m to the bottom (bottom water: BW), respectively.
The detritus flux of the CTL experiment increased by 4% (0.89 mmol m−2 decade−1) over the 36-year period, and the difference in DO concentration between the two experiments gradually increased due to the significant biological consumption of DO in the CTL experiment (Figure 9A). The effect of the increase in detritus flux on the DO concentration was remarkable in the upper layer, where the decomposition process is active, and weak in the deeper layer, which is less sensitive to the upper environment. The detritus is produced by mortality of phytoplankton and egestion/mortality of zooplankton in the upper ocean. Thus, the detritus is sufficient in the upper layer, and as it sinks to the lower layer, the detritus decomposes into organic matter, so the amount gradually decreases with depths.
The time series of the DO concentration obtained from the difference between the CTL and CDF experiments is shown in Figure 9B. The enhanced detritus flux increased the consumption of DO over the lower layers. The decreased DO concentration temporarily slowed down in the mid-1990s because of the weak detritus flux of the CTL experiment compared to that of the CDF experiment. This finding suggests that the biological activities of the upper ocean directly influence the lower layers through the settling of organic particles. The decreased DO concentration caused by the increased detritus flux was quantitatively large in the DW but lower in the BW, as we confirmed in Figure 9A. Therefore, the decline in the DO concentration resulted from the increased detritus settling was −0.092 and −0.077 ml l−1 for the 36 years in the deep and bottom water, respectively.
The spatial patterns of mean and linear trend in the detritus flux (Figures 8B, C) highly resemble with those of the Chl-a concentration (Figures 6E, J). It suggests that the biological cycles such as mortality of phytoplankton is well modeled. A decrease in the DO concentration caused by the additional decomposition is found in the entire EJS (Figures 10A, B). Especially, the enhanced detritus flux considerably decreases the DO concentration along the offshore branch of the TWC. This relationship indicates that enhanced biological production influences the biogeochemical environment of the lower layers by increasing the export flux of organic particles. Therefore, we can confirm that the increase in the amount of organic matter sinking to the lower layers accelerates the decline in DO concentration. The effect of the increase in detritus flux on the DO variation decreases gradually with depth because the decomposition process is more active in the upper layer.
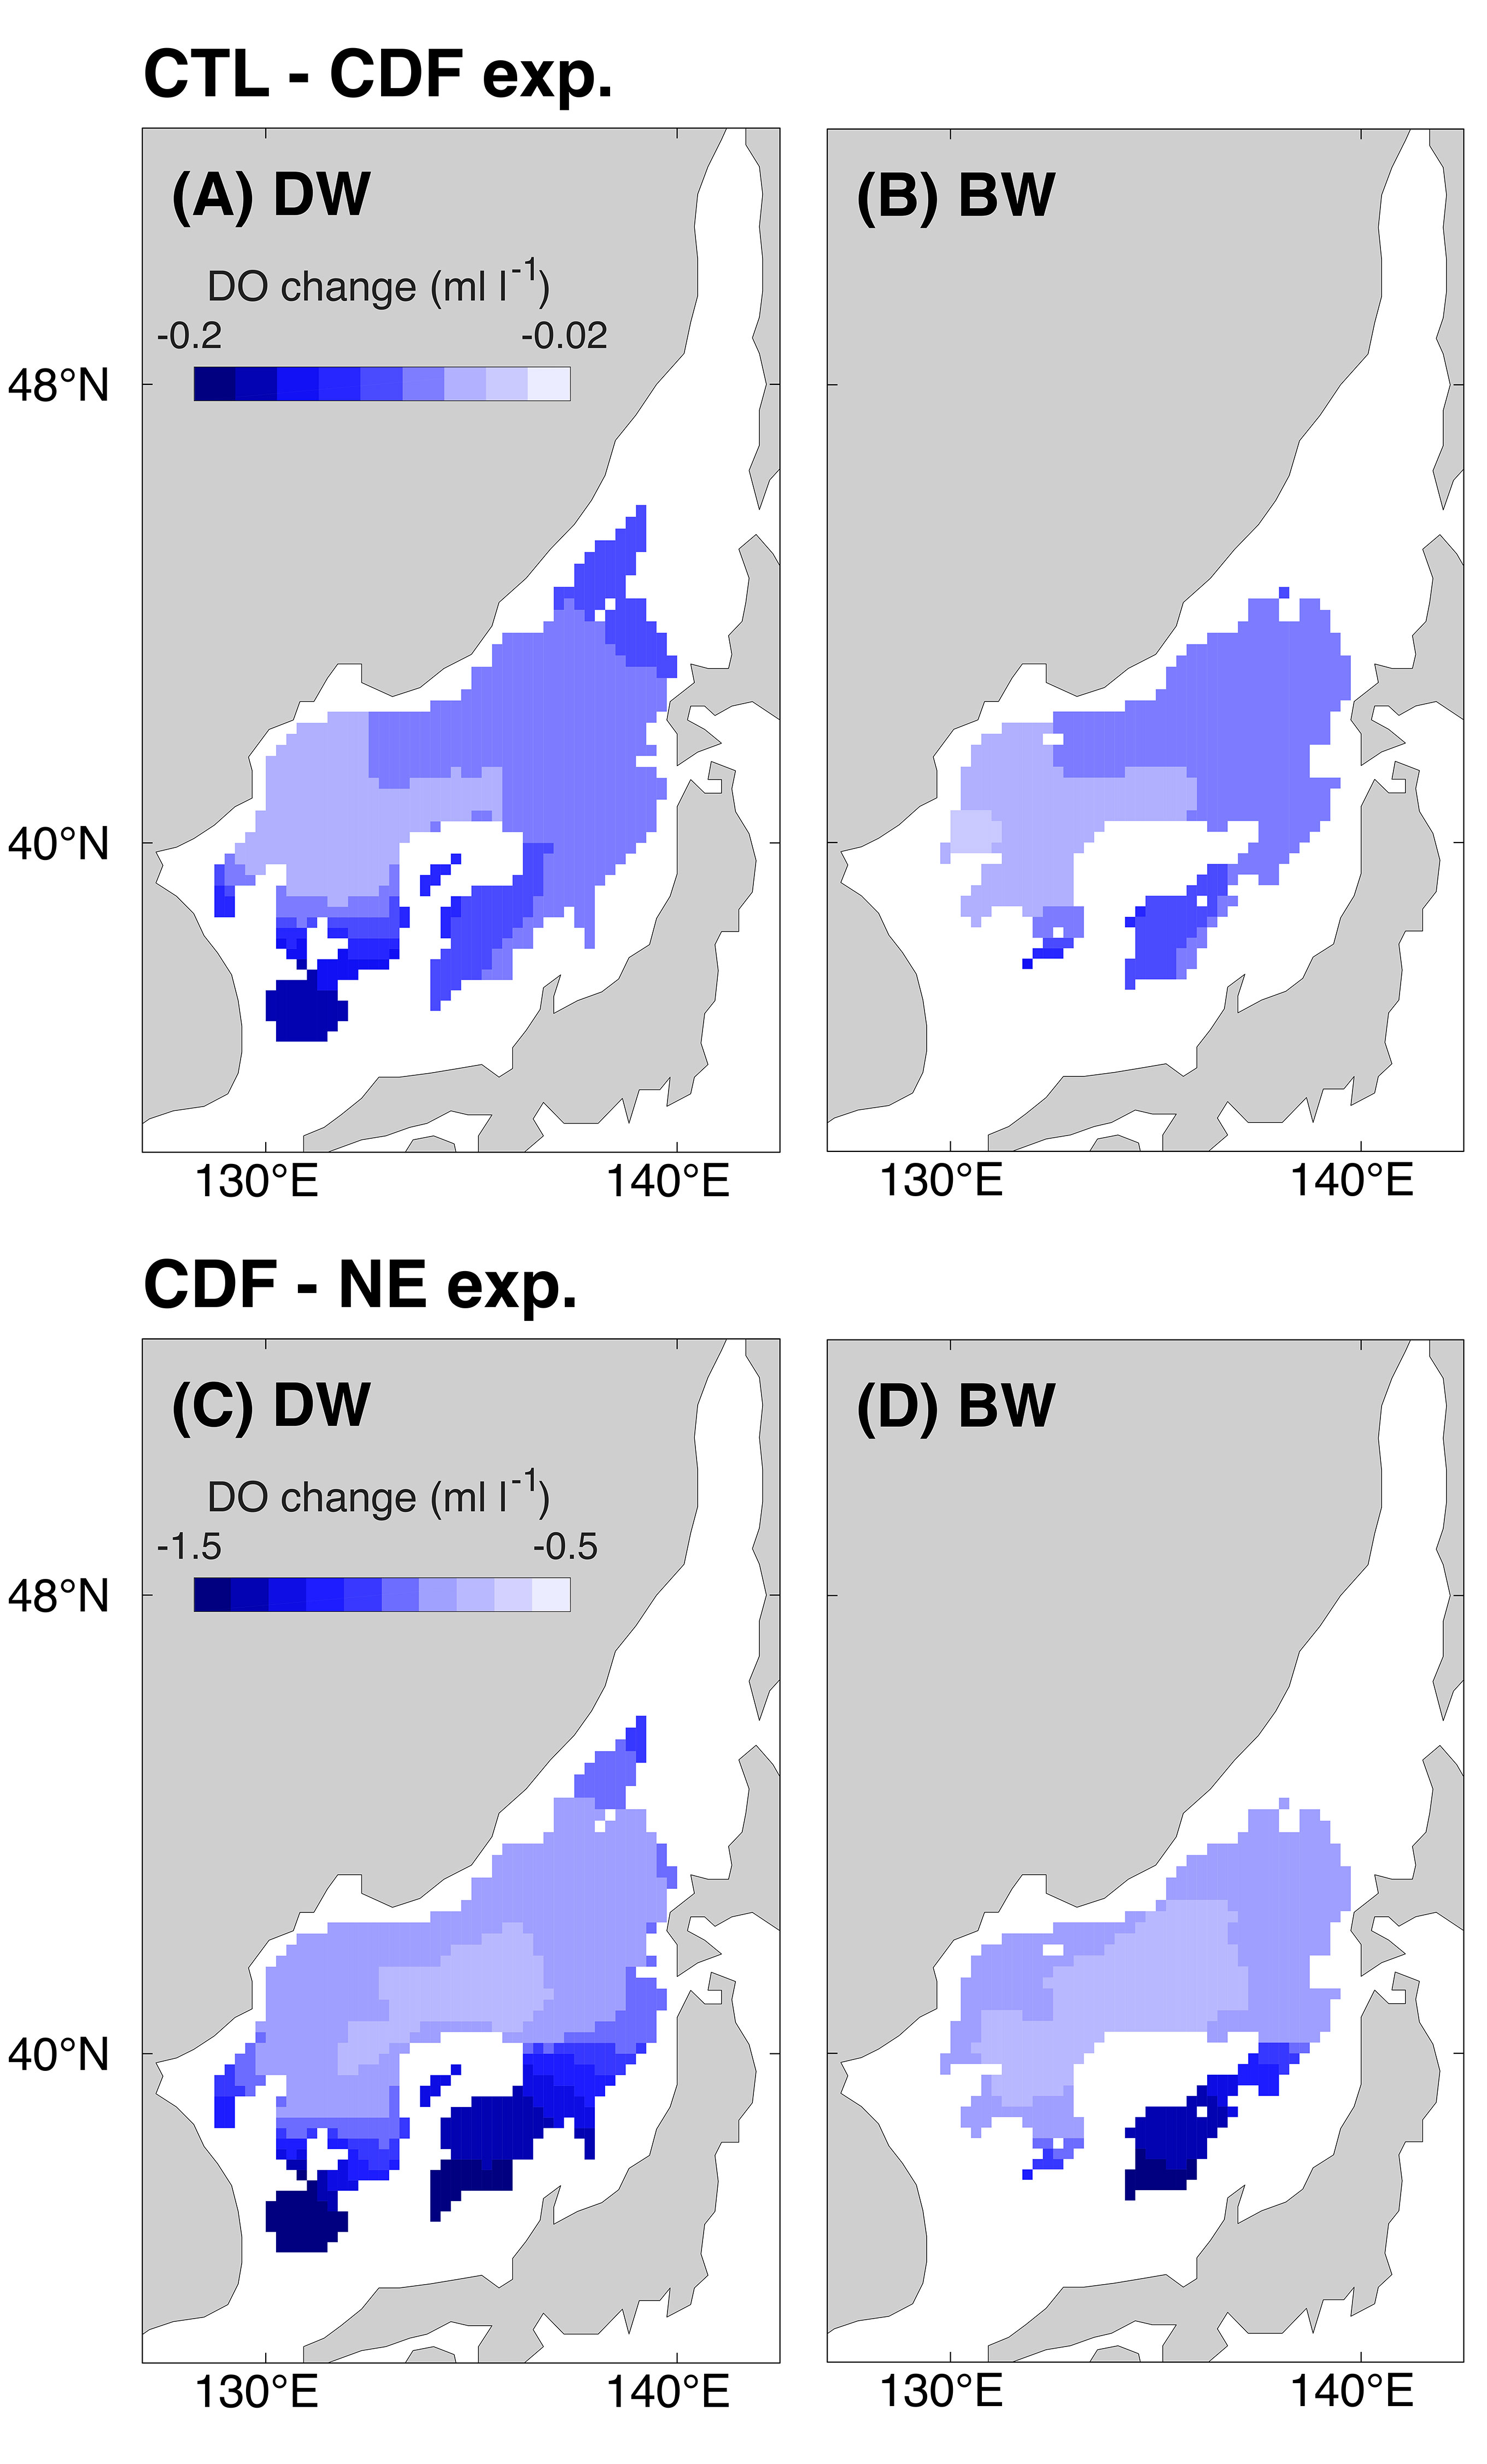
Figure 10 Spatial distribution of the changes in the dissolved oxygen (DO) difference (A, B) between the control (CTL) and the constant detritus flux (CDF) experiments; and (C, D) between the CDF and the no-ecosystem (NE) experiments for the 36-year period (1980 to 2015) in the depth range from 1618 to 2250 m (deep water: DW) and 2250 m to the bottom (bottom water: BW).
3.4.2.2 CDF – NE Experiments
The cessation of new water formation results in the sustained oxygen consumption due to the annually constant influx of organic matter, thus this effect is obtained from the difference between the CDF and NE experiment. The discontinued ventilation eventually induces the almost constant consumption of the DO concentration over the DW and BW (Figure 9C). Because the decomposition process accompanying DO consumption is active in the upper part, the reduction in the DO concentration by the constant detritus flux is more significant in the DW than in the BW. The DO consumed by the constant biological decomposition process is −0.94 and −0.84 ml l−1 for the 36-year period in the deep and bottom water, respectively.
Figures 10C, D present the changes in DO concentration due to the constant detritus flux from 1980 to 2015 in the DW and BW. The reduction in DO concentration is less prominent in the Japan Basin but increases considerably with distance from that area. We expected that a significant DO reduction would result from the large amount of vertical influx of organic particles. However, the horizontal pattern of DO reduction did not resemble the annual mean distribution of detritus flux (Figure 8B).
We found that the spatial pattern of DO change by the constant detritus flux, namely, a weak reduction in the Japan Basin and a strong decrease with distance, is highly related to the horizontal circulation. The Japan Basin is known as the source area of deep water (Kim et al., 1992; Senjyu and Sudo, 1994; Talley et al., 2003). The new water entering the deep layer is advected to the west of the Yamato Rise, and it finally flows to the Yamato Basin (Senjyu and Sudo, 1994). The oxygen content of the water mass is gradually decreased by biological consumption during transport. Therefore, the DO distribution by the cessation of new water formation is largely dependent on consumption while it circulates horizontally, rather than the decomposition by the vertically settling organic materials in each region.
3.4.3 Summary
We quantitatively investigated the contribution of each causal factor in the deep and bottom waters by calculating the ratio of DO changes by the physical activities, the increased detritus flux, and the discontinued ventilation to the net DO change (Figure 11; Table 1). The physical effect increases the DO concentration and cancels out a large proportion of the consumption, and it offsets approximately 51% (DW) and 34% (BW) of the net decrease in the DO concentration in a quantitative manner. The positive contribution of the physical effect is primarily associated with the vertical transport of oxygen from the upper layers.
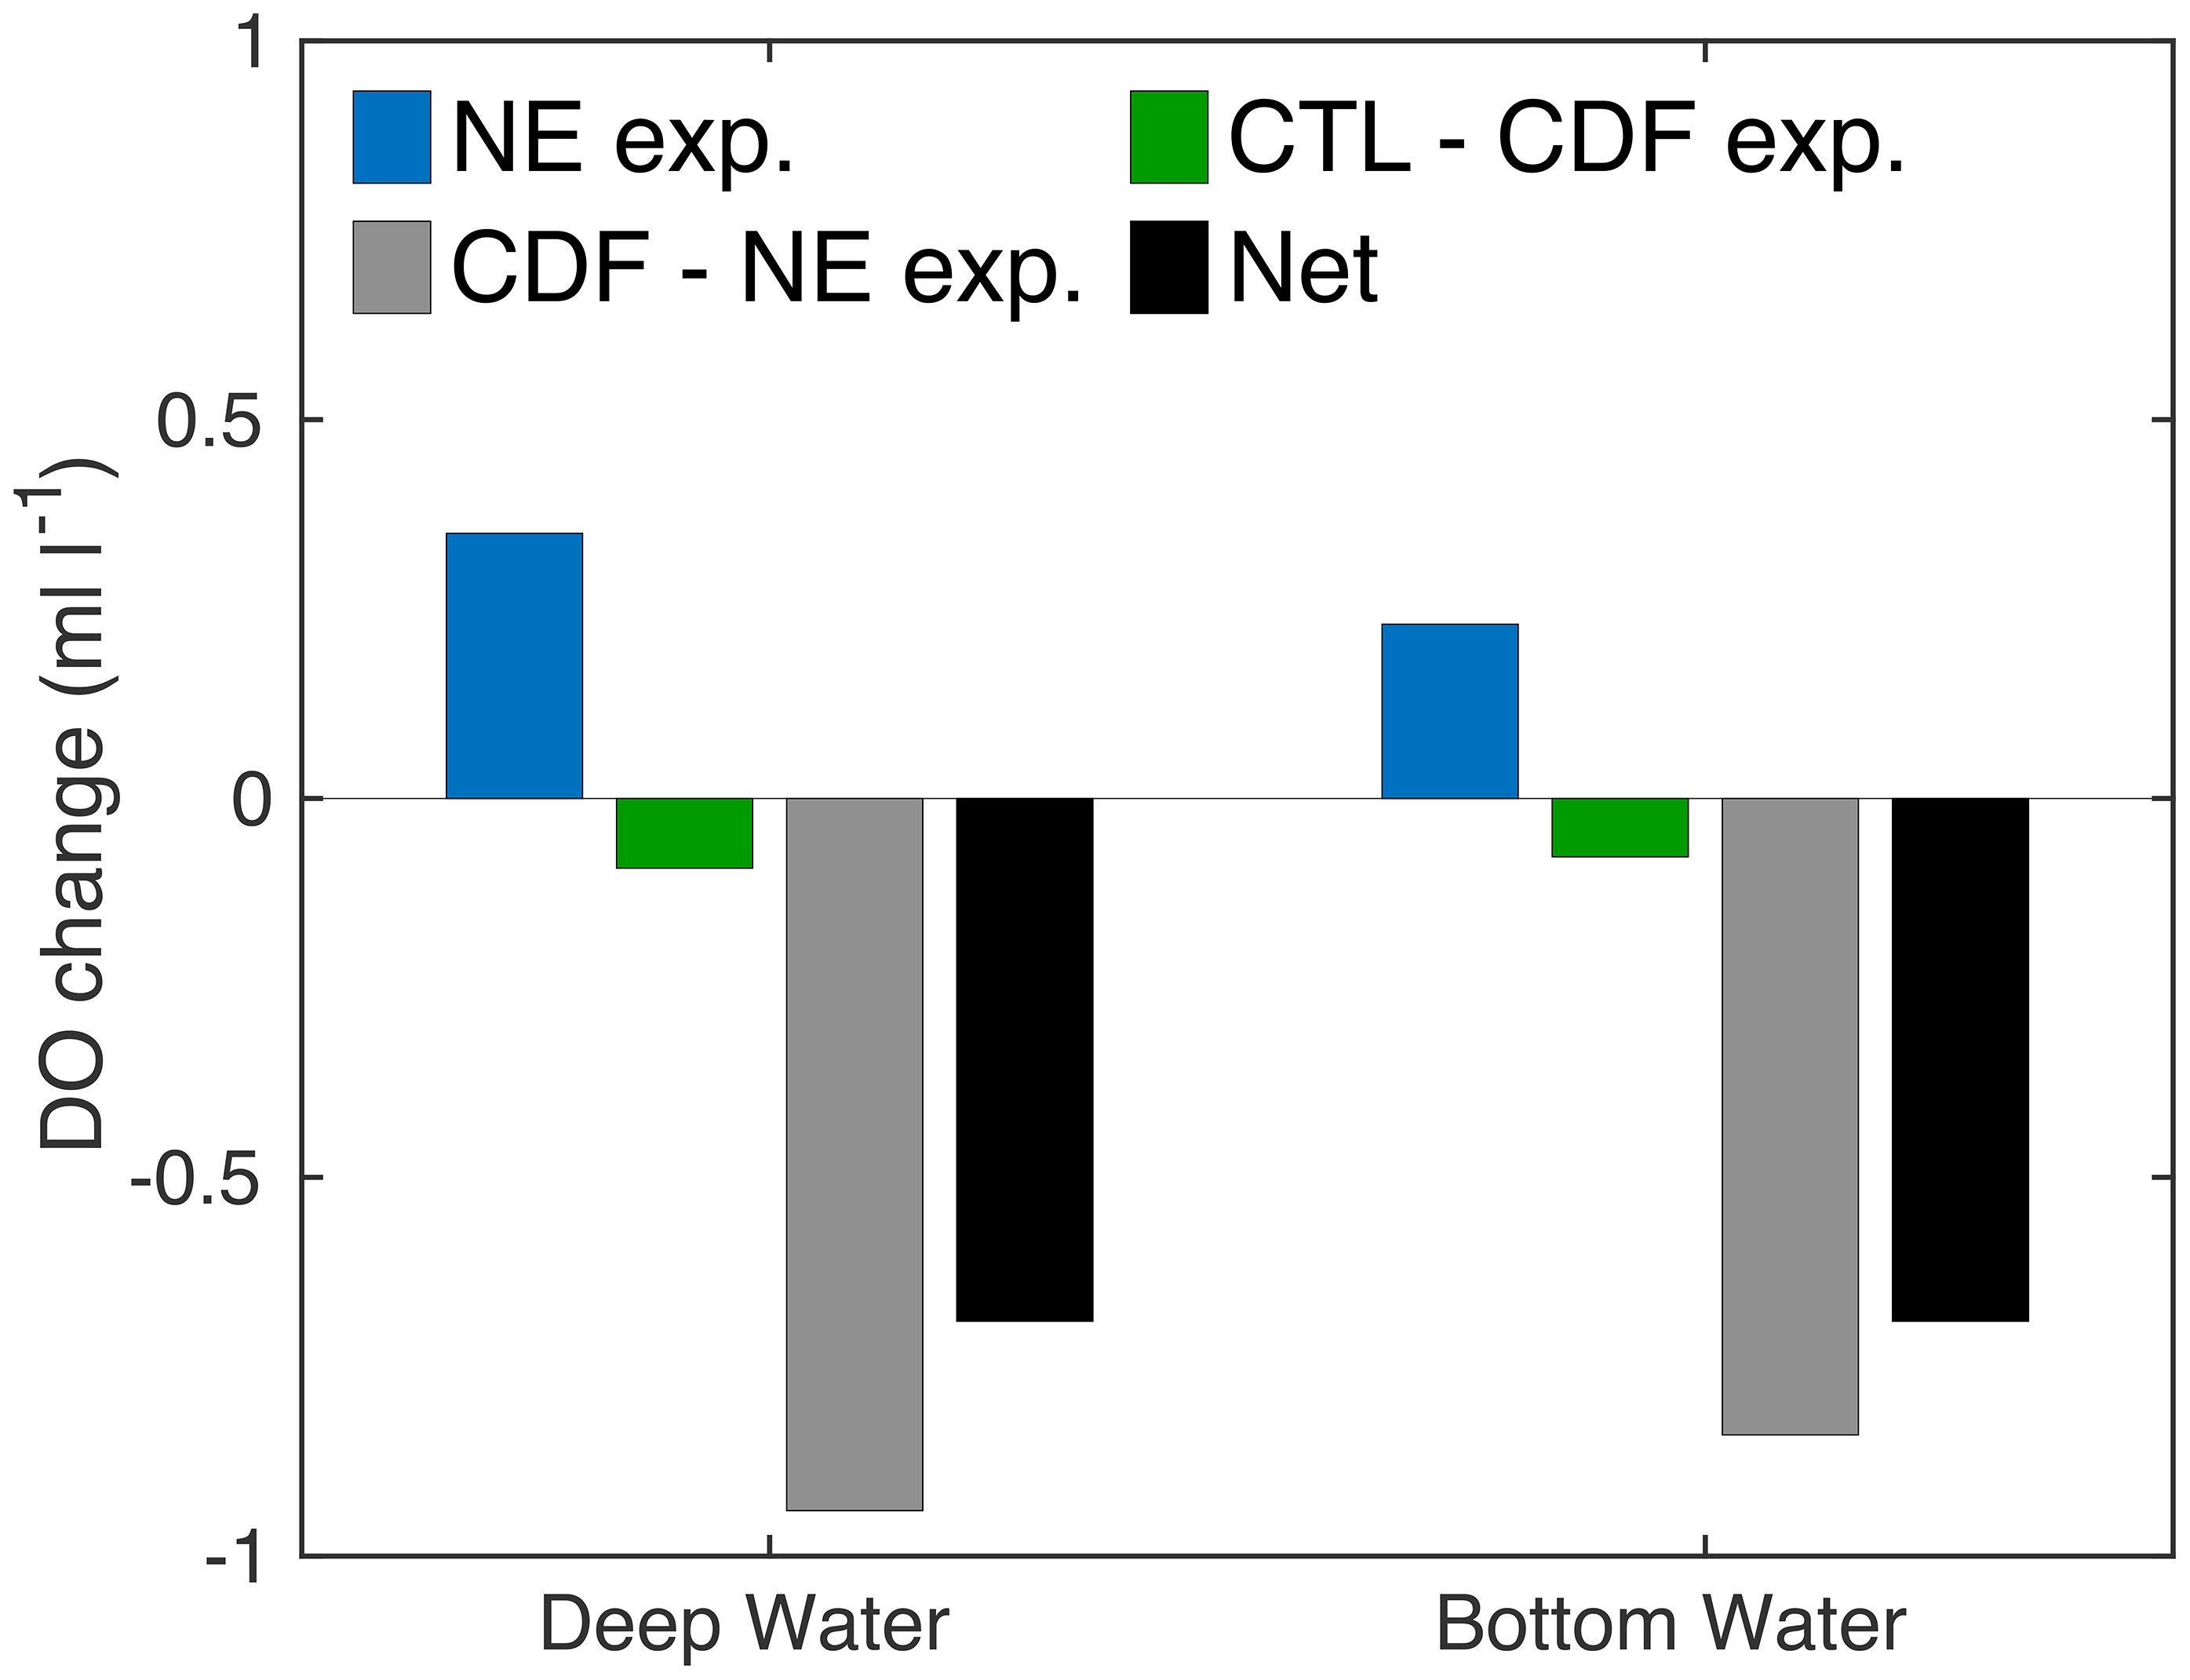
Figure 11 Changes in the dissolved oxygen (DO) concentration over the 36-year period (1980 to 2015) at each depth range from 1618 to 2250 m (deep water) and 2250 m to the bottom (bottom water). Blue, green, and gray bars indicate the DO change of the no-ecosystem (NE) experiment, the difference between the control (CTL) and constant detritus flux (CDF) experiments, the difference between the CDF and the NE experiments, respectively. The black bar indicates the net change in the DO concentration.
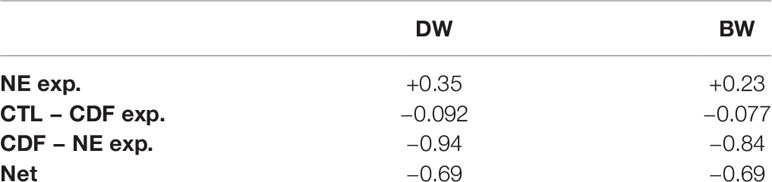
Table 1 Changes in the dissolved oxygen (DO) concentration (ml l−1) over the 36-year period (1980 to 2015) obtained from the no-ecosystem (NE) experiment, difference between the control (CTL) and the constant detritus flux (CDF) experiments, and difference between the CDF and the NE experiments at each depth range from 1618 to 2250 m (deep water: DW) and from 2250 m to the bottom (bottom water: BW), respectively.
Increasing biological decomposition decreases the DO concentration and accounts for 13% (DW) and 12% (BW) of the net reduction in DO concentration, although its effect was one order of magnitude smaller than the influence of discontinued new water formation or physical effects. The increased influx of organic particles sinking through 516 m induced an additional reduction in the DO concentration. The increased detritus flux accelerates the decrease in the DO concentration along the offshore branch of the TWC.
The cessation of ventilation substantially reduces the DO concentration and accounts for approximately 138% and 122% of the net decrease from 1980 to 2015 in the deep and bottom water, respectively. The oxygen concentration of the water mass introduced into the lower layers in the past gradually decreases through organic matter decomposition while it circulates horizontally.
The influences of the three causes on the net change in DO concentration are not spatially uniform. The reduction in DO concentration by the biological effect combined with the increase in oxygen attributed to the physical effect eventually results in a decline of the DO concentration over the entire EJS. A considerable reduction in the oxygen concentration occurred over the 36-year period in the Japan Basin, and it gradually decreased with distance (Figures 4C, D).
4 Conclusions and Discussion
The long-term decline in the DO concentration in the lower layers of the EJS has been considered to be attributed to the biological consumption by the decomposition process of organic materials in the isolated environment. This study quantitatively distinguished the contributions of the physical processes, the additional biological decomposition induced by the increased detritus influx, and the discontinued ventilation accompanied by the sustained biological consumption to the long-term decline in DO concentration using a coupled physical-biogeochemical model.
The measurement data showed that the Chl-a concentration at the surface layer of the EJS has been enhanced during the last few decades. The simulation results also delineated the increasing trend in the Chl-a concentration over the upper layer, thus implying enhanced biological productivity. The Chl-a inventory from the surface to 110 m depth actually increased by approximately 3% (1.25 mg m−2) from 1980 to 2015 in the model. Our study clarified that the biological activities were enhanced by the intensification of inflow transport (i.e., Tsushima Warm Current: TWC). The strengthening of the TWC changed the physical and biogeochemical environments and promoted photosynthetic production by increasing the available nutrients within the euphotic zone through vertical mixing.
The enhanced biological production of the upper layer increases the sinking flux of organic particles to the lower layers. The detritus flux into the lower layers (below 516 m depth) increased by 4% (0.89 mmol m−2 decade−1) over 36 years. This increase in organic particles accelerated the decline in the DO concentration by 0.08 ml l−1 over the lower layers, thus accounting for 12% of the net DO change. The increase in DO concentration caused by physical activities involving advection, diffusion, and air-sea gas exchange cancels out the large portion of the consumption, which is equivalent to 42% of the net decrease quantitatively. The increase in the DO concentration by the physical effect is mostly attributed to water transport from the upper ocean through bottom mixing. The cessation of new water formation, which is related to ongoing organic matter decomposition, was estimated in excess of the net reduction in DO concentration over the deep and bottom waters.
The three effects introduced in this study are slightly different from the suggestions of Gamo et al. (1986). The first and third cases in Gamo et al. (1986) are associated with the oxygen supply processes of advection, diffusion, and deep convection (first case) and vertical mixing only between the deep and bottom waters (third case). However, numerical modeling could not distinguish whether the changes in the DO concentration originated from the oxygen supply from the upper ocean or vertical mixing of deep and bottom waters. Thus, oxygen variations by all physical processes are included in the physical effect in this study. But, we can suppose that the third possibility proposed by Gamo et al. (1986) (i.e., enhanced vertical mixing between the deep and bottom waters) is negligible because if it is significant, the DO concentration of the DW should increase and that of the BW should decrease. The increase in the DO concentration in both deep and bottom waters shown in the NE experiment cannot be explained by the mixing between two layers.
Therefore, our modeling study confirmed that the discontinued ventilation is a major factor underlying the long-term decline in DO concentrations over the lower layers of the EJS, which is consistent with previous studies (e.g., Gamo et al., 1986; Kim et al., 2001; Yoon et al., 2018). These findings also demonstrated that the increased organic particles settling into the lower layers (second possibility in Gamo et al., 1986) influence on oxygen variation, but its effects were relatively minor. This potential that the increase in primary production of the euphotic layer could affect the deoxygenation of the lower layers was also suggested in a recent observational data-based study in the northwestern part of the EJS (Tishchenko et al., 2021). Our study and Tishchenko et al. (2021) agree that the vertical mixing between the deep and bottom waters (third possibility in Gamo et al., 1986) is negligible to explain the long-term decrease in DO concentration.
Our results showed that biological production in the upper ocean increased, which enhanced the influx of organic matter into the deep ocean. This intimate linkage of the biogeochemical system between the upper and lower layers was well modeled in this study. Consequently, the long-term decreasing and increasing trends of the model-reproduced chemical tracer DO and DIN concentrations were comparable with the collected observation data. However, the number of measurements of the biological indicators is insufficient; thus, these data cannot provide a better understanding of the recent changes in the nitrogen cycle of the EJS and cannot be used to validate that this study explains the mechanisms of long-term changes in the biological environment. Continuous monitoring and research on the biogeochemical cycle in the EJS are required to advance our understanding and predict future changes in the oxygen environment of the deep ocean.
Data Availability Statement
The chlorophyll-a (Chl-a) concentration data were retrieved from the Moderate Resolution Imaging Spectroradiometer (MODIS) satellites Aqua (https://oceancolor.gsfc.nasa.gov/data/aqua/) and Terra (https://oceancolor.gsfc.nasa.gov/data/terra/), and Sea-viewing Wide Field-of-view Sensor (SeaWiFS; https://oceancolor.gsfc.nasa.gov/data/seawifs/). The in situ measurement data on temperature, salinity, Chl-a, dissolved oxygen (DO), and dissolved inorganic nitrogen (DIN) were obtained from the World Ocean Database 2013 (https://www.nodc.noaa.gov/OC5/WOD13/). Data from the coupled physical-biogeochemical simulations performed for this study are available at Zenodo (http://doi.org/10.5281/zenodo.4589982). The annual mean volume transports through the Korea/Tsushima Strait measured by the Acoustic Doppler Current Profiler (ADCP) are archived in the same repository as the model outputs.
Author Contributions
HK, NH, and KT developed the ideas and designed the study. HK performed the numerical experiments and analysis. The manuscript was mainly written by HK, but NH and KT gave the comments and helped the revise of the manuscript. All authors contributed to the article and approved the submitted version.
Funding
This work was partially supported by the Korea Institute of Ocean Science & Technology (KIOST) major project “Biogeochemical cycling and marine environmental change studies”.
Conflict of Interest
Author KT is employed by IDEA Consultants, Inc.
The remaining authors declare that the research was conducted in the absence of any commercial or financial relationships that could be construed as a potential conflict of interest.
Publisher’s Note
All claims expressed in this article are solely those of the authors and do not necessarily represent those of their affiliated organizations, or those of the publisher, the editors and the reviewers. Any product that may be evaluated in this article, or claim that may be made by its manufacturer, is not guaranteed or endorsed by the publisher.
Supplementary Material
The Supplementary Material for this article can be found online at: https://www.frontiersin.org/articles/10.3389/fmars.2022.851598/full#supplementary-material
References
Boyer T. P., Antonov J. I., Baranova O. K., Coleman C., Garcia H. E., Grodsky A., et al. (2013). World Ocean Database 2013 Vol. 72. Eds. Levitus S., Mishonov A. (Silver Spring, MD: NOAA Atlas NESDIS), 209.
Breitburg D., Levin L. A., Oschlies A., Grégoire M., Chavez F. P., Conley D. J., et al. (2018). Declining Oxygen in the Global Ocean and Coastal Waters. Science 359 (6371), eaam7240. doi: 10.1126/science.aam7240
Chen C. T. A., Bychkov A. S., Wang S. L., Pavlova G. Y. (1999). An Anoxic Sea of Japan by the Year 2200? Marine. Chem. 67 (3-4), 249–265. doi: 10.1016/S0304-4203(99)00074-2
Cui Y., Senjyu T. (2012). Has the Upper Portion of the Japan Sea Proper Water Formation Really Been Enhancing? J. oceanograp. 68 (4), 593–598. doi: 10.1007/s10872-012-0115-y
Darecki M., Stramski D. (2004). An Evaluation of MODIS and SeaWiFS Bio-Optical Algorithms in the Baltic Sea. Remote Sens. Environ. 89 (3), 326–350. doi: 10.1016/j.rse.2003.10.012
Falkowski P. G., Algeo T., Codispoti L., Deutsch C., Emerson S., Hales B., et al. (2011). Ocean Deoxygenation: Past, Present, and Future. Eos. Trans. Am. Geophys. Union. 92 (46), 409–410. doi: 10.1029/2011EO460001
Gamo T. (1999). Global Warming may Have Slowed Down the Deep Conveyor Belt of a Marginal Sea of the Northwestern Pacific: Japan Sea. Geophys. Res. Lett. 26 (20), 3137–3140. doi: 10.1029/1999GL002341
Gamo T. (2011). Dissolved Oxygen in the Bottom Water of the Sea of Japan as a Sensitive Alarm for Global Climate Change. TrAC. Trends Anal. Chem. 30 (8), 1308–1319. doi: 10.1016/j.trac.2011.06.005
Gamo T., Momoshima N., Tolmachyov S. (2001). Recent Upward Shift of the Deep Convection System in the Japan Sea, as Inferred From the Geochemical Tracers Tritium, Oxygen, and Nutrients. Geophys. Res. Lett. 28 (21), 4143–4146. doi: 10.1029/2001GL013367
Gamo T., Nakayama N., Takahata N., Sano Y., Zhang J., Yamazaki E., et al. (2014). The Sea of Japan and its Unique Chemistry Revealed by Time-Series Observations Over the Last 30 Years. Monogr. Environ. Earth Planet. 2, 1–22. doi: 10.5047/meep.2014.00201.0001
Gamo T., Nozaki Y., Sakai H., Nakai T., Tsubota H. (1986). Spacial and Temporal Variations of Water Characteristics in the Japan Sea Bottom Layer. J. Marine. Res. 44 (4), 781–793. doi: 10.1357/002224086788401620
Gómez-Jakobsen F., Mercado J. M., Cortés D., Ramírez T., Salles S., Yebra L. (2016). A New Regional Algorithm for Estimating Chlorophyll-A in the Alboran Sea (Mediterranean Sea) From MODIS-Aqua Satellite Imagery. Int. J. Remote Sens. 37 (6), 1431–1444. doi: 10.1080/01431161.2016.1154223
Harada Y., Kamahori H., Kobayashi C., Endo H., Kobayashi S., Ota Y., et al. (2016). The JRA-55 Reanalysis: Representation of Atmospheric Circulation and Climate Variability. J. Meteorol. Soc. Japan. Ser. II. 94 (3), 269–302. doi: 10.2151/jmsj.2016-015
Helm K. P., Bindoff N. L., Church J. A. (2011). Observed Decreases in Oxygen Content of the Global Ocean. Geophys. Res. Lett. 38 (23), L23602. doi: 10.1029/2011GL049513
IPCC (2013). Climate Change 2013: The Physical Science Basis: Working Group I Contribution to the Fifth Assessment Report of the Intergovernmental Panel on Climate Change. Eds. Stocker T. F., Qin D., Plattner G.-K., Tignor M., Allen S. K., Boschung J., Nauels A., Xia Y., Bex V., Midgley P. M. (Cambridge, United Kingdom and New York, NY, USA: Cambridge University Press), 1535 pp.
Kang D. J., Kim J. Y., Lee T., Kim K. R. (2004). Will the East/Japan Sea Become an Anoxic Sea in the Next Century? Marine. Chem. 91 (1-4), 77–84. doi: 10.1016/j.marchem.2004.03.020
Kang D. J., Park S., Kim Y. G., Kim K., Kim K. R. (2003). A Moving-Boundary Box Model (MBBM) for Oceans in Change: An Application to the East/Japan Sea. Geophys. Res. Lett. 30 (6), 1299. doi: 10.1029/2002GL016486
Keeling R. F., Körtzinger A., Gruber N. (2010). Ocean Deoxygenation in a Warming World. Annu. Rev. marine. Sci. 2, 199–229. doi: 10.1146/annurev.marine.010908.163855
Kida S., Takayama K., Sasaki Y. N., Matsuura H., Hirose N. (2020). Increasing Trend in Japan Sea Throughflow Transport. J. Oceanograph. 77, 145–153. doi: 10.1007/s10872-020-00563-5
Kim S. K., Chang K. I., Kim B., Cho Y. K. (2013). Contribution of Ocean Current to the Increase in N Abundance in the Northwestern Pacific Marginal Seas. Geophys. Res. Lett. 40 (1), 143–148. doi: 10.1029/2012GL054545
Kim K., Kim K. R., Kim Y. G., Cho Y. K., Kang D. J., Takematsu M., et al. (2004). Water Masses and Decadal Variability in the East Sea (Sea of Japan). Prog. Oceanograph. 61 (2-4), 157–174. doi: 10.1016/j.pocean.2004.06.003
Kim K. R., Kim G., Kim K., Lobanov V., Ponomarev V., Salyuk A. (2002). A Sudden Bottom-Water Formation During the Severe Winter 2000–2001: The Case of the East/Japan Sea. Geophys. Res. Lett. 29 (8), 75–71. doi: 10.1029/2001GL014498
Kim K., Kim K. R., Min D. H., Volkov Y., Yoon J. H., Takematsu M. (2001). Warming and Structural Changes in the East (Japan) Sea: A Clue to Future Changes in Global Oceans? Geophys. Res. Lett. 28 (17), 3293–3296. doi: 10.1029/2001GL013078
Kim I. N., Lee K., Gruber N., Karl D. M., Bullister J. L., Yang S., et al. (2014). Increasing Anthropogenic Nitrogen in the North Pacific Ocean. Science 346 (6213), 1102–1106. doi: 10.1126/science.1258396
Kim T. W., Lee K., Najjar R. G., Jeong H. D., Jeong H. J. (2011). Increasing N Abundance in the Northwestern Pacific Ocean Due to Atmospheric Nitrogen Deposition. Science 334 (6055), 505–509. doi: 10.1126/science.1206583
Kim K. R., Rhee T. S., Kim K. (1992). A Note on Initial Nitrate and Initial Phosphate as Tracers for the Origin of East Sea (Japan Sea) Proper Water. La. mer. 30, 149–155.
Kim H., Takayama K., Hirose N., Onitsuka G., Yoshida T., Yanagi T. (2019). Biological Modulation in the Seasonal Variation of Dissolved Oxygen Concentration in the Upper Japan Sea. J. Oceanograph. 75 (3), 257–271. doi: 10.1007/s10872-018-0497-6
Kobayashi S., Ota Y., Harada Y., Ebita A., Moriya M., Onoda H., et al. (2015). The JRA-55 Reanalysis: General Specifications and Basic Characteristics. J. Meteorol. Soc. Japan. Ser. II. 93 (1), 5–48. doi: 10.2151/jmsj.2015-001
Lee H. J., Yoon J. H., Kawamura H., Kang H. W. (2003). Comparison of RIAMOM and MOM in Modeling the East Sea/Japan Sea Circulation. Ocean. Polar. Res. 25 (3), 287–302. doi: 10.4217/OPR.2003.25.3.287
Minami H., Kano Y., Ogawa K. (1999). Long-Term Variations of Potential Temperature and Dissolved Oxygen of the Japan Sea Proper Water. J. oceanograp. 55 (2), 197–205. doi: 10.1023/A:1007889929187
NASA. (2014a). Data from: NASA Goddard Space Flight Center, Ocean Ecology Laboratory and Ocean Biology Processing Group. Moderate-Resolution Imaging Spectroradiometer (MODIS) Aqua Chlorophyll Data; 2014 Reprocessing (Greenbelt, MD, USA: NASA OB.DAAC). doi: 10.5067/AQUA/MODIS_OC.2014.0
NASA. (2014b). Data from: NASA Goddard Space Flight Center, Ocean Ecology Laboratory and Ocean Biology Processing Group. Moderate-Resolution Imaging Spectroradiometer (MODIS) Terra Chlorophyll Data; 2014 Reprocessing (Greenbelt, MD, USA: NASA OB.DAAC). doi: 10.5067/TERRA/MODIS_OC.2014.0
NASA. (2014c). Data from: NASA Goddard Space Flight Center, Ocean Ecology Laboratory and Ocean Biology Processing Group. Sea-Viewing Wide Field-Of-View Sensor (SeaWiFS) Chlorophyll Data; 2014 Reprocessing (Greenbelt, MD, USA: NASA OB.DAAC). doi: 10.5067/ORBVIEW-2/SEAWIFS_OC.2014.0
Onitsuka G., Uno I., Yanagi T., Yoon J. H. (2009). Modeling the Effects of Atmospheric Nitrogen Input on Biological Production in the Japan Sea. J. Oceanograp. 65 (3), 433–438. doi: 10.1007/s10872-009-0038-4
Onitsuka G., Yanagi T., Yoon J. H. (2007). A Numerical Study on Nutrient Sources in the Surface Layer of the Japan Sea Using a Coupled Physical-Ecosystem Model. J. Geophys. Res.: Ocean. 112, C05042. doi:10.1029/2006JC003981
Oschlies A. (2021). A Committed Fourfold Increase in Ocean Oxygen Loss. Nat. Commun. 12 (1), 1–8. doi: 10.1038/s41467-021-22584-4
Park Y. G., Park J. H., Lee H. J., Min H. S., Kim S. D. (2013). The Effects of Geothermal Heating on the East/Japan Sea Circulation. J. Geophys. Res.: Ocean. 118 (4), 1893–1905. doi: 10.1002/jgrc.20161
Rho T., Lee T., Kim G., Chang K. I., Na T., Kim K. R. (2012). Prevailing Subsurface Chlorophyll Maximum (SCM) Layer in the East Sea and its Relation to the Physico-Chemical Properties of Water Masses. Ocean. Polar. Res. 34 (4), 413–430. doi: 10.4217/OPR.2012.34.4.413
Schmidtko S., Stramma L., Visbeck M. (2017). Decline in Global Oceanic Oxygen Content During the Past Five Decades. Nature 542 (7641), 335–339. doi: 10.1038/nature21399
Senjyu T., Aramaki T., Otosaka S., Togawa O., Danchenkov M., Karasev E., et al. (2002). Renewal of the Bottom Water After the Winter 2000–2001 may Spin-Up the Thermohaline Circulation in the Japan Sea. Geophys. Res. Lett. 29 (7), 53–51. doi: 10.1029/2001GL014093
Senjyu T., Sudo H. (1994). The Upper Portion of the Japan Sea Proper Water; its Source and Circulation as Deduced From Isopycnal Analysis. J. Oceanograph. 50 (6), 663–690. doi: 10.1007/BF02270499
Seung Y. H., Yoon J. H. (1995). Some Features of Winter Convection in the Japan Sea. J. Oceanograph. 51 (1), 61–73. doi: 10.1007/BF02235936
Stramma L., Schmidtko S., Levin L. A., Johnson G. C. (2010). Ocean Oxygen Minima Expansions and Their Biological Impacts. Deep. Sea. Res. Part I.: Oceanograph. Res. Paper. 57 (4), 587–595. doi: 10.1016/j.dsr.2010.01.005
Sudo H. (1986). A Note on the Japan Sea Proper Water. Prog. oceanograp. 17, 313–336. doi: 10.1016/0079-6611(86)90052-2
Takikawa T., Yoon J. H. (2005). Volume Transport Through the Tsushima Straits Estimated From Sea Level Difference. J. Oceanograph. 61 (4), 699–708. doi: 10.1007/s10872-005-0077-4
Talley L. D., Lobanov V., Ponomarev V., Salyuk A., Tishchenko P., Zhabin I., et al. (2003). Deep Convection and Brine Rejection in the Japan Sea. Geophys. Res. Lett. 30 (4), 1159. doi: 10.1029/2002GL016451
Tishchenko P., Lobanov V., Kaplunenko D., Sagalaev S., Tishchenko P. (2021). Acidification and Deoxygenation of the Northwestern Japan/East Sea. J. Marine. Sci. Eng. 9 (9), 953. doi: 10.3390/jmse9090953
Tsunogai S., Kawada K., Watanabe S., Aramaki T. (2003). CFC Indicating Renewal of the Japan Sea Deep Water in Winter 2000–2001. J. oceanograp. 59 (5), 685–693. doi: 10.1023/B:JOCE.0000009597.33460.d7
Usui N., Wakamatsu T., Tanaka Y., Hirose N., Toyoda T., Nishikawa S., et al. (2017). Four-Dimensional Variational Ocean Reanalysis: A 30-Year High-Resolution Dataset in the Western North Pacific (FORA-Wnp30). J. Oceanograph. 73 (2), 205–233. doi: 10.1007/s10872-016-0398-5
Watanabe Y. W., Wakita M., Maeda N., Ono T., Gamo T. (2003). Synchronous Bidecadal Periodic Changes of Oxygen, Phosphate and Temperature Between the Japan Sea Deep Water and the North Pacific Intermediate Water. Geophys. Res. Lett. 30 (24), 2273. doi: 10.1029/2003GL018338
Keywords: dissolved oxygen, long-term decline, coupled physical-biogeochemical model, lower trophic ecosystem, East/Japan Sea
Citation: Kim H, Hirose N and Takayama K (2022) Physical and Biological Factors Underlying Long-Term Decline of Dissolved Oxygen Concentrationin the East/Japan Sea. Front. Mar. Sci. 9:851598. doi: 10.3389/fmars.2022.851598
Received: 10 January 2022; Accepted: 22 March 2022;
Published: 02 May 2022.
Edited by:
Olaf Duteil, Helmholtz Association of German Research Centres (HZ), GermanyReviewed by:
Vyacheslav Lobanov, V.I. Il’ichev Pacific Oceanological Institute (RAS), RussiaChen-Tung Arthur Chen, National Sun Yat-sen University, Taiwan
Copyright © 2022 Kim, Hirose and Takayama. This is an open-access article distributed under the terms of the Creative Commons Attribution License (CC BY). The use, distribution or reproduction in other forums is permitted, provided the original author(s) and the copyright owner(s) are credited and that the original publication in this journal is cited, in accordance with accepted academic practice. No use, distribution or reproduction is permitted which does not comply with these terms.
*Correspondence: Haejin Kim, aGpraW0xMjdAa2lvc3QuYWMua3I=