 Chao Fan1†
 Xuekai Zhang1†
 Liming Tang1
 Xingzhi Zhang2Jinlong Li1Yangchun Li1Qiongzhen Li2
 Zhaoping Wang1*
- 1The Key Laboratory of Mariculture of Ministry of Education, Ocean University of China, Qingdao, China
- 2Guangxi Key Laboratory of Aquatic Genetic Breeding and Healthy Aquaculture, Guangxi Academy of Fisheries Sciences, Nanning, China
The pearl oyster Pinctada martensii is an important species for sea pearl production in China. To explore the influence of the combination of mass selection and hybridization on growth performance of P. martensii, we established four selected groups and four control groups (each with two within-family crosses and two reciprocal hybrid crosses) using 1-year-old offspring of two families (Family A and Family B) from Beihai, Guangxi Province, China. Generally, the growth of the selected group was greater than that of the control group for both within-family crosses and reciprocal hybrid crosses. Shell length and width were affected by genotype, environmental factors, and the interaction between the two on Days 210 and 360. The shell widths of the four reciprocal hybrid crosses all showed heterosis on Day 360. The four within-family crosses showed a certain degree of inbreeding depression during the growth period. On Day 360, the three genetic parameters for shell width of the selected group of ♀ Family B and ♂ Family A were the largest, with values of 0.70, 1.17, and 0.06 for realized heritability, standard response to selection, and current genetic gain, respectively. Overall, the growth performance of ♀ Family B × ♂ Family A in the selected group was the best. Therefore, the combination of mass selection and hybridization could be an effective way to improve the growth performance of P. martensii.
Introduction
Pinctada martensii is a dioecious pearl oyster native to Guangxi, Guangdong, and Hainan provinces in China. The pearls produced by P. martensii are called “South China Sea pearl.” P. martensii is the most important seawater pearl-producing species in China, and it once enjoyed a worldwide reputation. However, in recent years, the output of pearls in China has decreased significantly, and the quality and price of pearls have continued to decline. The germplasm of P. martensii in China is degraded seriously, with growth rate, small size, and poor secretion ability (Gu et al., 2009; Liu et al., 2011; Li et al., 2017; He et al., 2021). One of the most important reasons for the problems above is the inability to provide high-quality seedlings for the industry. Therefore, the breeding program of P. martensii is imperative. Mass selection is a frequently used and effective method in shellfish breeding. However, due to the destruction of the natural environment, the wild population resources of P. martensii are very scarce. Aquaculture currently mainly relies on hatchery production, while the shellfish in the hatchery can easily cause inbreeding depression due to the long-term inbreeding (Li et al., 2017). Hybridization is an effective method to reduce inbreeding depression. Therefore, the combination of mass selection and crossbreeding cannot only quickly achieve the purpose of breeding, but also reduce the decline of inbreeding.
Due to poorly developed selective breeding technology, the global output of aquatic products after selective breeding only accounted for 8.2% of the total aquaculture in 2010 (Gjedrem and Rye, 2018). The genetic gain of each generation of selected aquatic species can reach 12.5%, and the annual growth rate can reach 5.4%. If selective breeding is applied to all aquatic species, the world aquaculture production could be doubled in 13 years (Gjedrem et al., 2012). Effective selective breeding requires selection of parents with favorable phenotypes, such as fast growth and strong stress resistance (Gjedrem and Baranski, 2009). To date, many shellfish selective breeding programs initially selected parents from wild populations (Li et al., 2011; Zhao et al., 2012; Dégremont et al., 2015; Du et al., 2015; He, 2016; Barros et al., 2018), which have high genetic diversity and are easy to adapt to the environment due to natural selection (Zhao et al., 2020). However, some shellfish breeding programs have used advantageous breeding groups that are selected from laboratory strains as the basic populations (Li, 2012; Huo et al., 2015; Wang et al., 2020).
Mass selection and hybridization are common and effective approaches that have been widely used for genetic improvement of aquaculture animals. The advantage of mass selection for highly fertile aquatic animals is that strong selection pressures can be applied to them (Gjedrem and Baranski, 2010). Results from challenge test experiments on animals from family selection can be highly consistent with results from natural experiments, but the former are more expensive to conduct (Gjedrem and Rye, 2018). Mass selection is also a lower-cost alternative to family selection (Dégremont et al., 2015). Dégremont et al. (2015) reported that after four generations of mass selection for the Pacific oyster Crassostrea gigas, resistance to the ostreid herpesvirus 1 and the growth rate of each generation improved gradually. However, the growth rate of offspring selected from a suitable environment will not show a significant advantage compared with the control group in an unsuitable environment (Deng et al., 2009a; Zhao et al., 2019, 2020). Crossbreeding, which uses dominant parents to produce offspring with heterosis (Newkirk, 1980), is one method that may improve profitable traits. Crosses between inbred lines can also reduce the increased inbreeding coefficient of multiple generations of inbreeding and at the same time increase genetic diversity. Huo et al. (2015) selected two families with the fastest growth rate from 45 full-sib families of the clam Ruditapes philippinarum and applied a certain intensity of selection to self-crosses and crosses. The hybrid offspring showed obvious signs on growth at the age of 30–90 days. Thus, the growth advantage conferred by increasing the selection intensity of highly fertile species followed by hybridization may improve production performance. Researchers have carried out a series of breeding programs on P. martensii, including mass selection (Deng et al., 2009b; Wang et al., 2011), cross breeding (Gu et al., 2011), and molecular marker assisted breeding (Shi et al., 2009). Through these studies, new varieties of P. martensii with genetic advantages, such as “Haixuan No. 1” (Du et al., 2015), “Haiyou No. 1” (Li, 2012), and “Nanke No. 1” (He, 2016), have been cultivated. These new varieties have the characteristics of fast growth, large shell width, and a strong secreting ability.
In this study, we combined mass selection and hybridization to evaluate the growth parameters of the selected groups and the control groups, as well as the inbred and hybrid groups. We calculated the heterosis and inbreeding depression based on measurements of shell length and width and estimated values for several genetic parameters for shell width of the selected groups.
Materials and Methods
Base Stock and Intensity of Selection
In March 2019, we established 27 families using three new varieties of P. martensii (Haiyou No. 1, Haixuan No. 1, and Nanke No. 1). In April 2020, the 1-year-old offspring of these 27 families were transported from the culture sites to Guangxi Comprehensive Test Station Hatchery of the National Shellfish Industry Technology System at Guangxi Academy of Fisheries Sciences. The shell width of specimens from the 27 families was measured using a vernier caliper (accuracy 0.01 mm), and the two families (named Family A and Family B) with the largest mean shell width were selected as the parent population for our experiment. The parents of Family A were ♀ Haixuan No. 1 and ♂ Nanke No. 1, and the parents of Family B were ♀ Nanke No. 1 and ♂ Haiyou No. 1. Seven bags of offspring were randomly selected for each family. After removing the dead individuals and those with irregularly shaped shells, there were 1,075 individuals in Family A and 1,025 individuals in Family B. We used a vernier caliper (accuracy 0.01 mm) to measure the shell width of all individuals from the two families, and then the top 12% of individuals with the largest shell width from each family were selected as the selected groups (named SA and SB, respectively). Additionally, 100 individuals were randomly taken from each family to serve as the control groups (named CA and CB, respectively) before selection. Due to different levels of gonadal development, we actually used 112 individuals from Family A and 120 individuals from family B during the experiment. Figure 1 and Table 1 show the shell width frequency distribution, selection cutoff points, and intensity of selection (i) of the two families.

Figure 1. Shell width frequency distribution of P. martensii: (A) Family A and (B) Family B.
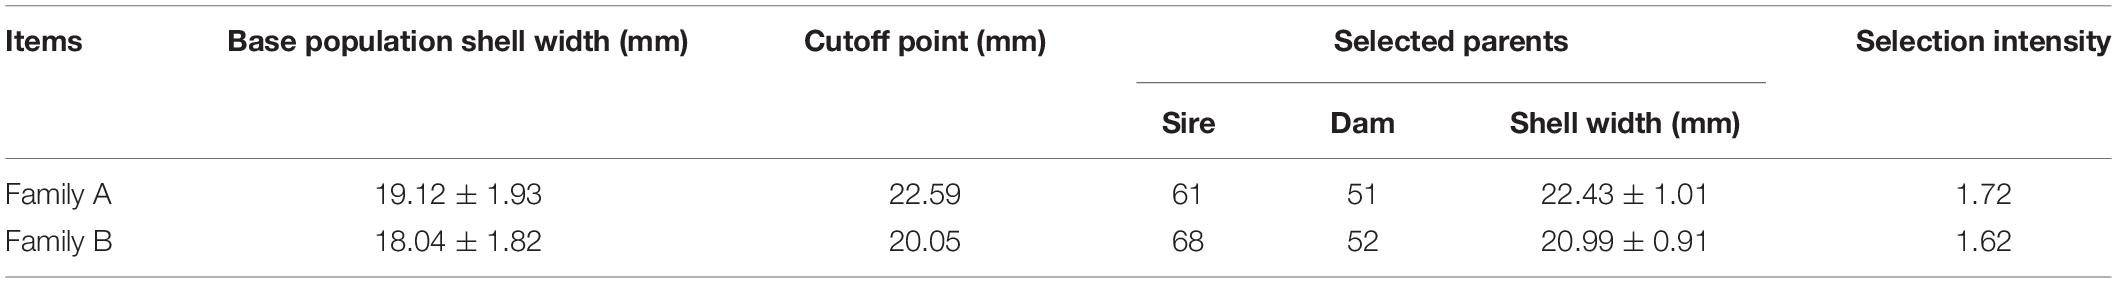
Table 1. Shell width (mean ± SD) of base populations and selected group parents, cutoff points, and selection intensity of P. martensii.
Establishment of Crosses
Oocytes from females were obtained by dissecting gonads and gathering them into a 50 L bucket filled with filtered sea water. Impurities such as tissue fragments were filtered out with a 100 μm mesh screen. For each line, egg suspensions were mixed well and divided equally into six 10 L buckets. A few drops of ammonia (2–3 mM) (Ohta et al., 2007) were added and the buckets were set aside. Oocyte maturity was monitored during the process of oocytes soaking. Semen was extracted from the gonad of each male with a pipette and then divided equally into six 1 L beakers. According to Qin et al. (2018), after the germinal vesicle breakdown ratio of the oocytes reached 100%, a few drops of ammonia were added to the seminal fluid, and the sperm activity was observed immediately. Eggs were examined to rule out the occurrence of uncontrolled fertilization before formal fertilization. When we observed that most of the sperm were activated, an appropriate amount of seminal fluid was poured into the oocyte fluid for fertilization to produce two within-family crosses and two reciprocal hybrid crosses for both the selected groups and the control groups. Table 2 shows the mating strategy, and the experiment was conducted in triplicate for each group. The fertilized eggs were pooled and placed in a 1 m3 beaker for hatching at a density of 10–20 eggs mL–1. The temperature of the hatching water was maintained at 28°C, and the salinity was kept at 30 ppt.
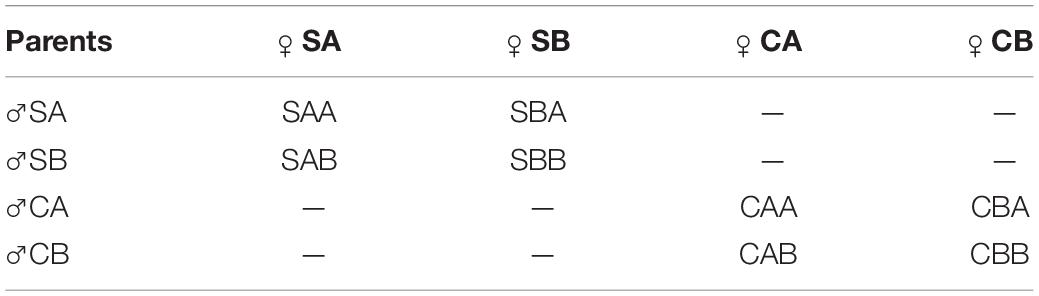
Table 2. Mating strategy of P. martensii.
Larval Rearing, Spat Nursery, and Grow-Out
The fertilized eggs developed into D-veliger larvae in about 16 h. Larvae were collected after being passed through a 40 μm nylon screen, and the density of each group was adjusted to 3–5 individuals mL–1. The density of each group was adjusted regularly during cultivation to eliminate the effect of density. The larvae were fed on Isochrysis galbana before they reached a size of 110–120 μm. As the spat grew, Chaetoceros muelleri and Platymonas subcordiformis were added to the diet. Feeding was gradually increased from 3,000 to 50,000 cells mL–1 day–1. The proportion of the three phytoplankton species was 1:1:1. The water was completely exchanged with filtered seawater once a day.
The spat from each group were gathered into polyethylene mesh bags with a 2 mm aperture at a density of 120–150 individuals/bag when the shell length of juveniles was about 2–3 mm. They were then transferred to three culture sites in Beihai in Guangxi Zhuang Autonomous Region. The three culture sites were named Zhulin (Z), Huolu (H), and Qingshantou (Q) (Figures 2a,b). The mesh bags at Zhulin were hung on a floating raft in a large pond (Figure 2c). The mesh bags at Huolu and Qingshantou were suspended from off-bottom piles, which were located in the shoal offshore (Figure 2d). The biofouling on the mesh bags was removed regularly to prevent it from affecting the flow of seawater through the bags. The mesh bags were changed periodically as the oysters grew. The density of oysters in the mesh bags was adjusted to avoid the influence of density on the experiment.
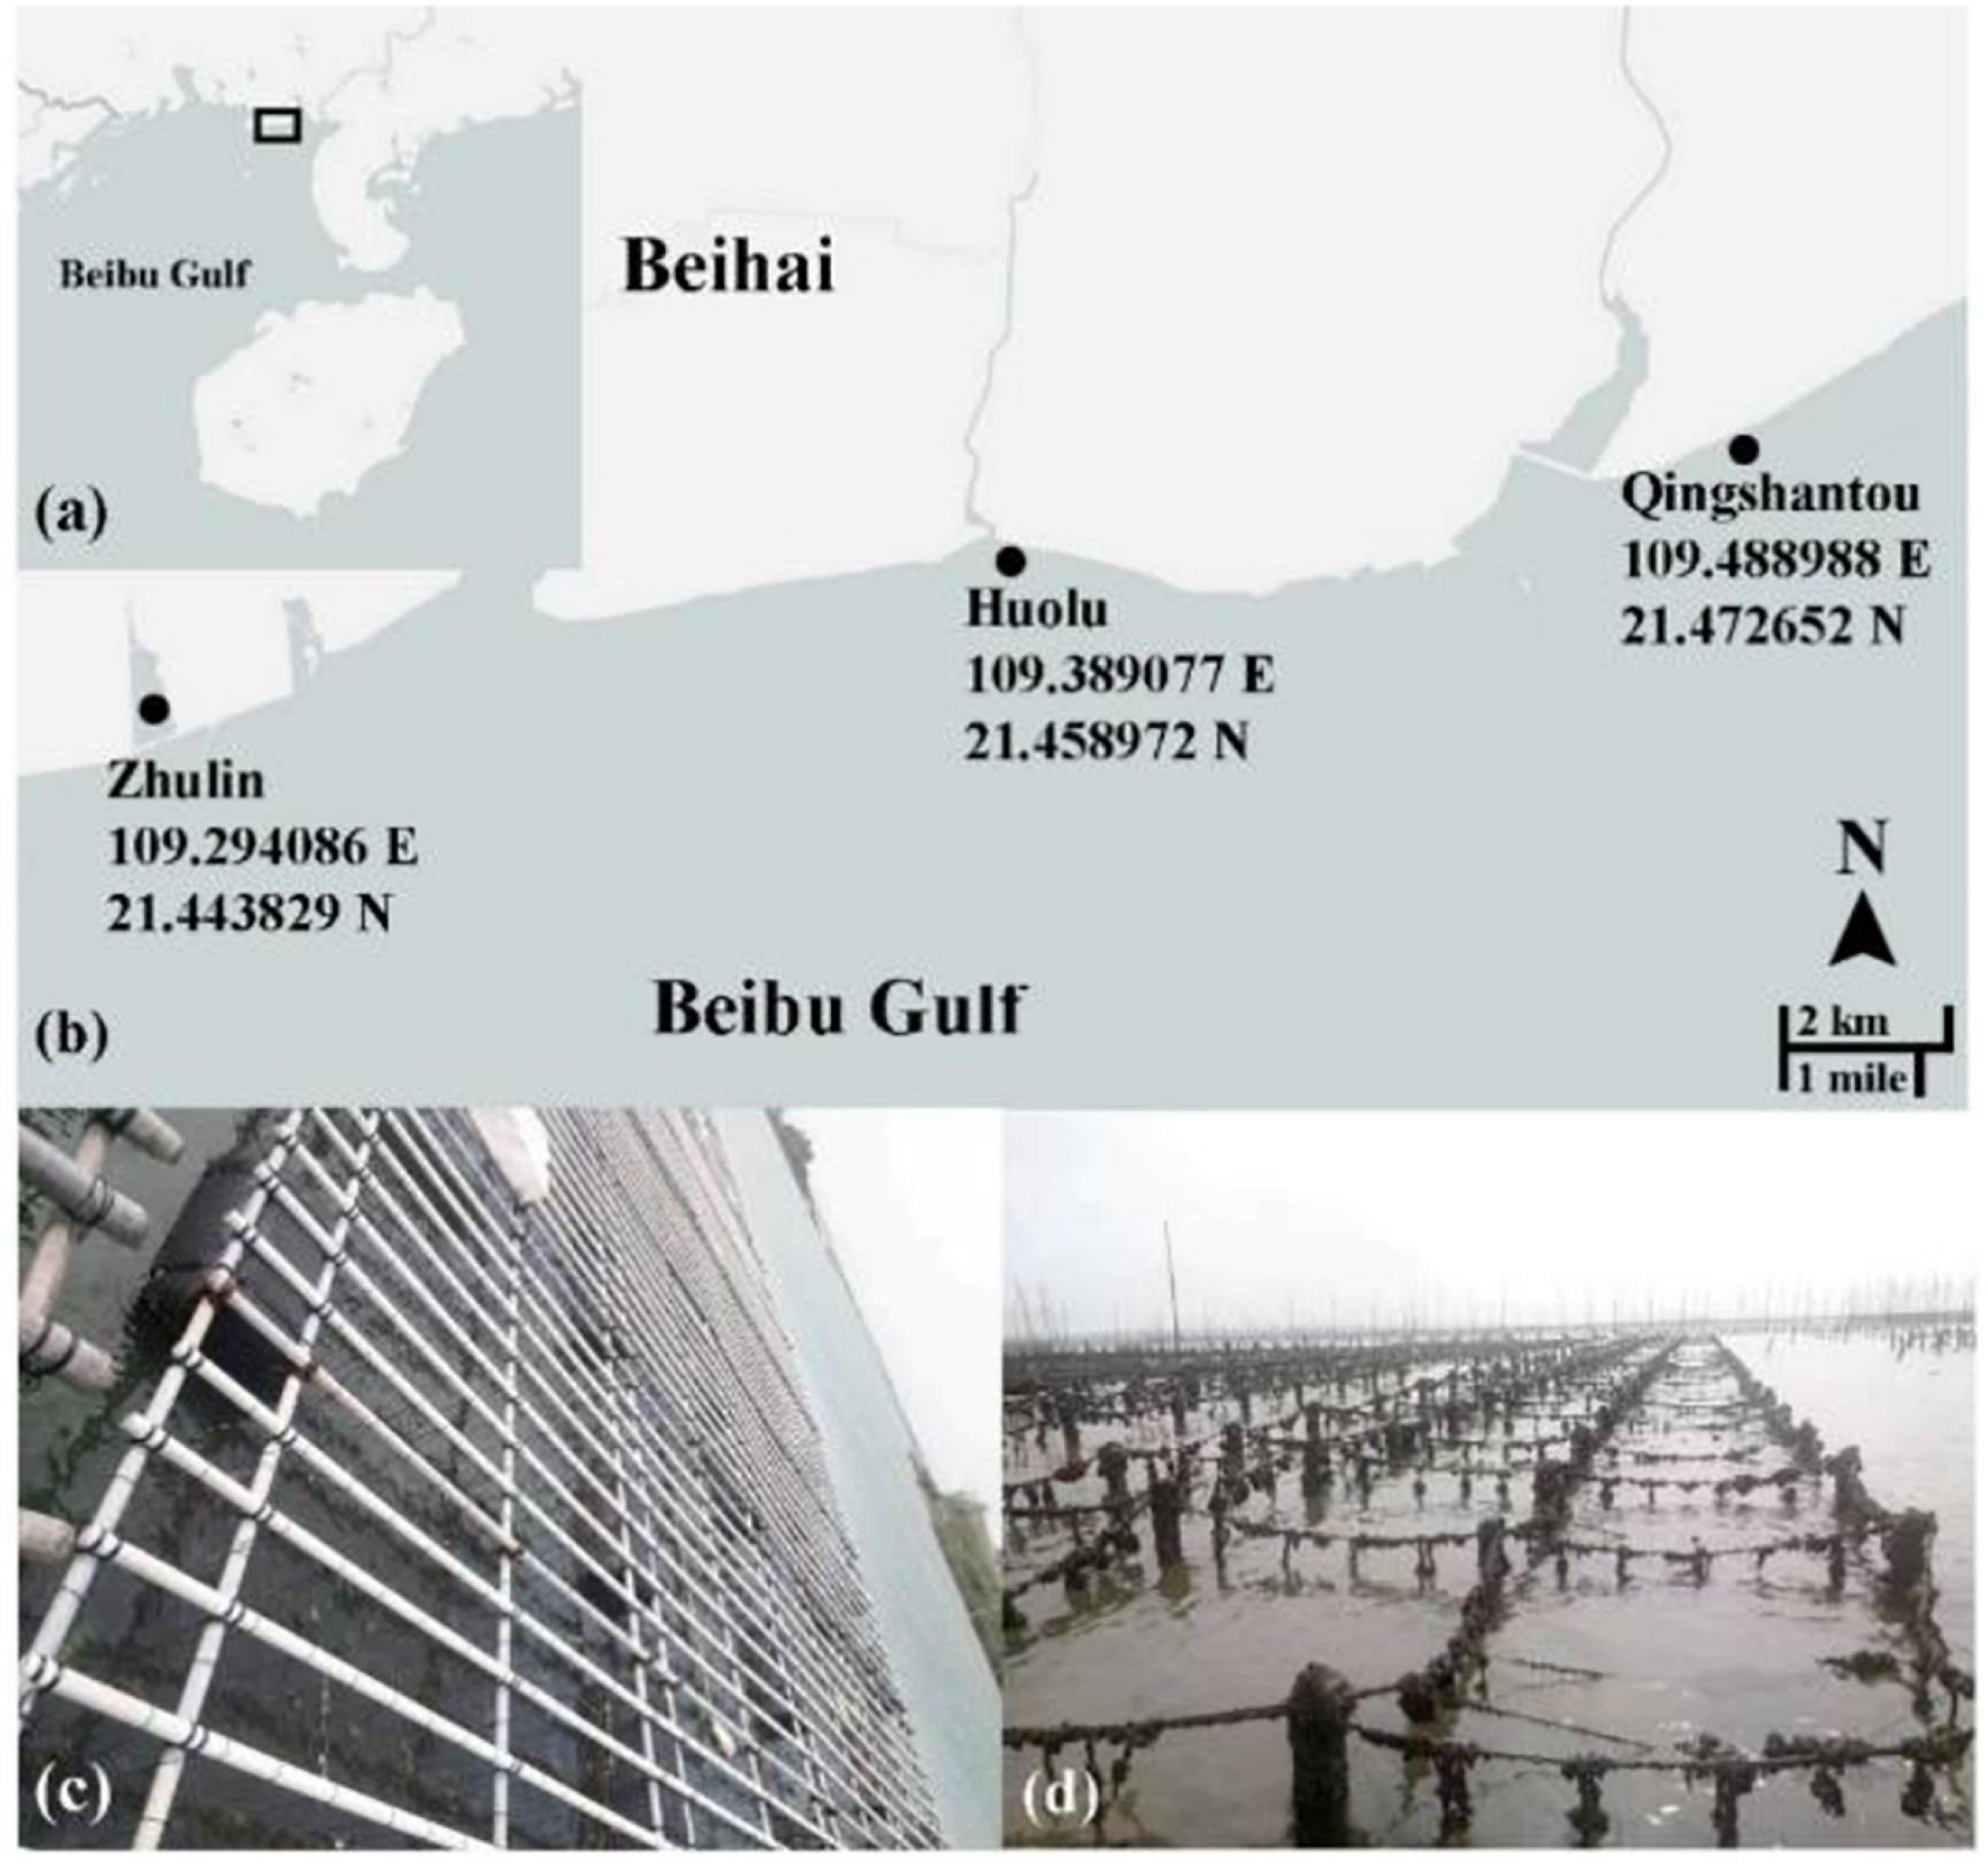
Figure 2. Culture sites and methods. (a,b) The three culture sites used in this study; (c) oyster hanging culture at Zhulin; (d) oyster off-bottom cultures at Huolu and Qingshantou.
Evaluation of Growth Performance
The shell length of oysters in each cross was measured on Days 9, 45, 210, and 360, and the shell width was measured on Days 210 and 400. The shell length on Day 9 was measured with a micrometer under a microscope (10×), and the other measurements were made using an electronic vernier caliper (accuracy 0.01 mm).
Statistical Analyses
Differences in the growth parameters on Days 9 and 45 among the different groups were analyzed by multiple comparisons using a one-way analysis of variance of the means. The growth parameters on Days 210 and 360 among the different groups were analyzed by multiple comparisons using a two-way analysis of variance of the means. The shell length and shell width were log transformed to ensure normality and homoscedasticity. All statistical analyses were performed using R software Version 3.6.3 for Windows. P < 0.05 was considered to be statistically significant.
To evaluate the effects of the genotype and environmental factors on the growth of P. martensii, a two-factor analysis of variance was used as Zhang et al. (2007):
where Yijk is the mean shell length or shell width at Days 210 and 360 of the k replicates, i genotype, and j site; Gi is the genotype effect on the mean shell length or shell width at Days 210 and 360 (i = 1, 2); Ej is the environmental effect on the mean shell length or shell width at Days 150, 210, and 360 (j = 1, 2, 3); (G × E)ij is the interaction effect between the genotype and the environmental factors; and eijk is the random observation error (k = 1, 2, 3).
Heterosis (H%) was calculated using the following formula (Eq. 1):
where F1 is the mean shell length (shell width) of the reciprocal hybrid crosses, and MP is the mean shell length (shell width) of within-family crosses.
According to Falconer and Mackay (1996), the intensity of selection was calculated as the difference in mean shell width between the selected parents and the base population divided by the standard deviation of the population. The realized heritability (h2R) was calculated following as Hadley et al. (1991):
According to Wang (2017), Eq. 2 was adjusted to Eq. 3 to calculate the realized heritability of the reciprocal hybrid crosses for a selected group:
where XS and XC are the mean shell width of offspring in selected and control groups, respectively; σc is the standard deviation of control offspring; and i is the intensity of selection (i1 for Family A and i2 for Family B). The standard response to selection (SR) was estimated as Zheng et al. (2006):
Current genetic gain (GG) was calculated following Zheng et al. (2006):
The magnitude of inbreeding depression (ID) was calculated using the following equation (Zhang et al., 2020):
where δX is the estimate of ID for family X; SX is the mean phenotypic value of offspring from within-family crosses; and PX is the mean phenotypic value of offspring from reciprocal hybrid crosses.
Results
Growth Parameters of Different Groups
Figure 3 show the growth of shell length and shell width, respectively, in the different groups. The growth rates of each group differed, and the differences began to appear during the larval stage (Day 9). On Day 9, the shell length of the SAB group was the largest at 103.41 ± 9.95 μm, which was significantly larger than that of the other groups (P < 0.05) (Figure 3A). On Day 45, the shell length of the SAA group was the largest, followed by that of the CAA group. The difference between these two groups was not statistically significant (P > 0.05), but their values were significantly higher than those of the other groups (P < 0.05) (Figure 3B).
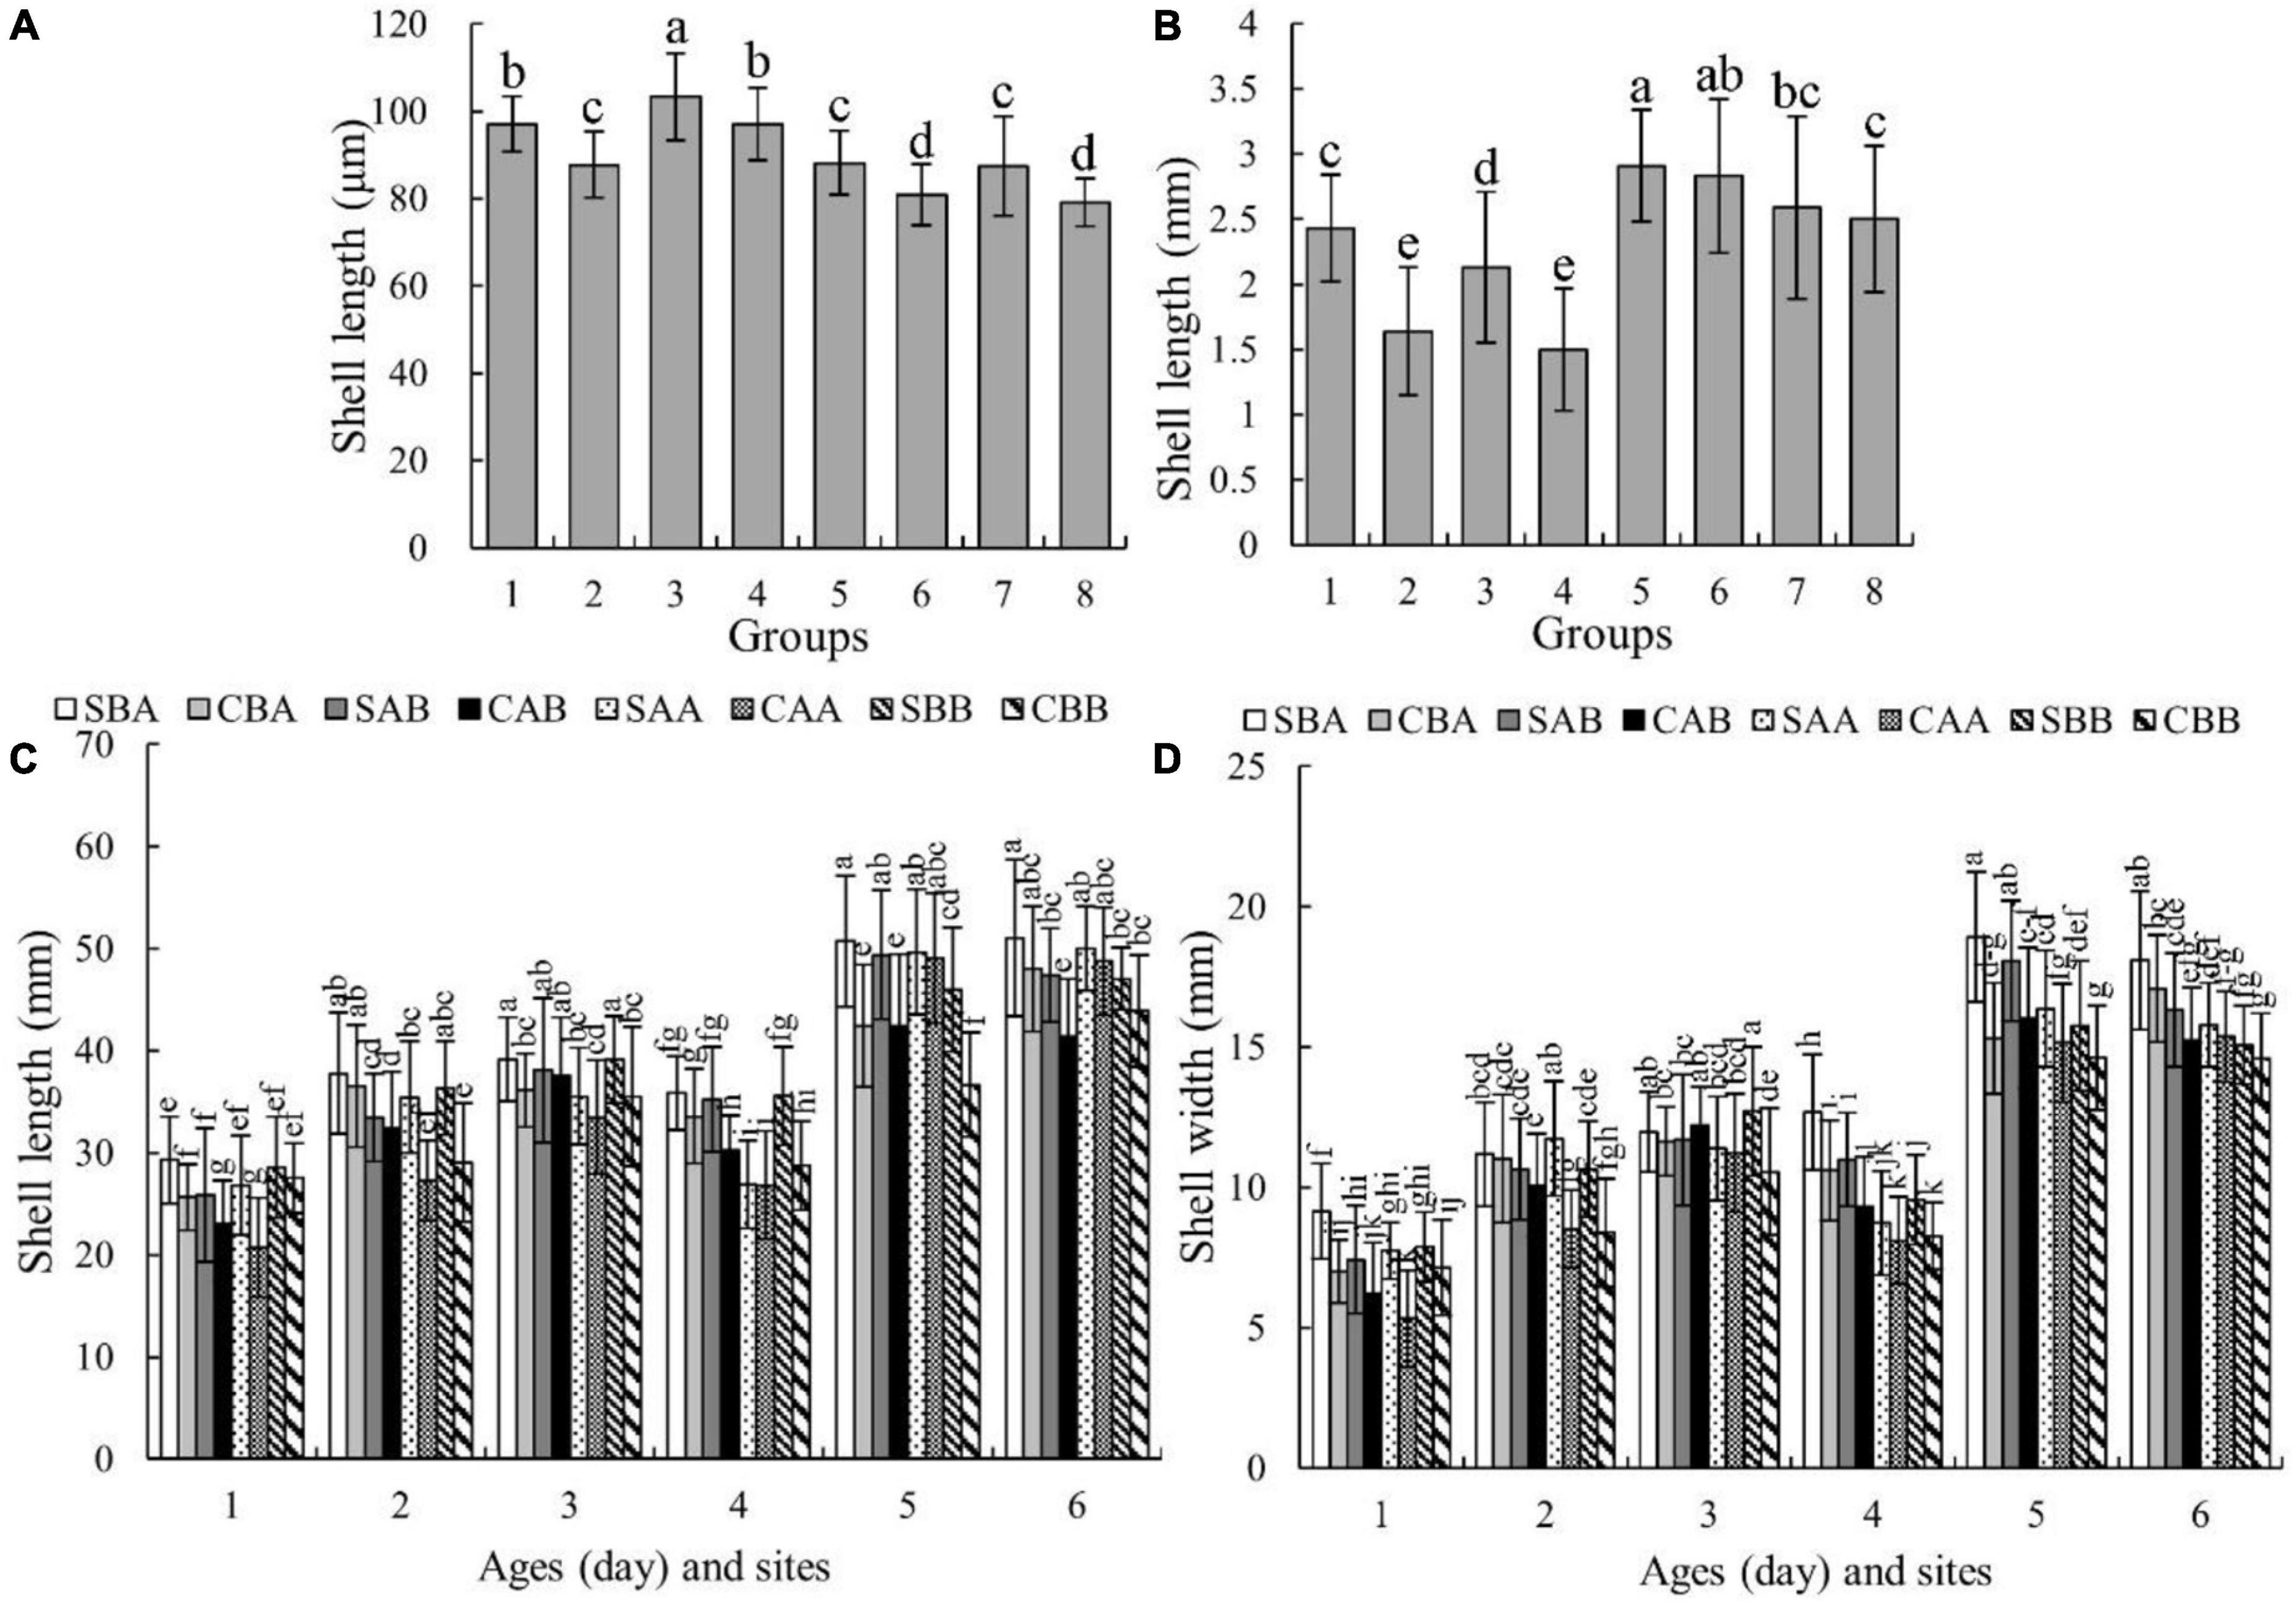
Figure 3. The shell length and shell width of each group of P. martensii at different ages and sites. The different letters at each age indicate significant differences among groups (P < 0.05). (A) Shell length on Day 9, on the horizontal, 1 for SBA, 2 for CBA, 3 for SAB, 4 for CAB, 5 for SAA, 6 for CAA, 7 for SBB, 8 for CBB; (B) shell length on Day 45, on the horizontal, 1 for SBA, 2 for CBA, 3 for SAB, 4 for CAB, 5 for SAA, 6 for CAA, 7 for SBB, 8 for CBB; (C) shell length on Day 210 and 360, on the horizontal, 1 for Day 210 at Zhulin site, 2 for Day 210 at Huolu site, 3 for Day 210 at Qingshantou site, 4 for Day 360 at Zhulin site, 5 for Day 360 at Huolu site, 6 for Day 360 at Qingshantou site; (D) shell width on Day 210 and 360, on the horizontal, 1 for Day 210 at Zhulin site, 2 for Day 210 at Huolu site, 3 for Day 210 at Qingshantou site, 4 for Day 360 at Zhulin site, 5 for Day 360 at Huolu site, 6 for Day 360 at Qingshantou site.
During the grow-out stage, both shell length and width were significantly affected by genotype, environmental factors, and the interaction of genotype and environmental factors (Table 3). Among the three sites, the shell length of each group was smallest at Zhulin, and the shell lengths of the SBA group on Days 210 and 360 were the largest among the groups within a given site (Figure 3C). The shell width of each group was the smallest at Zhulin on Days 210 and 360. With the exception of the SAB group at Qingshantou on Day 210, which had a smaller shell width than that of the CAB group, shell widths were always larger in selected groups than in the control groups. On Day 210, the groups with the largest shell widths at Zhulin, Huolu, and Qingshantou were SBA (9.15 ± 1.69 μm), SAA (11.74 ± 2.03 μm), and SBB (12.71 μm), respectively. On Day 360, the shell width of the SBA group was the largest at all three sites (Figure 3D).
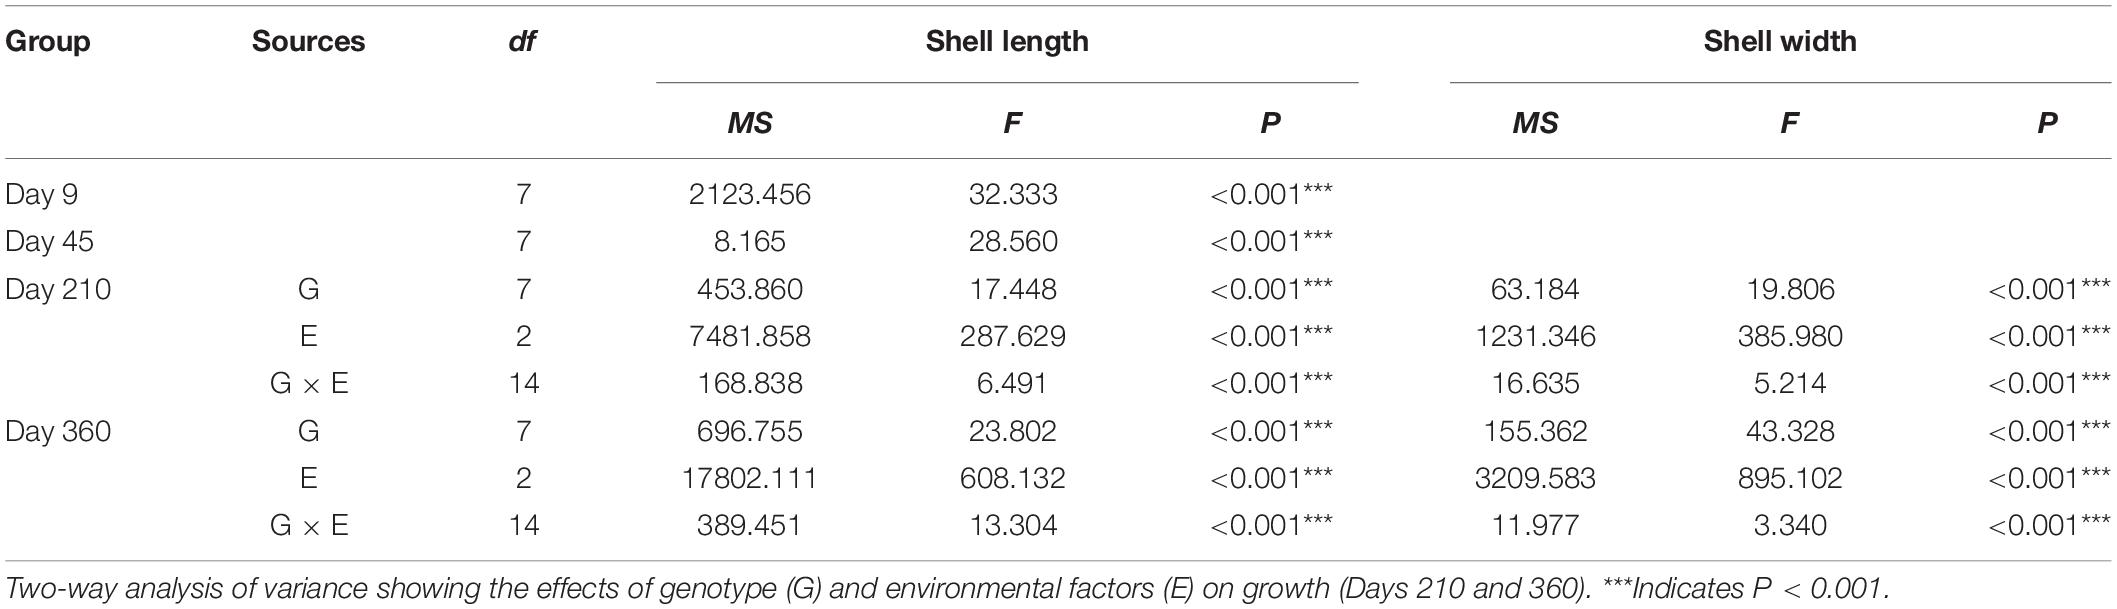
Table 3. One-way analysis of variance showing the differences in growth parameters among different groups (Days 9 and 45) of P. martensii.
Heterosis
Table 4 shows the heterosis results of shell length and shell width for each cross. In general, from the larval stage to the grow-out stage, the heterosis of the selected groups first decreased and then increased, whereas the control groups decreased, increased, and then decreased again. Shell length did not show heterosis in the CAB group (H% = –0.26%), but all of the other crosses exhibited heterosis at the end of the experiment. The shell width of each cross showed heterosis on Day 360, and the SBA group had the largest value (H% = 26.12%).
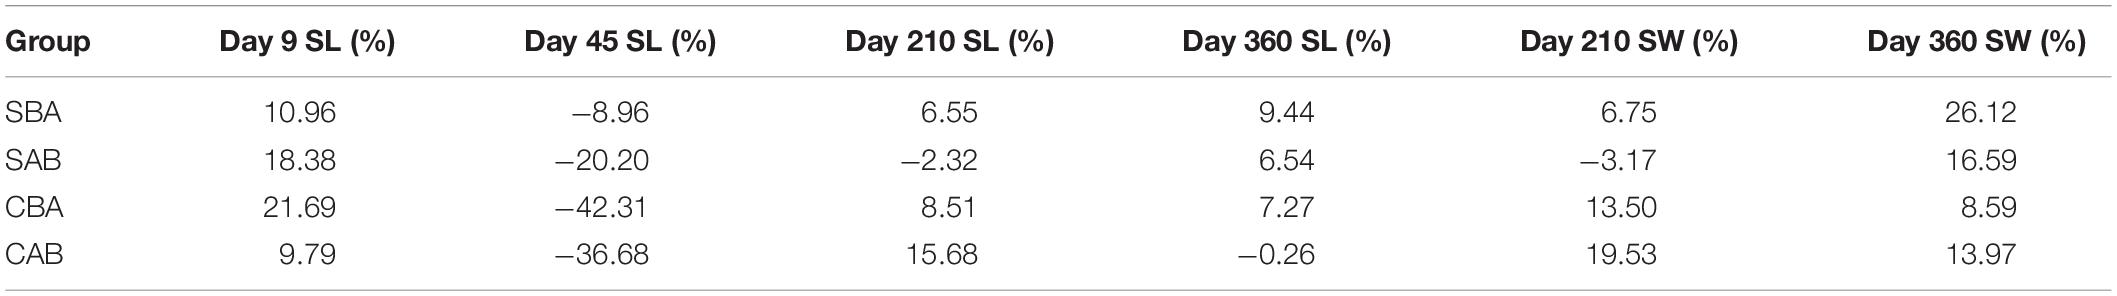
Table 4. Heterosis values for growth of reciprocal hybrid crosses of P. martensii (SL: shell length; SW: shell width).
Inbreeding Depression
Table 5 presents the results of ID analysis. During the entire growth period, the growth of the four within-family crosses showed varying degrees of ID. Values ranged from 6.01 to 7.18% in the larval stage (Day 9), but none of the four within-family crosses showed ID by the juvenile stage (Day 45). On Day 210, the shell lengths of the two selected groups exhibited ID values of 2.76% (SAA) and 5.16% (SBB). The shell widths of all but the SBB group showed ID. At the end of the experiment (Day 360), the ID rates for shell length (6.37%) and width (6.61%) were largest in the SBB group.
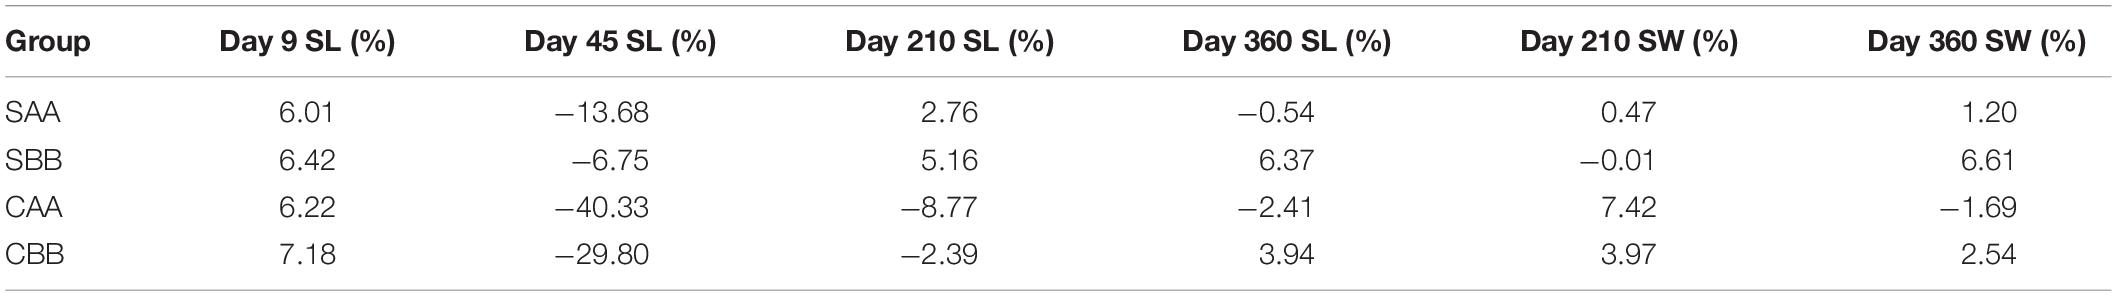
Table 5. Inbreeding depression of growth for within-family crosses of P. martensii (SL: shell length; SW: shell width).
Shell Width Genetic Parameters
Table 6 shows the realized heritability, standard response to selection, and current genetic gain values for shell width for the four selected groups during the grow-out stage (Days 210 and 360). The three genetic parameters for the reciprocal hybrid crosses all increased, whereas they decreased for the within-family crosses. On Day 210, the values of the three genetic parameters were highest in the SAA group and lowest in the SAB group, whereas on Day 360 the values were highest in the SBA group and lowest in the SAA group.
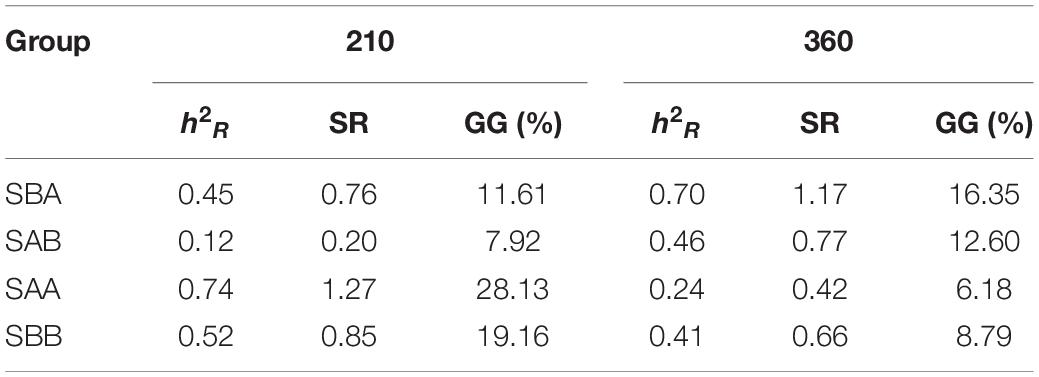
Table 6. Realized heritability (hR2), standardized response to selection (SR), and current genetic gain (GG) of selected groups of P. martensii.
Discussion
According to New (1991), aquaculture production may have to increase to 63 million tons in 2025 to meet the expected demands. The future needs for aquatic products cannot be met without a substantial increase in aquaculture production because the harvest of many wild stocks has come close to or exceeded the limits of sustainable exploitation (Bentsen and Olesen, 2002). Genetic improvement and domestication are proven routes to increasing agricultural productivity (Hedgecock, 2011). The results of our study indicated that the shell length and width of almost all selected groups were greater than those of the corresponding control groups from the larval stage (Day 9) to the adult stage (Day 360), regardless of mating method or culture site, but the differences were not all statistically significant. The initial selective trait in this study was shell width, so the shell length advantage of the selected groups may be due to the strong correlation between shell length and width of P. martensii. Additionally, the operation methods were the same throughout the experiment at a given site, which suggests that the differences in growth between the selected groups and the control groups were caused by genetics (changes in gene frequency caused by selection).
When planning a selective breeding program, the genotype-environment interaction is one of the important factors that must be considered. The selection led to changes in gene frequency, which in turn led to changes in genotypes, and different genotypes had different sensitivity to the environment. Therefore, the interaction may be related to the sensitivity of different genotypes to the environment (Falconer and Mackay, 1996). Genotype-environment interactions are common in shellfish culture, which may reflect poor control of the environment by shellfish (Evans and Langdon, 2006). Thus, in future breeding projects, we can choose genotypes that are less sensitive to the environment and/or we can breed strains that adapt to specific environments. In this study, the shell length and width of P. martensii were significantly affected by genotype-environment interaction. We found that the growth of each group at the Zhulin site at each time point was the slowest. The Huolu site and Qingshantou site were more suitable for pearl oyster aquaculture than the Zhulin site. This may be due to the low frequency of seawater exchange and the deposition of harmful substances, which make this site unsuitable for the rapid growth of P. martensii.
Throughout the experimental period, only spat at the juvenile stage (Day 45) did not show heterosis, whereas other stages exhibited a certain degree of heterosis. On Day 360, all reciprocal hybrid crosses except for the CAB group showed heterosis for shell length. The emergence of heterosis indicated a difference in gene frequency between the two families (Zhang et al., 2017). Maintaining two or more populations with different genetic bases as parents for reciprocal crosses is considered to be a good choice for selective breeding, as it may produce heterosis (Goyard et al., 2008). The parents used in this study were the F1 generation of two families that are characterized by rapid shell width growth. The parents of the two families were ♀ Haixuan No. 1 ×♂ Nanke No. 1 and ♀ Nanke No. 1 × ♂ Haiyou No. 1. These three new P. martensii varieties were generated through multiple generations of breeding. Although they are more suitable for artificial breeding than other populations and have the advantageous traits that aquaculturists expect, they may have lost most of the allelic variability available in the wild. Nevertheless, when multiple new varieties are used to generate crosses with each other, the F1 generation is guaranteed to be hybrid because the parents are unrelated. We have already observed heterosis (unpublished data) during the growth of the offspring of these two families. However, because the offspring of each family were produced by a pair of parents, the simple use of the dominant family for mass selection may cause ID. Therefore, we first selected offspring from the two families and then used the selected population to cross and observe the growth of the hybrid offspring. Ultimately, the target traits of the two families were the same, and whether their offspring will show reduced diversity as a result remains to be determined.
Inbreeding is harmful to most organisms and leads to a reduction in fitness (Falconer, 1989). According to Evans et al. (2004), any amount of inbreeding may cause phenotypic ID. In our study, the within-family crosses in both the selection and control groups showed ID. During the entire experimental period, most of reciprocal hybrid crosses performed better than all within-family crosses. This result showed that although we exerted great intensity of selection on pearl oysters, ID is likely to be one factor that affects the growth performance of within-family crosses. ID can be explained by the hypotheses of partial dominance and over dominance (Kristensen and Sørensen, 2005; Zheng et al., 2008, 2012). Deleterious recessive effects are also thought to be a major reason for ID (Charlesworth and Charlesworth, 1999). ID is often more obvious in the early stages of animal development and relatively weak in the later stages (Bierne et al., 1998; McCune et al., 2002; Escobar et al., 2008; Anderson and Hedgecock, 2010; Plough and Hedgecock, 2011). This may be because harmful genes are eliminated with the death of individuals in the early stages of development. This phenomenon is manifested in organisms with high fertility. In our study, all within-family crosses exhibited ID at the larval stage (Day 9), whereas the opposite was observed for the juvenile stage (Day 45). This may be because during development, slow-growing individuals were prone to death, while the surviving individuals grew faster, and therefore, showed obvious inbreeding advantages in the juvenile stage. Taris et al. (2007) reported similar results for Pacific oysters. As the offspring grew, ID did not disappear but the degree was different, which may also be related to high mortality during the larval stage. For both the selected and control groups, the ID of the BB group was highest during the entire experimental period, which may be related to the degree of ID of the parents.
Several researchers have estimated genetic parameters for growth of adult P. martensii after mass selection. After Wada (1986) conducted three generations of mass selection on P. martensii, the realized heritability values of shell length and width were 0.47 and 0.35, respectively. He et al. (2006) reported that the shell length genetic gain of the first generation was 3.91%. He et al. (2008) conducted mass selection on P. martensii, and the genetic gain of shell height at harvest was 15.86% and the realized heritability was 1.065. Deng et al. (2009b) found that the 360-day-old shell length genetic gain of P. martensii was 16.6%. Wang et al. (2011) reported that the third generation breeding population of P. martensii had a genetic gain of 13.27 and 13.83% for shell length and height at 360 days, respectively. On Day 360 in our study, the shell width genetic gain of P. martensii was in the range of 6.18–16.35%. The genetic gain of the two reciprocal hybrid crosses was larger than that of the two within-family crosses. The reason for the lower genetic gain of the two within-family crosses may be related to ID because the offspring were all born from a pair of parents. When harvesting, the realized heritability of shell width ranged from 0.24 to 0.70. Like genetic gain, the realized heritability of reciprocal hybrid crosses was greater than that of within-family crosses. Only the realized heritability of the SAA groups was lower than the result reported by Wada (1986), which may be because we only carried out one generation of selection. From Days 210 to 360 in our study, the realized heritability of shell width for reciprocal hybrid crosses increased, indicating that the breeding program was effective because of the significant additive genetic variation (Dégremont et al., 2015). Newkirk (1980) predicted that the genetic improvement of shellfish will be between 10 and 20% per generation. Heritability values above 0.20 indicate that genetic improvement can be easily achieved through the application of selective breeding programs (Newkirk et al., 1977; Falconer and Mackay, 1996).
In summary, we found that using two families as the base populations for mass selection successfully improved the growth performance of P. martensii. Although the within-family crosses produced a certain degree of ID, growth was improved to a certain extent. In contrast, the growth performance of reciprocal hybrid crosses improved more significantly, resulting in greater responses to selection. Therefore, the method of combining cross-breeding and mass selection is effective. Therefore, the combination of crossbreeding and mass selection is an ideal breeding method. It can provide a large number of excellent seeds for pearl industry and alleviate the shrinking status of pearl shell industry. Of course, if we want to revitalize the pearl oyster industry in China, we still need a lot of follow-up work.
Data Availability Statement
The raw data supporting the conclusions of this article will be made available by the authors, without undue reservation.
Author Contributions
CF and XKZ designed the experiment, performed the experiments, analyzed the data, wrote the manuscript, and revised manuscript. LT designed the experiment and performed the experiments. XZZ, JL, and YL performed the experiments. QL supported site. ZW revised the manuscript. All authors contributed to the article and approved the submitted version.
Funding
This project was funded by the National Natural Science Foundation of China.
Conflict of Interest
The authors declare that the research was conducted in the absence of any commercial or financial relationships that could be construed as a potential conflict of interest.
Publisher’s Note
All claims expressed in this article are solely those of the authors and do not necessarily represent those of their affiliated organizations, or those of the publisher, the editors and the reviewers. Any product that may be evaluated in this article, or claim that may be made by its manufacturer, is not guaranteed or endorsed by the publisher.
Acknowledgments
We thank Beihai Xiaoyuzhou Cooperative and Guangxi Jinggong Marine Science and Technology Co., Ltd. for providing the experimental sites. We are also grateful to the reviewers for reviewing our manuscript.
References
Anderson, D., and Hedgecock, D. (2010). Inbreeding depression and growth heterosis in larvae of the purple sea urchin Stronglyocentrotus purpuratus (Stimpson). J. Exp. Mar. Biol. Ecol. 384, 68–75. doi: 10.1016/j.jembe.2009.12.005
Barros, J., Velasco, L. A., and Winkler, F. M. (2018). Heritability, genetic correlations and genotype by environment interactions in productive traits of the Caribbean scallop, Argopecten nucleus (Mollusca: bivalvia). Aquaculture 488, 39–48. doi: 10.1016/j.aquaculture.2018.01.011
Bentsen, H. B., and Olesen, I. (2002). Designing aquaculture mass selection programs to avoid high inbreeding rates. Aquaculture 204, 349–359.
Bierne, N., Launey, S., Naciri-Graven, Y., and Bonhomme, F. (1998). Early effect of inbreeding as revealed by microsatellite analyses on Ostrea edulis larvae. Genetics 148, 1893–1906. doi: 10.1093/genetics/148.4.1893
Charlesworth, B., and Charlesworth, D. (1999). The genetic basis of inbreeding depression. Genet. Res. 74, 329–340.
Dégremont, L., Nourry, M., and Maurouard, E. (2015). Mass selection for survival and resistance to OsHV-1 infection in Crassostrea gigas spat in field conditions: response to selection after four generations. Aquaculture 446, 111–121. doi: 10.1016/j.aquaculture.2015.04.029
Deng, Y. W., Fu, S., Du, X. D., and Wang, Q. H. (2009a). Realized heritability and genetic gain estimates of larval shell length in the chinese pearl oyster Pinctada martensii at three different salinities. North Am. J. Aquac. 71, 302–306. doi: 10.1577/a08-024.1
Deng, Y. W., Du, X. D., and Wang, Q. H. (2009b). Selection for fast growth in the Chinese pearl oyster, Pinctada martensii: response of the first generation line. J. World Aquac. Soc. 40, 843–847. doi: 10.1111/j.1749-7345.2009.00307.x
Du, X. D., Deng, Y. W., Wang, Q. H., Xie, S. H., and Liu, D. (2015). Haixuan No 1 stock of pearl oyster Pinctada martensii. China Fish 10, 53–56.
Escobar, J. S., Nicot, A., and David, P. (2008). The different sources of variation in inbreeding depression, heterosis and outbreeding depression in a metapopulation of Physa acuta. Genetics 180, 1593–1608. doi: 10.1534/genetics.108.092718
Evans, F., Matson, S., Brake, J., and Langdon, C. (2004). The effects of inbreeding on performance traits of adult Pacific oysters (Crassostrea gigas). Aquaculture 230, 89–98. doi: 10.1016/j.aquaculture.2003.09.023
Evans, S., and Langdon, C. (2006). Effects of genotype×environment interactions on the selection of broadly adapted Pacific oysters (Crassostrea gigas). Aquaculture 261, 522–534.
Falconer, D. S., and Mackay, T. F. C. (1996). Introduction to Quantitative Genetics, 4th Edn. London: Pearson Education Limited, Essex.
Gjedrem, T., and Baranski, M. (2009). Selective Breeding in Aquaculture: An Introduction. Dordrecht: Springer Netherlands.
Gjedrem, T., and Baranski, M. (2010). Selective Breeding in Aquaculture: An Introduction, Vol. 10. Berlin: Springer Science & Business Media.
Gjedrem, T., Robinson, N., and Rye, M. (2012). The importance of selective breeding in aquaculture to meet future demands for animal protein: a review. Aquaculture 350–353, 117–129. doi: 10.1016/j.aquaculture.2012.04.008
Gjedrem, T., and Rye, M. (2018). Selection response in fish and shellfish: a review. Rev. Aquac. 10, 168–179. doi: 10.1111/raq.12154
Goyard, E., Goarant, C., Ansquer, D., Brun, P., Decker, S., Dufour, R., et al. (2008). Cross breeding of different domesticated lines as a simple way for genetic improvement in small aquaculture industries: heterosis and inbreeding effects on growth and survival rates of the Pacific blue shrimp Penaeus (Litopenaeus) stylirostris. Aquaculture 278, 43–50. doi: 10.1016/j.aquaculture.2008.03.018
Gu, Z. F., Shi, Y. H., Wang, Y., and Wang, A. M. (2011). Heritable characteristics in the pearl oyster Pinctada martensii: comparisons of growth and shell morphology of Chinese and Indian populations, and reciprocal crosses. J. Shellfish Res. 30, 241–246. doi: 10.2983/035.030.0207
Gu, Z. F., Wang, Q. Y., Fang, J. G., Ye, N. H., Mao, Y. Z., Shi, Y. H., et al. (2009). Growth of cultured pearl oyster (Pinctada martensii) in Li’an Lagoon, Hainan Island, China. J. Shellfish Res. 28, 465–470. doi: 10.2983/035.028.0307
Hadley, N. H., Dillon, R. T., and Manzi, J. J. (1991). Realized heritability of growth rate in the hard clam Mercenaria mercenaria. Aquaculture 93, 109–119. doi: 10.1016/0044-8486(91)90210-x
He, G., Liu, X., Xu, Y., Liang, J., Deng, Y., Zhang, Y., et al. (2021). Repeated exposure to simulated marine heatwaves enhances the thermal tolerance in pearl oysters. Aquatic. Toxicol. 239:105959. doi: 10.1016/j.aquatox.2021.105959
He, M. X., Guan, Y. Y., Yuan, T., and Zhang, H. Y. (2008). Realized heritability and response to selection for shell height in the pearl oyster Pinctada fucata (Gould). Aquac. Res. 39, 801–805. doi: 10.1111/j.1365-2109.2008.01889.x
He, M. X., Shi, J. H., Lin, Y. G., and Jiang, Y. P. (2006). Studies on growth traits of first generation of selective line of Pinctada martensii Dunker. J. Tropical Oceanogr. 25, 19–22.
Hedgecock, D. (2011). Genetics of Shellfish on a Human-Dominated Planet. Shellfish Aquaculture and the Environment Chichester, West Sussex, UK. Hoboken, NJ: Wiley, 339–357.
Huo, Z. M., Yan, X. W., Zhao, L. Q., Liang, J., Yang, F., and Zhang, G. F. (2015). Larval and juvenile growth performance of Manila clam hybrids of two full-sib families. J. Ocean Univ. China 14, 564–568. doi: 10.1007/s11802-015-2354-1
Kristensen, T. N., and Sørensen, A. C. (2005). Inbreeding–lessons from animal breeding, evolutionary biology and conservation genetics. Anim. Sci. 80, 121–133. doi: 10.1079/asc41960121
Li, J. H., Luo, Y. Q., Zhong, Y. S., Huang, Y., Huang, R. L., Wang, Q. H., et al. (2017). Effects of inbreeding on growth traits, genetic diversity and biomineraliazation gene expression of Pinctada fuctada martensii. J. Southern Agric. 48, 132–138.
Li, Q., Wang, Q. H., Liu, S. K., and Kong, L. F. (2011). Selection response and realized heritability for growth in three stocks of the Pacific oyster Crassostrea gigas. Fisheries Sci. 77, 643–648.
Li, Z. L. (2012). Brief introduction to the varieties approved by the fourth meeting of the Fourth National Committee for the examination and approval of original and improved varieties of aquatic products. China Fish. 6, 54–55.
Liu, W. G., Lin, J. S., and He, M. X. (2011). Evaluation on mid-term growth of 9 families of pearl oyster Pinctada fucata. South China Fish. Sci. 7, 30–36.
McCune, A. R., Fuller, R. C., Aquilina, A. A., Dawley, R. M., Fadool, J. M., Houle, D., et al. (2002). A low genomic number of recessive lethals in natural populations of bluefin killifish and zebrafish. Science 296, 2398–2401. doi: 10.1126/science.1071757
Newkirk, G. F. (1980). Review of the genetics and the potential for selective breeding of commercially important bivalves. Aquaculture 19, 209–228. doi: 10.1016/0044-8486(80)90045-9
Newkirk, G. F., Haley, L. E., Waugh, D. L., and Doyle, R. (1977). Genetics of larvae and spat growth rate in the oyster Crassostrea virginica. Mar. Biol. 41, 49–52. doi: 10.1007/bf00390580
Ohta, H., Kawamoto, T., Isowa, K., Aoki, H., Hayashi, M., Narita, T., et al. (2007). Motility of spermatozoa obtained from testes of Japanese pearl oyster Pinctada fucata martensii. Fish. Sci. 73, 107–111. doi: 10.1111/j.1444-2906.2007.01308.x
Plough, L. V., and Hedgecock, D. (2011). Quantitative trait locus analysis of stage-specific inbreeding depression in the pacific oyster Crassostrea gigas. Genetics 189, 1473–1486. doi: 10.1534/genetics.111.131854
Qin, Y. P., Xiao, S., Ma, H. T., Mo, R. G., Zhou, Z. H., Wu, X. W., et al. (2018). Effects of salinity and temperature on the timing of germinal vesicle breakdown and polar body release in diploid and triploid Hong Kong oysters, Crassostrea hongkongensis, in relation to tetraploid induction. Aquac. Res. 49, 3647–3657. doi: 10.1111/are.13833
Shi, Y. H., Kui, H., Guo, X. M., Gu, Z. F., Wang, Y., and Wang, A. M. (2009). Genetic linkage map of the pearl oyster, Pinctada martensii (Dunker): genetic map of Pinctada martensii. Aquac. Res. 41, 35–44. doi: 10.1111/j.1365-2109.2009.02299.x
Taris, N., Batista, F. M., and Boudry, P. (2007). Evidence of response to unintentional selection for faster development and inbreeding depression in Crassostrea gigas larvae. Aquaculture 272, S69–S79.
Wada, K. T. (1986). Genetic selection for shell traits in the Japanese pearl oyster, Pinctada fucata martensii. Aquaculture 57, 171–176. doi: 10.1016/0044-8486(86)90194-8
Wang, Q. H., Deng, Y. W., Du, X. D., Fu, S., and Lu, Y. Z. (2011). Realized heritability and genetic gains of three generation for superior growth in the pearl oyster Pinctada martensii. Acta Ecol. Sin. 31, 108–111. doi: 10.1016/j.chnaes.2010.12.001
Wang, X. B., Ding, S. Q., Yin, D. D., Song, J., and Chang, Y. Q. (2020). Response to selection for growth in the second generation of two shell color lines of the bay scallop Argopecten irradians. Aquaculture 528:735536. doi: 10.1016/j.aquaculture.2020.735536
Zhang, H. B., Liu, X., Zhang, G. F., and Wang, C. D. (2007). Growth and survival of reciprocal crosses between two bay scallops, Argopecten irradians concentricus Say and A. irradians irradians Lamarck. Aquaculture 272, S88–S93.
Zhang, Y. H., Ma, H. T., Li, X. Y., Zhou, Z. H., Li, J., Wei, J. K., et al. (2020). Analysis of inbreeding depression on performance traits of three giant clams (Tridacna derasa, T. squamosa, and T. crocea) in the South China Sea. Aquaculture 521:735023. doi: 10.1016/j.aquaculture.2020.735023
Zhang, Y. H., Su, J. Q., Li, J., Zhang, Y., Xiao, S., and Yu, Z. N. (2017). Survival and growth of reciprocal crosses between two stocks of the Hong Kong oyster Crassostrea hongkongensis (Lam & Morton, 2003) in southern China. Aquaculture Res. 48, 2344–2354.
Zhao, L., Liu, L., Liu, B., Liang, J., Lu, Y., and Yang, F. (2019). Antioxidant responses to seawater acidification in an invasive fouling mussel are alleviated by transgenerational acclimation. Aquatic Toxicol. 217:105331. doi: 10.1016/j.aquatox.2019.105331
Zhao, L., Shirai, K., Tanaka, K., Milano, S., Higuchi, T., Murakami-Sugihara, N., et al. (2020). A review of transgenerational effects of ocean acidification on marine bivalves and their implications for sclerochronology. Estuarine Coastal Shelf Sci. 235:106620.
Zhao, L., Yan, X., Huo, Z., Yang, F., and Zhang, G. (2012). Divergent selection for shell length in the Manila clam, Ruditapes philippinarum. J. World Aquaculture Soc. 43, 878–884. doi: 10.1111/j.1749-7345.2012.00612.x
Zheng, H. P., Li, L., and Zhang, G. F. (2012). Inbreeding depression for fitness-related traits and purging the genetic load in the hermaphroditic bay scallop Argopecten irradians irradians (Mollusca: bivalvia). Aquaculture 366, 27–33.
Zheng, H. P., Zhang, G. F., Guo, X. M., and Liu, X. (2008). Inbreeding depression for various traits in two cultured populations of the American bay scallop, Argopecten irradians irradians Lamarck (1819) introduced into China. J. Exp. Mar. Biol. Ecol. 364, 42–47.
Keywords: Pinctada martensii, mass selection, hybridization, production performance, response to selection
Citation: Fan C, Zhang X, Tang L, Zhang X, Li J, Li Y, Li Q and Wang Z (2022) Study on the Effect of Mass Selection and Hybridization on Growth Performance of Chinese Pearl Oyster Pinctada martensii. Front. Mar. Sci. 9:851142. doi: 10.3389/fmars.2022.851142
Received: 09 January 2022; Accepted: 24 January 2022;
Published: 15 February 2022.
Edited by:
Liqiang Zhao, Guangdong Ocean University, ChinaReviewed by:
Yanping Qin, South China Sea Institute of Oceanology, Chinese Academy of Sciences (CAS), ChinaZhe Zheng, Guangdong Ocean University, China
Copyright © 2022 Fan, Zhang, Tang, Zhang, Li, Li, Li and Wang. This is an open-access article distributed under the terms of the Creative Commons Attribution License (CC BY). The use, distribution or reproduction in other forums is permitted, provided the original author(s) and the copyright owner(s) are credited and that the original publication in this journal is cited, in accordance with accepted academic practice. No use, distribution or reproduction is permitted which does not comply with these terms.
*Correspondence: Zhaoping Wang, enB3YW5nQG91Yy5lZHUuY24=
†These authors have contributed equally to this work