- 1Ocean College, Zhejiang University, Zhoushan, China
- 2State Key Laboratory of Satellite Ocean Environment Dynamics, Second Institute of Oceanography, MNR, Hangzhou, China
- 3School of Oceanography, Shanghai Jiao Tong University, Shanghai, China
Water temperature in estuaries is sensitive to thermal discharges and expansive tidal flats; as such, this parameter is essential in maintaining estuarine ecosystem. Semi-enclosed water bodies with poor water exchange easily accumulate heat. This is especially true for Xiangshan Bay, which contains two power plants and a large area of tidal flats. This bay was used as an example to study water temperature and heat dynamics, considering the thermal discharge and tidal flats. This study developed and validated a three-dimensional hydro-heat flux numerical model using field data on tidal elevation, currents, water temperature, and tidal flat temperature. The Finite Volume Community Ocean Model combines an accurate thermal discharge model with the air-water-tidal flat heat flux model. The findings showed that thermal discharge provides heat to the bay in summer and winter, and increases the water temperature of the entire bay by 0.7°C in summer, while maintaining water temperature at 0.52°C in winter. The atmosphere and open seas had greater impacts on heat in the bay in winter and summer. The atmosphere and tidal flats provided heat to the bay in summer and absorbed heat from the bay during winter; the opposite was true for the open sea. The effect of tidal flats in summer is less than that in winter, and provides 1.31 × 10¹³ J of heat to the bay in summer, while taking 8.63 × 10¹³ J of heat from the bay in winter. This study provides a comprehensive understanding of the effects of tidal flats and thermal discharge on water temperature and heat in macro-tidal bays and estuaries; its results are applicable to similar bays around the world.
Introduction
Water temperature in bays and estuaries is a fundamental factor for estuarine ecosystems and marine aquaculture. In macro-tidal estuaries experiencing intense human activity, seawater temperature is sensitive to atmospheric temperature and is affected by the temperature of large tidal flats and thermal discharges. As such, accurate seawater temperature prediction is important for climate and ecosystems research (Cho et al., 2000).
Local water temperature increases in estuaries as a result of the discharge of cooling water from power plants have become a major ecological problem. A relatively stable temperature is essential for stable marine ecosystems, and thermal contamination of these ecosystems causes serious environmental problems. For example, the warming of water from thermal discharge gradually increases the content of total ammoniacal nitrogen and phosphorus (Jin, 1993). As thermal discharge also increases the pH of the water body, the elevated water temperature and pH triggers a rise in the non-ionic ammonia content (Xu et al., 1994). When water temperature rises from 8 to 18°C, there is a two-fold increase in the toxicity of potassium cyanide to fish. When there is a further increase in water temperature to 30°C, there is a two to four-fold increase in the toxicity of copper, zinc, and cadmium metal ions to zooplankton and benthic animals (Huang and Ye, 2014). Some studies have reported that thermal pollution increases the toxicity of harmful substances in water and deteriorates water bodies (Friedlander et al., 1996). Thermal discharge causes the local seawater temperature to increase and its density to decrease. Marine organisms have a poor tolerance to water temperature change, and as such, are more affected by thermal pollution; thus, relatively minor temperature changes will be detrimental to many marine species. These environmental impacts demonstrate that the effect of thermal discharges on the marine environment cannot be ignored (Roemmich and McGowan, 1995).
Thermal discharges not only increase the water temperature surrounding the point of input, they also affect initial productivity and alter the ecosystem (Lin and Zhan, 2000; Rajadurai et al., 2005; Jiang et al., 2016). Initial productivity refers to the ability of primary producers in the ocean (e.g., phytoplankton), to generate organic matter through photosynthesis. Previous studies have focused on the temperature difference between thermal discharges and ambient water (Roy et al., 2021), seasonal variations from changing thermal discharges (Lin et al., 2021), and the effects of thermal discharge on ecosystems (Dong et al., 2021; Xu et al., 2021). Numerical models have been improved to consider the elevation of temperature in water bodies near power plants (Zhu, 2007; He et al., 2008; Salgueiro et al., 2015). Previous studies on thermal discharge have used the heat dissipation coefficient in numerical models to characterize the influence of the sea surface heat dissipation effect. However, this coefficient only considers the combined effect of convection, thermal radiation, and evaporation; it cannot fully reflect detailed heat transfer processes, such as sensible heat flux, latent heat flux, and radiation. This indicates that sea surface heat flux terms must be explicitly incorporated to accurately simulate water temperature in the presence of thermal discharge (Zhang, 2015).
Seawater temperature in macro-tidal estuaries is also sensitive to tidal flats, as these flats interact with the atmosphere and water, thereby influencing the heat budget (Kim and Cho, 2009, 2011). Previous studies have demonstrated that tidal flats affect estuarine hydrodynamics, sediment dynamics, and thermal discharge processes (Sohma et al., 2001; Shen-Liang et al., 2004; Yanagi et al., 2005; Li et al., 2017a,b, 2018). Some researchers have investigated the laws and calculation methods used for soil heat and temperature, applying these to tidal flats (Guarini et al., 1997; Campbell and Norman, 1998); others have evaluated the relationship between tidal flats and groundwater (Hou et al., 2016; Nakashita et al., 2016). The exposure and inundation of tidal flats can also affect the temperature of nearby water bodies (Cho et al., 2005); notably, the heat capacity and albedo of tidal flats differ to those of seawater (Kim et al., 2007). Accordingly, many studies have considered the interaction between tidal flats and the atmosphere or seawater, including this interaction when calculating heat transfer in numerical models. For example, studies have numerically investigated the contribution of large areas of tidal flats to heat transfer (Kim and Cho, 2009, 2011; Rinehimer and Thomson, 2014). Others have developed a cross-shore model of tidal flat heat and mass fluxes to understand the heat exchange between the sediment and water column and compare the relationship between porosity and diffusion (Thomson, 2010; Rinehimer and Thomson, 2014).
This study quantitatively estimates the influence of thermal discharge and tidal flats on heat dynamics and budget in bays and estuaries, using Xiangshan Bay as an example. To this end, a three-dimensional (3D) numerical model was developed and validated using field data on tidal elevation, currents, water temperature, and tidal flat temperature. The model was improved to consider detailed interactions between the atmosphere, seawater, and tidal flats. This paper illustrates and discusses the effects of thermal discharge and tidal flats on water temperature and heat flux using model results and sensitivity tests. The remainder of this paper has been structured into three sections: Section “Model development” describes model development, Section “Results and Discussion” presents the results and discussion, while the conclusions are summarized in Section “Conclusion”.
Model Development
Governing Equations of the Hydrodynamic Model
The Finite Volume Community Ocean Model (FVCOM; Chen et al., 2011) was used to simulate hydrodynamics in the bay, as the unstructured grid used by the FVCOM is particularly suited to the complex shoreline geometry and tidal flats in Xiangshan Bay. The FVCOM is a free surface prognostic model; it may be mathematically closed using the modified Mellor and Yamada level 2.5 turbulence closure schemes for vertical eddy mixing, and the Smagorinsky parameterization for horizontal eddy viscosity and diffusivity (Smagorinsky, 1963; Kim and Cho, 2011). As the FVCOM solves the 3D momentum, continuity, and density equations using a finite-volume method, it enables the strict maintenance of mass conservation. The continuity, momentum, and temperature control Eqs. (1)–(6) may be expressed as:
The variables in the equations are as follows: D is the total water depth; z is the coordinate in the rectangular coordinate system; t is time; u, v, and w are velocity components in the x, y, and z directions, respectively; ρ and ρ0 are the density and reference density of seawater, respectively; f is the Coriolis parameter; g is the acceleration of gravity; pa is air pressure at the sea surface; pH is the hydrostatic pressure; q is the non-hydrostatic pressure; Km is the vertical eddy viscosity coefficient; T is the water temperature; S is the salinity; Kh is the thermal vertical eddy diffusion coefficient; and Fu, Fv, FT, and FS represent the horizontal momentum, thermal, and salt diffusion terms, respectively.
Dry and wet grid processing technology was used to determine the dry and wet states of the tidal flat, respectively. If the water depth of the node exceeded Dmin, the node was in a wet state; otherwise, the node was in a dry state. The wet Eq. (7) and dry Eq. (8) processing methods were expressed as:
Here, D = Hm + ζ; where Hm = H + Dmin in water and Hm = −(hB + Dmin) on land; Dmin is the thickness of the viscous layer specified at the bottom; H is the reference depth; ζ is the surface level; and hB is the bathymetric height.
Tidal Flat-Atmosphere-Seawater Heat Flux Model
In this heat flux model, the tidal flat is exposed to air when seawater retreats, exchanging heat with the atmosphere (Figure 1b). Conversely, the tidal flat is submerged when the tide rises, exchanging heat with seawater. Moreover, heat exchange also occurs between seawater and the tidal flat when the latter is submerged. Generally, the heat capacity of a tidal flat is lower than that of seawater; as such, when a tidal flat absorbs the same amount of heat as seawater, the temperature change experienced by the former is larger than that of the latter. The heat flux model contains four components described below.
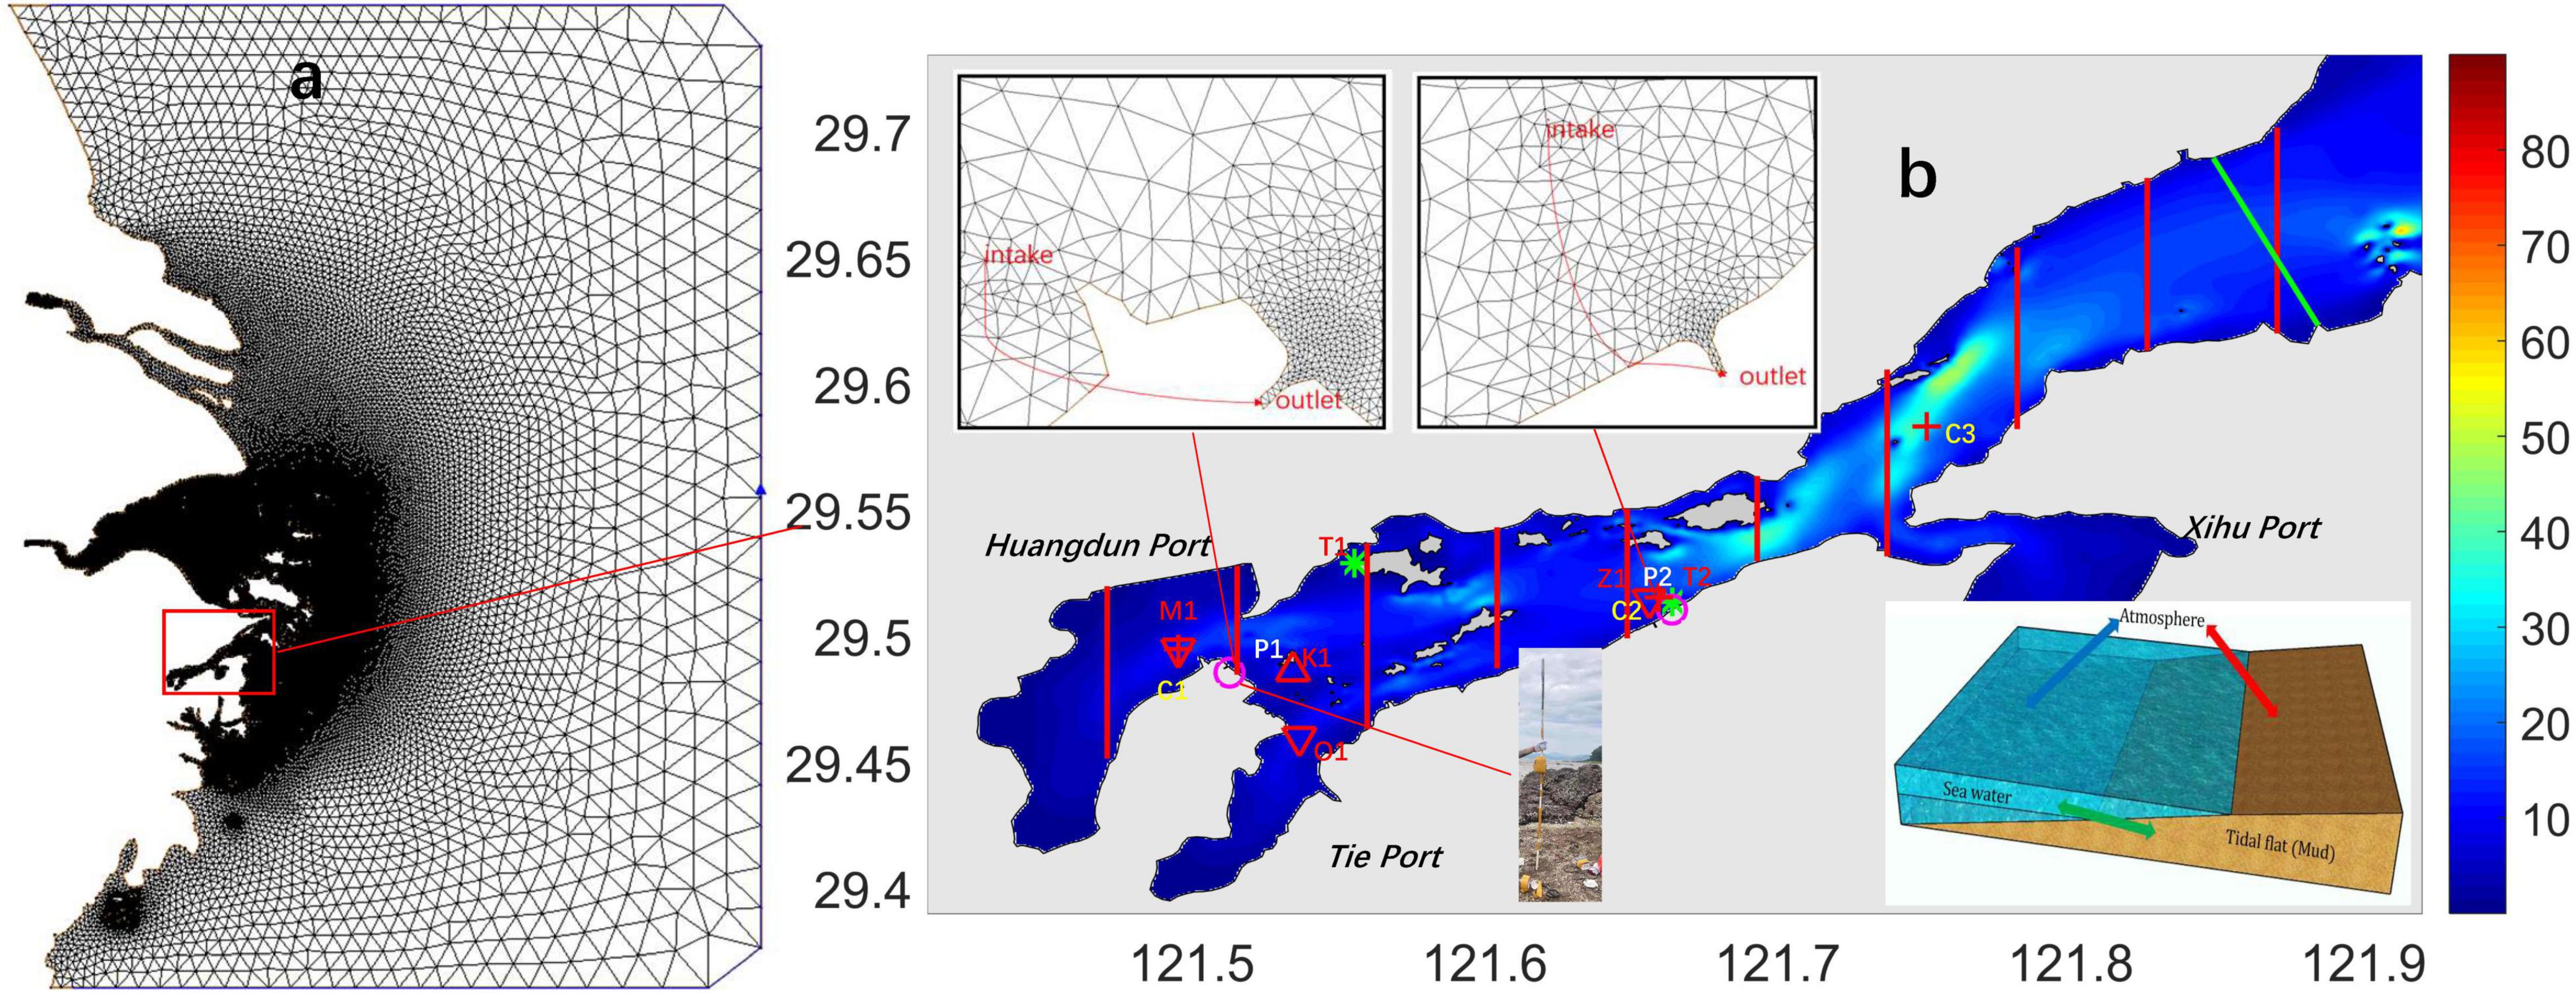
Figure 1. (a) Model grid and location of Xiangshan Bay; (b) distribution of water depth in the bay, the locations of survey stations, the water intakes and outlets of power plants, tidal flat temperature measurements, and a schematic of heat flux transfer. P1: Ninghai power plant; P2: Wushashan power plant; *: symbolizes tide stations, where T1 is the Tongzhao station, and T2 is the Wushashan station; +: represents stations C1 to C3 for flow velocity and direction; M1, O1, and Z1 (▽): locations of water temperature stations; K1(△): location of the tidal flat temperature station. The green line indicates the cross-section for statistical temperature and heat. The red lines represent a schematic of tangent points (from left to right: tangent points 1 to 10). The thermal discharge involved extracting water from a distance and discharging within close proximity to the power plant outlets.
(1) Heat flux between the tidal flat and atmosphere: this heat flux was calculated by considering shortwave radiation (QMS), longwave radiation (QML), sensible heat flux (QMH), and latent heat flux (QME); these four aspects may be expressed as per Eqs. (9)–(14) (Kim and Cho, 2011; Zhang, 2015):
Here, αMud is the albedo of the tidal flat sediment surface (0.17); QS0 is solar radiation; ε is the emissivity of the tidal flat sediment (0.96); σ is the Stefan–Boltzmann constant (5.6705 × 10⁻⁸ Wm–2K–4); QLA is atmospheric return radiation; ρa is the air density (1.2929 kg.m–3); Cpa is the specific heat of air at constant pressure (1003.0 J.kg–1.K–1); Ch is the bulk transfer coefficient for conduction (0.0014); U is the wind speed; ξ is the water content of the tidal flat surface (0.7); LV is the latent heat of evaporation; CV is the bulk transfer coefficient for conduction (0.0014); qM is the specific humidity of saturated air at water temperature; qa is the specific humidity of air; Ta is the absolute temperature of the tidal flat or water surfaces; and MT is the temperature of the tidal flat surface.
(2) Heat flux between seawater and atmosphere: this heat flux was calculated using the same method as that for tidal flat, using different parameters as per Eqs. (15)–(19):
Shortwave radiation:
Long wave radiation:
Sensible heat flux:
Latent heat flux:
Here, α is the albedo of the seawater surface (0.08); and QS0, QLA, ε, σ, ρa, Cpa, Ch, LV, CV, qs, qa, and Ta are the same as those defined in Eqs. (9)–(14), where TS is the surface water temperature.
(3) Heat flux between the tidal flat and the water body: this heat flux between seawater and the tidal flat (QMud) was calculated according to Kim and Cho (2011) Eq. (20):
where HSed is the effective thickness of the sediment layer (0.01 m); Cs is the volumetric heat capacity (3.65 × 10⁶ J.m–3.K–1); and κ is the thermal diffusivity of the sediment.
(4) Calculation of the tidal flat temperature: the sediment temperature was predicted from the amount of heat exchanged at the tidal flat surface using the one-dimensional (1D) heat conduction equation (Horton et al., 1983) Eq. (21):
Eq. (21) can be changed with an explicit finite difference equation Eq. (22):
where MT(t,i) is the sediment temperature of each layer (i) at time, t; t and z represent the time and depth intervals, respectively; and κi is the thermal diffusivity of each layer (Kim and Cho, 2011). The entire dataset was divided into 50 layers at 2 cm intervals.
We included time splitting, which was removed by a weak filter, where the solution was smoothed at each time step according to Eq. (23):
where Ts is the smoothed solution; and 0.005 was frequently adopted as the αi value. This technique introduces less damping than the Euler-backward or forward stepping techniques. After smoothing, TS was reset to Tn−1 to Tn.
Sediment temperature was predicted by the difference between the incoming heat flux through the tidal flat surface and the heat content change of the tidal flat, with the exception of the surface layer. The QMud value represents the heat exchange between the tidal flat and the atmosphere or seawater during exposure and inundation. QG1 is the heat content change at the surface layer, while QG2 represents the sum of heat content change from the second to bottom layers:
where Ci is the volumetric heat capacity of each layer (Kim and Cho, 2011); and MT(t+t,i) is the sediment temperature predicted from the 1D heat conduction equation for each layer.
When the tidal flat was exposed, the net heat flux between the tidal flat and the atmosphere was calculated using Eq. (26):
Combined with the above formulas, the surface temperature of the tidal flat was obtained as follows Eq. (27):
The variables in Eq. (27) are the same as those defined in previous equations.
Site Description of Xiangshan Bay
Xiangshan Bay represents an ideal site to investigate tidal flat interactions; the macro-tidal narrow is located on the east coast of the East China Sea (29°24 N–29°48 N and 121°25 E–122°03 E, Figure 1). It is a semi-enclosed, deep-water bay with multiple islands scattered near the head of the bay, extending inland along the northeast-southwest direction. There are three secondary inlets in the bay: the Xihu, Huangdun, and Tie ports. The total area of Xiangshan Bay is 563 km2, of which the sea and tidal flat areas span 391.76 and 171.53 km2, respectively (You and Jiao, 2011). There are 59 islands in the bay, comprising a total area of 10 km2. The climate of the bay is warm and humid, with four distinct seasons: alternating winter and summer monsoons. The annual average sunshine ranges from 1904 to 1999 h, and its annual average precipitation ranges from 1239 to 1522 mm; there are two relatively dry and wet seasons each year. The March–June period and September are relatively wet seasons, while July–August and October–February are relatively dry seasons, with an annual average evaporation of 1417–1503 mm. The annual average wind speed is 3.8 m/s. The northwest and west winds prevail from September to March, while the southwest and south winds prevail from April to August (You and Jiao, 2011).
Xiangshan Bay is a macro-tidal bay dominated by a semi-diurnal M2 tide; the duration of the flood tide is longer than that of the ebb tide, which is a reciprocating flow in the bay (You and Jiao, 2011). The average flow velocity is approximately 0.5–1 m/s for the entire bay, 1 m/s near the bay entrance, and only approximately 0.5–0.6 m/s at the bay head. The average tidal range in the bay is 2.7–3.3 m, with a high of 4.1 m and low of 2.1 m during the spring and neap tides, respectively. The maximum tidal range can exceed 5.7 m, with waves being dominated by swells in the bay. The average water transparency is ∼1 m, with a minimum of 0.1 m and a maximum of 2.8 m (You and Jiao, 2011). There are no large rivers discharging into the bay (Gao et al., 1990). The bay is shallow, with a mean depth of 10 m (Dong and Su, 1999), and the width of the bay mouth ranges from 5 to 10 km. The bay is 61 km long overall, from the mouth to the top and its average annual water temperature is less than 18°C, with a salinity ranging between 21.37 and 28.4 psu (Shen, 2002). The bay shelters large areas of tidal flats, which account for 30% of the total area (Dong and Su, 1999).
Given the significant role of tidal flats, tidal flat resources are an important natural resource in Xiangshan Bay. For example, tidal flats positioned between Beilun to Qiancang account for approximately 17.8% of the total tidal flats in the city; these flats are mainly concentrated at the Tie, Xihu, and Huangdun ports. The width of these tidal flats is between 200 and 1000 m, and the slope ranges from 2 to 8%. The climatic conditions of Xiangshan Bay alongside its tidal flats, which are rich in bait, indicates that this bay is highly conducive to the development of aquaculture (Huang and Ye, 2014). Additionally, Xiangshan Bay has weak water exchange capacity, as > 70 d is required to exchange 90% of the total water in the bay (Peng, 2013; Li et al., 2015). Two power plants are located at the bay head, proximal to the largest areas of the tidal flat; as such, these areas are affected by thermal discharges. Before and after the operation of these power plants, the area affected by red tides changed significantly, along with the frequency of occurrence. Prior to the operation of the power plants, red tides mainly occurred in the middle area and entrance of Xiangshan Bay with fewer red tides at the bay head; based on 11 y of statistics, only one red tide occurred at the bay head during this period. Following the operation of the power plants, there were a total of 11 red tide events at the bay head (Ren et al., 2012; Huang and Ye, 2014). Before the power plants were put into operation, the one observed red tide occurred from May to September, but this occurrence interval changed to the period of January to March after the plants were put into operation. Moreover, the superimposed effect of thermal discharge from both power plants caused the water temperature in Xiangshan Bay to rise. The poor water exchange capacity of the bay has also resulted in the continuous warming of seawater; this has become an important cause of red tides (Huang and Ye, 2014). Previous studies on Xiangshan Bay have mainly focused on the hydrodynamics (Li et al., 2015), water exchange (Peng, 2013), sediment dynamic processes (Gao et al., 1990), sediment composition (Sun et al., 2014), air-sea heat flux (Deng, 2007), and the effect of thermal discharge (Zeng et al., 2011; Fei, 2012; Fei et al., 2013). Research specific to the tidal flats of Xiangshan Bay have mainly focused on the changes in tidal flats, the hydrodynamics, and water exchange (Xia and Xie, 1997; Zhao and Yang, 2007; Li et al., 2015). Research attention has primarily been directed to the simulation of thermal discharge in the bay and the study of temperature elevation near the power plants.
The Ninghai Power Plant, located in Ningbo City, Zhejiang Province at the bottom of Xiangshan Bay, is situated 1.5 km from Qiangjiao Town, and 23 km from Ninghai County. The north and east sides of the plant are adjacent to Xiangshan Bay, while the west side is connected to Baishi Mountain; the site is also comprised of the peninsula between Tie and Huangdun ports. The Wushashan Power Plant, is located in Wushashan Village, Xiangshan County; it is north of Xiangshan Bay, with Wushashan Mountain to the east. The thermal discharge from the Ninghai and Wushashan power plants was 82.5 and 82.0 m3/s, while the seawater temperature elevation was 8.0 and 8.5 °C, respectively.
Model Configuration
An unstructured triangular mesh was used in the horizontal plane for the hydrodynamic model. In the vertical direction, the σ coordinate was used to simulate the complex seabed topography. The study area was divided into 63 091 nodes and 119 121 grids (Figure 1A), and the model was vertically divided into ten sigma layers. Meteorological forcing data including shortwave radiation, long-wave radiation, sea surface temperature, sea surface wind speed, and air pressure were obtained from the European Centre for Medium-Range Weather Forecasts.1 The large-area initial temperature field was interpolated using reanalysis data from the Asia-Pacific Data Research Center at the University of Hawaii.2 A σ-stretched coordinate system was applied in the vertical direction to better represent the complicated bathymetry and obtain a smooth representation of the irregular, variable bottom topography. Within the bay, the grid resolution was high, at a maximum of less than 15 m, and this resolution increased near the outlets and intakes of the power plants.
The open boundary of the model was located outside Xiangshan Bay to simulate the tides and the water temperatures in the bay more accurately; this boundary was located at a relative distance from the mouth of the bay (Figure 1A). The open-boundary condition for water level was specified using tidal elevation predicted by the TPXO7.2 global model of ocean tides.3 Hourly tidal elevation was applied to the open-ocean boundary, constructed using four diurnal components (K1, Q1, P1, and Q1), four semi-diurnal components (M2, S2, N2, and K2), three shallow-water components (M4, MS4, and MN4), and two long-period components (Mf and Mm) (Li et al., 2017a); the influence of water temperature on the open boundary was also considered (see text foot note 2). The external and internal mode time steps were 0.5 and 5 s, respectively. The bottom drag coefficient within the bay was set to ∼0.3 × 10⁻³ according to the Acoustic Doppler Current Profiler data (Xu et al., 2014; Li et al., 2017a). To eliminate the initial values influencing the model results, the model was run for longer than three months in both summer and winter; data from the last month were used for analysis. Both power plants were also considered in the model; the plants draw water from the bottom layer of deep water areas and discharge to the surface layer in shallow water areas (Figure 1B), adopting an open-channel discharge. The model considered the thermal discharges and water intakes of the power plants; the location of the latter is indicated by the red line in Figure 1B. Code optimization was used to ensure that the addition of thermal discharge did not increase the total water volume.
Model Verification
Field data on tidal elevation, current speed and direction, water temperature, and tidal flat temperature within Xianshan Bay were utilized to verify model results using the root mean square error (RMSE), normalized root mean square error (NRMSE), and correlation coefficient (CC) as follows Eqs. (28)–(32):
where Mi is the model result; Oi is the measured data; and and represent the means of the model results and measured data, respectively.
Verification of Sea Surface Level and Currents
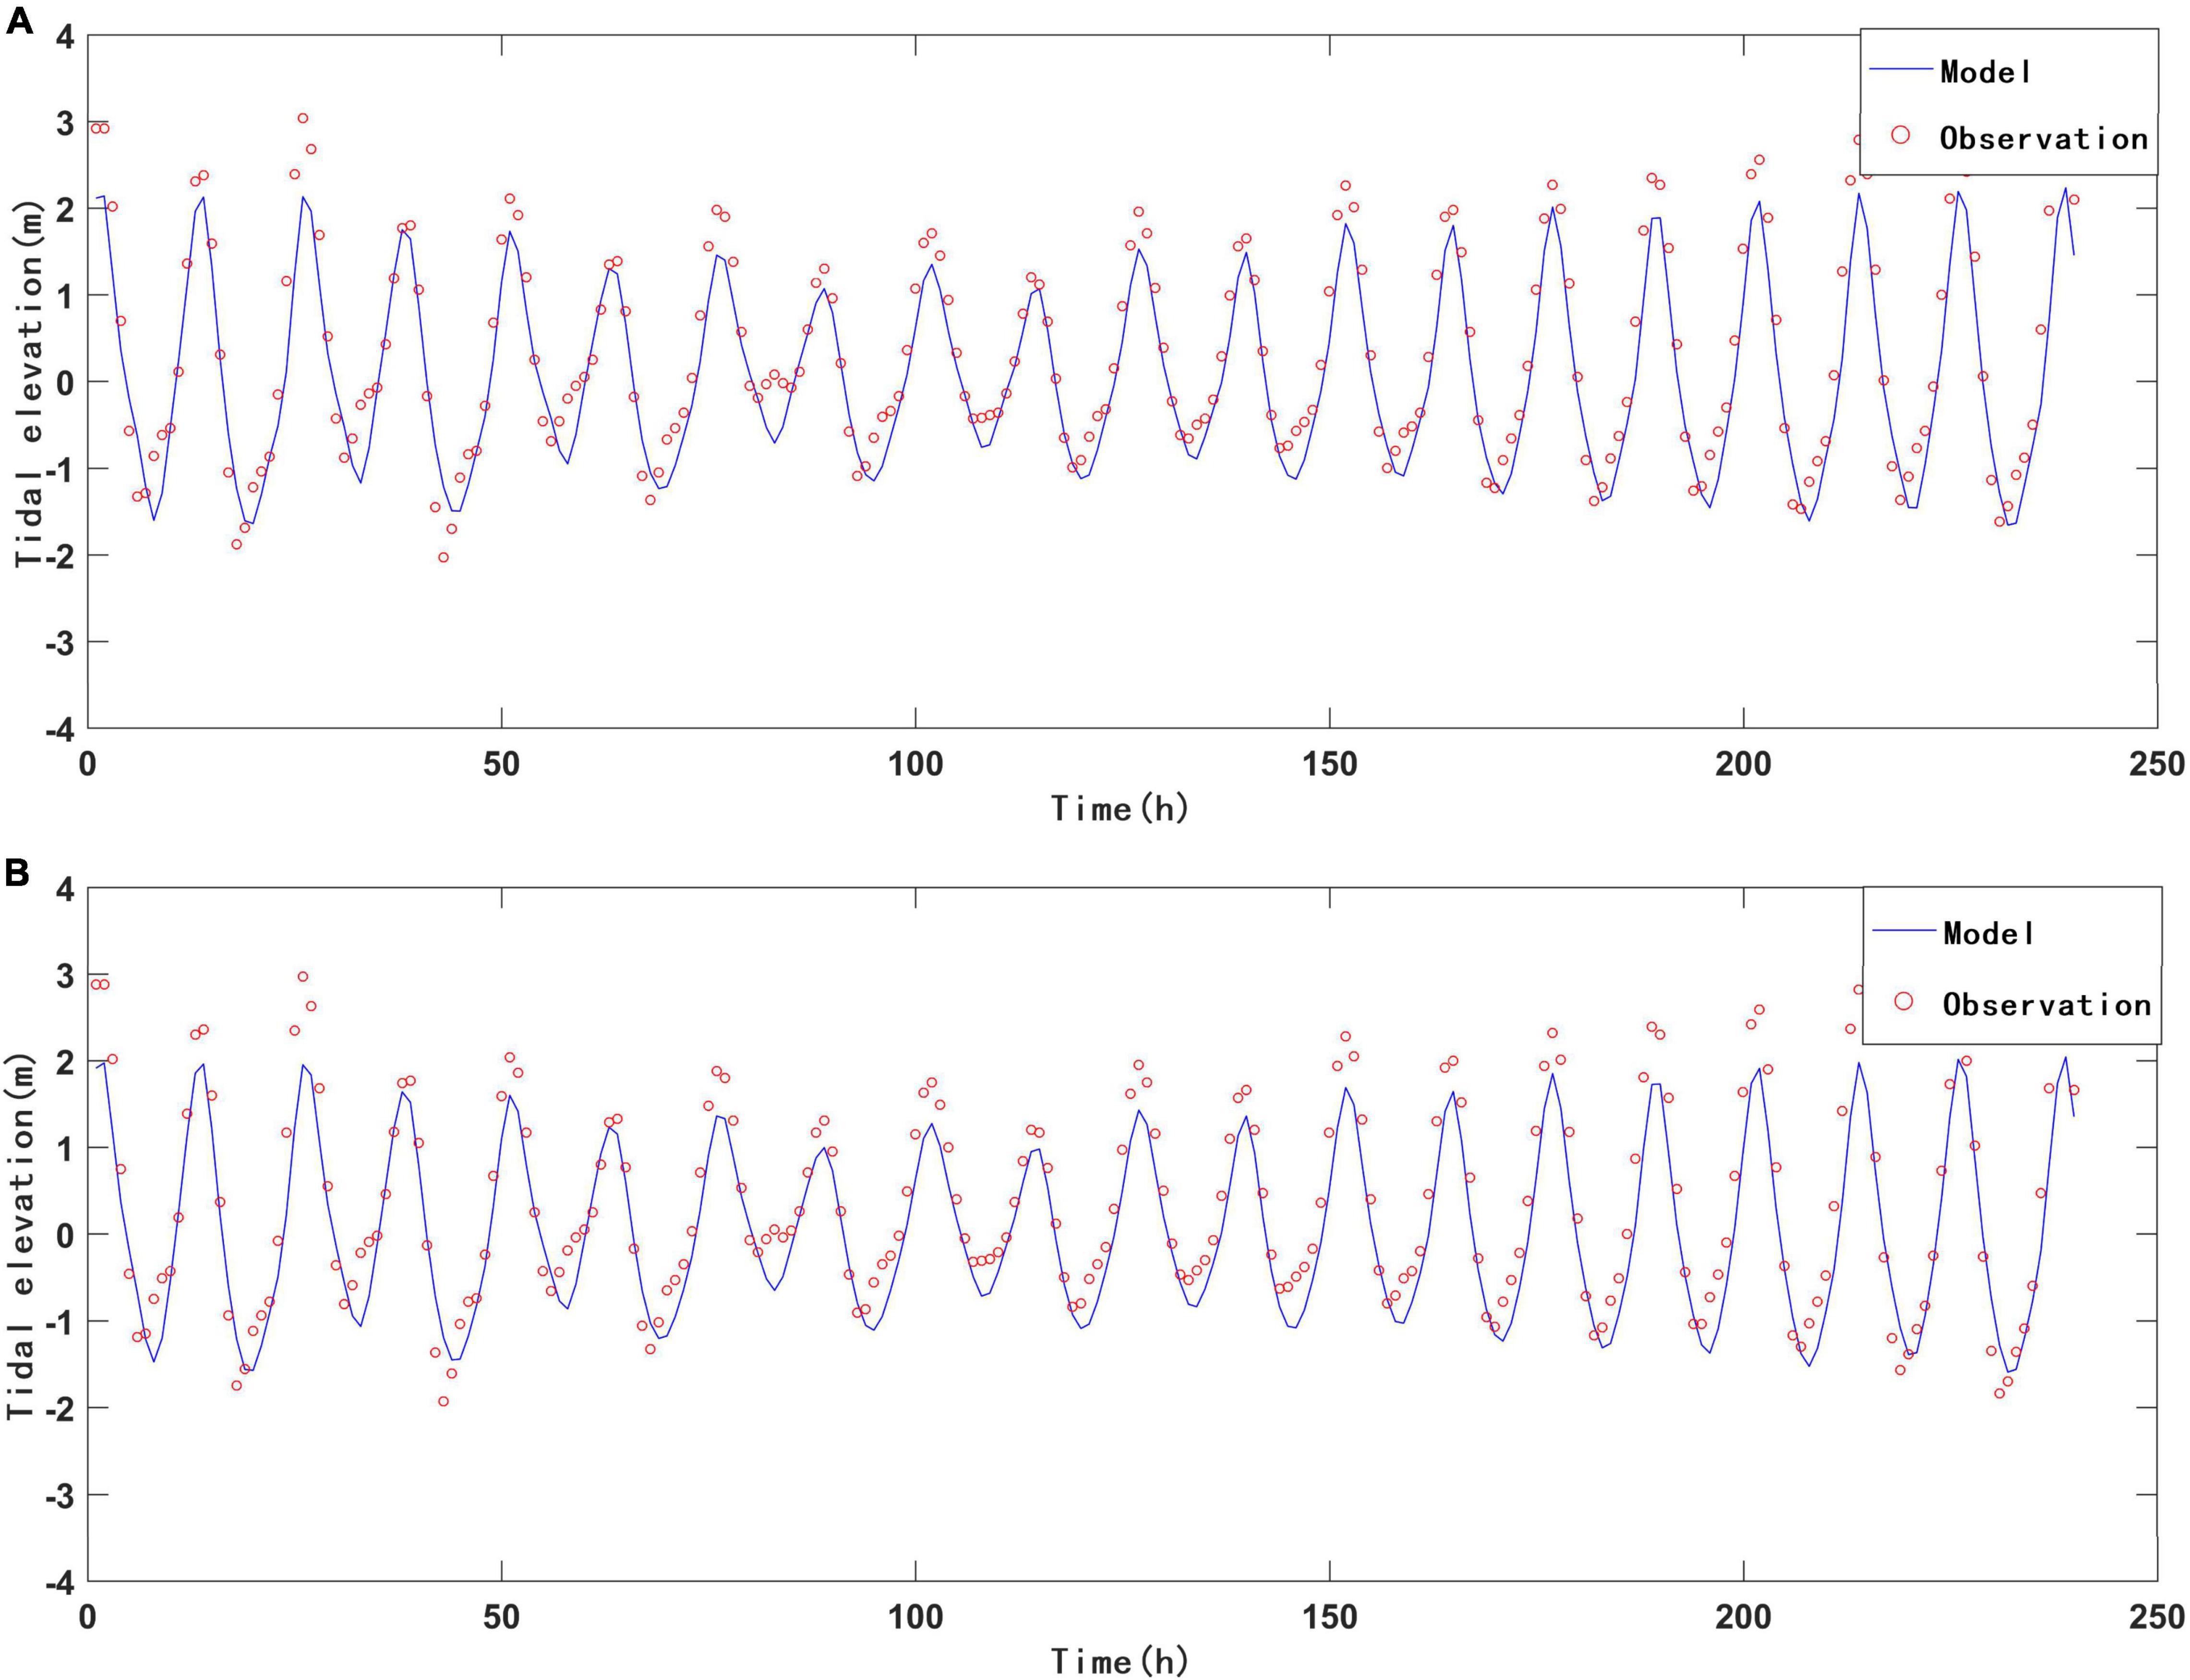
Sea surface level verification (Figure 2) was conducted by comparing modeled and observed data. The locations of the two tide stations are indicated by T1 and T2 in Figure 1B. The verification time period was 10 d, from April 11 to 20, 2012. The NRMSE and CC at Tongzhao tide station was 0.34 and 0.97, respectively; these values were 0.36 and 0.97 for the Wushashan tide station. The simulated phase and amplitude were highly correlated with their measured counterparts, suggesting that the model was reliable.
Model results were verified using measured flow velocity and direction data during the spring tides in April. The locations of stations used for velocity and direction are marked as C1, C2, and C3 in Figure 1B; the verification results are shown in Figure 3, and the error analysis results for C1, C2, and C3 are listed in Table 1. The NRMSE was found to be small, while the CC was large; this suggests good model performance in terms of reproducing tidal levels and currents. We have also published articles including a lot of verifications on sea surface level and currents (Li et al., 2017a,b). These verifications include several stations and different time periods.
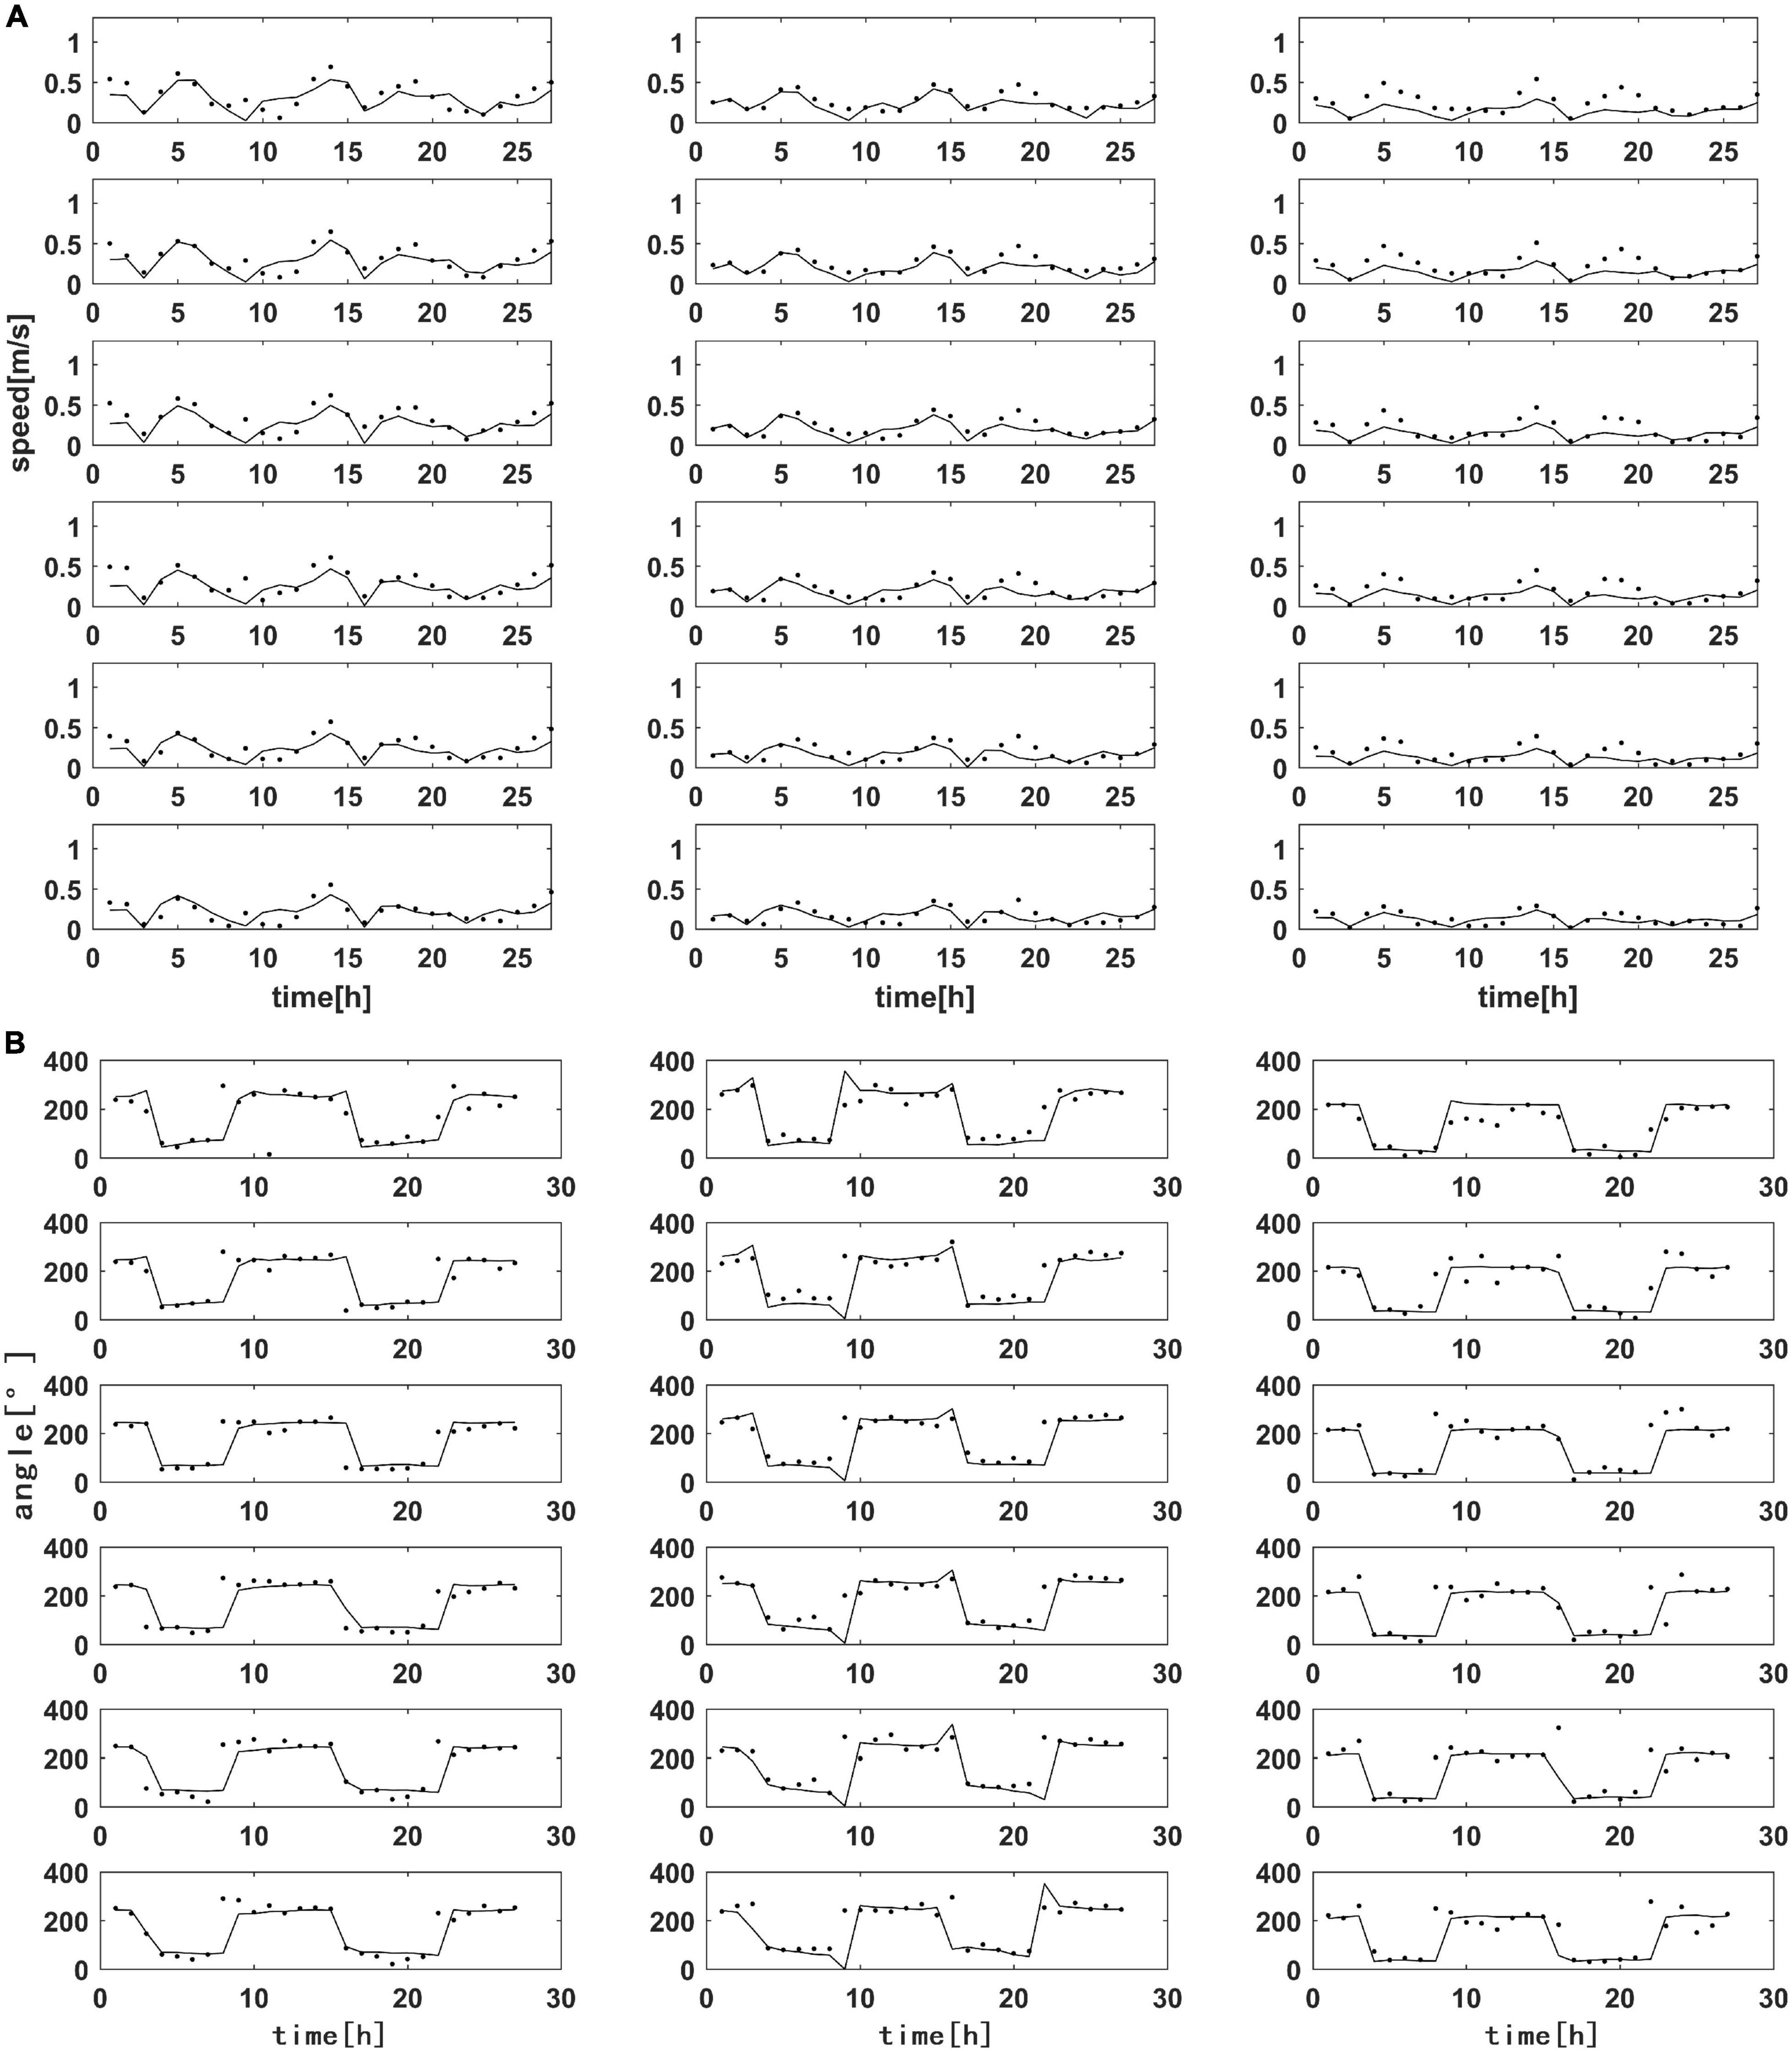
Figure 3. (A) Validation of tidal current speed. From left to right: C1, C2, and C3 stations. From top to bottom: surface layer, 0.2 H, 0.4 H, 0.6 H, 0.8 H, and bottom layer; (B) same as (A), except relating to the validation of flow direction.
Water Temperature Verification
Water temperature data at three stations (M1, O1, and Z1) were used to verify water temperature simulations. The M1 station contains water temperature data of six layers from the surface to the bottom layer, spanning from April 14 to 15, 2012. The O1 and Z1 stations have three observation periods including April 14 to 15, April 18 to 19, and April 21 to 22, 2012; these stations only contain monitoring data for the middle layer. Figure 4 presents the verification results, while Table 2 provides the error analysis. Temperature verification at these stations suggests that model results were relatively accurate.
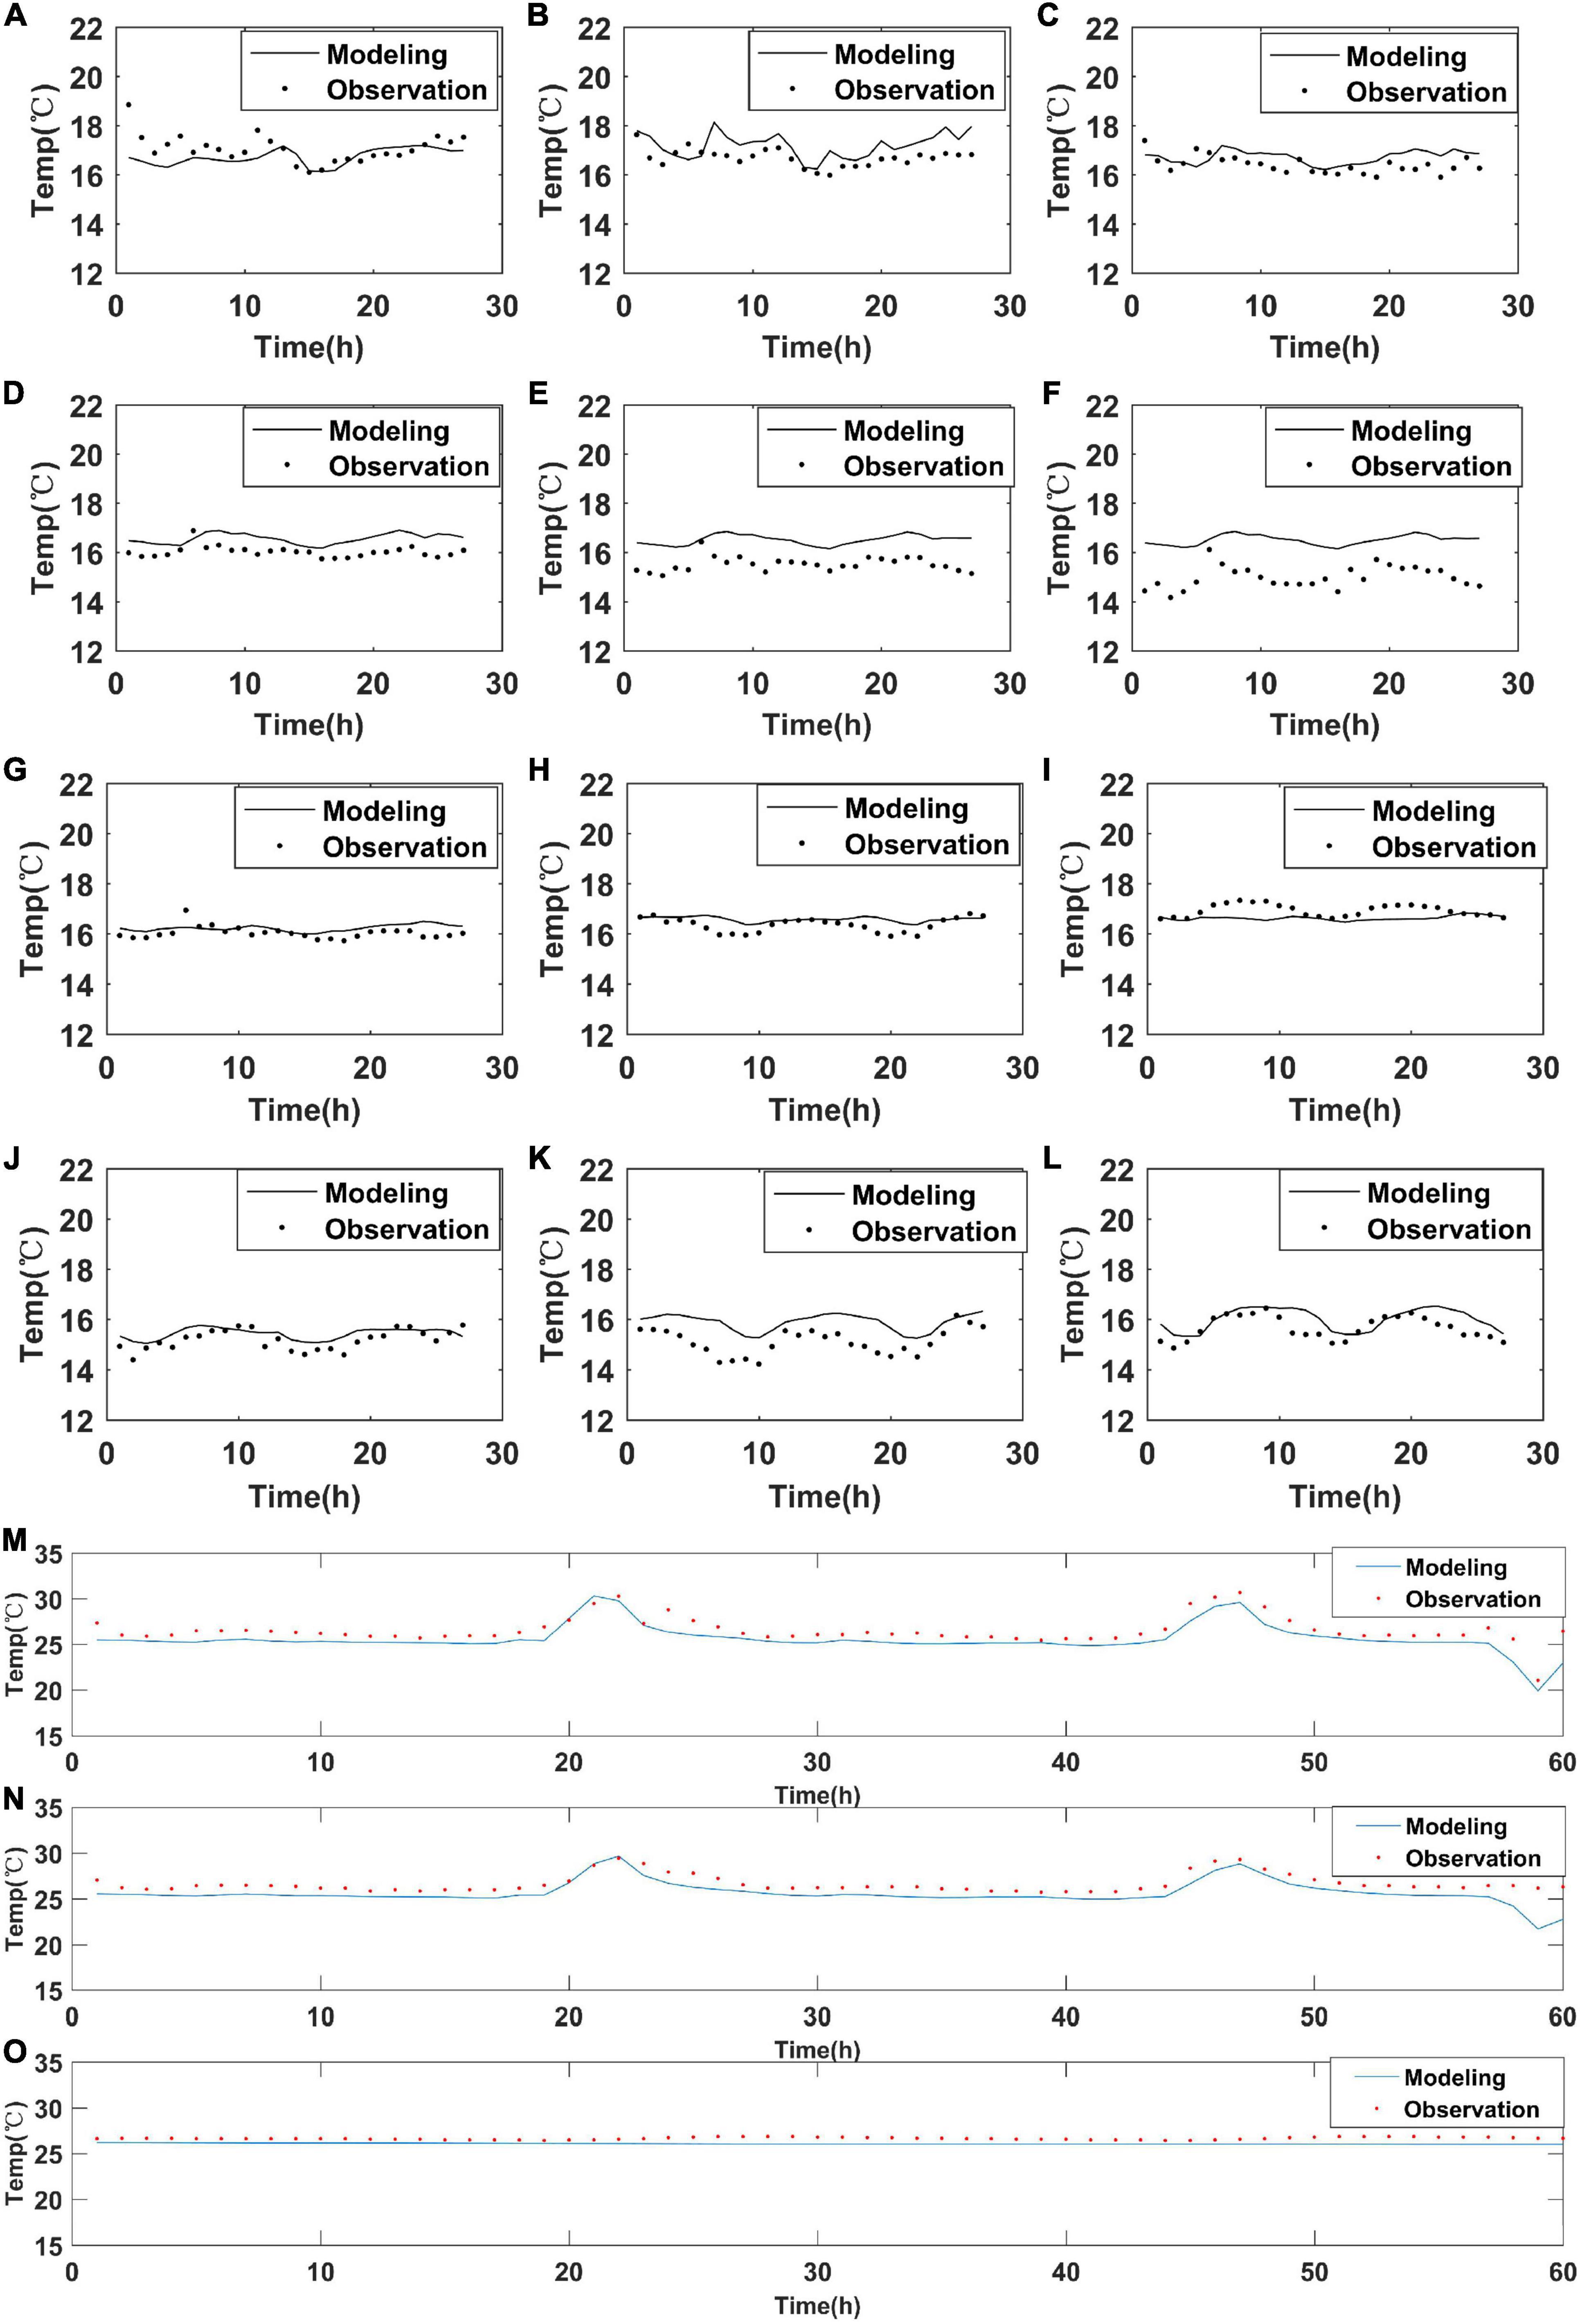
Figure 4. Water temperature validation at M1 station from April 14 to 15, 2012: (A) surface layer; (B) 0.2 H; (C) 0.4 H; (D) 0.6 H; (E) 0.8 H; (F) bottom. Validation of seawater temperature in the middle layer at (G–I): O1 station; (J–L): Z1 station; for (G,J): 04/14/2012–04/15/2012; (H,K): 04/18/2012–04/19/2012; (I,L): 04/21/2012–04/22/2012. Tidal flat temperature validation: (M) surface layer; (N): middle layer; (O): bottom layer.
To further verify the diffusion range of thermal discharge from the model, remote sensing inversion results were used to compare sea surface temperature (Chen et al., 2018). The sea surface temperature of Xiangshan Bay was retrieved using Landsat 8 satellite data.4 We retrieved sea surface temperature data at 2:25 on December 2, 2019, and compared them with the results calculated by the model (2:00 on December 2, 2019). The sea surface temperature near the two power plants was higher than that of nearby regions; modeled sea surface temperature was consistent with the remote sensing inversion results (Figure 5). There were some minor discrepancies between the simulation results and the satellite data, as there was a 25 min difference between the two datasets.
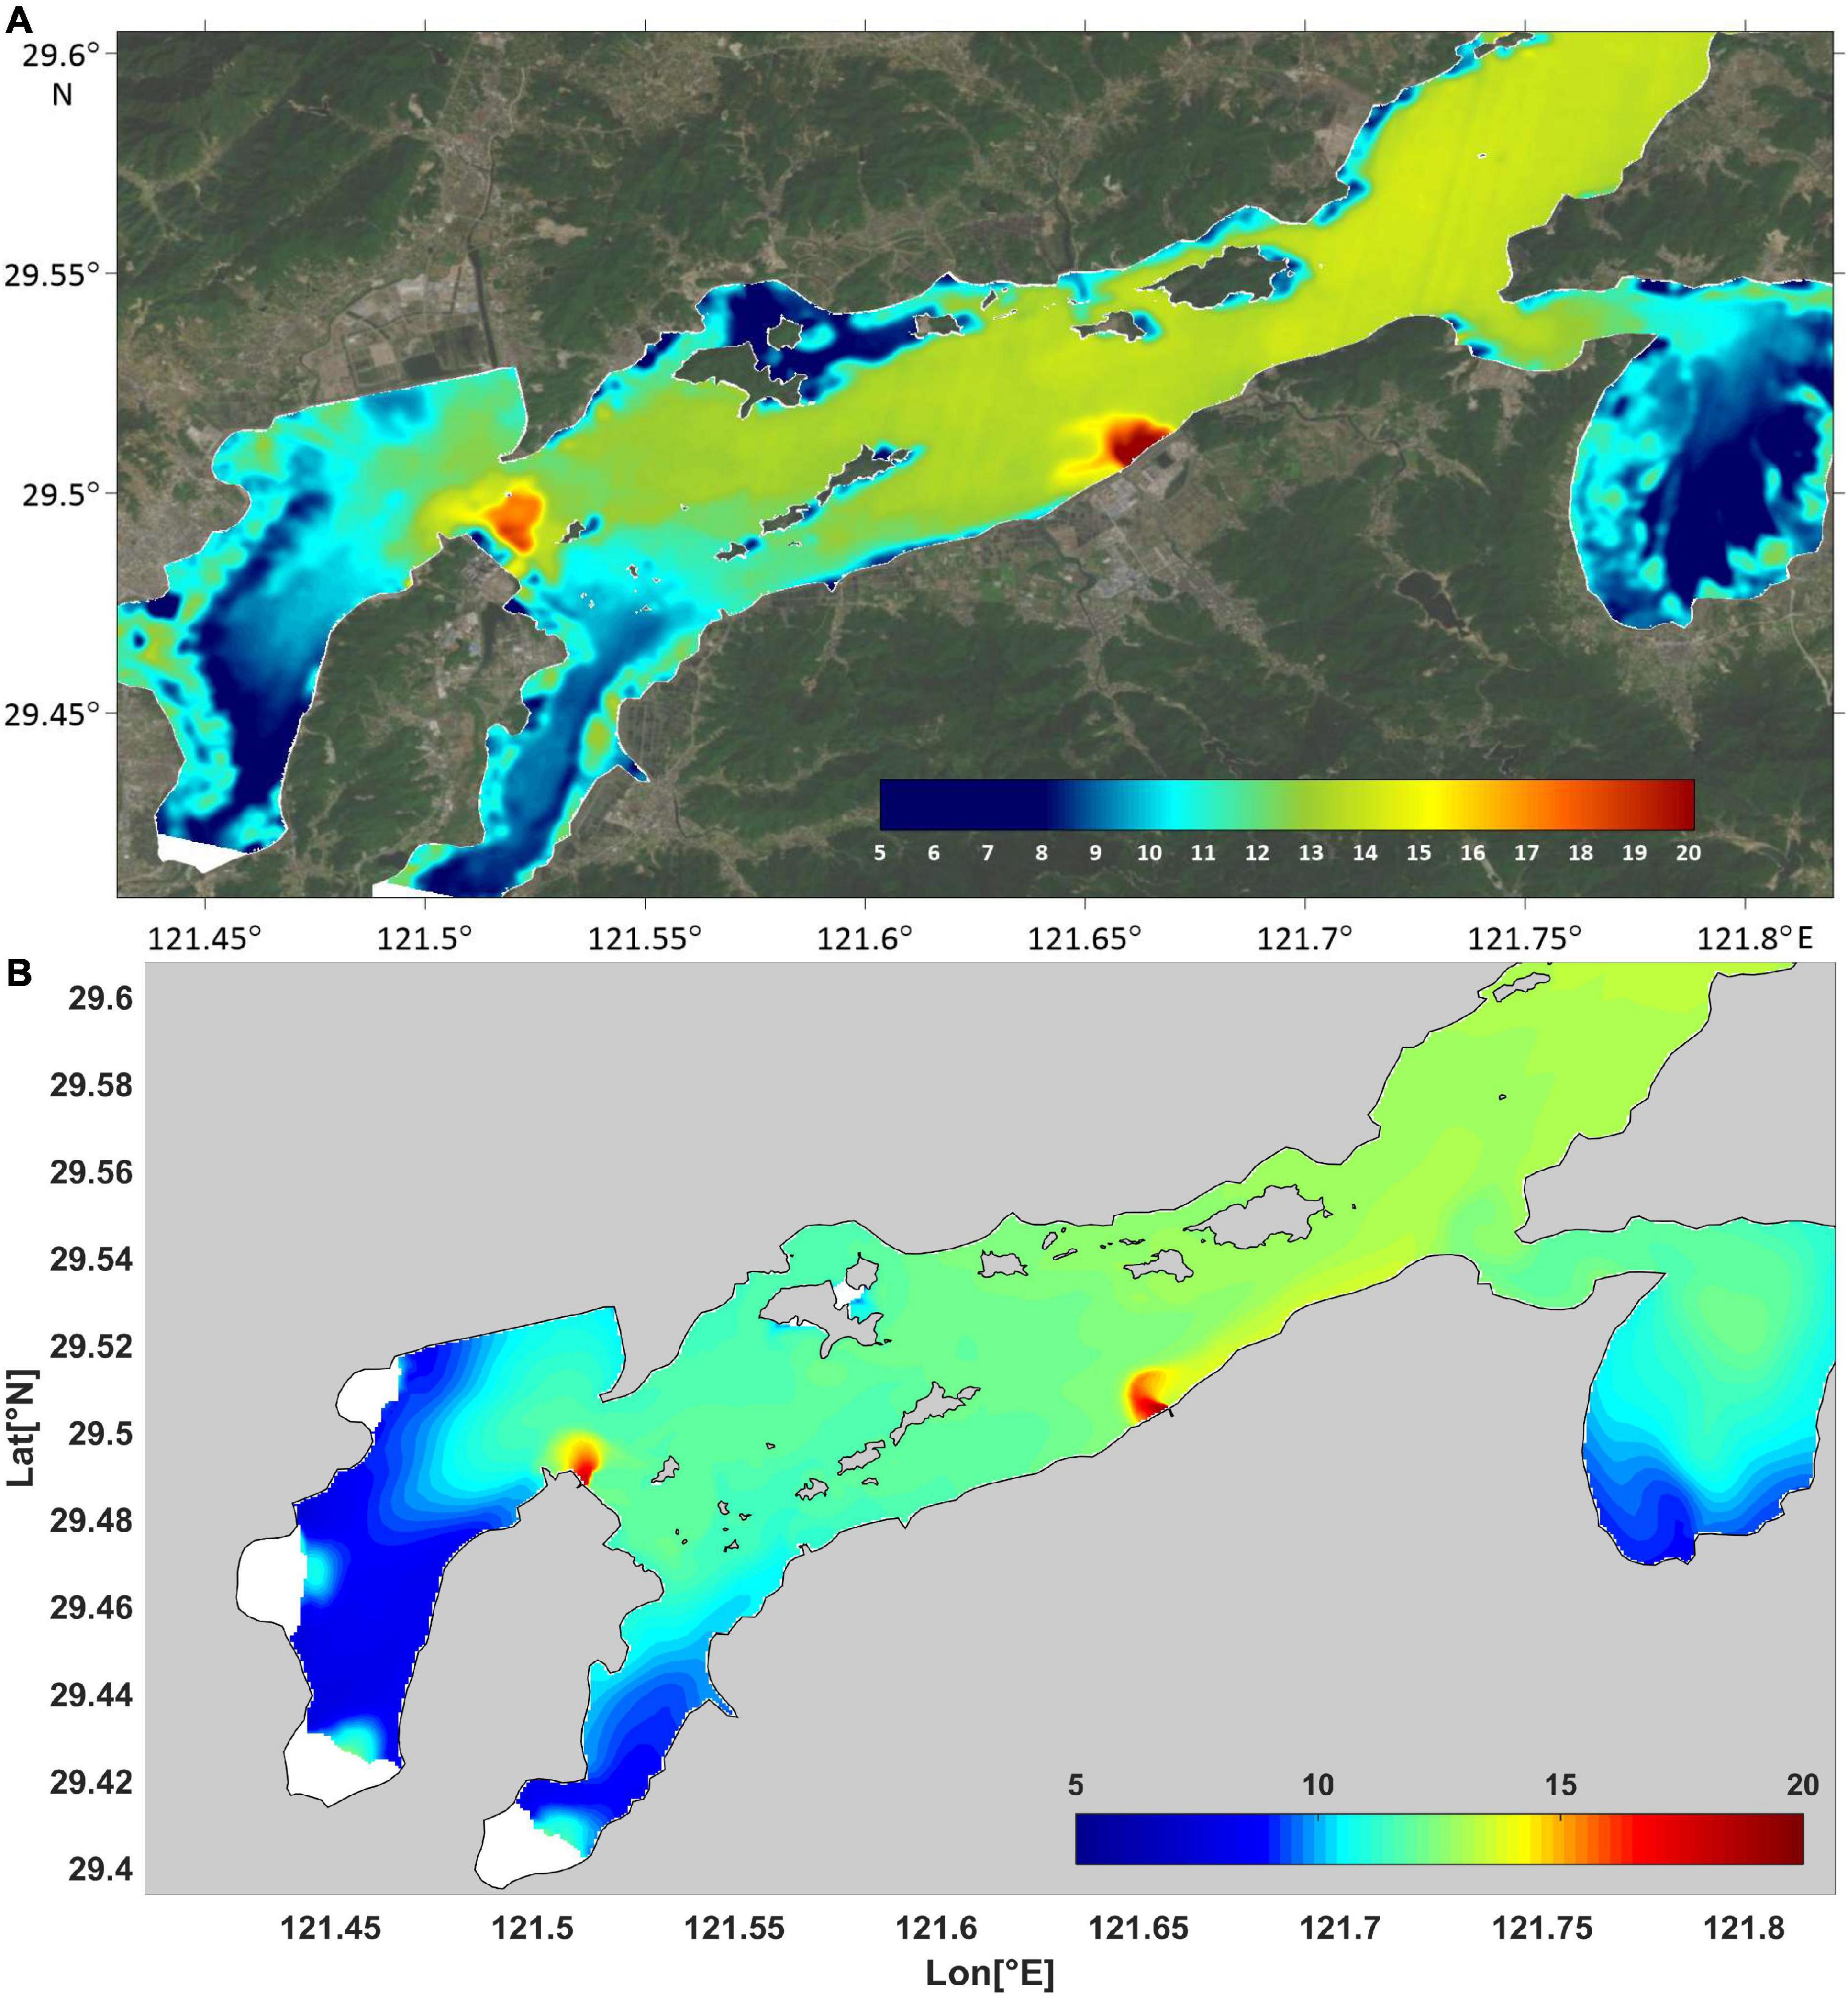
Figure 5. Comparison of remote sensing image and simulation results: (A) remote sensing data; and (B) simulation results.
Tidal Flat Temperature Verification
Tidal flat temperature was obtained using temperature sensors at K1 station in the bay (Figure 1B). Three sensors were arranged vertically: one near the surface of the tidal flat (surface layer), and the other two 20 (middle layer) and 82 cm (bottom layer) away from the surface. All sensors measured and recorded tidal flat temperature data every 10 min from September to October, 2019. Figures 4M–O and Table 3 present the verification results and error analysis, respectively. The temperature fluctuation range for the surface layer of the tidal flat was the largest, whereas that of the middle layer was slightly lower, and that of the bottom layer was the lowest. The tidal flat temperature during the measurement period decreased across the surface, middle, and bottom layers. The sudden change in surface temperature was more apparent, which may be related to the exposure of the tidal flats for an extended period of time. The NRMSE and CC values were used to analyze the error of tidal flat temperature verification and calculate the errors associated with the surface, middle, and bottom layers, respectively. The NRMSE of the surface, middle, and bottom layers were consistently lower than 0.1, while the CC of the surface and middle layers were consistently greater than 0.7; the model was able to reliably reproduce tidal flat temperature variations for all three layers.
Model Stability and Sensitivity
The average temperature method was used to describe the temperature elevation stabilization process Eq. (33):
where T is the water temperature; Ti is the temperature of each cell (i); Vi refers to the volume of each cell (i); and n is the total number of cells.
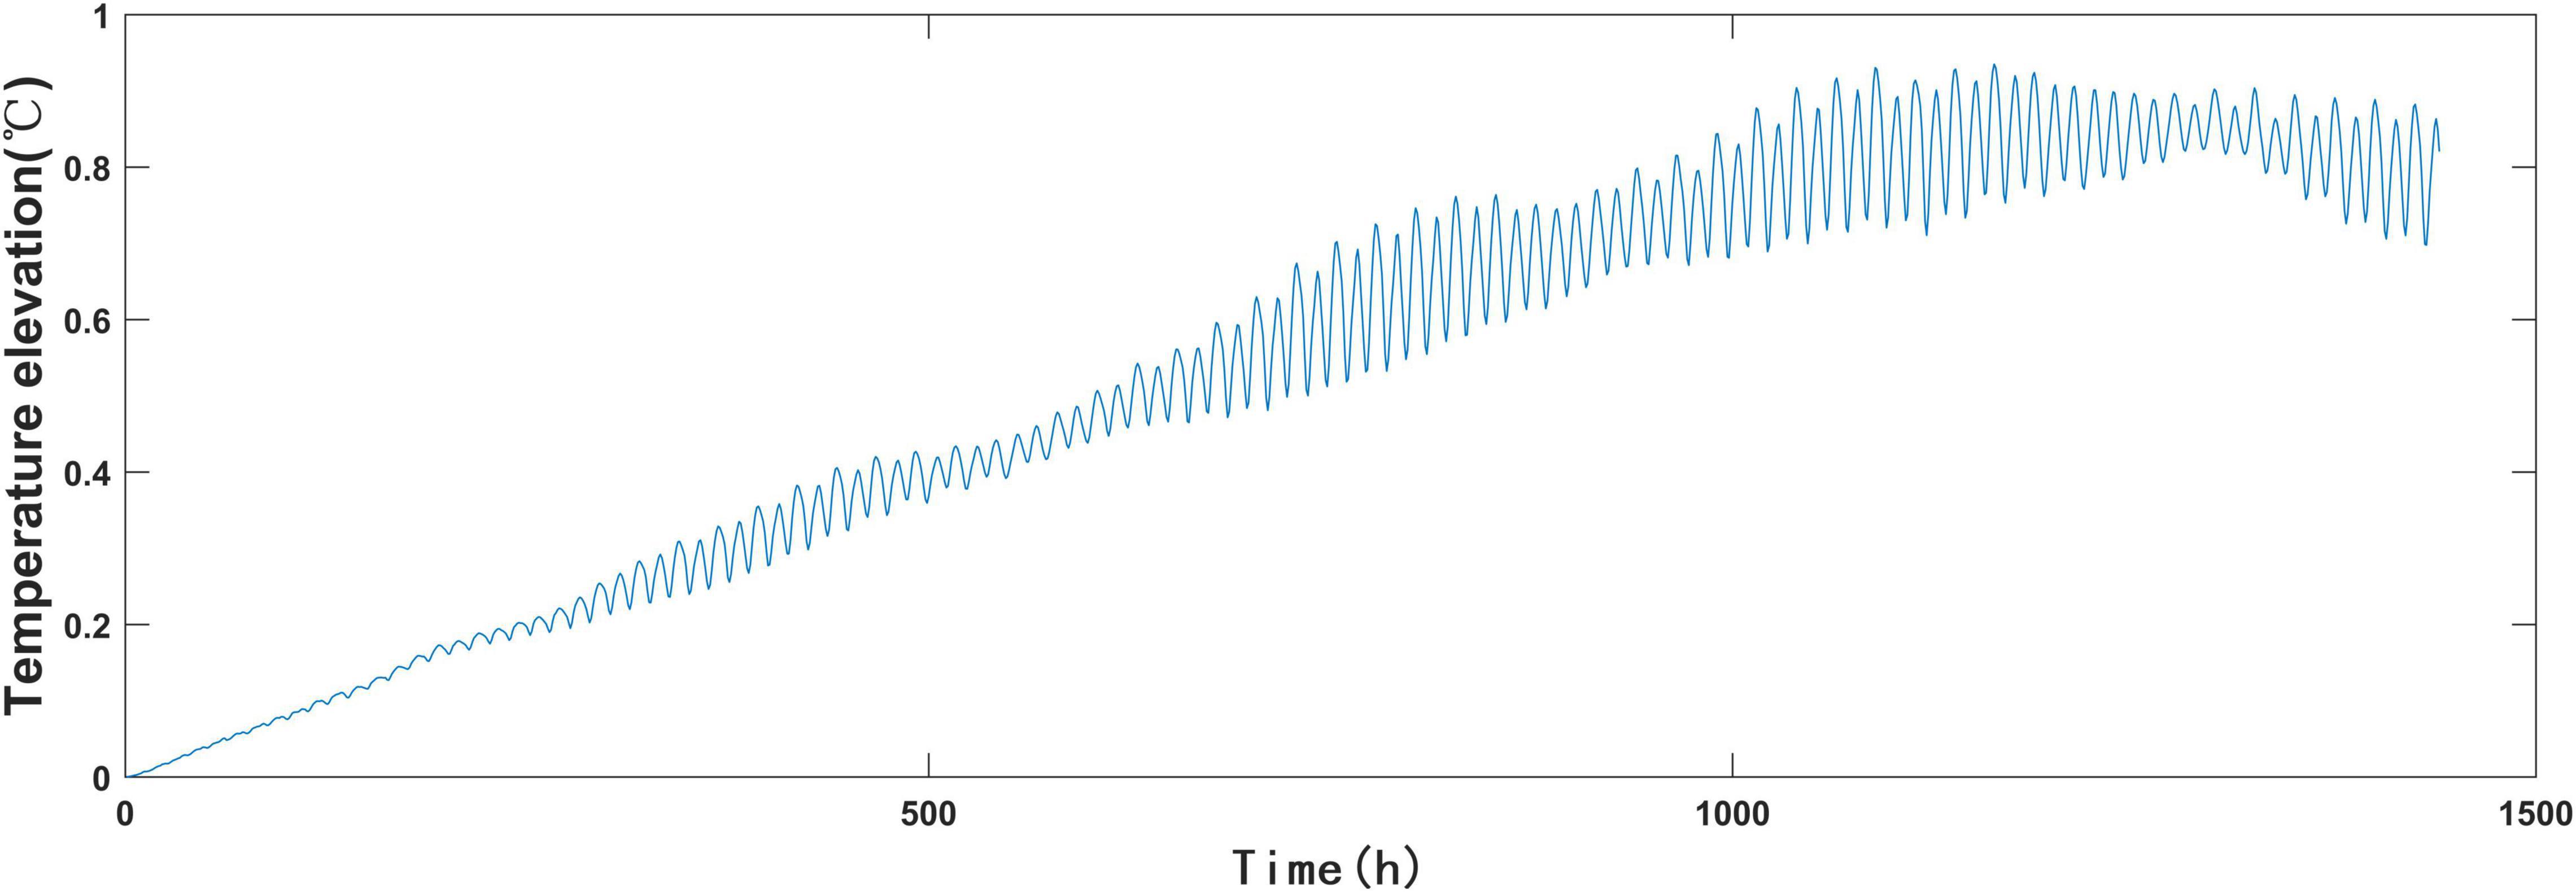
The numerical model spans a wide area which includes the East China Sea. The statistical scope of Xiangshan Bay extends from the bay head to bay mouth and the cross-section of the bay mouth is located at the green line in Figure 1B; the model grid was comprised of 29 849 cells. The thermal discharge gradually elevated water temperature, after which this increase gradually slowed, and finally reached stability approximately 1200 h later (Figure 6). Water temperature increased with fluctuations, with a maximum amplitude of ∼0.2°C; the maximum temperature elevation was ∼0.9°C.
Sensitivity analysis was conducted for the Dmin parameter and the horizontal coefficient. Dmin is the thickness of the bottom viscous layer; this coefficient may be used to determine the dry and wet grids, and subsequently ascertain the tidal flats. Two working conditions were calculated: (1) doubling Dmin from 0.15 to 0.3 m; and (2) doubling the horizontal diffusion coefficient from 0.2 to 0.4. Following this, average temperature changes during 14 tidal cycles were calculated, in which temperature changes at the entrance of the bay, middle of the bay, and bay head were compared; Table 4 presents these calculation results. The results show that the sensitivity rate of Dmin and the horizontal diffusion coefficient are 0% and 0.1%, respectively, demonstrating that they were insensitive to water temperature at the bay entrance. The sensitivity of the two parameters was greater in the middle and head of the bay. The impact of the horizontal diffusion coefficient in the middle of the bay was greater than that of Dmin, whereas the impact of Dmin at the bay head was much greater than the horizontal diffusion coefficient. It should be noted that the tidal flats are mainly distributed at the bay head, while Dmin mainly affects the determination of the tidal flats; this means Dmin may largely affect seawater temperature through its impact on the tidal flats. As the Wushashan power plant is located in the middle of the bay, the greater sensitivity of the horizontal diffusion coefficient in the middle of the bay may be related to thermal discharge from that power plant. To investigate the sensitivity of tidal flats to seawater temperature, the temperature elevation in the bay was calculated when considering and excluding the tidal flat heat fluxes; then, the temperature variation in the entire bay from the tidal flats was calculated (Figure 7E). This analysis showed that the maximum, minimum, and average temperature elevations were 0.27, 0.07, and 0.18°C, respectively. The average temperature variations at the bay mouth, the middle of the bay, and the bay head for 14 tidal cycles were also determined; the water temperature change was by 0, 0.04, and 0.21°C, respectively. The tidal flats had a greater influence on water temperature at the bay head, as these flats were mainly distributed at this location. Therefore, the effect of tidal flats on water temperature in the bay was significantly low.
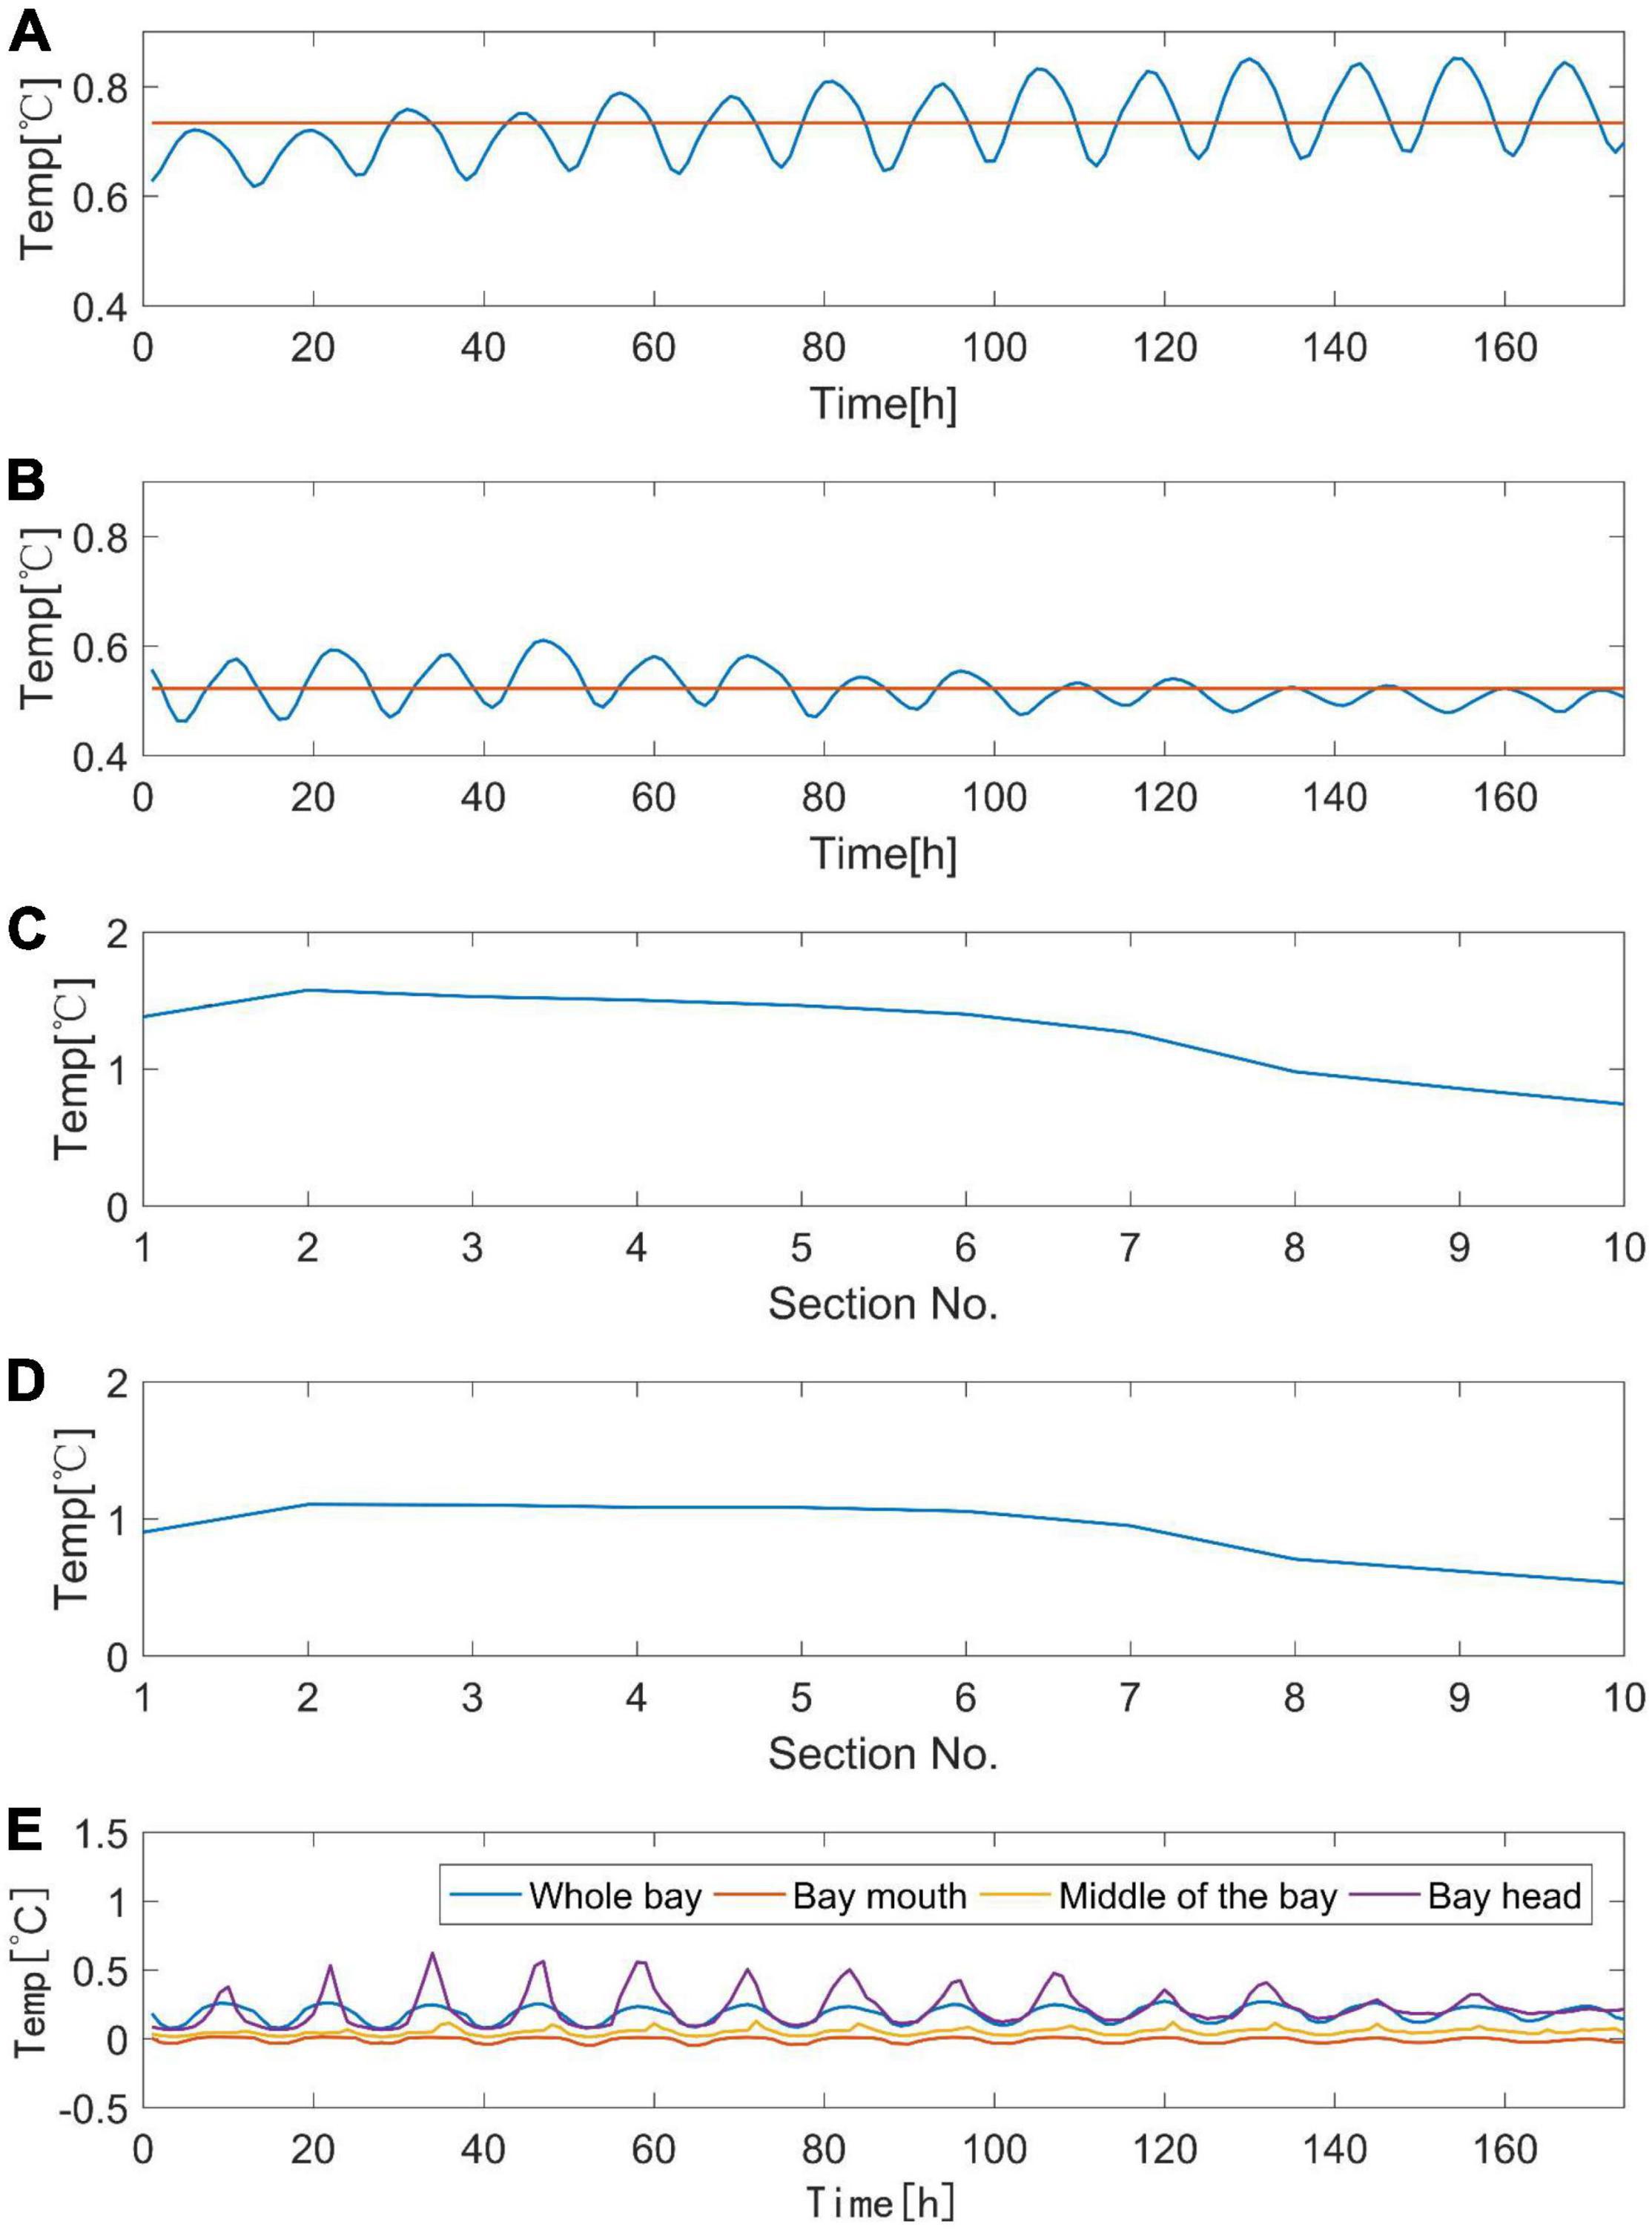
Figure 7. (A,B) Changes in temperature elevation over 14 tidal cycles for the entire bay in (A) summer; and (B) winter; average temperature elevation as represented by straight red line. (C,D) Temperature elevation from the bay head to the cross section as represented by straight red line (Figure 1B). The horizontal coordinate represents the cross-section number in (C) summer; and (D) winter; and (E) average temperature changes for the whole bay, the bay mouth, the middle of the bay, and the bay head affected by tidal flats.
Results and Discussion
Influence of Thermal Discharge on Water Temperature
The water temperature elevation distributions near the surface layer during spring tides (Figure 8) showed a clear increase near the thermal discharge outlets of the two power plants. Temperature elevation near the outlets was large (>6°C) in summer and winter; this elevation was largest at Tie Port, slightly lower at Huangdun Port, and the lowest at Xihu Port. The temperature elevation at the bay head was greater than that in the middle or entrance of the bay, indicating that warm water was being discharged from the outlet at the top layer of seawater, with an initial velocity of 0.5 m/s and a direction perpendicular to the shoreline. The change in temperature elevation was greatly affected by tidal currents; during periods of peak floods and ebbs, the warm water occurred throughout a large diffusion area, whereas during periods of high and low slack water, the warm water was limited to the areas near power plant outlets. The thermal discharges from Ninghai power plant affected Tie Port, while warm water from Wushashan power plant mainly affected the central area of the bay; this range of impact was constrained to coastal areas. This may be related to currents in the bay, as high velocity currents occur near the Wushashan power plant. Ninghai power plant is located at the bay head (near Tie Port), where the thermal discharge extends into this port during flood tides and toward the bay mouth during ebb tides. Wushashan power plant is located in the middle of the bay, and the bay width near this power plant is relatively narrow (4.5 km) with high flow velocity. As such, during flood tides the thermal discharge spreads along the shoreline to the bay head of the bay, whereas during ebb tides the thermal discharge extends out of the bay along the shoreline.
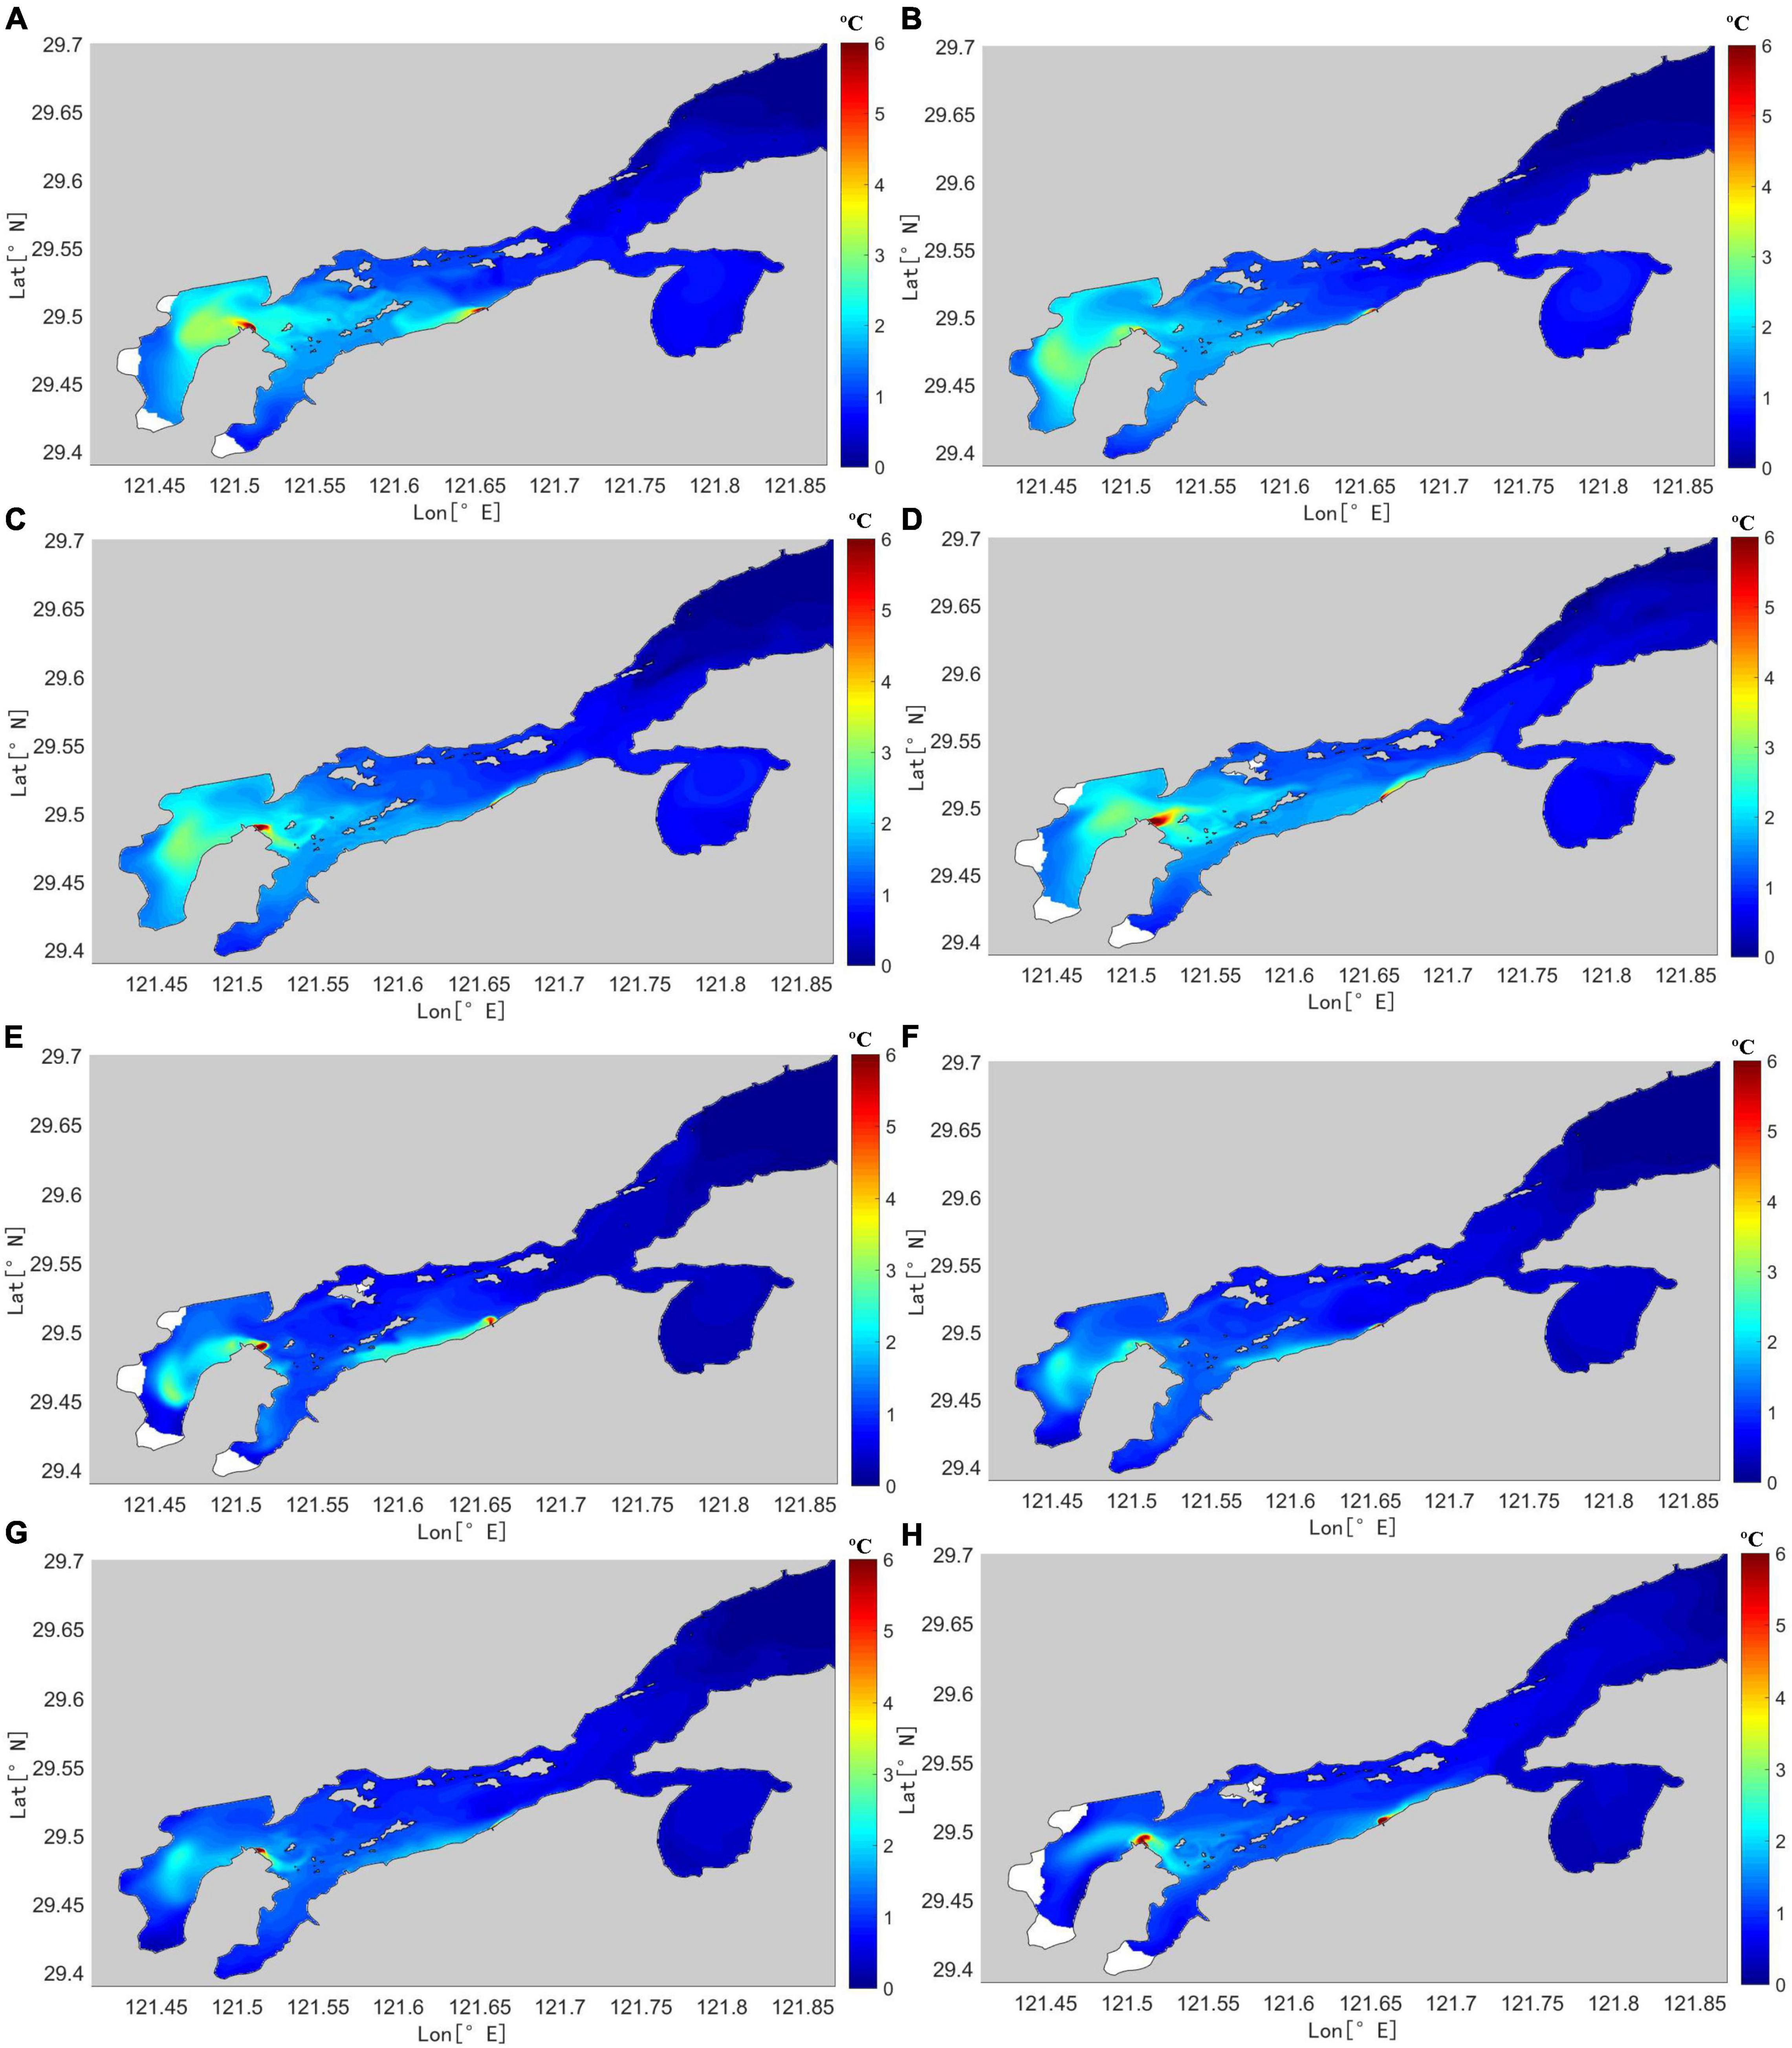
Figure 8. Distribution of temperature elevation near the surface layer during spring tides in (A–D) summer; and (E–H) winter for (A,E) peak floods; (B,F) high slack water; (C,G) peak ebbs; and (D,H) low slack water.
Figures 8A–D show that the thermal discharges from the two power plants have a substantial effect on the water temperature in Xiangshan Bay in summer. The poor water exchange in the bay (Zeng et al., 2011) allows for the accumulation of these discharges in the bay. A similar pattern occurred in the winter, although the temperature elevation was less pronounced (Figures 8E–H).
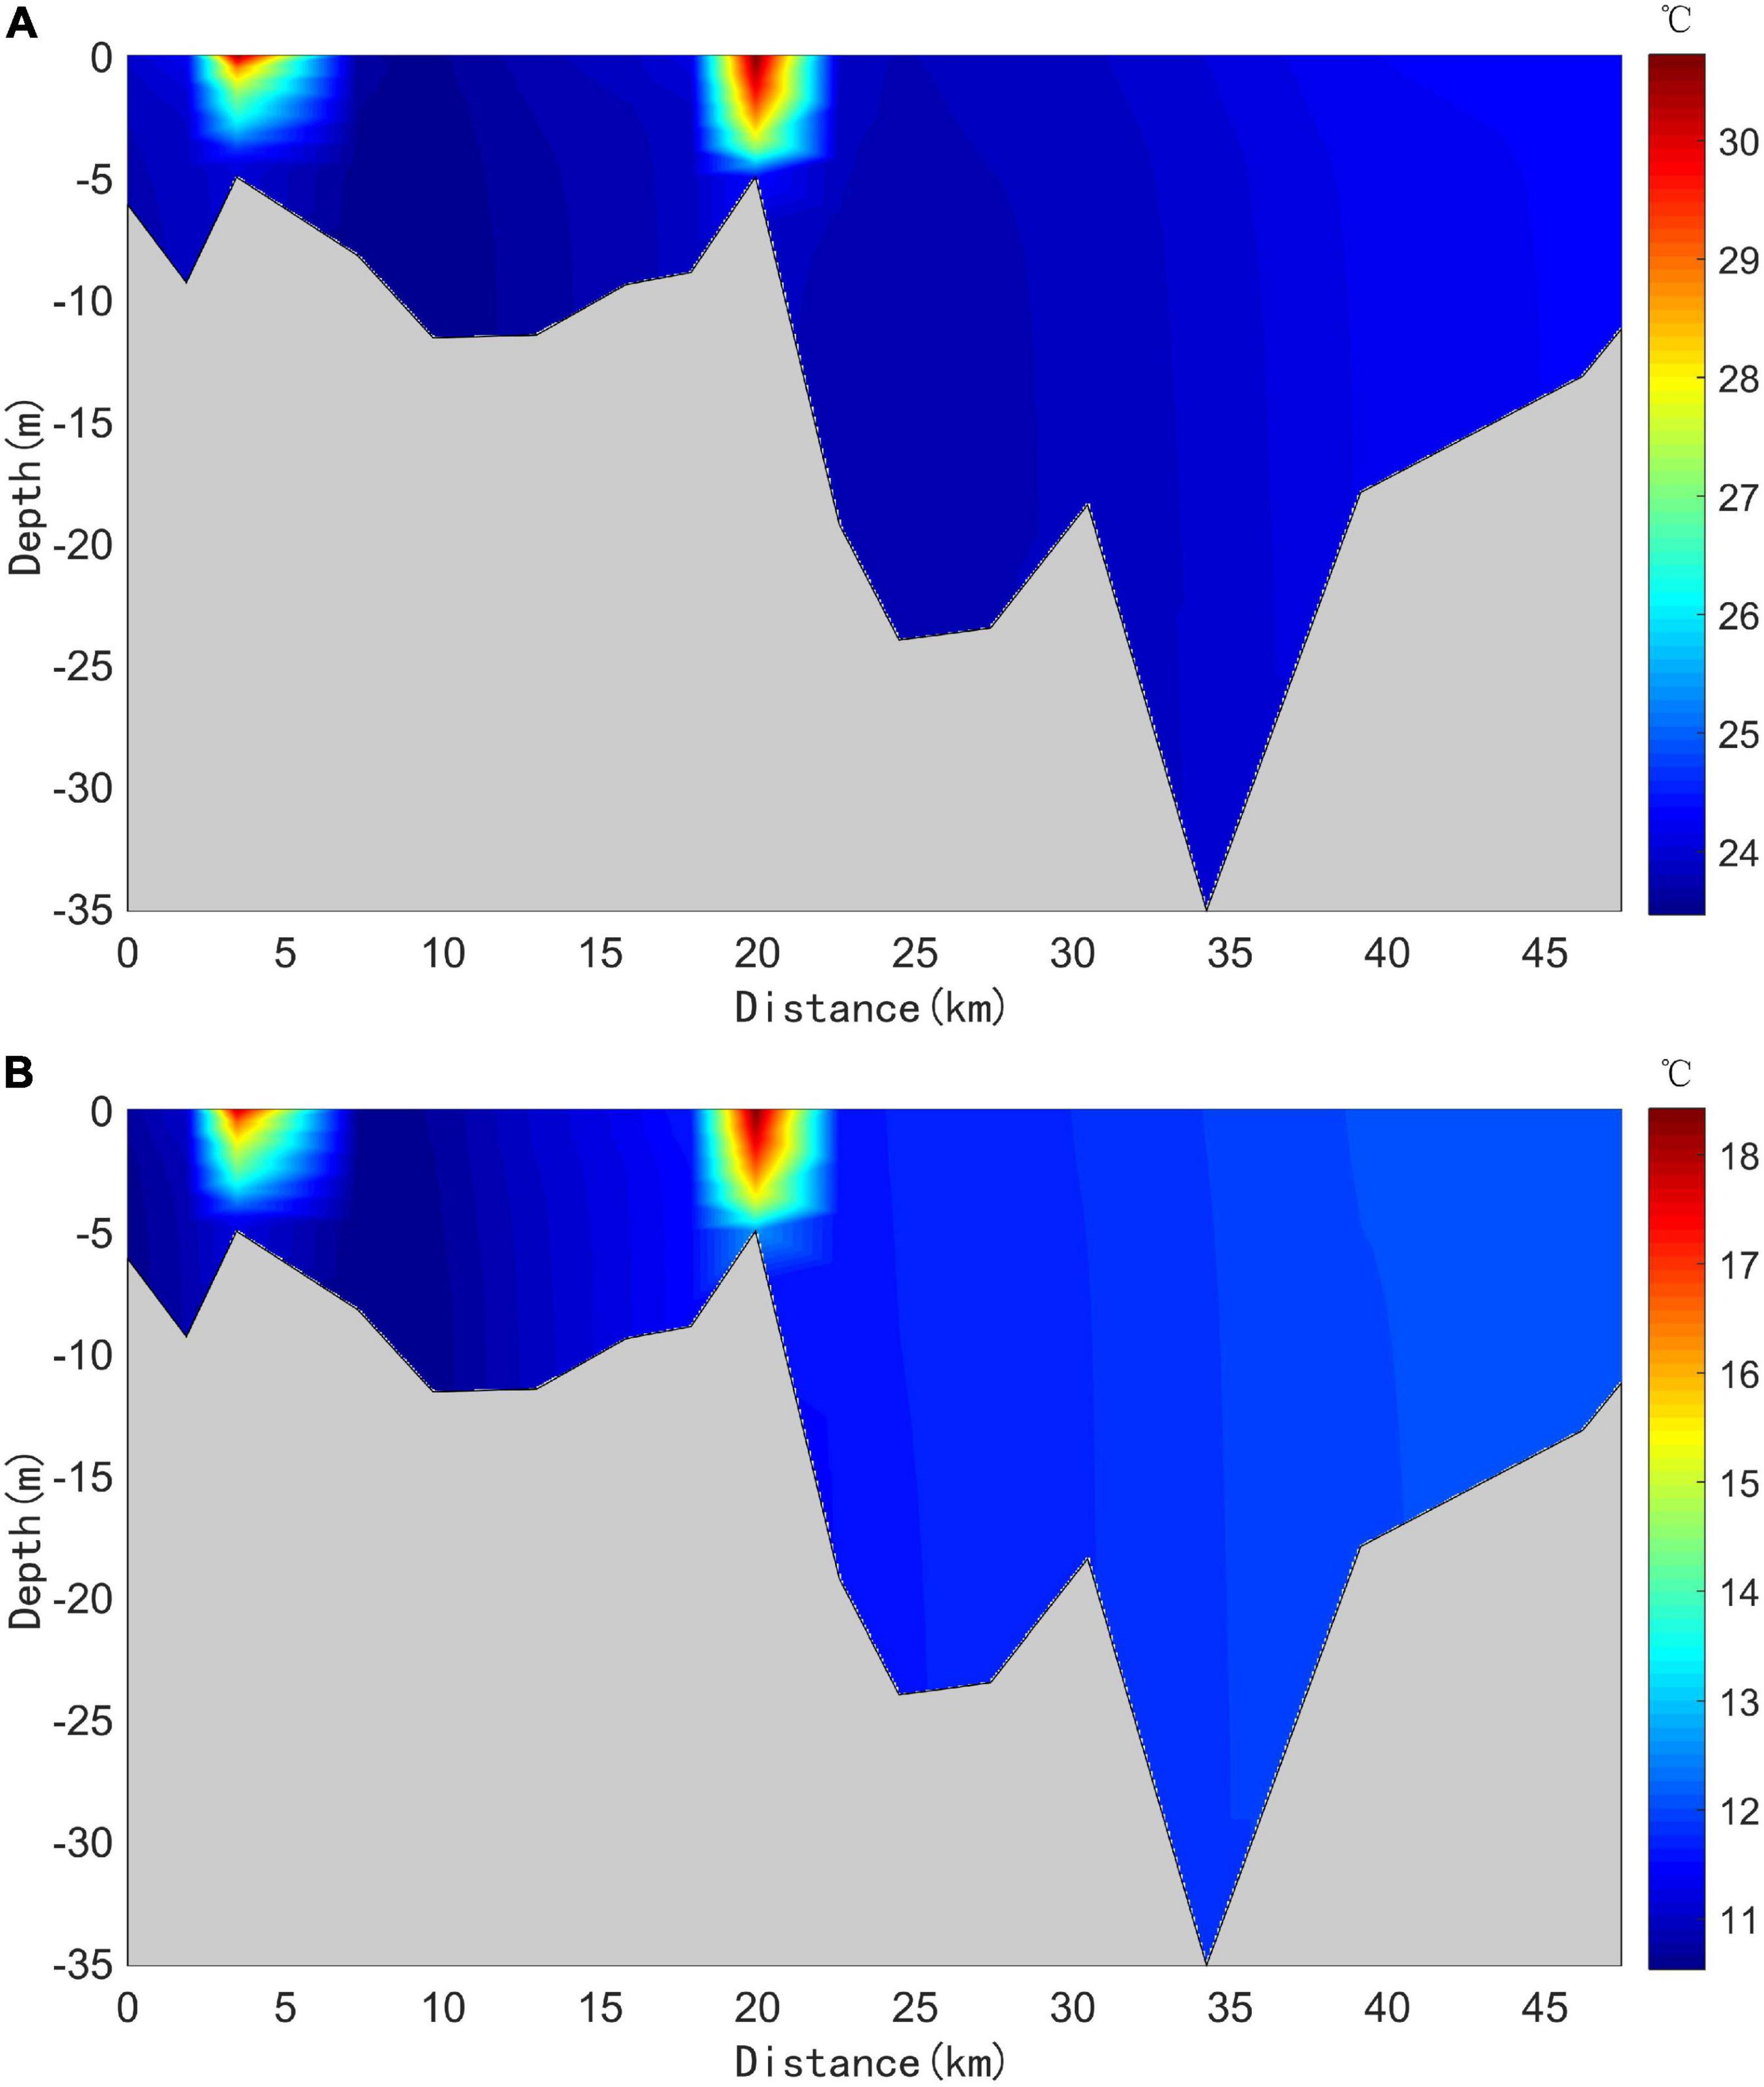
The distribution and characteristics of temperature elevation in the vertical plane were also investigated; the results showed that the thermal discharges also caused a temperature difference in the vertical direction. To evaluate vertical temperature variation in the bay, a section was taken from the bottom of the bay to the entrance (shown in Figure 1B) to study the temperature distribution in summer and winter.
The analysis results demonstrated that the overall vertical water temperature in summer was higher than that in winter (Figure 9). The temperature near the two power plants was higher than other regions; the temperature near the power plants was higher at the seawater surface than at the bottom, gradually decreasing with proximity to the bottom layer. In addition, the diffusion of warm water at the bottom was affected by bottom friction and the relatively low flow rate; therefore, the extent of influence was lower at the bottom than near the surface layer. Note that the water depth near the power plants was shallow, whereas depth near the bay entrance was deep. The maximum temperature near the outlets in summer and winter exceeded 30 and 18°C, respectively.
The temperature elevation from the bay head to its entrance (pink line in Figure 1B) was calculated to understand the effect of thermal discharge on the overall temperature throughout the bay in summer and winter. As semi-diurnal tides are dominant in Xiangshan Bay, the bay was mainly affected by the M2 tidal component with a tidal period of approximately 12.42 h. The variation in temperature elevation within 174 h (approximately 14 tide cycles) in summer and winter was calculated (Figures 7A,B).
The analysis results showed that temperature elevation fluctuated with tidal levels; this range of fluctuation was greater in summer than winter, and the variation was within the range of average values (denoted by orange lines in Figures 7A,B). Additionally, the amplitude of water temperature elevation was greater in summer than winter. Average temperature elevations in summer and winter were 0.73 and 0.52°C, while the minimum/maximum temperature elevations were 0.61/0.85°C and 0.46/0.61°C, respectively.
Ten cross-sections (hereafter referred to as cross-sections 1–10) were used to divide the bay into 10 equally distanced segments from the bay head to its entrance (red lines in Figure 1B) and evaluate the temperature elevation caused by the thermal discharge from the section to the bay head (Figures 7C,D).
In summer and winter, water temperature elevation increased then decreased from the bay head to the entrance of the bay. In cross-section 2, the temperature elevation reached its maximum in summer and winter; as such, the thermal discharge had the greatest effect on water temperature in Tie Port for both seasons. The decrease in temperature elevation from cross-sections 2 to 10 was mainly due to the gradual increase in water volume within the calculation area. It should be noted that Tie Port is located between cross-section 2 and the bay head, an area greatly impacted by Ninghai power plant. The temperature elevation from cross-sections 2 to 10 showed a decreasing trend that gradually accelerated, with a rapid temperature elevation decrease beyond cross-section 6 (Figures 7C,D). This was because Wushashan power plant is located between cross-sections 5 and 6, which increases the general temperature near the power plant. The maximum temperature elevation in summer was greater than that in winter. As there was poor water exchange between the inner bay and outer sea, and the thermal discharge accumulated within Xiangshan Bay.
Influence of Thermal Discharge and Tidal Flats on Heat Flux Distribution
The heat flux distribution during the tidal cycle was determined to investigate heat flux distribution in the bay as a result of the thermal discharge and tidal flats. Specifically, the heat flux distributions of 14 tidal cycles in summer and winter were determined, from which an average value was calculated. In Figure 10, the area from the pink line to the shoreline represents the tidal flat distribution area; this distribution shows that the tidal flats were mainly distributed along the west and south shorelines.

Figure 10. Distribution of heat flux in Xiangshan Bay in which positive values indicate the absorption of heat absorbed: (A) summer; and (B) winter. The pink line represents the boundary between the tidal flats and seawater. This figure represents a magnification of the area near power plant outlets.
The heat flux in the tidal flat was positive in summer and negative in winter; this trend was the same as that of seawater in Xiangshan Bay, excluding the area near the outlets of the two power plants. The heat flux near the power plant outlets was negative and lower than that in other areas, whereby the heat flux decreased with proximity to the outlet. The minimum heat flux near the outfall was -85.60 and -333.58 w/m2 in summer and winter, respectively; these results indicate that thermal discharge significantly influenced heat flux in the bay (Figure 10).
Heat Budgets in Winter and Summer
The heat flux contributions from the atmosphere (Q1), tidal flats (Q2), thermal discharges (Q3), and open sea (Q4) were calculated to understand the heat balance within the bay in summer and winter; the heat input is illustrated in Figure 11A. The heat budgets (Qnet) in summer and winter were also calculated and compared. Using the modeled results, Q1, Q2, Q3, and Qnet were calculated using the integral; further, Q4 was determined using Q1, Q2, Q3, and Qnet. To avoid the results being influenced by day and night, the average value of the 14 tide cycles was adopted to determine the heat flux of one tidal cycle in summer and winter; Figures 11B,C illustrate these results. These figures show that Q1 and Q4 had greater impacts on heat in the bay, regardless of season. The bay absorbed heat from Q1 and Q2 in summer, while becoming a heat source for Q1 and Q2 in winter. Conversely, Q4 absorbed heat from the bay in summer and provided heat to the bay in winter, whereas Q3 was a heat source to the bay in both seasons. The tidal flats had less influence on heat flux in the bay compared to the atmosphere in both seasons. The Qnet was positive in summer as the heat in the bay increased and negative in winter when heat in the bay decreased; this corresponded to a higher water temperature in summer than winter. The Q2/Q1 ratio was higher in winter than summer, demonstrating that the heat-related effect of the tidal flats in summer was lower than in winter; the flats provided 1.31 × 10¹³ J of heat to the bay in summer and absorbed 8.63 × 10¹³ J of heat from the bay in winter. These results demonstrate that the tidal flats contribute to the heat balance in Xiangshan Bay.
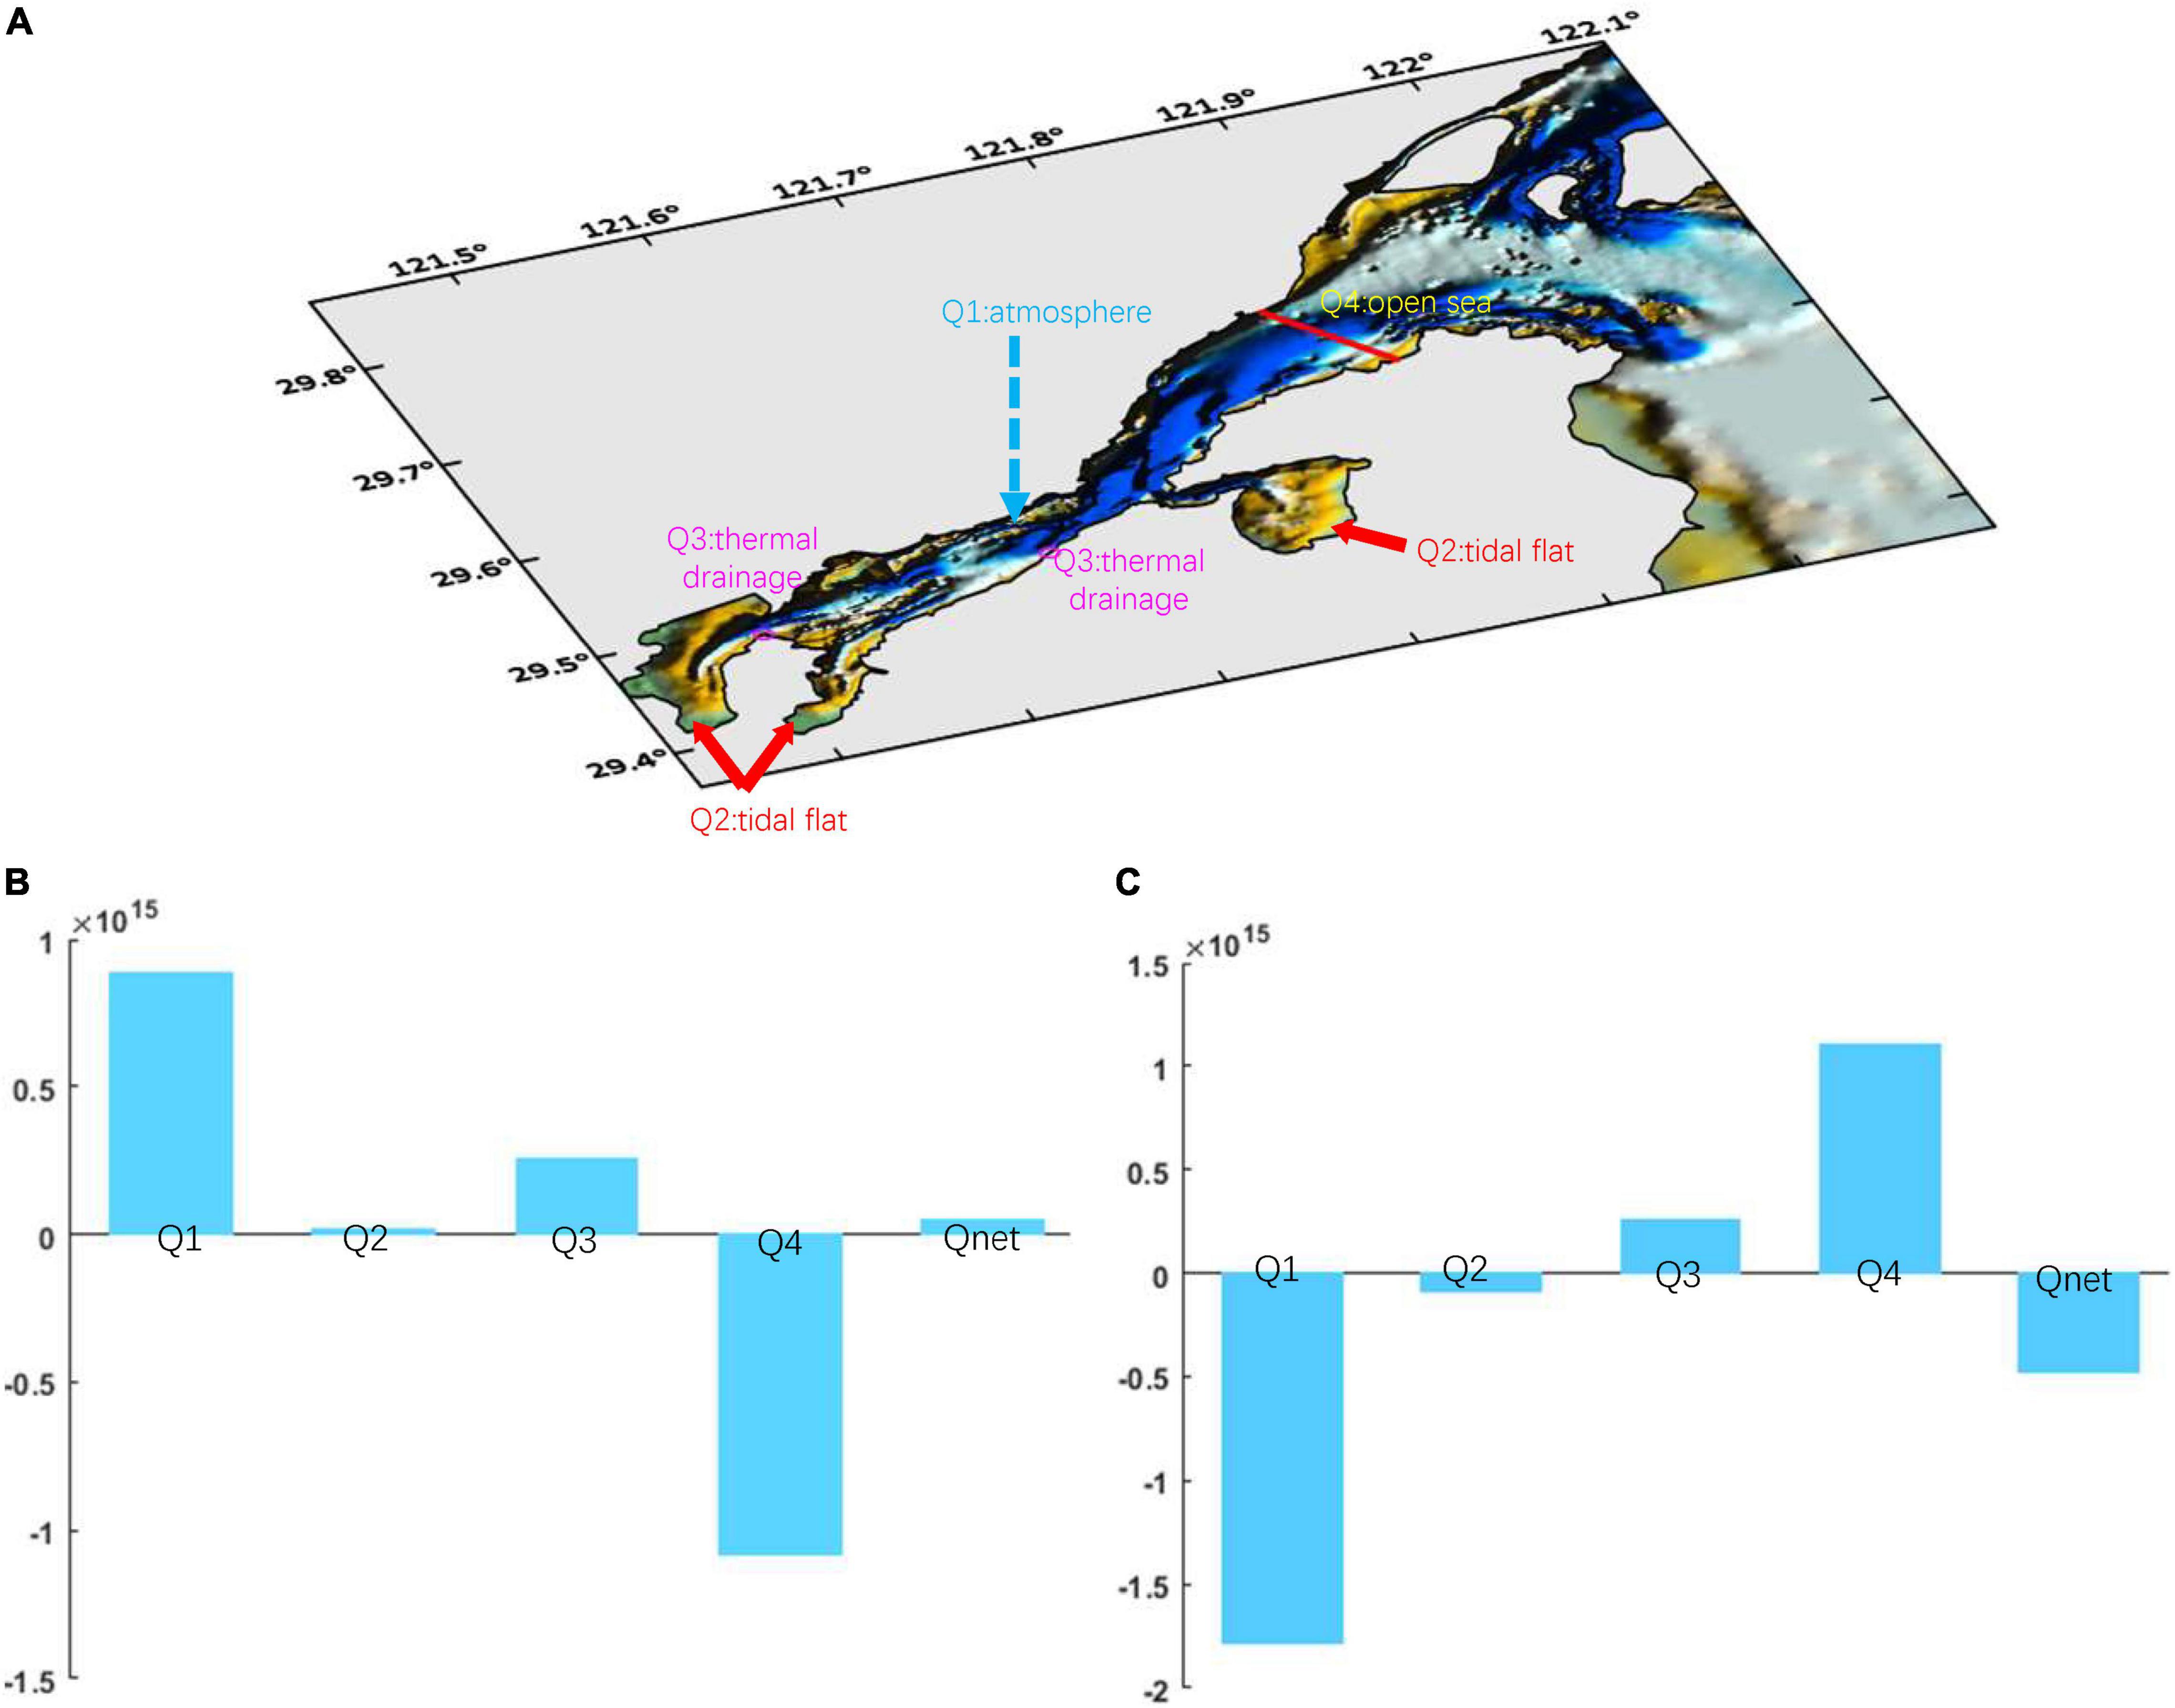
Figure 11. (A) Contributions of heat flux terms, where Q1: atmosphere; Q2: tidal flats; Q3: thermal discharge; and Q4: Open sea. Values of the four components of heat (unit: J) in (B) summer; and (C) winter. Qnet = Q1 + Q2 + Q3 + Q4.
Conclusion
This study considered the influence of thermal discharge and tidal flats on temperature and heat to improve the FVCOM model by adding the tidal flat temperature calculation module, optimizing the thermal discharge calculation module, and establishing a 3D thermal discharge convection-diffusion model. The model results were observed to fit with measured data, including the tidal level, currents, water temperature, and tidal flat temperature. The model demonstrated the best fit with measured tidal flat temperatures, indicating that the model could better reproduce actual temperatures of the tidal flat.
The findings show that thermal discharge caused a significant temperature elevation, with average temperature increases of 0.73 and 0.52°C in summer and winter, respectively. The average temperature elevation from the bay head to Ninghai power plant gradually increased, while it decreased from Ninghai power plant to the bay entrance; Tie Port experienced the largest temperature elevation compared to Huangdun and Xihu ports.
The results showed that in terms of the heat contribution of each part of Xiangshan Bay, the main heat sources were the atmosphere and open sea. The influence of thermal discharge was greater than that of tidal flats; however, the influence of the latter could not be neglected. During one tidal cycle, the tidal flat provided 1.69 × 10¹³ J of heat to the bay in summer and absorbed 8.61 × 10¹³ J of heat from the bay in winter. The findings of this study emphasize that the influence of tidal flats should always be considered to accurately estimate the heat content of Xiangshan Bay.
Data Availability Statement
The datasets presented in this study can be found in online repositories. The names of the repository/repositories and accession number(s) can be found below: https://pan.baidu.com/s/1mw9Pc6HzqYpNGQUtIyNnBg?pwd=vqy8.
Author Contributions
GK completed the article with the help of WG and LL. All authors contributed to the article and approved the submitted version.
Funding
This study was supported by the National Nature Science Foundation of China (42076216, U20A20104, and 41830540), and the Oceanic Interdisciplinary Program of Shanghai Jiao Tong University (SL2020ZD204). It was also funded by the Project of State Key Laboratory of Satellite Ocean Environment Dynamics (SOEDZZ2202 and SOEDZZ2101).
Conflict of Interest
The authors declare that the research was conducted in the absence of any commercial or financial relationships that could be construed as a potential conflict of interest.
Publisher’s Note
All claims expressed in this article are solely those of the authors and do not necessarily represent those of their affiliated organizations, or those of the publisher, the editors and the reviewers. Any product that may be evaluated in this article, or claim that may be made by its manufacturer, is not guaranteed or endorsed by the publisher.
Footnotes
- ^ https://www.ecmwf.int/
- ^ http://apdrc.soest.hawaii.edu/data/data.php
- ^ http://volkov.oce.orst.edu/tides/TPXO7.2.html
- ^ http://ids.ceode.ac.cn/query.html
References
Campbell, G. S., and Norman, J. M. (1998). An Introduction to Environmental Biophysics, 2nd Edn. New York, NY: Springer-Verlag. doi: 10.1007/978-1-4612-1626-1
Chen, C., Beardsley, R. C., Cowles, G., Qi, J., Lai, Z., Gao, G., et al. (2011). An Unstructured-Grid, Finite-Volume Community Ocean Model: FVCOM User Manual. Cambridge, MA: Sea Grant College Program, Massachusetts Institute of Technology.
Chen, H., Zhu, L., Li, J., and Fan, X. (2018). A comparison of two mono-window algorithms for retrieving sea surface temperature from Landsat-8 data in coastal waters of Hongyan River nuclear power station. Remote Sens. Nat. Resour. 30, 43–53. doi: 10.3390/ijgi7010030
Cho, Y. K., Kim, M. O., and Kim, B. C. (2000). Sea fog around the Korean peninsula. J. Appl. Meteorol. 39, 2473–2479. doi: 10.1175/1520-0450(2000)039<2473:sfatkp>2.0.co;2
Cho, Y. K., Kim, T., You, K., Park, L.-H., Moon, H.-T., Lee, S.-H., et al. (2005). Temporal and spatial variabilities in the sediment temperature on the Baeksu tidal flat, Korea. Estuar. Coast. Shelf Sci. 65, 302–308. doi: 10.1016/j.ecss.2005.06.010
Deng, Z. Q. (2007). Study on Air-Sea Heat Fluxes and Its Application in Heat Diffusion from Cooling Water. Shandong: Ocean University of China, 62.
Dong, L., and Su, J. (1999). Tide response and tide wave distortion study in the Xiangshan Bay. Haiyang Xue Bao 2, 1–8.
Dong, Y., Zuo, L., Ma, W., Chen, Z., Cui, L., and Lu, Z. (2021). Phytoplankton community organization and succession by sea warming: a case study in thermal discharge area of the northern coastal seawater of China. Mar. Pollut. Bull. 169:112538. doi: 10.1016/j.marpolbul.2021.112538
Fei, Y. (2012). Influence Analysis on Marine Environmental Capacity of Power Plant Thermal Discharge in Xiangshan Harbor. Zhoushan: Zhejiang Ocean University. 63.
Fei, Y. J., Chen, B. R., and Zhao, J. Y. (2013). The use of TATR (total amount of temperature rise) index in numerical simulation of Xiangshan Bay’s temperature rise. Adv. Mater. Res. 726–731, 2004–2011. doi: 10.4028/www.scientific.net/AMR.726-731.2004
Friedlander, M., Levy, D., and Hornung, H. (1996). The effect of cooling seawater effluents of a power plant on growth rate of cultured Gracilaria conferta (Rhodophyta). Hydrobiologia 332, 167–174. doi: 10.1007/BF00031922
Gao, S., Xie, Q.-C., and Feng, Y. J. (1990). Fine-grained sediment transport and sorting by tidal exchange in Xiangshan Bay, Zhejiang, China. Estuar. Coast. Shelf Sci. 31, 397–409. doi: 10.1016/0272-7714(90)90034-O
Guarini, J. M., Blanchard, G. F., Gros, P., and Harrison, S. J. (1997). Modelling the mud surface temperature on intertidal flats to investigate the spatio-temporal dynamics of the benthic microalgal photosynthetic capacity. Mar. Ecol. Prog. Ser. 153, 25–36. doi: 10.3354/meps153025
He, G., Huiming, Z., and Hongwei, F. (2008). 3D numerical simulation for flow and heat transport of power plant affected by tide. J. Hydroelectr. Eng. 27, 125–131.
Horton, R., Wierenga, P. J., and Nielsen, D. R. (1983). Evaluation of methods for determining the apparent thermal diffusivity of soil near the surface. Soil Sci. Soc. Am. J. 47, 25–32. doi: 10.2136/sssaj1983.03615995004700010005x
Hou, L. J., Li, H. L., Zheng, C. M., Ma, Q., Wang, C. Y., Wang, X. J., et al. (2016). Seawater-groundwater exchange in a silty tidal flat in the south coast of Laizhou Bay, China. J. Coast. Res. 74, 136–148. doi: 10.2112/SI74-013.1
Huang, X. Q., and Ye, H. F. (2014). Monitoring and Impact Assessment of Temperature Rise of Thermal Discharge of Xiangshan Bay. Beijing: China Ocean Press, 301.
Jiang, C. P., Xu, Z. L., Chen, J. J., Sun, L. F., and Que, J. L. (2016). Effects of the thermal discharge from Qinshan Nuclear Plant on the distribution pattern of fish. J. Fish. Sci. 42, 1229–1240.
Kim, T., and Cho, Y. (2009). Heat flux across the surface of a macrotidal flat in southwest Korea. J. Geophys. Res. Oceans 114:C07027. doi: 10.1029/2008JC004966
Kim, T., and Cho, Y. (2011). Calculation of heat flux in a macrotidal flat using FVCOM. J. Geophys. Res. 116:C03010. doi: 10.1029/2010JC006568
Kim, T., Cho, Y., and Dever, E. P. (2007). An evaluation of the thermal properties and albedo of a macrotidal flat. J. Geophys. Res. 112:C12009. doi: 10.1029/2006JC004015
Li, L., Guan, W., Hu, J., Cheng, P., and Wang, X. H. (2017a). Responses of water environment to tidal flat reduction in Xiangshan Bay: part I hydrodynamics. Estuar. Coast. Shelf Sci. 206, 14–26. doi: 10.1016/j.ecss.2017.11.003
Li, L., Guan, W., He, Z., Yao, Y., and Xia, Y. (2017b). Responses of water environment to tidal flat reduction in Xiangshan Bay: part II locally re-suspended sediment dynamics. Estuar. Coast. Shelf Sci. 198, 114–127. doi: 10.1016/j.ecss.2017.08.042
Li, L., Tongyao, F., Weibing, G., et al. (2015). “The influence of the decrease of tidal flat on the tide of Xiangshan Bay,” in Proceedings of the 17th China Offshore Eng. Symposium, Zhoushan 144–148.
Li, L., Ye, T., He, Z., and Xia, Y. (2018). A numerical study on the effect of tidal flat’s slope on tidal dynamics in the Xiangshan Bay, China. Acta Oceanol. Sin. 37, 29–40. doi: 10.1007/s13131-018-1263-8
Lin, J., Zou, X., Huang, F., and Yao, Y. (2021). Quantitative estimation of sea surface temperature increases resulting from the thermal discharge of coastal power plants in China. Mar. Pollut. Bull. 164:112020. doi: 10.1016/j.marpolbul.2021.112020
Lin, Z., and Zhan, H. (2000). Effects of thermal effluent on fish eggs and larvae in waters near Daya Bay nuclear plant. J. Trop. Oceanogr. 19, 44–51.
Nakashita, S., Hibino, T., Komai, K., and Narong, T. (2016). Temporal variations of groundwater salinity and temperature in a tidal flat in front of a tide pool. Cont. Shelf Res. 122, 29–35. doi: 10.1016/j.csr.2016.03.024
Peng, H. (2013). Numerical Study of Water Exchange in Xiangshan Port. Hangzhou: Zhejiang University.
Rajadurai, M., Poornima, E. H., Narasimhan, S. V., Rao, V. N. R., and Venugopalan, V. P. (2005). Phytoplankton growth under temperature stress: laboratory studies using two diatoms from a tropical coastal power station site. J. Therm. Biol. 30, 299–305. doi: 10.1016/j.jtherbio.2005.01.003
Ren, M., Liu, L., He, D. H., Xu, G. F., and Mao, W. H. (2012). Influence of thermal drainage of coastal power plant on red tide in Xiangshan Port. Ocean Dev. Manage. 29:4.
Rinehimer, J. P., and Thomson, J. T. (2014). Observations and modeling of heat fluxes on tidal flats. J. Geophys. Res. Oceans 119, 133–146.
Roemmich, D., and McGowan, J. (1995). Climatic warming and the decline of zooplankton in the Califonia Current. Science 267, 1324–1326. doi: 10.1126/science.267.5202.1324
Roy, P., Rao, I. N., Martha, T. R., and Kumar, K. V. (2021). Discharge water temperature assessment of thermal power plant using remote sensing techniques. Energy Geosci. doi: 10.1016/j.engeos.2021.06.006
Salgueiro, D. V., Pablo, H. D., Neves, R., and Mateus, M. (2015). Modelling the thermal effluent of a near coast power plant (Sines, Portugal). Rev. Árvore 27, 53–57. doi: 10.5894/rgci577
Shen, P. (2002). A study on farming capacity and sustained development of aquaculture in Xiangshan Port. Mod. Fish. Inf. 7, 22–24.
Shen-Liang, C., Shi-Lun, Y., and Rui-Ming, W. (2004). Temporal changes in tidal flat sediment grain size along the north bank of the Hangzhou Bay and their implication of sedimentation dynamics. Adv. Mar. Sci. 22, 299–305.
Smagorinsky, J. (1963). General circulation experiments with the primitive equations, I. The basic experiment. Mon. Weather Rev. 91, 99–164. doi: 10.1175/1520-0493(1963)091<0099:GCEWTP>2.3.CO;2
Sohma, A., Sekiguchi, Y., Yamada, H., Sato, T., and Nakata, K. (2001). A new coastal marine ecosystem model study coupled with hydrodynamics and tidal flat ecosystem effect. Mar. Pollut. Bull. 43, 187–208. doi: 10.1016/S0025-326X(01)00083-2
Sun, W., Yu, J., Xu, X., Zhang, W., Liu, R., and Pan, J. (2014). Distribution and sources of heavy metals in the sediment of Xiangshan bay. Acta Oceanol. Sin. 33, 101–107. doi: 10.1007/s13131-014-0456-z
Thomson, J. (2010). Observations of thermal diffusivity and a relation to the porosity of tidal flat sediments. J. Geophys. Res. Oceans 115:C05016. doi: 10.1029/2009JC005968
Xia, X. M., and Xie, Q. Y. (1997). Periodic change of muddy tidal flat in the harbor (in Chinese). Haiyang Xue Bao 19, 99–108.
Xu, D., Wang, H., Han, D., Chen, A., and Niu, X. (2021). Phytoplankton community structural reshaping as response to the thermal effect of cooling water discharged from power plant. Environ. Pollut. 285:117517. doi: 10.1016/j.envpol.2021.117517
Xu, J., Ma, X., Hou, W., and Han, X. (1994). Effect of temperature and ammonia on silver carp, bighead carp, grass carp and common carp. China Environ. Sci. 14:6.
Xu, P., Mao, X., Jiang, W., and Zhou, L. (2014). A numerical study of tidal asymmetry: preferable asymmetry of nonlinear mechanisms in Xiangshan Bay, East China Sea. J. Ocean Univ. China 13, 733–741. doi: 10.1007/s11802-014-2251-z
Yanagi, T., Sugimatsu, K., Shibaki, H., Shin, H.-R., and Kim, H.-S. (2005). Effect of tidal flat on the thermal effluent dispersion from a power plant. J. Geophys. Res. 110:C03025. doi: 10.1029/2004JC002385
You, Z. J., and Jiao, H. F. (2011). Research on Ecological Environment Protection and Restoration Technology of Xiangshan Bay. Beijing: China Ocean Press, 444.
Zeng, G. N., and Guan, W. B, Zeng, J. N, Chen, Q. Z, and Ai, N. (2011). 3D modeling of the thermal effluents dispersion from power plants in the Xiangshan Bay. Energy Educ. Sci. Technol. A 28, 71–82.
Zeng, X. M., Guan, W. B., and Pan, C. (2011). Cumulative influence of long-term reclamation on hydrodynamics in the Xiangshan Bay. J. Mar. Sci. 29, 73–83.
Zhang, G. (2015). Three-Dimensional Numerical Simulation of Cooling Water in Longkou Northern Water. Qingdao: The First Institute of Oceanography, MNR, 95.
Zhao, Y.-L., and Yang, J.-Z. (2007). The remote sensing dynamic monitoring of the shoreline and the bank in Xiangshan Harbor. Remote Sens. Land Resour. 4, 114–117, 121. doi: 10.3969/j.issn.1001-070X.2007.04.025
Keywords: tidal flat, thermal discharge, heat flux, water temperature, numerical modeling, Xiangshan Bay
Citation: Kong G, Li L and Guan W (2022) Influences of Tidal Flat and Thermal Discharge on Heat Dynamics in Xiangshan Bay. Front. Mar. Sci. 9:850672. doi: 10.3389/fmars.2022.850672
Received: 08 January 2022; Accepted: 14 February 2022;
Published: 10 March 2022.
Edited by:
Achilleas G. Samaras, Democritus University of Thrace, GreeceReviewed by:
Maria Gabriella Gaeta, University of Bologna, ItalyTarang Khangaonkar, University of Washington, United States
Copyright © 2022 Kong, Li and Guan. This is an open-access article distributed under the terms of the Creative Commons Attribution License (CC BY). The use, distribution or reproduction in other forums is permitted, provided the original author(s) and the copyright owner(s) are credited and that the original publication in this journal is cited, in accordance with accepted academic practice. No use, distribution or reproduction is permitted which does not comply with these terms.
*Correspondence: Weibing Guan, Z3diQHNpby5vcmcuY24=
 Gaoqiang Kong
 Li Li
Li Li Weibing Guan1,2,3*
