 Nicholas Bock
 Ajit Subramaniam
 Andrew R. Juhl
 Joseph Montoya
 Solange Duhamel
94% of researchers rate our articles as excellent or good
Learn more about the work of our research integrity team to safeguard the quality of each article we publish.
Find out more
METHODS article
Front. Mar. Sci., 23 May 2022
Sec. Marine Biology
Volume 9 - 2022 | https://doi.org/10.3389/fmars.2022.850646
Marine phytoplankton play a central role in global biogeochemical cycling, carbon export, and the overall functioning of marine ecosystems. While chlorophyll a (Chl a) is widely used as a proxy for phytoplankton biomass, identifying the proportion of Chl a attributable to different phytoplankton groups remains a major challenge in oceanography, especially for the picophytoplankton groups that often represent the majority of phytoplankton biomass in the open ocean. We describe a method for measuring picophytoplankton per-cell Chl a in field samples using fluorescence-activated cell sorting followed by solvent-based Chl a extraction and fluorescence quantification. Applying this method to surface samples from the Gulf of Mexico, we determined per-cell Chl a to be 0.24 ± 0.07, 0.6 ± 0.33, and 26.36 ± 20.9 fg Chl a cell-1 for Prochlorococcus, Synechococcus, and PPE, respectively (mean ± SD). Measurements of per-cell Chl a using this method are precise to within 1.7, 2.1, and 3.1% for Prochlorococcus, Synechococcus, and PPE, respectively. We demonstrate that this approach can be used to obtain estimates of group-specific Chl a for Prochlorococcus, Synechococcus, and picophytoeukaryotes, the latter two of which cannot be captured by existing methods. We also demonstrate that measurements of per-cell Chl a made using this method in field samples are sufficiently precise to capture relationships between per-cell Chl a and cytometer red fluorescence, providing a bridge between biomass estimates from cell counts and bulk measurements of total Chl a.
Evaluating marine phytoplankton community composition is essential for understanding global biogeochemical cycling, the impacts of human activity on marine ecosystem productivity, and the overall structure of marine food webs. Because optical or molecular methods for describing phytoplankton community composition are labor-intensive on large spatiotemporal scales, phytoplankton community composition is typically evaluated using methods that estimate the relative abundance of phytoplankton size or functional classes based on phytoplankton pigment concentrations. These methods include size-fractionated filtration of chlorophyll a (hereafter Chl a; Sieburth et al., 1978), determination of phytoplankton taxonomic groups based on ratios of accessory pigments (Mackey et al., 1996), and determination of phytoplankton size class abundance based on subsets of accessory pigments (diagnostic pigment analysis, or DPA).
Because of the global coverage of accessory pigment measurements via high-performance liquid chromatography (HPLC), DPA is widely used in conjunction with bio-optical measurements from remote sensing platforms to model phytoplankton community structure at the global scale (see Mouw et al., 2017 for a review). First proposed by Claustre (1994) and developed further by Vidussi et al. (2001), DPA methods generally describe phytoplankton biomass fractions attributable to three phytoplankton size classes: picophytoplankton, nanophytoplankton, and microphytoplankton, defined as cells with a diameter < 2 μm, 2 – 20 μm, and > 20 μm, respectively. Refinements to this approach have used linear regression to relate diagnostic pigments to total Chl a concentrations (Uitz et al., 2006), have introduced additional diagnostic pigments to differentiate Prochlorococcus from other pico-sized groups (Hirata et al., 2008; Hirata et al., 2011), and have established criteria allowing for individual pigments to be diagnostic of different groups based on total Chl a concentration (Brewin et al., 2010).
While estimates from diagnostic pigment-based methods converge with those derived from size fractionation in larger phytoplankton size classes (Brewin et al., 2014), the accuracy of pigment-based predictions for the three major picophytoplankton groups (Prochlorococcus, Synechococcus, and picophytoeukaryotes, hereafter PPE) is limited by the overlap of individual diagnostic pigments across multiple size classes (Uitz et al., 2009), in addition to difficulty in determining generalizable coefficients relating diagnostic pigments to Chl a (Gittings et al., 2019; Chase et al., 2020). With primary production estimates for Prochlorococcus, Synechococcus, PPE, and larger phytoplankton differing by several orders of magnitude (Jardillier et al., 2010; Rii et al., 2016a; Rii et al., 2016b; Duhamel et al., 2019), accurately resolving community structure within picophytoplankton is key to understanding marine primary production from local to global scales.
Because contributions of Prochlorococcus, Synechococcus, and PPE populations to total Chl a cannot be disambiguated using current diagnostic pigment-based or size fractionation based techniques, we introduce a novel method for directly measuring picophytoplankton per-cell Chl a content (fg Chl a cell-1) using fluorescence-activated cell sorting (FACS) in concert with solvent-based Chl a quantification. Combining per-cell Chl a measurements obtained using this method with picophytoplankton cell counts and measurements of total Chl a, this approach allows for the estimation of phytoplankton group-specific Chl a concentration (μg Chl a ml-1) and group-specific Chl a fractions (% Chl a), thus bridging the two commonly used methods to describe phytoplankton biomass (e.g., cytometry and bulk Chl a) without the use of diagnostic pigments or other proxies.
An additional motivation for the development of the FACS method described here is to address the long-standing challenge of ascertaining phytoplankton Chl a: Carbon ratios, which are widely parameterized in phytoplankton primary production models (Westberry et al., 2008; Graff et al., 2015). Especially when combined with existing methods for estimating per-cell carbon based on cytometry forward scatter or side scatter measurements (Martinez-Vicente et al., 2013; Cetinić et al., 2015), or existing taxon-specific carbon conversion coefficients (Grob et al., 2007; Rembauville et al., 2017), this method provides a new tool estimating total Chl:C ratios, and for evaluating sources of variability in Chl:C ratios within and between individual phytoplankton groups.
To demonstrate that the FACS method is sufficiently sensitive to support these applications, we validated the approach using cultured phytoplankton and applied the approach to field samples collected in the Gulf of Mexico on a transect covering a large gradient in surface Chl a concentrations. We report sources of variability encountered using this method and compare FACS-based measurements of per-cell Chl a to environmental variables and cytometer red fluorescence. We also compare FACS-based measurements of group-specific Chl a to HPLC pigment concentrations and estimates of group-specific Chl a fractions obtained using several existing DPA methods.
Field samples were collected during R/V Endeavor cruise EN642 in the Gulf of Mexico during July 2019 (Figure 1). Surface samples were collected from depths < 5 meters at 13 sites. At five of these sites, additional samples were taken at depths corresponding to the halocline and the deep chlorophyll maximum (DCM). All samples were collected using a Niskin bottle rosette and processed following the protocol described below. At all sampling sites, depth profiles of salinity, temperature, and pressure were measured with a conductivity-temperature-depth instrument (CTD, Seabird 911 Plus) integrated within the bottle rosette. The percent of surface PAR (hereafter % I0) for each sampling depth was determined using a Photosynthetically Active Radiation (PAR) sensor on the rosette. The percent of surface PAR (hereafter % I0) was calculated by normalizing PAR to measurements of surface PAR from a shipboard PAR sensor.
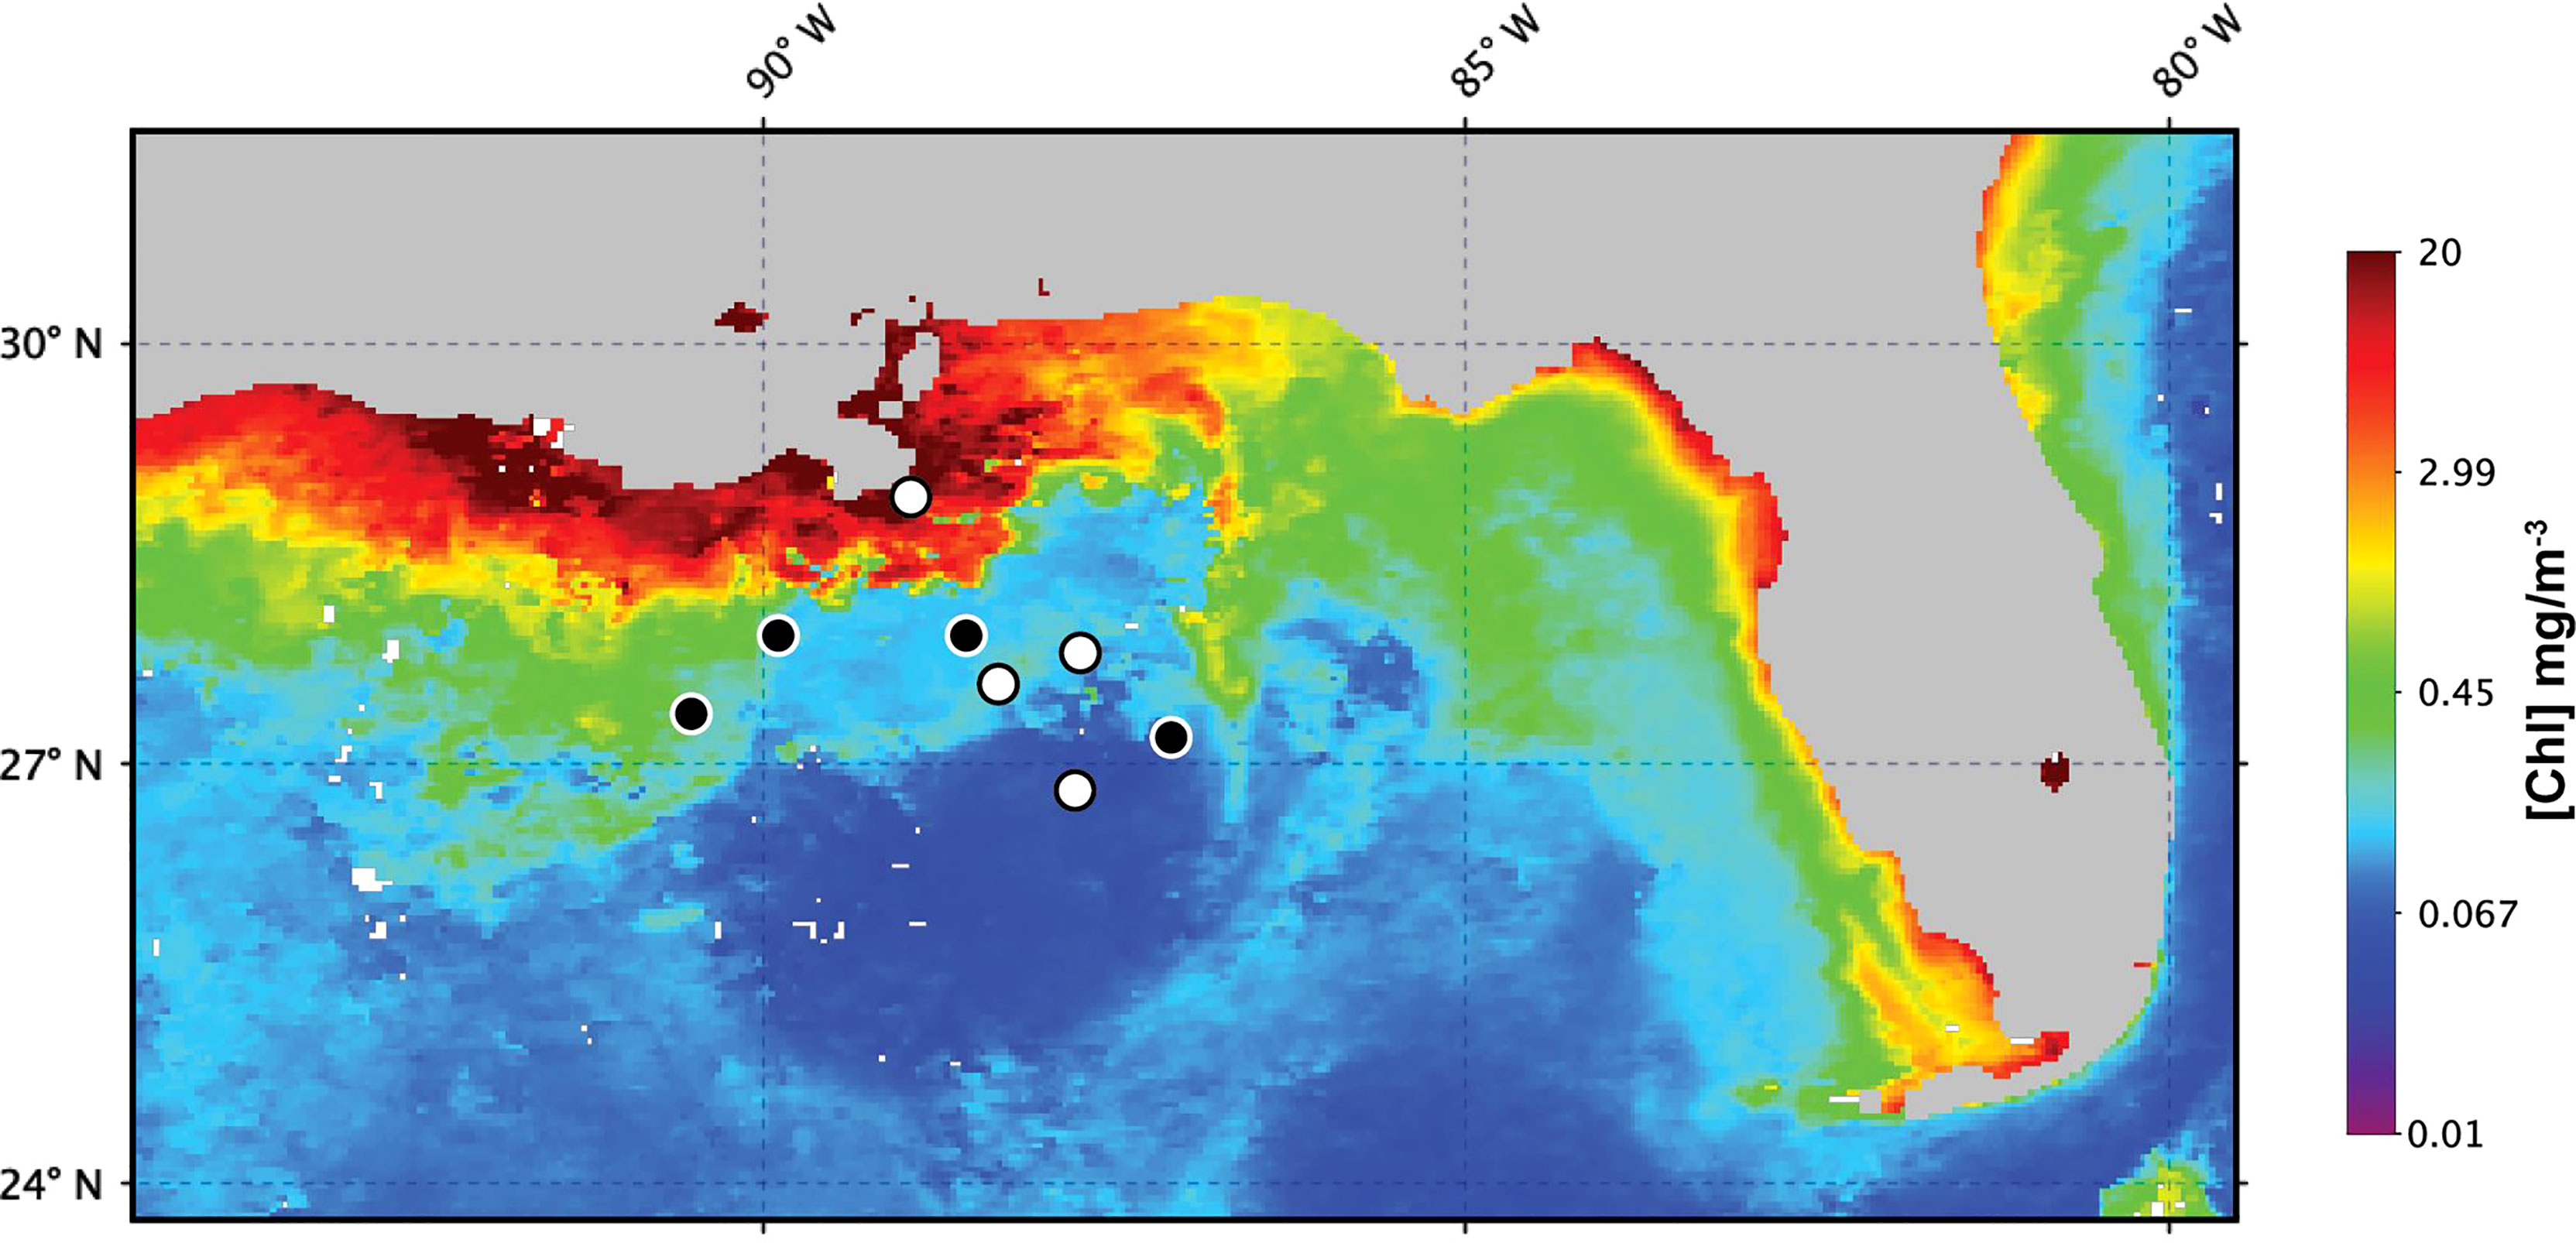
Figure 1 Gulf of Mexico sites sampled for measurements of cell-specific Chl a during EN642. Numbered black circles indicate sites where profile samples were collected. White circles indicate sites where only surface samples were collected. Background chlorophyll concentration corresponds to the 4-km, 1-month MODIS composite for July 2019.
For each sampling site/depth, separate subsamples were prepared for measurement of per-cell Chl a, HPLC pigments, and picophytoplankton cell abundance. To prepare per-cell Chl a samples, a peristaltic pump was used to concentrate cells from duplicate 1-liter samples onto 47-mm 0.2-μm pore size polycarbonate membrane filters (Sigma Millipore catalog #GTTP04700). Each filter was folded and placed in a cryovial containing 4-ml of seawater from the corresponding sampling depth. Samples were vortexed for 1 – 2 seconds to release cells from the filter, flash-frozen in liquid nitrogen without the addition of biological fixatives, and stored at -80°C. Water for HPLC analysis was collected from the same sampling depth as per-cell Chl a samples and filtered onto precombusted Whatman GF/F filters. The filters were then frozen in liquid nitrogen until analysis at the NASA facility at Goddard Space Flight Center, following the method described in Van Heukelem and Thomas (2001). All filtrations were performed under subdued lighting conditions to prevent pigment degradation. For cell enumeration, 2-mL subsamples were fixed (1% w/v electron microscopy grade paraformaldehyde, Electron Microscopy Sciences catalog RT-15710) for 10 – 15 minutes in the dark at room temperature. Samples were then flash-frozen in liquid nitrogen and stored at -80°C. All samples were processed within 8 months of collection. Only samples collected from depths corresponding to > 0.1% I0 and with salinity > 25.9 ppt were included in analyses.
For all samples, a BD Influx flow cytometer (BD Life Sciences, USA) was used to isolate cells from individual picophytoplankton populations by FACS. Cells from each population were collected onto separate 13-mm, 0.2-μm pore polycarbonate filters (Millipore Sigma catalog #GTTP01300) connected to a low-vacuum pump as described in Berthelot et al. (2019). A 70-µm nozzle was used, with sheath fluid pressure of 30 PSI (207 kPa) and sample fluid pressure of 31 PSI (214 kPa). At the start of each day of sample processing, the drop delay was calibrated using Accudrop Beads (BD Life Sciences, USA), and the sorting efficiency was verified manually by sorting a specified number of 1-µm yellow-green microspheres (Fluoresbrite, Polysciences catalog #17154-10) onto a glass slide and counting the beads under an epifluorescence microscope. The breakoff position was monitored through the day and adjusted if necessary. The instrument was set at high sorting purity (1.0 drop mode). To maintain high sorting purity and recovery, samples were diluted in artificial seawater filtered through a 0.2-μm pore size filter as required to achieve an event rate of < 5,000 per second. Higher event rates resulted in coincidence and swarm, as previously reported using the Influx (Kormelink et al., 2016). To ensure consistent instrument alignment, the position of the forward scatter detector, 488 nm 200 mW solid state laser, and 457 nm 300 mW solid state laser were calibrated such that reference beads were aligned to a predetermined position on a calibration plot comparing forward scatter and red fluorescence after adjusting the instrument to clearly resolve Prochlorococcus populations in surface samples. Samples were additionally amended with fluorescent reference beads (1-µm yellow-green microspheres) to monitor the alignment and focus of the instrument.
To gate populations of interest, cell doublets were first discarded using a pulse width versus forward scatter plot. That is, assuming that pulse width should generally covary with forward scatter for single particles (doublets have similar forward scatter as single cells but increased pulse width), total events were gated so that only events with similar pulse width:forward scatter ratios were included in analyses. Prochlorococcus, Synechococcus, and PPE were distinguished based on forward scatter (FSC), orange fluorescence (580/30 nm), and red fluorescence (>650 nm) as described in Bock et al. (2018) and shown in Supplementary Materials Figure S1. Briefly, particles with low forward scatter, low red fluorescence, and low orange fluorescence were identified as Prochlorococcus cells. Particles with intermediate forward scatter, intermediate red fluorescence, and high orange fluorescence were identified as Synechococcus cells. Particles with high forward scatter, high red fluorescence, and low orange fluorescence were identified as PPE cells. The BD Influx cytometer is equipped with a special forward scatter detector that increases the sensitivity of forward scatter photomultiplier tubes to small particles (i.e., up to 200 nm in diameter), making forward scatter a better discriminant for small cells like Prochlorococcus than side scatter on this instrument. However, side scatter might be a more appropriate proxy for cell size on other instruments.
For each field sample, cells from each phytoplankton group were sorted to achieve a range of cell concentrations across three filters. Tests using culture samples determined that > 3.0 x 10⁵ cells per filter were sufficient to exceed fluorometer quantitation limits (determined as described in Supplementary Materials SM2) for cyanobacteria and that > 1.5 x 10⁴ cells were sufficient to exceed fluorometer quantitation limits for PPE. Accordingly, cyanobacterial filters were prepared, at minimum, with 3 x 10⁵, 5 x10⁵, and 7 x 10⁵ Prochlorococcus or Synechococcus cells per filter. PPE filters were prepared, at minimum, with 1.5 x 10⁴, 2 x 10⁴, and 2.5 x 10⁴ cells per filter. Immediately after sorting and filtration, each filter was placed in a 2-ml screw-cap o-ring microcentrifuge tube (Fisher Scientific catalog #21-403-200) and stored at -80°C for at least one hour prior to Chl a extraction.
Chl a extractions were performed using 100% methanol following established methods (Strickland and Parsons, 1972; Arar and Collins, 1997). 100% methanol was chosen as an extraction solvent based on its reported superior extraction efficiency compared to other solvents (Holm-hansen and Riemann, 1978; Wright et al., 1997). Fluorescence of Chl a in extracts was quantified using a Turner Trilogy fluorometer (Turner Designs, San Jose, CA, USA). To maximize the final Chl a concentration, the extraction volume was only 1.5 ml of 100% methanol. This volume was sufficient to both completely immerse the 13-mm diameter filters and to cover the measurement window of the Turner Trilogy fluorometer when using 12-mm (OD) borosilicate glass tubes (Fisher Scientific catalog # 14-961-26). Following the methanol addition, sample tubes were capped and vortexed in the dark for 15 seconds each, then extracted for 20 to 24 hours in the dark at -20°C. After the extraction period, samples were brought to room temperature in the dark and vortexed for 15 seconds each to ensure homogenization. Finally, disposable transfer pipettes were used to transfer extracts to glass tubes for fluorescence quantification.
Raw fluorescence output values (relative fluorescence units; hereafter RFU) measured on the Trilogy Fluorometer were converted to mg Chl a m-3 using a calibration curve prepared with the same standard used for tests of instrument quantitation limits. To estimate per-cell Chl a, regressions were performed comparing the filter Chl a content with the corresponding number of cells sorted onto the filter (Figure 2). Average RFU values for triplicate measurements of methanol blanks were represented in regressions as filters containing zero cells. Regression slopes were interpreted as per-cell Chl a (fg Chl a cell-1).
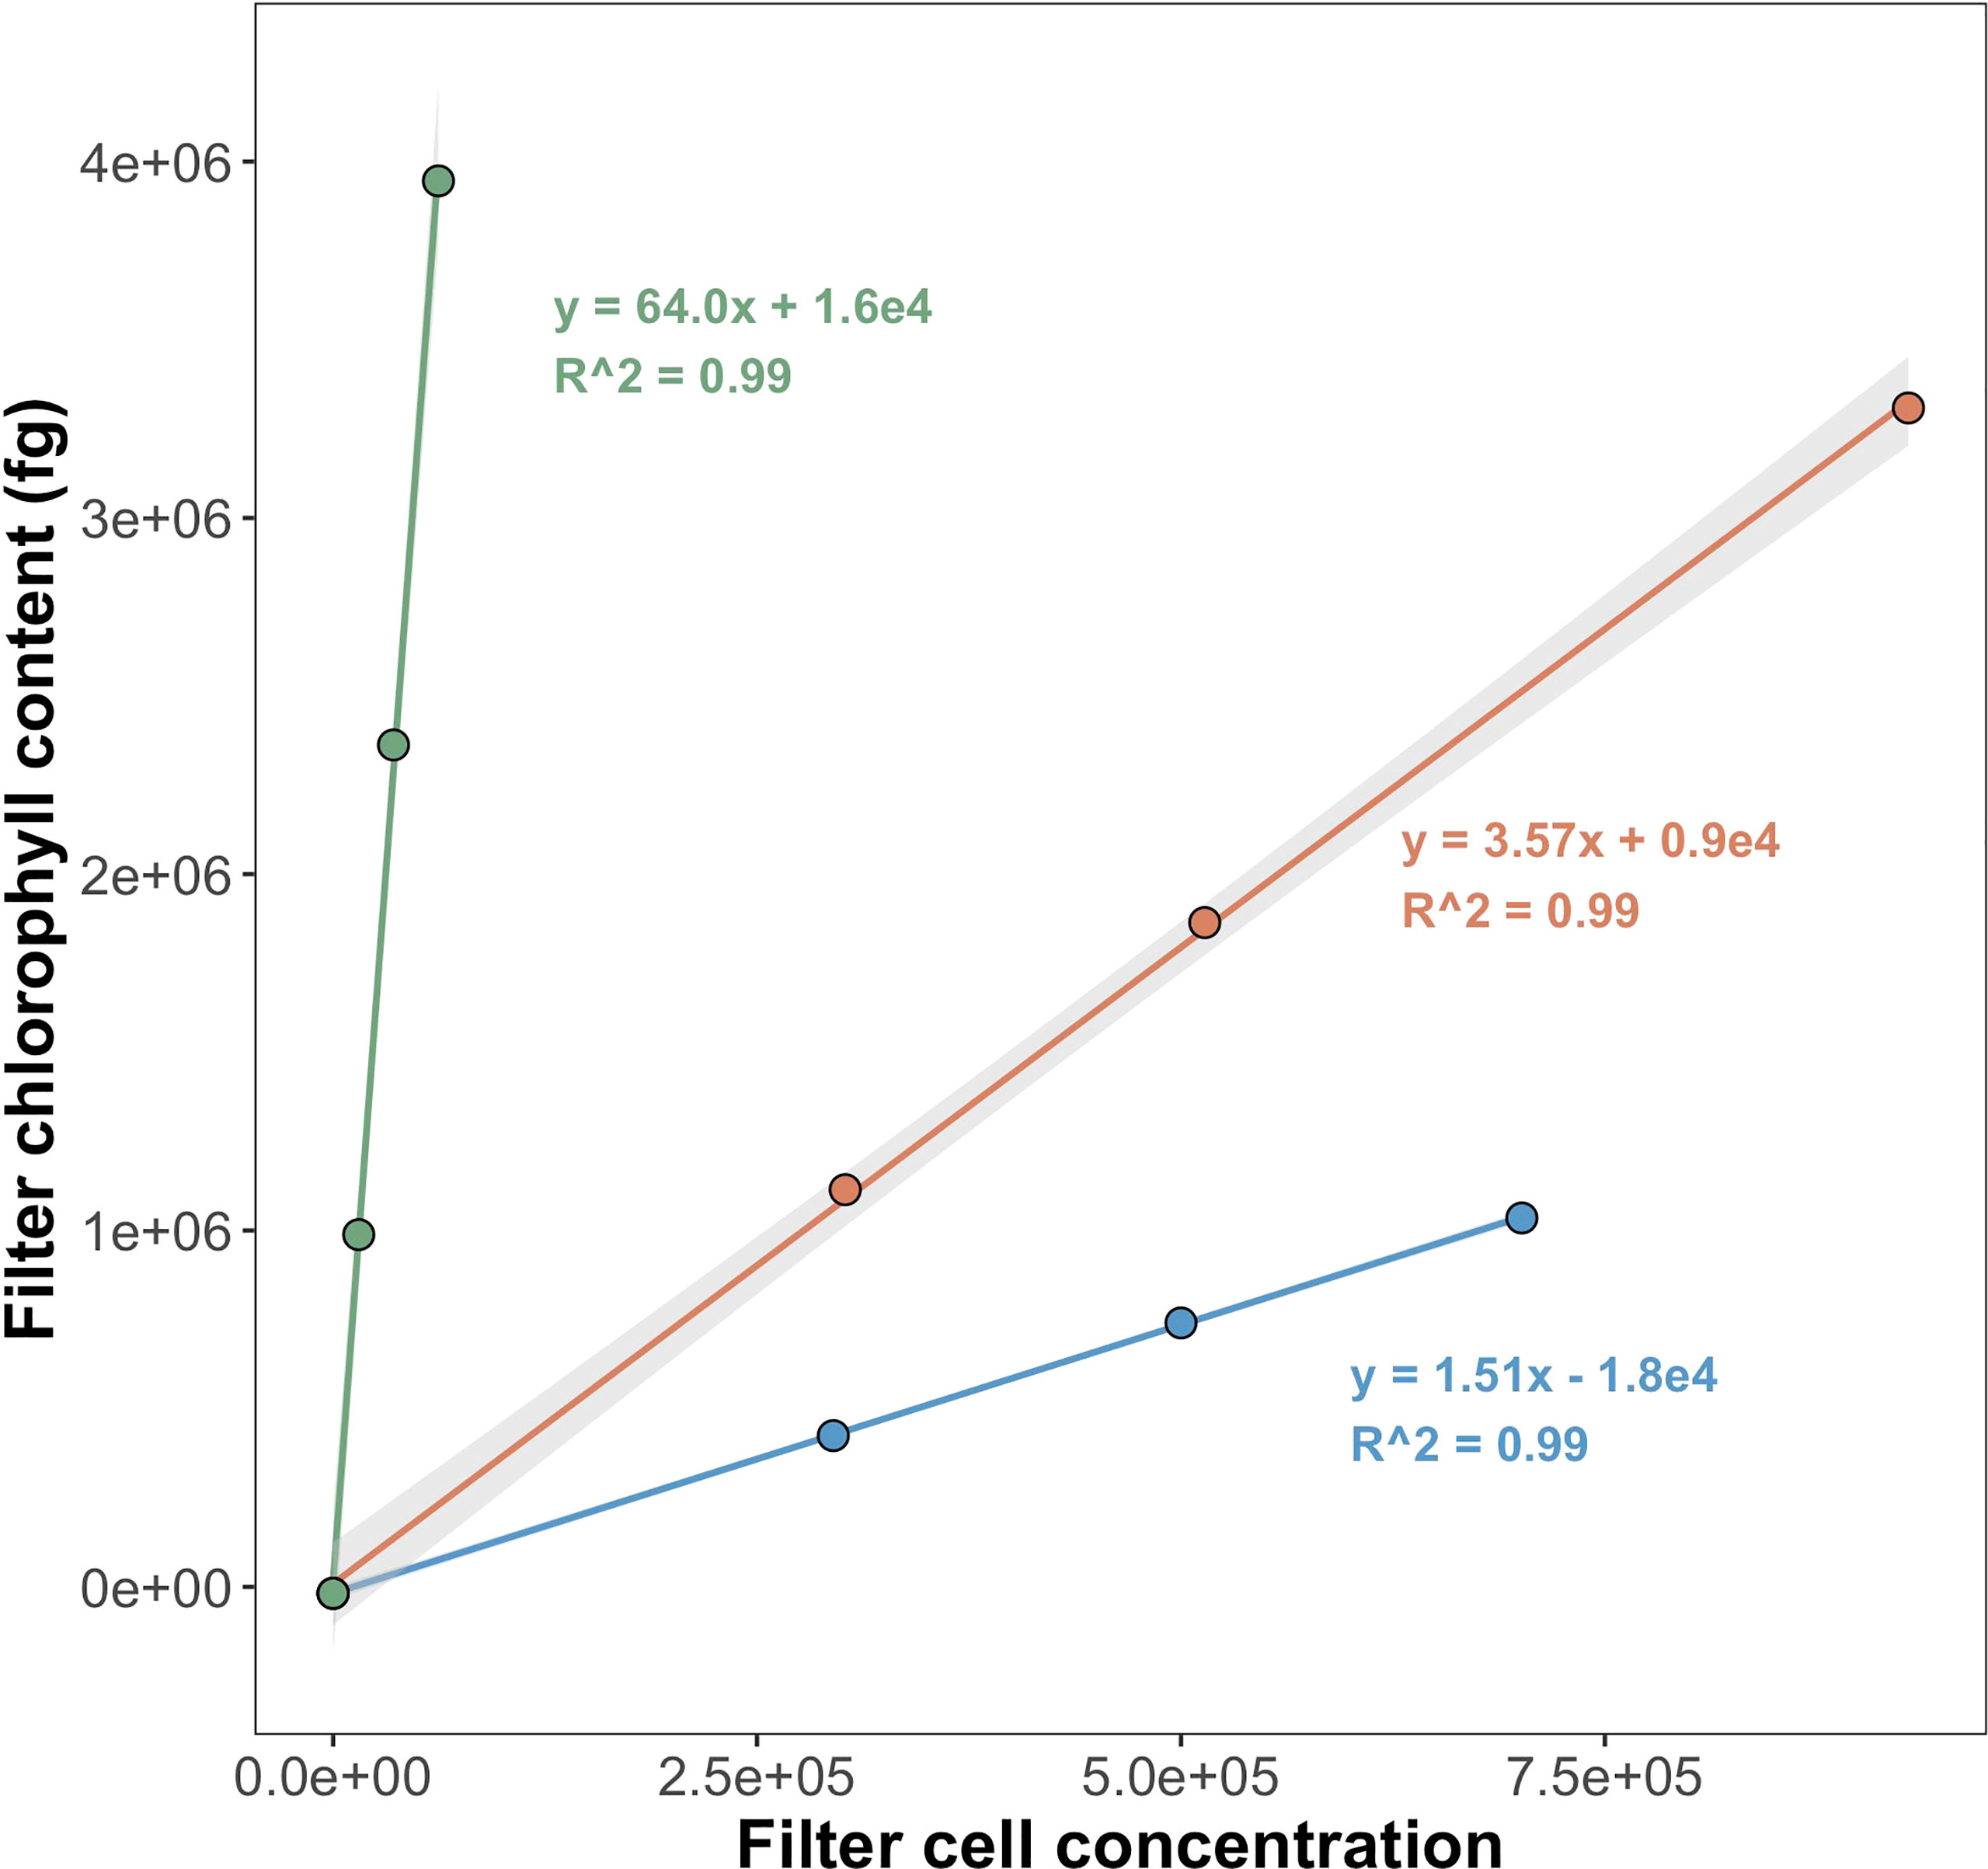
Figure 2 Regressions to calculate per-cell Chl a for Prochlorococcus (PRO), Synechococcus (SYN), and picophytoeukaryotes (PPE). Samples collected from surface at EN642 station 14. Grey shading shows ± 1 standard error of regression coefficients (standard error values for Prochlorococcus and picophytoeukaryotes are too small to be seen). Regression slopes correspond to fg Chl a cell-1.
To estimate group-specific Chl a concentration for Prochlorococcus, Synechococcus, and PPE, per-cell Chl a measurements for each sample were multiplied by the cell abundance of the corresponding phytoplankton group. Group-specific Chl a fractions were calculated as the ratio between group-specific Chl a and total Chl a (monovinyl Chl a + divinyl Chl a; from the HPLC measurements) of each sample multiplied by 100 (to express as a percentage). For each field sample, total picophytoplankton Chl a was calculated as the sum of Prochlorococcus, Synechococcus, and PPE Chl a fractions. Prokaryote Chl a was calculated as the sum of measured Prochlorococcus and Synechococcus Chl a fractions. Nanophytoplankton + microphytoplankton Chl a was calculated as the difference between total Chl a and picophytoplankton Chl a. To compare field measurements of group-specific Chl a fractions to those estimated by DPA methods, diagnostic pigments quantified for each sample using HPLC were used to estimate group-specific Chl a fractions following the approaches described in Vidussi et al. (2001); Uitz et al. (2006) and Hirata et al. (2011). Details on the implementation of the different DPA methods are provided in Supplementary Materials Table S1.
Cytometer red fluorescence is widely used as a proxy for intracellular Chl a and total phytoplankton Chl a for field samples (Veldhuis et al., 1997; Calvo-Díaz et al., 2008; Graff et al., 2016; Brewin et al., 2019). To assess whether the red fluorescence versus per-cell Chl a relationship was consistent across the three picophytoplankton groups studied in our samples, we compared mean per-cell Chl a with mean group-specific red fluorescence for picophytoplankton populations in cell abundance samples. To account for any adjustments to the sensitivity of red fluorescence detectors between samples, average group-specific red fluorescence was normalized to the red fluorescence of fluorescent reference beads (1-µm yellow-green microspheres). Red fluorescence values were log-transformed for all groups to linearize relationships with per-cell Chl a.
Cytograms were analyzed using FCS Express 6 Flow Cytometry Software (De Novo Software). All subsequent data analyses were performed in R 4.0.2 using RStudio 1.3.107 (R Core Team, 2016). All averaged values are reported ± the standard error of the mean. Analyses were performed on samples corresponding to individual depth horizons (surface, halocline, or DCM) and on pooled data combining samples from each horizon. Bivariate comparisons between estimated and measured group-specific Chl a and HPLC pigment concentrations were performed using Pearson’s correlation. ANOVA was used to identify significant differences between measured and estimated group-specific Chl a fractions. Tukey’s honest significance difference posthoc test was used to compare pairs of group means when ANOVA indicated significant between-group differences. Model I linear regressions were used for comparisons involving a single independent variable: to determine fluorometer calibration curves and to estimate per-cell Chl a as described above. Model II linear regressions were used for comparisons involving two independent variables: to evaluate relationships between 1) log-transformed per-cell Chl a and log transformed cytometer red fluorescence and 2) relationships between per-cell Chl a and % I0. All regression analyses were performed using original least squares. Statistical tests of regressions were based on F-tests evaluating the overall fit of the regression model. F-scores and degrees of freedom are provided for all ANOVA tests. A significance threshold of 0.05 was used for all statistical tests.
Samples were collected from stratified waters across a salinity gradient ranging from 25.9 to 36.2 ppt, and with surface temperatures ranging from 23.8 to 29.6°C. Total Chl a concentrations across all sampling depths ranged from 0.12 to 3.22 mg m-3. Regressions used to calculate per-cell Chl a were statistically significant for all phytoplankton groups across all sampling sites (R2 > 0.97, p < 0.05 for all comparisons). Regression fits were not affected by the duration of cell sorts (data not shown). Experimental tests of steps within the method using cultured Prochlorococcus (CCMP 2777), Synechococcus (WH 8102), and the pico-sized chlorophyte Mantoniella squamata (NIES 1407) showed that per-cell Chl a measurements were not significantly affected by cell sorting (Supplementary Materials SM3), duration of methanol extraction (Supplementary Materials SM4), or sample storage duration up to 8 months (Supplementary Materials SM5). Across all field samples, the relative error of per-cell Chl a measurements (Esort) was 2.87%, 2.76%, and 4.19% for Prochlorococcus, Synechococcus, and PPE, respectively (Supplementary Materials Table S2).
Mean estimates of per cell Chl a for Prochlorococcus, Synechococcus, and PPE for different depth horizons are shown in Table 1. Prochlorococcus and Synechococcus per-cell Chl a tripled between the surface and the DCM, while PPE per-cell Chl a doubled between the surface and the DCM. Differences in per-cell Chl a between depth horizons were statistically significant for Prochlorococcus (ANOVA, F2,13 = 19.2; p = 0.0001) and Synechococcus (ANOVA, F2,14 = 15.09; p = 0.0003), and PPE (ANOVA, F2,13 = 4.93; p = 0.03). Regressions comparing per-cell Chl a to log10 transformed % I0 were statistically significant for all phytoplankton groups (Table 2; Figure 3). Based on regression R2 values, changes in % I0 accounted for 62%, 34%, and 53% of the variability in per-cell Chl a for Prochlorococcus, Synechococcus, and PPE, respectively. Because % I0 depths were log10 transformed, regression slopes can be interpreted as the change in per-cell Chl a for an order of magnitude change in % I0. Therefore, regressions of per-cell Chl a to log-transformed % I0 showed per-cell Chl a to increase by 0.26 fg, 0.40 fg, and 18.65 fg for Prochlorococcus, Synechococcus, and PPE, respectively, for an order of magnitude decrease in % I0. Regressions between log-transformed per-cell Chl a and log-transformed cytometer red fluorescence were statistically significant for all phytoplankton groups (Figure 4; ANOVA, p < 0.05 for all comparisons).
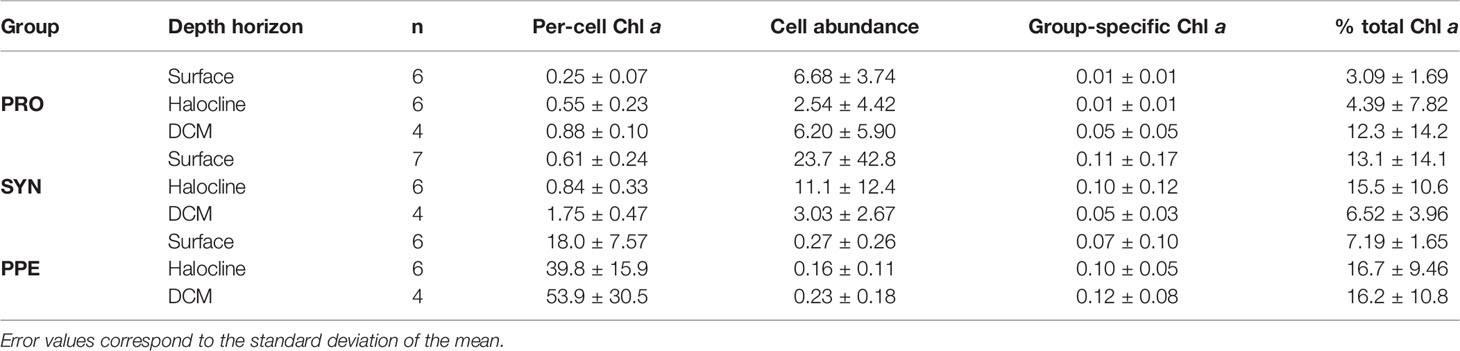
Table 1 Summary of values for per-cell Chl a (fg Chl a cell-1), cell abundance (1 x 10¹⁰ cells m-3), group-specific Chl a (mg Chl a m-3), and group-specific Chl a fractions (% total Chl a) for Prochlorococcus (PRO), Synechococcus (SYN), and picophytoeukaryotes (PPE) in field samples grouped by depth horizon.
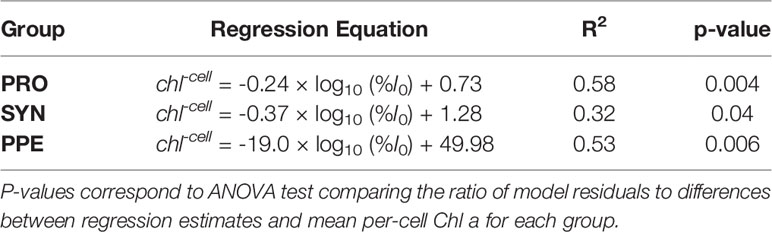
Table 2 Model II regression equations for comparisons of log10-transformed % I0 and group-specific per-cell Chl a (chl-cell) for Prochlorococcus (PRO), Synechococcus (SYN), and picophytoeukaryotes (PPE).
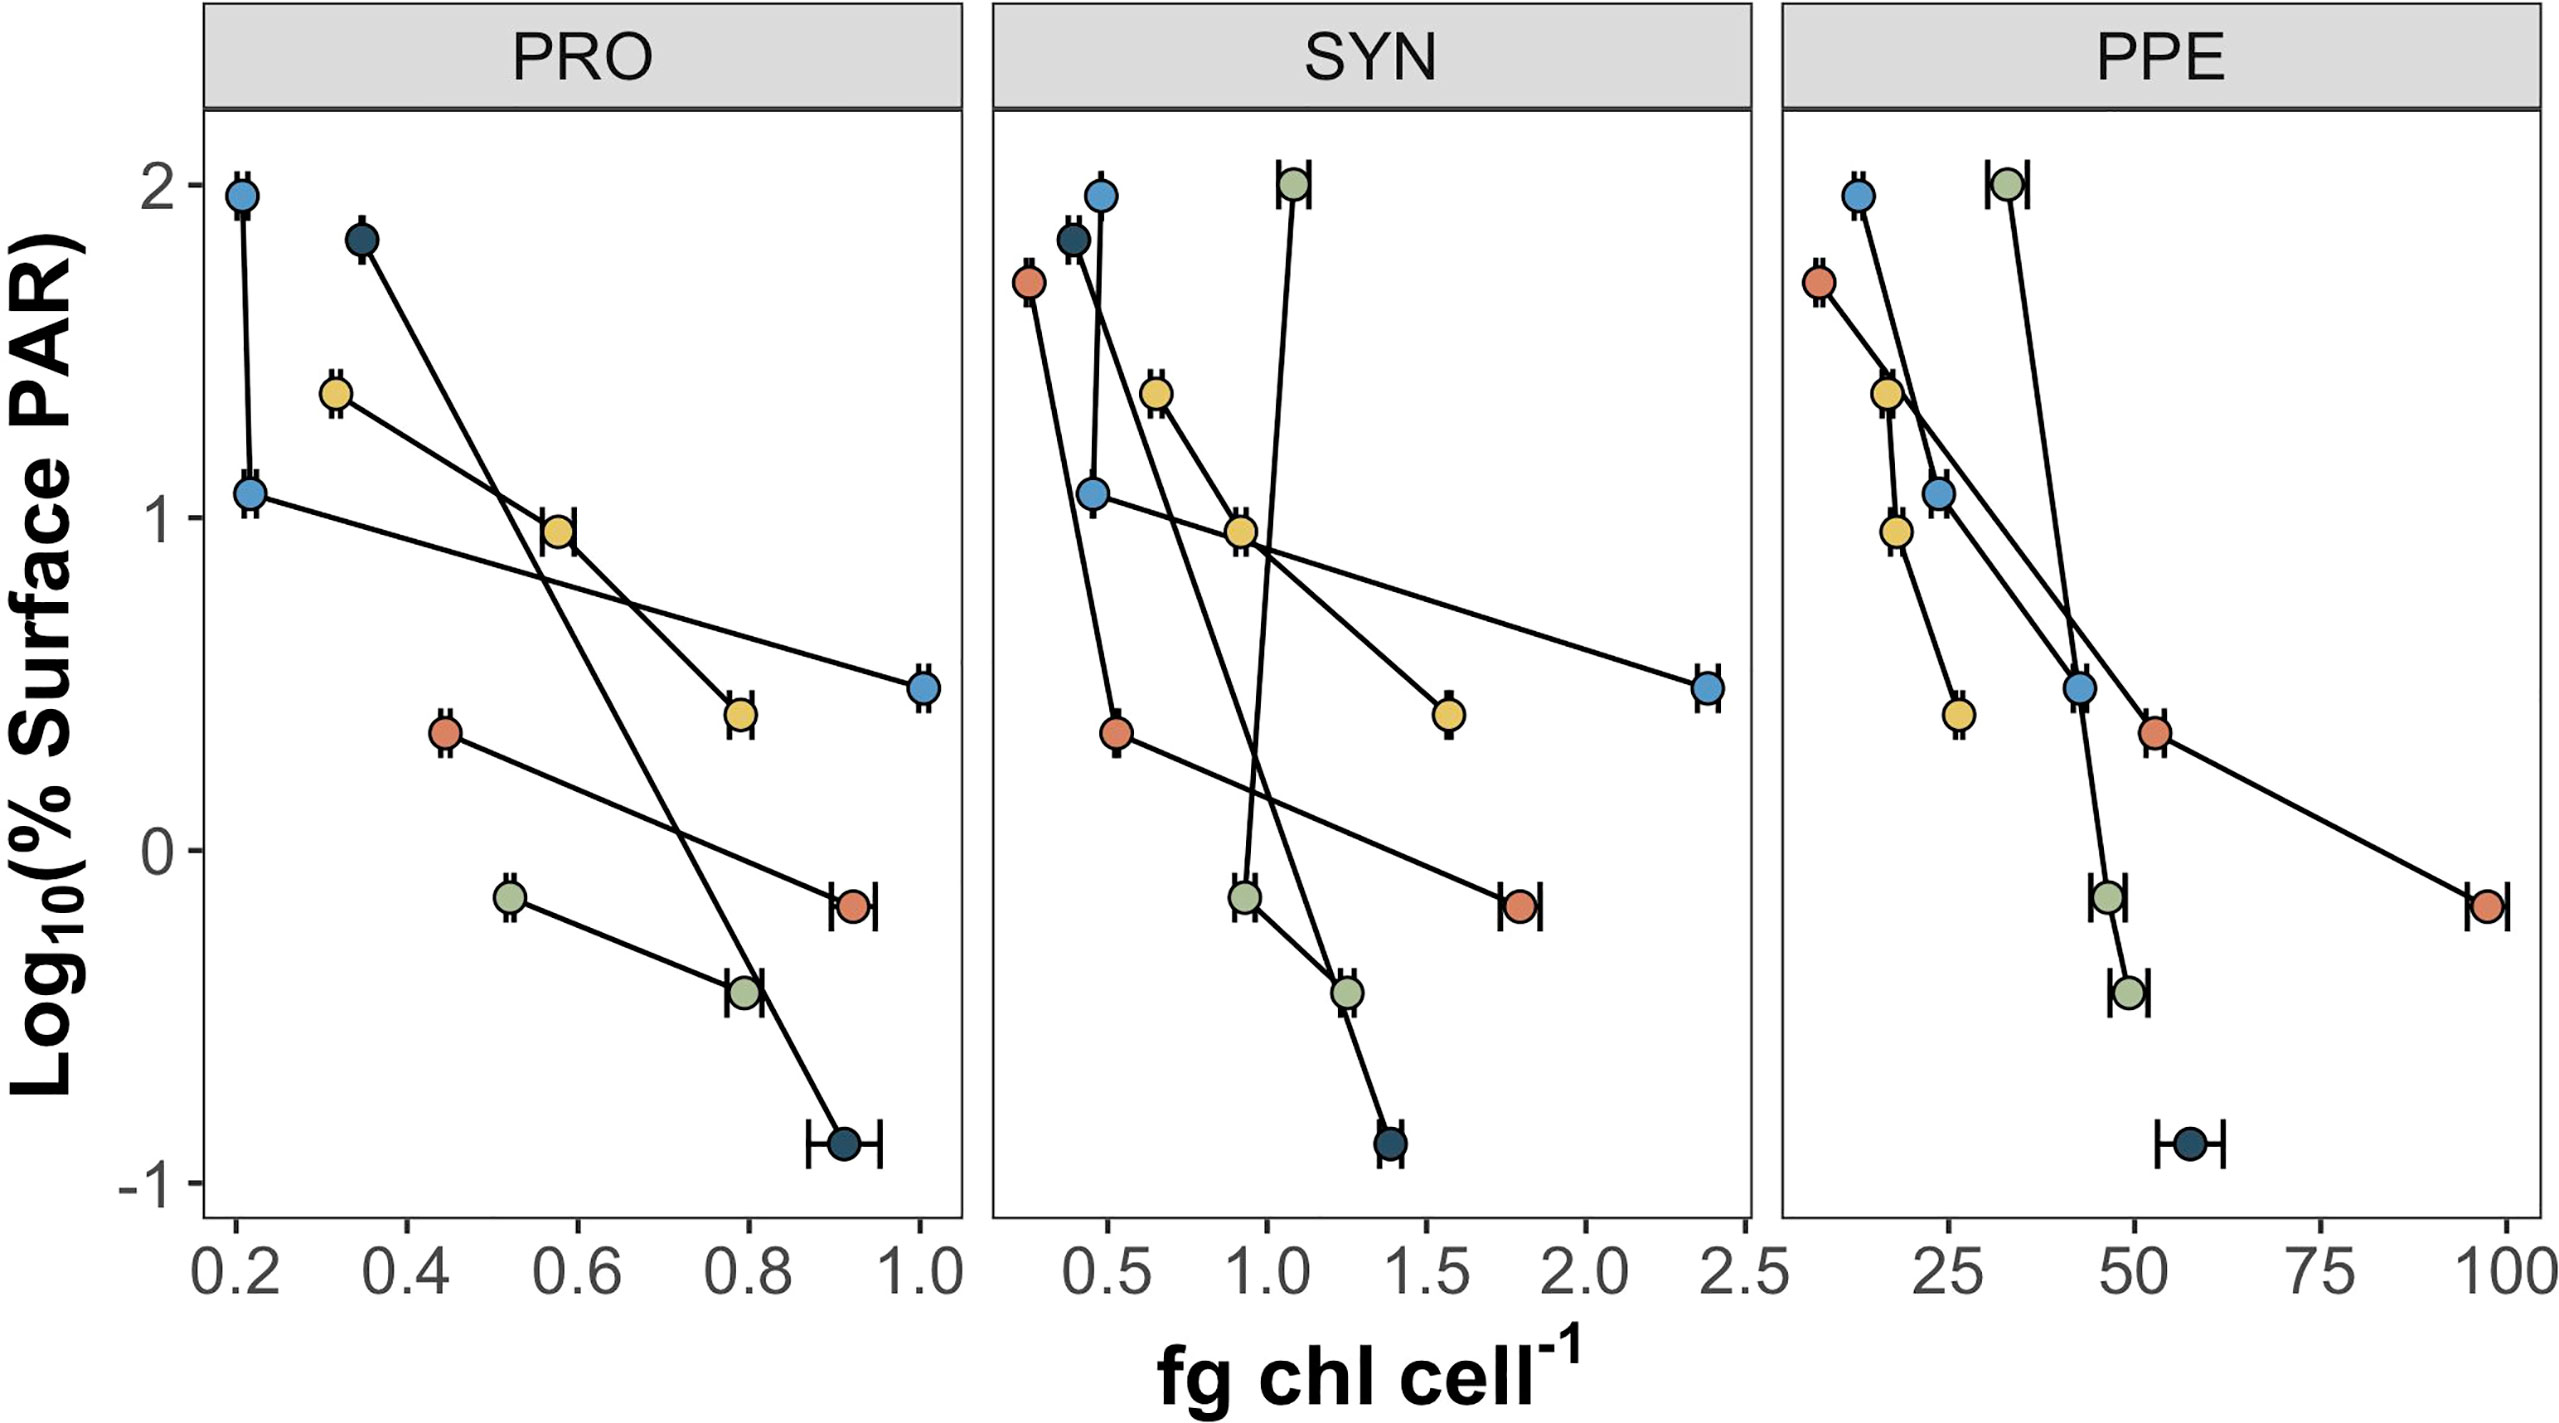
Figure 3 Per-cell Chl a (fg Chl a cell-1) for Prochlorococcus (PRO), Synechococcus (SYN), and picophytoeukaryotes (PPE) plotted against log10 transformed % I0. Color markers correspond to different sampling sites. Error bars represent standard error of regression slopes between filter Chl a content and the number of cells sorted.
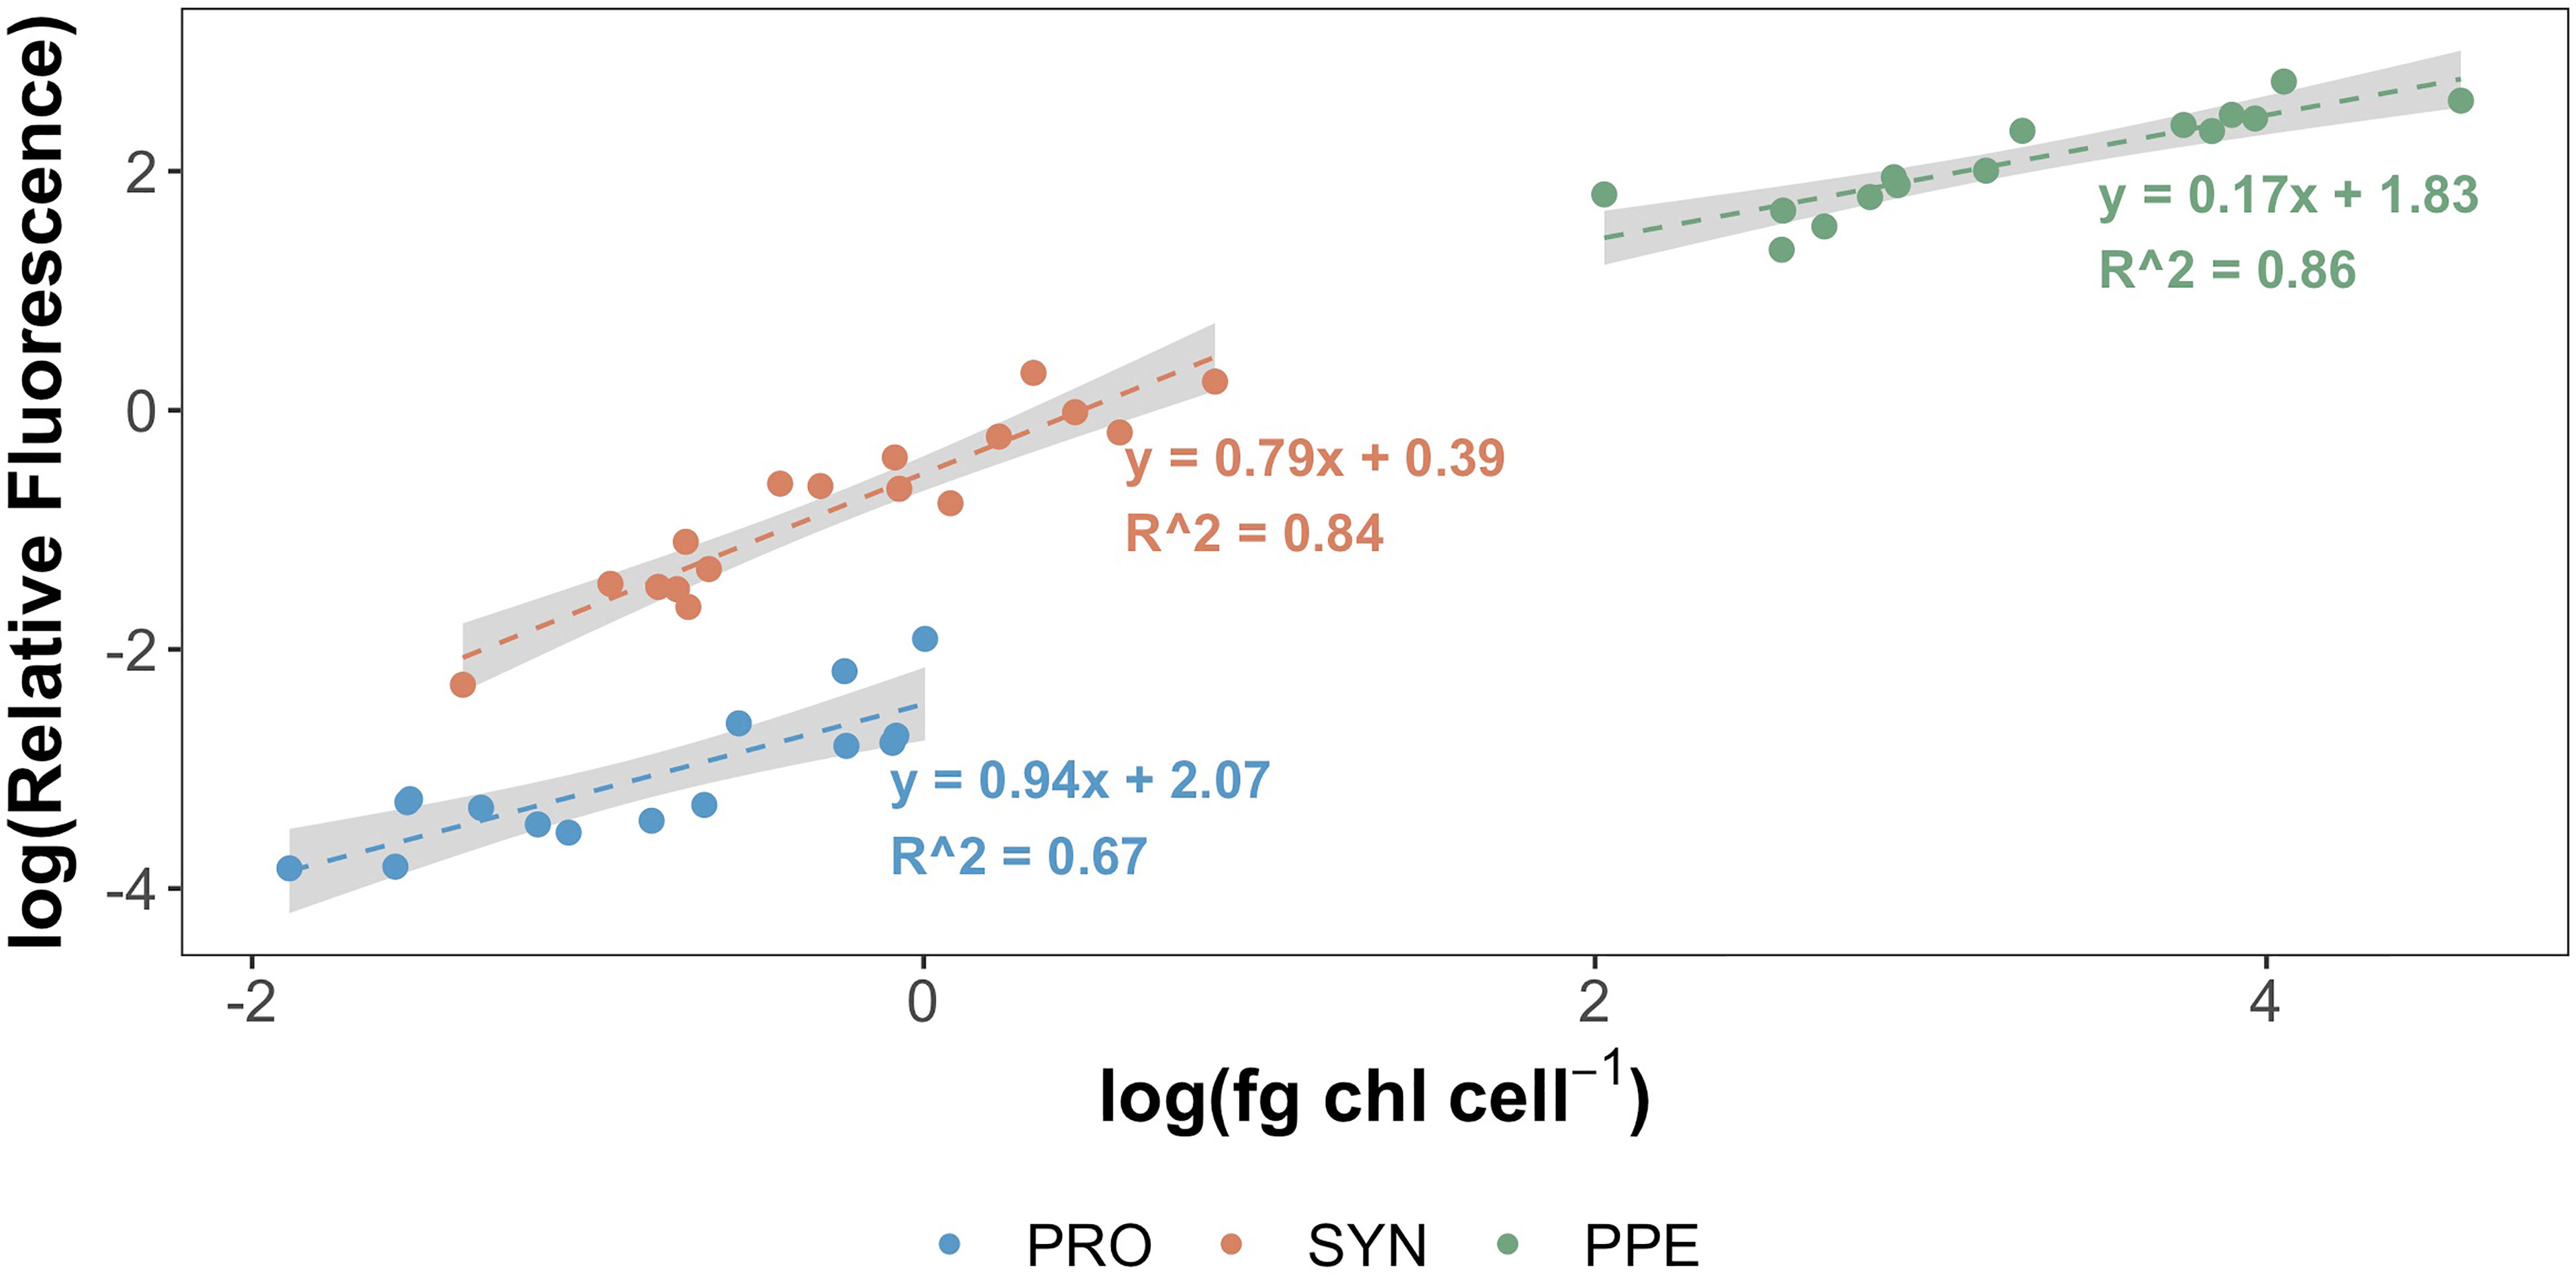
Figure 4 Log-transformed per-cell Chl a (fg Chl a cell-1) for Prochlorococcus (blue), Synechococcus (orange), and picophytoeukaryotes (green) plotted against log-transformed relative red fluorescence measured by BD Influx cytometer. Grey shading corresponds to ± 1 standard error of regression coefficients. All samples processed 2 – 8 months following sample collection.
Group-specific Chl a fractions measured using the FACS method generally overlapped with group-specific Chl a fractions estimated using three different HPLC pigment algorithms. Prochlorococcus Chl a fractions measured with the FACS method were significantly correlated with estimates derived using the Hirata et al. (2011) algorithm when comparing individual samples (Pearson’s r = 0.96; p = 1 x 10⁻⁶). None of the DPA algorithms used provided estimates of Synechococcus or PPE Chl a fractions, precluding similar comparisons for those groups. When averaging across all sampling sites, there were no significant differences between measured and estimated Chl a fractions for picophytoplankton and nano+micro groups (Table 3; ANOVA; p > 0.05 for all comparisons). However, correlations comparing measured and estimated fractions for individual samples were not statistically significant. Mean values of picophytoplankton and nano+microphytoplankton Chl a fractions across all sampling sites did not differ significantly between the FACS and 3 DPA methods (Table 3; ANOVA; p > 0.05 for all comparisons). However, correlations comparing these fractions as measured by the FACS and DPA methods in individual samples were not statistically significant.
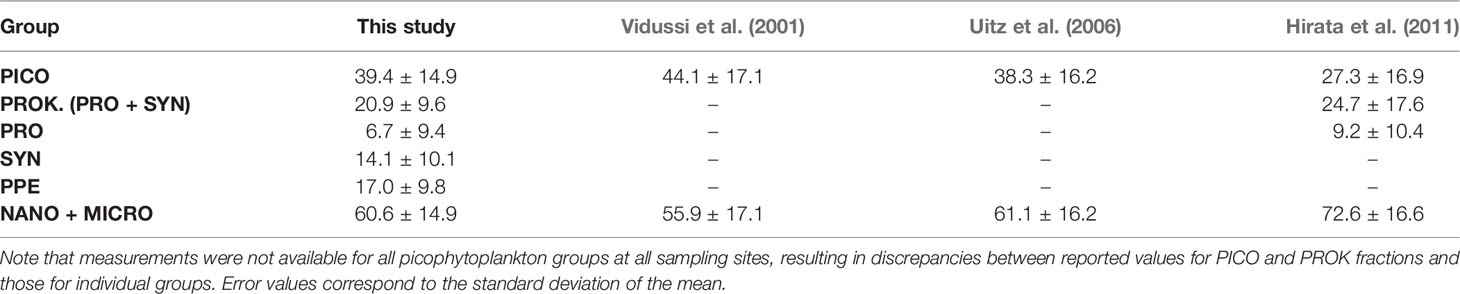
Table 3 Comparison between group-specific Chl a fractions (% total Chl a) based on measured per-cell Chl a (this study) versus estimates derived from HPLC concentrations using the algorithms of Vidussi et al. (2001), Uitz et al. (2006), and Hirata et al. (2011).
Group-specific Chl a concentrations were generally significantly correlated with measurements of HPLC pigment concentrations (Table 4). However, group-specific Chl a fractions (that is, group-specific Chl a concentrations normalized to total Chl a) were not correlated with HPLC pigment concentrations, with the exception of Prochlorococcus Chl a fractions, which were significantly correlated with concentrations of divinyl Chl a (Pearson’s r = 0.78; p = 0.004).
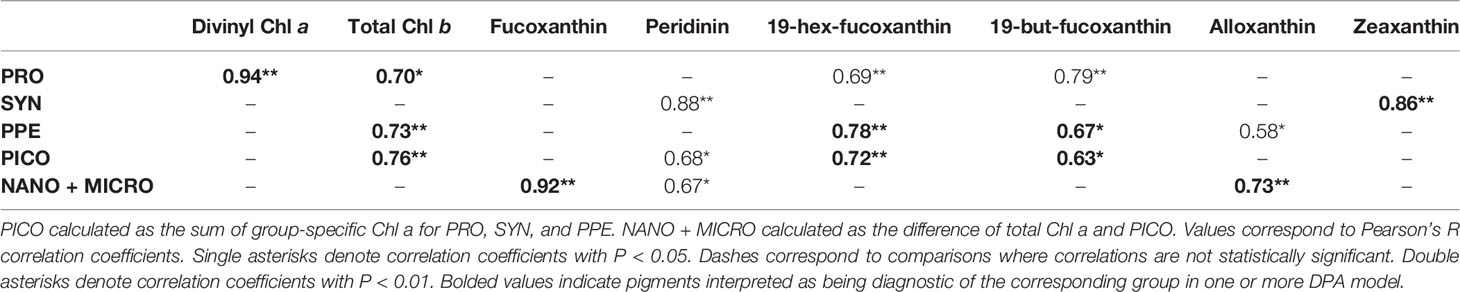
Table 4 Correlation matrix for comparisons of measured group-specific Chl a for Prochlorococcus (PRO), Synechococcus (SYN), picophytoeukaryotes (PPE) and HPLC pigments.
Our results demonstrate that FACS followed by Chl a extraction and quantification can be used to measure picophytoplankton per-cell Chl a in field samples, yielding results that are similar to previously reported values from field and culture studies (Table 5) and providing critical insight into group-specific Chl a distributions not available using existing methods. In combination with independently measured picophytoplankton cell counts and total Chl a concentration, the FACS method uniquely provides estimates of Chl a fractions for Synechococcus and PPE, picophytoplankton groups not individually represented in DPA methods. At the same time, the FACS method provides estimates of Prochlorococcus Chl a and total picophytoplankton Chl a that overlap with those provided by DPA methods (Table 3). Finally, the results from this approach also provide the first-ever direct measurements of group-specific Chl a fractions, providing a novel basis for evaluating estimates from existing methodologies.
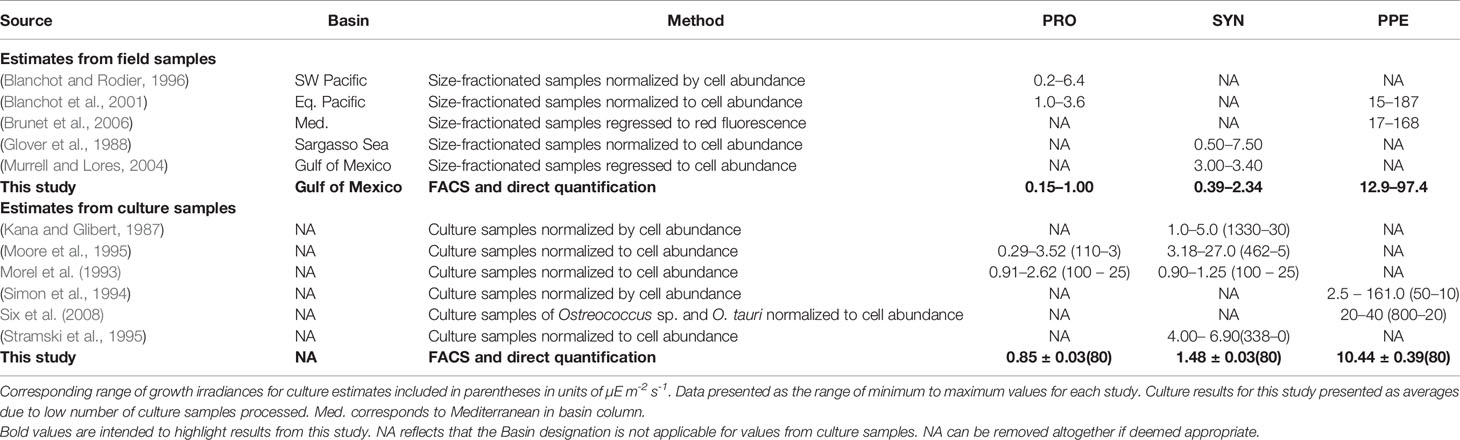
Table 5 Reported estimates of per-cell Chl a (fg cell-1) for Prochlorococcus (PRO), Synechococcus (SYN), and picophytoeukaryotes (PPE).
The observed increases in per-cell Chl a in response to reductions in %I0 (Table 2; Figure 3) are similar to those previously reported in culture experiments investigating change in per-cell Chl a with irradiance for both cyanobacterial groups (Moore et al., 1995) and small eukaryotes (Sosik et al., 1989). The stronger relationships between Prochlorococcus per-cell Chl a and % I0 compared to other picophytoplankton groups is also consistent with previous studies demonstrating Prochlorococcus to adjust cellular chlorophyll concentrations over a wide range of irradiances, especially relative to Synechococcus (Moore et al., 1995; Marie et al., 1999). That % I0 accounts for at most 62% total variance in per-cell Chl a (depending on the group) indicates per-cell Chl a in picophytoplankton to be strongly influenced by other in situ variables, likely including growth rates (Blanchot et al., 1997; Neveux et al., 2003), cell size (Calvo-Díaz et al., 2008; Álvarez et al., 2017), and taxonomic composition (Veldhuis and Kraay, 1993; Blanchot et al., 2001).
The similarity of measured and estimated Prochlorococcus Chl a fractions (Table 3) is attributable to the strong correlations between measured Prochlorococcus Chl a and divinyl Chl a (Table 4), which is unique to prochlorophytes and the only diagnostic pigment used for Prochlorococcus in the Hirata et al. (2011) algorithm. Weak correlations between estimated and measured group-specific Chl a fractions is likely the result of HPLC pigments in our data set better predicting group-specific Chl a concentrations (mg Chl a m-3) than group-specific Chl a fractions (% total Chl a). Especially given that the DPA methods used in our intercomparison assume ratios of HPLC pigments to Chl a to be constant, disagreement between estimated and measured Chl a fractions may reflect changes in pigment ratios in response to differences in light or nutrient conditions across different sampling sites (Goericke and Montoya, 1998; Henriksen et al., 2002; Llewellyn et al., 2005). Disagreement between estimated and measured Chl a fractions could also result from overlap in diagnostic pigments between different groups (Wright et al., 1997). In this case, an increase in a given diagnostic pigment would be expected to correlate with multiple groups, but not necessarily with the fraction of Chl a associated with any individual group.
It also may be the case that the combination of pigments used in the different DPA methods are not applicable to the region sampled. For example, we found total Chl b, 19’-hex fucoxanthin, and 19’-but fucoxanthin to be the best predictors of measured picophytoplankton Chl a in our data, as opposed to zeaxanthin and total Chl b, as are used in the Vidussi et al. (2001) and Uitz et al. (2006) approaches. This is consistent with previous studies demonstrating the widespread distribution of pico-sized haptophytes, which uniquely contain 19’-hex fucoxanthin (19’-hex) as an accessory pigment (Liu et al., 2009). While the Hirata (Hirata et al., 2011) approach incorporates 19’-hex as a picophytoplankton diagnostic pigment for samples where Chl a concentrations are below 0.04 mg m-3, this threshold was below the minimum Chl a concentration encountered in our field samples. The difficulty in accurately assigning 19’-hex to a specific phytoplankton size class illustrates the issues raised in the introduction and further demonstrates the usefulness of the FACS-based approach.
The high R2 values obtained for group-specific regressions between cytometer red fluorescence and measurements of per-cell Chl a support the use of cytometer red fluorescence as a proxy for per-cell Chl a for individual phytoplankton groups. The results obtained using this method could be used to determine instrument or region-specific “calibration coefficients” relating group-specific per-cell Chl a to cytometer red fluorescence. That is, this method could be used to measure group-specific per-cell Chl a for a subset of samples, with the corresponding red fluorescence measurements then being used to derive group-specific calibration coefficients to estimate per-cell Chl a for samples where cytometry cell counts are available alone. By providing relatively high-throughput estimates of overall phytoplankton community structure with associated uncertainties, results obtained using this method would be relevant to the study of any process where phytoplankton community structure might be expected to play a role. Such measurements would make it possible to develop regional models for estimating phytoplankton community composition based on measurements of bio-optical proxies from satellites, gliders, or autonomous profilers, or to perform regional validations of existing DPA algorithms. Finally, if paired with estimates of per-cell carbon as described in the introduction, this method could also be used to study drivers of variability in Chl:C ratios, both for individual phytoplankton groups as well as for the entire phytoplankton community.
Our results also demonstrate the potential for differing relationships between cytometer red fluorescence and per-cell Chl a for individual phytoplankton groups (Figure 4). This underlines the importance of accounting for such group-specific differences when using cytometer red fluorescence as a proxy for per-cell Chl a. Similar group-specific differences in fluorescence properties have been reported previously in culture studies and have been ascribed in part to differences in pigment composition among taxa (Sosik et al., 1989; Morel et al., 1993). Relationships between red fluorescence and per-cell Chl a may also be affected by cell size, as reflected in equations derived from regressions comparing red fluorescence to per-cell Chl a. Assuming Prochlorococcus to have the smallest cell diameter of the groups studied and PPE to be the largest, and taking any transformations into account, regression coefficients reflect a decrease in the sensitivity of red fluorescence to changes in per-cell Chl a from smaller to larger groups. Similar non-linear relationships between fluorescence and per-cell Chl a with changes in cell size have been reported in culture studies (Álvarez et al., 2017), and presumably reflect reductions in absorption efficiency with increases in cell size or pigment density (that is, the package effect; Morel and Bricaud, 1981).
Most variability encountered in estimates of per-cell Chl a was attributable to variability in fluorometry measurements (Supplementary Materials SM2; Supplementary Materials Table S2). Because the relative error of fluorometry measurements scaled inversely with Chl a concentration (e.g., relative error values for fluorometry measurements were lower at higher Chl a concentrations), variability in estimates of per-cell Chl a for all groups may be lowered by sorting a larger number of cells per filter, if possible. The relatively elevated error values encountered for PPE (Supplementary Materials Table S2) are presumably due to the lower number of cells typically sorted for PPE filters compared to Prochlorococcus and Synechococcus filters. While sorting larger numbers of PPE cells is not likely practical in most cases, variability in estimates of per-cell Chl a for PPE may be lowered by preparing triplicate samples of cells sorted to provide an intermediate number of cells per filter and normalizing by cell abundance rather than by performing regressions.
We found that sample storage and extraction times did not significantly contribute to variability in measurements of per-cell Chl a within the time frames tested (see Supplementary Materials SM4 and SM5). However, the decrease in the number of intact picophytoplankton cells over 8 months of storage (Supplementary Materials Figure S3) demonstrates the importance of processing samples as soon after collection as possible for efficient sorting. Although previous studies have shown that biological fixatives decrease cell loss during storage of picophytoplankton samples (Vaulot et al., 1989; Sato et al., 2006), fixation has been demonstrated to result in considerable decreases in fluorescence yields even after short (e.g. < 1 day) storage times, with these decreases being variable across different phytoplankton groups (Navaluna et al., 1989). As such, fixing samples prior to sorting could dramatically increase uncertainties in per-cell Chl a for individual phytoplankton groups. Regardless, given that strong relationships were identified between measured per-cell Chl a, HPLC pigment concentrations, and cytometry relative fluorescence across independent samples, despite processing per-cell Chl a measurements over an 8 month period following sample collection, our method appears quite robust with regard to post-collection storage.
The method as described is optimized for sorting pico-sized cells. However, it could be adapted to measure per-cell Chl a for larger size classes as well, albeit with adjustments to sorting configurations. Tests of this method using laboratory cultures of the nano-sized chlorophyte Pyramimonas parkeae indicated that as few as 200 cells per filter were sufficient to exceed fluorometer quantitation limits, suggesting that sorting sufficient numbers of these cells from natural samples may be realistic, even in areas with low total Chl a concentration. However, the sources of variability encountered in estimates of per-cell Chl a for PPE may be compounded in larger size classes, owing to the lower number of cells from these groups that can be sorted when processing samples.
Finally, in samples where the phytoplankton groups of interest are in low abundance (as was occasionally the case in this study for Prochlorococcus in coastal samples or for Synechococcus in deep samples), the amount of time required to sort the minimum number of cells necessary to exceed fluorometer quantitation limits may become impractical. While it was generally feasible to completely process surface samples within 30 minutes each, this increased to as long as two hours for samples from the bottom of the euphotic zone. However, the number of cells required could potentially be reduced by 1) further decreasing the volume of solvent used during methanol extractions, 2) using a more sensitive fluorometer than the Turner Trilogy, or 3) using cuvettes that allow for a longer path-length than the 12 mm tubes used here.
FACS combined with Chl a extraction can be used to quantify picophytoplankton per-cell Chl a with enough precision to support research applications in the field. Combined with picophytoplankton cell counts, this method provides a novel and practical approach for estimating fractions of total Chl a attributable to different picophytoplankton groups and for evaluating group-specific variability in per-cell Chl a in response to environmental conditions. This new approach performs similarly to existing DPA methods for quantifying Chl a attributable to Prochlorococcus in field samples and is currently the only method that provides a direct assessment of Synechococcus and PPE biomass in field samples. Our field results also validate the use of cytometer red fluorescence as a proxy for per-cell Chl a.
pt?>Given the widespread importance of picophytoplankton and the fundamental nature of per-cell Chl a to many oceanographic measurements, this method will be useful in a broad range of biological and biogeochemical studies. Direct quantification of picophytoplankton contributions to total Chl a in field samples using this method will improve quantification of phytoplankton community structure, especially in regions where picophytoplankton make a large contribution to total chlorophyll. The method can also be used to validate DPA-based approaches to estimating picophytoplankton contributions to phytoplankton communities. In addition, in combination with measurements of per-cell primary production (Jardillier et al., 2010; Rii et al., 2016a; Rii et al., 2016b; Duhamel et al., 2019) or per-cell carbon content (Graff et al., 2012), this method could be used to derive group-specific photosynthetic parameters, or group-specific chlorophyll:carbon ratios.
Raw data supporting the conclusions of this article are available in Supplementary Table 1. Additional data will be made available by the authors, without undue reservation.
NB developed the method, collected and processed samples, performed analyses and wrote the manuscript. SD was the direct advisor of NB and collaborated on the development of the method, provided guidance on analyses, and assisted in developing the manuscript. AJ, AS, and JM provided guidance on analyses and assisted in developing the manuscript. All authors contributed to the article and approved the submitted version.
This work was supported by National Science Foundation (NSF) OCE-1458070 award to SD, and OCE-1737240 to AJ, SD and AS.
The authors declare that the research was conducted in the absence of any commercial or financial relationships that could be construed as a potential conflict of interest.
All claims expressed in this article are solely those of the authors and do not necessarily represent those of their affiliated organizations, or those of the publisher, the editors and the reviewers. Any product that may be evaluated in this article, or claim that may be made by its manufacturer, is not guaranteed or endorsed by the publisher.
We thank the captain and crew of the R/V Endeavor for outstanding shipboard operation during EN642, and Benjamin Ramcharitar for collecting and processing samples for cell enumeration.
The Supplementary Material for this article can be found online at: https://www.frontiersin.org/articles/10.3389/fmars.2022.850646/full#supplementary-material
Álvarez E., Nogueira E., López-Urrutia Á. (2017). In Vivo Single-Cell Fluorescence and Size Scaling of Phytoplankton Chlorophyll Content. Appl. Environ. Microbiol. 83, 1–16. doi: 10.1128/AEM.03317-16
Arar E. J., Collins G. B. (1997). U.S. Environmental Protection Agency Method 445.0, In Vitro Determination of Chlorophyll a and Pheophytin a in Marine and Freshwater Algae by Fluorescence, Revision 1.2 (Cincinnati, Ohio, USA: U.S. Environmental Protection Agency).
Berthelot H., Duhamel S., L’Helguen S., Maguer J.-F., Wang S., Cetinić I., et al. (2019). NanoSIMS Single Cell Analyses Reveal the Contrasting Nitrogen Sources for Small Phytoplankton. ISME J. 13, 651–662. doi: 10.1038/s41396-018-0285-8
Blanchot J., André J. M., Navarette C., Neveux J. (1997). Picophytoplankton Dynamics in the Equatorial Pacific: Diel Cycling From Flow-Cytometer Observations. Compt. Rend. l’Acad. Des. Sci. - Ser. III. 320, 925–931. doi: 10.1016/S0764-4469(97)80878-5
Blanchot J., André J. M., Navarette C., Neveux J., Radenac M. H. (2001). Picophytoplankton in the Equatorial Pacific: Vertical Distributions in the Warm Pool and in the High Nutrient Low Chlorophyll Conditions. Deep. Res. Part I. Oceanogr. Res. Pap. 48, 297–314. doi: 10.1016/S0967-0637(00)00063-7
Blanchot J., Rodier M. (1996). Picophytoplankton Abundance and Biomass in the Western Tropical Pacific Ocean During the 1992 El Nino Year: Results From Flow Cytometry. Deep. Res. Part I. Oceanogr. Res. Pap. 43, 877–895. doi: 10.1016/0967-0637(96)00026-X
Bock N., Van Wambeke F., Dion M., Duhamel S. (2018). Microbial Community Structure in the Western Tropical South Pacific. Biogeosciences 15, 3909–3925. doi: 10.5194/bg-15-3909-2018
Brewin R. J. W., Morán X. A. G., Raitsos D. E., Gittings J. A., Calleja M. L., Viegas M., et al. (2019). Factors Regulating the Relationship Between Total and Size-Fractionated Chlorophyll-a in Coastal Waters of the Red Sea. Front. Microbiol. 10. doi: 10.3389/fmicb.2019.01964
Brewin R. J. W., Sathyendranath S., Hirata T., Lavender S. J., Barciela R. M., Hardman-Mountford N. J. (2010). A Three-Component Model of Phytoplankton Size Class for the Atlantic Ocean. Ecol. Modell. 221, 1472–1483. doi: 10.1016/j.ecolmodel.2010.02.014
Brewin R. J. W., Sathyendranath S., Lange P. K., Tilstone G. (2014). Comparison of Two Methods to Derive the Size-Structure of Natural Populations of Phytoplankton. Deep. Sea. Res. Part I. Oceanogr. Res. Pap. 85, 72–79. doi: 10.1016/j.dsr.2013.11.007
Brunet C., Casotti R., Vantrepotte V., Corato F., Conversano F. (2006). Picophytoplankton Diversity and Photoacclimation in the Strait of Sicily (Mediterranean Sea) in Summer. I. Mesoscale Variations. Aquat. Microb. Ecol. 44, 127–141. doi: 10.3354/ame044127
Calvo-Díaz A., Morán X. A. G., Suárez L.Á. (2008). Seasonality of Picophytoplankton Chlorophyll a and Biomass in the Central Cantabrian Sea, Southern Bay of Biscay. J. Mar. Syst. 72, 271–281. doi: 10.1016/j.jmarsys.2007.03.008
Cetinić I., Perry M. J., D’Asaro E., Briggs N., Poulton N., Sieracki M. E., et al. (2015). A Simple Optical Index Shows Spatial and Temporal Heterogeneity in Phytoplankton Community Composition During the 2008 North Atlantic Bloom Experiment. Biogeosciences 12, 2179–2194. doi: 10.5194/bg-12-2179-2015
Chase A. P., Kramer S. J., Haëntjens N., Boss E. S., Karp-Boss L., Edmondson M., et al. (2020). Evaluation of Diagnostic Pigments to Estimate Phytoplankton Size Classes. Limnol. Oceanogr. Methods 18, 570–584. doi: 10.1002/lom3.10385
Claustre H. (1994). The Trophic Status of Various Oceanic Provinces as Revealed by Phytoplankton Pigment Signatures. Limnol. Oceanogr. 39, 1206–1210. doi: 10.4319/lo.1994.39.5.1206
Duhamel S., Kim E., Sprung B., Anderson O. R. (2019). Small Pigmented Eukaryotes Play a Major Role in Carbon Cycling in the P-Depleted Western Subtropical North Atlantic, Which may be Supported by Mixotrophy. Limnol. Oceanogr. 64, 2424–2440. doi: 10.1002/lno.11193
Gittings J. A., Brewin R. J. W., Raitsos D. E., Kheireddine M., Ouhssain M., Jones B. H., et al. (2019). Remotely Sensing Phytoplankton Size Structure in the Red Sea. Remote Sens. Environ. 234, 111387. doi: 10.1016/j.rse.2019.111387
Glover H. E., Prezelin B. B., Campbell L., Campbell M., Garside C., Prézelin B. B., et al. (1988). A Nitrate-Dependent Synechococcus Bloom in Surface Sargasso Sea Water. Nature 331, 161–163. doi: 10.1038/331161a0
Goericke R., Montoya J. P. (1998). Estimating the Contribution of Microalgal Taxa to Chlorophyll a in the Field - Variations of Pigment Ratios Under Nutrient- and Light-Limited Growth. Mar. Ecol. Prog. Ser. 169, 97–112. doi: 10.3354/meps169097
Graff J. R., Milligan A. J., Behrenfeld M. J. (2012). The Measurement of Phytoplankton Biomass Using Flowcytometric Sorting and Elemental Analysis of Carbon. Limnol. Oceanogr. Methods 10, 910–920. doi: 10.4319/lom.2012.10.910
Graff J. R., Westberry T. K., Milligan A. J., Brown M. B., Dall’Olmo G., Reifel K. M., et al. (2016). Photoacclimation of Natural Phytoplankton Communities. Mar. Ecol. Prog. Ser. 542, 51–62. doi: 10.3354/meps11539
Graff J. R., Westberry T. K., Milligan A. J., Brown M. B., Dall’Olmo G., van Dongen-Vogels V., et al. (2015). Analytical Phytoplankton Carbon Measurements Spanning Diverse Ecosystems. Deep. Res. Part I. Oceanogr. Res. Pap. 102, 16–25. doi: 10.1016/j.dsr.2015.04.006
Grob C., Ulloa O., Claustre H., Huot Y., Alarcón G., Marie D. (2007). Contribution of Picoplankton to the Total Particulate Organic Carbon Concentration in the Eastern South Pacific. Biogeosciences 4, 837–852. doi: 10.5194/bg-4-837-2007
Henriksen P., Riemann B., Kaas H., Sørensen H. M., Sørensen H. L. (2002). Effects of Nutrient-Limitation and Irradiance on Marine Phytoplankton Pigments. J. Plankt. Res. 24, 835–858. doi: 10.1093/plankt/24.9.835
Hirata T., Aiken J., Hardman-mountford N., Smyth T. J., Barlow R. G. (2008). An Absorption Model to Determine Phytoplankton Size Classes From Satellite Ocean Colour. Remote Sens. Environ. 112, 3153–3159. doi: 10.1016/j.rse.2008.03.011
Hirata T., Hardman-Mountford N. J., Brewin R. J. W., Aiken J., Barlow R., Suzuki K., et al. (2011). Synoptic Relationships Between Surface Chlorophyll-A and Diagnostic Pigments Specific to Phytoplankton Functional Types. Biogeosciences 8, 311–327. doi: 10.5194/bg-8-311-2011
Holm-hansen O., Riemann B. (1978). Chlorophyll a Determination : Improvements in Methodology. Nord. Soc Oikos. 30, 438–447. doi: 10.2307/3543338
Jardillier L., Zubkov M. V., Pearman J., Scanlan D. J. (2010). Significant CO2 Fixation by Small Prymnesiophytes in the Subtropical and Tropical Northeast Atlantic Ocean. ISME J. 4, 1180–1192. doi: 10.1038/ismej.2010.36
Kana T. M., Glibert P. M. (1987). Effect of Irradiances Up to 2000 μe M-2 s-1 on Marine Synechococcus WH7803-I. Growth, Pigmentation, and Cell Composition. Deep. Sea. Res. Part A. Oceanogr. Res. Pap. 34, 479–495. doi: 10.1016/0198-0149(87)90001-X
Kormelink T. G., Arkesteijn G. J. A., Nauwelaers F. A., van den Engh G., Nolte-’t Hoen E. N. M., Wauben M. H. M. (2016). Prerequisites for the Analysis and Sorting of Extracellular Vesicle Subpopulations by High-Resolution Flow Cytometry. Cytom. Part A. 89, 135–147. doi: 10.1002/cyto.a.22644
Liu H., Probert I., Uitz J., Claustre H., Aris-Brosou S., Frada M., et al. (2009). Extreme Diversity in Noncalcifying Haptophytes Explains a Major Pigment Paradox in Open Oceans. Proc. Natl. Acad. Sci. U. S. A. 106, 12803–12808. doi: 10.1073/pnas.0905841106
Llewellyn C. A., Fishwick J. R., Blackford J. C. (2005). Phytoplankton Community Assemblage in the English Channel: A Comparison Using Chlorophyll a Derived From HPLC-CHEMTAX and Carbon Derived From Microscopy Cell Counts. J. Plankt. Res. 27, 103–119. doi: 10.1093/plankt/fbh158
Mackey M., Mackey D., Higgins H., Wright S. (1996). CHEMTAX – a Program for Estimating Class Abundances From Chemical Markers : Application to HPLC Measurements of Phytoplankton. Mar. Ecol. Prog. Ser. 144, 265–283. doi: 10.3354/meps144265
Marie D., Partensky F., Vaulot D., Brussard C. (1999). Enumeration of Phytoplankton, Bacteria, and Viruses in Marine Samples. Curr. Protoc. Cytom. 10, 11.11.1–11.11.15. doi: 10.1002/0471142956.cy0706s02
Martinez-Vicente V., Dall’Olmo G., Tarran G., Boss E., Sathyendranath S. (2013). Optical Backscattering is Correlated With Phytoplankton Carbon Across the Atlantic Ocean. Geophys. Res. Lett. 40, 1154–1158. doi: 10.1002/grl.50252
Moore L. R., Goericke R., Chisholm S. W. (1995). Comparative Physiology of Synechococcus and Prochlorococcus: Influence of Light and Temperature on Growth, Pigments, Fluorescence and Absorptive Properties. Mar. Ecol. Prog. Ser. 116, 259–276. doi: 10.3354/meps116259
Morel A., Ahn Y., Partensky F., Vaulot D., Claustre H. (1993). Prochlorococcus and Synechococcus : A Comparative Study of Their Optical Properties in Relation to Their Size and Pigmentation. J. Mar. Res. 51, 617–649. doi: 10.1357/0022240933223963
Morel A., Bricaud A. (1981). Theoretical Results Concerning Light Absorption in a Discrete Medium, and Application to Specific Absorption of Phytoplankton. Deep. Sea. Res. 28, 1375–1393. doi: 10.1016/0198-0149(81)90039-X
Mouw C. B., Hardman-mountford N. J., Alvain S., Bracher A., Brewin R. J. W., Bricaud A., et al. (2017). A Consumer’s Guide to Satellite Remote Sensing of Multiple Phytoplankton Groups in the Global Ocean 4. Front. Mar. Sci. doi: 10.3389/fmars.2017.00041
Murrell M. C., Lores E. M. (2004). Phytoplankton and Zooplankton Seasonal Dynamics in a Subtropical Estuary: Importance of Cyanobacteria. J. Plankt. Res. 26, 371–382. doi: 10.1093/plankt/fbh038
Navaluna N. A., Perry M. J., Talbot M. C. (1989). The Effect of Chemical Fixation on Some Optical Properties of Phytoplankton. J. Plankt. Res. 11, 15–24. doi: 10.1093/plankt/11.1.15
Neveux J., Dupouy C., Blanchot J., Le Bouteiller A., Landry M. R., Brown S. L. (2003). Diel Dynamics of Chlorophylls in High-Nutrient, Low-Chlorophyll Waters of the Equatorial Pacific (180°): Interactions of Growth, Grazing, Physiological Responses, and Mixing. J. Geophys. Res. C. Ocean. 108, 1–17. doi: 10.1029/2000jc000747
Rembauville M., Briggs N., Ardyna M., Uitz J., Catala P., Penkerc’h C., et al. (2017). Plankton Assemblage Estimated With BGC-Argo Floats in the Southern Ocean: Implications for Seasonal Successions and Particle Export. J. Geophys. Res. Ocean. 122, 8278–8292. doi: 10.1002/2017JC013067
Rii Y. M., Duhamel S., Bidigare R. R., Karl D. M., Repeta D. J., Church M. J. (2016b). Diversity and Productivity of Photosynthetic Picoeukaryotes in Biogeochemically Distinct Regions of the South East Pacific Ocean. Limnol. Oceanogr. 61, 806–824. doi: 10.1002/lno.10255
Rii Y., Karl D., Church M. (2016a). Temporal and Vertical Variability in Picophytoplankton Primary Productivity in the North Pacific Subtropical Gyre. Mar. Ecol. Prog. Ser. 562, 1–18. doi: 10.3354/meps11954
Sato M., Takeda S., Furuya K. (2006). Effects of Long-Term Sample Preservation on Flow Cytometric Analysis of Natural Populations of Pico-and Nanophytoplankton. J. Oceanogr. 62, 903–908. doi: 10.1007/s10872-006-0107-x
Sieburth J., Smetacek V., Lenz J. (1978). Pelagic Ecosystem Structure: Heterotrophic Compartments of the Plankton and Their Relationship to Plankton Size. Limnol. Oceanogr. 23, 1256–1263. doi: 10.4319/lo.1978.23.6.1256
Simon N., Barlow R., Marie D., Partensky F., Vaulot D. (1994). Characterization of Oceanic Photosynthetic Picoeukaryotes by Flow Cytometry. J. Phycol. 30, 922–935. doi: 10.1111/j.0022-3646.1994.00922.x
Six C., Finkel Z. V., Rodriguez F., Marie D., Partensky F., Campbell D. A. (2008). Contrasting Photoacclimation Costs in Ecotypes of the Marine Eukaryotic Picoplankter Ostreococcus. Limnol. Oceanogr. 53, 255–265. doi: 10.4319/lo.2008.53.1.0255
Sosik H. M., Chisholm S. W., Olson R. J. (1989). Chlorophyll Fluorescence From Single Cells : Interpretation of Flow Cytometric Signals. Limnol. Oceanogr. 34, 1749–1761. doi: 10.4319/lo.1989.34.8.1749
Stramski D., Shalapyonok A., Reynolds R. A. (1995). Optical Characterization of the Oceanic Unicellular Cyanobacterium Synechococcus Grown Under a Day-Night Cycle in Natural Irradiance. J. Geophys. Res. 100, 13295–13307. doi: 10.1029/95jc00452
Strickland J. D. H., Parsons T. R. (1972). A Practical Handbook of Seawater Analyses (Ottawa: Fisheries Research Board of Canada).
Uitz J., Claustre H., Griffiths F. B., Ras J., Garcia N., Sandroni V. (2009). A Phytoplankton Class-Specific Primary Production Model Applied to the Kerguelen Islands Region (Southern Ocean). Deep. Res. Part I. Oceanogr. Res. Pap. 56, 541–560. doi: 10.1016/j.dsr.2008.11.006
Uitz J., Claustre H., Morel A., Hooker S. B. (2006). Vertical Distribution of Phytoplankton Communities in Open Ocean: An Assessment Based on Surface Chlorophyll. J. Geophys. Res. Ocean. 111, C08005. doi: 10.1029/2005JC003207
Van Heukelem L., Thomas C. S. (2001). Computer-Assisted High Performance Liquid Chromatography Method Development With Applications to the Isolation and Analysis of Phytoplankton Pigments. J. Chromatogr. A. 23, 31–49. doi: 10.1016/S0378-4347(00)00603-4
Vaulot D., Courties C., Partensky F. (1989). A Simple Method to Preserve Oceanic Phytoplankton for Flow Cytometric Analyses. Cytometry 10, 629–635. doi: 10.1002/cyto.990100519
Veldhuis M. J. W., Kraay G. W. (1993). Cell Aubndance and Fluorescence of Picoplankton in Relation to Growth Irradiance and Nitrogen Availability in the Red Sea. Netherland 31, 135–145. doi: 10.1016/0077-7579(93)90003-B
Veldhuis M. J. W., Kraay G. W., Van Bleijswijk J. D. L., Baars M. A. (1997). Seasonal and Spatial Variability in Phytoplankton Biomass, Productivity and Growth in the Northwestern Indian Ocean: The Southwest and Northeast Monsoo-1993. Deep. Res. Part I. Oceanogr. Res. Pap. 44, 425–449. doi: 10.1016/S0967-0637(96)00116-1
Vidussi F., Claustre H., Manca B. B., Luchetta A., Marty J. C. (2001). Phytoplankton Pigment Distribution in Relation to Upperthermocline Circulation in the Eastern Mediterranean Sea During Summer. J. Geophys. Res. 106, 939–956. doi: 10.1029/1999JC000308
Westberry T., Behrenfeld M. J., Siegel D. A., Boss E. (2008). Carbon-Based Primary Productivity Modeling With Vertically Resolved Photoacclimation. Global Biogeochem. Cycles 22, 1–18. doi: 10.1029/2007GB003078
Keywords: phytoplankton community structure, chlorophyll, flow cytometry, fluorescence, picophytoplankton
Citation: Bock N, Subramaniam A, Juhl AR, Montoya J and Duhamel S (2022) Quantifying Per-Cell Chlorophyll a in Natural Picophytoplankton Populations Using Fluorescence-Activated Cell Sorting. Front. Mar. Sci. 9:850646. doi: 10.3389/fmars.2022.850646
Received: 08 January 2022; Accepted: 21 April 2022;
Published: 23 May 2022.
Edited by:
Ryan Paerl, North Carolina State University, United StatesReviewed by:
John R. Casey, Massachusetts Institute of Technology, United StatesCopyright © 2022 Bock, Subramaniam, Juhl, Montoya and Duhamel. This is an open-access article distributed under the terms of the Creative Commons Attribution License (CC BY). The use, distribution or reproduction in other forums is permitted, provided the original author(s) and the copyright owner(s) are credited and that the original publication in this journal is cited, in accordance with accepted academic practice. No use, distribution or reproduction is permitted which does not comply with these terms.
*Correspondence: Nicholas Bock, bmFiMjE2MUBjb2x1bWJpYS5lZHU=; Solange Duhamel, ZHVoYW1lbEBhcml6b25hLmVkdQ==
†Present address: Solange Duhamel, Department of Molecular and Cellular Biology, The University of Arizona, Tucson, AZ, United States
Disclaimer: All claims expressed in this article are solely those of the authors and do not necessarily represent those of their affiliated organizations, or those of the publisher, the editors and the reviewers. Any product that may be evaluated in this article or claim that may be made by its manufacturer is not guaranteed or endorsed by the publisher.
Research integrity at Frontiers
Learn more about the work of our research integrity team to safeguard the quality of each article we publish.